Embed Size (px)
Citation preview
1
FORTUNE World's Most Admired Companies®
2014 | 2015 | 2016 | 2017 | 2018 | 2019 | 2020
SpendTrend® Special Report
Update | Coronavirus Impact on Consumer Spending
SpendTrend® Special Report
All data is Fiserv proprietary data and includes only actual card-based forms of payment. SpendTrend is a macroeconomic indicator that reports aggregated year-over-year same store sales activity for card-based payments. SpendTrend from Fiserv does not represent Fiserv financial performance. © 2020 Fiserv. All rights reserved.
October 9, 2020
2
FORTUNE World's Most Admired Companies®
2014 | 2015 | 2016 | 2017 | 2018 | 2019 | 2020
SpendTrend® Special Report
Executive Summary
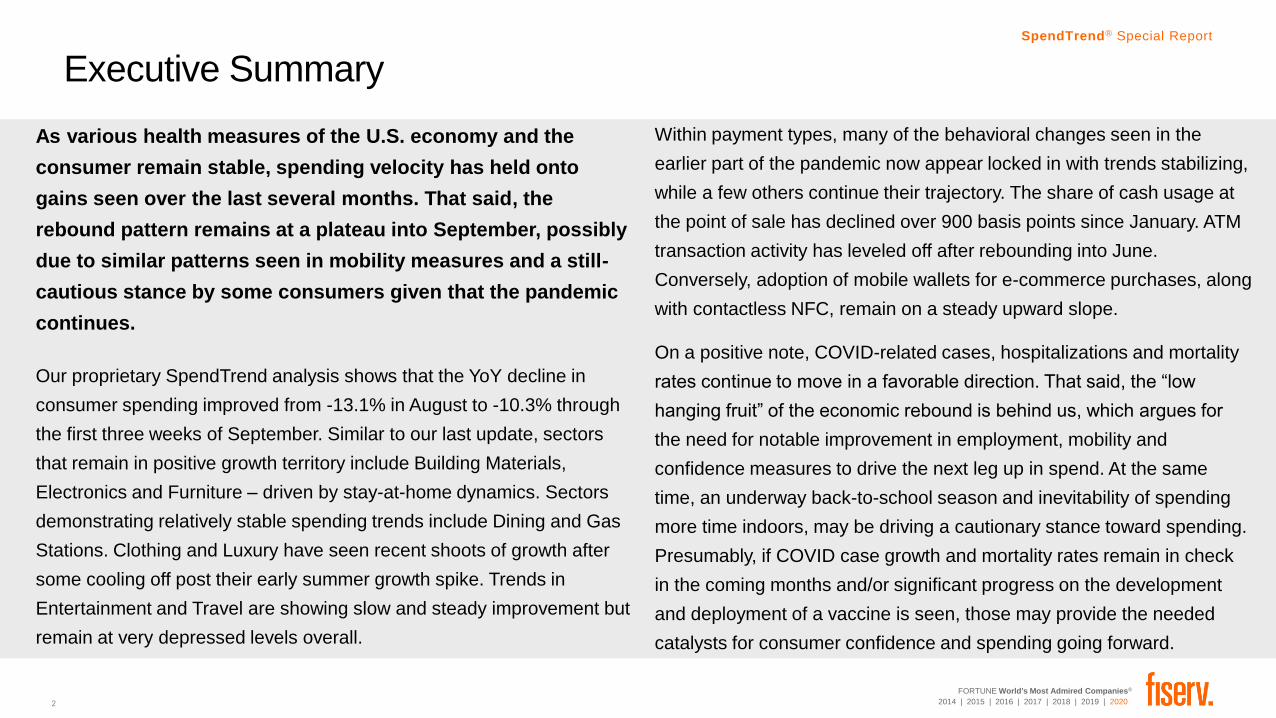
As various health measures of the U.S. economy and the
consumer remain stable, spending velocity has held onto
gains seen over the last several months. That said, the
rebound pattern remains at a plateau into September, possibly
due to similar patterns seen in mobility measures and a still-
cautious stance by some consumers given that the pandemic
continues.
Our proprietary SpendTrend analysis shows that the YoY decline in
consumer spending improved from -13.1% in August to -10.3% through
the first three weeks of September. Similar to our last update, sectors
that remain in positive growth territory include Building Materials,
Electronics and Furniture – driven by stay-at-home dynamics. Sectors
demonstrating relatively stable spending trends include Dining and Gas
Stations. Clothing and Luxury have seen recent shoots of growth after
some cooling off post their early summer growth spike. Trends in
Entertainment and Travel are showing slow and steady improvement but
remain at very depressed levels overall.
Within payment types, many of the behavioral changes seen in the
earlier part of the pandemic now appear locked in with trends stabilizing,
while a few others continue their trajectory. The share of cash usage at
the point of sale has declined over 900 basis points since January. ATM
transaction activity has leveled off after rebounding into June.
Conversely, adoption of mobile wallets for e-commerce purchases, along
with contactless NFC, remain on a steady upward slope.
On a positive note, COVID-related cases, hospitalizations and mortality
rates continue to move in a favorable direction. That said, the “low
hanging fruit” of the economic rebound is behind us, which argues for
the need for notable improvement in employment, mobility and
confidence measures to drive the next leg up in spend. At the same
time, an underway back-to-school season and inevitability of spending
more time indoors, may be driving a cautionary stance toward spending.
Presumably, if COVID case growth and mortality rates remain in check
in the coming months and/or significant progress on the development
and deployment of a vaccine is seen, those may provide the needed
catalysts for consumer confidence and spending going forward.
3
FORTUNE World's Most Admired Companies®
2014 | 2015 | 2016 | 2017 | 2018 | 2019 | 2020
SpendTrend® Special Report
3
U.S. Commerce Trends Through September 22
4
FORTUNE World's Most Admired Companies®
2014 | 2015 | 2016 | 2017 | 2018 | 2019 | 2020
SpendTrend® Special Report
2.1%0.2%
4.3%2.8%
1.7% 1.3%2.1% 2.6% 1.9% 2.5% 2.4%
3.5% 3.5%1.8%
-17.4%
-34.4%
-21.5%
-14.2%
-12.3%-13.1%
-10.3%
-40%
-35%
-30%
-25%
-20%
-15%
-10%
-5%
0%
5%
Jan Feb Mar Apr May Jun Jul Aug Sep Oct Nov Dec Jan Feb Mar Apr May Jun Jul Aug Sep
2019 2020
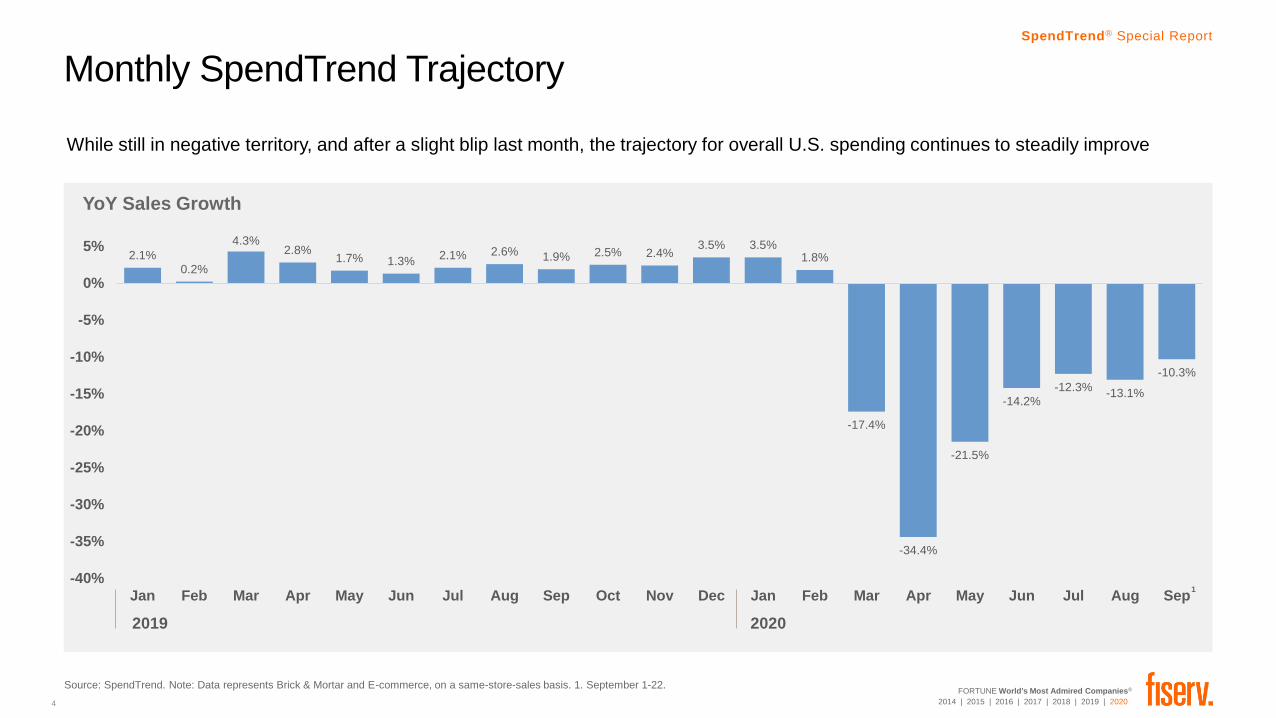
Monthly SpendTrend Trajectory
While still in negative territory, and after a slight blip last month, the trajectory for overall U.S. spending continues to steadily improve
YoY Sales Growth
Source: SpendTrend. Note: Data represents Brick & Mortar and E-commerce, on a same-store-sales basis. 1. September 1-22.
1
5
FORTUNE World's Most Admired Companies®
2014 | 2015 | 2016 | 2017 | 2018 | 2019 | 2020
SpendTrend® Special Report
Source: SpendTrend. Note: Data represents Brick & Mortar and E-commerce, on a same-store-sales basis.
5
YoY Transaction Growth
(7-day moving average)
Average Ticket
(7-day moving average)
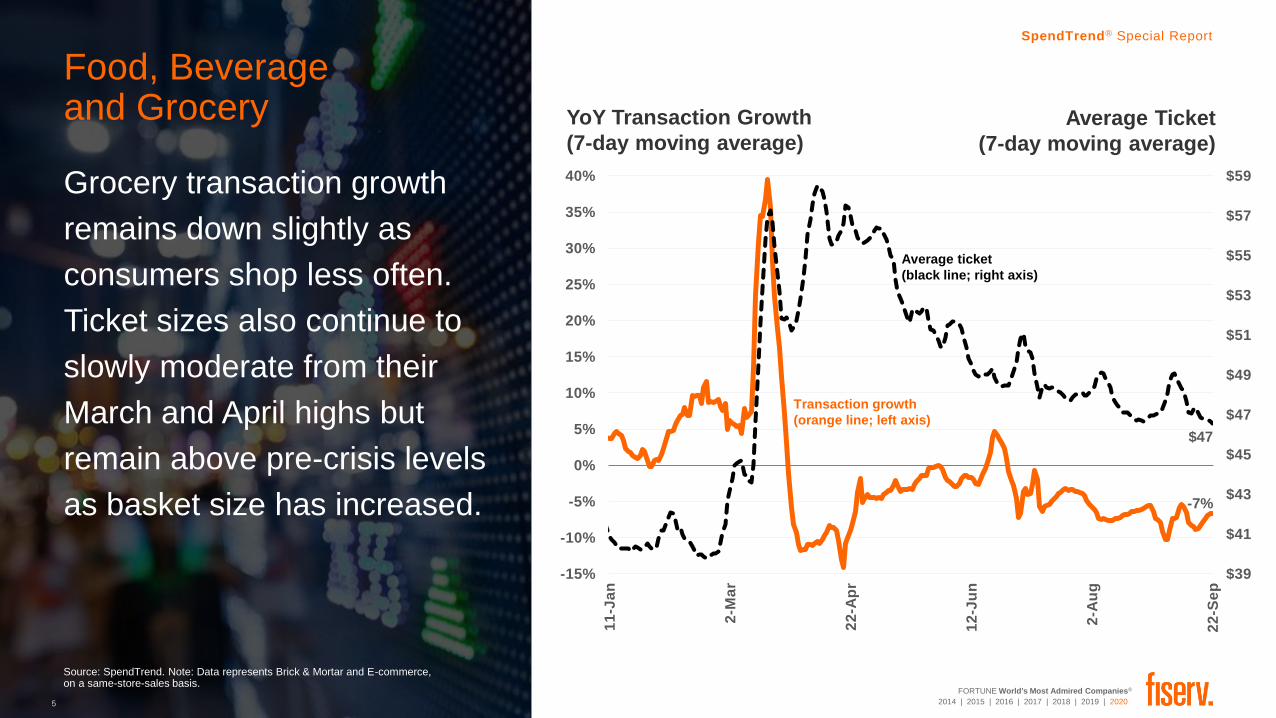
Food, Beverageand Grocery
Grocery transaction growth
remains down slightly as
consumers shop less often.
Ticket sizes also continue to
slowly moderate from their
March and April highs but
remain above pre-crisis levels
as basket size has increased.
$39
$41
$43
$45
$47
$49
$51
$53
$55
$57
$59
-15%
-10%
-5%
0%
5%
10%
15%
20%
25%
30%
35%
40%
11
-Ja
n
2-M
ar
22
-Ap
r
12
-Ju
n
2-A
ug
22
-Se
p
$47
-7%
Average ticket
(black line; right axis)
Transaction growth
(orange line; left axis)
6
FORTUNE World's Most Admired Companies®
2014 | 2015 | 2016 | 2017 | 2018 | 2019 | 2020
SpendTrend® Special Report
Source: SpendTrend. Note: Data represents Brick & Mortar and E-commerce, on a same-store-sales basis.
6
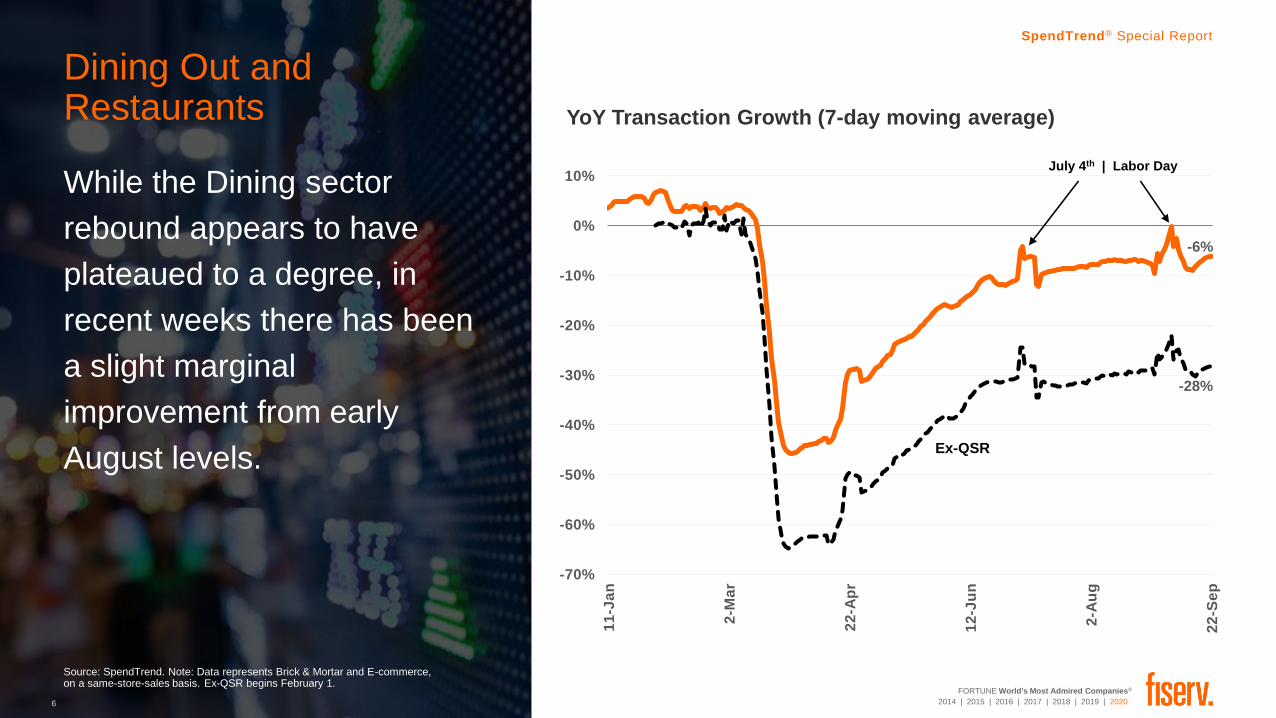
YoY Transaction Growth (7-day moving average)
Ex-QSR begins February 1.
Dining Out and Restaurants
While the Dining sector
rebound appears to have
plateaued to a degree, in
recent weeks there has been
a slight marginal
improvement from early
August levels.
-70%
-60%
-50%
-40%
-30%
-20%
-10%
0%
10%
11
-Ja
n
2-M
ar
22
-Ap
r
12
-Ju
n
2-A
ug
22
-Se
p
Ex-QSR
-6%
-28%
July 4th | Labor Day
7
FORTUNE World's Most Admired Companies®
2014 | 2015 | 2016 | 2017 | 2018 | 2019 | 2020
SpendTrend® Special Report
Source: Fiserv. SpendTrend. Note: Data represents Brick & Mortar and E-commerce, on a same-store-sales basis. 1. February 1-14. 2. February 15-28. 3. March 1-15. 4. March 16-31. 5. April 1-14. 6. April 15-30. 7. May 1-12. 8. May 13-31. 9. June 1-16. 10. June 17-30.
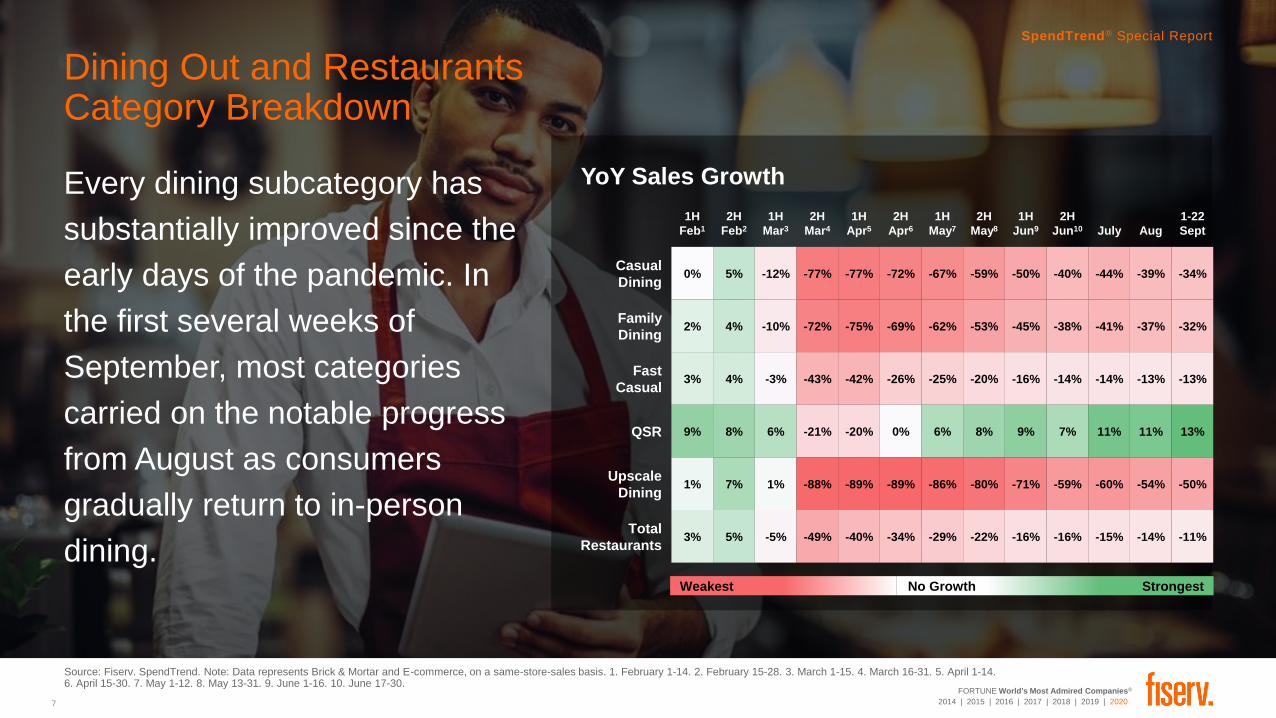
Dining Out and Restaurants Category Breakdown
YoY Sales Growth
Weakest No Growth Strongest
SpendTrend® Special Report
Every dining subcategory has
substantially improved since the
early days of the pandemic. In
the first several weeks of
September, most categories
carried on the notable progress
from August as consumers
gradually return to in-person
dining.
1H
Feb1
2H
Feb2
1H
Mar3
2H
Mar4
1H
Apr5
2H
Apr6
1H
May7
2H
May8
1H
Jun9
2H
Jun10 July Aug
1-22
Sept
Casual
Dining0% 5% -12% -77% -77% -72% -67% -59% -50% -40% -44% -39% -34%
Family
Dining2% 4% -10% -72% -75% -69% -62% -53% -45% -38% -41% -37% -32%
Fast
Casual3% 4% -3% -43% -42% -26% -25% -20% -16% -14% -14% -13% -13%
QSR 9% 8% 6% -21% -20% 0% 6% 8% 9% 7% 11% 11% 13%
Upscale
Dining1% 7% 1% -88% -89% -89% -86% -80% -71% -59% -60% -54% -50%
Total
Restaurants3% 5% -5% -49% -40% -34% -29% -22% -16% -16% -15% -14% -11%
8
FORTUNE World's Most Admired Companies®
2014 | 2015 | 2016 | 2017 | 2018 | 2019 | 2020
SpendTrend® Special Report
Source: SpendTrend. Note: Data represents Brick & Mortar and E-commerce, on a same-store-sales basis.
8
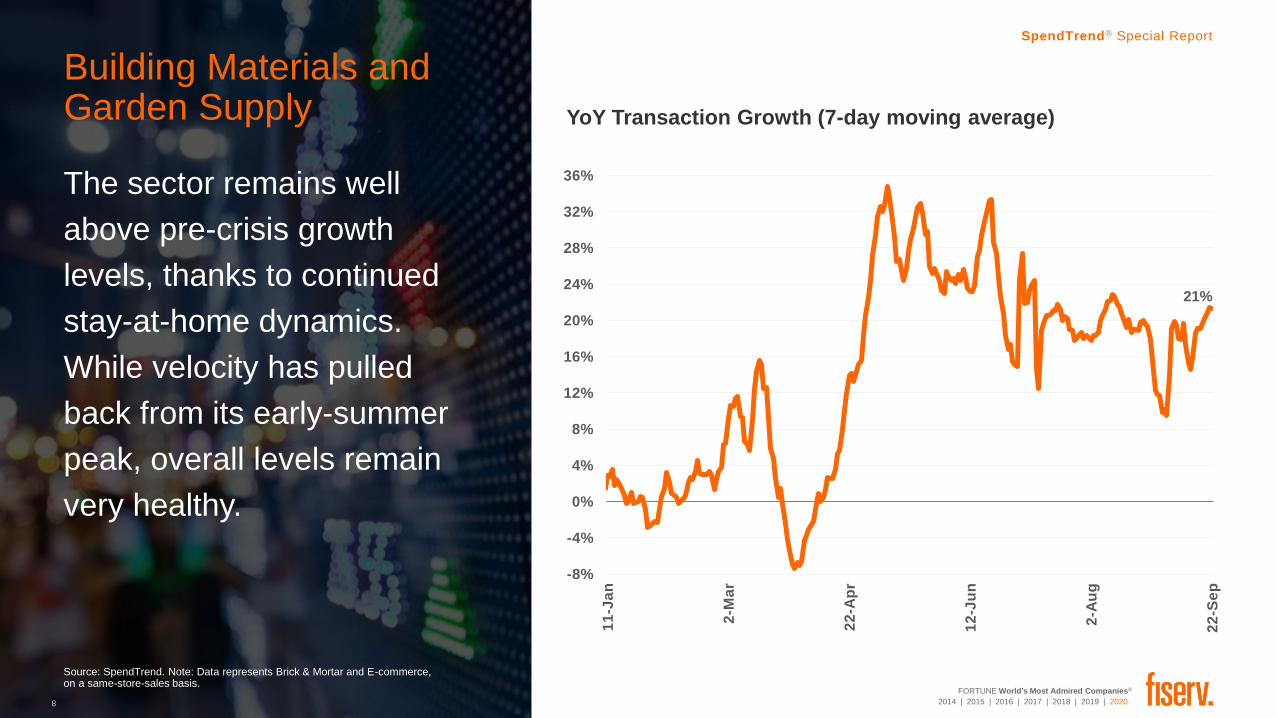
Building Materials and Garden Supply YoY Transaction Growth (7-day moving average)
The sector remains well
above pre-crisis growth
levels, thanks to continued
stay-at-home dynamics.
While velocity has pulled
back from its early-summer
peak, overall levels remain
very healthy.
-8%
-4%
0%
4%
8%
12%
16%
20%
24%
28%
32%
36%
11
-Ja
n
2-M
ar
22
-Ap
r
12
-Ju
n
2-A
ug
22
-Se
p
21%
9
FORTUNE World's Most Admired Companies®
2014 | 2015 | 2016 | 2017 | 2018 | 2019 | 2020
SpendTrend® Special Report
Source: SpendTrend. Note: Data represents Brick & Mortar and E-commerce, on a same-store-sales basis.
9
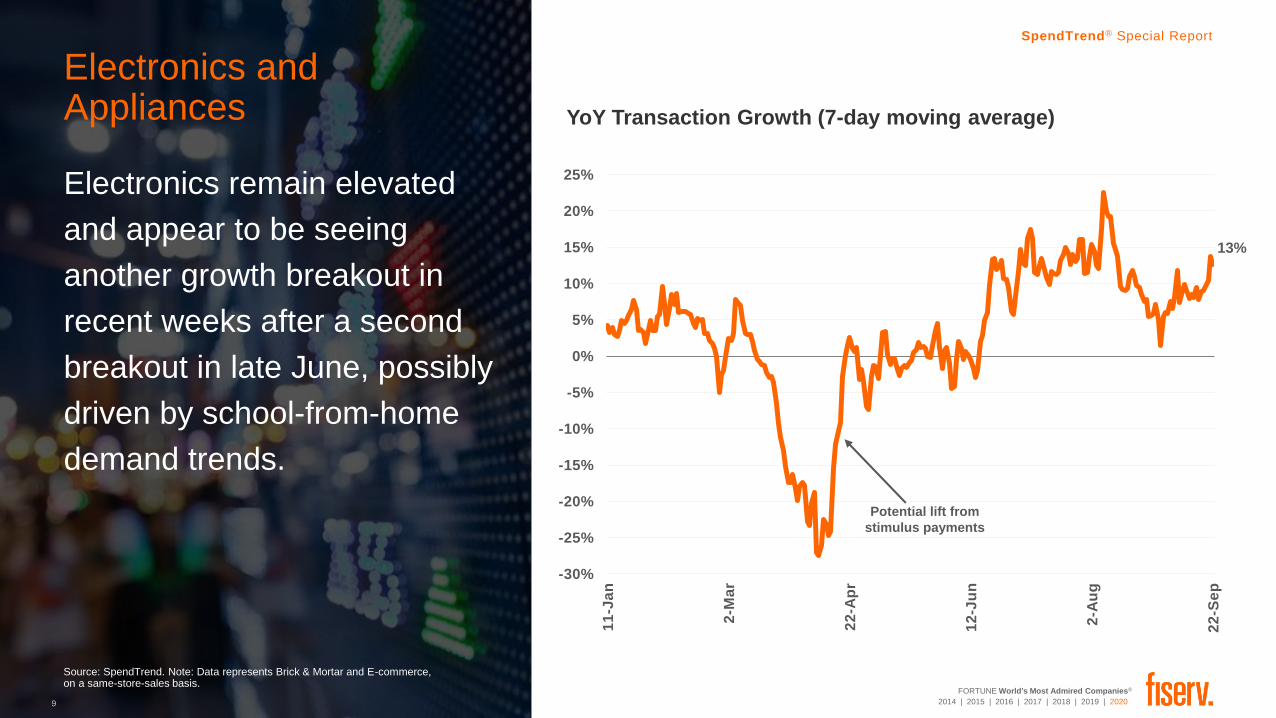
Electronics and Appliances YoY Transaction Growth (7-day moving average)
Electronics remain elevated
and appear to be seeing
another growth breakout in
recent weeks after a second
breakout in late June, possibly
driven by school-from-home
demand trends.
-30%
-25%
-20%
-15%
-10%
-5%
0%
5%
10%
15%
20%
25%
11
-Ja
n
2-M
ar
22
-Ap
r
12
-Ju
n
2-A
ug
22
-Se
p
13%
Potential lift from
stimulus payments
10
FORTUNE World's Most Admired Companies®
2014 | 2015 | 2016 | 2017 | 2018 | 2019 | 2020
SpendTrend® Special Report
10
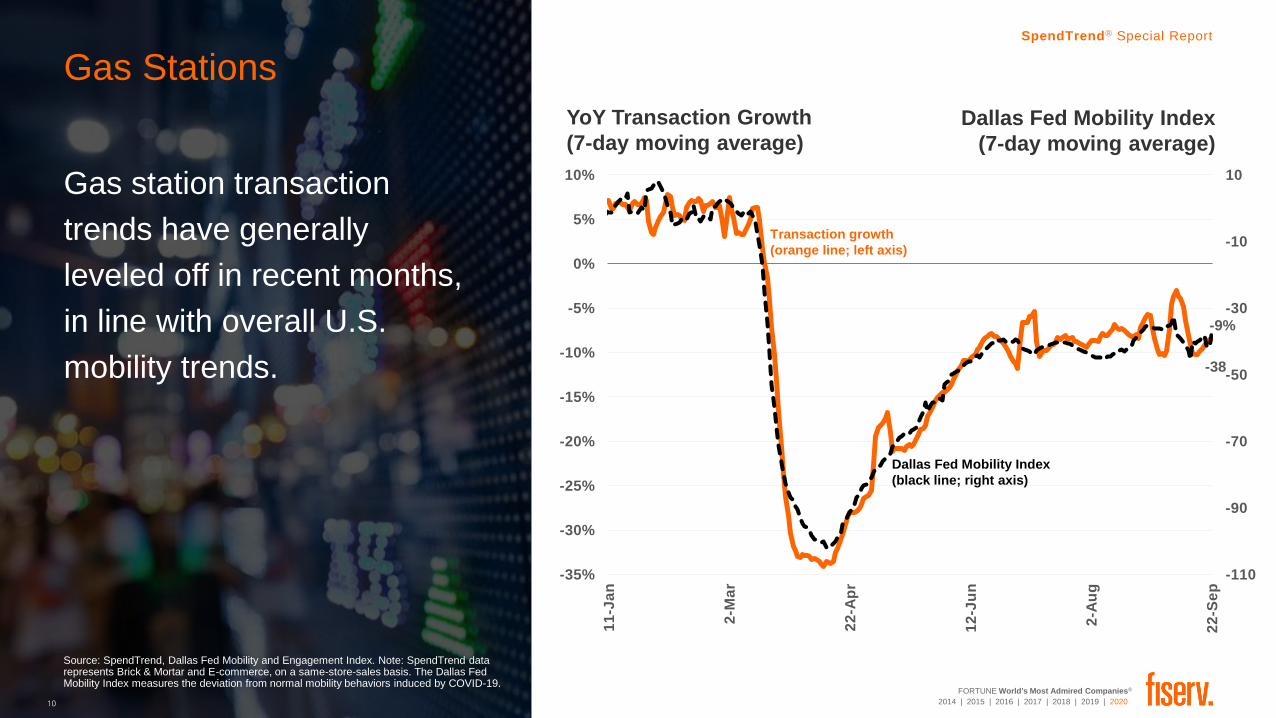
Gas Stations
Gas station transaction
trends have generally
leveled off in recent months,
in line with overall U.S.
mobility trends.
Source: SpendTrend, Dallas Fed Mobility and Engagement Index. Note: SpendTrend data represents Brick & Mortar and E-commerce, on a same-store-sales basis. The Dallas Fed Mobility Index measures the deviation from normal mobility behaviors induced by COVID-19.
YoY Transaction Growth
(7-day moving average)
Dallas Fed Mobility Index
(7-day moving average)
-110
-90
-70
-50
-30
-10
10
-35%
-30%
-25%
-20%
-15%
-10%
-5%
0%
5%
10%
11
-Ja
n
2-M
ar
22
-Ap
r
12
-Ju
n
2-A
ug
22
-Se
p
Dallas Fed Mobility Index
(black line; right axis)
Transaction growth
(orange line; left axis)
-9%
-38
11
FORTUNE World's Most Admired Companies®
2014 | 2015 | 2016 | 2017 | 2018 | 2019 | 2020
SpendTrend® Special Report
Source: SpendTrend. Note: Data represents Brick & Mortar and E-commerce, on a same-store-sales basis.
11
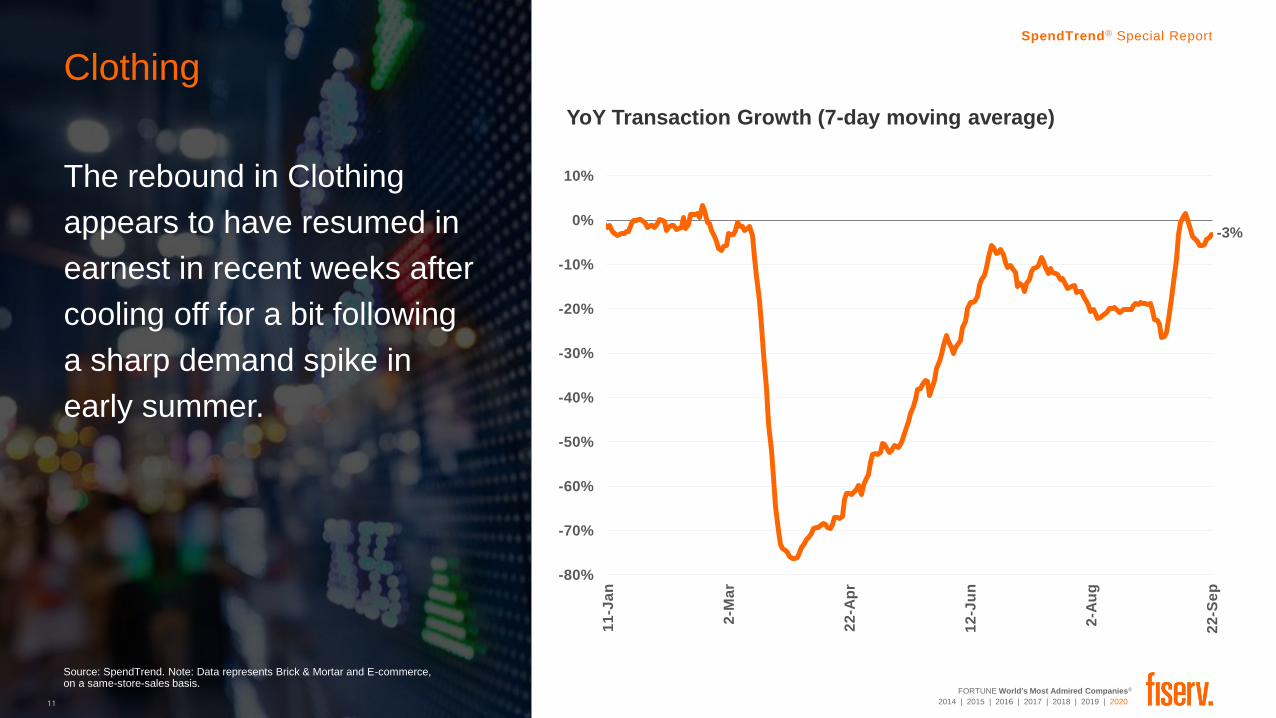
Clothing
YoY Transaction Growth (7-day moving average)
The rebound in Clothing
appears to have resumed in
earnest in recent weeks after
cooling off for a bit following
a sharp demand spike in
early summer.
-3%
-80%
-70%
-60%
-50%
-40%
-30%
-20%
-10%
0%
10%
11
-Ja
n
2-M
ar
22
-Ap
r
12
-Ju
n
2-A
ug
22
-Se
p
12
FORTUNE World's Most Admired Companies®
2014 | 2015 | 2016 | 2017 | 2018 | 2019 | 2020
SpendTrend® Special Report
Source: SpendTrend. Note: Data represents Brick & Mortar and E-commerce, on a same-store-sales basis.
12
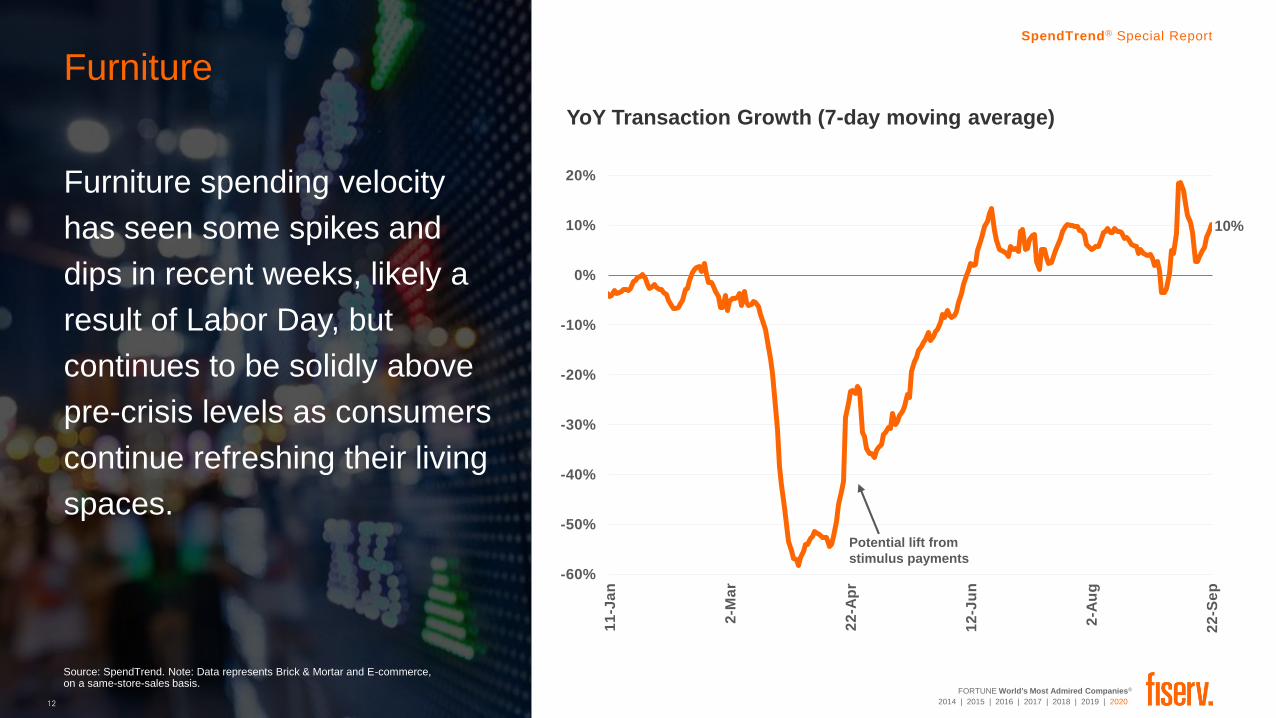
Furniture
YoY Transaction Growth (7-day moving average)
Furniture spending velocity
has seen some spikes and
dips in recent weeks, likely a
result of Labor Day, but
continues to be solidly above
pre-crisis levels as consumers
continue refreshing their living
spaces.
-60%
-50%
-40%
-30%
-20%
-10%
0%
10%
20%
11
-Ja
n
2-M
ar
22
-Ap
r
12
-Ju
n
2-A
ug
22
-Se
p
Potential lift from
stimulus payments
10%
13
FORTUNE World's Most Admired Companies®
2014 | 2015 | 2016 | 2017 | 2018 | 2019 | 2020
SpendTrend® Special Report
13
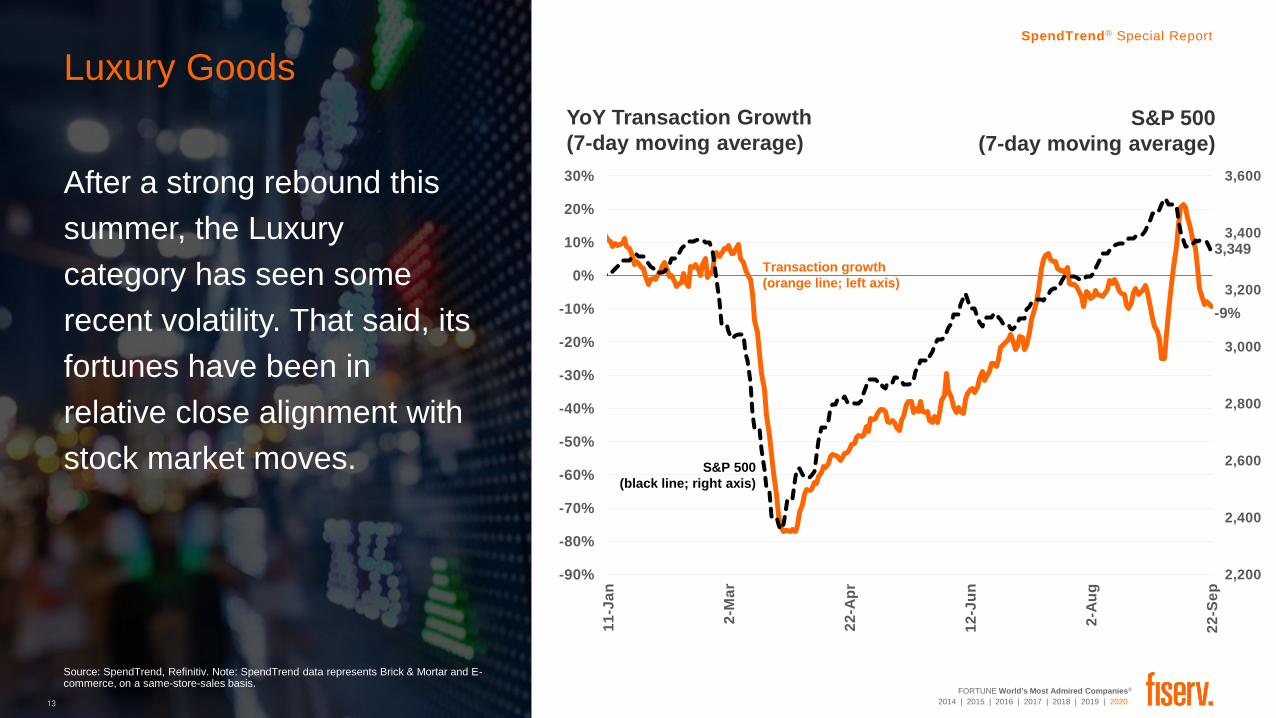
Luxury Goods
After a strong rebound this
summer, the Luxury
category has seen some
recent volatility. That said, its
fortunes have been in
relative close alignment with
stock market moves.
S&P 500
(7-day moving average)
YoY Transaction Growth
(7-day moving average)
Source: SpendTrend, Refinitiv. Note: SpendTrend data represents Brick & Mortar and E-commerce, on a same-store-sales basis.
2,200
2,400
2,600
2,800
3,000
3,200
3,400
3,600
-90%
-80%
-70%
-60%
-50%
-40%
-30%
-20%
-10%
0%
10%
20%
30%
11
-Ja
n
2-M
ar
22
-Ap
r
12
-Ju
n
2-A
ug
22
-Se
p
-9%
S&P 500
(black line; right axis)
Transaction growth
(orange line; left axis)
3,349
14
FORTUNE World's Most Admired Companies®
2014 | 2015 | 2016 | 2017 | 2018 | 2019 | 2020
SpendTrend® Special Report
Source: SpendTrend. Note: Data represents Brick & Mortar and E-commerce, on a same-store-sales basis.
14
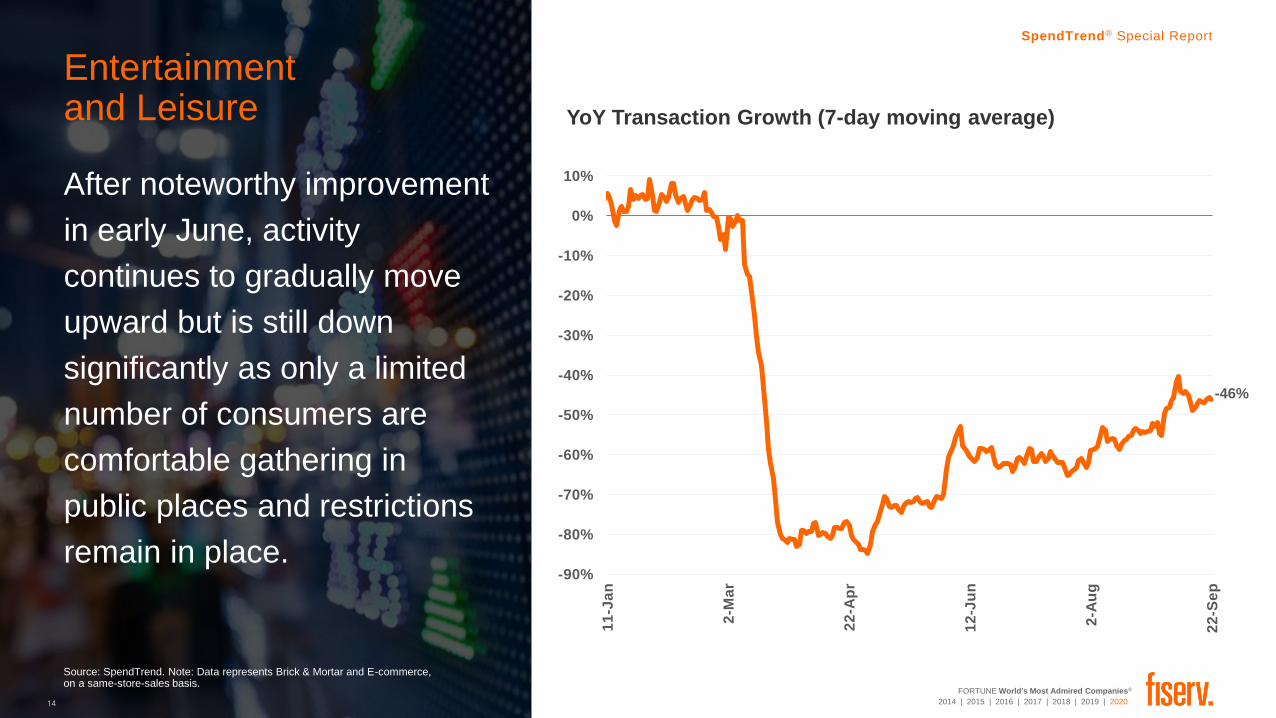
Entertainment and Leisure YoY Transaction Growth (7-day moving average)
After noteworthy improvement
in early June, activity
continues to gradually move
upward but is still down
significantly as only a limited
number of consumers are
comfortable gathering in
public places and restrictions
remain in place.-90%
-80%
-70%
-60%
-50%
-40%
-30%
-20%
-10%
0%
10%
11
-Ja
n
2-M
ar
22
-Ap
r
12
-Ju
n
2-A
ug
22
-Se
p
-46%
15
FORTUNE World's Most Admired Companies®
2014 | 2015 | 2016 | 2017 | 2018 | 2019 | 2020
SpendTrend® Special Report
Source: SpendTrend. Note: Data represents Brick & Mortar and E-commerce, on a same-store-sales basis.
15
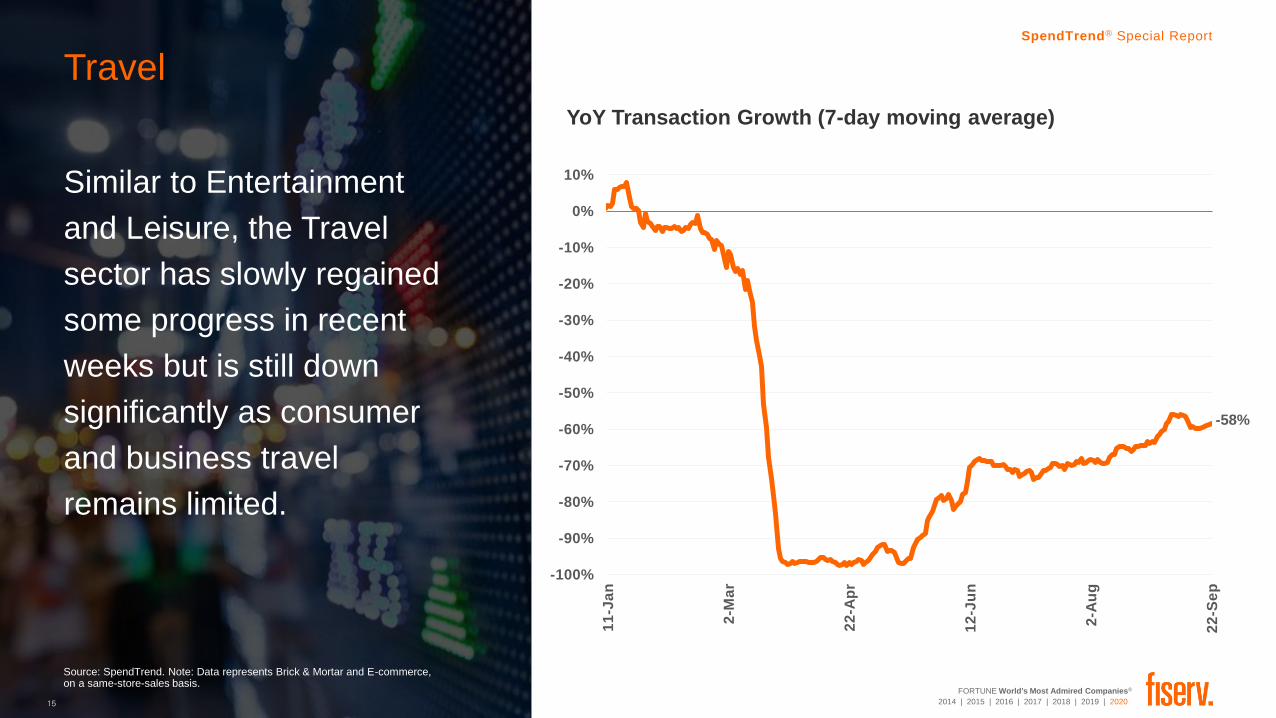
Travel
YoY Transaction Growth (7-day moving average)
Similar to Entertainment
and Leisure, the Travel
sector has slowly regained
some progress in recent
weeks but is still down
significantly as consumer
and business travel
remains limited.
-100%
-90%
-80%
-70%
-60%
-50%
-40%
-30%
-20%
-10%
0%
10%
11
-Ja
n
2-M
ar
22
-Ap
r
12
-Ju
n
2-A
ug
22
-Se
p
-58%
16
FORTUNE World's Most Admired Companies®
2014 | 2015 | 2016 | 2017 | 2018 | 2019 | 2020
SpendTrend® Special Report
16
Additional Analysis
17
FORTUNE World's Most Admired Companies®
2014 | 2015 | 2016 | 2017 | 2018 | 2019 | 2020
SpendTrend® Special Report
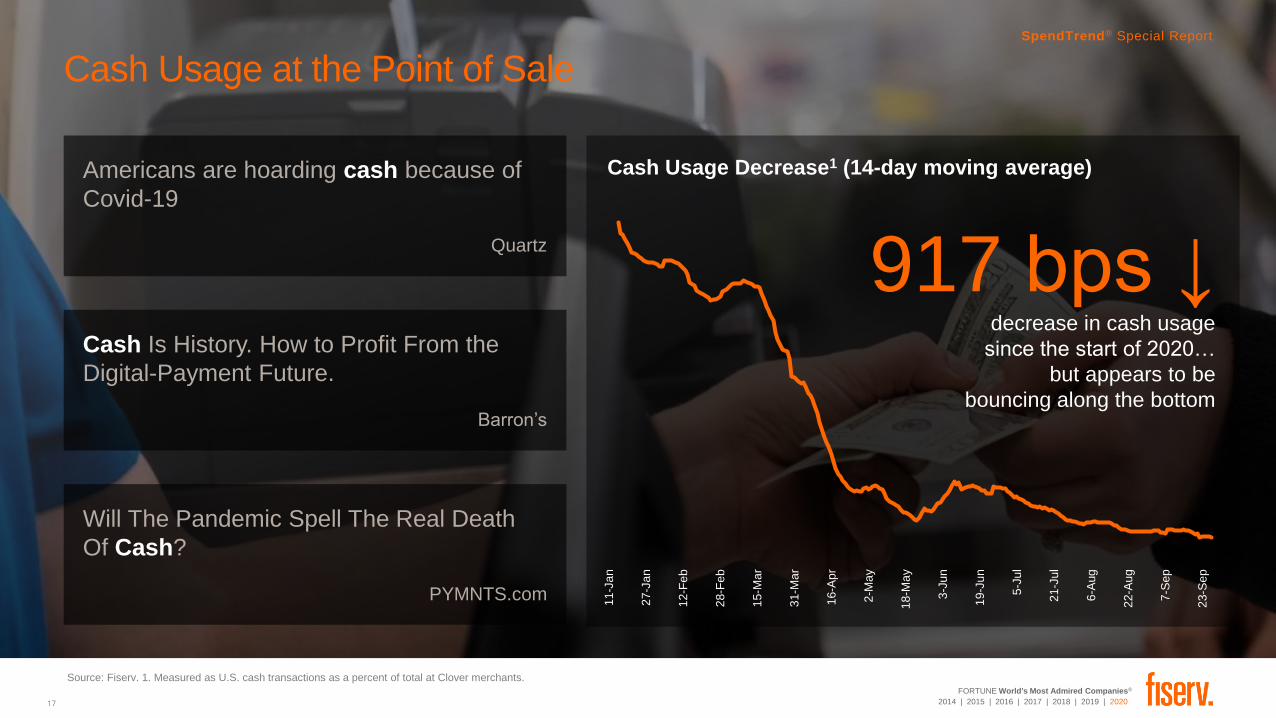
Source: Fiserv. 1. Measured as U.S. cash transactions as a percent of total at Clover merchants.
Cash Usage at the Point of Sale
Americans are hoarding cash because of
Covid-19
Quartz
Cash Is History. How to Profit From the
Digital-Payment Future.
Barron’s
Will The Pandemic Spell The Real Death
Of Cash?
PYMNTS.com
Cash Usage Decrease1 (14-day moving average)
SpendTrend® Special Report
11-J
an
27-J
an
12-F
eb
28-F
eb
15-M
ar
31-M
ar
16-A
pr
2-M
ay
18-M
ay
3-J
un
19-J
un
5-J
ul
21-J
ul
6-A
ug
22-A
ug
7-S
ep
23-S
ep
917 bps ↓decrease in cash usage
since the start of 2020…
but appears to be
bouncing along the bottom
18
FORTUNE World's Most Admired Companies®
2014 | 2015 | 2016 | 2017 | 2018 | 2019 | 2020
SpendTrend® Special Report
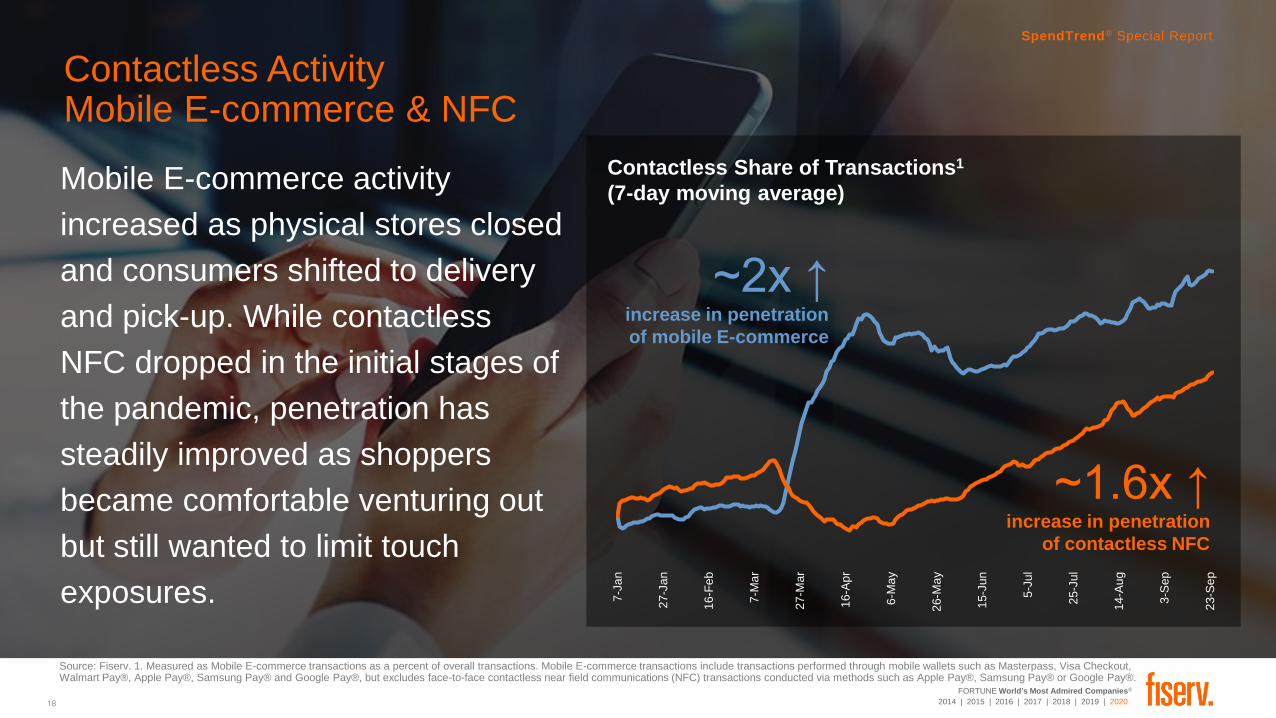
Contactless ActivityMobile E-commerce & NFC
Contactless Share of Transactions1
(7-day moving average)
SpendTrend® Special Report
Mobile E-commerce activity
increased as physical stores closed
and consumers shifted to delivery
and pick-up. While contactless
NFC dropped in the initial stages of
the pandemic, penetration has
steadily improved as shoppers
became comfortable venturing out
but still wanted to limit touch
exposures.
Source: Fiserv. 1. Measured as Mobile E-commerce transactions as a percent of overall transactions. Mobile E-commerce transactions include transactions performed through mobile wallets such as Masterpass, Visa Checkout, Walmart Pay®, Apple Pay®, Samsung Pay® and Google Pay®, but excludes face-to-face contactless near field communications (NFC) transactions conducted via methods such as Apple Pay®, Samsung Pay® or Google Pay®.
7-J
an
27-J
an
16-F
eb
7-M
ar
27-M
ar
16-A
pr
6-M
ay
26-M
ay
15-J
un
5-J
ul
25-J
ul
14-A
ug
3-S
ep
23-S
ep
~1.6x ↑increase in penetration
of contactless NFC
~2x ↑increase in penetration
of mobile E-commerce
19
FORTUNE World's Most Admired Companies®
2014 | 2015 | 2016 | 2017 | 2018 | 2019 | 2020
SpendTrend® Special Report
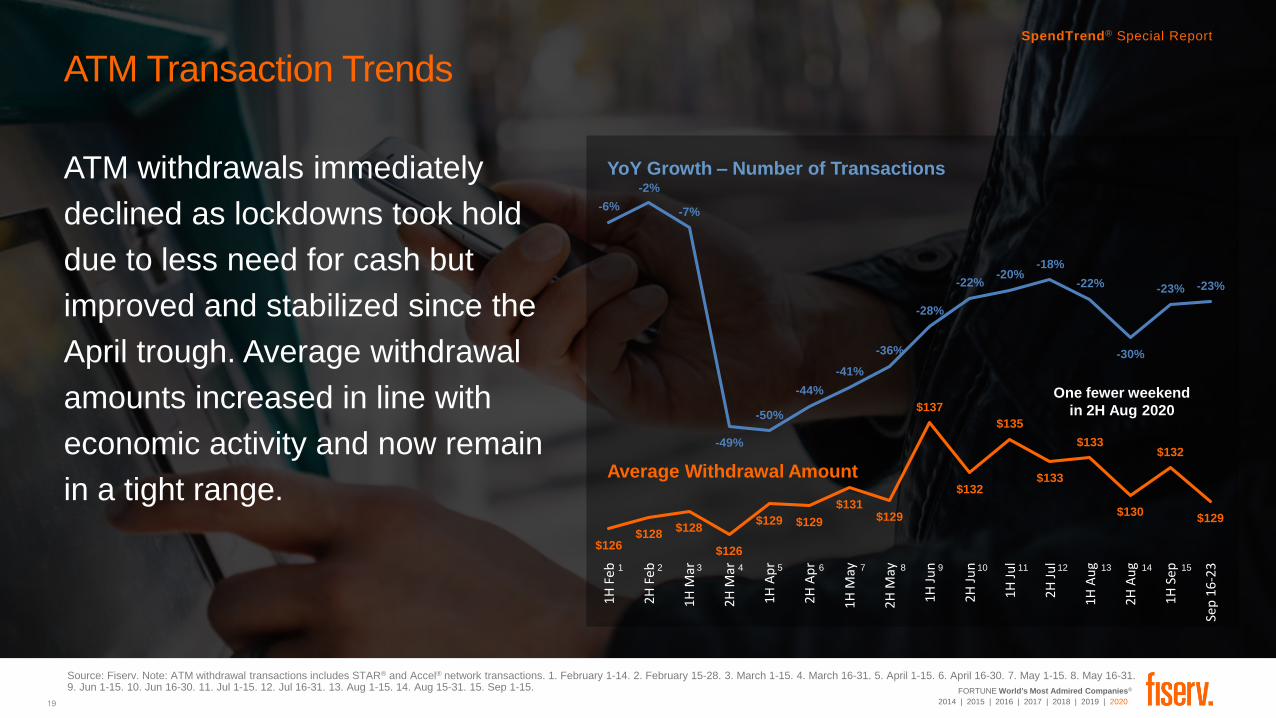
ATM Transaction Trends
ATM withdrawals immediately
declined as lockdowns took hold
due to less need for cash but
improved and stabilized since the
April trough. Average withdrawal
amounts increased in line with
economic activity and now remain
in a tight range.
Source: Fiserv. Note: ATM withdrawal transactions includes STAR® and Accel® network transactions. 1. February 1-14. 2. February 15-28. 3. March 1-15. 4. March 16-31. 5. April 1-15. 6. April 16-30. 7. May 1-15. 8. May 16-31.9. Jun 1-15. 10. Jun 16-30. 11. Jul 1-15. 12. Jul 16-31. 13. Aug 1-15. 14. Aug 15-31. 15. Sep 1-15.
SpendTrend® Special Report
-6%
-2%
-7%
-49%
-50%
-44%
-41%
-36%
-28%
-22%-20%
-18%
-22%
-30%
-23% -23%
$126$128
$128
$126
$129 $129
$131$129
$137
$132
$135
$133
$133
$130
$132
$129
1H
Feb
2H
Feb
1H
Mar
2H
Mar
1H A
pr
2H
Ap
r
1H
May
2H
May
1H J
un
2H J
un
1H J
ul
2H J
ul
1H
Au
g
2H
Au
g
1H
Sep
Sep
16
-23
YoY Growth – Number of Transactions
Average Withdrawal Amount
1 2 3 4 5 6 7 8 9 10 11 12 13 14 15
One fewer weekend
in 2H Aug 2020
20
FORTUNE World's Most Admired Companies®
2014 | 2015 | 2016 | 2017 | 2018 | 2019 | 2020
SpendTrend® Special Report
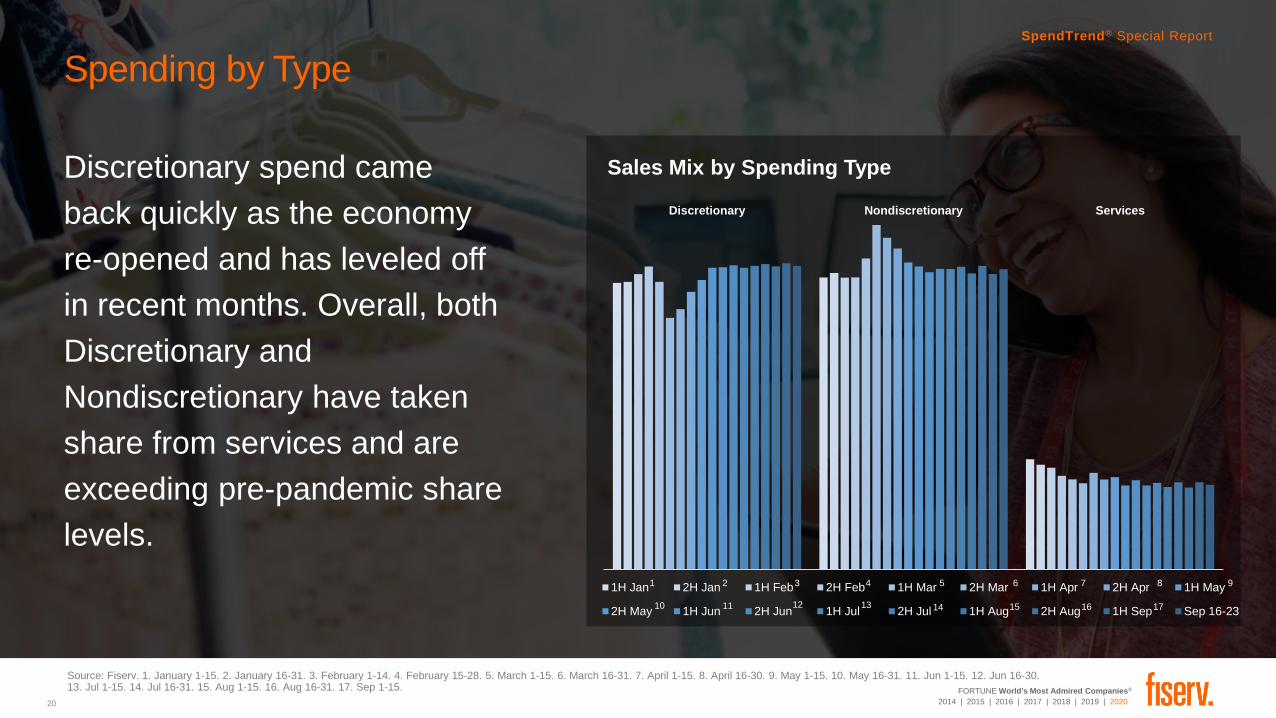
Spending by Type
Discretionary spend came
back quickly as the economy
re-opened and has leveled off
in recent months. Overall, both
Discretionary and
Nondiscretionary have taken
share from services and are
exceeding pre-pandemic share
levels.
Sales Mix by Spending Type
SpendTrend® Special Report
Source: Fiserv. 1. January 1-15. 2. January 16-31. 3. February 1-14. 4. February 15-28. 5. March 1-15. 6. March 16-31. 7. April 1-15. 8. April 16-30. 9. May 1-15. 10. May 16-31. 11. Jun 1-15. 12. Jun 16-30. 13. Jul 1-15. 14. Jul 16-31. 15. Aug 1-15. 16. Aug 16-31. 17. Sep 1-15.
Discretionary Nondiscretionary Services
1H Jan 2H Jan 1H Feb 2H Feb 1H Mar 2H Mar 1H Apr 2H Apr 1H May
2H May 1H Jun 2H Jun 1H Jul 2H Jul 1H Aug 2H Aug 1H Sep Sep 16-23
1 2 3 4 5 7 9
10
6
131211 1514 16
8
17
21
FORTUNE World's Most Admired Companies®
2014 | 2015 | 2016 | 2017 | 2018 | 2019 | 2020
SpendTrend® Special Report
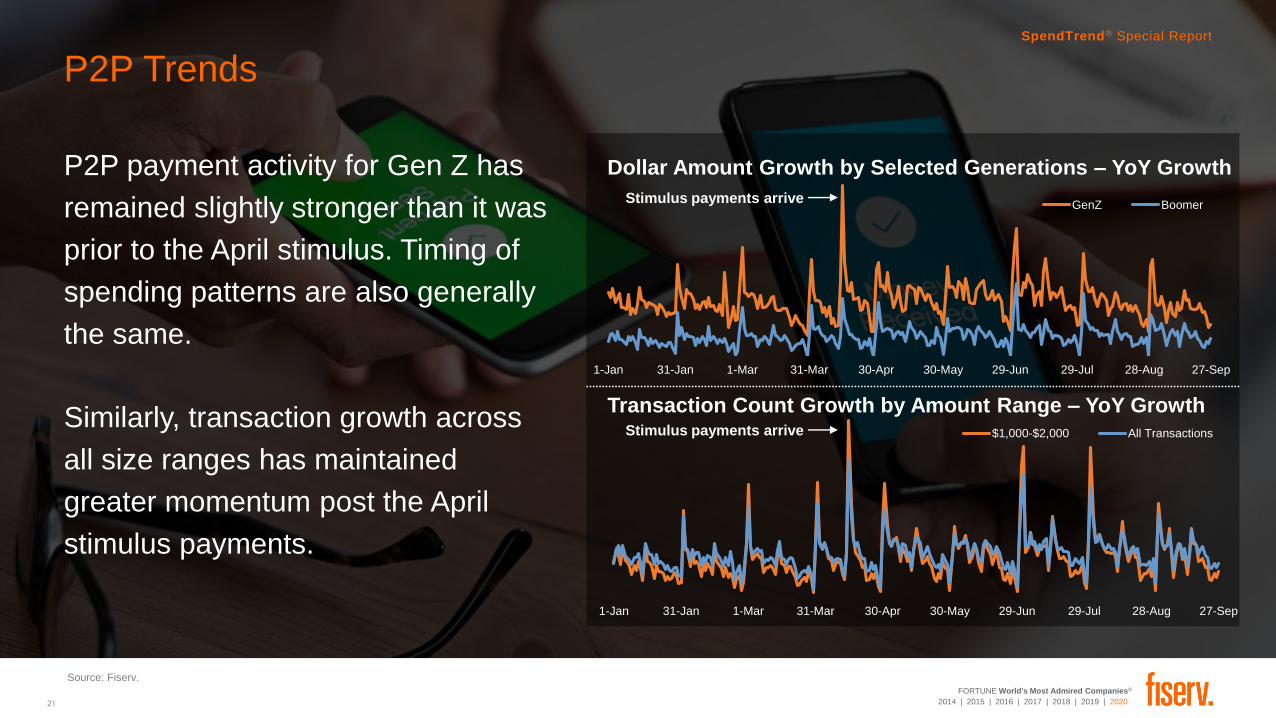
P2P Trends
P2P payment activity for Gen Z has
remained slightly stronger than it was
prior to the April stimulus. Timing of
spending patterns are also generally
the same.
Source: Fiserv.
SpendTrend® Special Report
Source: Fiserv.
Dollar Amount Growth by Selected Generations – YoY Growth
Transaction Count Growth by Amount Range – YoY GrowthSimilarly, transaction growth across
all size ranges has maintained
greater momentum post the April
stimulus payments.
1-Jan 31-Jan 1-Mar 31-Mar 30-Apr 30-May 29-Jun 29-Jul 28-Aug 27-Sep
GenZ BoomerStimulus payments arrive
1-Jan 31-Jan 1-Mar 31-Mar 30-Apr 30-May 29-Jun 29-Jul 28-Aug 27-Sep
$1,000-$2,000 All TransactionsStimulus payments arrive
22
FORTUNE World's Most Admired Companies®
2014 | 2015 | 2016 | 2017 | 2018 | 2019 | 2020 © 2020 Fiserv, Inc.
SpendTrend® Special Report
Same Store figures include activity (amount of USD sales volumes or transactions) for merchant locations that
are open and have activity in both comparison time periods. They are not reflective of overall Fiserv activity.
Same Store Dollar Volume growth reflects the percent change in the USD amount of same store sales (net of
returns) in the current period compared to the same period in the prior year. Same Store Transaction growth
reflects the percent change in the number of same store transactions (net of returns) in the current period
compared to the same period in the prior year.
Same Store Average Ticket is derived by dividing the total USD amount of Same Store Sales for a specified
period by the total number of Same Store Transactions for that same period.
Same Store Sales Data includes sample data which we believe generally reflects current trends but does not
include all data available to Fiserv and specifically excludes Salem platform, Bank of America proprietary
platform, and Bank of America TSYS platform activity.
All data contains Credit, Debit and EBT transactions.
All charts show year-over-year (YoY) growth rates for same time period in previous year. Growth rates are not
seasonally adjusted.
Cash Usage at the Point of Sale includes transactions conducted at Clover Point of Sale terminals.
Mobile Wallet (in-app/e-commerce) includes transactions performed through mobile wallets such as Masterpass,
Visa Checkout, Walmart Pay, Apple Pay, Samsung Pay and Google Pay, but excludes face-to-face contactless
near field communications (NFC) transactions conducted via methods such as Apple Pay, Samsung Pay or
Google Pay.
P2P is person-to-person cash transfer services initiated with bank accounts at select financial institutions.
How to Read SpendTrend
All growth rates compare current performance to that of the same period prior year. We believe year-over-year
growth better reflects organic spending patterns. 7-day moving averages reflect the mean of the prior seven (7)
days.
We do not adjust for seasonality. We believe that seasonality adjustments are best made by the users of our
reports.
Our analysis is based on normalized POS activity from Fiserv’s proprietary systems. Our data includes only
card-based payments and checks where appropriate. Key differences between SpendTrend and other available
reports:
Government and network association reports are often based on surveys and estimates rather than actual POS
activity.
Government and network association reports often make sequential growth comparisons (i.e. April 2020 vs.
March 2020 instead of April 2020 vs. April 2019).
Government and network association reports make adjustments for assumptions and seasonality.
Terms and Conditions
The following terms and conditions (“Terms of Use”) apply to persons who are authorized to receive or obtain possession (“Rec ipient”) of this SpendTrend® report which was
prepared by First Data Merchant Services LLC (“First Data”), an affiliate of Fiserv, Inc. (referred to collectively as “Fiserv”) and governs Recipient’s use of the SpendTrend report
(including any portions or derivations thereof) and any articles, text, data, information, and other materials and services related thereto or included herein (collectively, “SpendTrend
report”). If Recipient is a subscriber to SpendTrend report, the terms of the subscriber agreement are in addition to and sha ll control to the extent there is any conflict with the terms
herein. Recipient agrees to be bound by, and to use the SpendTrend report in compliance with, the Terms of Use and all applicable laws, regulations, and rules. These Terms of Use
may be amended from time to time by Fiserv without notice and it is the Recipient’s responsibility to review the Terms of Use on www.spendtrend.com for updates, if any. If you have
any questions regarding the Terms of Use or the SpendTrend report, please contact Fiserv SpendTrend at [email protected].
1. Recipient is permitted to review, use, report, summarize, and print copies of the SpendTrend report solely for Recipient’s internal use as set forth in these Terms of Use. Except as
expressly permitted herein, the SpendTrend report or any portions thereof may not be otherwise reviewed, accessed, downloaded, used, reported, summarized, copied, reproduced,
modified, distributed to third parties, or published in any form or media. Recipient may not disclose or make available to third parties, all or any portion of the SpendTrend report
(including summaries thereof). The SpendTrend report is created with data that includes processing data from Fiserv’s credit, debit, EBT and check information warehouse that
Fiserv owns or has a contractual or other right to provide to Recipient through SpendTrend.
2. RECIPIENT SHALL NOT CHANGE, OBSCURE, OR REMOVE ANY COPYRIGHT OR OTHER NOTICE OR LEGEND APPEARING ON THE SPENDTREND REPORT; AND
RECIPIENT SHALL AT ALL TIMES LIST FISERV AS THE SOURCE OF ANY AND ALL INFORMATION, DATA, REPORTS, SUMMARY, QUOTES, AND OTHER SPENDTREND
CONTENT THAT MAY BE DISCLOSED TO THIRD PARTIES IN CONFORMANCE WITH THESE TERMS OF USE.
3. Fiserv does not provide any investment or financial advice and is not advocating the sale or purchase of any stocks, bonds, or securities. If Recipient is able to discern any
information about a particular entity or fund from the information in the SpendTrend report, either alone or with other information in the possession of Recipient. Recipient
understands and acknowledges that the information may be insider information under applicable law or otherwise restricted and Recipient will limit its use thereof in accordance with
applicable laws. Fiserv expressly states, and Recipient hereby acknowledges that this SpendTrend report is provided solely for informational purposes only and is not to be used as
a substitute for independent financial investment advice nor is it intended to be relied upon by any person or entity, including Recipient’s clients/customers, for the purpose of
investment or other financial decisions. This SpendTrend report contains forward-looking statements which involve significant risks and uncertainties, and a number of factors, both
foreseen and unforeseen, could cause actual results to differ materially from current expectations. THE SPENDTREND REPORT IS NOT TO BE CONSTRUED AS PROVIDING
INVESTMENT ADVICE AND SHOULD NOT BE USED OR CONSTRUED, IN WHOLE OR IN PART, AS A BASIS OR RECOMMENDATION FOR AN INVESTMENT DECISION.
4. While Fiserv takes commercially reasonable measures to ensure the accuracy of the information and content contained in the SpendTrend report, Fiserv makes no
representations or warranties of any kind with respect to the SpendTrend report. Further Recipient agrees that all use of the SpendTrend report by Recipient hereunder shall be: (i)
based on Recipient’s own determination and evaluation; and (ii) at Recipient’s sole risk. In addition, Recipient shall not, d irectly or indirectly, challenge, contest, or otherwise
disparage the SpendTrend report or the value or validity of any content/information therein. THE SPENDTREND REPORT IS PROVIDED TO RECIPIENT “AS-IS” AND FISERV
AND ITS AFFILIATES, AGENTS, SUPPLIERS AND LICENSORS EXPRESSLY DISCLAIM ALL WARRANTIES, EXPRESS OR IMPLIED, IN RELATION TO THE SPEND TREND
REPORT OR ANY CONTENT OR ITS USE BY RECIPIENT, INCLUDING ANY WARRANTY OF NON-INFRINGEMENT, ACCURACY, MERCHANTABILITY OR FITNESS FOR A
PARTICULAR PURPOSE. IN NO EVENT SHALL FISERV OR ITS AFFILIATES, AGENTS, SUPPLIERS OR LICENSORS BE LIABLE FOR ANY INDIRECT, INCIDENTAL, SPECIAL
OR CONSEQUENTIAL DAMAGES, INCLUDING WITHOUT LIMITATION, DAMAGES FOR LOSS OF PROFITS, DATA OR USE, INCURRED BY EITHER PARTY OR ANY THIRD
PARTY. FISERV AND ITS AFFILIATES, AGENTS, SUPPLIERS OR LICENSORS’ MAXIMUM LIABILITY ARISING OUT OF THE RECEIPT AND USE OF THIS SPENDTREND
SHALL BE SOLELY AS SET FORTH IN THE SUBSCRIBER AGREEMENT OR THE FEES PAID TO FISERV FOR THIS SPENDTREND REPORT.
5. Recipient shall indemnify, defend, and hold harmless, Fiserv, its affiliates, and/or related companies and their respective officers, directors, employees, agents, licensors,
expenses, damages and costs, including reasonable attorney’s fees, resulting from or related to Recipient’s use of the SpendTrend report, or any portions thereof, and/or any
violation of this Agreement or the Terms of Use.
6. Recipient agrees that Fiserv, its affiliates and/or related companies own all rights and title in and to the SpendTrend report, including all content. In addition, all trademarks,
service marks, logos, trade dress, and names (“Trademarks”) appearing on the SpendTrend report are the exclusive property of Fiserv, its affiliates or other respective owners.
Recipient is not being granted any rights, permission, or license to use any of the Trademarks. All rights in the SpendTrend report and Trademarks are expressly reserved by Fiserv.
7. Recipient shall not combine the SpendTrend report or any portions thereof with any third party information, data, report, or content: (i) in a manner that states or suggests that
Fiserv or the SpendTrend report is endorsing, sponsoring, or otherwise affiliated with any such third party content, products, or services; or (ii) to create an independent report,
article, index, or other product to be offered outside the Recipient’s use.
8. The SpendTrend report may contain references or information obtained from third parties (“Third Party Information”). Fiserv does not make any representations or warranties
regarding any Third Party Information and Recipient agrees that Fiserv is not responsible for, and does not control the Third Party Information. * If you are not an authorized
Recipient of the SpendTrend report, or do not agree to the Terms of Use, and have received a copy of the SpendTrend report, you are not permitted to retain the SpendTrend report
and must destroy or permanently delete the document/file, and are hereby notified that any use, dissemination, distribution, or copying of the SpendTrend report is strictly prohibited.
SpendTrend® Special Report