Embed Size (px)
Citation preview
Spider Glass Behaviour Under Seismic Action
L. Martins & R. Delgado Faculty of Engineering of University of Porto, Portugal
R. Camposinhos Scholl of Engineering of Polytechnic of Porto, Portugal
SUMMARY:
This paper presents a study on the structural behaviour of laminated glass panels with point-fixed façade system
(spider glass) submitted to seismic action so that it aims to a better understanding of this fixing system
behaviour. A study was conducted on a set of laminated glass panels used on an office building in Lisbon. A
simplified method was used to obtain the maximum induced force on the façade panels. Subsequently several
series of numeric tests were conducted using the accelerations records on a real and artificial earthquake. Time
history analyses were preformed to assess the existence of resonant effects on the panel due to the building’s
natural frequency and the sensitivity to damping.
Keywords: Seismic action, Structural glass, Numerical modelling
1. INTRODUCTION
Glass is a material that has been used in construction industry for centuries mainly for the production
of windows, but recent developments in science and technology meant that nowadays glass is used in
structural demanding applications like façades, girders and columns.
Due to its characteristics glazing façade solutions aims to gather building’s envelope in such way that
it has become one of the defining features of the twentieth and twenty first century architecture.
Modern glazed façade curtain wall systems include either singular aluminium alloy frame glass curtain
walls or frameless glass curtain walls.
During an earthquake, due to both in-plane and out of plane loads, glass breakage and fallout poses
serious hazard to pedestrians and occupants with considerable economic losses. For example Sucuoǧlu
and Vallabhan (1997) refer broken windows as the second most serious non-structural damage related
with earthquakes.
Although there is some research on the behaviour of glass panels under out-of-plane loads, e.g., wind
loads, the combine effect of both in-plane and out-of plane loads that are applied to the panels during
an earthquake seems to be a not very well studied subject.In fact, seismic action brings out specific
problems not only to designers but to practitioners as well, mainly, due to the lack of, at least well-
known, international rules or regulations about this issue. Design codes tend to limit out-of-plane
damage by specifying a seismic static load while damage due to in-plane vibration is controlled by
imposing interstorey drift limits to buildings (Sucuoǧlu & Vallabhan 1997). The scope of this paper is
to present the relevant aspects of the seismic loading in point fixed glass panels. Firstly a simplified
method based upon the elastic response spectrum is introduced, then the results of time history
dynamic analyses are presented.
2. STATE OF ART
2.1 A review on the structural behaviour of glass and design of glazed structures
From a chemical point of view glass is
fusing silica with an oxide and when subjected to loads exhibits
behaviour and brittle failure. The brittle nature of
within the mesh of silicon and oxygen atoms to allow plastic deformations
According to Haldimann et al (2008)
GPa, however the actual relevant value for engineering applications is much lower
explanation lies on the fact that glass’ tensile strength depends very much on the me
over the surface which may not be visible to the naked eye
of a surface flaw reaches a critical value
strength, however this is of little interest for most structural applicat
reached long before the compressive strength is exceeded
dependent on the duration and intensity
conditions. Usually, the higher intensity
ultimate bearing capacity (Haldimann et al.
The current state of art in structural glass design is a process that relies on the combination of
empirical rules and recommendations and
regulations about structural glass are the ASTM E1300
1999), both are applicable only to glass panels subjected to uniform loads.
prescribed by the prEN13474 is the only one that directly compares the internal stresses due to loading
with the material strength and enables accounting the no
the prEN13474 most of the design method
the quantification of the action has an
resistance. In fact these methods only
factors known to influence the response of
size and environmental conditions. Especially
are ignored (Martins 2011).
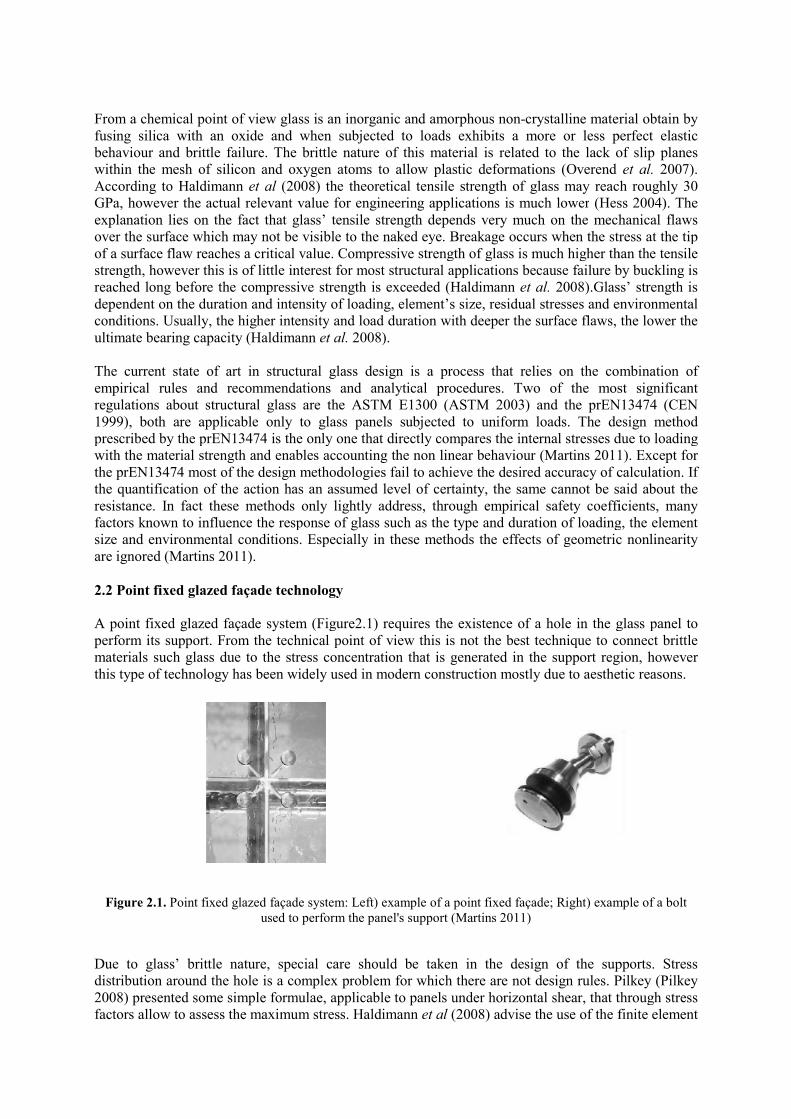
2.2 Point fixed glazed façade technology
A point fixed glazed façade system (Figure2.1
perform its support. From the technical point of view this is not the best technique to connect brittle
materials such glass due to the stress concentration that is g
this type of technology has been widely used i
Figure 2.1. Point fixed glazed façade system:
used to perform the panel's support
Due to glass’ brittle nature, special care should be taken in the design of the supports. Stress
distribution around the hole is a complex problem for which there are not
2008) presented some simple formulae
factors allow to assess the maximum stress
is an inorganic and amorphous non-crystalline material obtain by
hen subjected to loads exhibits a more or less perfect elastic
. The brittle nature of this material is related to the lack of
within the mesh of silicon and oxygen atoms to allow plastic deformations (Overend
) the theoretical tensile strength of glass may reach
GPa, however the actual relevant value for engineering applications is much lower (Hess 2004
lies on the fact that glass’ tensile strength depends very much on the mechanical flaws
not be visible to the naked eye. Breakage occurs when the stress at the tip
value. Compressive strength of glass is much higher than the tensile
is of little interest for most structural applications because failure by buckling is
reached long before the compressive strength is exceeded (Haldimann et al. 2008).Glass’
and intensity of loading, element’s size, residual stresses and environmental
intensity and load duration with deeper the surface flaws, the lower the
et al. 2008).
current state of art in structural glass design is a process that relies on the combination of
empirical rules and recommendations and analytical procedures. Two of the most
ral glass are the ASTM E1300 (ASTM 2003) and the prEN13474
glass panels subjected to uniform loads. The design method
prescribed by the prEN13474 is the only one that directly compares the internal stresses due to loading
and enables accounting the non linear behaviour (Martins 2011
the prEN13474 most of the design methodologies fail to achieve the desired accuracy of calculation
an assumed level of certainty, the same cannot be said
only lightly address, through empirical safety coefficients
the response of glass such as the type and duration of loading
Especially in these methods the effects of geometric
lazed façade technology
Figure2.1) requires the existence of a hole in the glass panel to
From the technical point of view this is not the best technique to connect brittle
materials such glass due to the stress concentration that is generated in the support region, how
f technology has been widely used in modern construction mostly due to aesthetic reasons.
Point fixed glazed façade system: Left) example of a point fixed façade; Right) example of a bolt
used to perform the panel's support (Martins 2011)
ass’ brittle nature, special care should be taken in the design of the supports. Stress
distribution around the hole is a complex problem for which there are not design rules. Pilkey
formulae, applicable to panels under horizontal shear, that through stress
the maximum stress. Haldimann et al (2008) advise the use of the finite element
crystalline material obtain by
perfect elastic
material is related to the lack of slip planes
et al. 2007).
may reach roughly 30
Hess 2004). The
chanical flaws
when the stress at the tip
ompressive strength of glass is much higher than the tensile
by buckling is
Glass’ strength is
size, residual stresses and environmental
deeper the surface flaws, the lower the
current state of art in structural glass design is a process that relies on the combination of
Two of the most significant
and the prEN13474 (CEN
The design method
prescribed by the prEN13474 is the only one that directly compares the internal stresses due to loading
Martins 2011). Except for
of calculation. If
cannot be said about the
coefficients, many
of loading, the element
geometric nonlinearity
requires the existence of a hole in the glass panel to
From the technical point of view this is not the best technique to connect brittle
enerated in the support region, however
due to aesthetic reasons.
ight) example of a bolt
ass’ brittle nature, special care should be taken in the design of the supports. Stress
. Pilkey (Pilkey
through stress
dvise the use of the finite element
method to determine the final solution, however the designer should be aware the stress distribution is
heavily influenced by the modelling solution adopted for the boundary conditions (Martins 2011). In
the development of the glass façade the engineer must take in to account some details like the gap
between the bolt and the panel, the distance between the hole and the panel’s edge and glass’
thickness, because this factors are known to heavily influence the panel’s structural behaviour
(Haldimann et al. 2008).
2.3 Seismic design of glazed façades
Severe earthquake causes damage to both structural and non-structural elements such as window glass
and curtain walls. Besides the fact that damage suffered by curtain wall façades is very costly, falling
façade fragments during an earthquake poses a serious hazard to both pedestrians and people
attempting to leave the building.
Very little research has been produced on the seismic performance of glass panels, being one of the
firsts due to Bouwkamp (1961); in which the author analysed the behaviour of windows panels under
static in-plane loading. Thirty years later King and Lim (1991), as cited by Sucuoǧlu and Vallabhan
(1997), also published the results of an experimental study on the in-plane behaviour of curtain wall
glazing systems with similar conclusions to those of Bouwkamp. More recently, Memari et al (2004,
2003) also conducted studies on the seismic behaviour of glazed façade panels.
During an earthquake two types of lateral loads are considered acting in the façade panels: the “in
plane” loads and the “out of plane” loads. In-plane actions causes, mainly shear stresses, while the
others excite the panel in bending. The frequency content of the dynamic loads transmitted to the
panels is modulated by the building natural frequency, so if it happens that it has a value very close to
the panel’s natural frequency, resonant effects occur with an agonisingly increase of the dynamic
response, a well-known phenomena that must be avoided, otherwise structural safety may be
compromised.
For out-of-plane loads some simplified methods to assess the seismic behaviour of glazed façade
panels are available and will be properly reviewed further in this paper (Camposinhos 2009; Singh et
al. 2006, 2006), however the same is not true for in-plane loading. As there are no design regulations
for determine seismic behaviour under in-plane loads, some laboratory test procedures according to
the American Architectural Manufacturers Association recommendations (AAMA 2009, 2009) are
followed in order to evaluate the maximum seismic drift which may cause glass breakage and fallout
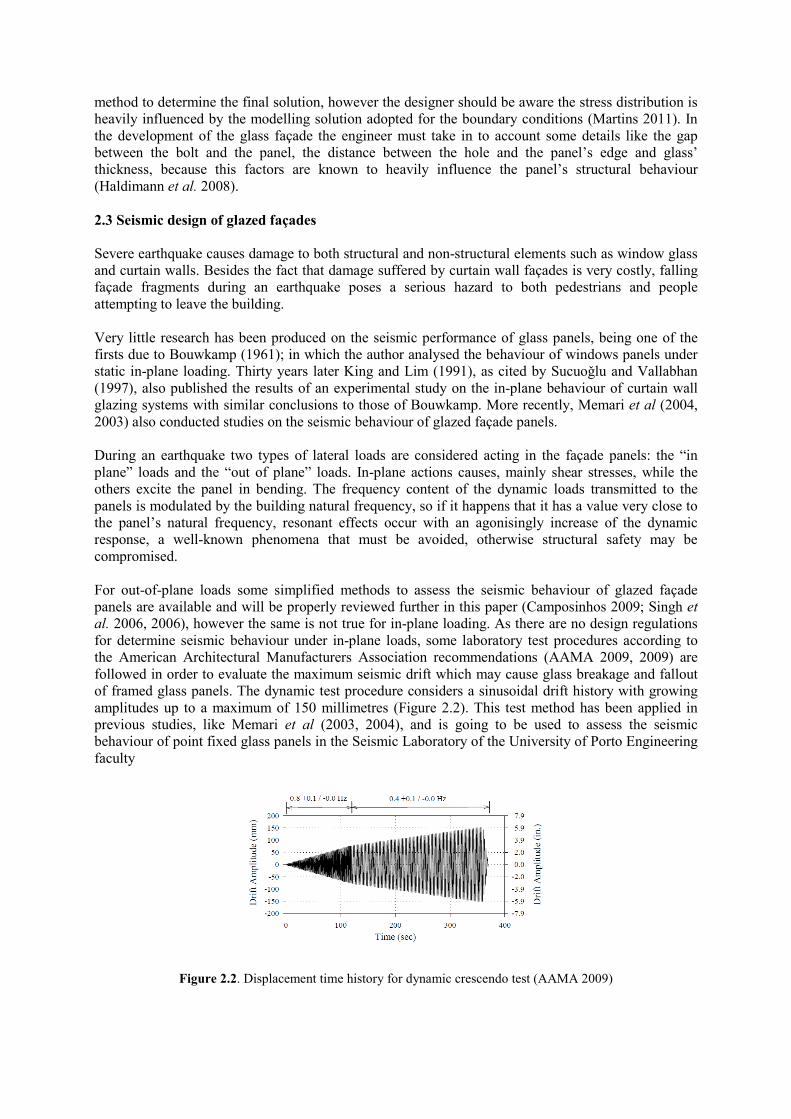
of framed glass panels. The dynamic test procedure considers a sinusoidal drift history with growing
amplitudes up to a maximum of 150 millimetres (Figure 2.2). This test method has been applied in
previous studies, like Memari et al (2003, 2004), and is going to be used to assess the seismic
behaviour of point fixed glass panels in the Seismic Laboratory of the University of Porto Engineering
faculty
Figure 2.2. Displacement time history for dynamic crescendo test (AAMA 2009)

3. SIMPLIFIED METHOD TO ASSESS SEISMIC LOADS
In the work of Camposinhos (2009) a simplified method to assess the seismic forces, adapted from the
studies of Singh et al (2006, 2006), is presented. The seismic force, calculated thought Eqn. 3.1,
depends on the building’s natural vibration period, the panel’s mass and natural vibration period and
the spectral acceleration evaluated according to Eurocode 8 (CEN 2010) rules.
E
EEDSfZ
EkR
MSCF
⋅γ⋅⋅⋅=
40.0 (3.1)
Where:
FEk characteristic seismic force;
CfZ seismic coefficient of the panel
SDS ground acceleration value;
γE importance coefficients of the panel (ranging between 1.0 and 1.5);
ME panel’s mass;
RE coefficient of performance of the panel (ranging between 1.5 and 3.5).
The output of Eqn 3.1 is directly related with Cfz which depends on many other parameters like the
building’s natural vibration frequency and height, the panel’s dynamic properties and the floor in
which it is located. The individual contribution of each one of these parameters was studied by
Martins (2011) in which the author concluded that the positioning of the panel in building plays a
major role in the variation of Cfz and consequently in the maximum seismic force. The elastic response
spectrum used in this study is shown in Figure 3.1. The response spectrum was computed in order to
get the maximum spectrum acceleration expected for the Portuguese territory, so was assumed an
seismic action type II, soil type D and the Portuguese seismic zone 2.1 (CEN 2010).
Figure 3.1. Design response spectrum (CEN 2010)
Prior to the application of the simplified method a parametric analysis was made to evaluate the most
severe design hypothesis from the seismic action point of view. To evaluate the variation of the
parameter Cfz two different cases were studied: in the first the panel is assumed to be in the last floor
(m=N), and in the second, the panel was assumed to be at the penultimate floor (m=N-1). The results
(Figure 3.2) show a significant decay in the parameter Cfz when the panel is assumed to be in the
penultimate floor with peak values being about 30% lower. Since the seismic load is directly
correlated with this parameter the same behaviour is expected, so in the design stage special attention
should be devoted to the panel placed in the last floor, thus it is in the significantly severe situation. In
the plots is visible that the maximum values are reached for natural vibration periods of the building
close the panel’s own natural vibration period, this behaviour derives from the fact that the dynamic
load transmitted to the panel has its frequency content modulated by the building’s natural frequency.
0.0
2.0
4.0
6.0
8.0
10.0
0.0 1.0 2.0 3.0 4.0
Sa (
m/s
2)
T (s)
Response spectrum (Seismic action type II; soil type D; seismic region 2.1;
η=1.0)
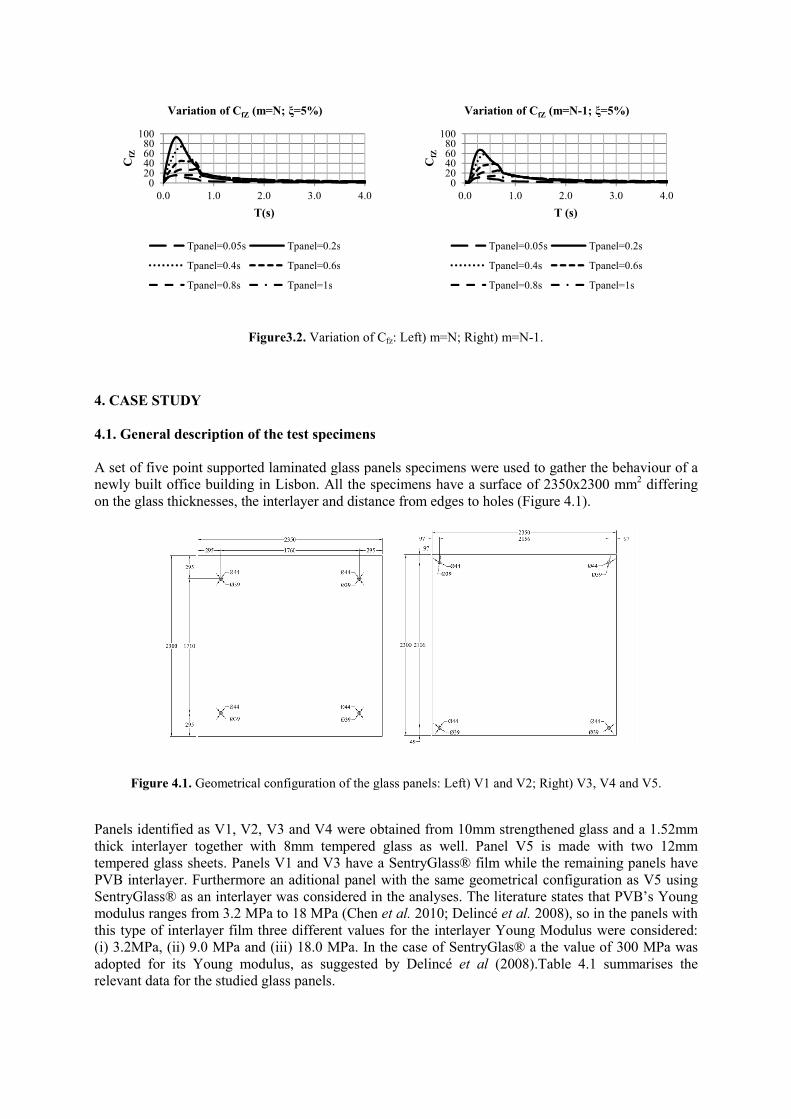
Figure3.2. Variation of C
4. CASE STUDY
4.1. General description of the test specimens
A set of five point supported laminated glass panels
newly built office building in Lisbon.
on the glass thicknesses, the interlayer and distance from edges to holes
Figure 4.1. Geometrical configuration of the glass panels:
Panels identified as V1, V2, V3 and V4
thick interlayer together with 8mm tempered glass
tempered glass sheets. Panels V1 and V3 have a SentryGlass
PVB interlayer. Furthermore an aditional
SentryGlass® as an interlayer was considered in the analyses. The
modulus ranges from 3.2 MPa to 18 MPa
this type of interlayer film three different values for
(i) 3.2MPa, (ii) 9.0 MPa and (iii) 18.0 MPa. In the case of SentryGlas
adopted for its Young modulus, as suggested by Delincé
relevant data for the studied glass panels.
020406080
100
0.0 1.0 2.0 3.0
CfZ
T(s)
Variation of CfZ (m=N; ξ=5%)
Tpanel=0.05s Tpanel=0.2s
Tpanel=0.4s Tpanel=0.6s
Tpanel=0.8s Tpanel=1s
Variation of Cfz: Left) m=N; Right) m=N-1.
4.1. General description of the test specimens
of five point supported laminated glass panels specimens were used to gather the behaviour of a
All the specimens have a surface of 2350x2300 mm
on the glass thicknesses, the interlayer and distance from edges to holes (Figure 4.1).
Geometrical configuration of the glass panels: Left) V1 and V2; Right) V3, V4 and V5.
anels identified as V1, V2, V3 and V4 were obtained from 10mm strengthened glass and a 1.52mm
thick interlayer together with 8mm tempered glass as well. Panel V5 is made with
tempered glass sheets. Panels V1 and V3 have a SentryGlass® film while the remaining panels have
aditional panel with the same geometrical configuration
was considered in the analyses. The literature states that PVB’s Young
om 3.2 MPa to 18 MPa (Chen et al. 2010; Delincé et al. 2008), so in the panels with
three different values for the interlayer Young Modulus were considered:
(i) 3.2MPa, (ii) 9.0 MPa and (iii) 18.0 MPa. In the case of SentryGlas® a the value of 300 MPa was
adopted for its Young modulus, as suggested by Delincé et al (2008).Table 4.1 summarises the
relevant data for the studied glass panels.
3.0 4.0
=5%)
Tpanel=0.2s
Tpanel=0.6s
Tpanel=1s
020406080
100
0.0 1.0 2.0 3.0
CfZ
T (s)
Variation of CfZ (m=N-1; ξ=5%)
Tpanel=0.05s Tpanel=0.2s
Tpanel=0.4s Tpanel=0.6s
Tpanel=0.8s Tpanel=1s
the behaviour of a
All the specimens have a surface of 2350x2300 mm2 differing
ight) V3, V4 and V5.
obtained from 10mm strengthened glass and a 1.52mm
with two 12mm
® film while the remaining panels have
with the same geometrical configuration as V5 using
PVB’s Young
the panels with
were considered:
® a the value of 300 MPa was
summarises the
3.0 4.0
=5%)
Tpanel=0.2s
Tpanel=0.6s
Tpanel=1s
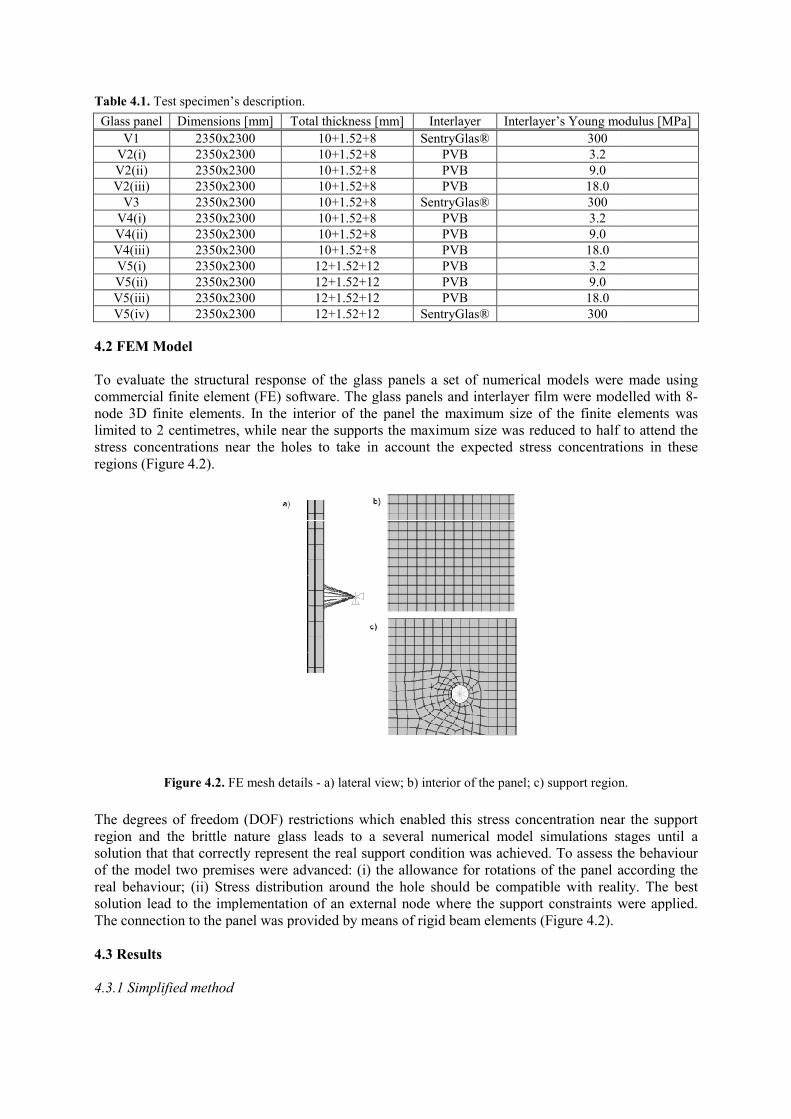
Table 4.1. Test specimen’s description.
Glass panel Dimensions [mm] Total thickness [mm]
V1 2350x2300 10+1.52+8
V2(i) 2350x2300 10+1.52+8
V2(ii) 2350x2300 10+1.52+8
V2(iii) 2350x2300 10+1.52+8
V3 2350x2300 10+1.52+8
V4(i) 2350x2300 10+1.52+8
V4(ii) 2350x2300 10+1.52+8
V4(iii) 2350x2300 10+1.52+8
V5(i) 2350x2300 12+1.52+12
V5(ii) 2350x2300 12+1.52+12
V5(iii) 2350x2300 12+1.52+12
V5(iv) 2350x2300 12+1.52+12
4.2 FEM Model
To evaluate the structural response of the glass panels a set of numerical models were made using
commercial finite element (FE) software. The glass panels and interlayer film were
node 3D finite elements. In the interior of the panel the maximum size of the finite elements was
limited to 2 centimetres, while near the supports the maximum size was reduced to half to attend the
stress concentrations near the holes to take in a
regions (Figure 4.2).
Figure 4.2. FE mesh details -
The degrees of freedom (DOF) restrictions which enabled this stress concentration near
region and the brittle nature glass leads to a several numerical model simulations stages until a
solution that that correctly represent the real support condition was achieved.
of the model two premises were advanced:
real behaviour; (ii) Stress distribution around the hole should be compatible with reality. The best
solution lead to the implementation of an external node where the support constraints
The connection to the panel was provided
4.3 Results
4.3.1 Simplified method
Total thickness [mm] Interlayer Interlayer’s Young modulus [MPa]
10+1.52+8 SentryGlas® 300
10+1.52+8 PVB 3.2
10+1.52+8 PVB 9.0
10+1.52+8 PVB 18.0
10+1.52+8 SentryGlas® 300
10+1.52+8 PVB 3.2
10+1.52+8 PVB 9.0
10+1.52+8 PVB 18.0
12+1.52+12 PVB 3.2
12+1.52+12 PVB 9.0
12+1.52+12 PVB 18.0
12+1.52+12 SentryGlas® 300
To evaluate the structural response of the glass panels a set of numerical models were made using
commercial finite element (FE) software. The glass panels and interlayer film were modelled
node 3D finite elements. In the interior of the panel the maximum size of the finite elements was
, while near the supports the maximum size was reduced to half to attend the
stress concentrations near the holes to take in account the expected stress concentrations in these
- a) lateral view; b) interior of the panel; c) support region.
reedom (DOF) restrictions which enabled this stress concentration near
region and the brittle nature glass leads to a several numerical model simulations stages until a
solution that that correctly represent the real support condition was achieved. To assess the behaviour
of the model two premises were advanced: (i) the allowance for rotations of the panel according the
real behaviour; (ii) Stress distribution around the hole should be compatible with reality. The best
solution lead to the implementation of an external node where the support constraints were appli
The connection to the panel was provided by means of rigid beam elements (Figure 4.2).
Interlayer’s Young modulus [MPa]
To evaluate the structural response of the glass panels a set of numerical models were made using
modelled with 8-
node 3D finite elements. In the interior of the panel the maximum size of the finite elements was
, while near the supports the maximum size was reduced to half to attend the
ccount the expected stress concentrations in these
; b) interior of the panel; c) support region.
reedom (DOF) restrictions which enabled this stress concentration near the support
region and the brittle nature glass leads to a several numerical model simulations stages until a
To assess the behaviour
(i) the allowance for rotations of the panel according the
real behaviour; (ii) Stress distribution around the hole should be compatible with reality. The best
were applied.
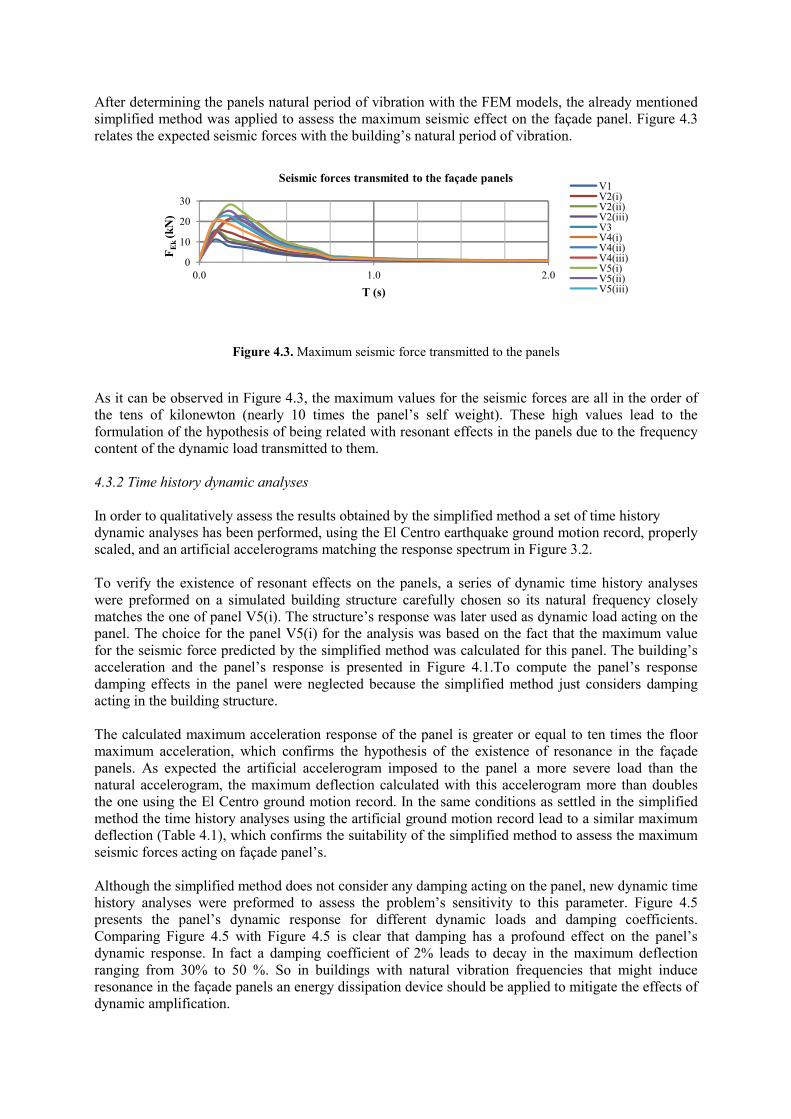
After determining the panels natural period of vibration with the FEM models, the already mentioned
simplified method was applied to assess the maximum seismic effect on the façade panel. Figure 4.3
relates the expected seismic forces with the building’s natural period of vibration.
Figure 4.3. Maximum seismic force transmitted to the panels
As it can be observed in Figure 4.3, the maximum values for the seismic forces are all in the order of
the tens of kilonewton (nearly 10 times the panel’s self weight). These high values lead to the
formulation of the hypothesis of being related with resonant effects in the panels due to the frequency
content of the dynamic load transmitted to them.
4.3.2 Time history dynamic analyses
In order to qualitatively assess the results obtained by the simplified method a set of time history
dynamic analyses has been performed, using the El Centro earthquake ground motion record, properly
scaled, and an artificial accelerograms matching the response spectrum in Figure 3.2.
To verify the existence of resonant effects on the panels, a series of dynamic time history analyses
were preformed on a simulated building structure carefully chosen so its natural frequency closely
matches the one of panel V5(i). The structure’s response was later used as dynamic load acting on the
panel. The choice for the panel V5(i) for the analysis was based on the fact that the maximum value
for the seismic force predicted by the simplified method was calculated for this panel. The building’s
acceleration and the panel’s response is presented in Figure 4.1.To compute the panel’s response
damping effects in the panel were neglected because the simplified method just considers damping
acting in the building structure.
The calculated maximum acceleration response of the panel is greater or equal to ten times the floor
maximum acceleration, which confirms the hypothesis of the existence of resonance in the façade
panels. As expected the artificial accelerogram imposed to the panel a more severe load than the
natural accelerogram, the maximum deflection calculated with this accelerogram more than doubles
the one using the El Centro ground motion record. In the same conditions as settled in the simplified
method the time history analyses using the artificial ground motion record lead to a similar maximum
deflection (Table 4.1), which confirms the suitability of the simplified method to assess the maximum
seismic forces acting on façade panel’s.
Although the simplified method does not consider any damping acting on the panel, new dynamic time
history analyses were preformed to assess the problem’s sensitivity to this parameter. Figure 4.5
presents the panel’s dynamic response for different dynamic loads and damping coefficients.
Comparing Figure 4.5 with Figure 4.5 is clear that damping has a profound effect on the panel’s
dynamic response. In fact a damping coefficient of 2% leads to decay in the maximum deflection
ranging from 30% to 50 %. So in buildings with natural vibration frequencies that might induce
resonance in the façade panels an energy dissipation device should be applied to mitigate the effects of
dynamic amplification.
0
10
20
30
0.0 1.0 2.0
FE
k (k
N)
Τ (s)
Seismic forces transmited to the façade panels V1V2(i)V2(ii)V2(iii)V3V4(i)V4(ii)V4(iii)V5(i)V5(ii)V5(iii)
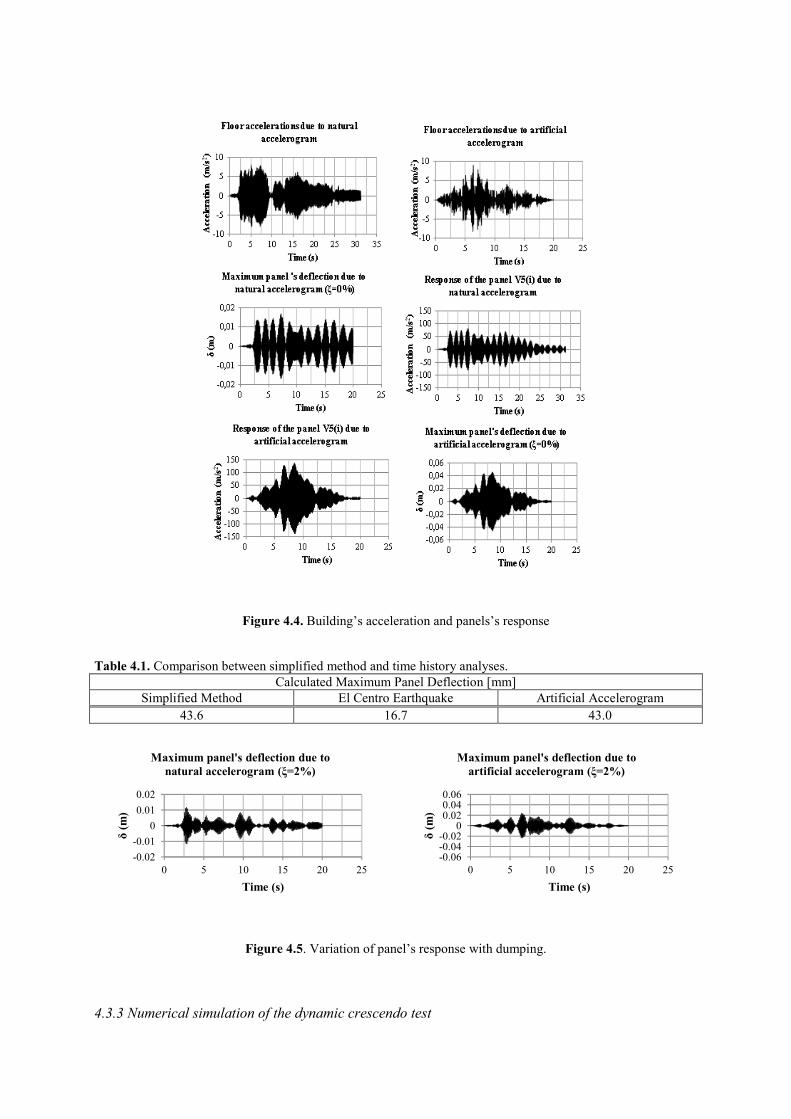
Figure 4.4. Building’s acceleration and panels’s response
Table 4.1. Comparison between simplified method and time history analyses.
Calculated Maximum Panel Deflection [mm]
Simplified Method El Centro Earthquake Artificial Accelerogram
43.6 16.7 43.0
Figure 4.5. Variation of panel’s response with dumping.
4.3.3 Numerical simulation of the dynamic crescendo test
-0.02
-0.01
0
0.01
0.02
0 5 10 15 20 25
δ(m
)
Time (s)
Maximum panel's deflection due to
natural accelerogram (ξ=2%)
-0.06-0.04-0.02
00.020.040.06
0 5 10 15 20 25
δ(m
)
Time (s)
Maximum panel's deflection due to
artificial accelerogram (ξ=2%)
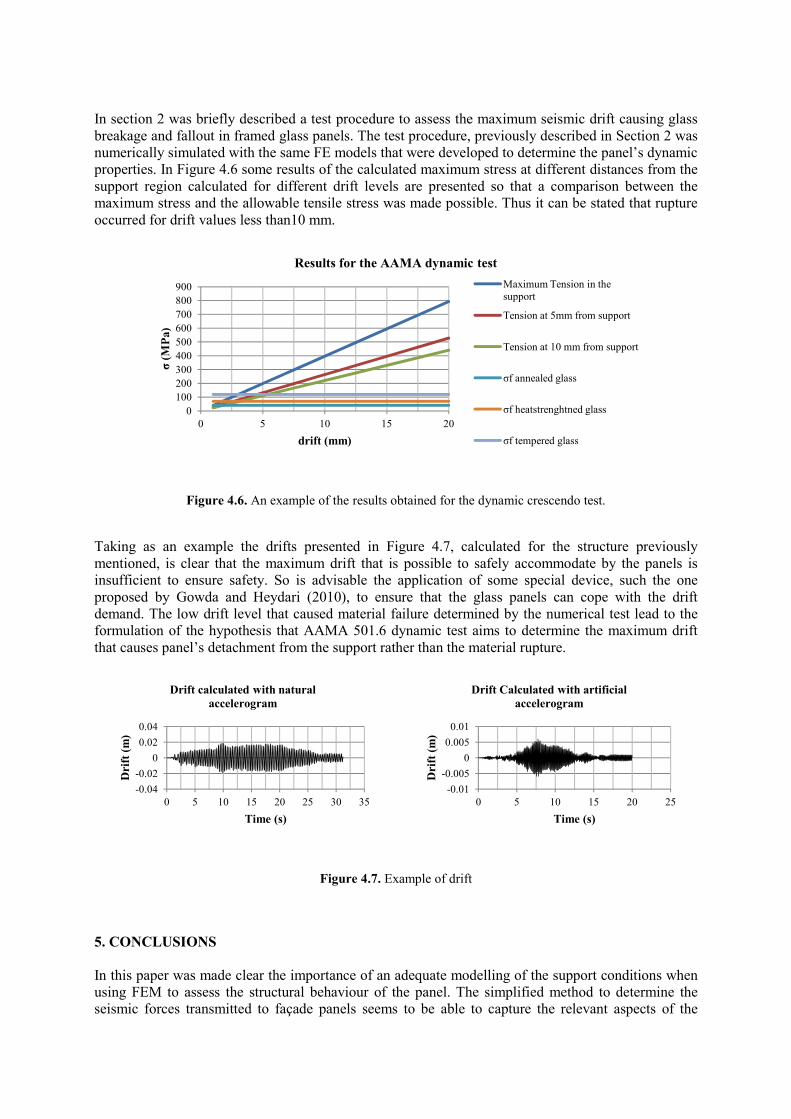
In section 2 was briefly described a test procedure to assess the maximum seismic drift causing glass
breakage and fallout in framed glass panels. The test procedure, previously described in Section 2 was
numerically simulated with the same FE models that were developed to determine the panel’s dynamic
properties. In Figure 4.6 some results of the calculated maximum stress at different distances from the
support region calculated for different drift levels are presented so that a comparison between the
maximum stress and the allowable tensile stress was made possible. Thus it can be stated that rupture
occurred for drift values less than10 mm.
Figure 4.6. An example of the results obtained for the dynamic crescendo test.
Taking as an example the drifts presented in Figure 4.7, calculated for the structure previously
mentioned, is clear that the maximum drift that is possible to safely accommodate by the panels is
insufficient to ensure safety. So is advisable the application of some special device, such the one
proposed by Gowda and Heydari (2010), to ensure that the glass panels can cope with the drift
demand. The low drift level that caused material failure determined by the numerical test lead to the
formulation of the hypothesis that AAMA 501.6 dynamic test aims to determine the maximum drift
that causes panel’s detachment from the support rather than the material rupture.
Figure 4.7. Example of drift
5. CONCLUSIONS
In this paper was made clear the importance of an adequate modelling of the support conditions when
using FEM to assess the structural behaviour of the panel. The simplified method to determine the
seismic forces transmitted to façade panels seems to be able to capture the relevant aspects of the
0
100
200
300
400
500
600
700
800
900
0 5 10 15 20
σ(M
Pa)
drift (mm)
Results for the AAMA dynamic test
Maximum Tension in the
support
Tension at 5mm from support
Tension at 10 mm from support
σf annealed glass
σf heatstrenghtned glass
σf tempered glass
-0.04
-0.02
0
0.02
0.04
0 5 10 15 20 25 30 35
Dri
ft (
m)
Time (s)
Drift calculated with natural
accelerogram
-0.01
-0.005
0
0.005
0.01
0 5 10 15 20 25
Dri
ft (
m)
Time (s)
Drift Calculated with artificial
accelerogram

whole issue regarding resonance effects as well. The numerical simulations using time history analysis
confirmed the hypothesis of resonance effects induced by the building’s natural frequency and are in
agreement with the peak values determined by the simplified method. Tests showed up that the
problem’s sensibility to damping is relevant. In fact a 2% damping ratio for the panels lead to a 30%
decrease in its maximum deflection. It must be emphasized that in earthquake prone regions façade
panels without energy dissipation devices could be seriously and dangerously excited into non
acceptable limits.
REFERENCES
AAMA. (2009). AAMA 501.4-09: Recommended static testing method for evaluating curtain wall and storefront
systems subjected to seismic and wind induced interstory drift. AAMA.
AAMA. (2009). AAMA 501.6-09: Recommended dynamic test method for determining the seismic drift causing
glass fallout from a wall system. AAMA.
ASTM. (2003). ASTM E1300-03: Standard practice for determining load resistence of glass buildings. ASTM.
Bouwkamp, J. G. (1961). Behavior of window panels under in-plane forces. Bulletin of the Seismological Society
of America 51 (1):85-109.
Camposinhos, R. (2009). Revestimentos em pedra natural com fixação mecânica dimensionamento e projecto.
Lisboa: Edições Sílabo.
CEN. (1999). prEn 13474-1:Glass in building - Design of glass panes - Part 1: General basis of design.
CEN. (2010). Eurocode 8 - Design of structures for earthquake resistance Part1: General rules, seismic actions
and rules for buildings. Caparica: IPQ.
Chen, J., Zhang, Q. and Xie, B. (2010). Nonlinear finite element analysis on laminated glass panel based on
APDL. Computer Aided Engineering 19:22-6.
Delincé, D., Callewaert, D., Belis, J., et al. (2008). Post-breakage behaviour of laminated glass in structural
applications. in Challenging Glass.
Gowda, B. and Heydari, N. (2010). High displacement glass seismic systems. Practice Periodical on Structural
Design and Construction 15 (2):170-176.
Haldimann, M., Luible, A. and Overend, M. (2008). Structural Use of Glass, Structural Engineering Documents:
International Association for Bridge and Structural Engineering.
Hess, R. (2004). Material glass. Structural Engineering International: Journal of the International Association
for Bridge and Structural Engineering (IABSE) 14 (2):76-79.
King, A. B. and Lim, K. Y. S. (1991). The behavior of external glazing systems under seismic in-plane rocking.
in Pacific Conference of Earthquake Engineering, Auckland.
Martins, L. (2011). Comportamento estrutural de painéis de vidro em fachadas. Master's Thesis, University of
Porto, Porto.
Memari, A. M., Behr, R. A. and Kremer, P. A. (2003). Seismic behavior of curtain walls containing insulating
glass units. Journal of Architectural Engineering 9 (2):70-85.
Memari, A. M., Behr, R. A. and Kremer, P. A. (2004). Dynamic racking crescendo tests on architectural glass
fitted with anchored pet film. Journal of Architectural Engineering 10 (1):5-14.
Overend, M., De Gaetano, S. and Haldimann, M. (2007). Diagnostic interpretation of glass failure. Structural
Engineering International: Journal of the International Association for Bridge and Structural Engineering
(IABSE) 17 (2):151-158.
Pilkey, Walter D. (2008). Stress Concentration Factors. Vol. 3rd ed. New York: John Wiley.
Singh, M. P., Moreschi, L. M., Suárez, L. E., et al. (2006). Seismic design forces. I: Rigid nonstructural
components. Journal of Structural Engineering 132 (10):1524-1532.
Singh, M. P., Moreschi, L. M., Suárez, L. E., et al. (2006). Seismic design forces. II: Flexible nonstructural
components. Journal of Structural Engineering 132 (10):1533-1542.
Sucuoǧlu, H. and Vallabhan, C. V. G. (1997). Behaviour of window glass panels during earthquakes.
Engineering Structures 19 (8):685-694.