Embed Size (px)
Citation preview

SPP 2012 Probabilistic Assessment Analysis
July 27, 2012
Michael Odom, SPP [email protected] · 501.688.8205
Jinxiang Zhu, ABB Inc. [email protected] 919.807.8246

• Gather input data
• Model data in GridView
• Run simulation
• Sensitivities
• Compile results into report
• Submit report to NERC
Process Overview
2
• Area Load shapes
• Demand Response
• Thermal / Renewable Generation data
• Wind Generation shapes
• Interface, Contingency, Nomogram data
• Purchases and Sales
• Uncertainty data
• Transmission topology
Data Inputs
3

• The summer period is defined as June 1st – September 1st
• Load shed penalty < Branch overload penalty
• (Generally) 2400 trials per simulation will be ran to get a proper convergence
• Only Existing, Certain and Future, Planned reported generation are used as inputs from the LTRA
• Future, Planned generation as stated in the LTRA is “firm and deliverable”
• Uncertainty based generation outages are randomly selected
• Spinning reserve is 50% of the Operating reserve
Assumptions
4

• Import Load, Wind shapes from .csv
• 25 zones within SPP region for 2012
• Import Bus, Load, Branch data from PSSE
• Update Interface monitoring, Line monitoring, Contingency monitoring, Operating guides, and Regional configuration
• Update Generation in .csv using LTRA and GADS data then import
• Schedule Thermal Generation maintenance
• Model Demand Response & Imports/Exports as flat hourly resources
• Model DC ties as variable hourly resources
• Model probability pattern and 7 value probability distribution
Modeling
5

• Probability distribution is comprised of historical actual load and temperature values
• Temperature values are regressed against load
• User defined load patterns are used to apply a monthly multiplier
• Each modeled area (zone) will have 7 patterns available
Data Uncertainty
6
0.0062
0.0606
0.2417
0.383
0.2417
0.0606
0.0062
0
0.05
0.1
0.15
0.2
0.25
0.3
0.35
0.4
0.45
0.922 0.928 0.951 1.000 1.032 1.053 1.057
Pro
bab
ilit
y
Peak Load Multiplier

• Monte Carlo simulation
– Uncertainty in generator outages, transmission outages, and load modifiers
– Each hour (8760 typical): SCUC, SCED, Indices calculation
– Each hour update Generator/Interface/Load status
– Will commit all units (minus scheduled and random outages)
– Rate C will be used for constraint limits for all branches
– Congestion values per branch calculated
– Hourly Load, Capacity, Congestion values
– LOLE, LOLH, EUE indices calculated
– 2400 trials per simulation
Simulation
7
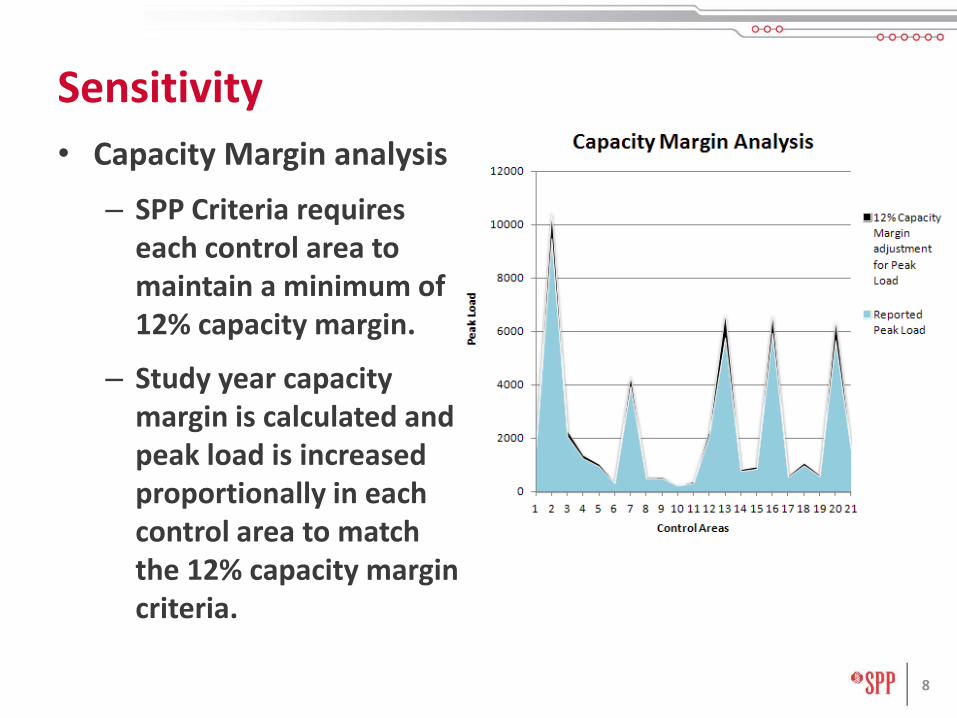
• Capacity Margin analysis
– SPP Criteria requires each control area to maintain a minimum of 12% capacity margin.
– Study year capacity margin is calculated and peak load is increased proportionally in each control area to match the 12% capacity margin criteria.
Sensitivity
8

• Severe event simulation
• Random or scheduled transmission and generation outages
• Can be specific by unit, bus, branch
• Can be clustered and outaged in groups
Sensitivity
9

• Finalized metric results (LOLH, LOLE, EUE, Normalized EUE)
• Adjusted 12% Capacity Margin results for SPP Criteria
• Severe event scenario results (if requested by stakeholders)
• SPP 2011 Probabilistic Assessment Report
Reporting
10

Transportation Model vs. Transmission Model
11
Transfer capability from A to C? - Supply Curve Model - Transportation Model - LMP Model
75
0 75
[100, 0.1]
[10
0, 0
.1]
A
B
C
Low Cost
High Cost
150
40 190
50 MW
A
B
C
Low Cost
High Cost
Limiting line
Unconstrained Constrained
25 MW 1
2 2
1

• Multi-State Transition Rate Model
– Generators
– Interface limits
• Transmission Forced and Schedule Outages
– N-x transmission forced outages
• Unit Deration due to Temperature
• Wind Generation Uncertainty
• Load Uncertainty and Correlation
• Fuel Price Uncertainty and Correlation
Uncertainties in GridView Model
12

GridView Outputs
13

• Benchmark with IEEE RTS systems and commercial software
• Model normal and emergency limits
• Interface limits dependent on some unit status and load
– Central East (Oswego units)
• Reliability Study and Economic Study
– Consistency on the transmission model
– Enforcing intra-zonal and inter-zonal constraints
– Enforcing transmission ratings under normal and contingency conditions
• NY STARS Project Phase II Final Report
http://www.nyiso.com/public/webdocs/services/planning/stars/Phase_2_Final_Report_4_30_2012.pdf
GridView Applications
14

Questions
15
Are there any questions?