Embed Size (px)
Citation preview
Prepared by the Office for Institutional Effectiveness
Spr
ing
2012
C
olle
ge E
mpl
oyee
Sat
isfa
ctio
n S
urve
y (N
oel-
Lev
itz)

[Noel – Levitz Spring 2012 Survey Results | Cascadia Community College page 2]
College Employee Satisfaction Survey 2012
[this page intentionally left blank]
[Noel – Levitz Spring 2012 Survey Results | Cascadia Community College page 3]
College Employee Satisfaction Survey 2012
Table of Contents
Executive summary ........................................................................................................................... 5
Background ....................................................................................................................................... 6
Method .............................................................................................................................................. 7
How to use this report ....................................................................................................................... 7
Results comparison ........................................................................................................................... 9
Respondent profile ............................................................................................................................11
Overall satisfaction ............................................................................................................................11
Institutional goals ..............................................................................................................................12
Involvement in planning and decision-making .................................................................................14
Campus culture and policies .............................................................................................................15
Work environment ............................................................................................................................18
Custom questions ..............................................................................................................................20
Professional development ..................................................................................................................22
[Noel – Levitz Spring 2012 Survey Results | Cascadia Community College page 4]
College Employee Satisfaction Survey 2012
[this page intentionally left blank]
[Noel – Levitz Spring 2012 Survey Results | Cascadia Community College page 5]
College Employee Satisfaction Survey 2012
Executive Summary
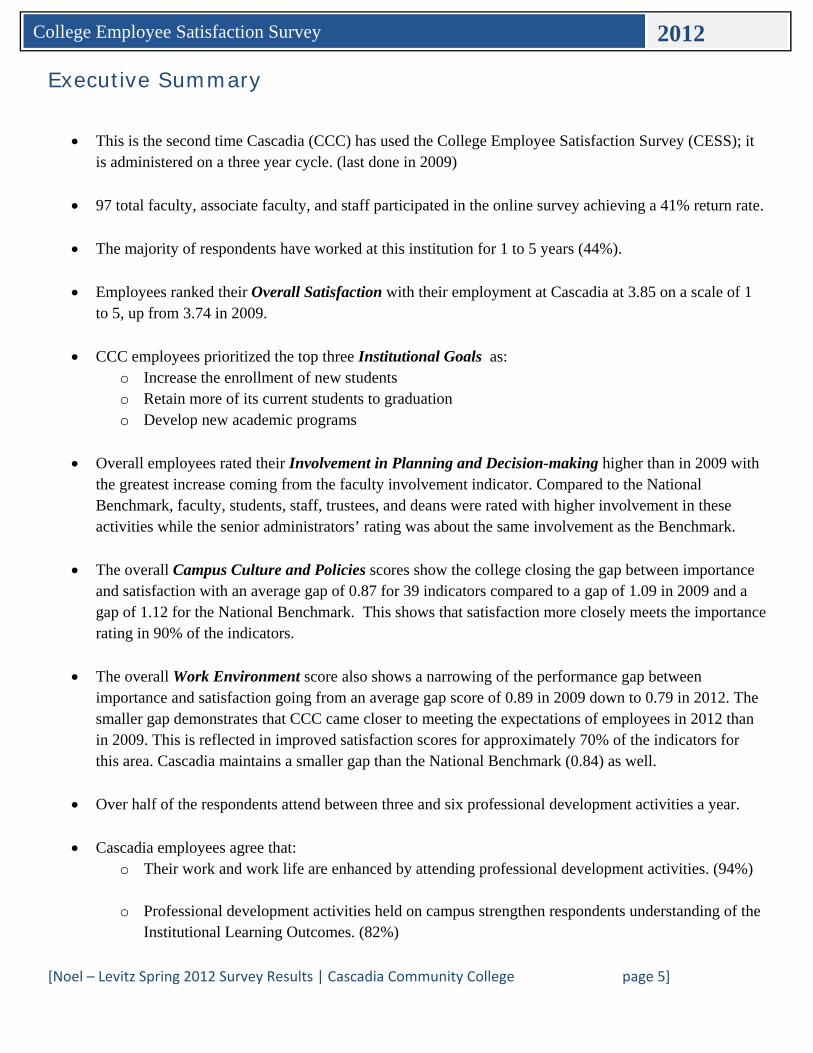
This is the second time Cascadia (CCC) has used the College Employee Satisfaction Survey (CESS); it is administered on a three year cycle. (last done in 2009)
97 total faculty, associate faculty, and staff participated in the online survey achieving a 41% return rate.
The majority of respondents have worked at this institution for 1 to 5 years (44%).
Employees ranked their Overall Satisfaction with their employment at Cascadia at 3.85 on a scale of 1 to 5, up from 3.74 in 2009.
CCC employees prioritized the top three Institutional Goals as: o Increase the enrollment of new students o Retain more of its current students to graduation o Develop new academic programs
Overall employees rated their Involvement in Planning and Decision-making higher than in 2009 with the greatest increase coming from the faculty involvement indicator. Compared to the National Benchmark, faculty, students, staff, trustees, and deans were rated with higher involvement in these activities while the senior administrators’ rating was about the same involvement as the Benchmark.
The overall Campus Culture and Policies scores show the college closing the gap between importance and satisfaction with an average gap of 0.87 for 39 indicators compared to a gap of 1.09 in 2009 and a gap of 1.12 for the National Benchmark. This shows that satisfaction more closely meets the importance rating in 90% of the indicators.
The overall Work Environment score also shows a narrowing of the performance gap between importance and satisfaction going from an average gap score of 0.89 in 2009 down to 0.79 in 2012. The smaller gap demonstrates that CCC came closer to meeting the expectations of employees in 2012 than in 2009. This is reflected in improved satisfaction scores for approximately 70% of the indicators for this area. Cascadia maintains a smaller gap than the National Benchmark (0.84) as well.
Over half of the respondents attend between three and six professional development activities a year.
Cascadia employees agree that: o Their work and work life are enhanced by attending professional development activities. (94%)
o Professional development activities held on campus strengthen respondents understanding of the
Institutional Learning Outcomes. (82%)
[Noel – Levitz Spring 2012 Survey Results | Cascadia Community College page 6]
College Employee Satisfaction Survey 2012
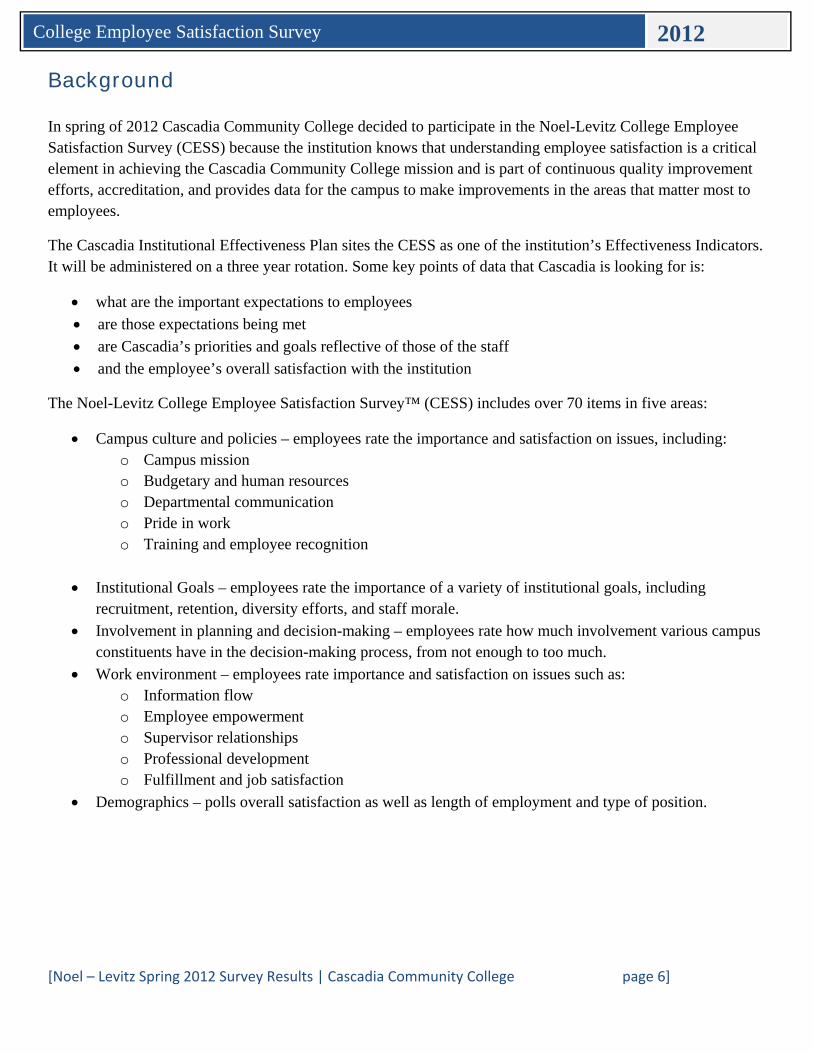
Background In spring of 2012 Cascadia Community College decided to participate in the Noel-Levitz College Employee Satisfaction Survey (CESS) because the institution knows that understanding employee satisfaction is a critical element in achieving the Cascadia Community College mission and is part of continuous quality improvement efforts, accreditation, and provides data for the campus to make improvements in the areas that matter most to employees.
The Cascadia Institutional Effectiveness Plan sites the CESS as one of the institution’s Effectiveness Indicators. It will be administered on a three year rotation. Some key points of data that Cascadia is looking for is:
what are the important expectations to employees
are those expectations being met
are Cascadia’s priorities and goals reflective of those of the staff
and the employee’s overall satisfaction with the institution
The Noel-Levitz College Employee Satisfaction Survey™ (CESS) includes over 70 items in five areas:
Campus culture and policies – employees rate the importance and satisfaction on issues, including: o Campus mission o Budgetary and human resources o Departmental communication o Pride in work o Training and employee recognition
Institutional Goals – employees rate the importance of a variety of institutional goals, including recruitment, retention, diversity efforts, and staff morale.
Involvement in planning and decision-making – employees rate how much involvement various campus constituents have in the decision-making process, from not enough to too much.
Work environment – employees rate importance and satisfaction on issues such as: o Information flow o Employee empowerment o Supervisor relationships o Professional development o Fulfillment and job satisfaction
Demographics – polls overall satisfaction as well as length of employment and type of position.
[Noel – Levitz Spring 2012 Survey Results | Cascadia Community College page 7]
College Employee Satisfaction Survey 2012
Method The CESS was completed by 97 employees in the spring quarter of 2012. It was an online survey administered through Noel-Levitz.
In the CESS the employees respond to each question twice, first by indicating how important it is that the expectation be met and then again to indicate how satisfied they are that the expectation is being met.
The responses are based on a scale of 1 to 5 with 5 being the very satisfied/important. A Performance Gap is identified which shows the indicated importance minus the indicated satisfaction. The smaller the gap the better the employees’ expectations are being met; there is more room for improvement in meeting expectations where the gap is larger.
How to use this report This report has been prepared with the intention of providing multiple viewing levels of the data. The Executive Summary provides a brief look at general results. The Results Comparison section provides an area-by-area comparison between this year’s results, the 2009 results, and the National Benchmark results. Tables containing actual raw data details are available in Appendix A Tables.
Please contact the office for Institutional Effectiveness to request individual meetings or presentations on the data from this report or with any questions.
Requests can also be made for direction and assistance in conducting follow-up employee focus groups to gain more information on items addressed in the survey. Comments or questions regarding this report may be directed to:
Susi Hamilton Director for Institutional Effectiveness Cascadia Community College 18345 Campus Way NE Bothell, WA 98011 425.352.8583

[Noel – Levitz Spring 2012 Survey Results | Cascadia Community College page 8]
College Employee Satisfaction Survey 2012
[this page intentionally left blank]
[Noel – Levitz Spring 2012 Survey Results | Cascadia Community College page 9]
College Employee Satisfaction Survey 2012
Results Comparison
Respondent Profile
Overall Satisfaction
Institutional Goals
Involvement in Planning and Decision-making
Campus Culture and Policies
Work Environment
Custom Questions
Professional Development Activities
[Noel – Levitz Spring 2012 Survey Results | Cascadia Community College page 10]
College Employee Satisfaction Survey 2012
[this page intentionally left blank]
[Noel – Levitz Spring 2012 Survey Results | Cascadia Community College page 11]
College Employee Satisfaction Survey 2012
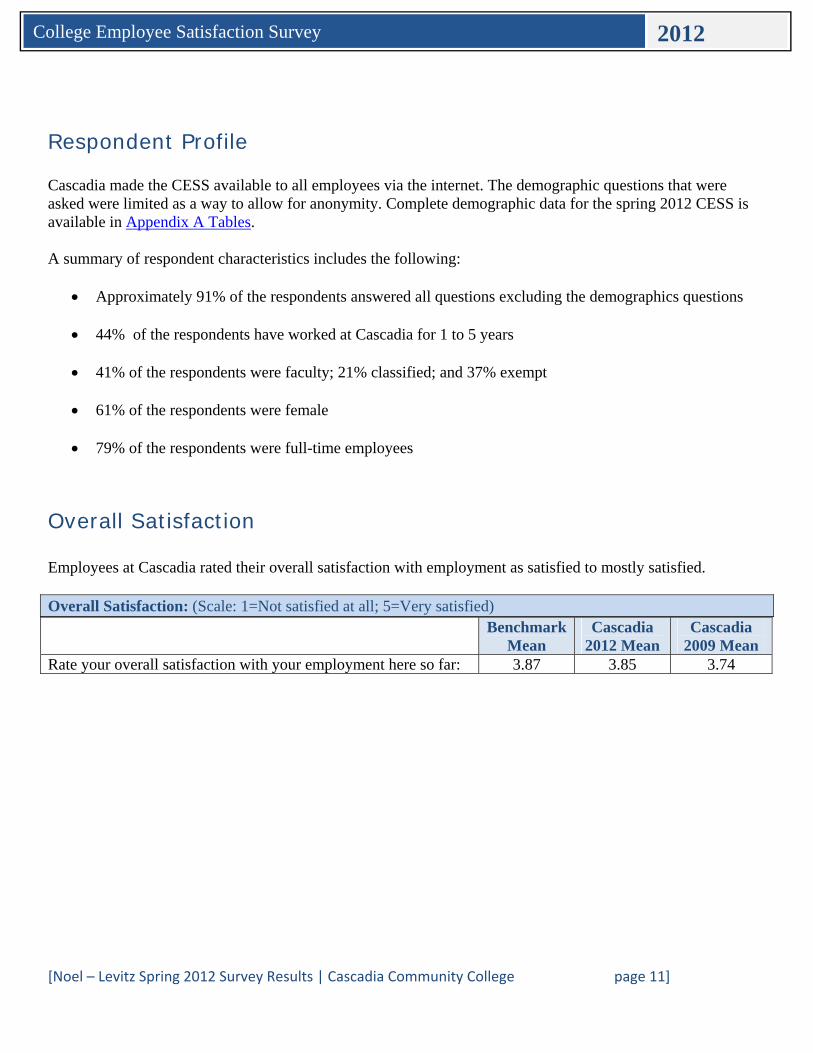
Respondent Profile Cascadia made the CESS available to all employees via the internet. The demographic questions that were asked were limited as a way to allow for anonymity. Complete demographic data for the spring 2012 CESS is available in Appendix A Tables. A summary of respondent characteristics includes the following:
Approximately 91% of the respondents answered all questions excluding the demographics questions
44% of the respondents have worked at Cascadia for 1 to 5 years
41% of the respondents were faculty; 21% classified; and 37% exempt
61% of the respondents were female
79% of the respondents were full-time employees
Overall Satisfaction Employees at Cascadia rated their overall satisfaction with employment as satisfied to mostly satisfied. Overall Satisfaction: (Scale: 1=Not satisfied at all; 5=Very satisfied) Benchmark
Mean Cascadia
2012 Mean Cascadia
2009 Mean Rate your overall satisfaction with your employment here so far: 3.87 3.85 3.74
[Noel – Levitz Spring 2012 Survey Results | Cascadia Community College page 12]
College Employee Satisfaction Survey 2012
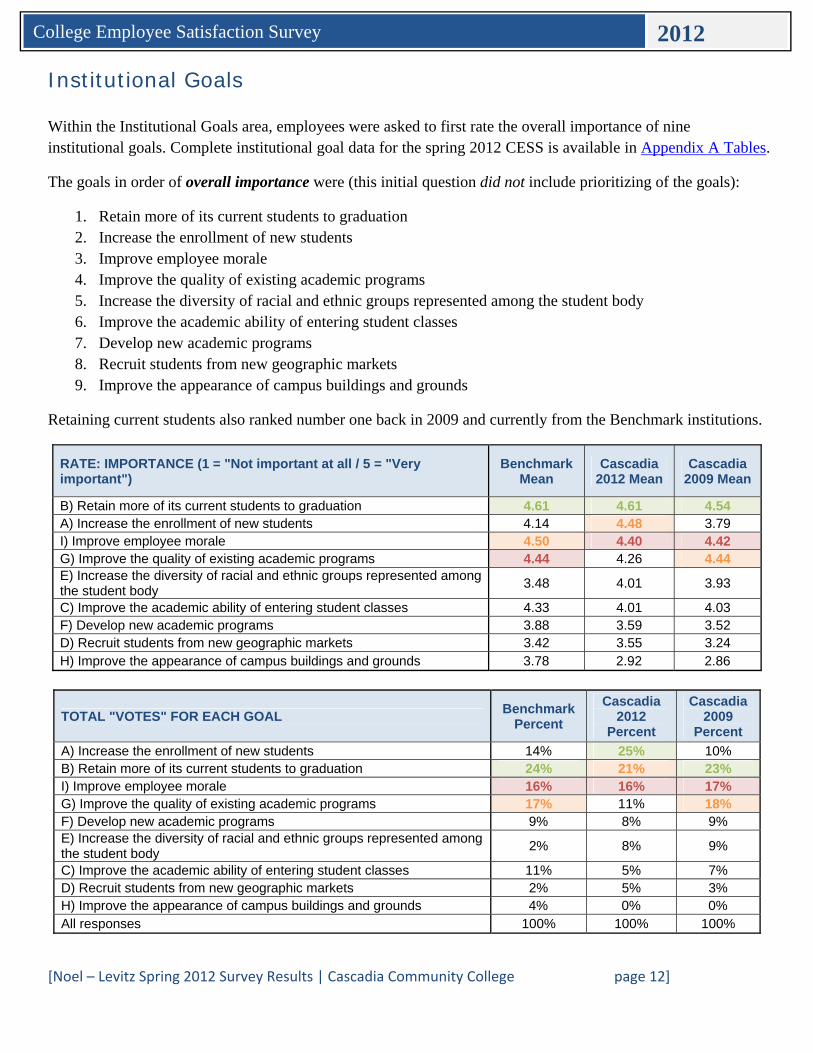
Institutional Goals Within the Institutional Goals area, employees were asked to first rate the overall importance of nine institutional goals. Complete institutional goal data for the spring 2012 CESS is available in Appendix A Tables.
The goals in order of overall importance were (this initial question did not include prioritizing of the goals):
1. Retain more of its current students to graduation 2. Increase the enrollment of new students 3. Improve employee morale 4. Improve the quality of existing academic programs 5. Increase the diversity of racial and ethnic groups represented among the student body 6. Improve the academic ability of entering student classes 7. Develop new academic programs 8. Recruit students from new geographic markets 9. Improve the appearance of campus buildings and grounds
Retaining current students also ranked number one back in 2009 and currently from the Benchmark institutions.
RATE: IMPORTANCE (1 = "Not important at all / 5 = "Very important")
Benchmark Mean
Cascadia 2012 Mean
Cascadia 2009 Mean
B) Retain more of its current students to graduation 4.61 4.61 4.54 A) Increase the enrollment of new students 4.14 4.48 3.79 I) Improve employee morale 4.50 4.40 4.42 G) Improve the quality of existing academic programs 4.44 4.26 4.44 E) Increase the diversity of racial and ethnic groups represented among the student body
3.48 4.01 3.93
C) Improve the academic ability of entering student classes 4.33 4.01 4.03 F) Develop new academic programs 3.88 3.59 3.52 D) Recruit students from new geographic markets 3.42 3.55 3.24 H) Improve the appearance of campus buildings and grounds 3.78 2.92 2.86
TOTAL "VOTES" FOR EACH GOAL Benchmark
Percent
Cascadia 2012
Percent
Cascadia 2009
Percent
A) Increase the enrollment of new students 14% 25% 10% B) Retain more of its current students to graduation 24% 21% 23% I) Improve employee morale 16% 16% 17% G) Improve the quality of existing academic programs 17% 11% 18% F) Develop new academic programs 9% 8% 9% E) Increase the diversity of racial and ethnic groups represented among the student body
2% 8% 9%
C) Improve the academic ability of entering student classes 11% 5% 7% D) Recruit students from new geographic markets 2% 5% 3% H) Improve the appearance of campus buildings and grounds 4% 0% 0% All responses 100% 100% 100%
[Noel – Levitz Spring 2012 Survey Results | Cascadia Community College page 13]
College Employee Satisfaction Survey 2012
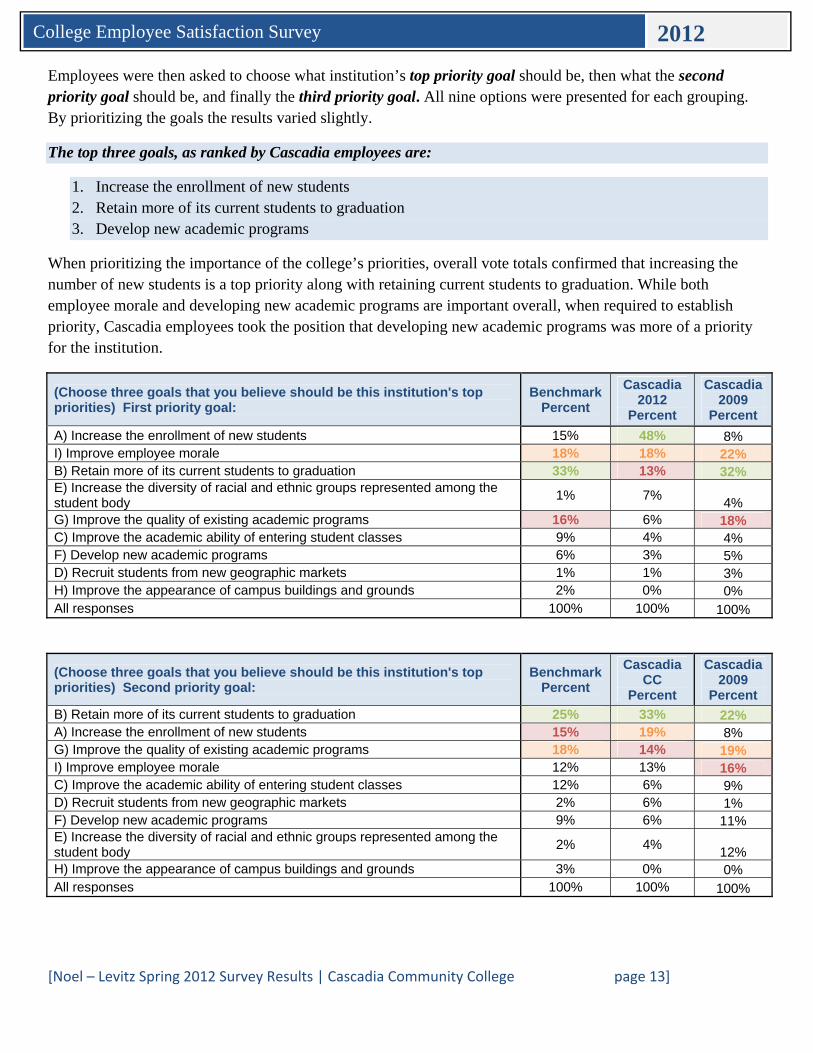
Employees were then asked to choose what institution’s top priority goal should be, then what the second priority goal should be, and finally the third priority goal. All nine options were presented for each grouping. By prioritizing the goals the results varied slightly.
The top three goals, as ranked by Cascadia employees are:
1. Increase the enrollment of new students 2. Retain more of its current students to graduation 3. Develop new academic programs
When prioritizing the importance of the college’s priorities, overall vote totals confirmed that increasing the number of new students is a top priority along with retaining current students to graduation. While both employee morale and developing new academic programs are important overall, when required to establish priority, Cascadia employees took the position that developing new academic programs was more of a priority for the institution.
(Choose three goals that you believe should be this institution's top priorities) First priority goal:
Benchmark Percent
Cascadia 2012
Percent
Cascadia 2009
Percent
A) Increase the enrollment of new students 15% 48% 8% I) Improve employee morale 18% 18% 22% B) Retain more of its current students to graduation 33% 13% 32% E) Increase the diversity of racial and ethnic groups represented among the student body
1% 7% 4%
G) Improve the quality of existing academic programs 16% 6% 18% C) Improve the academic ability of entering student classes 9% 4% 4% F) Develop new academic programs 6% 3% 5% D) Recruit students from new geographic markets 1% 1% 3% H) Improve the appearance of campus buildings and grounds 2% 0% 0% All responses 100% 100% 100%
(Choose three goals that you believe should be this institution's top priorities) Second priority goal:
Benchmark Percent
Cascadia CC
Percent
Cascadia 2009
Percent
B) Retain more of its current students to graduation 25% 33% 22% A) Increase the enrollment of new students 15% 19% 8% G) Improve the quality of existing academic programs 18% 14% 19% I) Improve employee morale 12% 13% 16% C) Improve the academic ability of entering student classes 12% 6% 9% D) Recruit students from new geographic markets 2% 6% 1% F) Develop new academic programs 9% 6% 11% E) Increase the diversity of racial and ethnic groups represented among the student body
2% 4% 12%
H) Improve the appearance of campus buildings and grounds 3% 0% 0% All responses 100% 100% 100%
[Noel – Levitz Spring 2012 Survey Results | Cascadia Community College page 14]
College Employee Satisfaction Survey 2012
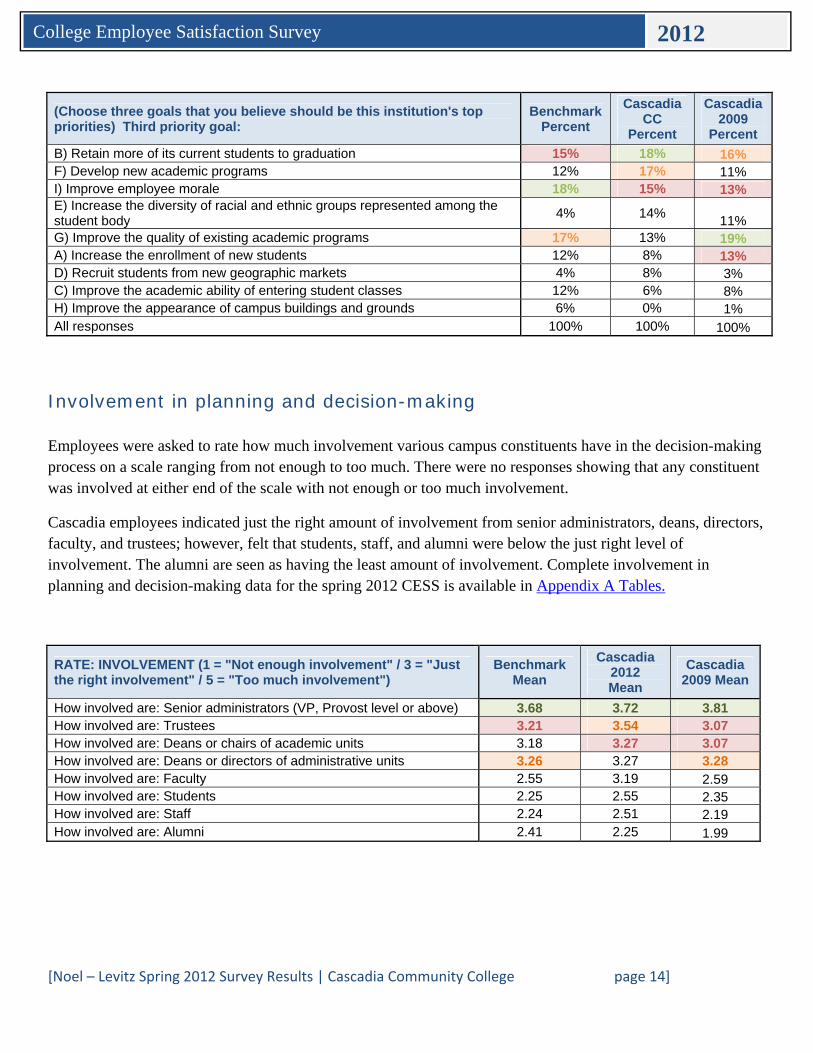
(Choose three goals that you believe should be this institution's top priorities) Third priority goal:
Benchmark Percent
Cascadia CC
Percent
Cascadia 2009
Percent
B) Retain more of its current students to graduation 15% 18% 16% F) Develop new academic programs 12% 17% 11% I) Improve employee morale 18% 15% 13% E) Increase the diversity of racial and ethnic groups represented among the student body
4% 14% 11%
G) Improve the quality of existing academic programs 17% 13% 19% A) Increase the enrollment of new students 12% 8% 13% D) Recruit students from new geographic markets 4% 8% 3% C) Improve the academic ability of entering student classes 12% 6% 8% H) Improve the appearance of campus buildings and grounds 6% 0% 1% All responses 100% 100% 100%
Involvement in planning and decision-making Employees were asked to rate how much involvement various campus constituents have in the decision-making process on a scale ranging from not enough to too much. There were no responses showing that any constituent was involved at either end of the scale with not enough or too much involvement.
Cascadia employees indicated just the right amount of involvement from senior administrators, deans, directors, faculty, and trustees; however, felt that students, staff, and alumni were below the just right level of involvement. The alumni are seen as having the least amount of involvement. Complete involvement in planning and decision-making data for the spring 2012 CESS is available in Appendix A Tables.
RATE: INVOLVEMENT (1 = "Not enough involvement" / 3 = "Just the right involvement" / 5 = "Too much involvement")
Benchmark Mean
Cascadia 2012 Mean
Cascadia 2009 Mean
How involved are: Senior administrators (VP, Provost level or above) 3.68 3.72 3.81 How involved are: Trustees 3.21 3.54 3.07 How involved are: Deans or chairs of academic units 3.18 3.27 3.07 How involved are: Deans or directors of administrative units 3.26 3.27 3.28 How involved are: Faculty 2.55 3.19 2.59 How involved are: Students 2.25 2.55 2.35 How involved are: Staff 2.24 2.51 2.19 How involved are: Alumni 2.41 2.25 1.99
[Noel – Levitz Spring 2012 Survey Results | Cascadia Community College page 15]
College Employee Satisfaction Survey 2012
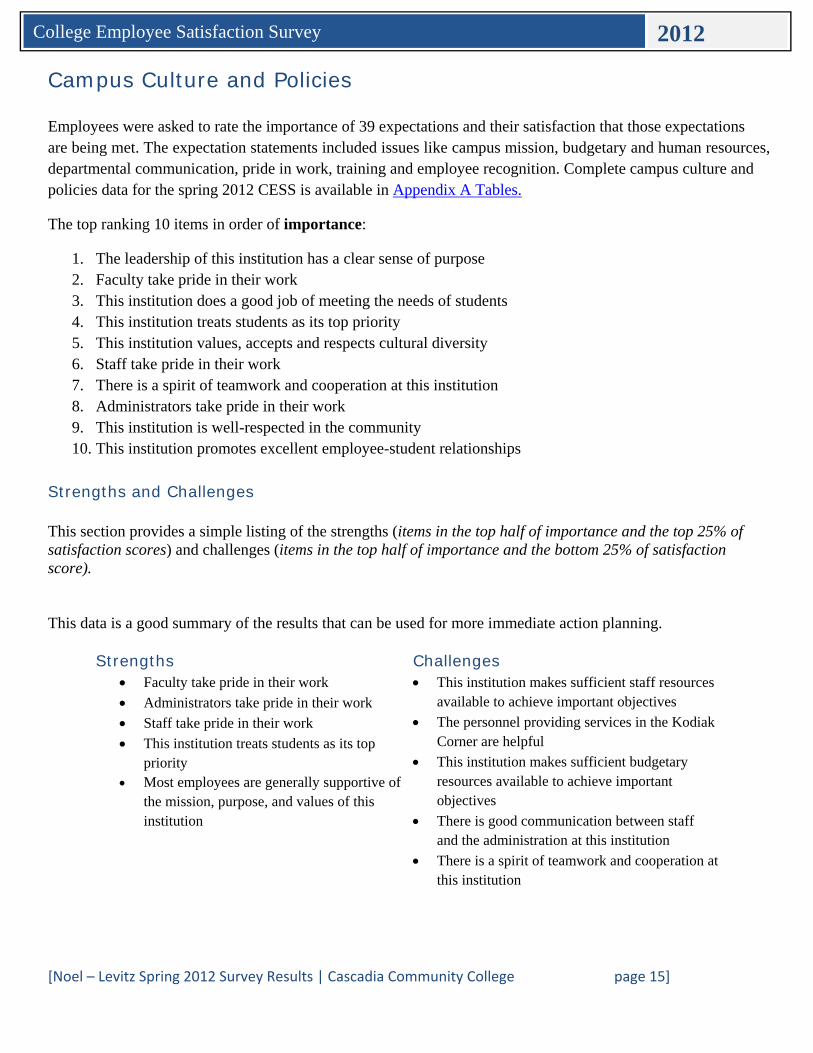
Campus Culture and Policies Employees were asked to rate the importance of 39 expectations and their satisfaction that those expectations are being met. The expectation statements included issues like campus mission, budgetary and human resources, departmental communication, pride in work, training and employee recognition. Complete campus culture and policies data for the spring 2012 CESS is available in Appendix A Tables.
The top ranking 10 items in order of importance:
1. The leadership of this institution has a clear sense of purpose 2. Faculty take pride in their work 3. This institution does a good job of meeting the needs of students 4. This institution treats students as its top priority 5. This institution values, accepts and respects cultural diversity 6. Staff take pride in their work 7. There is a spirit of teamwork and cooperation at this institution 8. Administrators take pride in their work 9. This institution is well-respected in the community 10. This institution promotes excellent employee-student relationships
Strengths and Challenges This section provides a simple listing of the strengths (items in the top half of importance and the top 25% of satisfaction scores) and challenges (items in the top half of importance and the bottom 25% of satisfaction score). This data is a good summary of the results that can be used for more immediate action planning.
Strengths Faculty take pride in their work
Administrators take pride in their work
Staff take pride in their work
This institution treats students as its top priority
Most employees are generally supportive of the mission, purpose, and values of this institution
Challenges
This institution makes sufficient staff resources available to achieve important objectives
The personnel providing services in the Kodiak Corner are helpful
This institution makes sufficient budgetary resources available to achieve important objectives
There is good communication between staff and the administration at this institution
There is a spirit of teamwork and cooperation at this institution
[Noel – Levitz Spring 2012 Survey Results | Cascadia Community College page 16]
College Employee Satisfaction Survey 2012
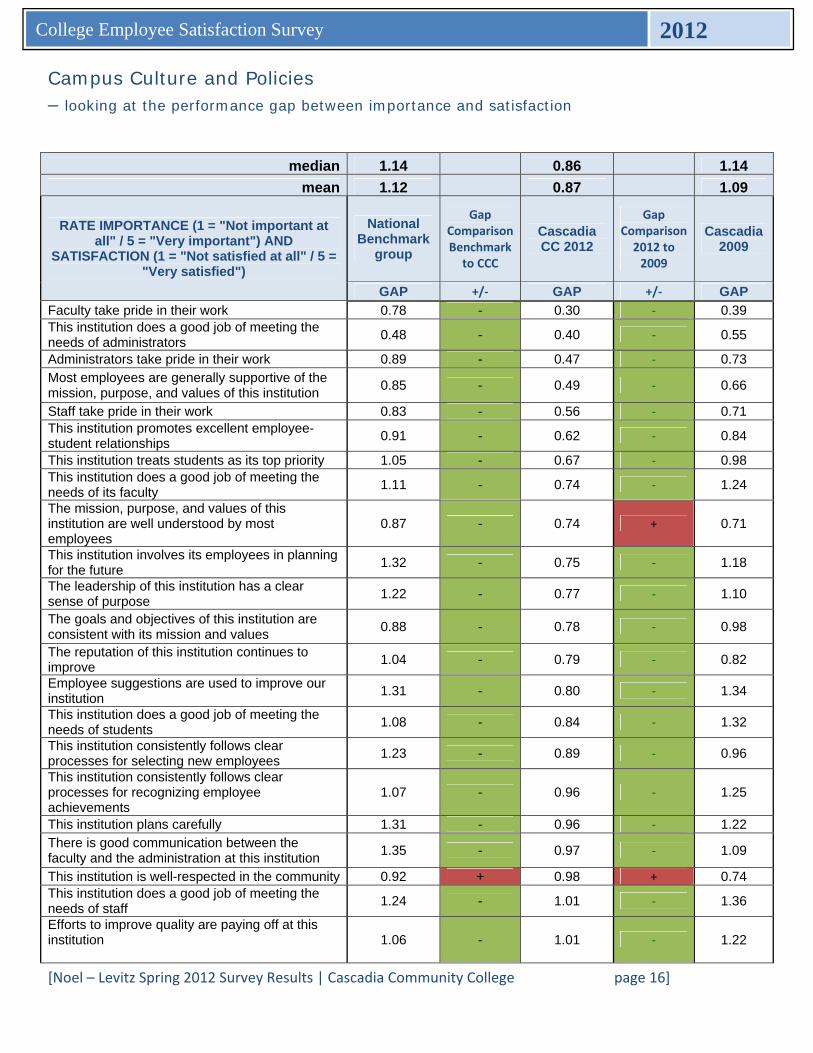
Campus Culture and Policies – looking at the performance gap between importance and satisfaction
median 1.14 0.86 1.14
mean 1.12 0.87 1.09
RATE IMPORTANCE (1 = "Not important at all" / 5 = "Very important") AND
SATISFACTION (1 = "Not satisfied at all" / 5 = "Very satisfied")
National Benchmark
group
Gap Comparison Benchmark to CCC
Cascadia CC 2012
Gap Comparison 2012 to 2009
Cascadia 2009
GAP +/‐ GAP +/‐ GAP
Faculty take pride in their work 0.78 - 0.30 ‐ 0.39 This institution does a good job of meeting the needs of administrators
0.48 - 0.40 ‐ 0.55
Administrators take pride in their work 0.89 - 0.47 ‐ 0.73 Most employees are generally supportive of the mission, purpose, and values of this institution
0.85 - 0.49 ‐ 0.66
Staff take pride in their work 0.83 - 0.56 ‐ 0.71 This institution promotes excellent employee-student relationships
0.91 - 0.62 ‐ 0.84
This institution treats students as its top priority 1.05 - 0.67 ‐ 0.98 This institution does a good job of meeting the needs of its faculty
1.11 - 0.74 ‐ 1.24
The mission, purpose, and values of this institution are well understood by most employees
0.87 - 0.74 + 0.71
This institution involves its employees in planning for the future
1.32 - 0.75 ‐ 1.18
The leadership of this institution has a clear sense of purpose
1.22 - 0.77 ‐ 1.10
The goals and objectives of this institution are consistent with its mission and values
0.88 - 0.78 ‐ 0.98
The reputation of this institution continues to improve
1.04 - 0.79 ‐ 0.82
Employee suggestions are used to improve our institution
1.31 - 0.80 ‐ 1.34
This institution does a good job of meeting the needs of students
1.08 - 0.84 ‐ 1.32
This institution consistently follows clear processes for selecting new employees
1.23 - 0.89 ‐ 0.96
This institution consistently follows clear processes for recognizing employee achievements
1.07 - 0.96 ‐ 1.25
This institution plans carefully 1.31 - 0.96 ‐ 1.22 There is good communication between the faculty and the administration at this institution
1.35 - 0.97 ‐ 1.09
This institution is well-respected in the community 0.92 + 0.98 + 0.74 This institution does a good job of meeting the needs of staff
1.24 - 1.01 ‐ 1.36
Efforts to improve quality are paying off at this institution
1.06 - 1.01 ‐ 1.22
[Noel – Levitz Spring 2012 Survey Results | Cascadia Community College page 17]
College Employee Satisfaction Survey 2012
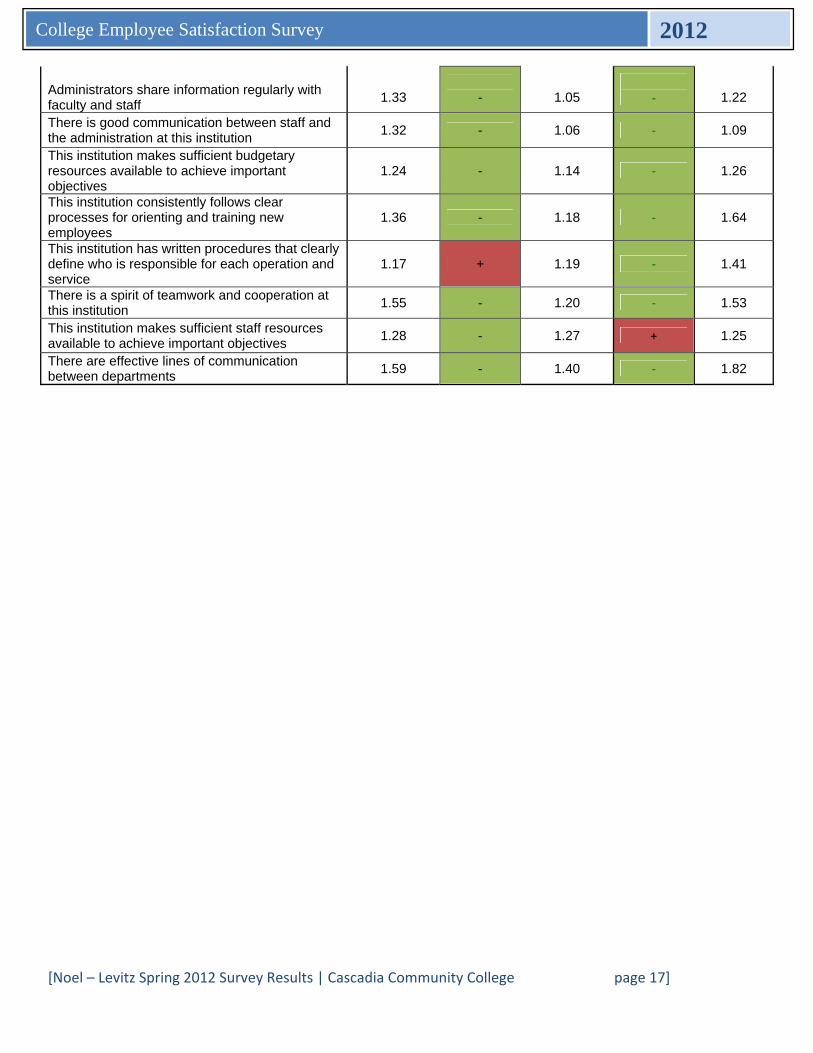
Administrators share information regularly with faculty and staff
1.33
-
1.05
‐
1.22
There is good communication between staff and the administration at this institution
1.32 - 1.06 ‐ 1.09
This institution makes sufficient budgetary resources available to achieve important objectives
1.24 - 1.14 ‐ 1.26
This institution consistently follows clear processes for orienting and training new employees
1.36 - 1.18 ‐ 1.64
This institution has written procedures that clearly define who is responsible for each operation and service
1.17 + 1.19 ‐ 1.41
There is a spirit of teamwork and cooperation at this institution
1.55 - 1.20 ‐ 1.53
This institution makes sufficient staff resources available to achieve important objectives
1.28 - 1.27 + 1.25
There are effective lines of communication between departments
1.59 - 1.40 ‐ 1.82
[Noel – Levitz Spring 2012 Survey Results | Cascadia Community College page 18]
College Employee Satisfaction Survey 2012
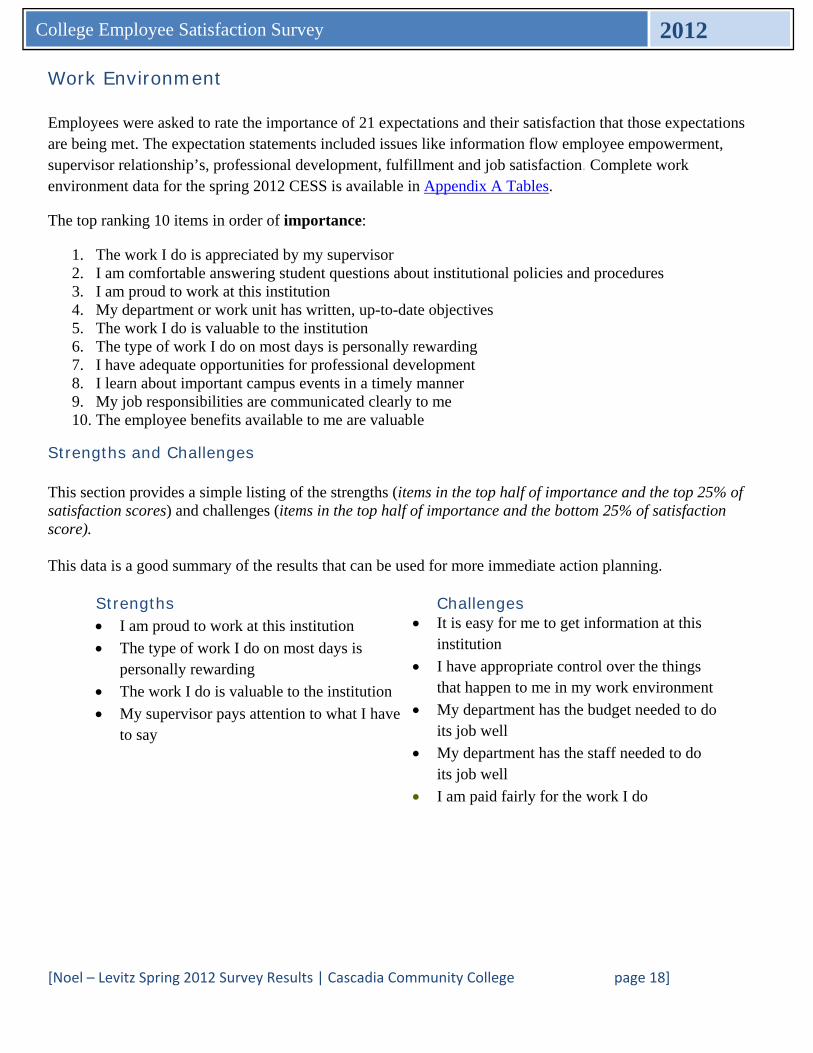
Work Environment Employees were asked to rate the importance of 21 expectations and their satisfaction that those expectations are being met. The expectation statements included issues like information flow employee empowerment, supervisor relationship’s, professional development, fulfillment and job satisfaction. Complete work environment data for the spring 2012 CESS is available in Appendix A Tables.
The top ranking 10 items in order of importance:
1. The work I do is appreciated by my supervisor 2. I am comfortable answering student questions about institutional policies and procedures 3. I am proud to work at this institution 4. My department or work unit has written, up-to-date objectives 5. The work I do is valuable to the institution 6. The type of work I do on most days is personally rewarding 7. I have adequate opportunities for professional development 8. I learn about important campus events in a timely manner 9. My job responsibilities are communicated clearly to me 10. The employee benefits available to me are valuable
Strengths and Challenges This section provides a simple listing of the strengths (items in the top half of importance and the top 25% of satisfaction scores) and challenges (items in the top half of importance and the bottom 25% of satisfaction score). This data is a good summary of the results that can be used for more immediate action planning.
Strengths I am proud to work at this institution
The type of work I do on most days is personally rewarding
The work I do is valuable to the institution
My supervisor pays attention to what I have to say
Challenges It is easy for me to get information at this
institution
I have appropriate control over the things that happen to me in my work environment
My department has the budget needed to do its job well
My department has the staff needed to do its job well
I am paid fairly for the work I do
[Noel – Levitz Spring 2012 Survey Results | Cascadia Community College page 19]
College Employee Satisfaction Survey 2012
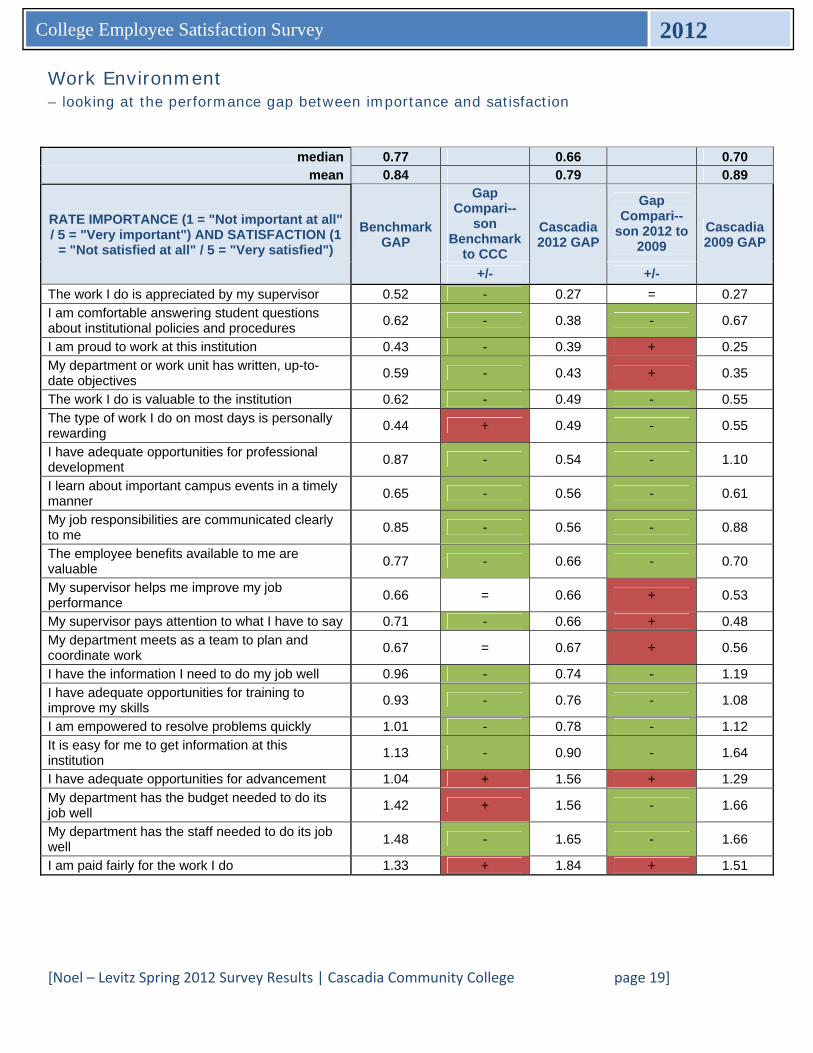
Work Environment – looking at the performance gap between importance and satisfaction
median 0.77 0.66 0.70 mean 0.84 0.79 0.89
RATE IMPORTANCE (1 = "Not important at all" / 5 = "Very important") AND SATISFACTION (1
= "Not satisfied at all" / 5 = "Very satisfied")
Benchmark GAP
Gap Compari--
son Benchmark
to CCC
Cascadia 2012 GAP
Gap Compari--
son 2012 to 2009
Cascadia 2009 GAP
+/- +/-
The work I do is appreciated by my supervisor 0.52 - 0.27 = 0.27
I am comfortable answering student questions about institutional policies and procedures
0.62 - 0.38 - 0.67
I am proud to work at this institution 0.43 - 0.39 + 0.25
My department or work unit has written, up-to-date objectives
0.59 - 0.43 + 0.35
The work I do is valuable to the institution 0.62 - 0.49 - 0.55
The type of work I do on most days is personally rewarding
0.44 + 0.49 - 0.55
I have adequate opportunities for professional development
0.87 - 0.54 - 1.10
I learn about important campus events in a timely manner
0.65 - 0.56 - 0.61
My job responsibilities are communicated clearly to me
0.85 - 0.56 - 0.88
The employee benefits available to me are valuable
0.77 - 0.66 - 0.70
My supervisor helps me improve my job performance
0.66 = 0.66 + 0.53
My supervisor pays attention to what I have to say 0.71 - 0.66 + 0.48
My department meets as a team to plan and coordinate work
0.67 = 0.67 + 0.56
I have the information I need to do my job well 0.96 - 0.74 - 1.19
I have adequate opportunities for training to improve my skills
0.93 - 0.76 - 1.08
I am empowered to resolve problems quickly 1.01 - 0.78 - 1.12
It is easy for me to get information at this institution
1.13 - 0.90 - 1.64
I have adequate opportunities for advancement 1.04 + 1.56 + 1.29
My department has the budget needed to do its job well
1.42 + 1.56 - 1.66
My department has the staff needed to do its job well
1.48 - 1.65 - 1.66
I am paid fairly for the work I do 1.33 + 1.84 + 1.51
[Noel – Levitz Spring 2012 Survey Results | Cascadia Community College page 20]
College Employee Satisfaction Survey 2012
Custom Questions
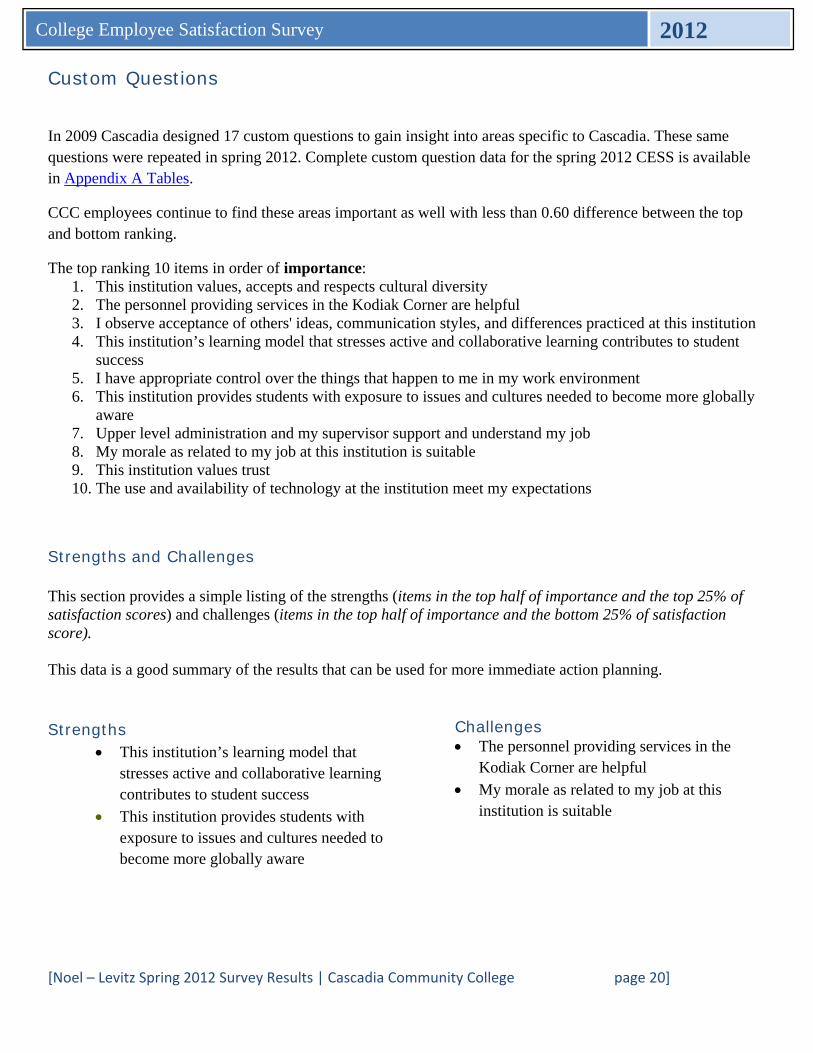
In 2009 Cascadia designed 17 custom questions to gain insight into areas specific to Cascadia. These same questions were repeated in spring 2012. Complete custom question data for the spring 2012 CESS is available in Appendix A Tables.
CCC employees continue to find these areas important as well with less than 0.60 difference between the top and bottom ranking.
The top ranking 10 items in order of importance: 1. This institution values, accepts and respects cultural diversity 2. The personnel providing services in the Kodiak Corner are helpful 3. I observe acceptance of others' ideas, communication styles, and differences practiced at this institution 4. This institution’s learning model that stresses active and collaborative learning contributes to student
success 5. I have appropriate control over the things that happen to me in my work environment 6. This institution provides students with exposure to issues and cultures needed to become more globally
aware 7. Upper level administration and my supervisor support and understand my job 8. My morale as related to my job at this institution is suitable 9. This institution values trust 10. The use and availability of technology at the institution meet my expectations
Strengths and Challenges This section provides a simple listing of the strengths (items in the top half of importance and the top 25% of satisfaction scores) and challenges (items in the top half of importance and the bottom 25% of satisfaction score). This data is a good summary of the results that can be used for more immediate action planning. Strengths
This institution’s learning model that stresses active and collaborative learning contributes to student success
This institution provides students with exposure to issues and cultures needed to become more globally aware
Challenges The personnel providing services in the
Kodiak Corner are helpful
My morale as related to my job at this institution is suitable
[Noel – Levitz Spring 2012 Survey Results | Cascadia Community College page 21]
College Employee Satisfaction Survey 2012
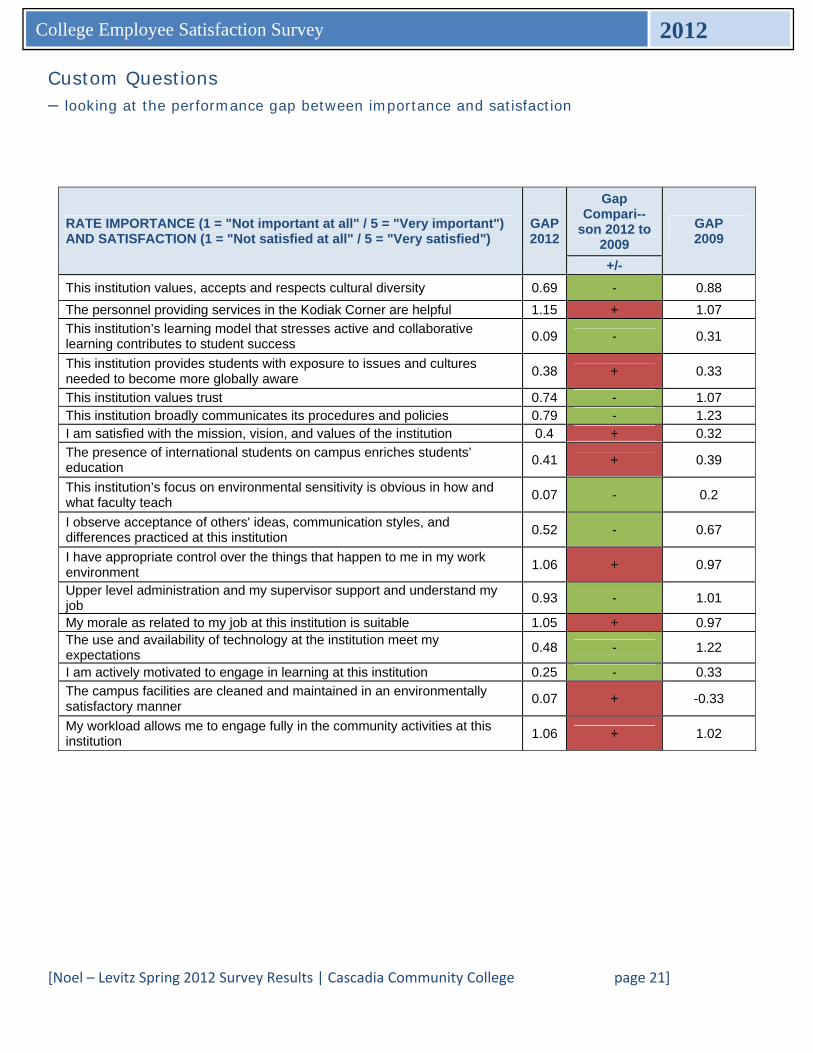
Custom Questions – looking at the performance gap between importance and satisfaction
RATE IMPORTANCE (1 = "Not important at all" / 5 = "Very important") AND SATISFACTION (1 = "Not satisfied at all" / 5 = "Very satisfied")
GAP 2012
Gap Compari--
son 2012 to 2009
GAP 2009
+/-
This institution values, accepts and respects cultural diversity 0.69 - 0.88
The personnel providing services in the Kodiak Corner are helpful 1.15 + 1.07
This institution’s learning model that stresses active and collaborative learning contributes to student success
0.09 - 0.31
This institution provides students with exposure to issues and cultures needed to become more globally aware
0.38 + 0.33
This institution values trust 0.74 - 1.07 This institution broadly communicates its procedures and policies 0.79 - 1.23 I am satisfied with the mission, vision, and values of the institution 0.4 + 0.32
The presence of international students on campus enriches students’ education
0.41 + 0.39
This institution’s focus on environmental sensitivity is obvious in how and what faculty teach
0.07 - 0.2
I observe acceptance of others' ideas, communication styles, and differences practiced at this institution
0.52 - 0.67
I have appropriate control over the things that happen to me in my work environment
1.06 + 0.97
Upper level administration and my supervisor support and understand my job
0.93 - 1.01
My morale as related to my job at this institution is suitable 1.05 + 0.97 The use and availability of technology at the institution meet my expectations
0.48 - 1.22
I am actively motivated to engage in learning at this institution 0.25 - 0.33
The campus facilities are cleaned and maintained in an environmentally satisfactory manner
0.07 + -0.33
My workload allows me to engage fully in the community activities at this institution
1.06 + 1.02
[Noel – Levitz Spring 2012 Survey Results | Cascadia Community College page 22]
College Employee Satisfaction Survey 2012
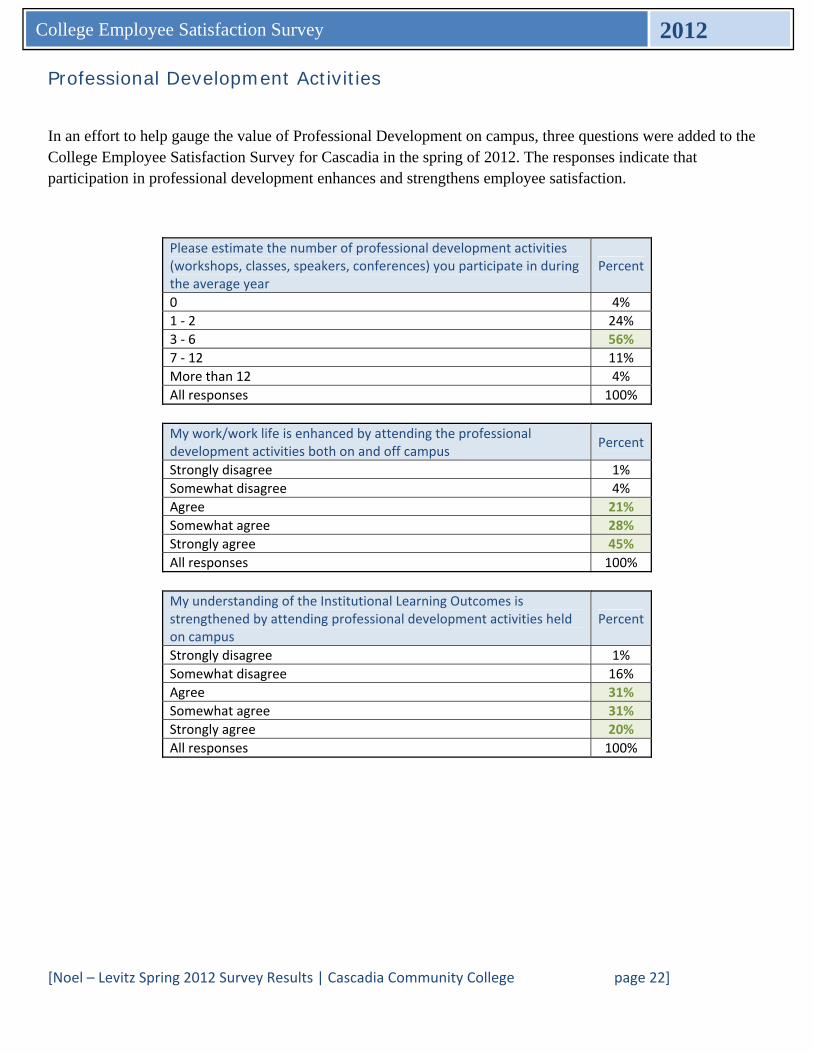
Professional Development Activities
In an effort to help gauge the value of Professional Development on campus, three questions were added to the College Employee Satisfaction Survey for Cascadia in the spring of 2012. The responses indicate that participation in professional development enhances and strengthens employee satisfaction.
Please estimate the number of professional development activities (workshops, classes, speakers, conferences) you participate in during the average year
Percent
0 4%
1 ‐ 2 24%
3 ‐ 6 56%
7 ‐ 12 11%
More than 12 4%
All responses 100%
My work/work life is enhanced by attending the professional development activities both on and off campus
Percent
Strongly disagree 1%
Somewhat disagree 4%
Agree 21%
Somewhat agree 28%
Strongly agree 45%
All responses 100%
My understanding of the Institutional Learning Outcomes is strengthened by attending professional development activities held on campus
Percent
Strongly disagree 1%
Somewhat disagree 16%
Agree 31%
Somewhat agree 31%
Strongly agree 20%
All responses 100%