Embed Size (px)
Citation preview
57
3Crime Waves by the Numbers
T his chapter is concerned with the statistical meaning of crime waves. Ofcourse, one of the major ways in which we “know” a crime wave is under
way is when crime statistics tell us so. Crime statistics, like many forms of social(and other) statistics, appear to us as objective facts. We contrast them in ourminds with opinions or beliefs. Statistics, after all, are rich in scientific mean-ing (Pfuhl & Henry, 1993).
Most of us, however, have an uneasy relationship with social statistics. Whilewe recognize numbers as facts, we also seem quite willing to dismiss statistics outof hand. “Figures don’t lie,” we sometimes say. But we also like to recall Britishstatesman Benjamin Disraeli’s observation that there are “lies, damned lies, andstatistics.” How this ambivalence is expressed with respect to crime statistics is animportant issue and part of what concerns us in this chapter.
Our discussion of crime statistics parallels themes that are explored inother chapters. The most important of these themes concerns the issue ofsocial constructionism. In contrast to the view that emphasizes statistics asobjective reflections of the empirical world, we need to appreciate crime statis-tics as social constructions. Like other cultural products, they are outcomes ofsocial processes. What do we count? Who counts? When do we count? How dowe count? None of these questions has a preordained answer. Instead, ouranswers reflect social decisions. This is crucial. Crime statistics that reveal to usthat a crime wave is under way are social constructions in precisely the sameway that a nightly newscast about rising crime is a social construction.
Thus, crime statistics matter, as crime stories in the newspaper matter,because they encourage perceptions about the levels of crime in our society.There is an important difference, however. Most studies of crime news proceedfrom the assumption that to some degree public estimates of the amount andtype of crime in society reflect the amount and type of crime we encounter inthe news. The implication of such arguments is that we are all our own accoun-tants. We make crude calculations about high or rising crime levels based onthe amount of raw material the media present to us. By implication, the more
03-Sacco-4650.qxd 4/18/2005 9:58 AM Page 57

crime we find in the news and other media, the more likely we are to think thatcrime is rising. But as Dennis Howitt (1982) argues, maybe we don’t “do themath” ourselves. Rather, we need to recognize that one of the more commonkinds of news story involves the routine reporting of crime statistics. In themost direct way, statistical news—about a “new threat” or “rising crimelevels”—provides the members of the public with the most immediate evi-dence that crime is on the rise.
In general, then, it is essential that we understand where crime statisticscome from. Moreover, since most of us who do encounter crime statistics doso in the mass media, it is important as well for us to appreciate how crimestatistics become news and what kinds of news they become.
Numerate and Innumerate Consumers
Our starting point in this discussion, though, is the end point of the process—the “average” consumers of crime statistics. For many observers, the love-haterelationship with social statistics of all kinds is rooted in the high levels ofinnumeracy among members of the general public. The term innumeracy con-notes a condition comparable in many ways to the more familiar concept ofilliteracy (Paulos, 1988). Most of us pride ourselves on being literate andunderstand the serious problems likely to befall anyone who is not literate.Innumeracy, however, is less well understood as a problem. Still, many (if notmost) people lack even a rudimentary understanding of how social statisticsare generated, how they need to be interpreted, or what we can or cannot learnfrom them. As mathematician John Allen Paulos (1988) has written,“The samepeople who can understand the subtlest emotional nuances in conversation,the most convoluted plots in literature and the most intricate aspects of a legalcase can’t seem to grasp the most basic elements of a mathematical demon-stration” (p. 118).
Innumeracy can take many forms. One of the most problematic is whatsome analysts have referred to as “number numbness” (Dewdney, 1993). Thiscan be defined as a widespread inability to make sense of numbers that are verylarge or very small. Number numbness can create problems when we attemptto make sense of crime levels without a proper context. For instance, accordingto Bureau of Justice Statistics data, in the year 2000 there were 1,949 homicidesin the United States involving victims 50 years of age or over (Bureau of JusticeStatistics, 2002). On its own the number is huge. Indeed, it is about 50% ofthe homicide figure we find for the group for whom we might naturally expectmurder to be a much more serious problem—those aged between 18 and 24.For this group, the number of homicides in 2000 was 3,933.
In the case of older Americans, the figure represents untold amounts ofpain, suffering, and grief on the part of family members left behind. It describes
58—WHEN CRIME WAVES
03-Sacco-4650.qxd 4/18/2005 9:58 AM Page 58
almost 2,000 lives cut short, plans uncompleted, and dreams unfulfilled.The tragedy implicit in such a number is not in question. However, tragedy isrelative, and when we contextualize this number with reference to the size of thepopulation involved, we get a somewhat different perspective. If we ask howmany homicides this represents in a relative sense, the number is, as these thingsgo, a relatively small one. One thousand nine hundred forty-nine homicides ofpeople 50 years of age or over represents a rate of 2.5 homicides for every100,000 people in this age group. Those aged between 18 and 24 have a murderrate that is six times higher: 14.9 per 100,000. To focus only on the size of these(large) numbers without a sense of their context is to lose any understanding ofrelative risk. Even when numbers are carefully compiled (as homicide statisticsusually are), they rarely tell the whole story (Best, 2001a).
Our innumeracy creates confusion in many different ways. On the onehand, we are suspicious when arguments are made to us without statistics(Crossen, 1994). At the same time, we tend to lack the tools that might allowus to react with appropriate skepticism. As Paulos (1988) notes, mathematicalcertainty (even if unfounded) can be invoked to “bludgeon the innumerateinto a dumb acquiescence” (p. 67). Minimally, our innumeracy makes it diffi-cult for us to appreciate the complexity or nuances of arguments about howmuch crime there is or about how much the levels are changing.
Several factors can be used to explain contemporary levels of innumeracy.Critics point, for instance, to the lack of rigorous mathematical education inschools (Paulos, 1988). Many people have never taken even a basic statisticscourse, which would teach the skills necessary to evaluate statistical information(Crossen, 1994). In addition, while most people would feel extreme embarrass-ment about being illiterate, no such stigma seems to adhere to innumeracy.Indeed, people (even many professors) often speak with pride about theirinability to use or understand statistics. In fact, it is not the innumerate, but thehighly numerate who are often stigmatized in our society when we speak, forinstance, of the “math nerd” (Dewdney, 1993). As well, many people have trou-ble with the impersonality of mathematics. In the mass media, we are encour-aged to think about the personal and the emotional. In our news and in ourpublic rhetoric, we often seem much more comfortable with drama and emo-tion than with statistics (Cohl, 1997). In part, this reflects a widespread sensethat there is something fundamentally impersonal, or even dehumanizing,about social statistics (Paulos, 1998). As a consequence, we are free to interpretan inability to come to terms with statistical arguments as a healthy indicatorof the depth of our humanity.
The Statistics of Crime Waves
Arguments about crime waves are, in one sense, arguments about how crimewaves change over time. Can we say with some degree of statistical certainty
Crime Waves by the Numbers—59
03-Sacco-4650.qxd 4/18/2005 9:58 AM Page 59
that crime has gotten worse? Of course, “gotten worse” is a highly problematicphrase. It might mean that crime is becoming more violent or that the violenceis becoming more vicious. It might mean that crime, however violent orvicious, has begun to victimize more vulnerable victims. Usually, though, theclaim that crime is getting worse is a claim about how crime levels are increas-ing. But this too is problematic. Whether we think about crime rates as higher(or lower) depends on the comparison point. During the 1990s, for instance,overall crime rates were falling but they were still higher than they had been atthe midpoint of the 20th century (Mosher, Miethe, & Phillips, 2002). Althoughthe data are somewhat unreliable, the best estimates of long-term trends sug-gest that, at least since the 17th century, American crime patterns have beencyclical, with a major peak in the middle of the 19th century (Brantingham &Brantingham, 1984). Resolving arguments about crime level changes over timeturns out to be a rather complicated business. It is not a surprise, then, that theaverage consumer of crime statistics as found in mass media or in politicalspeeches (or shoddy pop scholarship) is often confused.
Statistics in the Raw
We have already seen how dangerous it is to make casual interpretations of rawnumbers. It follows logically that efforts to determine whether a crime wave isunder way will be undermined if we rely unduly on such numbers, yet errors inthis respect are easy to make. A relatively small number of very high visibilitycrimes can occur within a rather short period of time. If our observations arenot grounded in some broader perspective, it may appear that some problemis indeed rapidly deteriorating.
Consider, for instance, the celebrated cases of road rage that occurredduring the 1980s and again in the 1990s (Best, 1991; Fumento, 1998; Glassner,1999). While the “epidemic” nature of the problem was taken as a given in manyquarters, researchers were hard pressed to find careful and systematic evidenceof more aggressive driving on the nation’s roads, especially when account wastaken of the numbers of drivers on the road and the number of miles driven. Itmight even be argued that the celebrity crimes of corporate offenders in theearly years of the 21st century suggest similar phenomena. The rapid discoveryof crimes involving Enron, Global Crossing, “domestic maven” Martha Stewart,and others within a very short period of time, led many to argue that a “corpo-rate crime wave” was under way. While the designation had a certain rhetoricalflair, its substantive meaning remains uncertain. We might ask, after all, aboutthe rate of such crimes relative to the number of corporations and aboutwhether such a rate had changed during the period in question. As we will seein our discussion of crime news in the next chapter, it is easy to come to such
60—WHEN CRIME WAVES
03-Sacco-4650.qxd 4/18/2005 9:58 AM Page 60
conclusions. It is, after all, the rarity of events that makes them noteworthy andnewsworthy. While a school shooting, for instance, might attract widespreadattention, two school shootings (an even rarer event) will attract even moreattention and become the subject of even greater public discussion.
There is a further ironic twist to the use of raw numbers as indicators ofcrime wave trends. It can be argued that even if the actual rate at which somephenomenon occurs is in decline, some will read the data as indicating a wors-ening problem. “Worse” in this sense might mean that the problem continues(even though it does so at reduced levels). It is not therefore the relative rate atwhich incidents occur but the fact that cases continue to occur at all that canpromote the conclusion that a crime problem is deteriorating, even while itmight be improving. So, for example, we might learn that 10 murders occurredin our city last year and 5 occurred this year. While the reduction might indi-cate a shrinking problem, some will be less struck by the relative rate of occur-rence and more struck by the observation that five more of their fellowresidents died this year.
Some psychologists have noted our tendency to discern clear patterns inrandomly occurring events. When we flip a coin, for instance, we expect headsand tails to alternate more often than they actually do. What we observe areclumps of heads or clumps of tails. While these clumps, or runs, of head or tailsare perfectly consistent with a notion of randomness, the fluctuations appearmore patterned than they are. In the same way, the chance or purely randomfluctuations in the stock market, for instance, can look to uninformed observerslike a disturbing or promising trend. The occurrence of a small number ofunusual or particularly aberrant crimes might not indicate any real statisticaltrends, no matter how much we talk about these crimes or how confidently orhow loudly journalists declare the existence of such a trend. As Gilovich (1991)notes, this tendency to recognize patterns in empirical phenomena is a veryimportant skill. It is, after all, the way in which great scientific advances aremade. However, the discovery of patterns when none exist can easily lead usastray (Paulos, 1988).
Small, raw numbers can also create serious problems when they are con-verted to percentages. This is because percentages can hide unimportant orrandom differences. So, for example, if one attack on a tourist in a resort townoccurred last year and two occurred this year, we have two ways of expressingwhat we have observed. On the one hand, we might say that one additionalperson was attacked (and that the differences between the two years can beattributed to chance). On the other hand, we might state boldly that attacks tothe resort town increased by 100%. The second statement is much more omi-nous than the first.
Barry Glassner (1999) demonstrates the problem with reference to anAmerican Automobile Association study of road rage. According to Glassner,
Crime Waves by the Numbers—61
03-Sacco-4650.qxd 4/18/2005 9:58 AM Page 61
the study concluded that during the 1990s, road rage incidents were increasingat a rate of 7% per year such that by 1997, the rate had increased almost 50%.The problem, however, is that the study actually compares two relatively mod-est absolute numbers. The number of such events was 1,129 in 1990 and 1,800by 1996–1997. The difference is a grand total of 671 incidents, and these inci-dents are spread over millions of drivers in 50 states over a 7-year period.
Jacobs and Henry (1996) have provided a similar critique of data off-ered in support of claims about a “hate crime wave.” The authors analyzedNew York City police department data that purported to show that for the first4 months of 1990 there was a 12% increase in hate crimes when compared tothe same period of 1989. Of perhaps greatest concern, it was argued, was thatthe number of hate crimes directed toward Asians almost doubled between1989 and 1990. The authors maintain that a closer examination of the data tellsa more complicated story. According to Jacobs and Henry, there were 11 biascrimes against Asians in the first 4 months of 1990 as compared to 22 reportsfor all of 1989. The question posed by Jacobs and Henry is a provocative one:Is an increase of 11 incidents really all that alarming in a city that for 1990 washome to 512,719 Asian residents and the setting for 710,222 index crimes?
Another questionable use of raw numbers in the tracking of crime wavesinvolves the presentation of such numbers in ways that suggest they havesomehow been standardized when in reality they have not. One of the majordevices used in the creation of this misimpression is the crime clock. The crimeclock is a method of data presentation that purports to show the frequency ofcrime in a way that takes the timing of the offences into account. While crimeclocks are widely used by the FBI and many other policing organizations, theyhave a rather deceptive character.
The crime clock described in Figure 3.1, for instance, indicates that in theUnited States in 2002 there was a violent crime committed every 22.1 seconds.How is this figure arrived at? The estimate involves two quantities. One is anestimate of the police-reported violent crimes. For the United States in 2002that number is 1,426,325. The second figure we require is a count of thenumber of seconds in a year. This figure is easily calculated (365 days × 24hours × 60 minutes × 60 seconds) as 31,536,000. Dividing the former figureinto the latter yields the estimate of one violent crime every 22.1 seconds.
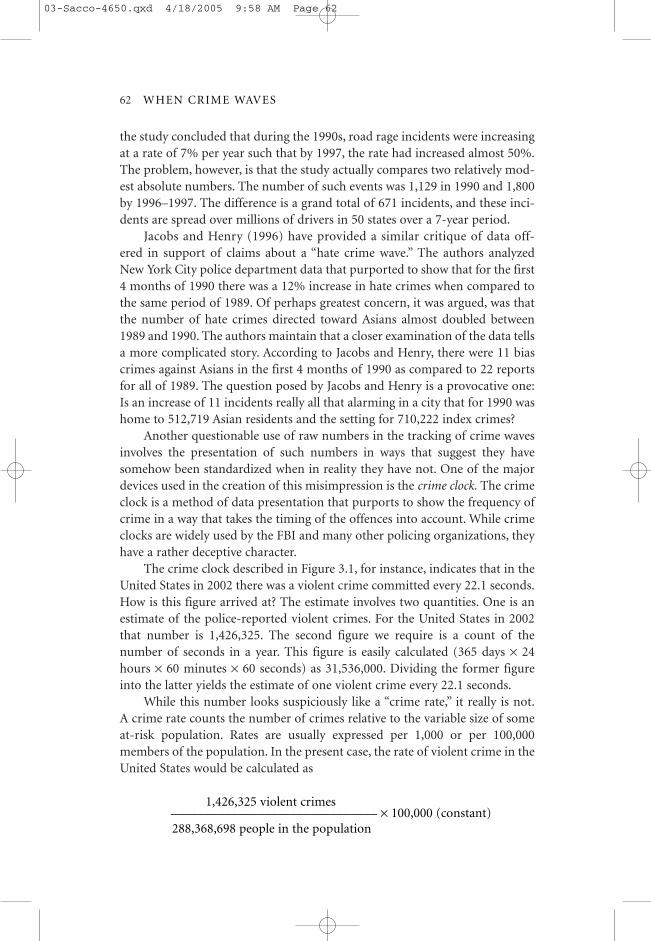
While this number looks suspiciously like a “crime rate,” it really is not.A crime rate counts the number of crimes relative to the variable size of someat-risk population. Rates are usually expressed per 1,000 or per 100,000members of the population. In the present case, the rate of violent crime in theUnited States would be calculated as
62—WHEN CRIME WAVES
_______________________________ × 100,000 (constant)1,426,325 violent crimes
288,368,698 people in the population
03-Sacco-4650.qxd 4/18/2005 9:58 AM Page 62

The rate of violent crime for the year 2002 is 494.6 crimes per 100,000members of the population.
It may appear that crime rates and crime clocks are telling us the samethings but they are not. The reason is simple. The size of the population is avariable, and as we calculate changes in the crime rate from year to year we aretaking into account not only how the number of crimes changes, but also howthe size of the population changes. In contrast, the number of seconds in a yearis not a variable but a fixed quantity. To see what difference this makes, com-pare the data from the year 1983 with the data from the year 2002.
In 1983, there were fewer violent crimes measured in an absolute sense(1,258,087) and a smaller population (233,791,994), but of course the samenumber of seconds in the year (31,536,000). The rate of violent crime per100,000 members of the population is quite a bit higher (538.1). The crimeclock, however, would suggest that we can expect a slightly longer gap betweenviolent crimes, at every 25 rather than every 22 seconds. Clearly, the crime clockmisleads us into thinking that we are seeing the data in some way that standard-izes these numbers, when in reality all we are seeing are raw numbers presentedin a more rhetorically impressive manner. Clearly, we can think of circumstancesin which the crime rate might remain the same from year to year (because the
Crime Waves by the Numbers—63
Figure 3.1 Crime Clock
2002
Every 2.7 seconds: One Crime Index Offense
Every 22.1 seconds: One Violent Crime
Every 35.3 seconds: One Aggravated Assault
Every 1.2 minutes: One Robbery
Every 5.5 minutes: One Forcible Rape
Every 32.4 minutes: One Murder
Every 3.0 seconds: One Property Crime
Every 4.5 seconds: One Larceny-Theft
Every 14.7 seconds: One Burglary
Every 25.3 seconds: One Motor Vehicle Theft
CRIMECL CK
03-Sacco-4650.qxd 4/18/2005 9:58 AM Page 63
number of crimes and the size of the population grow in proportionate ways)while the crime clocks suggest that a major crime wave might be under way.
Emergent Problems
Sometimes it is useful to make a distinction between established and emergentcrime problems. The differences have to do with the relative newness of thecategory in question. Crime problems like homicide or vandalism or white-collar crime have relatively long cultural and legal histories. In contrast, crimecategories like “home invasion,” “carjacking,” “cyberstalking,” or “road rage” arerelatively recent inventions. Of course, many of the behaviors to which theselabels apply might predate the labels themselves by many years. What is new isthe socially constructed character of the category to which the label applies. AsBest (1999) has shown, the last couple of decades of the 20th century saw thecreation of a number of categories of new crimes and new victims. When wespeak of these categories in ways that assign them a kind of taken-for-grantedreality, we often lose sight of their socially constructed character. It is importantfor us to recognize that these crime categories exist as ways of classifying expe-riences, assessing moral worth, and as objects of public discussion only becauseclaims about the need to recognize these problems have been effectively made.
As argued in the Chapter 1, the successful construction of a new socialproblem depends upon the ability of claims-makers to impress upon audiencesof lawmakers, journalists, and the members of the general public that the prob-lem is serious and deserving of attention. One of the ways this is accomplishedis through statistical arguments that provide dramatic and compellingevidence that the problem is a sizeable and growing one.
Such arguments might provide the first occasion on which most of us everhear about the problem or about its dimensions. Often we are asked to draw animplicit kind of contrast between the present and some sort of idealized pastin which the problem was less serious or did not exist at all. Of course, suchimplicit comparisons require critical scrutiny. Jacobs and Potter (1997), forinstance, argue that in the case of hate crime we are asked to believe that ratesare at an all-time high. This is difficult to accept, however, given the history ofnear genocide of native peoples and racist violence against African Americans.
One problem facing those who attempt to make the statistical case for newcrime problems is that these compelling statistical data often do not exist.Indeed, a lack of statistical information can be interpreted as a kind of proofthat no one is bothering to take the problem seriously. In other words, we tendto document problems that concern us and ignore those that do not. Yet evenin the absence of trend data, claims-makers still need to be able to argue thatthis problem is either as bad as it has ever been or that it is getting worse.
64—WHEN CRIME WAVES
03-Sacco-4650.qxd 4/18/2005 9:58 AM Page 64
Where will such numbers come from? In some cases, they are simply“guesstimates” provided by those who seek to establish the problem’s legitimacy(Best, 2001). As Neil Gilbert (1997) notes, in the early stages of social problemsconstruction it might be only those who are most deeply interested in the prob-lem who bother to think about and try to convince others regarding thefrequency or growth of a crime problem. Victims groups and victim advocatesof various sorts may be those who are expected to speak to the statistical dimen-sions of the problem to which they seek to direct our attention. This sort ofvested interest in a problem’s development can be accompanied by a real inter-est in the production of numbers that are big and growing and very little inter-est in the production of numbers that might be correct (Reuter, 1984).
In the case of the missing children crime wave of the 1980s, an early esti-mate by Jay Howell, executive director of the National Center for Missing andExploited Children, estimated that between 4,000 and 20,000 children wereabducted by strangers each year (Forst & Blomquist, 1991). Other estimatesplaced the number of missing children at between 1.8 and 2 million (Best &Thibodeau, 1998). Many individuals involved in law enforcement critiquedthese estimates and suggested that the number of children abducted bystrangers might be much closer to 100. Indeed, they argued that the very largenumbers simply did not make sense in terms of personal experience. Over fiftythousand Americans died in Vietnam, and most people knew someone whosefamily was affected by the war in this way. But how many of us know someonewhose child was abducted by a stranger? Despite such objections, these largeestimates of the number of missing children were widely accepted as correct(Forst & Blomquist, 1991).
While guesses sometimes serve to give emergent problems statistical form,another approach is to reconfigure existing data in ways that provide the needednumbers. Perhaps the best example of this phenomenon in recent years was pro-vided by Philip Jenkins’s (1994) discussion of the serial killer crime wave in the1980s. Early estimates of the size (and hence the seriousness) of the serial killerproblem estimated that as many as 20% of all American homicides in any givenyear might be the work of serial killers. But where did this number come from?Unlike some early social problem estimates, it was not just made up. Rather, itcame from a skillful if curious reinterpretation of official homicide data.
Using police-reported crime data, some justice officials estimated thatbetween 1976 and 1985 about 17% of all homicide circumstances were listedas “unknown.” During the same period, 29% of all homicides indicated that therelationship between the victim and the offender was “unknown.” In a further16% of cases, it was revealed that the offender was a stranger to the victim. Forthe year 1983, then, these officials made the unwarranted assumption thatmost of the unknown and stranger homicides were the work of serial killers.As Jenkins argues, the essential problem here is the implicit assumption that an
Crime Waves by the Numbers—65
03-Sacco-4650.qxd 4/18/2005 9:58 AM Page 65
unknown homicide circumstance is the same as “no apparent motive,” and thatno apparent motive is the same as “motiveless.” Such statistical sleight of handmeant that missing information could be imaginatively transformed intoinformation of a particular kind, and the result was an estimate of the numberof serial killer victims in the 4,000 to 5,000 range.
Why are large and increasing numbers so important to those who seek toestablish a beachhead with respect to an emergent crime problem? Most obvi-ously, they show that a problem is important because it is widespread. Whenthe numbers are large, those who have been personally affected by the problemcan believe that they are part of a larger social dynamic. Those who are notpersonally affected (and have no basis for judgment) are likely to be impressedby estimates of the widespread and worsening problem (Best & Thibodeau,1998). Often the impact of large numbers can be personalized through rhetor-ical forms that indicate that “1 in 10,” or “1 in 4,” or even “1 in 2” people willexperience the problem.
There is a further ideological benefit that derives from large and increas-ing numbers. They tend to move the search for the causes of crime waves awayfrom individuals and toward broader social, economic, or historical factors(Gilbert, 1994). Often those who seek to formulate new problem definitionsalso seek to promote social change and to avoid victim-blaming. Of course,large numbers are useful in this respect in that they encourage the search fordepersonalized explanations of crime waves.
Big numbers are important not only for putting an issue on the agendafor public debate and discussion but also for keeping it there (Gilbert, 1997;Nelson, 1984). The inability to show that a problem is getting worse, or at leastas bad as it has always been, can cause relevant parties such as journalists orlawmakers to lose interest. According to Cook and Skogan (1990), this is exactlywhat happened in the case of the elderly victimization crime wave of the 1970s.Early research, which employed very inadequate sampling and measurementtechniques, suggested that the elderly were the most frequently victimizedgroup in society. Starting in 1972, however, data from the methodologicallyrigorous National Crime Survey began to show with remarkable consistencythat this was not the case. In fact, these data showed year after year that theelderly were the least—not the most—likely to become victims of crime. Inthe presence of such a statistical onslaught, arguments for a crime wave againstthe elderly began to collapse.
Of course, sometimes the opposite happens. Initial problem estimatescan be quite resistant to challenges from more carefully conducted, state-sponsored research. This process is an interesting one. Claims-makers whohave a direct interest in the development of a new social problem tend to pro-mote large estimates of the problem. In the absence of other estimates, thesenumbers become the only game in town (Best, 2001). Moreover, such numbersare typically understood by their advocates and by audiences as underesti-mates. Because it is always easy to show that there exist cases that we don’t learn
66—WHEN CRIME WAVES
03-Sacco-4650.qxd 4/18/2005 9:58 AM Page 66
about, these often inflated numbers gain additional credibility. As thesenumbers gain legitimacy (and are the only numbers available for a period) theycan become resistant to challenge. When later, more carefully conducted, andoften more disinterested research is undertaken it may provide considerablylower estimates. These revised estimates are sometimes read by critics as anattempt on the part of government officials to deny the gravity of the problem.
More generally, as Gillespie and Leffler (1987) argue, data collection meth-ods always have political overtones and the burden of proof will always restwith those whose research challenges the status quo. Their methodologies willbe subject to greater scrutiny by those who are proponents of the definitions ofthe problem the new results challenge.
Statistical Record Keeping as a Social Process
The collection of any kind of crime data can be understood as a social con-structionist process. What ends up in any kind of crime tally is a product ofa large number of interlocking decisions made by a wide variety of actorsinvolved in the process.
This is true with respect to both of the two major data sources used bycriminological researchers: the Uniform Crime Reports and the victimizationsurvey (MacKenzie, Baunach, & Roberg, 1990; Mosher et al., 2002; O’Brien,1985). The Uniform Crime Reports (UCR) are often referred to as “policedata.” UCR data are gathered and collated by individual policing agenciesaccording to a standardized set of reporting rules. The data are submitted tothe FBI and made available to criminal justice agencies and other interestedusers nationally on an annual basis. The crime clock (discussed earlier) repre-sents one of the most famous outputs of the UCR system.
The other major data source is what is known as the victimization survey.Such studies attempt to generate counts of crime by asking people directlyabout their experiences during some specified period of crime (e.g., duringthe previous 6 months). Many researchers claim that since the counts are gen-erated directly from the members of the general public (rather than by thepolice), they are more accurate measures. This is because they are unaffectedby the vagaries of criminal justice system processing. The best-known exampleof the victimization survey is the National Crime Victimization Survey, whichhas been an important data source since its inception in 1972 (Bureau of JusticeStatistics, 2002).
The point we need to appreciate is a more general one—in either case, theproduction of crime data must be understood as a social activity. Rather thanpassively reflecting some objective world of crime, they actively construct asubjective world of crime. It is of course in the nature of social constructionsthat we often end up thinking of the worlds we have constructed as havingan independent existence (Brownstein, 1996). In other words, we reify these
Crime Waves by the Numbers—67
03-Sacco-4650.qxd 4/18/2005 9:58 AM Page 67
statistics and relate to them as though they have a much more rigorousexistence than they actually have.
What does it really mean to say that social statistics are social construc-tions? There is really nothing mystical or mysterious about this process,although it is complicated and involves many different elements (Coleman &Moynihan, 1996). Consider, for instance, the UCR counts of assault. If awoman is struck by her husband, does she, in the first instance, think of theincident as a legal infraction that should be reported to the law? Perhaps not.Certainly there have been strong cultural pressures that have encouragedwomen and men to think about assaults of this sort as somehow “different” ormore normal than other kinds of assault. If she does think of it as an assault,does she phone the police? Maybe, but maybe not. Perhaps she might be wor-ried that the police won’t really protect her and that her actions might put herat greater risk in the future. Or maybe she is too ashamed or blames herself forwhat has happened. If she phones the police, do they send a squad car? If theydo send a squad car, do they decide a “crime” has been committed? Ifthey decide a crime has been committed, do they decide to treat it officially? Ifthey do treat it officially, can we be confident that this piece of data won’t getlost in the police information system?
All of this is to say that crime levels end up being what they are as a resultof a very large number of interlocking decisions of this type. This does notimply that these decisions are simply made in some random fashion, sincethis is clearly not the case. Citizen reporting, police deployment, and policediscretion, for instance, are themselves socially patterned and predictable(Gottfedson & Gottfredson, 1988). Nor is it to say that there is never any sortof relationship between the number of crimes objectively occurring and thenumber of crimes that end up in our statistical tallies. In the case of legallydefined homicides, for example, the counts in UCR records quite closelyapproximate the number of murder victims in society. But even in this case,our decision to treat some kinds of killing (but not other kinds) as murder orthe judgments made by coroners in mysterious circumstances point to a socialconstructionist process (Box, 1981; Douglas, 1967). It is important to add, aswell, that these processes are largely organizational in nature. How police,victim interest groups, statistical agencies, or other criminal justice bodies con-struct crime depends on the cultures and the structures of these organizations.The implication is important. Statistical crime waves come and go at least inpart because of the manner in which these organizational process change overtime. There are several interesting complications in this respect.
REDEFINITION
If our legal definitions of crime can be thought of as categories, thenstatistical record keeping, at a very fundamental level, involves sorting
68—WHEN CRIME WAVES
03-Sacco-4650.qxd 4/18/2005 9:58 AM Page 68
experiences into such categories. If the categories change over time, then ofcourse so will the number and the kinds of experiences that get sorted intothem (Maxfield & Babbie, 1995). Several authors, for instance, have pointed tothe highly variable ways in which important concepts like “gang” and “gangbehavior” are defined over time or across jurisdictions for policy and thereforefor statistical purposes (Katz, 2003; McCorkle & Miethe, 2002; Peterson, 2000).
Such a situation helps explain, in some cases, why measured levels ofcrime shoot upward rapidly. Barry Glassner (1999) argues, for instance, that astime went on, the conceptual category of “road rage” became wider and wider.Eventually, it included incidents that did not even involve violence or happenon highways. At one extreme, he points out, is labeling as road rage an incidentin which one individual engaged in tailgating before being involved in an acci-dent. Joel Best (2001) makes a similar point with respect to the growth of childabuse during the 1960s. The deterioration of the problem, advocates said, wasevident from the fact that the number of reported cases grew from 150,000 in1963 to 3 million in 1995. Importantly, Best points out, over that period thedefinition of child abuse broadened to include not only physical violence butalso emotional abuse and neglect. In a similar way, Chasteen (2001) notes,feminist redefinitions of rape have encouraged an understanding of the crimeas involving an increasingly wider range of behaviors that share as a commonelement the violation of a woman’s nonconsent.
TOLERANCE
How much crime we end up counting depends to some degree on the levelof tolerance for crime. In this regard, we can think about tolerance as an indi-vidual as well as a community-level phenomenon (Horowitz, 1987). Thus,individuals might differ from each other with respect to how severe an offensemust be before they are willing to call the police, and communities might havevery different standards regarding what does and what does not offend localstandards of conduct.
In this respect it is useful to distinguish between reactive and proactivepolicing (Black, 1970). In simple terms, the former refers to those instances inwhich police get involved in the lives of citizens as a reaction to a request froma member of the public that they do so. Proactive policing, on the other hand,refers to the kind of citizen contact that police personnel themselves initiate.Most kinds of crime come to the attention of the police as a result of the for-mer type of mobilization. In other words, at least with most standard forms ofvictimization, the police become involved because someone—usually a victim,a victim’s relative, or a witness—phones the police or flags down a squad car(Gottfredson & Gottfedson, 1988).
Research suggests that victims often don’t call the police because theyassume (quite correctly) that there is really very little the police can do in
Crime Waves by the Numbers—69
03-Sacco-4650.qxd 4/18/2005 9:58 AM Page 69
particular situations. Often as well, they tell victimization researchers, they donot call the police because the crime was a relatively minor one. In addition,people may be less interested in calling the police if they have other optionsavailable to them for dealing with the situation. In the case of wife assault andsexual assault, women often do not call the police for other kinds of reasons.They fear the offender or the misogynist stigma traditionally associated withthese crimes.
Clearly, the willingness to report crimes to the police can vary over time.For instance, greater public discussion of various kinds of victimization mightencourage more victims to come forward. To the degree that the police takespecial care to encourage reporting, through public relations efforts or throughthe development of special programs, reports to the police could escalate(Sacco & Silverman, 1982). In this sense, we can imagine how a rising crimerate could fuel further reporting (Loseke, 1999). Calling the police is in a sensea form of censure and as the willingness to tolerate crime at an individual leveldecreases, our crime statistics may increase.
Proactive policing suggests a parallel set of issues at the community level.In this case, we need to recognize that crime counts can reflect the eagernessor the aggressiveness with which policing agencies pursue particular kinds oftasks. Crimes involving drug sales, for instance, are unlikely to be reported bythe buyer or the seller. It is really up to the police to discover such crimes, andhow many they discover will depend on the way in which they utilize availablehuman and financial resources.
Programs of so-called zero tolerance in schools, for instance, demonstrateeasily the point being made here. Such policies are characterized by the corpo-rate decision to treat troublesome behavior officially. In other words, in theschool system, the policy of dealing with school violence informally is replacedby a policy stating that the police will be called in ALL cases. It seems prettyobvious that one immediate consequence of such a policy would be a rapidincrease in the number of cases entering the official record.
BOOKKEEPING QUALITY
Any systematic attempt to collect large amounts of data will be plagued byerrors. This will happen despite the best intentions of all concerned. Cases willbe overlooked or recorded incorrectly. In complex data systems, there are prob-lems of “case attrition.” Simply put, cases that enter the system get lost some-where along the way. We can expect more problems to occur the larger theamount of data that needs to be processed. It has also been argued that theerrors might be most acute with respect to the cases that occur least frequently.In other words, a few serious cases buried in the midst of large numbers ofnonserious cases might more easily be lost.
70—WHEN CRIME WAVES
03-Sacco-4650.qxd 4/18/2005 9:58 AM Page 70
Of course, improvements in data collection can reduce dramatically thenumber of errors that occur. A hallmark of highly professionalized policingagencies is the tendency to take collection and record maintenance very seri-ously. Again, a consequence of better and more faithful record keeping couldbe an increase in the rate at which crimes are recorded.
THE MANIPULATION OF STATISTICAL RECORDS
There are all kinds of reasons why state (and other) agencies in societymight seek to manipulate crime statistics in a deliberate fashion. As somescholars have argued, it is helpful to think about the statistics maintained bysocial agencies as a kind of bureaucratic propaganda (Altheide & Johnson,1980). Accordingly, such statistics serve to convince others of the legitimacy ofthe organization in question.
For instance, the police might wish to create a public impression that theyare doing a good job, or that particular policies that are intended to controlcrime are working effectively. It has been argued that in the 1970s, crime ratesin many major American cities fell as a result of deliberate efforts to make thestatistical case that the crime control policies of the Nixon administration wereworking well (Mosher et al., 2002). Alternatively, there may be strong bureau-cratic pressure to keep the numbers high or even to show them increasing. Insuch circumstances, statistics can be used to make a powerful argument aboutthe need for new resources to combat a problem that appears to be spiralingout of control.
Of course, crime statistics also reflect on the prestige and reputation of thearea or organization for which reports are made. In this respect, Maier (1991)reports that some New York City police precincts used to deliberately suppresstheir crime statistics to protect the reputation of particular neighborhoods. Ina somewhat different way, Mosher and colleagues (2002) describe how statisti-cal reports of university and college crime have been manipulated in order toprotect the reputation of particular educational institutions. Although stateand federal governments mandate the collection of such data, it is obvious thathigh university or college crime rates will worry the parents of potential fresh-man and embarrass the alumni. One very obvious case of such manipulationis evident in the actions of University of Pennsylvania officials in 1996. Inits federally mandated report, the university indicated that 18 robberies hadoccurred, whereas the police reported 181. The university was able to keep thenumbers down by not reporting incidents that had taken place on streets thatcrossed the campus or in buildings that it did not own.
The notion that “numbers speak for themselves” is true only to the extentthat we fail to exercise critical judgment. Often, the graphs and charts that aresupposed to unambiguously show particular kinds of trends are themselves
Crime Waves by the Numbers—71
03-Sacco-4650.qxd 4/18/2005 9:58 AM Page 71
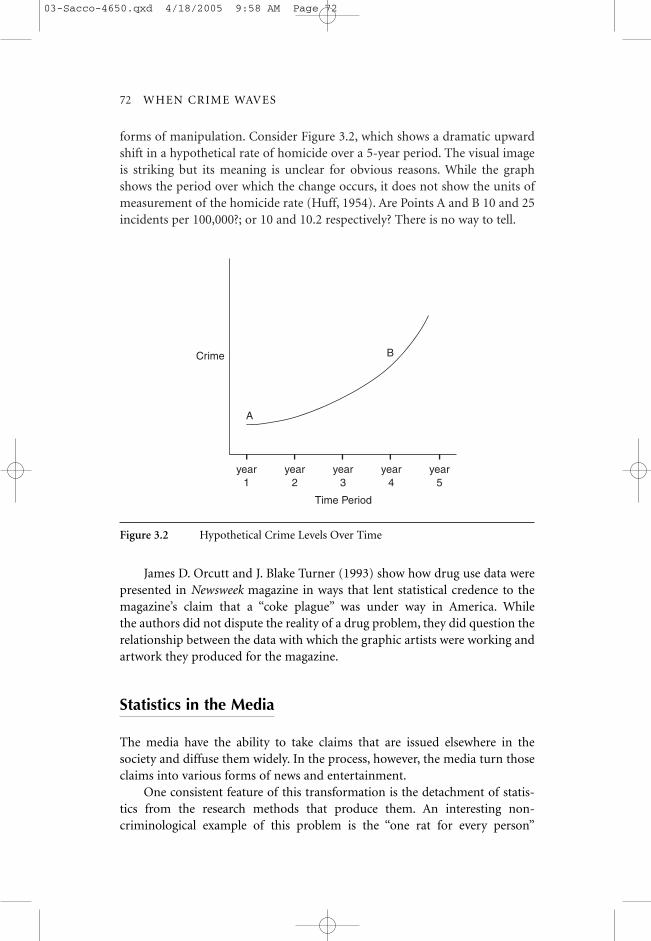
forms of manipulation. Consider Figure 3.2, which shows a dramatic upwardshift in a hypothetical rate of homicide over a 5-year period. The visual imageis striking but its meaning is unclear for obvious reasons. While the graphshows the period over which the change occurs, it does not show the units ofmeasurement of the homicide rate (Huff, 1954). Are Points A and B 10 and 25incidents per 100,000?; or 10 and 10.2 respectively? There is no way to tell.
72—WHEN CRIME WAVES
A
B
year1
year2
year3
year4
Time Period
year5
Crime
Figure 3.2 Hypothetical Crime Levels Over Time
James D. Orcutt and J. Blake Turner (1993) show how drug use data werepresented in Newsweek magazine in ways that lent statistical credence to themagazine’s claim that a “coke plague” was under way in America. Whilethe authors did not dispute the reality of a drug problem, they did question therelationship between the data with which the graphic artists were working andartwork they produced for the magazine.
Statistics in the Media
The media have the ability to take claims that are issued elsewhere in thesociety and diffuse them widely. In the process, however, the media turn thoseclaims into various forms of news and entertainment.
One consistent feature of this transformation is the detachment of statis-tics from the research methods that produce them. An interesting non-criminological example of this problem is the “one rat for every person”
03-Sacco-4650.qxd 4/18/2005 9:58 AM Page 72
statistic (Sullivan, 2004). In short, it is widely believed and frequently reportedthat in large cities the rat population is approximately equal to the human pop-ulation, yet few people know the source of this statistical estimate. It origins areto be found in a study of the rat population in England conducted in 1909 byan investigator named W. R. Boelter. He surveyed the English countryside (leav-ing out towns and cities) and concluded that there was roughly one rat for eachacre of cultivated land. At the time, there were about 40,000,000 acres of culti-vated land in England, thereby yielding an estimate of about 40,000,000 rats. Aswell, by historical coincidence, the population of England at the time also hap-pened to be about 40,000,000. Thus while in England in 1909 it made a certainamount of sense to talk about the parity of the rat and human populations,there is nothing generalizable about this statistic. While numbers can assumelives of their own, the methodology that generates them is less well known. Ofcourse, it is difficult to critique a statistic when its origins are unknown.
In a related way, we learn from watching television or reading the news-paper that crime problems are big and getting bigger. We tend to find out rela-tively little, by contrast, about how we know what we know about the statisticaldimensions of crime problems. The claims-making that surrounded the emer-gence of the problem of elder abuse in the 1980s is a good case in point. As theproblem was being established, many advocates argued that “one million elderlypeople are abused in America every year.” As Best (1999) has noted, there issomething magical about the one million figure, and it is surprising how manysocial problems seem to reach this benchmark. But where did the figure of onemillion abused elders come from? According to Steven Crystal (1988), the esti-mate came from a survey mailed out to 433 elderly residents of the Washington,D.C., area. Respondents to the survey were asked about several types of abuseincluding physical, psychological, material, and medical abuse as well as neglect.Seventy-three people or about 17% of the total sample responded. Of thatnumber only 3 people (or 4%) reported abuse. Advocates argued that if that 4%figure were extrapolated to all elderly Americans it would represent one millionvictims. The problem, of course, is that the estimate is too unreliable to allowsuch an inference to be made with any degree of confidence: Each victim in thesample would have to represent 333,333 people.
Two broad questions need to be addressed in an analysis of media treat-ments of crime statistics. First, how do such statistics enter the news flow?Second, how are statistical reports packaged so that they are consistent withour understanding of what news is? Each of these questions is addressed below.
WHERE DOES STATISTICAL NEWS COME FROM?
The origin of statistical crime news is potentially quite diverse. In practice,however, most news of this type seems to emerge out of the pronouncements
Crime Waves by the Numbers—73
03-Sacco-4650.qxd 4/18/2005 9:58 AM Page 73

issued in one form or another by state agencies (Sacco, 2000b). It is sometimeargued that any kind of unsubstantiated statistical claim can find its way intonews. While this is true, journalistic practices tend to favor “official statistics”for the same reasons that journalistic sources tend to favor official news of allsorts (Ericson, Baranek, & Chan, 1989; Gans, 1979). Like other kinds of “offi-cial news,” official statistics are widely perceived as authoritative and objec-tive, and they can be easily accessed by journalists (Brownstein, 1996). Thoseinvolved in news production, however, like most members of society, lack thetraining and background that allow them to dissect the methods that producecrime statistics (Cohl, 1997). Not surprisingly, therefore, they prefer numbersthat many members of their audiences will perceive as being above any type ofpartisan fray. Journalists feel little inclination to look elsewhere for alternativestatistics—especially when the resolution of any such debate might necessitatea side trip into arcane methodological topics that journalists aren’t qualified toaddress and in which audience members are not really interested (Crossen,1994). Federal and state agencies, policing services, and university researchers,for instance, have well-articulated relationships with media agencies and areimportant sources of “official numbers” (Fishman, 1978).
One of the reasons official statistics dominate the news has to do with themore general nature of crime coverage. By and large, the kinds of crime prob-lems to which news media attend are those that are already on the publicagenda. Thus, the media tend to be more involved in problem maintenancethan in problem construction (Nelson, 1984). The official (and quasi-official)agencies assigned the responsibility to collect routine crime informationbecome the major source of statistical news.
Of course, in those circumstances for which no other data are available,journalists must turn elsewhere for statistical estimates. Their sources in suchcases are likely to include members of victim advocate groups. Alternatively,journalists might access frontline workers whose estimates of the size of theproblem are are drawn from experience with, for instance, victims in sheltersfor battered women or abuse hotlines (Gilbert, 1994).
STATISTICS AND THE NEWS FLOW
On its own merits, a statistical report might not be the most newsworthyof items. How, then, do crime statistics become news? Like other kinds ofclaims about social problems, statistics need to be hung on some kind of newshook. Research suggests that crime statistics enter the news flow in three dis-tinct ways (Sacco, 2000b).The first involves the data release. On an annualor other regular basis, federal, state, or municipal agencies release data thatdescribe crime trends or data on new crime problems. Typically, the agencywill make available a press release with key findings and user-friendly chartsand graphs. Such new stories often concern trends, shifting crime patterns, oremerging problems.
74—WHEN CRIME WAVES
03-Sacco-4650.qxd 4/18/2005 9:58 AM Page 74

A second major news hook involves articles or news items that questionexisting beliefs about rates of crime (Gilbert, 1994). For instance, a researchermight release the results of a study that causes us to ask whether rates of rapeor sexual assault or abuse are as low as they have sometimes been made outto be. Best (1988) showed, for instance, how the Denver Post and other news-papers covered the “missing child” issue in the early days of problem construc-tion in ways that seriously questioned the estimates put forth by advocates. Ina similar way, Anthony Doob (1995) discussed how Canadian media critiquedthe high estimates of violence against women yielded by a national survey bycalling into question the motives and the methods of the researchers.
A third type of news hook involves the use of statistics as “background”information with respect to some more substantive theme. A feature magazineor newspaper article about rising rates of road rage, for instance, might include,as a sidebar, a graph showing recent increases in the size of the problem. Typi-cally, these data might be presented with little comment regarding either thesources of the data or the variety of interpretations that might be made of them.
STATISTICAL NEWS AND NEWS VALUES
Like other kinds of news, stories about statistics need to polished andmolded in order to fit the demands and the conventions of the medium inquestion. This can be accomplished in a variety of ways.
Statistical News Can Be Entertaining
As stated, there is a widespread view among both journalists and membersof the general public that statistics are not all that interesting. It is necessary,therefore, to dress such stories up in ways that increase their entertainmentvalue. In this respect, journalists might, for instance, make use of irony andhumor. News articles dealing with a national study on car theft, for instance,might talk about which city will be awarded the “car theft crown.” Graphics canalso be used to intensify the dramatic feel of a news presentation. In the studyof drug use trends described by Orcutt and Turner (1993), the data describedpatterns of use but the graphic purported to describe a “coke plague.”
One major strategy is to turn statistical stories into human interest stories.This is accomplished by putting a “human face on the figures.” A report of astudy of child abuse, for instance, might begin with a narrative about the abuseof one particular child. The focus of the story is then on the ways in which thecase is typical of a larger problem that is described by the study.
Statistical News Is Important
Statistical claims become important news when journalists emphasize thesignificance of the findings. A study of violence against women, we are told, is
Crime Waves by the Numbers—75
03-Sacco-4650.qxd 4/18/2005 9:58 AM Page 75
a “landmark study” with wide-ranging implications. Research pointing to “anational shame,” as it was claimed the early studies of elder abuse did, or that“confirms our worst fears,” as studies of gang violence are sometimes claimedto do, are packaged as more than mere social science.
Statistical News Is Objective News
If statistical news tends to consist largely of government pronouncements,how are media able to construct themselves as objective? One way this isaccomplished is through efforts on the part of journalists to promote a self-critical style. In a way that seems to suggest real disinterestedness, news articlesoften speak of the “hype” (which they themselves generate) that exaggerates thethreat that crime poses. In this respect, journalists often call upon academicand other experts to provide “perspective.” Objectivity can also be manifestedthough the routine coverage of party politics by which “administration” studiescan be critiqued by interest groups or by a competing political factions. In thisway, journalists are seen as not committed to a particular version of the storybut as engaged in the same kind of detached and objective reporting that isinvolved in the reporting of other kinds of stories.
Conclusion
The investigation of crime waves necessitates an understanding of how crimestatistics are shaped, formed, and made available to consumers. The words weuse to describe the phenomena in which we are interested—epidemic, flood,torrent—and of course crime wave itself, are terms that clearly lend themselvesto statistical expression (Jacobs & Henry, 1996).
Crimes statistics must therefore be seen as one of the central means bywhich crime waves are constructed. It is when we learn that crime statistics arerising that we come to understand that a crime wave is under way. As we haveseen, however, our observations in this respect might be less straightforwardthan at first appears.
Crime statistics, like all forms of statistics, are subject to considerablepotential distortion. Some of this distortion results from the vagaries of anyform of data collection. The counting of crime is a complex undertaking.There are always unresolved questions about how crime is to be measured andhow populations are to be sampled for research purposes.
There are also intentional sources of distortion. Statistics are often a site ofsocial conflict in our society. Arguments about escalating rates of crime caneasily be turned into arguments about how resources are to be employed andabout who is most deserving of our attention or even our sympathy. Claims-makers, in order to draw attention to what they see as a problem condition,
76—WHEN CRIME WAVES
03-Sacco-4650.qxd 4/18/2005 9:58 AM Page 76

provide extreme estimates of the size of the problem and the rate at which it isgrowing. In a related way, policing agencies (and other bureaucratic organiza-tions) have sometimes played fast and loose with the statistical facts in order togain bureaucratic advantage.
All of these problems are compounded by the high level of innumeracy inthe general population. Many—or perhaps most—people in the populationlack the skills to think critically about statistical evidence. The consequences ofthis state of affairs are not always uniform. On the one hand, we are made vul-nerable to statistical arguments because we possess no natural defenses. On theother hand, we are often suspicious of numbers and believe that they cannotbe trusted. The problem, of course, is that these positions do not correlate withthe quality of statistical evidence in any consistent way. We are, it seems, aslikely to be impressed by faulty statistical logic as we are to be dismissive ofrobust statistical evidence.
Crime statistics are themselves social constructions. Whether we end upseeing a crime wave in our tables, charts, and graphs depends not only on whatis going on in the world that we intend to represent numerically, but also onhow we do the counting. The parallels between statistical work and news workneed to be carefully considered. The latter process is discussed more fully in thefollowing chapter.
Crime Waves by the Numbers—77
03-Sacco-4650.qxd 4/18/2005 9:58 AM Page 77

03-Sacco-4650.qxd 4/18/2005 9:58 AM Page 78