Embed Size (px)
Citation preview

SQM: Results for 1H08 and Market Outlook
August 20, 2008
Patricio ContesseChief Executive Officer
Eugenio Ponce Senior Commercial Vice President

2
Important Notice
Statements in this presentation concerning the Company’s business outlook or future economic performances, anticipated profitability, revenues, expenses, or other financial items, anticipated cost synergies and product or service line growth, together with other statements that are not historical facts, are “forward-looking statements” as that term is defined under Federal Securities Laws.
Any forward-looking statements are estimates, reflecting the best judgment of SQM based on currently available information and involve a number of risks, uncertainties and other factors that could cause actual results to differ materially from those stated in such statements.
Risks, uncertainties, and factors that could affect the accuracy of such forward-looking statements are identified in the public filing made with the Securities and Exchange Commission, and forward-looking statements should be considered in light of those factors.

3
Results for 1H08
• Increase in prices of nitrates and potassium-based fertilizers
• Increases in iodine sales volumes
• Higher lithium prices and sales volumes than originally expected
1H08 Net Income
US
$ M
illio
ns
93.9
190.5
0
40
80
120
160
200
240
1H 2007 1H 2008
∆∆∆∆+ 102.8%
51.0
125.7
0
50
100
150
2Q 2007 2Q 2008
2Q08 Net Income
∆∆∆∆+ 146.6%
US
$ M
illio
ns
4
Seven consecutive years of earnings growth: • Quarterly earnings higher than earnings for the same quarter of the previous year
SQM’s long-term development strategy continues to de liver positive results
Results for Last Seven Years: Sustained Growth
Earnings growth observed in 2008 is part of an ongo ing, systematic trend resulting from several factors:
• Capex plan focused on core businesses
• Increases in sales volumes • New products and development of international supply chain • Technological development, innovation and operating flexibility
• Price increases in all our business lines

5
Positive outlook in our main markets:• Nitrates and potassium: favorable pricing conditions
� Growing demand exceeds effective supply � Low inventories of potassium-based fertilizers and grains/cereals
• Significant increase in KCl sales during 2009• Iodine and lithium: sustained demand growth exceeds original projections
Short-Term Expectations
We expect results for the second half of 2008 to be significantly higher than the first half of the year.
The positive trend observed in 2008 should continue in 2009.
6
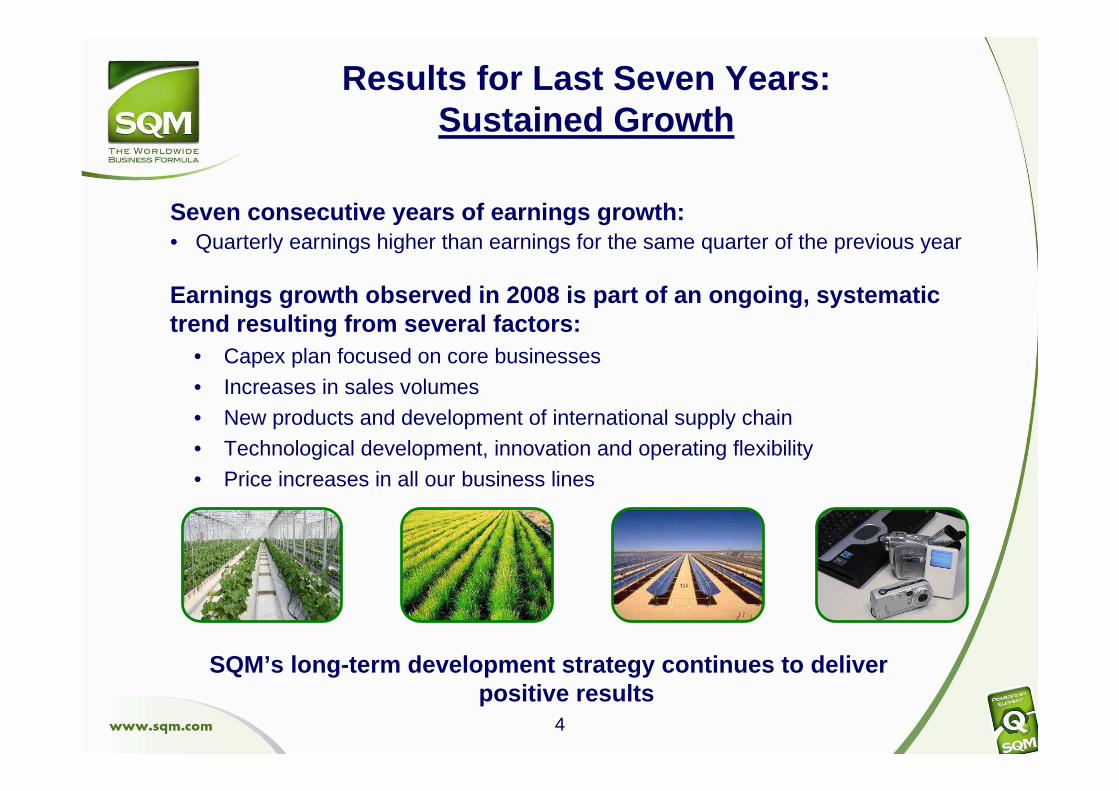
• Sustained demand growth projected for our core busi nesses• Scarcity of high-quality natural resources
� High investment and operating costs associated with new projects� Implementation of new projects requires long lead-times
• Growing margins on the crops that use our fertilize rs and the industrial products that use iodine and lithium
� Increased margins in the whole supply chain � Opportunity to increase the prices of our products
Structural Changes in our Markets
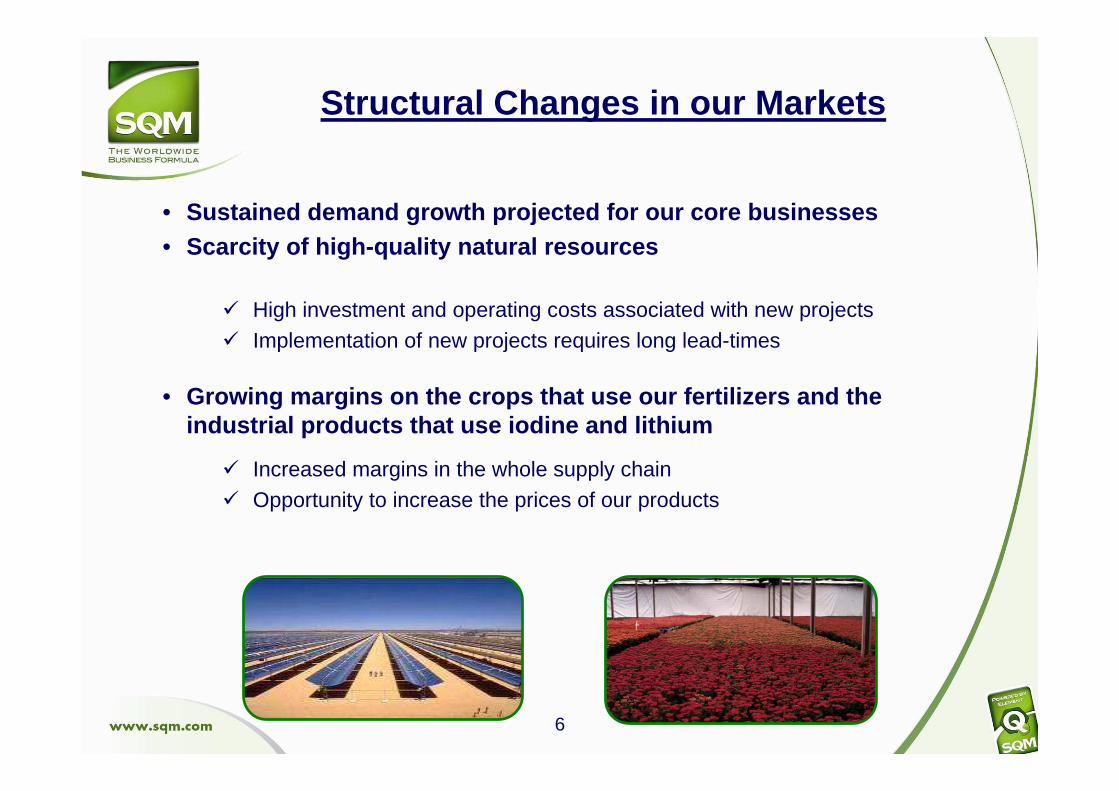
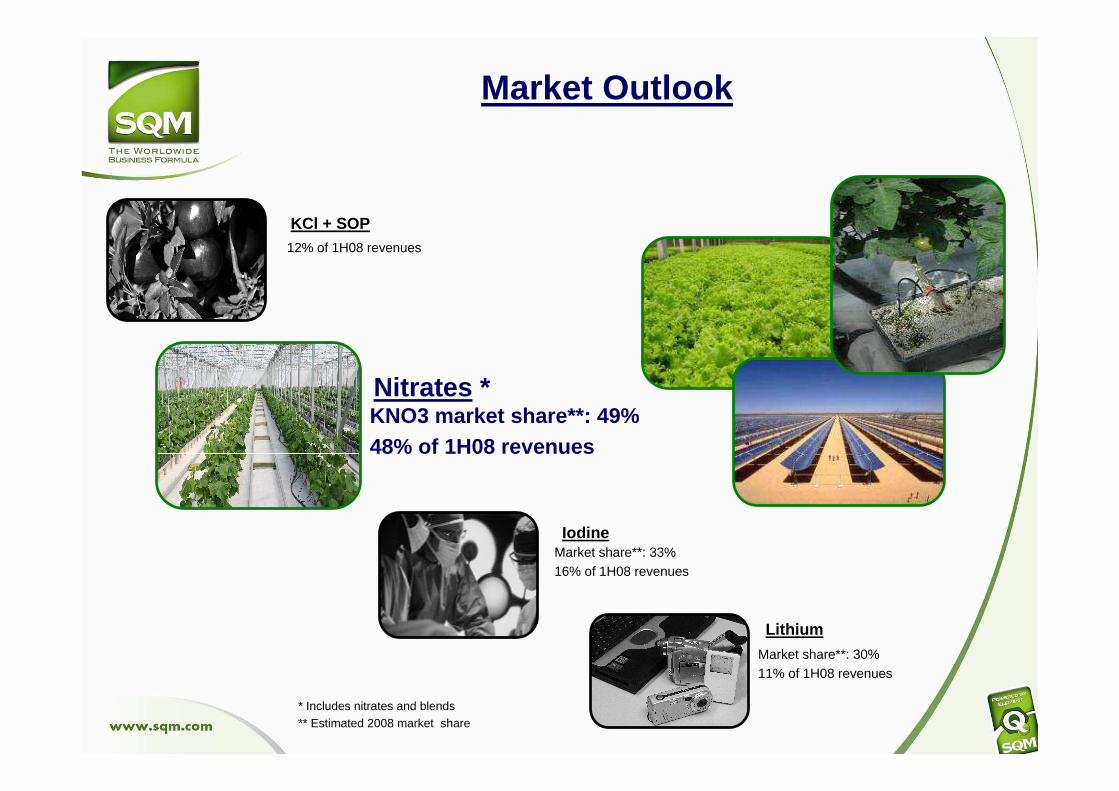
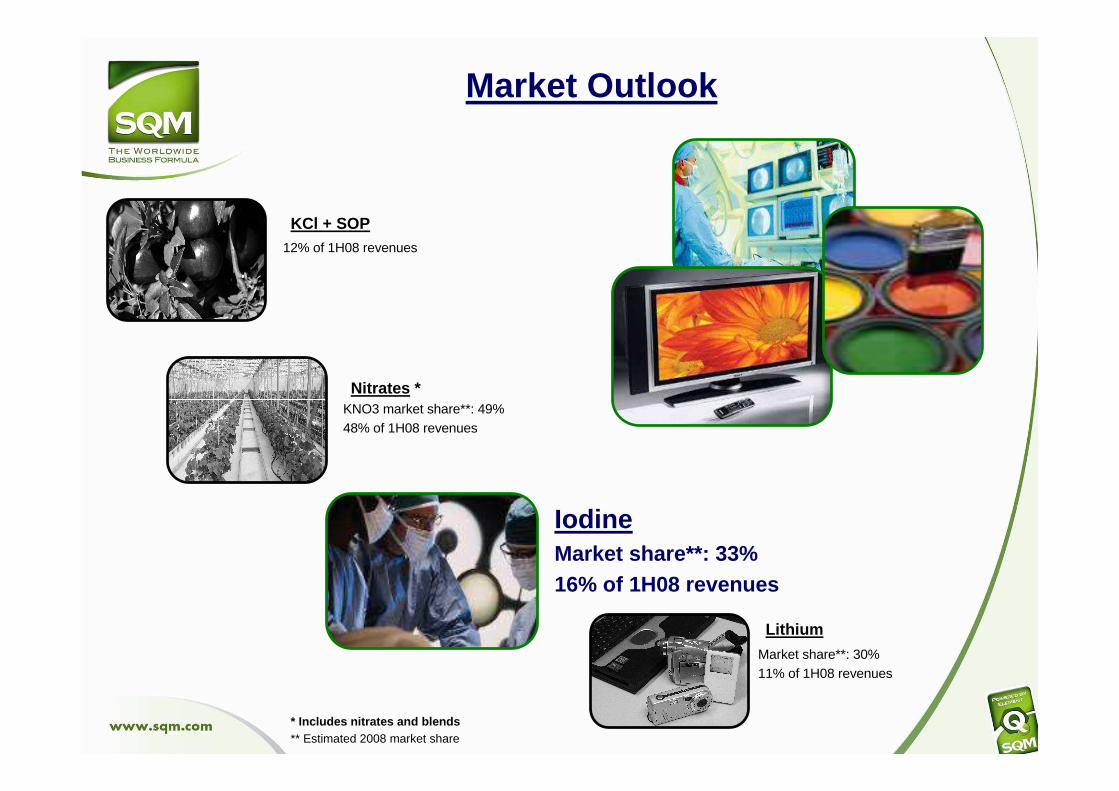
Market share**: 33%16% of 1H08 revenues
Iodine
Nitrates *KNO3 market share **: 49%48% of 1H08 revenues
Lithium
Market share**: 30%11% of 1H08 revenues
KCl + SOP12% of 1H08 revenues
* Includes nitrates and blends ** Estimated 2008 market share
Market Outlook
8
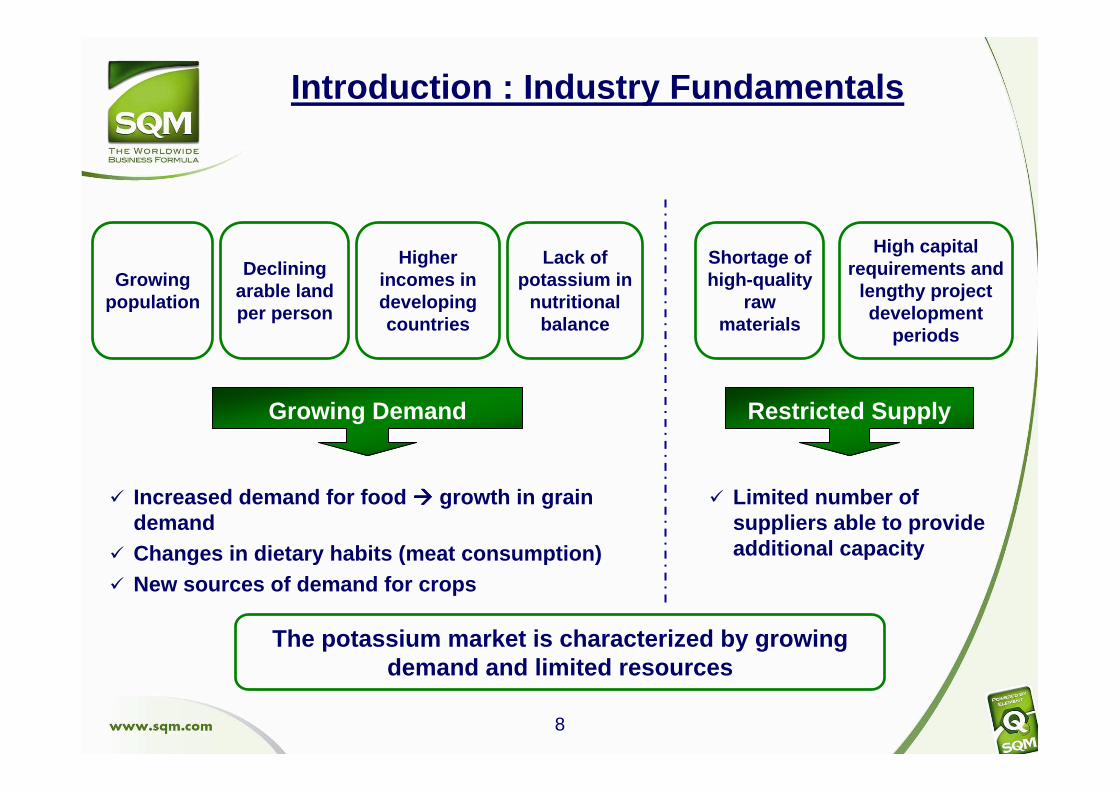
Growing population
Declining arable land per person
Higher incomes in developingcountries
Lack of potassium in
nutritional balance
Shortage of high-quality
raw materials
High capital requirements and
lengthy project development
periods
Growing Demand Restricted Supply
� Increased demand for food ���� growth in grain demand
� Changes in dietary habits (meat consumption)� New sources of demand for crops
� Limited number of suppliers able to provide additional capacity
The potassium market is characterized by growing demand and limited resources
Introduction : Industry Fundamentals

9
0
100
200
300
400
500
600
700
1980
1982
1984
1986
1988
1990
1992
1994
1996
1998
2000
2002
2004
2006
2008
E
12%
16%
20%
24%
28%
32%
36%
Inventory Stock-to-Use
Demand: Inventories vs. Consumption
Strong decrease in total grain inventories beginnin g in 2000• Global consumption of grains and oilseeds has exceeded production in 7 of the
last 8 years • Increased food consumption � increased grain demand• Stock-to-use ratio has fallen to 16%, an all-time low (equal to 2 months’ worth
of global consumption)
Source: USDA, PCS
Mill
ions
ofM
T

10 * Source: Fertecon - Odepa
Demand: Crop Prices vs. KCl
0
100
200
300
400
500
600
700
Mar-9
3Nov
-93
Jul-9
4Mar
-95
Nov-9
5Ju
l-96
Mar-9
7Nov
-97
Jul-9
8Mar
-99
Nov-9
9Ju
l-00
Mar-0
1Nov
-01
Jul-0
2Mar
-03
Nov-0
3Ju
l-04
Mar-0
5Nov
-05
Jul-0
6Mar
-07
Nov-0
7Ju
l-08
0
200
400
600
800
1000
1200
1400
Corn (Yellow no. 2, FOB Gulf, USA)
Wheat (Hard red winter no. 2, FOB Gulf, USA)
Soy (FOB Rosario, BB.AA., Argentina)
KCl (FOB Vancouver - Standard)
Crop Prices vs. KCI Prices*C
rop
Pric
es (
US
$ / M
T)
KC
lP
rices (US
$ / MT
)
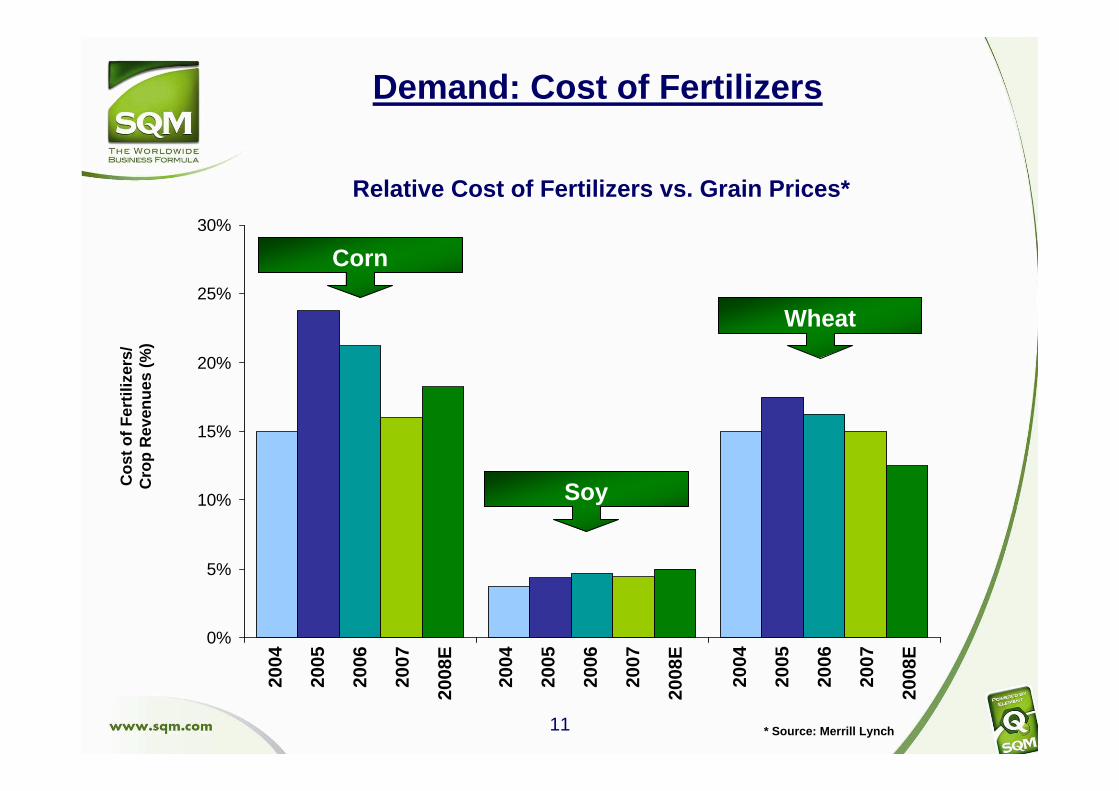
11 * Source: Merrill Lynch
Demand: Cost of Fertilizers
0%
5%
10%
15%
20%
25%
30%
Cos
t of F
ertil
izer
s/
Cro
p R
even
ues
(%)
Relative Cost of Fertilizers vs. Grain Prices*
Corn
Soy
Wheat
2004
2005
2006
2007
2008
E
2004
2005
2006
2007
2008
E
2004
2005
2006
2007
2008
E

12
Demand: Volume Trends
40.8
55.6
0
10
20
30
40
50
60
2000 2001 2002 2003 2004 2005 2006 2007
Mill
ions
ofM
T
KCl Demand*CAGR 2000-2007: 4.5%
• Consumption levels in 2008 are expected to be the same as in 2007, due to insufficient supply
• Beginning in 2009, consumption growth is expected to continue at a rate of approximately of 4.5%
* Source: IFA, British Sulphur
13
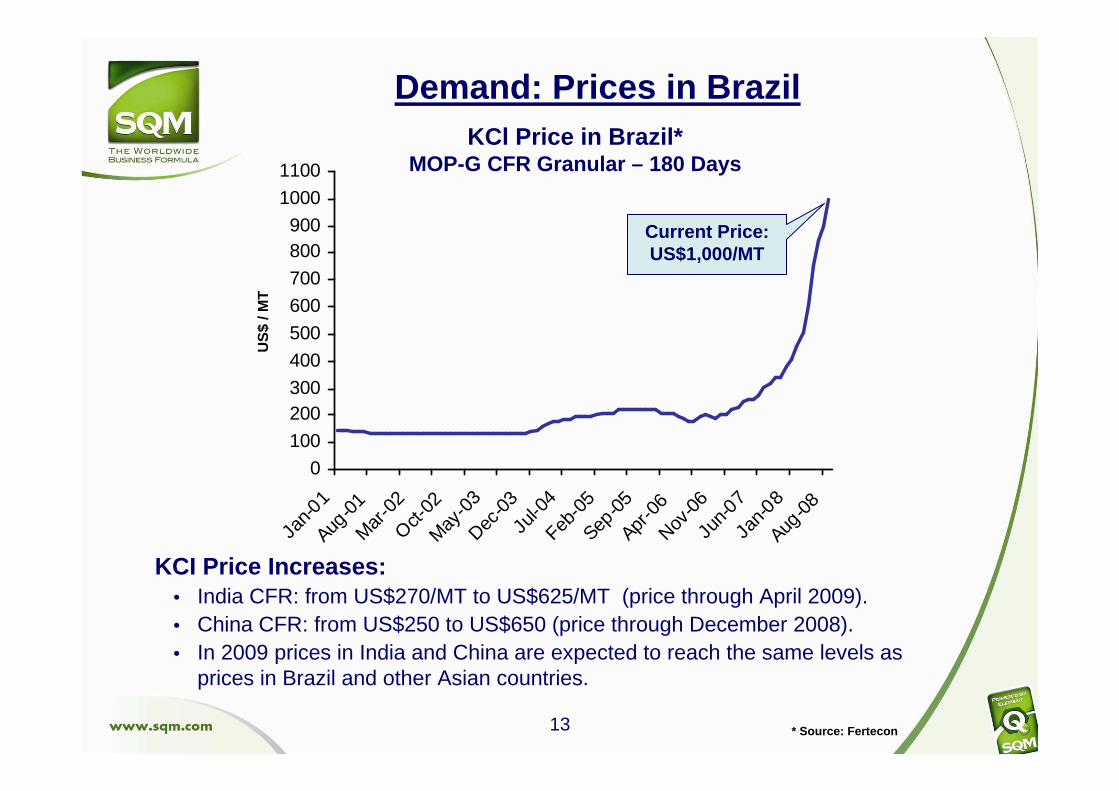
Demand: Prices in Brazil
* Source: Fertecon
0
100
200300
400
500
600
700
800900
1000
1100
Jan-0
1Aug
-01
Mar
-02
Oct-02
May-0
3Dec
-03
Jul-0
4Feb
-05
Sep-0
5Apr
-06
Nov-0
6Ju
n-07
Jan-0
8Aug
-08
KCl Price in Brazil*MOP-G CFR Granular – 180 Days
Current Price: US$1,000/MT
KCI Price Increases:• India CFR: from US$270/MT to US$625/MT (price through April 2009).• China CFR: from US$250 to US$650 (price through December 2008). • In 2009 prices in India and China are expected to reach the same levels as
prices in Brazil and other Asian countries.
US
$/ M
T

14
Projected Supply and Demand Balance
0.0
10.0
20.0
30.0
40.0
50.0
60.0
70.0
80.0
2008E 2009E 2010E 2011E 2012E0%
10%
20%
30%
40%
50%
60%
70%
80%
90%
100%
110%Demand Installed Capacity Demand/Capacity
Mill
ions
ofM
T
Source: Fertecon, IFA, British Sulphur
• Capacity utilization rate expected to be close to 9 0% in coming years.
Utilization rate

15
SQM’s Supply: ProjectionT
hous
ands
of
MT
* SQM estimates. Sales of KNO3 are projected to increase in 2009 and to increase significantly in 2010. Consequently, a significant part of the KCl production will be used in the production of KNO3. Current projections indicate that in 2009 SQM will sell approximately 100,000 MT of inventory generated during 2008. These figures may change significantly, depending on effective production, the start-up dates for the potassium expansions and the start-up dates for the KNO3 expansion.
820900
10001100
0
200
400
600
800
1000
1200
2008E 2009E 2010E 2011E
330
500-550500-550550-600
0
100
200
300
400
500
600
700
2008E 2009E 2010E 2011E
KCl + SOP Production * KCl + SOP Sales *
Tho
usan
ds o
f M
T
Market share**: 33%16% of 1H08 revenues
Iodine
Lithium
Market share**: 30%11% of 1H08 revenues
Nitrates *KNO3 market share**: 49%48% of 1H08 revenues
KCl + SOP12% of 1H08 revenues
Market Outlook
* Includes nitrates and blends** Estimated 2008 market share
17
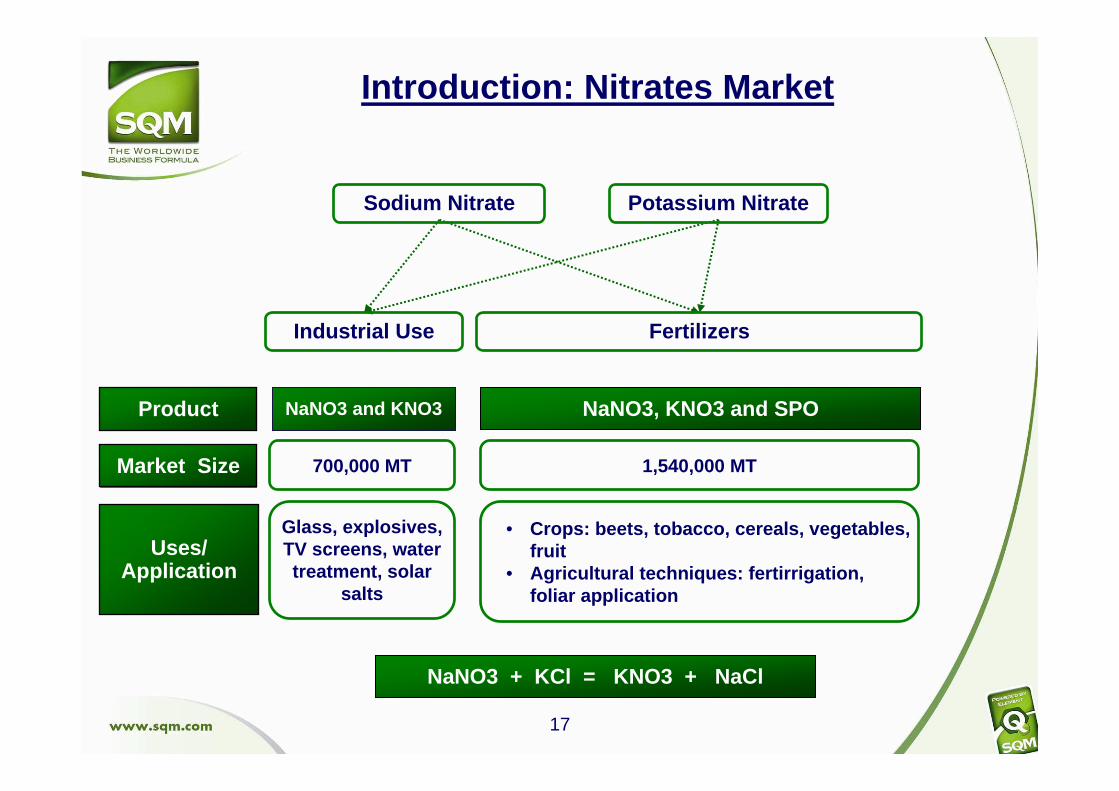
Market Size
Uses/ Application
Product NaNO3 and KNO3 NaNO3, KNO3 and SPO
Sodium Nitrate Potassium Nitrate
Industrial Use Fertilizers
Introduction: Nitrates Market
700,000 MT
Glass, explosives, TV screens, water treatment, solar
salts
1,540,000 MT
• Crops: beets, tobacco, cereals, vegetables, fruit
• Agricultural techniques: fertirrigation, foliar application
NaNO3 + KCl = KNO3 + NaCl

18
Demand for agricultural potassium nitrate:• Demand Growth : during the last 10 years, the CAGR has been close to 5%.
• Soluble Segment : scarcity of water, high cost of land and growing demand for high-quality fruits and vegetables have driven the growth of modern agricultural techniques (Micro-irrigation, hydroponics, greenhousing, etc.)
• Geographic Area : KNO3 demand has increased substantially in countries like China, India, Turkey, México, Middle East countries.
Demand: Agricultural KNO3
1.11.7
3.2
6.0
0.5
0.0
1.5
3.0
4.5
6.0
7.5
1980 1986 1991 2000 2006
Global Micro-Irrigation Surface Area**CAGR: 10%
Mill
ions
ofhe
ctar
es
KNO3 Prices and Demand*
KN
O3 P
rice(U
S$
/ MT
)
* SQM estimates for 2008
** Source: ICID
Dem
and
(tho
usan
dsof
MT
)
853
607
0
100
200
300
400
500
600
700
800
900
2002 2003 2004 2005 2006 2007 2008 E
0
200
400
600
800
1,000
1,200
1,400Demand Average Price

19
Demand for industrial-grade potassium nitrate and s odium nitrate• Demand for current applications has been stable• New demand for storage of thermal energy in solar energy plants will significantly
increase the consumption of nitrates� Mixture of sodium nitrate and potassium nitrate� 50 projects will be developed in the next 5 years.
Demand: Industrial Nitrates
28 48
250300
350
100
100
200
300
400
500
2007 2008E 2009E 2010E 2011E 2012E
Projected Demand for Solar Salts*
Tho
usan
dsof
MT
* SQM estimates
Price
(US
$/ M
T)
Dem
and
(tho
usan
dsof
MT
)
Industrial Nitrates Prices and Demand*
358381
0
50
100
150
200
250
300
350
400
450
2003 2004 2005 2006 2007 2008 E
0
100
200
300
400
500
600
700
800Demand Average Price

20
Main Projects• ACS Cobra-Sener, Man Solar Millenium, Abengoa, Acciona, SAMCA,
Endesa España, Ibereolica
Demand: Solar Salts Projects

21
Projected Supply and Demand Balance
0
500
1,000
1,500
2,000
2,500
20052006
20072008E
2009E2010E
2011E2012E
2013E2014E
2015E
0%
10%
20%
30%
40%
50%
60%
70%
80%
90%
100%
110%Demand Installed Capacity Demand/Capacity
Tho
usan
dsof
MT
SQM estimates
• Capacity utilization rate expected to be close to 1 00% in comingyears.
Utilization
Rate
Market Outlook
Lithium
Market share**: 30%11% of 1H08 revenues
* Includes nitrates and blends** Estimated 2008 market share
KCl + SOP12% of 1H08 revenues
Nitrates *KNO3 market share**: 49%48% of 1H08 revenues
IodineMarket share**: 33%16% of 1H08 revenues
23
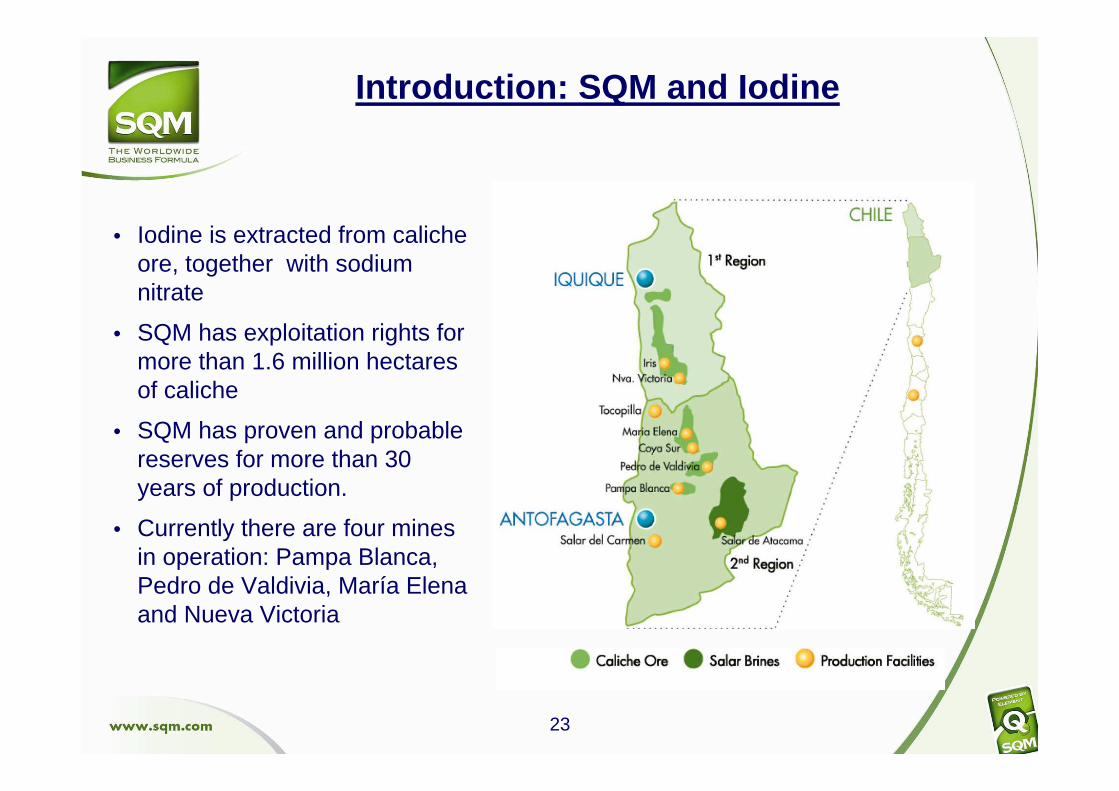
• Iodine is extracted from caliche ore, together with sodiumnitrate
• SQM has exploitation rights formore than 1.6 million hectaresof caliche
• SQM has proven and probable reserves for more than 30 years of production.
• Currently there are four mines in operation: Pampa Blanca, Pedro de Valdivia, María Elena and Nueva Victoria
Introduction: SQM and Iodine
24
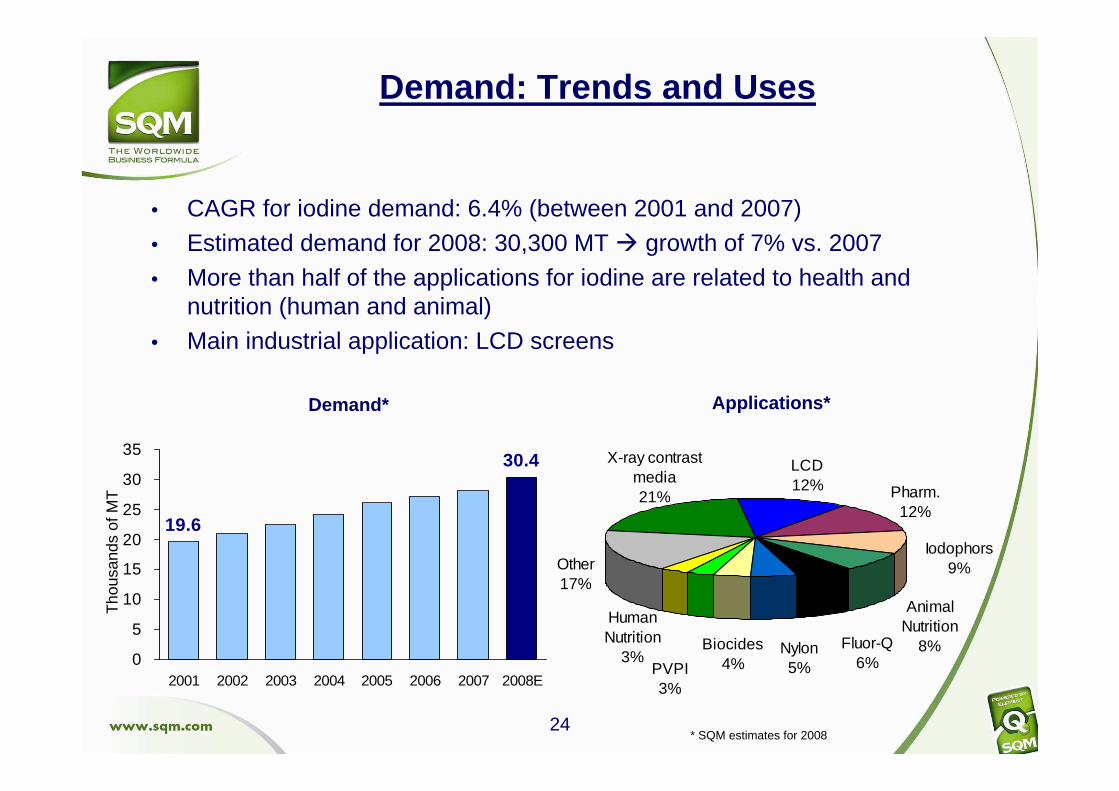
• CAGR for iodine demand: 6.4% (between 2001 and 2007)• Estimated demand for 2008: 30,300 MT � growth of 7% vs. 2007
• More than half of the applications for iodine are related to health andnutrition (human and animal)
• Main industrial application: LCD screens
Demand: Trends and Uses
19.6
30.4
0
5
10
15
20
25
30
35
2001 2002 2003 2004 2005 2006 2007 2008E
Demand*
Tho
usan
dsof
MT
Applications*
LCD12% Pharm.
12%
X-ray contrast media21%
PVPI3%
Human Nutrition
3%
Other17%
Biocides4%
Nylon5%
Animal Nutrition
8%Fluor-Q6%
Iodophors9%
* SQM estimates for 2008
25
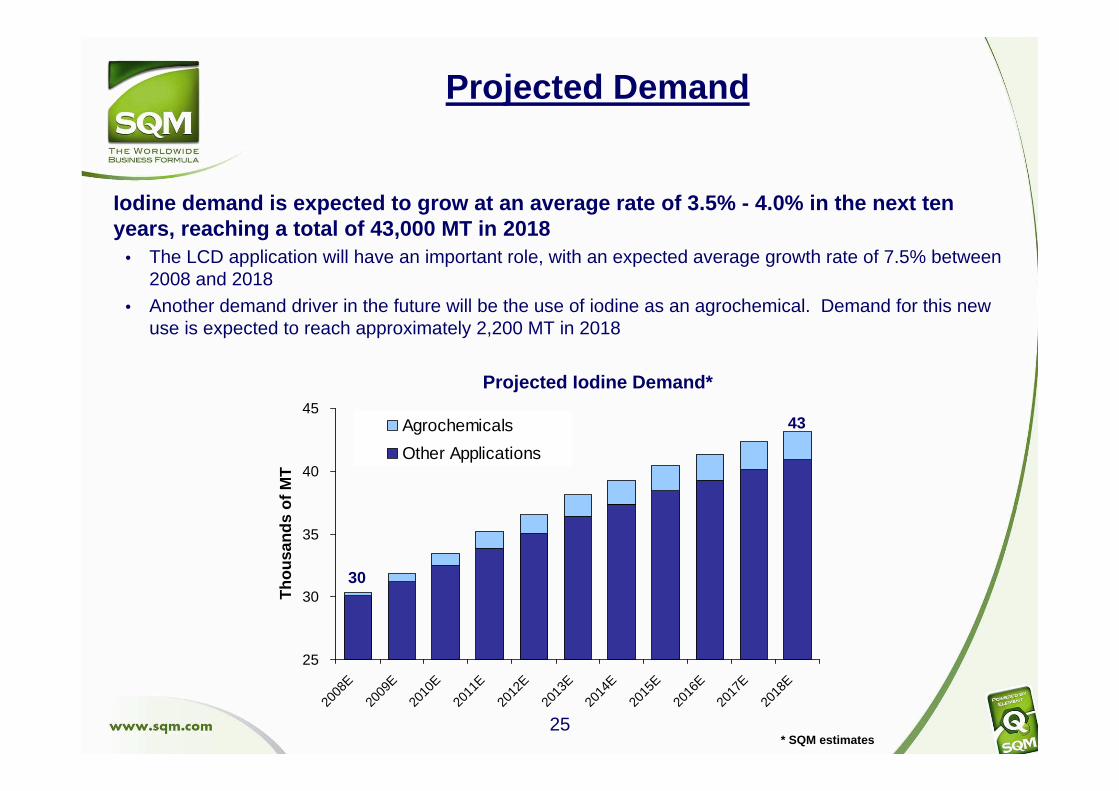
Iodine demand is expected to grow at an average rat e of 3.5% - 4.0% in the next ten years, reaching a total of 43,000 MT in 2018
• The LCD application will have an important role, with an expected average growth rate of 7.5% between 2008 and 2018
• Another demand driver in the future will be the use of iodine as an agrochemical. Demand for this new use is expected to reach approximately 2,200 MT in 2018
Projected Demand
25
30
35
40
45
2008
E
2009
E
2010
E
2011
E
2012
E
2013
E
2014
E
2015
E
2016
E
2017
E
2018
E
Agrochemicals
Other Applications
Tho
usan
dsof
MT
43
Projected Iodine Demand*
* SQM estimates
30
26
Japan21% Others
6%
Recycling11%
USA4%
Others Chile25%
SQM33%
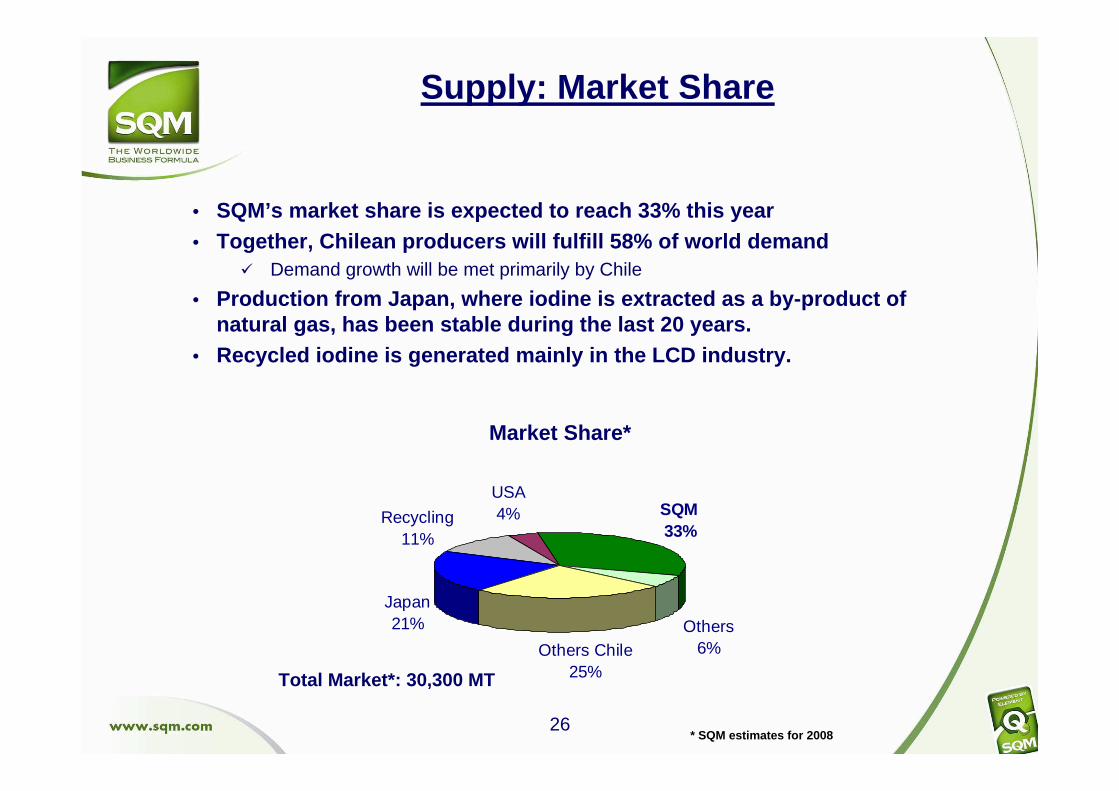
• SQM’s market share is expected to reach 33% this yea r• Together, Chilean producers will fulfill 58% of wor ld demand
� Demand growth will be met primarily by Chile
• Production from Japan, where iodine is extracted as a by-product of natural gas, has been stable during the last 20 yea rs.
• Recycled iodine is generated mainly in the LCD indu stry.
Supply: Market Share
Market Share*
Total Market*: 30,300 MT
* SQM estimates for 2008
27
20
25
30
35
40
45
50
2008E 2009E 2010E 2011E 2012E 2013E 2014E 2015E 2016E 2017E 2018E0%
10%
20%
30%
40%
50%
60%
70%
80%
90%
100%
110%Demand Installed Capacity Demand/Capacity
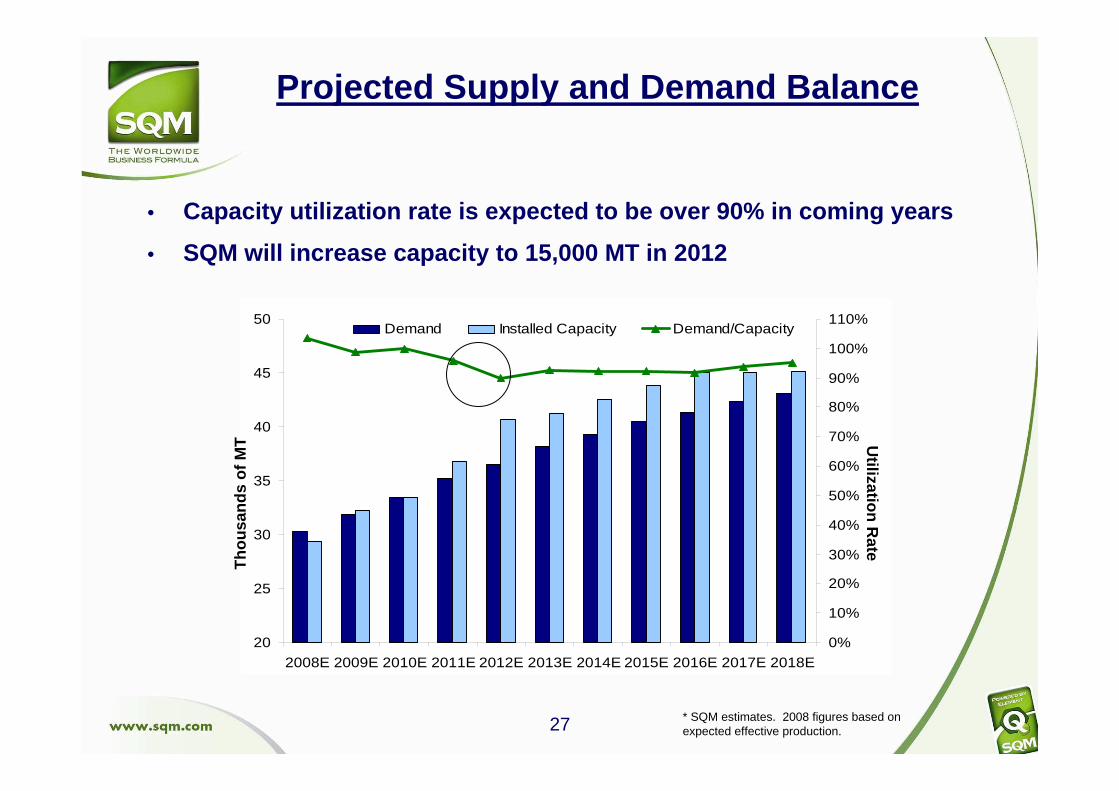
• Capacity utilization rate is expected to be over 90 % in coming years
• SQM will increase capacity to 15,000 MT in 2012T
hous
ands
ofM
T
* SQM estimates. 2008 figures based onexpected effective production.
Utilization
Rate
Projected Supply and Demand Balance

Market Outlook
* Includes nitrates and blends** Estimated 2008 market share
KCl + SOP12% of 1H08 revenues
Nitrates *KNO3 market share**: 49%48% of 1H08 revenues
Market share**: 33%16% of 1H08 revenues
Iodine
LithiumMarket share**: 30%11% of 1H08 revenues

29
• The Salar de Atacama contains the best and most abundant commercially exploitable reserves in the world
• These reserves are located in the core of the Salar de Atacama, a salt-encrusted depression within the Atacama Desert, which contains deposits of brines fed by an underground inflow of water from the Andes Mountains
Introduction: SQM and Lithium
• The brines from the Salar de Atacama have sustainable competitive advantages on a global level, because they have the highest concentrations of potassium, lithium and boron
30
Frits9%
Lubricating Greases
12%
Glass8%
Batteries27%
Otros38%
A/C6%
95
59
40
50
60
70
80
90
100
110
2001 2002 2003 2004 2005 2006 2007 2008E
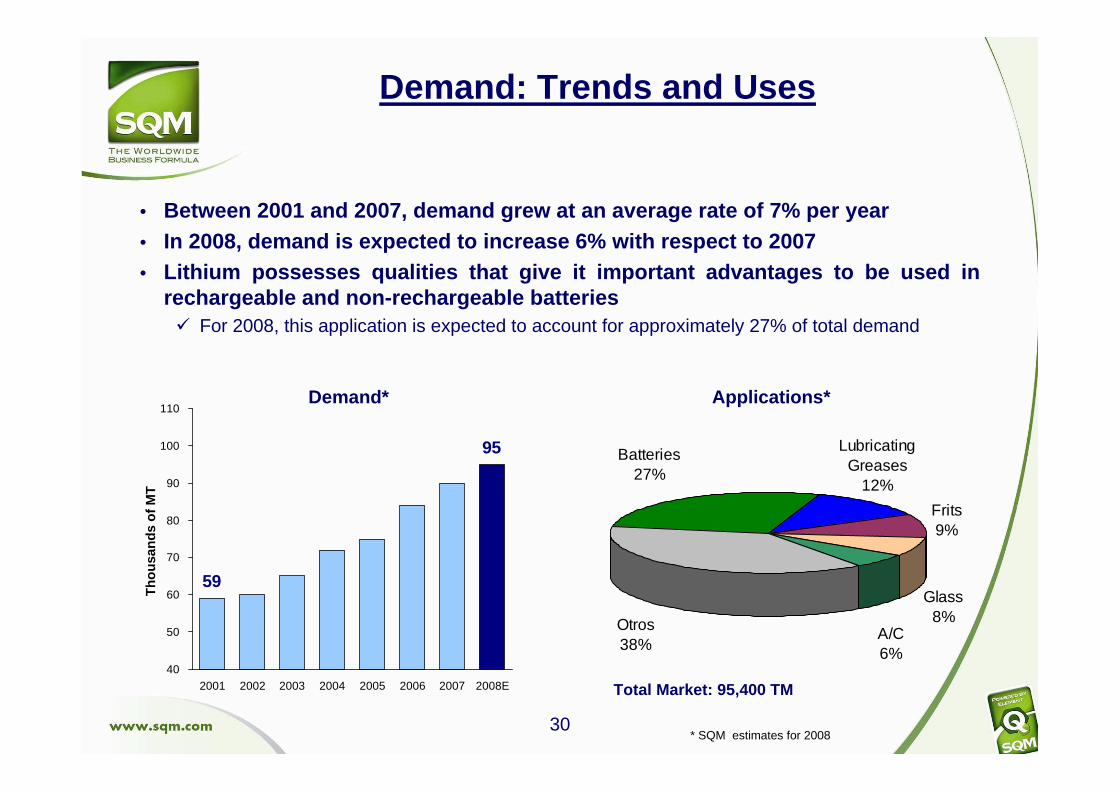
• Between 2001 and 2007, demand grew at an average ra te of 7% per year• In 2008, demand is expected to increase 6% with res pect to 2007 • Lithium possesses qualities that give it important advantages to be used in
rechargeable and non-rechargeable batteries� For 2008, this application is expected to account for approximately 27% of total demand
Demand: Trends and Uses
Demand* Applications*
Tho
usan
dsof
MT
Total Market: 95,400 TM
* SQM estimates for 2008

31
• Expected growth in lithium demand (2008 – 2018): ove r 5% per year• Rechargeable batteries should drive growth, with ra tes near 10% per year
� By 2018 batteries should account for 42% of total demand (2008: 27%)
• Within the batteries market, the batteries with gre ater growth potential are those that are more lithium-intensive, such as batteries for e lectric vehicles.
Projected Demand
Projected Lithium Demand*
80
100
120
140
160
2008
E20
09E
2010
E20
11E
2012
E20
13E
2014
E20
15E
2016
E20
17E
2018
E
Batteries for VehiclesOther Applications
Tho
usan
dsof
MT
* SQM estimates
95
158

32
Demand: Hybrid and Electric Vehicles
• There is a consensus in the industry that lithium batteries are the best option to store energy in electric and hybrid electric vehicles (HEVs).
• In 2007 more than half a million hybrid vehicles were sold
� Toyota is the main manufacturer of HEVs, with its Prius model being the best-selling car in this category.
� By 2012 the number of electric and hybrid electric vehicles could exceed 2 million units.
• Some estimates indicate that the first HEVs using lithium-ion batteries will be available for sale by the end of 2009.
• This application has significant potential for the lithium market. A battery for a hybrid or electric vehicle should contain between 1 and 5 kilograms of lithium-carbonate equivalent.
• By 2018, batteries for hybrid and electric vehicles could account for between 10% and 15% of total demand.

33
• SQM is the main producer of lithium, with an estimated marke tshare of approximately 30% for 2008.
Supply: Market Share
FMC17%
Chemetall28%
Others1%
China24%
SQM30%
Market Share 2008*
Total Market: 95,400 MT
* SQM estimates for 2008

34
80
100
120
140
160
180
2008
E
2009
E20
10E
2011
E20
12E
2013
E
2014
E20
15E
2016
E20
17E
2018
E
0%
10%
20%
30%
40%
50%
60%
70%
80%
90%
100%
110%Demand Installed Capacity Demand/Capacity
• SQM: Capacity expansion to 40,000 MT LCE is complet e• China: New operations have been announced, but ther e is still uncertainty
regarding actual production capacities• Capacity utilization rate is expected to be over 90 % in coming years
* SQM estimates. Balance will depend on effective capacity of China
Tho
usan
ds o
f MT
Utilization
Rate
Projected Supply and Demand Balance