Embed Size (px)
Citation preview

+
LONGWOOD Noel-Levitz Student Satisfaction Inventory (SSI) 2013
Overview of Results Onie McKenzie Assistant Vice President for Student Affairs November 2013

+ SSI Administration at LU
Administered in Spring 2013 to 4,528 enrolled LU students via unique email invitation with link to web-based survey extensive social media marketing and multiple follow-
ups with six incentive prizes of $50 Lancer Ca$h offered
A total of 792 LU students responded yielding an 18% response rate
Possible influences on low response rate: 567 emails were kicked back immediately Multiple competing surveys have contributed to
mounting student survey fatigue

LU & National Respondent Demographics Based on 792 LU and 97,084 student respondents from 93 Four-Year Public Institutions
Gender LU 4-Yr Publics
Female (628) 79.29% 62%
Male (164) 20.71% 38%
Age
< 18 (75) 9.46% 12%
19 – 24 (655) 82.60% 62%
25 - 34 (35) 4.41% 15%
35 - 44 (15) 1.89% 6%
> 45 (13) 1.64% 5%
Class Level
LU 4-Yr Publics
FR (136) 17.30% 23%
SO (167) 21.25% 18%
JR (215) 27.35% 23%
SR (200) 25.45% 26%
Grad/Prof
(57) 7.25% 8%

LU & National Respondent Demographics Based on 792 LU and 97,084 student respondents from 93 Four-Year Public Institutions
Ethnicity/ Race
LU 4-Yr Publics
African-American
(51) 6.44% 16%
American Indian
(4) 0.51% 1%
Asian (19) 2.40% 6%
Caucasian (661) 83.46% 61%
Hispanic (14) 1.77% 8%
Other race (17) 2.15% 4%
Prefer not to Respond
(26) 3.28% 4%
Self-reported descriptor:
LU
Varsity Athlete (33) 0.4%
Student with a disability (52) 6.65%
Undeclared/Undecided (23) 2.98%
CCCAS (435) 56.35%
CBE (88) 11.40%
CEHS (190) 24.61%
CGPS (36) 4.66%

LU & National Respondent Demographics Based on 792 LU and 97,084 student respondents from 93 Four-Year Public Institutions
GPA LU 4-Yr Publics
2.49 or below
(107) 13.56% 10%
2.5 – 2.99 (216) 27.38% 20%
30 – 3.49 (257) 32.57% 32%
3.50 or above
(202) 26.60% 32%
Institution was…
LU 4-Yr Publics
First Choice
(536) 67.85% 62%
Second Choice
(185) 23.42% 26%
Third Choice or lower
(69) 8.73% 12%

70 items across 12 Scales
Academic Advising
Instructional Effectiveness
Safety and Security
Student Centeredness
Campus Climate
Concern for Individual
Service Excellence
Campus Support Services
Campus Life Responsiveness
to Diverse Populations
Registration Effectiveness
Recruitment and Financial Aid

Prompts and Scales used on the SSI
1=not important at all 4=neutral 7=very important
1=not satisfied at all 4=neutral 7=very satisfied

Which scales did LU students rate as most important?
Academic Advising
Instructional Effectiveness
Safety and Security
Student Centeredness
Campus Climate
Concern for Individual
Service Excellence
Campus Support Services
Campus Life Responsiveness
to Diverse Populations
Registration Effectiveness
Recruitment and Financial Aid
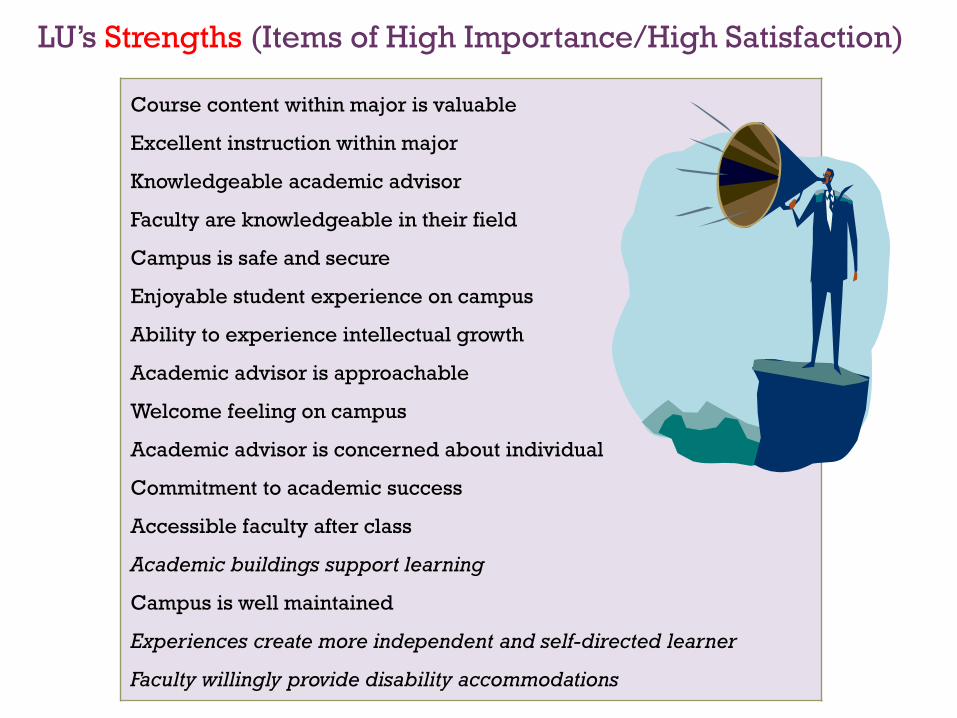
LU’s Strengths (Items of High Importance/High Satisfaction)
Course content within major is valuable
Excellent instruction within major
Knowledgeable academic advisor
Faculty are knowledgeable in their field
Campus is safe and secure
Enjoyable student experience on campus
Ability to experience intellectual growth
Academic advisor is approachable
Welcome feeling on campus
Academic advisor is concerned about individual
Commitment to academic success
Accessible faculty after class
Academic buildings support learning
Campus is well maintained
Experiences create more independent and self-directed learner
Faculty willingly provide disability accommodations

LU’s Challenges (Items of High Importance/Low Satisfaction)
Excellent instruction in majority of classes
Ability to register for needed course with few conflicts
Major requirements are clear and reasonable
Tuition is a worthwhile investment
Faculty are fair and unbiased to the individual
Timely feedback from faculty on progress
Living in residence hall is comfortable
Adequate financial aid provided
Adequate food selection in dining hall
Adequate housing options provided
Seldom get the “run around”
Faculty consider differences when teaching
Adequate amount of student parking

LU Student Priorities (LU Importance Rating Exceeded 4-Yr Publics)
Course content within major is valuable Faculty are unbiased and fair to the individual
Excellent instruction within major Timely feedback from faculty on progress
Knowledgeable academic advisor Campus staff are caring and helpful
Faculty are knowledgeable in their field Commitment to academic excellence
Excellent instruction in most classes Flexible faculty hours
Ability to register for needed courses Comfortable living in residence halls
Major requirements are clear and reasonable Campus is well maintained
Campus is safe and secure Faculty care for the individual
Enjoyable student experience on campus Adequate career services
Tuition is a worthwhile investment Sense of belonging
Quick response by security staff Adequate food selection in dining hall
Ability to experience intellectual growth Seldom get the “run around”
Academic advisor is approachable Adequate academic support services
Welcome feeling on campus Faculty consider differences when teaching
Advisor is concerned about individual success Course placement procedures are reasonable
Institution shows concern for individual Student disciplinary procedures are fair
Good variety of course offerings Freedom of expression is protected

LU Satisfaction Scores exceeded 4-Yr Publics
Course content within major is valuable Faculty are unbiased and fair to the individual
Excellent instruction within major Timely feedback from faculty on progress
Knowledgeable academic advisor Campus staff are caring and helpful
Faculty are knowledgeable in their field Commitment to academic excellence
Excellent instruction in most of classes Accessible faculty after class
Ability to register for needed courses Comfortable living in residence halls
Major requirements are clear and reasonable Campus is well maintained
Campus is safe and secure Faculty care for the individual
Enjoyable student experience on campus Adequate career services
Quick response by security staff Sense of belonging
Ability to experience intellectual growth Seldom get the “run around”
Academic advisor is approachable Adequate academic support services
Welcome feeling on campus Faculty consider differences when teaching
Advisor is concerned about individual success Course placement procedures are reasonable
Institution shows concern for individual Student disciplinary procedures are fair
Good variety of course offerings Freedom of expression is protected

4-Yr Public Satisfaction Scores exceeded LU
Adequate selection of food in cafeteria

Summary Items
LU Natn’l Group
Mean Difference
So far, how has your college experience met your expectations?
4.98 4.56 0.42
Rate your overall satisfaction with your experience here thus far.
5.69 5.26 0.43
All in all, if you had to do it over, would you enroll here again?
5.79 5.34 0.45
Averages based on a seven-point scale

Summary Items
34%
69% 72%
21%
56% 61%
College metexpectations
Overall satisfaction Would enroll again
LU Natn'l Group
Percentage who responded with highest two response options*
* Quite a bit or much better / Satisfied or Very Satisfied / Probably yes or Definitely yes

Factors in Enrollment Decisions
Academic Reputation Opportunity to play sports
Cost Recommendations from
family/friends
Size Geographic Setting
Financial Aid Personalized Attention Prior to
Enrollment
Campus Appearance
What do you think are the top three factors when LU students are making their decision to enroll?

Ranking of Enrollment Factors (Importance on a
seven-point scale) LU Rank Natn’l Rank LU Natn’l
Group
Academic Reputation 1 3 6.21 5.98
Cost 2 1 6.16 6.24
Size 3 7 6.12 5.29
Financial Aid 4 2 6.02 6.07
Campus Appearance 5 6 5.93 5.31
Personalized Attention Prior to Enrollment
6 5 5.74 5.34
Geographic Setting 7 4 5.38 5.57
Recommendations from family/friends
8 8 5.14 4.90
Opportunity to play sports
9 9 3.36 3.57

+ NUMBERS!!! (finally)
With a progressive illustration of how to read the summary tables…

Definitions
Average Scores:
Scales run 1 to 7
Calculated by summing the respondents’ ratings and dividing by the number of respondents
Scale score is not the average of the averages
Performance Gap (PGap):
The difference between the importance and satisfaction scores
The larger the PGap, the greater the discrepancy between what students expect and their current level of satisfaction
The smaller the PGap, the better students’ expectations are being met

Definitions
Mean Difference:
Difference in LU’s and the comparison group satisfaction means
If the mean difference is POSITIVE, then our students are MORE satisfied than their counterparts in the national four-year comparison group
If the mean difference is NEGATIVE, then our students are LESS satisfied than their counterparts in the national four-year comparison group
Statistical Significance:
*: Difference statistically significant at the .05 level
**: Difference statistically significant at the .01 level
***: Difference statistically significant at the .001 level
If there are no asterisks, then the level of satisfaction between the two groups is basically the same

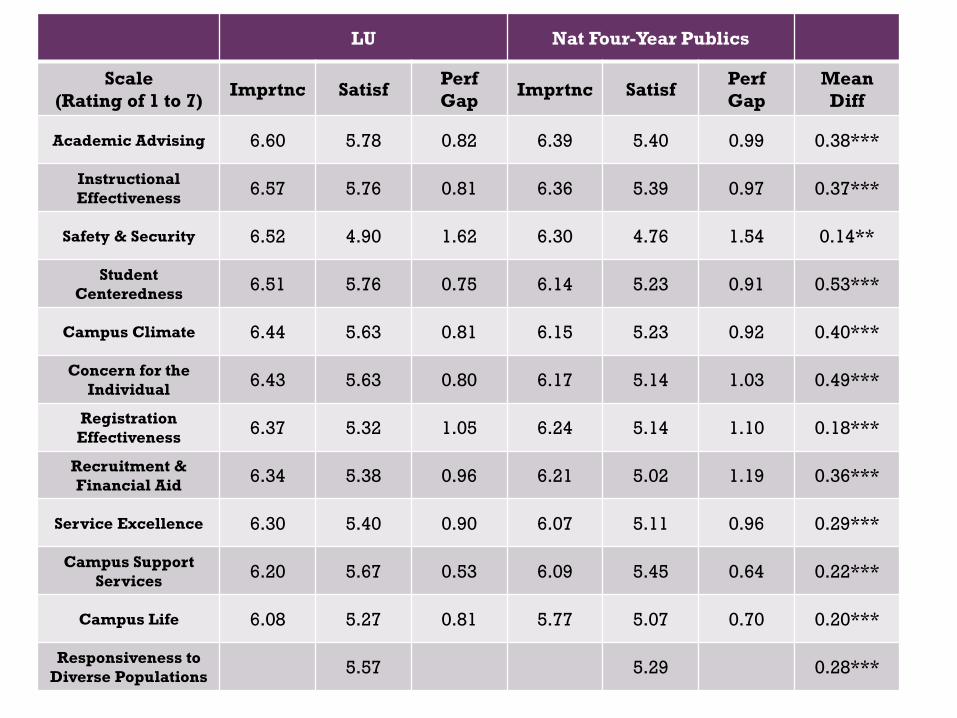
LU Nat Four-Year Publics
Scale (Rating of 1 to 7) Imprtnc Satisf Perf
Gap Imprtnc Satisf Perf Gap
Mean Diff
Academic Advising 6.60 5.78 0.82 6.39 5.40 0.99 0.38***
Instructional Effectiveness 6.57 5.76 0.81 6.36 5.39 0.97 0.37***
Safety & Security 6.52 4.90 1.62 6.30 4.76 1.54 0.14**
Student Centeredness 6.51 5.76 0.75 6.14 5.23 0.91 0.53***
Campus Climate 6.44 5.63 0.81 6.15 5.23 0.92 0.40***
Concern for the Individual 6.43 5.63 0.80 6.17 5.14 1.03 0.49***
Registration Effectiveness 6.37 5.32 1.05 6.24 5.14 1.10 0.18***
Recruitment & Financial Aid 6.34 5.38 0.96 6.21 5.02 1.19 0.36***
Service Excellence 6.30 5.40 0.90 6.07 5.11 0.96 0.29***
Campus Support Services 6.20 5.67 0.53 6.09 5.45 0.64 0.22***
Campus Life 6.08 5.27 0.81 5.77 5.07 0.70 0.20***
Responsiveness to Diverse Populations 5.57 5.29 0.28***
LU Nat Four-Year Publics
Scale (Rating of 1 to 7) Imprtnc Satisf Perf
Gap Imprtnc Satisf Perf Gap
Mean Diff
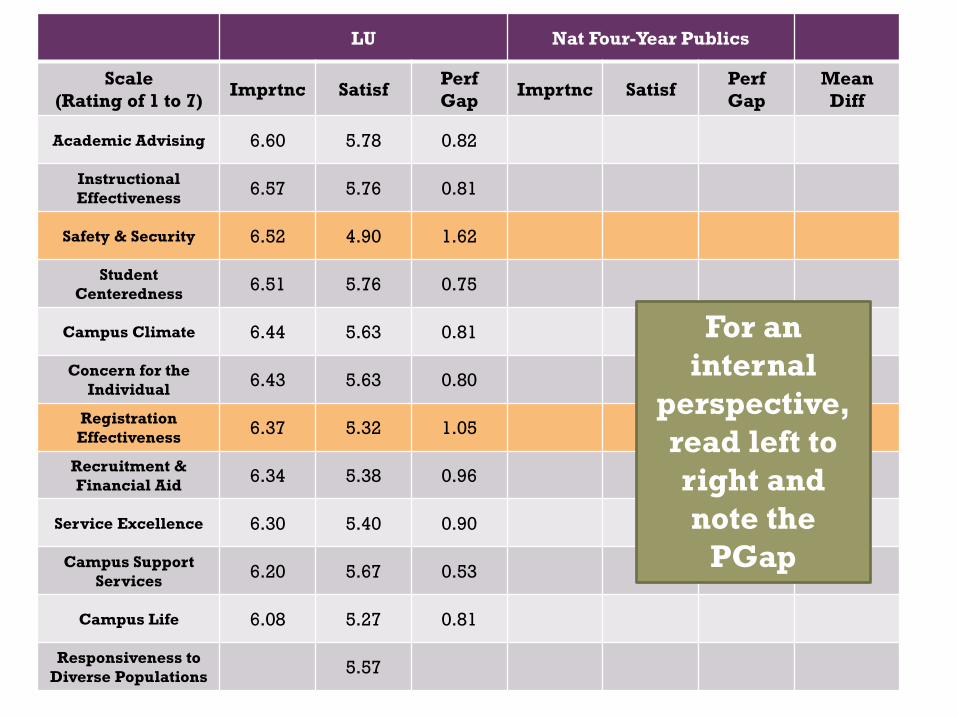
Academic Advising 6.60 5.78 0.82
Instructional Effectiveness 6.57 5.76 0.81
Safety & Security 6.52 4.90 1.62
Student Centeredness 6.51 5.76 0.75
Campus Climate 6.44 5.63 0.81
Concern for the Individual 6.43 5.63 0.80
Registration Effectiveness 6.37 5.32 1.05
Recruitment & Financial Aid 6.34 5.38 0.96
Service Excellence 6.30 5.40 0.90
Campus Support Services 6.20 5.67 0.53
Campus Life 6.08 5.27 0.81
Responsiveness to Diverse Populations 5.57
For an internal
perspective, read left to right and note the
PGap
LU Nat Four-Year Publics
Scale (Rating of 1 to 7) Imprtnc Satisf Perf
Gap Imprtnc Satisf Perf Gap
Mean Diff
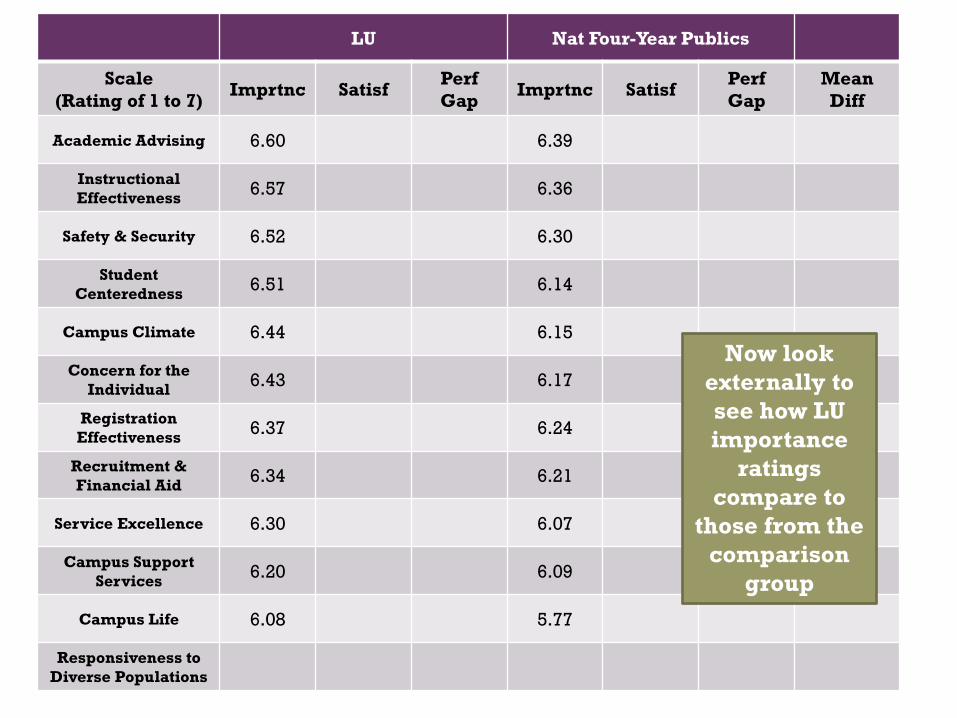
Academic Advising 6.60 6.39
Instructional Effectiveness 6.57 6.36
Safety & Security 6.52 6.30
Student Centeredness 6.51 6.14
Campus Climate 6.44 6.15
Concern for the Individual 6.43 6.17
Registration Effectiveness 6.37 6.24
Recruitment & Financial Aid 6.34 6.21
Service Excellence 6.30 6.07
Campus Support Services 6.20 6.09
Campus Life 6.08 5.77
Responsiveness to Diverse Populations
Now look externally to see how LU importance
ratings compare to
those from the comparison
group

LU Nat Four-Year Publics
Scale (Rating of 1 to 7) Imprtnc Satisf Perf
Gap Imprtnc Satisf Perf Gap
Mean Diff
Academic Advising 5.78 5.40 0.38***
Instructional Effectiveness 5.76 5.39 0.37***
Safety & Security 4.90 4.76 0.14**
Student Centeredness 5.76 5.23 0.53***
Campus Climate 5.63 5.23 0.40***
Concern for the Individual 5.63 5.14 0.49***
Registration Effectiveness 5.32 5.14 0.18***
Recruitment & Financial Aid 5.38 5.02 0.36***
Service Excellence 5.40 5.11 0.29***
Campus Support Services 5.67 5.45 0.22***
Campus Life 5.27 5.07 0.20***
Responsiveness to Diverse Populations 5.57 5.29 0.28***
Look to the Mean
Differences for
statistically significant differences
in satisfaction
scores

LU Nat Four-Year Publics
Scale (Rating of 1 to 7) Imprtnc Satisf Perf
Gap Imprtnc Satisf Perf Gap
Mean Diff
Academic Advising 0.82 0.99
Instructional Effectiveness 0.81 0.97
Safety & Security 1.62 1.54
Student Centeredness 0.75 0.91
Campus Climate 0.81 0.92
Concern for the Individual 0.80 1.03
Registration Effectiveness 1.05 1.10
Recruitment & Financial Aid 0.96 1.19
Service Excellence 0.90 0.96
Campus Support Services 0.53 0.64
Campus Life 0.81 0.70
Responsiveness to Diverse Populations
Compare Performance
Gaps seeking a
lower score
LU Nat Four-Year Publics
Scale (Rating of 1 to 7) Imprtnc Satisf Perf
Gap Imprtnc Satisf Perf Gap
Mean Diff
Academic Advising 6.60 5.78 0.82 6.39 5.40 0.99 0.38***
Instructional Effectiveness 6.57 5.76 0.81 6.36 5.39 0.97 0.37***
Safety & Security 6.52 4.90 1.62 6.30 4.76 1.54 0.14**
Student Centeredness 6.51 5.76 0.75 6.14 5.23 0.91 0.53***
Campus Climate 6.44 5.63 0.81 6.15 5.23 0.92 0.40***
Concern for the Individual 6.43 5.63 0.80 6.17 5.14 1.03 0.49***
Registration Effectiveness 6.37 5.32 1.05 6.24 5.14 1.10 0.18***
Recruitment & Financial Aid 6.34 5.38 0.96 6.21 5.02 1.19 0.36***
Service Excellence 6.30 5.40 0.90 6.07 5.11 0.96 0.29***
Campus Support Services 6.20 5.67 0.53 6.09 5.45 0.64 0.22***
Campus Life 6.08 5.27 0.81 5.77 5.07 0.70 0.20***
Responsiveness to Diverse Populations 5.57 5.29 0.28***
+
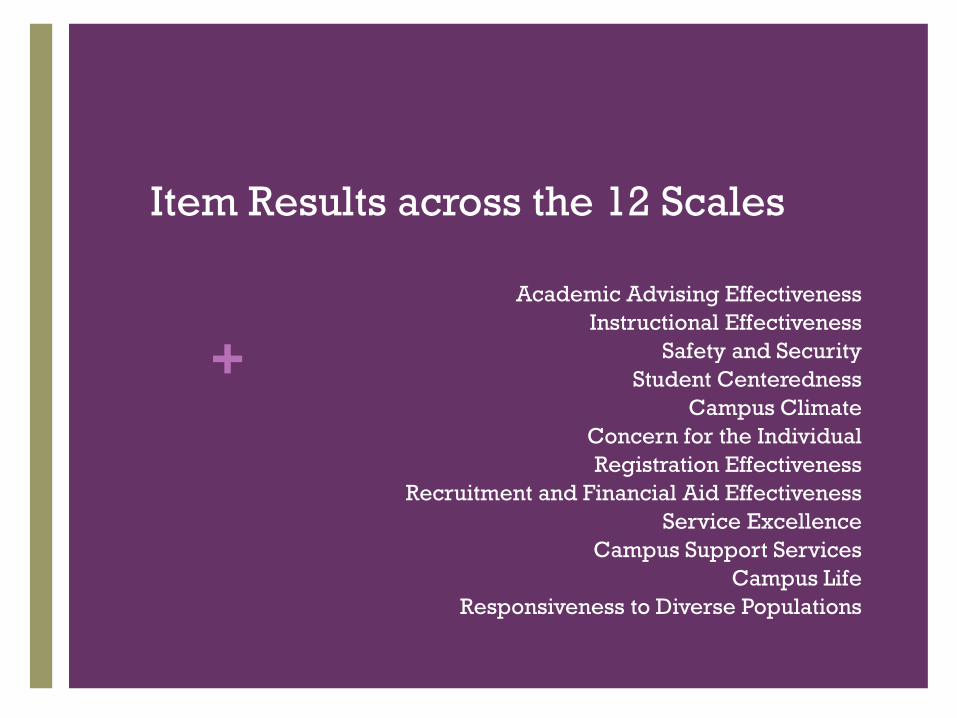
Item Results across the 12 Scales
Academic Advising Effectiveness Instructional Effectiveness
Safety and Security Student Centeredness
Campus Climate Concern for the Individual Registration Effectiveness
Recruitment and Financial Aid Effectiveness Service Excellence
Campus Support Services Campus Life
Responsiveness to Diverse Populations

LU Nat Four-Year Publics
Scale (Rating of 1 to 7) Imprtnc Satisf Perf
Gap Imprtnc Satisf Perf Gap
Mean Diff
ACADEMIC ADVISING 6.60 5.78 0.82 6.39 5.40 0.99 0.38***
Advisor is approachable 6.64 5.93 0.71 6.46 5.54 0.92 0.39***
My academic advisor is concerned about my success as an individual
6.60 5.87 0.73 6.33 5.31 1.02 0.56***
My academic advisor helps me set goals to work toward
6.33 5.47 0.86 6.14 5.05 1.09 0.42***
My academic advisor is knowledgeable about requirements in my major
6.73 5.95 0.78 6.54 5.61 0.93 0.34***
Major requirements are clear and reasonable
6.68 5.70 0.98 6.46 5.47 0.99 0.23***

LU Nat Four-Year Publics
Scale (Rating of 1 to 7) Imprtnc Satisf Perf
Gap Imprtnc Satisf Perf Gap
Mean Diff
INSTRUCTIONAL EFFECTIVENESS (1 of 2) 6.57 5.76 0.81 6.36 5.39 0.97 0.37***
Faculty care about individuals 6.47 5.80 0.67 6.12 5.10 1.02 0.70***
Content of courses within major is valuable
6.75 5.96 0.79 6.57 5.54 1.03 0.42***
Instruction in my major excellent 6.74 5.95 0.79 6.55 5.51 1.04 0.44***
Faculty are fair and unbiased in treatment of individual students
6.58 5.53 1.05 6.39 5.28 1.11 0.25***
Able to experience intellectual growth here
6.64 5.99 0.65 6.42 5.60 0.82 0.39***
Commitment to academic excellence on campus
6.55 5.94 0.61 6.34 5.40 0.94 0.54***
Faculty provide timely feedback about progress in a course
6.57 5.25 1.32 6.36 5.11 1.25 0.14*
Faculty take into consideration differences as they teach course
6.39 5.31 1.08 6.16 5.01 1.15 0.30***
The quality of instruction is excellent
6.72 5.80 0.92 6.51 5.40 1.11 0.40***
Adjunct faculty are competent as classroom instructors
6.34 5.65 0.69 6.19 5.34 0.85 0.31***

LU Nat Four-Year Publics
Scale (Rating of 1 to 7) Imprtnc Satisf Perf
Gap Imprtnc Satisf Perf Gap
Mean Diff
INSTRUCTIONAL EFFECTIVENESS (2 of 2) 6.57 5.76 0.81 6.36 5.39 0.97 0.37***
Faculty are usually available after class and during office hours
6.55 5.97 0.58 6.34 5.65 0.69 0.32***
Nearly all of the faculty are knowledgeable in their field
6.73 6.09 0.64 6.53 5.74 0.79 0.35***
There is a good variety of courses provided
6.59 5.76 0.83 6.43 5.48 0.95 0.28***
Graduate teaching assistants are competent as classroom instructors
6.15 5.39 0.76 6.16 5.19 0.97 0.20**

LU Nat Four-Year Publics
Scale (Rating of 1 to 7) Imprtnc Satisf Perf
Gap Imprtnc Satisf Perf Gap
Mean Diff
SAFETY AND SECURITY 6.52 4.90 1.62 6.30 4.76 1.54 0.14**
The campus is safe and secure for all students
6.68 5.89 0.79 6.46 5.50 0.96 0.39***
The amount of student parking space on campus is adequate
6.37 3.26 3.11 6.20 3.40 2.80 -0.14
Parking lots are well-lighted and secure
6.36 4.76 1.60 6.18 5.02 1.16 -0.26***
Security staff respond quickly in emergencies
6.65 5.84 0.81 6.36 5.23 1.13 0.61***

LU Nat Four-Year Publics
Scale (Rating of 1 to 7) Imprtnc Satisf Perf
Gap Imprtnc Satisf Perf Gap
Mean Diff
STUDENT CENTEREDNESS 6.51 5.76 0.75 6.14 5.23 0.91 0.53***
Most students feel a sense of belonging here
6.41 5.57 0.84 5.76 5.13 0.63 0.44***
The campus staff are caring and helpful
6.56 5.79 0.77 6.29 5.25 1.04 0.54***
Administrators are approachable to students
6.23 5.56 0.67 5.96 5.07 0.89 0.49***
It is an enjoyable experience to be a student on this campus
6.66 5.91 0.75 6.34 5.37 0.97 0.54***
Students are made to feel welcome on this campus
6.61 5.95 0.66 6.24 5.44 0.80 0.51***
This institution shows concern for students as individuals
6.60 5.76 0.84 6.29 5.12 1.17 0.64***

LU Nat Four-Year Publics
Scale (Rating of 1 to 7) Imprtnc Satisf Perf
Gap Imprtnc Satisf Perf Gap
Mean Diff
CAMPUS CLIMATE (1 of 2) 6.44 5.63 0.81 6.15 5.23 0.92 0.40***
Sense of belonging 6.41 5.57 0.84 5.76 5.13 0.63 0.44***
Staff are caring and helpful 6.56 5.79 0.77 6.29 5.25 1.04 0.54***
Faculty care about the individual 6.47 5.80 0.67 6.12 5.10 1.02 0.70***
Campus is safe and secure 6.68 5.89 0.79 6.46 5.50 0.96 0.39***
Administrators are approachable 6.23 5.56 0.67 5.96 5.07 0.89 0.49***
Being on campus is enjoyable 6.66 5.91 0.75 6.34 5.37 0.97 0.54***
Sense of pride about campus 6.31 5.86 0.45 5.86 5.22 0.64 0.64***
Commitment to academic excellence
6.55 5.94 0.61 6.34 5.40 0.94 0.54***
Students feel welcome 6.61 5.95 0.66 6.24 5.44 0.80 0.51***
Good reputation in community 6.34 5.79 0.55 6.21 5.57 0.64 0.22***
Seldom get the “run-around” 6.41 4.93 1.48 6.22 4.62 1.60 0.31***

LU Nat Four-Year Publics
Scale (Rating of 1 to 7) Imprtnc Satisf Perf
Gap Imprtnc Satisf Perf Gap
Mean Diff
CAMPUS CLIMATE (2 of 2) 6.44 5.63 0.81 6.15 5.23 0.92 0.40***
Concern shown for individuals 6.60 5.76 0.84 6.29 5.12 1.17 0.64***
Generally know what’s happening on campus
6.24 5.53 0.71 5.82 5.01 0.81 0.52***
Strong commitment to racial harmony on campus
6.12 5.50 0.62 5.99 5.47 0.52 0.03
Tuition is worthwhile investment 6.66 5.21 1.45 6.47 5.19 1.28 0.02
Freedom of expression is protected on campus
6.38 5.61 0.77 6.15 5.50 0.65 0.11*
Channels for expressing student complaints are readily available
6.27 5.06 1.21 6.07 4.80 1.27 0.26***

LU Nat Four-Year Publics
Scale (Rating of 1 to 7) Imprtnc Satisf Perf
Gap Imprtnc Satisf Perf Gap
Mean Diff
CONCERN FOR INDIVIDUAL 6.43 5.63 0.80 6.17 5.14 1.03 0.49***
Faculty care about individuals 6.47 5.80 0.67 6.12 5.10 1.02 0.70***
Academic advisor concerned about success as an individual
6.60 5.87 0.73 6.33 5.31 1.02 0.56***
Counseling staff care about students as individuals
6.26 5.54 0.72 6.05 5.07 0.98 0.47***
Faculty are fair and unbiased in treatment of individual students
6.58 5.53 1.05 6.39 5.28 1.11 0.25***
Residence hall staff are concerned about individuals
6.01 5.19 0.82 5.62 4.84 0.78 0.35***
Institution shows concern for students as individuals
6.60 5.76 0.84 6.29 5.12 1.17 0.64***

LU Nat Four-Year Publics
Scale (Rating of 1 to 7) Imprtnc Satisf Perf
Gap Imprtnc Satisf Perf Gap
Mean Diff
REGISTRATION EFFECTIVENESS 6.37 5.32 1.05 6.24 5.14 1.10 0.18***
Billing policies are reasonable 6.35 5.04 1.31 6.20 4.84 1.36 0.20***
The business office is open during hours which are convenient for most students
6.09 5.29 0.80 6.00 5.22 0.78 0.07
The personnel involved in registration are helpful
6.35 5.44 0.91 6.24 5.24 1.00 0.20***
I am able to register for classes I need with few conflicts
6.71 5.17 1.54 6.55 5.02 1.53 0.15*
Class change (drop/add) policies are reasonable
6.34 5.65 0.69 6.20 5.41 0.79 0.24***

LU Nat Four-Year Publics
Scale (Rating of 1 to 7) Imprtnc Satisf Perf
Gap Imprtnc Satisf Perf Gap
Mean Diff
RECRUITMENT & FINANCIAL AID 6.34 5.38 0.96 6.21 5.02 1.19 0.36***
Admissions staff are knowledgeable
6.31 5.57 0.74 6.24 5.14 1.10 0.43***
Financial aid counselors are helpful
6.28 5.32 0.96 6.23 4.90 1.33 0.42***
Financial aid awards are announced to students in time to be helpful in college planning
6.35 5.23 1.12 6.31 4.93 1.38 0.30***
Adequate financial aid is available for most students
6.45 4.95 1.50 6.37 4.93 1.44 0.02
Admissions counselors respond to prospective students’ unique needs and requests
6.30 5.64 0.66 6.05 5.09 0.96 0.55***
Admissions counselors accurately portray the campus in their recruiting practices
6.37 5.56 0.81 6.01 5.13 0.88 0.43***

LU Nat Four-Year Publics
Scale (Rating of 1 to 7) Imprtnc Satisf Perf
Gap Imprtnc Satisf Perf Gap
Mean Diff
SERVICE EXCELLENCE 6.30 5.40 0.90 6.07 5.11 0.96 0.29***
Campus staff are caring and helpful
6.56 5.79 0.77 6.29 5.25 1.04 0.54***
Library staff are helpful and approachable
5.97 5.82 0.15 5.82 5.60 0.22 0.22***
The staff in the health services area are competent
6.33 5.00 1.33 6.04 5.25 0.79 -0.2***
Counseling staff care about students as individuals
6.26 5.54 0.72 6.05 5.07 0.98 0.47***
The personnel involved in registration are helpful
6.35 5.44 0.91 6.24 5.24 1.00 0.20***
I seldom get the “run-around” when seeking information on campus
6.41 4.93 1.48 6.22 4.62 1.60 0.31***
I generally know what’s happening on campus
6.24 5.53 0.71 5.82 5.01 0.81 0.52***
Channels for expressing student complaints are readily available
6.27 5.06 1.21 6.07 4.80 1.27 0.26***

LU Nat Four-Year Publics
Scale (Rating of 1 to 7) Imprtnc Satisf Perf
Gap Imprtnc Satisf Perf Gap
Mean Diff
CAMPUS SUPPORT SERVICES 6.20 5.67 0.53 6.09 5.45 0.64 0.22***
Library staff are helpful and approachable
6.20 5.67 0.53 6.09 5.45 0.64 0.22***
Library resources and services are adequate
6.35 5.87 0.48 6.17 5.61 0.56 0.26***
Computer labs are adequate and accessible
6.11 5.78 0.33 6.26 5.51 0.75 0.27***
Tutoring services are readily available
6.16 5.60 0.56 6.05 5.48 0.57 0.12*
Academic support services adequately meet the needs of students
6.39 5.63 0.76 6.15 5.24 0.91 0.39***
Adequate services to help decide upon a career
6.47 5.65 0.82 6.21 5.15 1.06 0.50***
Bookstore staff are helpful 5.99 5.35 0.64 5.96 5.57 0.39 -0.22***

LU Nat Four-Year Publics
Scale (Rating of 1 to 7) Imprtnc Satisf Perf
Gap Imprtnc Satisf Perf Gap
Mean Diff
CAMPUS LIFE (1 of 2) 6.08 5.27 0.81 5.77 5.07 0.70 0.20***
Variety of intramural activities 5.17 5.61 -0.44 5.03 5.20 -0.17 0.41***
Living conditions in the residence halls are comfortable (adequate space, lighting, heat, air, etc.)
6.52 4.94 1.58 5.94 4.70 1.24 0.24***
Intercollegiate athletic programs contribute to school spirit
5.50 5.08 0.42 5.35 4.87 0.48 0.21***
Residence hall staff are concerned about individuals
6.01 5.19 0.82 5.62 4.84 0.78 0.35***
Males and females have equal opportunities to participate in intercollegiate athletics
5.77 5.80 -0.03 5.62 5.43 0.19 0.37***
Adequate selection of food available in cafeteria
6.42 4.02 2.40 5.92 4.57 1.35 -0.55***
Residence hall regulations are reasonable
6.20 5.51 0.69 5.76 4.93 0.83 0.58***
Sufficient weekend activities 5.96 4.88 1.08 5.45 4.63 0.82 0.25***
Easy to get involved in campus organizations
6.23 5.80 0.43 5.84 5.32 0.52 0.48***

LU Nat Four-Year Publics
Scale (Rating of 1 to 7) Imprtnc Satisf Perf
Gap Imprtnc Satisf Perf Gap
Mean Diff
CAMPUS LIFE (2 of 2) 6.08 5.27 0.81 5.77 5.07 0.70 0.20***
Student Center is comfortable place to spend leisure time
6.05 5.35 0.70 5.89 5.36 0.53 -0.01
Student handbook provides helpful information
5.95 5.43 0.52 5.75 5.26 0.49 0.17**
Disciplinary procedures are fair 6.38 5.55 0.83 6.09 5.37 0.72 0.18**
New student orientation services help students adjust
6.32 5.48 0.84 5.95 5.21 0.74 0.27***
Freedom of expression is protected on campus
6.38 5.61 0.77 6.15 5.50 0.65 0.11*
Student activities fees are put to good use
6.35 4.85 1.50 6.16 4.64 1.52 0.21**

LU Nat Four-Year Publics
Scale (Rating of 1 to 7) Imprtnc Satisf Perf
Gap Imprtnc Satisf Perf Gap
Mean Diff
RESPONSIVENESS TO DIVERSE POPULATIONS 5.57 5.29 0.28***
Institution’s commitment to part-time students?
5.52 5.26 0.26***
Institution’s commitment to evening students?
5.46 5.25 0.21**
Institution’s commitment to older, returning learners?
5.61 5.36 0.25***
Institution’s commitment to under-represented populations?
5.29 5.31 -0.02
Institution’s commitment to commuters?
5.57 5.11 0.46***
Institution’s commitment to students with disabilities?
5.97 5.48 0.49***

LU
(Rating Scale 1 to 7) Imprtnc Satisf Perf Gap
INSTITUTIONALLY ADDED ITEMS
This university has helped me meet the goals I came here to achieve. 6.64 5.82 .82
The academic buildings adequately support a productive learning environment.
6.53 6.03 .50
There are adequate and accessible quiet places for students to study. 6.50 5.75 .75
My experiences have helped me become a more independent and self-directed learner.
6.49 6.09 .40
Faculty willingly provide appropriate accommodations to students with disabilities.
6.43 6.14 .29
Longwood provides an adequate variety of housing options. 6.42 5.39 1.03
The campus is physically accessible to individuals of all abilities. 6.36 6.03 .33
The extracurricular opportunities with which I am involved have contributed significantly to my learning at Longwood.
6.29 5.88 .41
This university has helped prepare me as a citizen leader. 6.28 5.79 .49
Campus Recreation provides comprehensive opportunities for my physical wellness.
6.25 6.19 .06

+
Comparison Group Summary Analyses To better understand the LU experience from multiple perspectives, several self-reported student subgroups were targeted. Complete reports are available and the following tables represent summary comparisons.
Students indicating a disability Varsity Athletes
Males/Females/Persons of Color Class and College Affiliation
High Achieving Students (GPA of 3.0+) Institutional Preference (LU as first choice / not first choice)

Importance Rankings across
Student Subgroups (1 of 3)
LU (792) Sts with Disabil
(52)
Persons of Color
(105)
Athletes (33)
Males (164)
Females (628)
Academic Advising 1 1 3 1 2 1
Instructional Effectiveness 2 3 1 2 1 2
Safety & Security 3 4 6 4 4 3
Student Centeredness 4 2 1 2 3 4
Campus Climate 5 5 3 5 5 5
Concern for the Individual 6 6 5 6 5 6
Registration Effectiveness 7 7 8 7 7 7
Recruitment & Financial Aid 8 10 7 8 8 8
Service Excellence 9 8 9 8 8 9
Campus Support Services 10 9 10 10 10 10
Campus Life 11 11 11 11 11 11

Importance Rankings across
Student Subgroups (2 of 3)
LU (792) CCCAS (435)
CBE (88)
CEHS (190)
CGPS (36)
LU 1st Choice
(536)
LU Not 1st Choice
(254)
Academic Advising 1 1 1 1 1 1 1
Instructional Effectiveness 2 2 4 2 2 2 2
Safety & Security 3 4 3 3 2 3 3
Student Centeredness 4 3 2 4 6 3 3
Campus Climate 5 5 5 6 8 5 5
Concern for the Individual 6 6 7 5 5 5 6
Registration Effectiveness 7 7 6 9 4 7 7
Recruitment & Financial Aid 8 8 8 7 7 8 8
Service Excellence 9 9 9 7 9 9 9
Campus Support Services 10 10 10 10 10 10 10
Campus Life 11 11 11 11 11 11 11
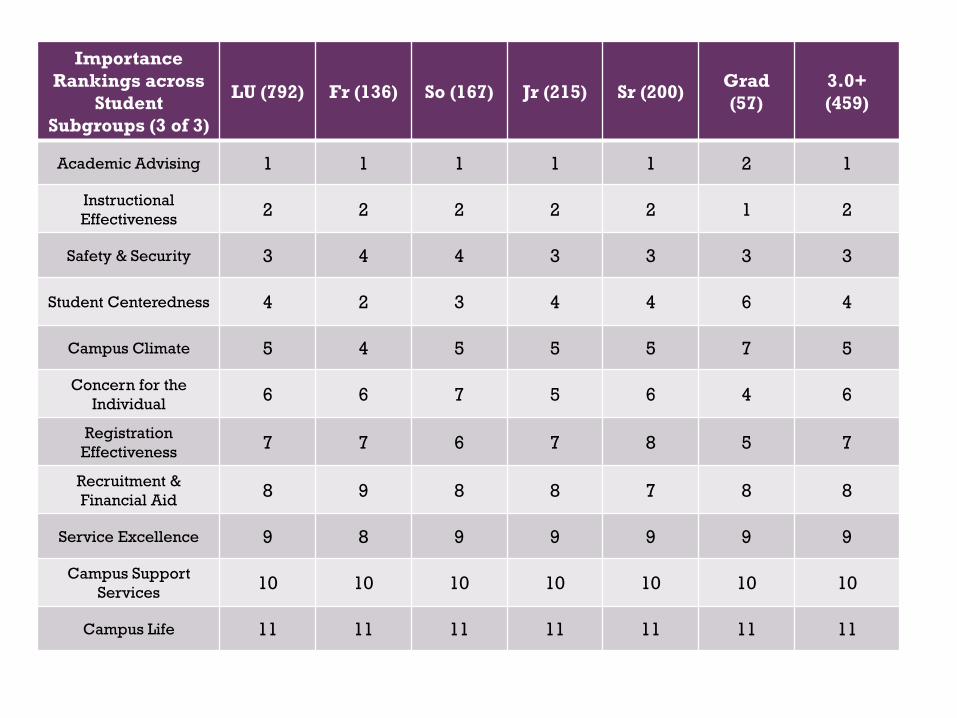
Importance Rankings across
Student Subgroups (3 of 3)
LU (792) Fr (136) So (167) Jr (215) Sr (200) Grad (57)
3.0+ (459)
Academic Advising 1 1 1 1 1 2 1
Instructional Effectiveness 2 2 2 2 2 1 2
Safety & Security 3 4 4 3 3 3 3
Student Centeredness 4 2 3 4 4 6 4
Campus Climate 5 4 5 5 5 7 5
Concern for the Individual 6 6 7 5 6 4 6
Registration Effectiveness 7 7 6 7 8 5 7
Recruitment & Financial Aid 8 9 8 8 7 8 8
Service Excellence 9 8 9 9 9 9 9
Campus Support Services 10 10 10 10 10 10 10
Campus Life 11 11 11 11 11 11 11

Performance Gaps across
Student Subgroups (1 of 3)
LU (792) Sts with Disabil
(52)
Persons of Color
(105)
Athletes (33)
Males (164)
Females (628)
Academic Advising .82 1.13 .81 .91 .58 .87
Instructional Effectiveness .81 .96 .98 .83 .84 .79
Safety & Security 1.62 1.74 1.90 1.62 1.27 1.69
Student Centeredness .75 1.12 1.09 .73 .88 .71
Campus Climate .81 1.06 1.12 .77 .88 .78
Concern for the Individual .80 1.15 1.01 .87 .71 .82
Registration Effectiveness 1.05 1.40 1.15 .92 1.00 1.06
Recruitment & Financial Aid .96 1.09 1.20 .82 .92 .97
Service Excellence .90 1.13 1.05 .77 .78 .93
Campus Support Services .53 .78 .78 .52 .53 .52
Campus Life .81 .94 1.13 1.08 .88 .79
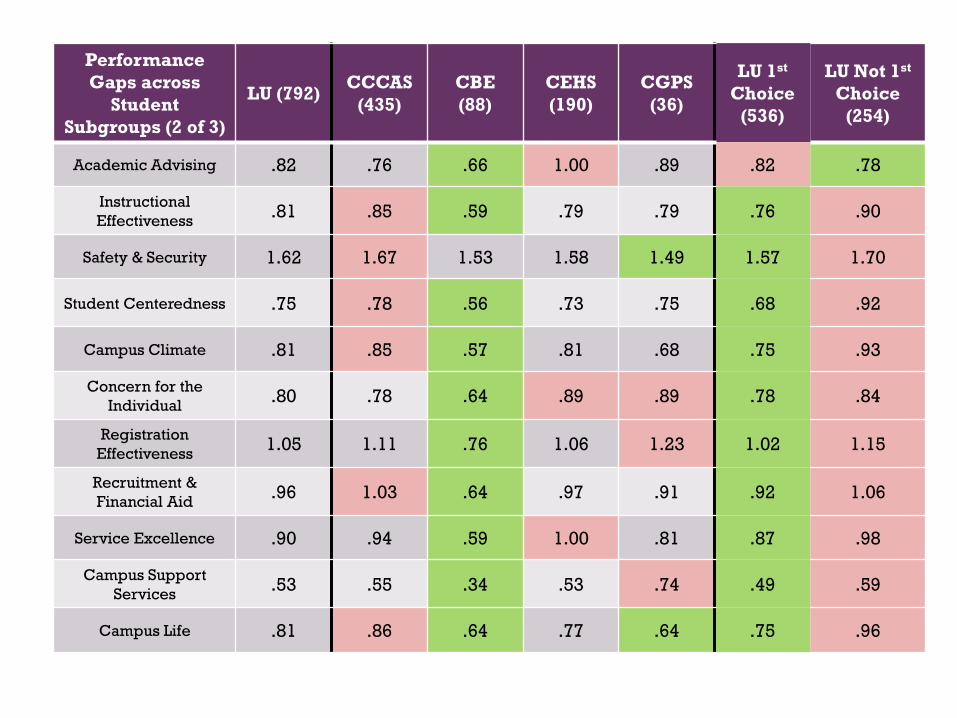
Performance Gaps across
Student Subgroups (2 of 3)
LU (792) CCCAS (435)
CBE (88)
CEHS (190)
CGPS (36)
LU 1st Choice
(536)
LU Not 1st Choice
(254)
Academic Advising .82 .76 .66 1.00 .89 .82 .78
Instructional Effectiveness .81 .85 .59 .79 .79 .76 .90
Safety & Security 1.62 1.67 1.53 1.58 1.49 1.57 1.70
Student Centeredness .75 .78 .56 .73 .75 .68 .92
Campus Climate .81 .85 .57 .81 .68 .75 .93
Concern for the Individual .80 .78 .64 .89 .89 .78 .84
Registration Effectiveness 1.05 1.11 .76 1.06 1.23 1.02 1.15
Recruitment & Financial Aid .96 1.03 .64 .97 .91 .92 1.06
Service Excellence .90 .94 .59 1.00 .81 .87 .98
Campus Support Services .53 .55 .34 .53 .74 .49 .59
Campus Life .81 .86 .64 .77 .64 .75 .96

Performance Gaps across
Student Subgroups (3 of 3)
LU (792) Fr (136) So (167) Jr (215) Sr (200) Grad (57)
3.0+ (459)
Academic Advising .82 .72 .90 .78 .86 .75 .81
Instructional Effectiveness .81 .74 .84 .78 .86 .69 .76
Safety & Security 1.62 1.35 1.58 1.71 1.75 1.44 1.58
Student Centeredness .75 .72 .78 .74 .79 .60 .66
Campus Climate .81 .72 .85 .78 .89 .63 .73
Concern for the Individual .80 .75 .88 .74 .87 .66 .72
Registration Effectiveness 1.05 .87 1.13 1.04 1.18 1.07 1.04
Recruitment & Financial Aid .96 .72 1.07 .99 1.05 .79 .94
Service Excellence .90 .73 1.00 .89 1.01 .75 .87
Campus Support Services .53 .41 .59 .48 .61 .54 .47
Campus Life .81 .81 .93 .75 .85 .42 .74

Summary Items (1 of 3)
LU (792)
Sts with Disabil
(52)
Persons of Color
(105)
Athletes (33)
Males (164)
Females (628)
How college has met students’ expectations
4.98 4.77 4.90 4.55 4.74 5.05
Overall satisfaction with experience
5.69 5.20 5.54 5.38 5.28 5.81
Would student enroll again 5.79 5.29 5.58 5.27 5.26 5.93
Each average based on a seven-point scale

Summary Item (2 of 3) LU (792) Fr (136) So (167) Jr (215) Sr (200) Grad
(57) 3.0+ (459)
How college has met students’ expectations
4.98 4.93 5.05 5.03 4.93 5.14 5.09
Overall satisfaction with experience
5.69 5.55 5.80 5.71 5.74 5.71 5.85
Would student enroll again 5.79 5.84 5.95 5.78 5.66 5.98 5.91
Each average based on a seven-point scale

Summary Items (3 of 3) LU (792) CCCAS
(435) CBE (88) CEHS (190)
CGPS (36)
LU 1st Choice
(536)
LU Not 1st Choice
(254)
How college has met students’ expectations
4.98 5.07 4.82 4.95 4.64 5.06 4.83
Overall satisfaction with experience
5.69 5.73 5.53 5.82 5.33 5.82 5.43
Would student enroll again 5.79 5.79 5.46 6.05 5.69 6.02 5.33
Each average based on a seven-point scale

Summary Items
34%
69% 72%
30%
46%
61%
33%
66% 62%
15%
55%
63%
24%
57% 60%
37%
73% 76%
College met expectations Overall satisfaction Would enroll again
LU Sts w Disabil Persons of Color Athletes Males Females
Percentage who responded with highest two response options*
* Quite a bit or much better / Satisfied or Very Satisfied / Probably yes or Definitely yes

Summary Items
34%
69% 72%
39%
69% 73%
27%
66% 62%
31%
74% 77%
27%
63% 71%
College met expectations Overall satisfaction Would enroll again
LU CCCAS CBE CEHS CGPS
Percentage who responded with highest two response options*
* Quite a bit or much better / Satisfied or Very Satisfied / Probably yes or Definitely yes

Summary Items
34%
69% 72%
33%
66% 72%
35%
73% 75%
34%
70% 72%
35%
70% 72%
43%
69% 76%
College met expectations Overall satisfaction Would enroll again
LU Fr So Jr SR Grad
Percentage who responded with highest two response options*
* Quite a bit or much better / Satisfied or Very Satisfied / Probably yes or Definitely yes

Summary Items
34%
69% 72%
36%
74% 78%
32%
60% 62%
38%
77% 76%
College met expectations Overall satisfaction Would enroll again
LU LU first choice LU not first choice High Achievers
Percentage who responded with highest two response options*
* Quite a bit or much better / Satisfied or Very Satisfied / Probably yes or Definitely yes
+ For more information and additional LU SSI 2013 Reports…
Onie McKenzie
Assistant Vice President for Student Affairs
Longwood University
(434) 395-2487
The Student Affairs Assessment and Evaluation website:
http://www.longwood.edu/studentaffairs/12395.htm
The Noel-Levitz Student Satisfaction Inventory website:
https://www.noellevitz.com/student-retention-solutions/satisfaction-priorities-assessments/student-satisfaction-inventory


