Embed Size (px)
Citation preview
ANNUAL REPORT
2014
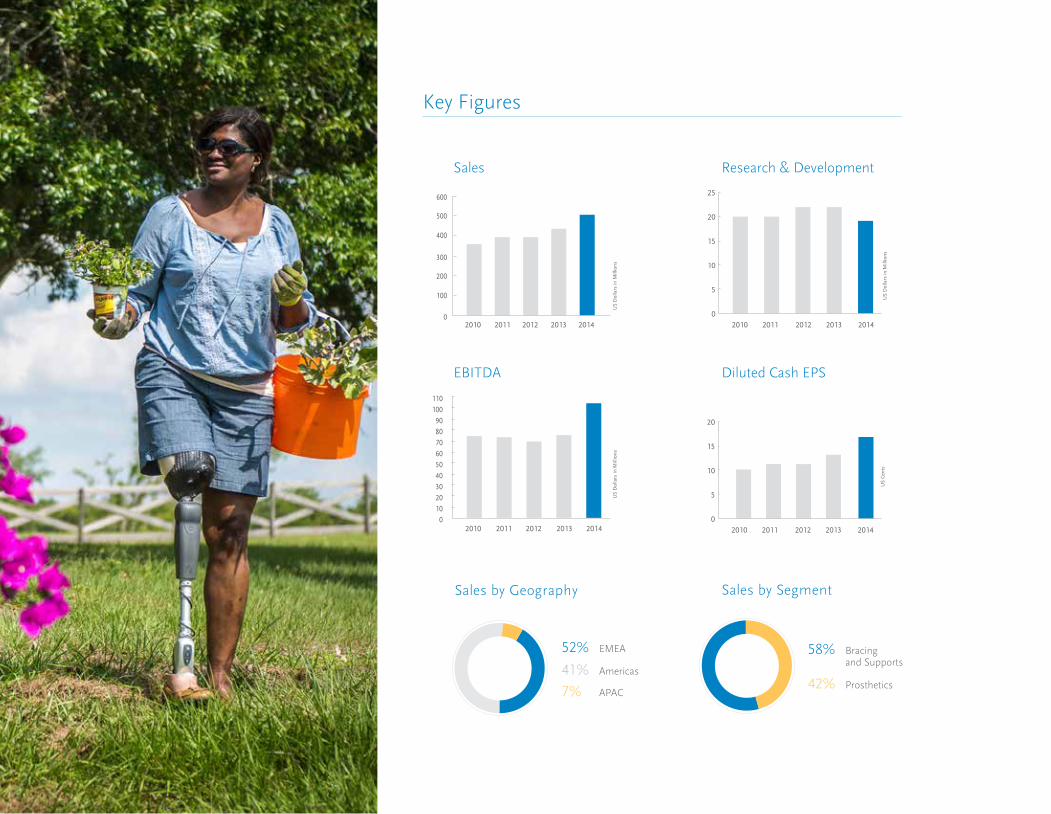
Sales by Geography Sales by Segment
EBITDA
US
Dol
lars
in M
illio
nsU
S D
olla
rs in
Mill
ions
Sales
US
Dol
lars
in M
illio
ns
Research & Development
Diluted Cash EPS
US
Cen
ts
58%
42%
Bracing and Supports
Prosthetics
52%
41%
7%
EMEA
Americas
APAC
0
100
200
300
400
500
600
2010 2011 2012 2013 2014
0102030405060708090
100110
2010 2011 2012 2013 2014
0
5
10
15
20
25
2010 2011 2012 2013 2014
0
5
10
15
20
2010 2011 2012 2013 2014
Key Figures
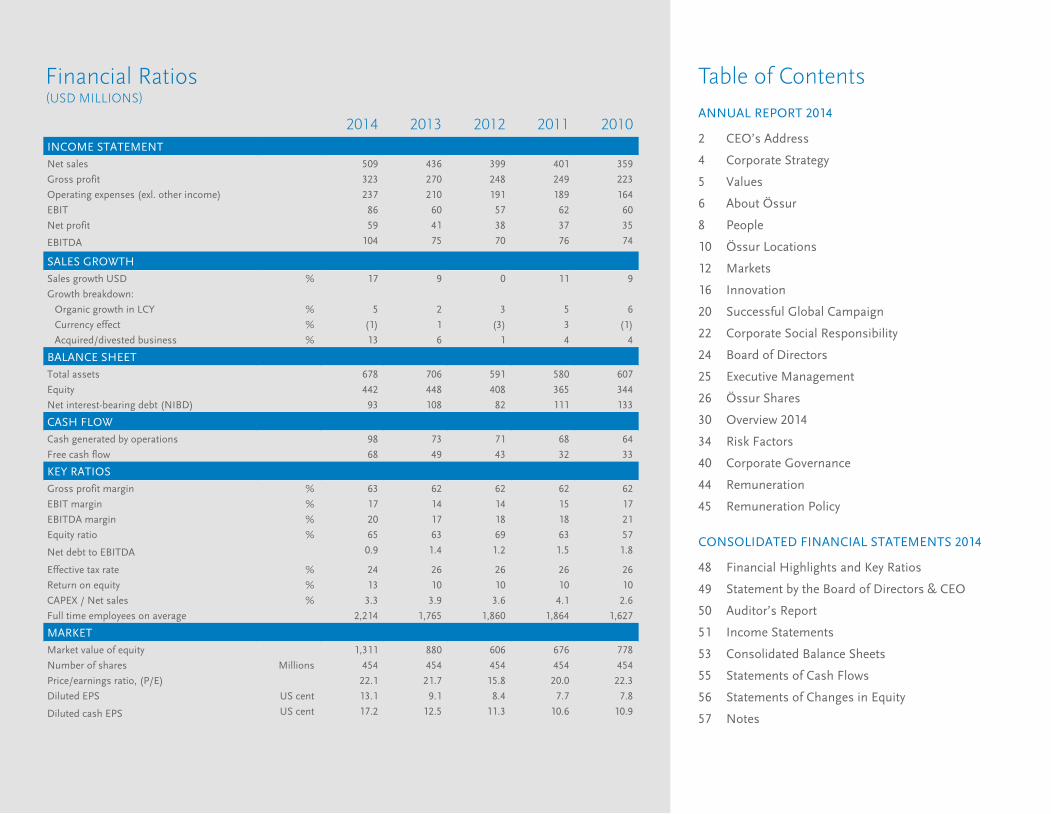
Table of Contents
ANNUAL REPORT 2014
2 CEO’s Address
4 Corporate Strategy
5 Values
6 About Össur
8 People
10 Össur Locations
12 Markets
16 Innovation
20 Successful Global Campaign
22 Corporate Social Responsibility
24 Board of Directors
25 Executive Management
26 Össur Shares
30 Overview 2014
34 Risk Factors
40 Corporate Governance
44 Remuneration
45 Remuneration Policy
CONSOLIDATED FINANCIAL STATEMENTS 2014
48 Financial Highlights and Key Ratios
49 Statement by the Board of Directors & CEO
50 Auditor’s Report
51 Income Statements
53 Consolidated Balance Sheets
55 Statements of Cash Flows
56 Statements of Changes in Equity
57 Notes
Financial Ratios (USD MILLIONS)
2014 2013 2012 2011 2010INCOME STATEMENTNet sales 509 436 399 401 359
Gross profit 323 270 248 249 223
Operating expenses (exl. other income) 237 210 191 189 164
EBIT 86 60 57 62 60
Net profit 59 41 38 37 35
EBITDA 104 75 70 76 74
SALES GROWTHSales growth USD % 17 9 0 11 9
Growth breakdown:
Organic growth in LCY % 5 2 3 5 6
Currency effect % (1) 1 (3) 3 (1)
Acquired/divested business % 13 6 1 4 4
BALANCE SHEETTotal assets 678 706 591 580 607
Equity 442 448 408 365 344
Net interest-bearing debt (NIBD) 93 108 82 111 133
CASH FLOWCash generated by operations 98 73 71 68 64
Free cash flow 68 49 43 32 33
KEY RATIOSGross profit margin % 63 62 62 62 62
EBIT margin % 17 14 14 15 17
EBITDA margin % 20 17 18 18 21
Equity ratio % 65 63 69 63 57
Net debt to EBITDA 0.9 1.4 1.2 1.5 1.8
Effective tax rate % 24 26 26 26 26
Return on equity % 13 10 10 10 10
CAPEX / Net sales % 3.3 3.9 3.6 4.1 2.6
Full time employees on average 2,214 1,765 1,860 1,864 1,627
MARKETMarket value of equity 1,311 880 606 676 778
Number of shares Millions 454 454 454 454 454
Price/earnings ratio, (P/E) 22.1 21.7 15.8 20.0 22.3
Diluted EPS US cent 13.1 9.1 8.4 7.7 7.8
Diluted cash EPS US cent 17.2 12.5 11.3 10.6 10.9
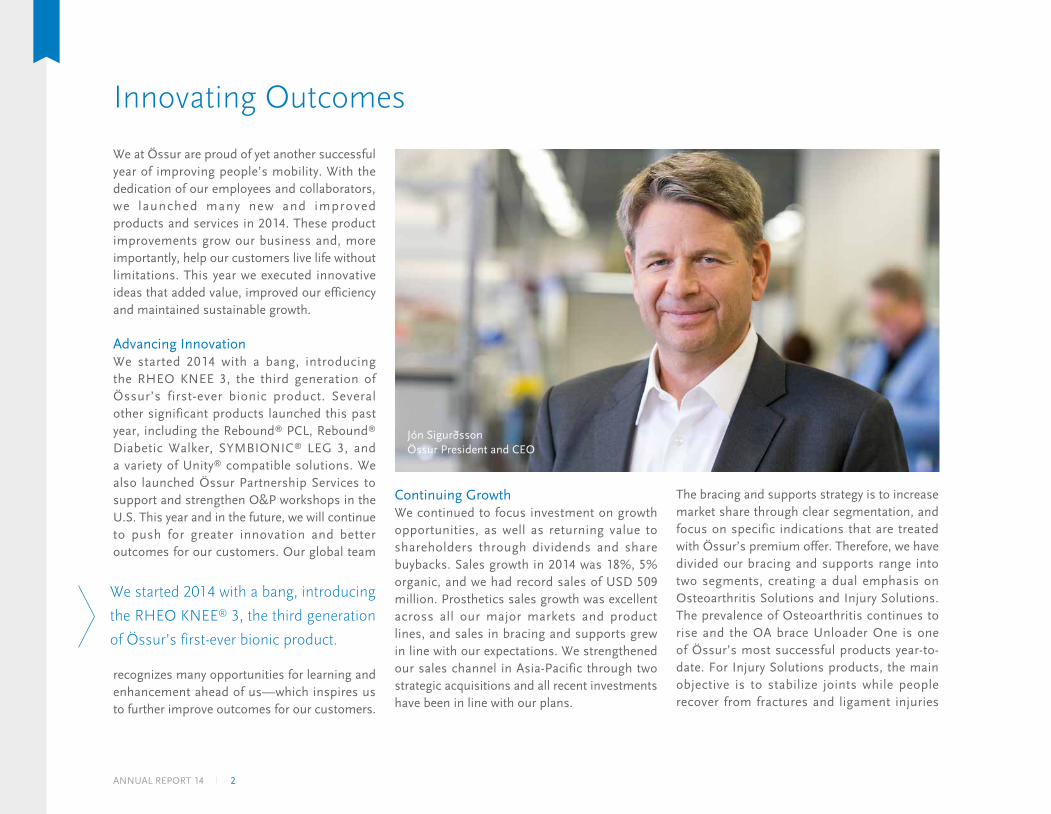
Innovating Outcomes
We at Össur are proud of yet another successful year of improving people’s mobility. With the dedication of our employees and collaborators, we launched many new and improved products and services in 2014. These product improvements grow our business and, more importantly, help our customers live life without limitations. This year we executed innovative ideas that added value, improved our efficiency and maintained sustainable growth. Advancing InnovationWe started 2014 with a bang, introducing the RHEO KNEE 3, the third generation of Össur’s first-ever bionic product. Several other significant products launched this past year, including the Rebound® PCL, Rebound® Diabetic Walker, SYMBIONIC® LEG 3, and a variety of Unity® compatible solutions. We also launched Össur Partnership Services to support and strengthen O&P workshops in the U.S. This year and in the future, we will continue to push for greater innovation and better outcomes for our customers. Our global team
recognizes many opportunities for learning and enhancement ahead of us—which inspires us to further improve outcomes for our customers.
Continuing GrowthWe continued to focus investment on growth opportunities, as well as returning value to shareholders through dividends and share buybacks. Sales growth in 2014 was 18%, 5% organic, and we had record sales of USD 509 million. Prosthetics sales growth was excellent across all our major markets and product lines, and sales in bracing and supports grew in line with our expectations. We strengthened our sales channel in Asia-Pacific through two strategic acquisitions and all recent investments have been in line with our plans.
The bracing and supports strategy is to increase market share through clear segmentation, and focus on specific indications that are treated with Össur’s premium offer. Therefore, we have divided our bracing and supports range into two segments, creating a dual emphasis on Osteoarthritis Solutions and Injury Solutions. The prevalence of Osteoarthritis continues to rise and the OA brace Unloader One is one of Össur’s most successful products year-to-date. For Injury Solutions products, the main objective is to stabilize joints while people recover from fractures and ligament injuries
Jón SigurðssonÖssur President and CEO
We started 2014 with a bang, introducing
the RHEO KNEE® 3, the third generation
of Össur’s first-ever bionic product.
2ANNUAL REPORT 14
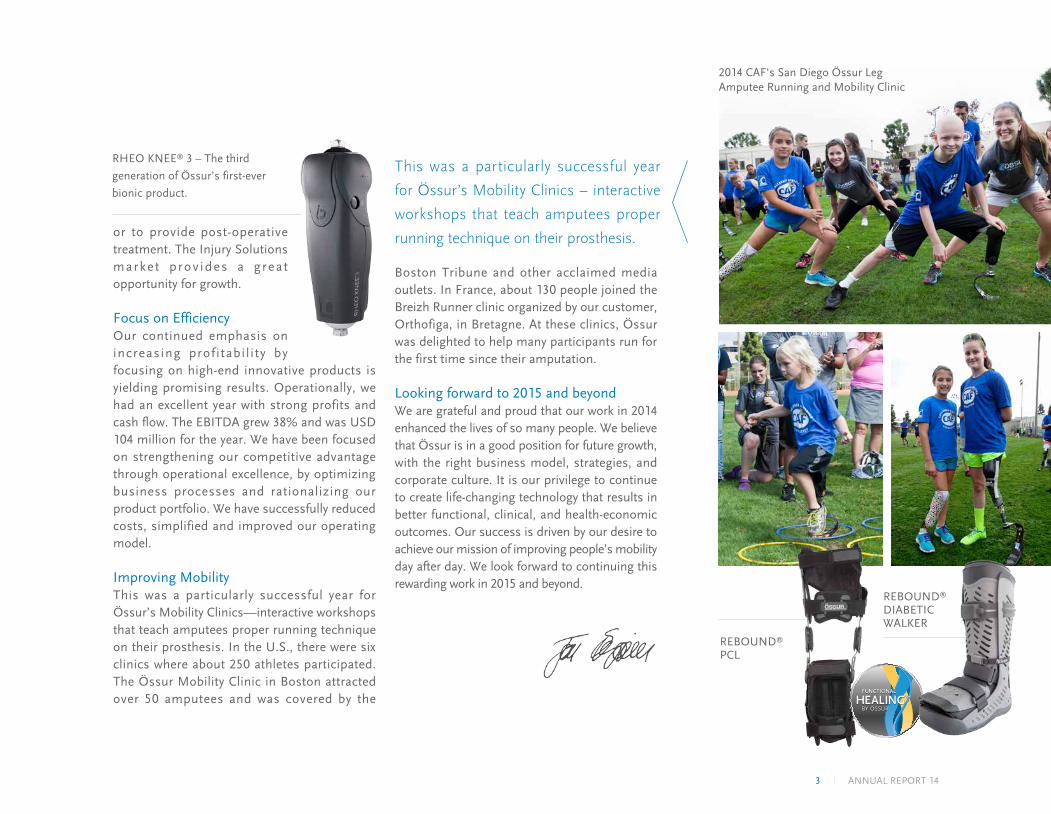
or to provide post-operative treatment. The Injury Solutions market prov ides a g rea t opportunity for growth.
Focus on EfficiencyOur continued emphasis on increasing profitabil i ty by focusing on high-end innovative products is yielding promising results. Operationally, we had an excellent year with strong profits and cash flow. The EBITDA grew 38% and was USD 104 million for the year. We have been focused on strengthening our competitive advantage through operational excellence, by optimizing business processes and rationalizing our product portfolio. We have successfully reduced costs, simplified and improved our operating model.
Improving MobilityThis was a particularly successful year for Össur’s Mobility Clinics—interactive workshops that teach amputees proper running technique on their prosthesis. In the U.S., there were six clinics where about 250 athletes participated. The Össur Mobility Clinic in Boston attracted over 50 amputees and was covered by the
Boston Tribune and other acclaimed media outlets. In France, about 130 people joined the Breizh Runner clinic organized by our customer, Orthofiga, in Bretagne. At these clinics, Össur was delighted to help many participants run for the first time since their amputation.
Looking forward to 2015 and beyond We are grateful and proud that our work in 2014 enhanced the lives of so many people. We believe that Össur is in a good position for future growth, with the right business model, strategies, and corporate culture. It is our privilege to continue to create life-changing technology that results in better functional, clinical, and health-economic outcomes. Our success is driven by our desire to achieve our mission of improving people’s mobility day after day. We look forward to continuing this rewarding work in 2015 and beyond.
This was a particularly successful year
for Össur’s Mobility Clinics – interactive
workshops that teach amputees proper
running technique on their prosthesis.
REBOUND® PCL
RHEO KNEE® 3 – The third
generation of Össur’s first-ever
bionic product.
REBOUND® DIABETIC WALKER
2014 CAF's San Diego Össur Leg Amputee Running and Mobility Clinic
3 ANNUAL REPORT 14
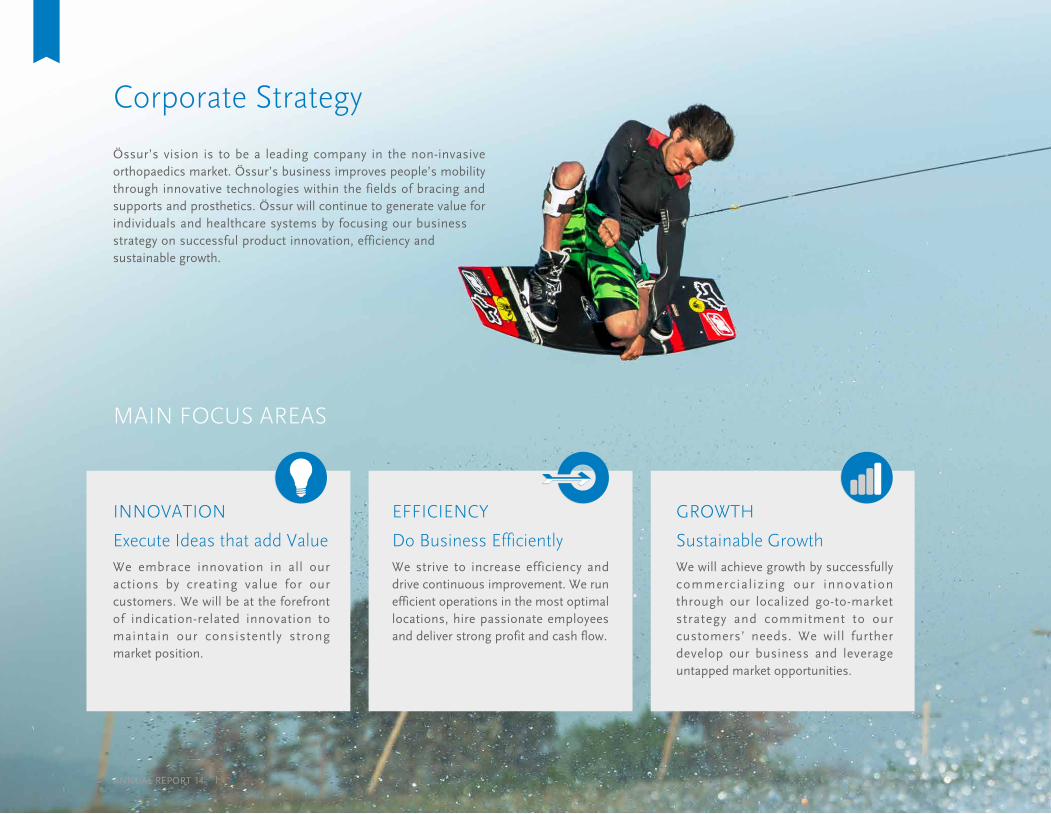
Corporate Strategy
Össur’s vision is to be a leading company in the non-invasive orthopaedics market. Össur’s business improves people’s mobility through innovative technologies within the fields of bracing and supports and prosthetics. Össur will continue to generate value for individuals and healthcare systems by focusing our business strategy on successful product innovation, efficiency and sustainable growth.
MAIN FOCUS AREAS
INNOVATION
Execute Ideas that add ValueWe embrace innovation in all our actions by creating value for our customers. We will be at the forefront of indication-related innovation to maintain our consistently strong market position.
EFFICIENCY
Do Business EfficientlyWe strive to increase efficiency and drive continuous improvement. We run efficient operations in the most optimal locations, hire passionate employees and deliver strong profit and cash flow.
GROWTH
Sustainable GrowthWe will achieve growth by successfully commercial izing our innovation through our localized go-to-market strategy and commitment to our customers’ needs. We will further develop our business and leverage untapped market opportunities.
4ANNUAL REPORT 14
VISIONLeading Company in Non-Invasive Orthopaedics
MISSIONWe Improve People’s Mobility
Össur’s core values ensure successful cooperation and partnerships, and are the foundation for our strategy and success.
Values
HONESTYWe show respect by adhering to facts and reality, fulfilling promises and claims, and admitting failures. We nurture honest communication throughout the Company by sharing information and respecting each other’s time and workload.
FRUGALITYWe use resources wisely. The Company aims to minimize costs across all areas of its business through effective communication, preparedness, planning and optimized processes.
COURAGEWe are open to change and constantly strive for improvement. We challenge unwritten rules, show initiative and take calculated risks, while at the same time, taking responsibility for our ideas, decisions and actions.
5 ANNUAL REPORT 14
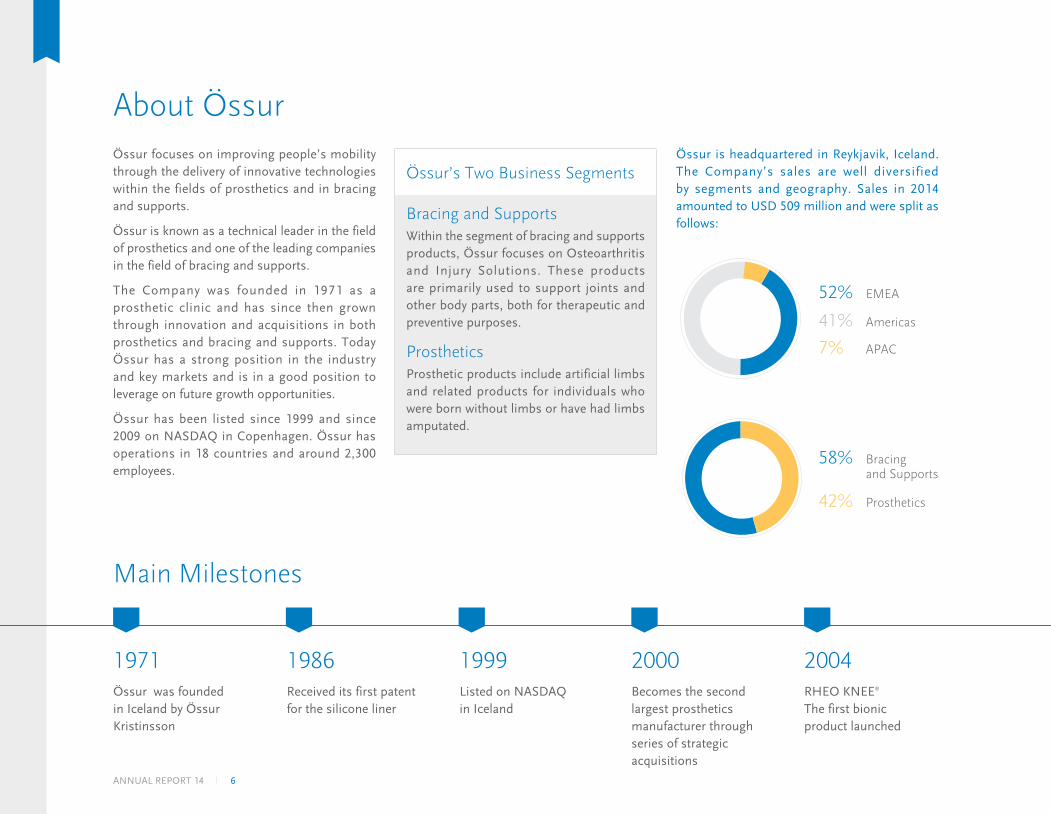
Össur focuses on improving people’s mobility through the delivery of innovative technologies within the fields of prosthetics and in bracing and supports.
Össur is known as a technical leader in the field of prosthetics and one of the leading companies in the field of bracing and supports.
The Company was founded in 1971 as a prosthetic clinic and has since then grown through innovation and acquisitions in both prosthetics and bracing and supports. Today Össur has a strong position in the industry and key markets and is in a good position to leverage on future growth opportunities.
Össur has been listed since 1999 and since 2009 on NASDAQ in Copenhagen. Össur has operations in 18 countries and around 2,300 employees.
About Össur
Main Milestones
Össur’s Two Business Segments
Bracing and SupportsWithin the segment of bracing and supports products, Össur focuses on Osteoarthritis and Injury Solutions. These products are primarily used to support joints and other body parts, both for therapeutic and preventive purposes.
ProstheticsProsthetic products include artificial limbs and related products for individuals who were born without limbs or have had limbs amputated.
Össur is headquartered in Reykjavik, Iceland. The Company’s sales are well diversified by segments and geography. Sales in 2014 amounted to USD 509 million and were split as follows:
58%
42%
Bracing and Supports
Prosthetics
52%
41%
7%
EMEA
Americas
APAC
Össur was founded in Iceland by Össur Kristinsson
1971RHEO KNEE®
The first bionic product launched
2004Received its first patent for the silicone liner
1986Becomes the second largest prosthetics manufacturer through series of strategic acquisitions
2000Listed on NASDAQ in Iceland
1999
6ANNUAL REPORT 14
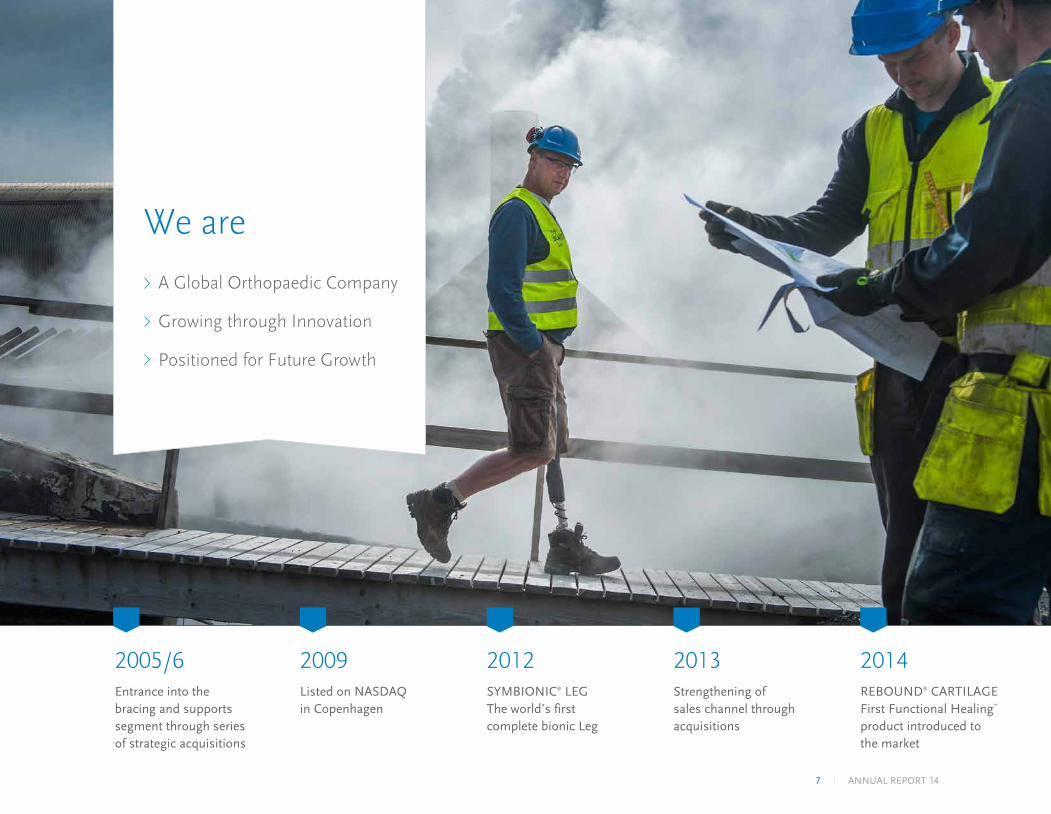
Entrance into the bracing and supports segment through series of strategic acquisitions
2005/6SYMBIONIC® LEG The world’s first complete bionic Leg
2012REBOUND® CARTILAGE First Functional Healing™ product introduced to the market
2014Listed on NASDAQ in Copenhagen
2009Strengthening of sales channel through acquisitions
2013
A Global Orthopaedic Company
Growing through Innovation
Positioned for Future Growth
We are
7 ANNUAL REPORT 14
People
The effort and enthusiasm of our employees in 2014 led to many new and improved products and services that make a difference in people’s lives. With the hard work and passion of our employees, we achieved our mission of improving people’s mobility.
Our mission is a rewarding cause, but it is the team mentality and positive attitude of our employees that make Össur a remarkable company. While we are truly diverse, numbering 2,300 employees across the globe, we work as one.
Our values – honesty, frugality, and courage – are the backbone of our business and the glue that keeps us functioning as a group. We strive to live these values every day, in everything that we do – in our interactions with colleagues and customers, and in our work efforts.
Diverse WorkforceThis year we strengthened our commitment to diversity and Human Rights by signing the United Nations Women’s Empowerment Principles, an addition to the UN Global Compact. Össur committed to the UN Global Compact initiative in 2011, pledging to follow the Global Compact principles in the areas of Environment, Labor Practices, Human Rights and Anti-Corruption.
In a global company like Össur, diversity in its broadest sense is important. Encouragement of diversity in the workplace is beneficial as it
helps gain diverse perspectives from which to base decisions, which in turn lead to better results. We are committed to providing equal treatment and equal opportunities for growth to all employees.
A Great Place To WorkAt Össur, we believe in creating an environment where the skills, strengths and knowledge of all employees are utilized in full. We seek input from every level of the organization, knowing that the unique experience and insights of our employees are the keys to continuous improvement. Employee input is so important to us that we have made it a goal in our manufacturing operation to solicit and implement 10 ideas per employee each year.
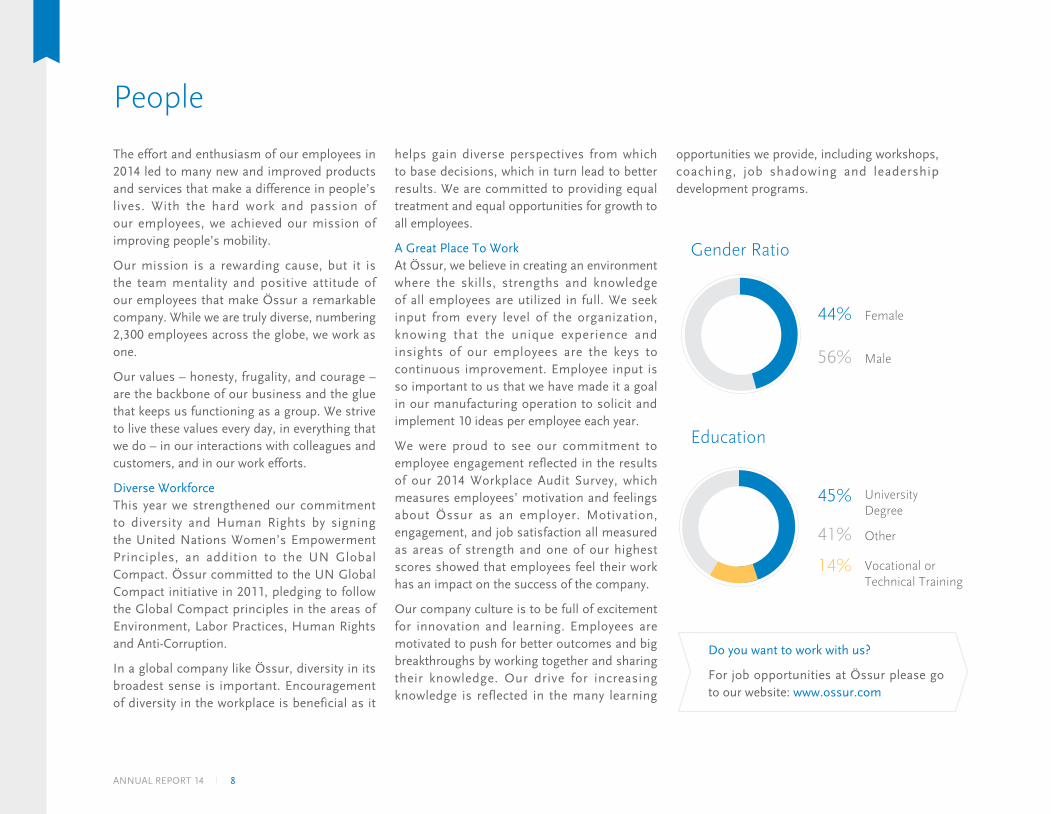
We were proud to see our commitment to employee engagement reflected in the results of our 2014 Workplace Audit Survey, which measures employees’ motivation and feelings about Össur as an employer. Motivation, engagement, and job satisfaction all measured as areas of strength and one of our highest scores showed that employees feel their work has an impact on the success of the company.
Our company culture is to be full of excitement for innovation and learning. Employees are motivated to push for better outcomes and big breakthroughs by working together and sharing their knowledge. Our drive for increasing knowledge is reflected in the many learning
45%
14%
41%
University Degree
Other
Vocational or Technical Training
44%
56%
Female
Male
45%
14%
41%
University Degree
Other
Vocational or Technical Training
44%
56%
Female
Male
Gender Ratio
Education
opportunities we provide, including workshops, coaching, job shadowing and leadership development programs.
Do you want to work with us?
For job opportunities at Össur please go to our website: www.ossur.com
8ANNUAL REPORT 14
9 ANNUAL REPORT 14
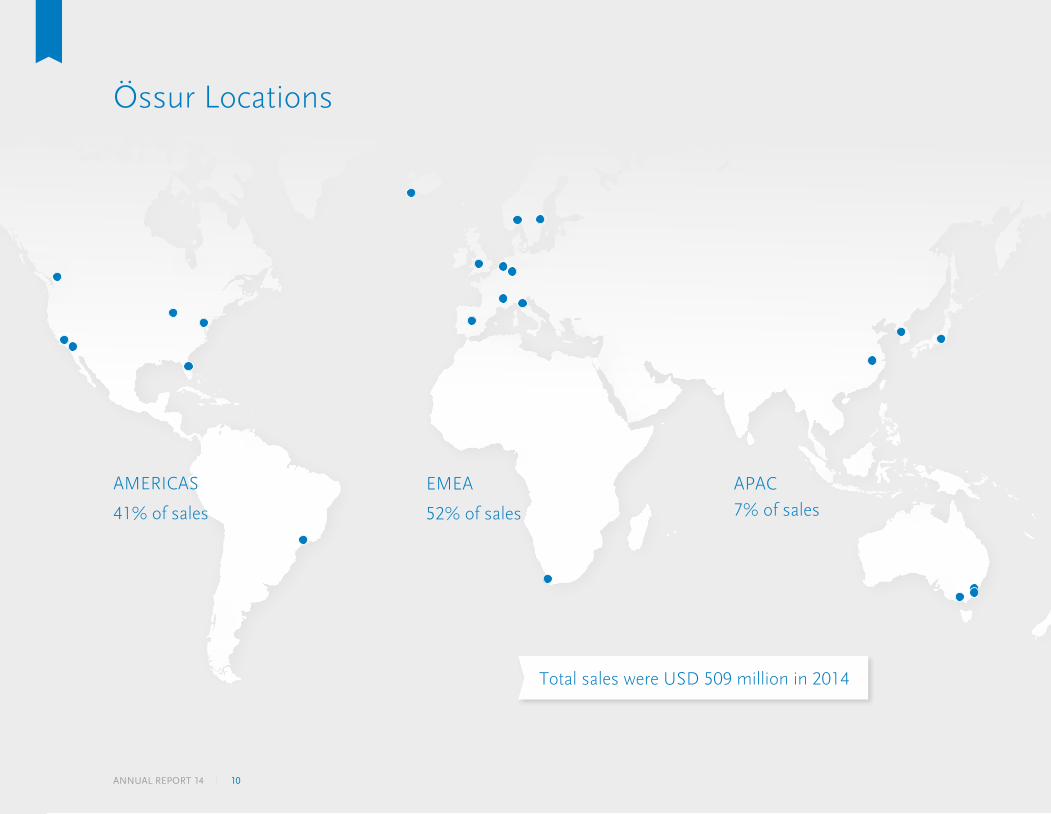
Össur Locations
AMERICAS
41% of sales
EMEA
52% of sales
APAC
7% of sales
Total sales were USD 509 million in 2014
10ANNUAL REPORT 14
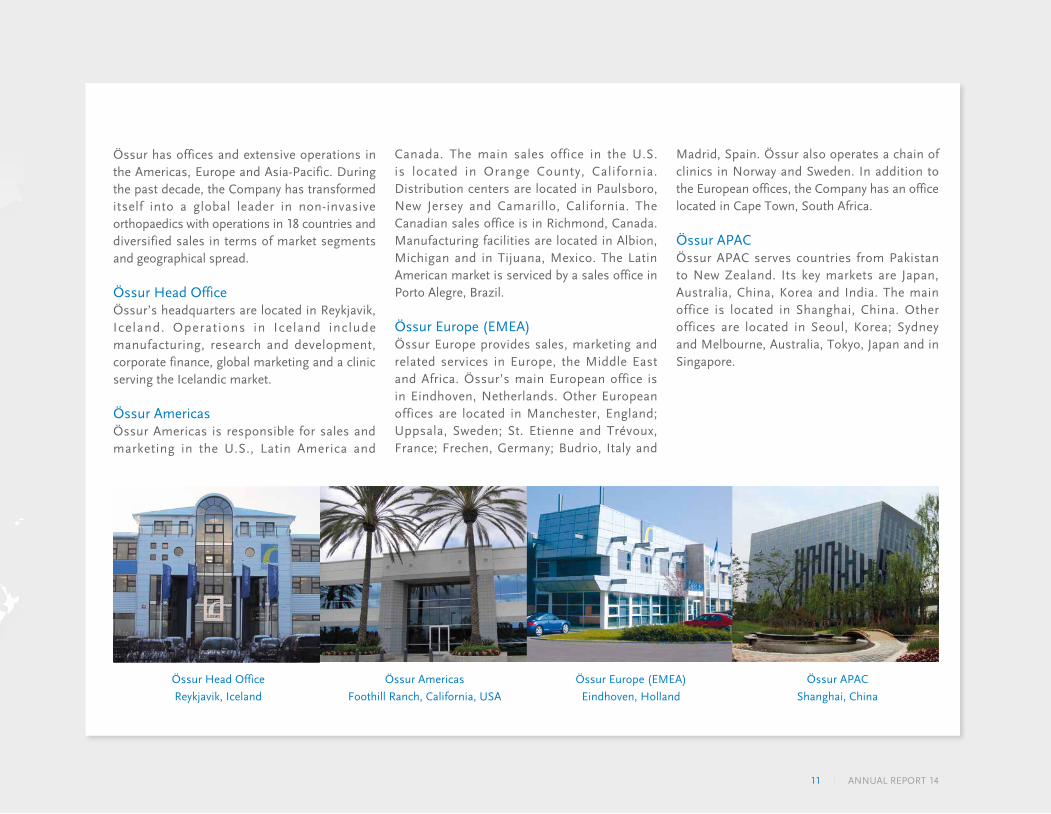
Össur Head Office
Reykjavik, Iceland
Össur Americas
Foothill Ranch, California, USA
Össur Europe (EMEA)
Eindhoven, Holland
Össur APAC
Shanghai, China
Össur has offices and extensive operations in the Americas, Europe and Asia-Pacific. During the past decade, the Company has transformed itself into a global leader in non-invasive orthopaedics with operations in 18 countries and diversified sales in terms of market segments and geographical spread.
Össur Head OfficeÖssur’s headquarters are located in Reykjavik, Iceland. Operations in Iceland include manufacturing, research and development, corporate finance, global marketing and a clinic serving the Icelandic market.
Össur AmericasÖssur Americas is responsible for sales and marketing in the U.S., Latin America and
Canada. The main sales office in the U.S. is located in Orange County, California. Distribution centers are located in Paulsboro, New Jersey and Camarillo, California. The Canadian sales office is in Richmond, Canada. Manufacturing facilities are located in Albion, Michigan and in Tijuana, Mexico. The Latin American market is serviced by a sales office in Porto Alegre, Brazil.
Össur Europe (EMEA)Össur Europe provides sales, marketing and related services in Europe, the Middle East and Africa. Össur’s main European office is in Eindhoven, Netherlands. Other European offices are located in Manchester, England; Uppsala, Sweden; St. Etienne and Trévoux, France; Frechen, Germany; Budrio, Italy and
Madrid, Spain. Össur also operates a chain of clinics in Norway and Sweden. In addition to the European offices, the Company has an office located in Cape Town, South Africa.
Össur APACÖssur APAC serves countries from Pakistan to New Zealand. Its key markets are Japan, Australia, China, Korea and India. The main office is located in Shanghai, China. Other offices are located in Seoul, Korea; Sydney and Melbourne, Australia, Tokyo, Japan and in Singapore.
11 ANNUAL REPORT 14

Markets
BUSINESS SEGMENTS
Bracing and Supports• Össur’s bracing and supports products are used primarily to support joints
and other body parts for therapeutic and preventative purposes. The bracing and supports market includes devices supporting spinal, knee, hip, foot, ankle and upper extremities. The Company offers a comprehensive line of custom made and off-the-shelf products with primary focus on Osteoarthritis and Injury Solutions.
• Össur’s management estimates that the size of the bracing and supports market within the U.S., EMEA and APAC is in the range of USD 2.7 to 3.0 billion. Össur is the second largest company operating in the global bracing and supports market with market share approximately 10%.
Prosthetics• Prosthetics are artificial limbs and related products for individuals who were
born without limbs or who have had limbs amputated. Össur offers a full range of premium lower limb prosthetics, including liners, knees and feet.
• Össur’s management estimates that the size of the prosthetic market within the U.S., EMEA and APAC is approximately USD 1.0-1.2 billion. Össur is the second largest company operating in the prosthetics market with market share approximately 20%.
Össur operates within the global non-invasive orthopaedic industry, delivering advanced and innovative solutions within the bracing and supports and prosthetics markets.
12ANNUAL REPORT 14
such as Osteoarthritis, which increases the demand for different forms of bracing and supports products.
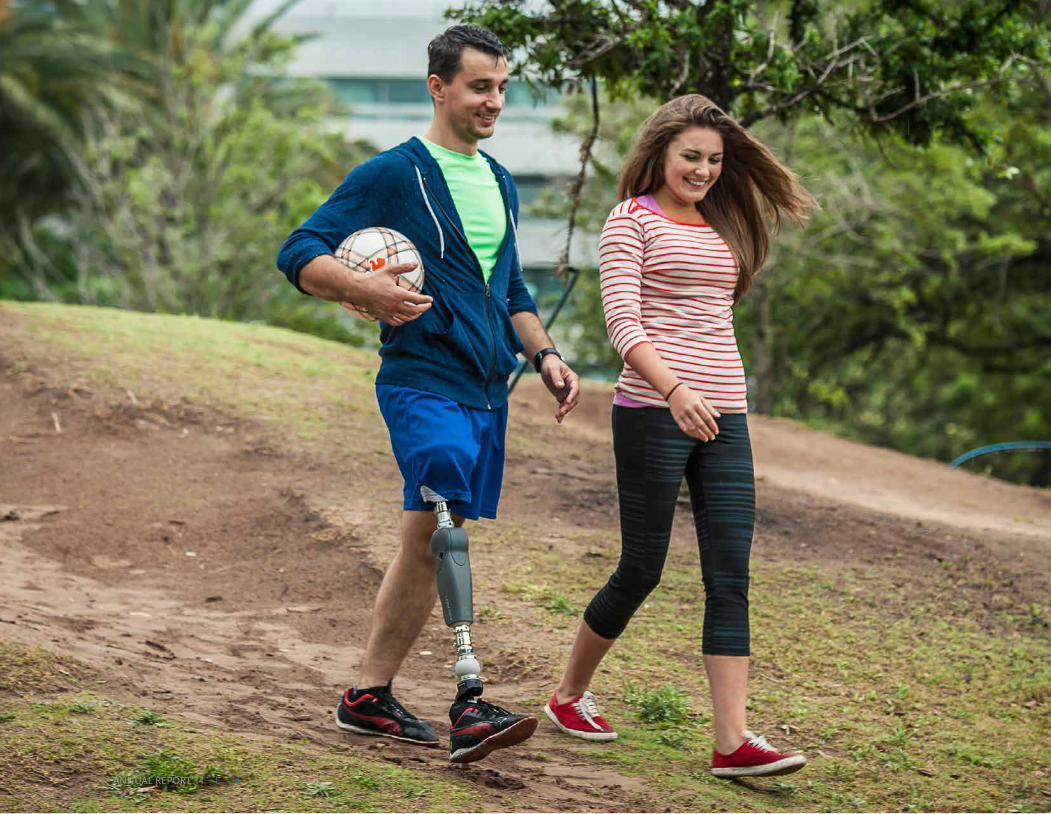
LifestyleObesity, which can result in diabetes and vascular diseases, is reaching epidemic proportions. Since diabetes and vascular diseases are the main causes of amputation, as the number of people afflicted by these diseases increases, the demand for prosthetics is expected to increase as well. Obesity and an aging population are also the main market drivers for Osteoarthritis. As active lifestyles and participation in sports increase, the demand for different types of support products continues to
Industry DynamicsAn aging population, changing lifestyles, technological developments and healthcare regulations are fundamental drivers of change in the orthopaedic industry.
Aging PopulationThe increasing number of the total global population aged 65 and older will underpin market growth as an aging society brings an increase in the frequency of vascular diseases and diabetes, two of the main causes of amputation, as well as an increasing need for compression therapy solutions. An aging population also means an increased amount of fractures, joint instability and joint afflictions
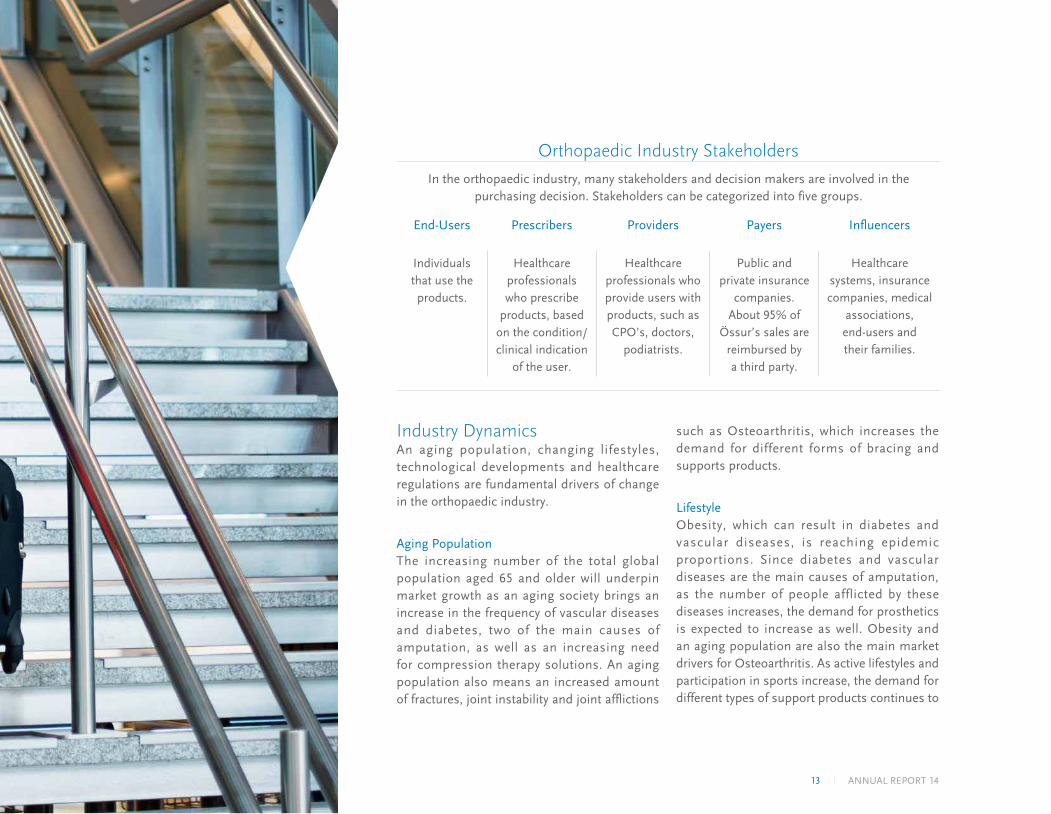
Orthopaedic Industry Stakeholders
In the orthopaedic industry, many stakeholders and decision makers are involved in the purchasing decision. Stakeholders can be categorized into five groups.
End-Users Prescribers Providers Payers Influencers
Individuals that use the products.
Healthcare professionals who prescribe
products, based on the condition/clinical indication
of the user.
Healthcare professionals who provide users with products, such as CPO’s, doctors,
podiatrists.
Public and private insurance
companies. About 95% of
Össur’s sales are reimbursed by a third party.
Healthcare systems, insurance companies, medical
associations, end-users and their families.
13 ANNUAL REPORT 14
14ANNUAL REPORT 14
grow due to an increased number of sports related injuries and an increased demand for preventive products.
Technological DevelopmentNew technologies and technological combinations, as well as new materials, continuously yield improved products. Such technological advances lead to total market growth as demand is created for more technically advanced and expensive solutions.
Healthcare RegulationsHealthcare providers are constrained by budgets and, accordingly, they demand cost effective solutions without compromising quality. This has led to substantial investment in systems demonstrating and providing functional, clinical and health economical outcomes to potential buyers. Two vital requirements for any market player in the orthopaedics industry are the ability to adapt to changing healthcare requirements and tailoring product offerings to meet the prevailing regulatory system.
The vast majority of Össur’s products are reimbursable through diverse public and private reimbursement systems. Reimbursement systems vary substantially between countries and product markets. Payers for Össur’s products usually include government reimbursement plans or insurance companies. Össur applies its reimbursement know-how from the earliest stages of product development to the post-sale education of customers. The Company pursues several strategies to manage and influence the reimbursement of Össur products and focuses on proving and communicating the functional, health economical and clinical outcome of its products.
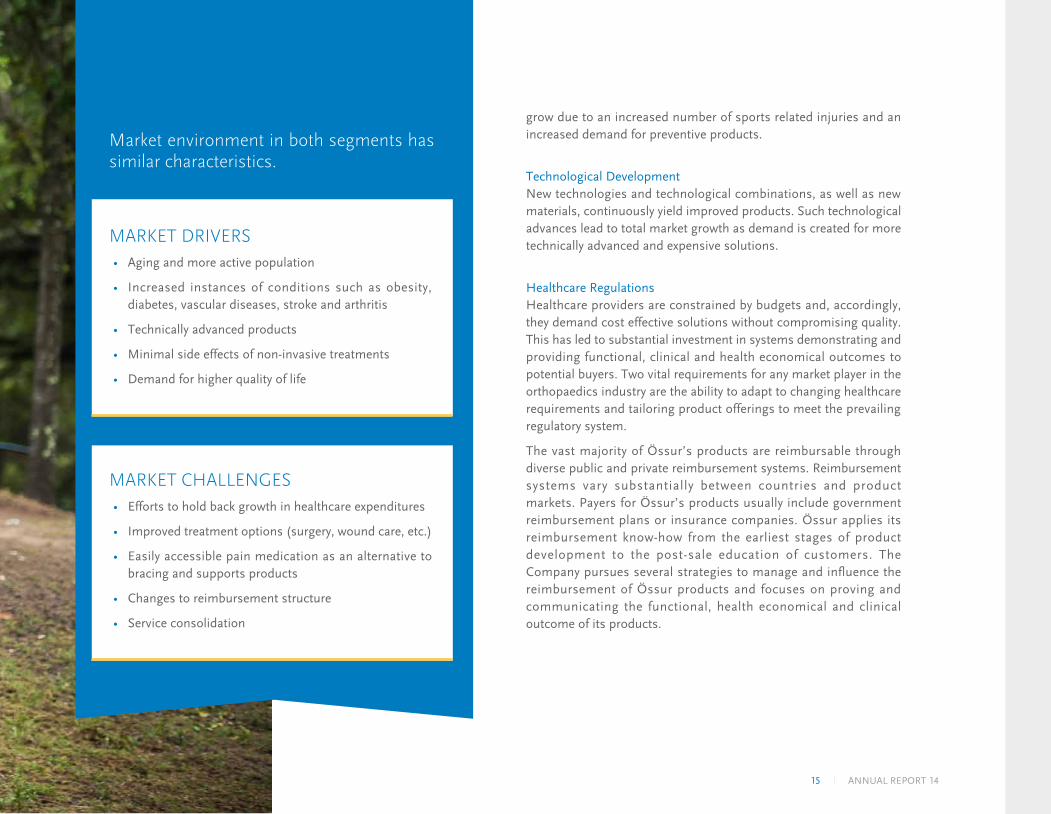
Market environment in both segments has similar characteristics.
MARKET DRIVERS• Aging and more active population
• Increased instances of conditions such as obesity, diabetes, vascular diseases, stroke and arthritis
• Technically advanced products
• Minimal side effects of non-invasive treatments
• Demand for higher quality of life
MARKET CHALLENGES• Efforts to hold back growth in healthcare expenditures
• Improved treatment options (surgery, wound care, etc.)
• Easily accessible pain medication as an alternative to bracing and supports products
• Changes to reimbursement structure
• Service consolidation
15 ANNUAL REPORT 14
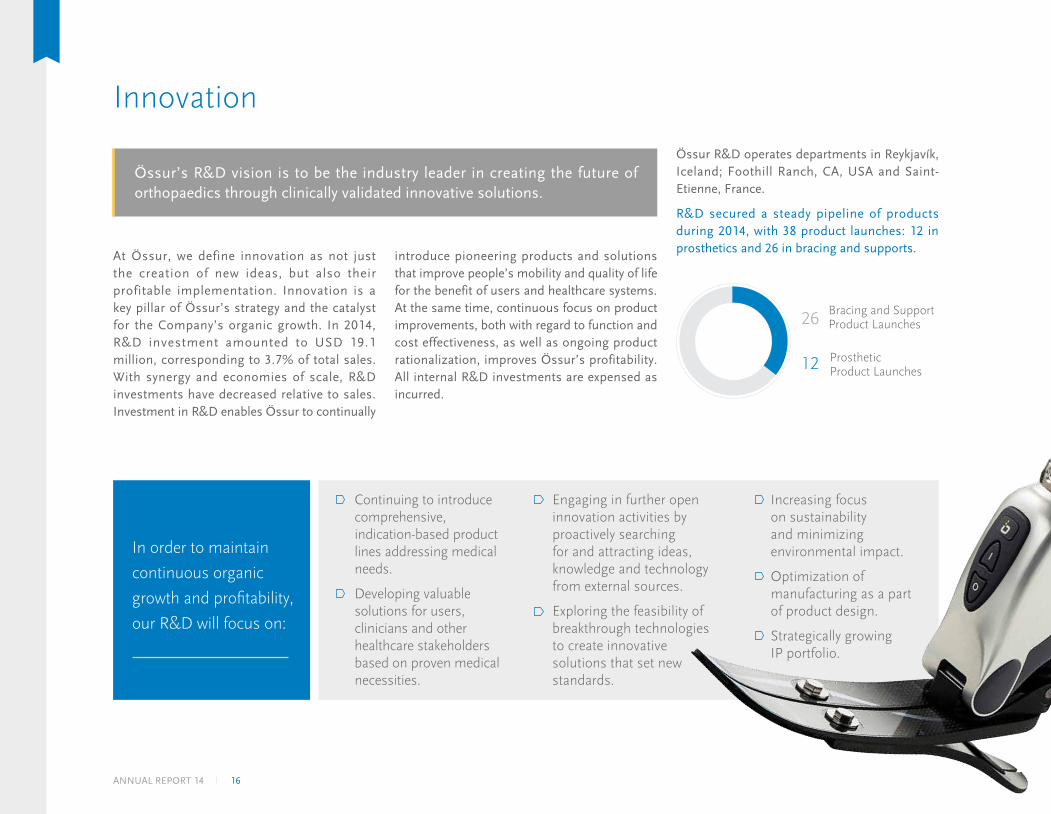
Innovation
At Össur, we define innovation as not just the creation of new ideas, but also their profitable implementation. Innovation is a key pillar of Össur’s strategy and the catalyst for the Company’s organic growth. In 2014, R&D investment amounted to USD 19.1 million, corresponding to 3.7% of total sales. With synergy and economies of scale, R&D investments have decreased relative to sales. Investment in R&D enables Össur to continually
introduce pioneering products and solutions that improve people’s mobility and quality of life for the benefit of users and healthcare systems. At the same time, continuous focus on product improvements, both with regard to function and cost effectiveness, as well as ongoing product rationalization, improves Össur’s profitability. All internal R&D investments are expensed as incurred.
26
12
Bracing and SupportProduct Launches
ProstheticProduct Launches
Össur R&D operates departments in Reykjavík, Iceland; Foothill Ranch, CA, USA and Saint-Etienne, France.
R&D secured a steady pipeline of products during 2014, with 38 product launches: 12 in prosthetics and 26 in bracing and supports.
Össur’s R&D vision is to be the industry leader in creating the future of orthopaedics through clinically validated innovative solutions.
Continuing to introduce comprehensive, indication-based product lines addressing medical needs.
Developing valuable solutions for users, clinicians and other healthcare stakeholders based on proven medical necessities.
Engaging in further open innovation activities by proactively searching for and attracting ideas, knowledge and technology from external sources.
Exploring the feasibility of breakthrough technologies to create innovative solutions that set new standards.
Increasing focus on sustainability and minimizing environmental impact.
Optimization of manufacturing as a part of product design.
Strategically growing IP portfolio.
In order to maintain
continuous organic
growth and profitability,
our R&D will focus on:
16ANNUAL REPORT 14
Indication Based
InnovationÖssur’s indication-
based innovation a p p r o a c h r e f e r s
to the Company ’s increased efforts to
produce products that are medically indicated and
clinically validated through product development. In the
development process, Össur’s R&D teams rely on medical and
biomechanical evidence, as well as health economic data, in order to develop
valuable concepts for individuals and healthcare systems. In order to obtain clinical evidence for product outcomes, Össur initiates and promotes clinical studies in cooperation with recognized scientists, institutions and healthcare professionals.
As a part of the indication based approach, Össur has identified clinical pathways for increasing and improving its product and service range. Clinical pathways refer to the different stages of progression and treatments of diseases. Mapping out clinical pathways involves identification of possible points of intervention for products specifically tailored for different stages of disease development and
applied treatments. Moreover, Össur monitors epidemiological trends for diseases and medical conditions relevant to the Company’s product offerings in order to identify unmet needs and possible opportunities.
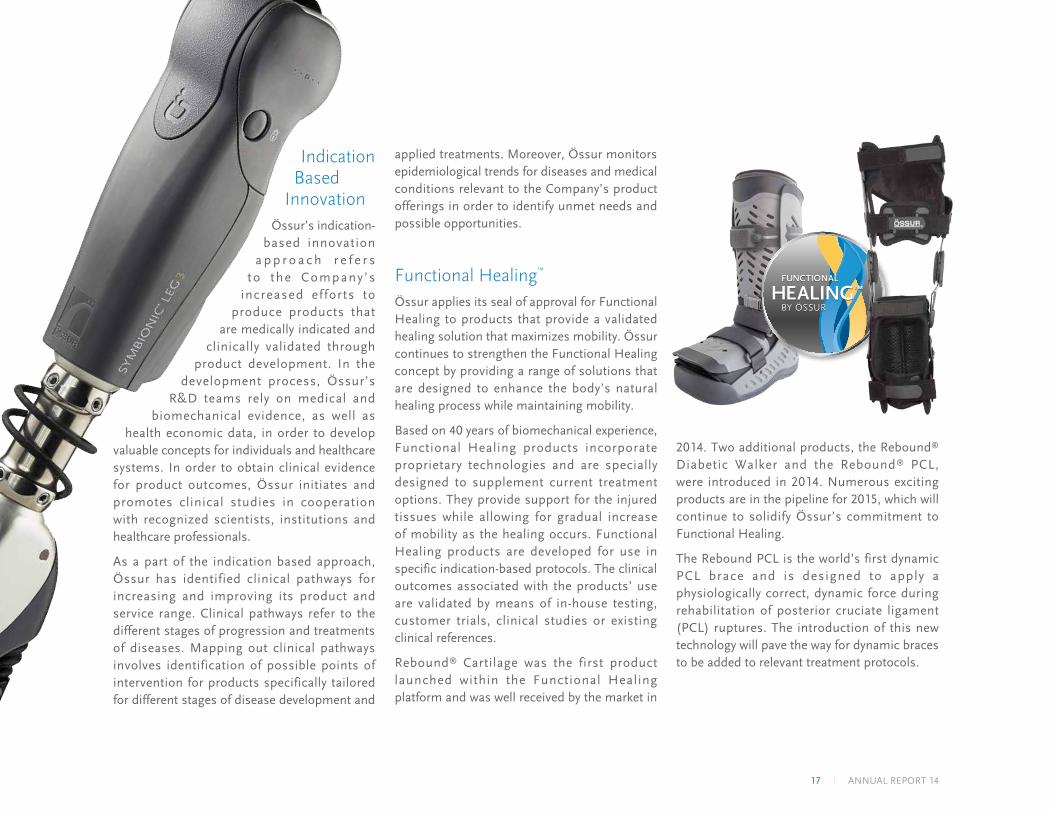
Functional Healing™
Össur applies its seal of approval for Functional Healing to products that provide a validated healing solution that maximizes mobility. Össur continues to strengthen the Functional Healing concept by providing a range of solutions that are designed to enhance the body’s natural healing process while maintaining mobility.
Based on 40 years of biomechanical experience, Functional Healing products incorporate proprietary technologies and are specially designed to supplement current treatment options. They provide support for the injured tissues while allowing for gradual increase of mobility as the healing occurs. Functional Healing products are developed for use in specific indication-based protocols. The clinical outcomes associated with the products’ use are validated by means of in-house testing, customer trials, clinical studies or existing clinical references.
Rebound® Cartilage was the first product launched within the Functional Healing platform and was well received by the market in
2014. Two additional products, the Rebound® Diabetic Walker and the Rebound® PCL, were introduced in 2014. Numerous exciting products are in the pipeline for 2015, which will continue to solidify Össur’s commitment to Functional Healing.
The Rebound PCL is the world’s first dynamic PCL brace and is designed to apply a physiologically correct, dynamic force during rehabilitation of posterior cruciate ligament (PCL) ruptures. The introduction of this new technology will pave the way for dynamic braces to be added to relevant treatment protocols.
17 ANNUAL REPORT 14
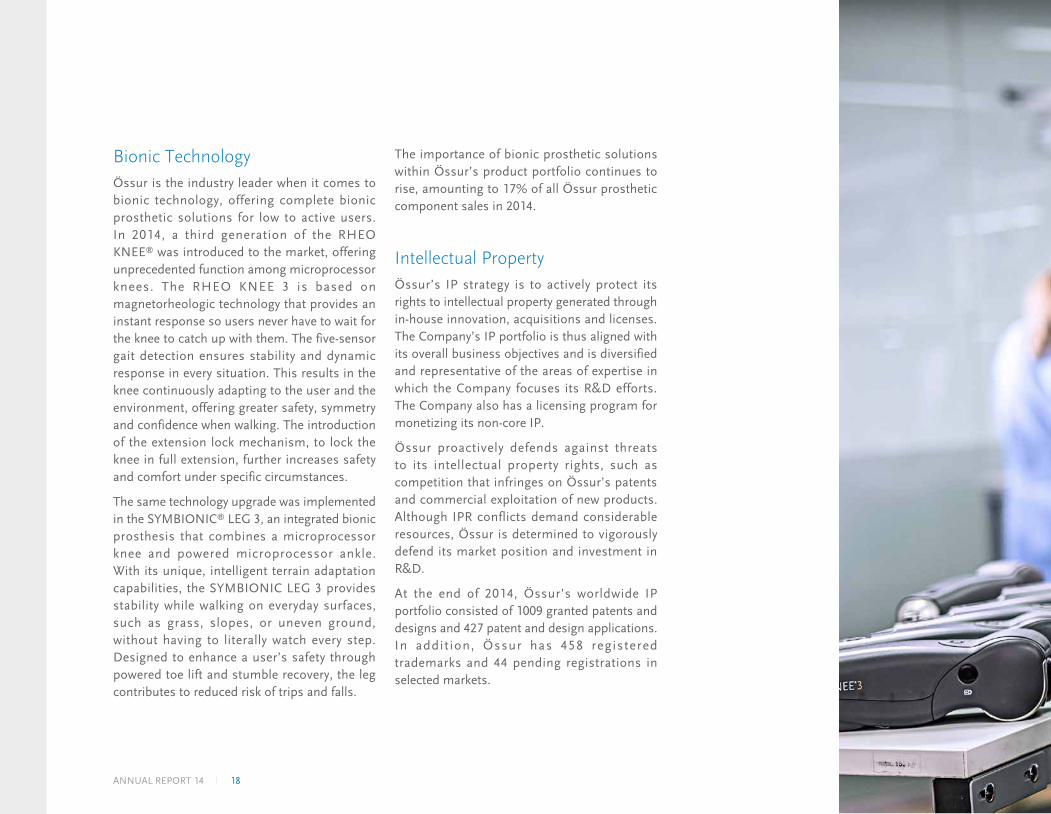
Bionic TechnologyÖssur is the industry leader when it comes to bionic technology, offering complete bionic prosthetic solutions for low to active users. In 2014, a third generation of the RHEO KNEE® was introduced to the market, offering unprecedented function among microprocessor knees. The RHEO KNEE 3 is based on magnetorheologic technology that provides an instant response so users never have to wait for the knee to catch up with them. The five-sensor gait detection ensures stability and dynamic response in every situation. This results in the knee continuously adapting to the user and the environment, offering greater safety, symmetry and confidence when walking. The introduction of the extension lock mechanism, to lock the knee in full extension, further increases safety and comfort under specific circumstances.
The same technology upgrade was implemented in the SYMBIONIC® LEG 3, an integrated bionic prosthesis that combines a microprocessor knee and powered microprocessor ankle. With its unique, intelligent terrain adaptation capabilities, the SYMBIONIC LEG 3 provides stability while walking on everyday surfaces, such as grass, slopes, or uneven ground, without having to literally watch every step. Designed to enhance a user’s safety through powered toe lift and stumble recovery, the leg contributes to reduced risk of trips and falls.
The importance of bionic prosthetic solutions within Össur’s product portfolio continues to rise, amounting to 17% of all Össur prosthetic component sales in 2014.
Intellectual PropertyÖssur’s IP strategy is to actively protect its rights to intellectual property generated through in-house innovation, acquisitions and licenses. The Company’s IP portfolio is thus aligned with its overall business objectives and is diversified and representative of the areas of expertise in which the Company focuses its R&D efforts. The Company also has a licensing program for monetizing its non-core IP.
Össur proactively defends against threats to its intellectual property rights, such as competition that infringes on Össur’s patents and commercial exploitation of new products. Although IPR conflicts demand considerable resources, Össur is determined to vigorously defend its market position and investment in R&D.
At the end of 2014, Össur’s worldwide IP portfolio consisted of 1009 granted patents and designs and 427 patent and design applications. In addit ion, Össur has 458 registered trademarks and 44 pending registrations in selected markets.
18ANNUAL REPORT 14

19 ANNUAL REPORT 14
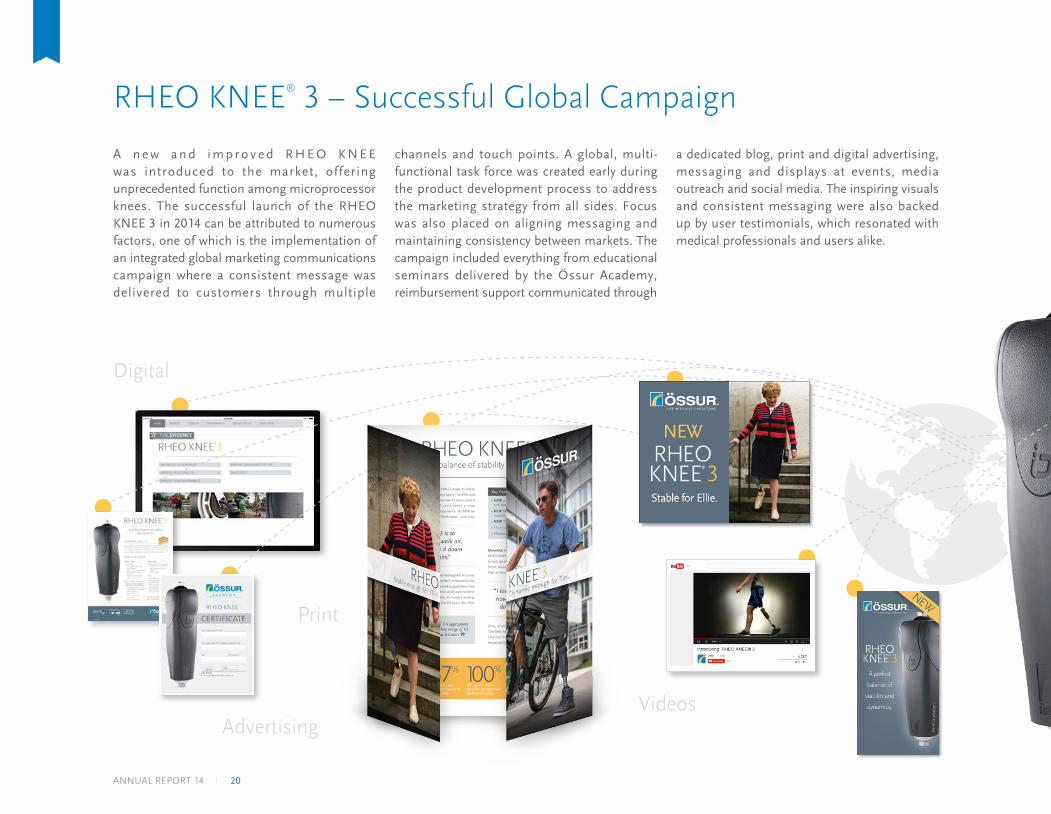
A n e w a n d i m p r o v e d R H E O K N E E was introduced to the market, offering unprecedented function among microprocessor knees. The successful launch of the RHEO KNEE 3 in 2014 can be attributed to numerous factors, one of which is the implementation of an integrated global marketing communications campaign where a consistent message was delivered to customers through multiple
RHEO KNEE® 3 – Successful Global Campaign
channels and touch points. A global, multi-functional task force was created early during the product development process to address the marketing strategy from all sides. Focus was also placed on aligning messaging and maintaining consistency between markets. The campaign included everything from educational seminars delivered by the Össur Academy, reimbursement support communicated through
a dedicated blog, print and digital advertising, messaging and displays at events, media outreach and social media. The inspiring visuals and consistent messaging were also backed up by user testimonials, which resonated with medical professionals and users alike.
Videos
Advertising
Digital
20ANNUAL REPORT 14

Product launched January 2014
Positive customer feedback and word of mouth
Aligned global communication
Video has been played over 10000 times
SOCIAL MEDIA
Web
Social
Testimonials
21 ANNUAL REPORT 14
Approach to Corporate Social Responsibility
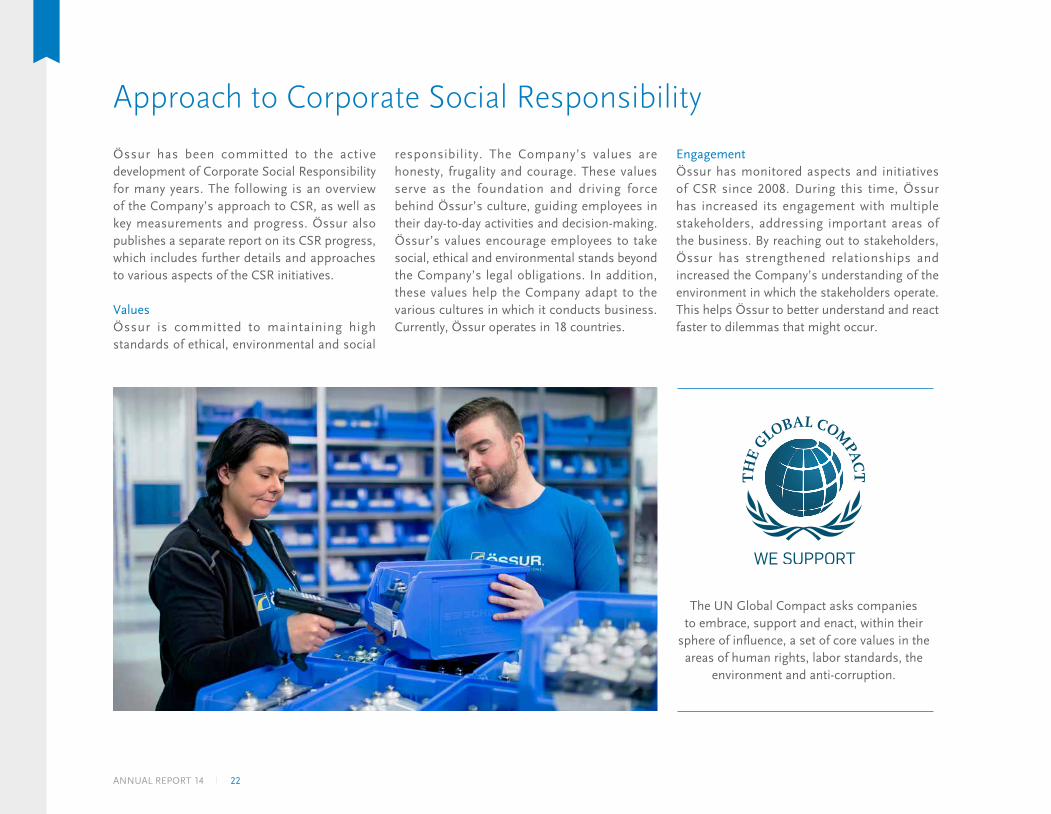
Össur has been committed to the active development of Corporate Social Responsibility for many years. The following is an overview of the Company’s approach to CSR, as well as key measurements and progress. Össur also publishes a separate report on its CSR progress, which includes further details and approaches to various aspects of the CSR initiatives.
ValuesÖssur is committed to maintaining high standards of ethical, environmental and social
responsibility. The Company’s values are honesty, frugality and courage. These values serve as the foundation and driving force behind Össur’s culture, guiding employees in their day-to-day activities and decision-making. Össur’s values encourage employees to take social, ethical and environmental stands beyond the Company’s legal obligations. In addition, these values help the Company adapt to the various cultures in which it conducts business. Currently, Össur operates in 18 countries.
Engagement Össur has monitored aspects and initiatives of CSR since 2008. During this time, Össur has increased its engagement with multiple stakeholders, addressing important areas of the business. By reaching out to stakeholders, Össur has strengthened relationships and increased the Company’s understanding of the environment in which the stakeholders operate. This helps Össur to better understand and react faster to dilemmas that might occur.
The UN Global Compact asks companies to embrace, support and enact, within their
sphere of influence, a set of core values in the areas of human rights, labor standards, the
environment and anti-corruption.
22ANNUAL REPORT 14
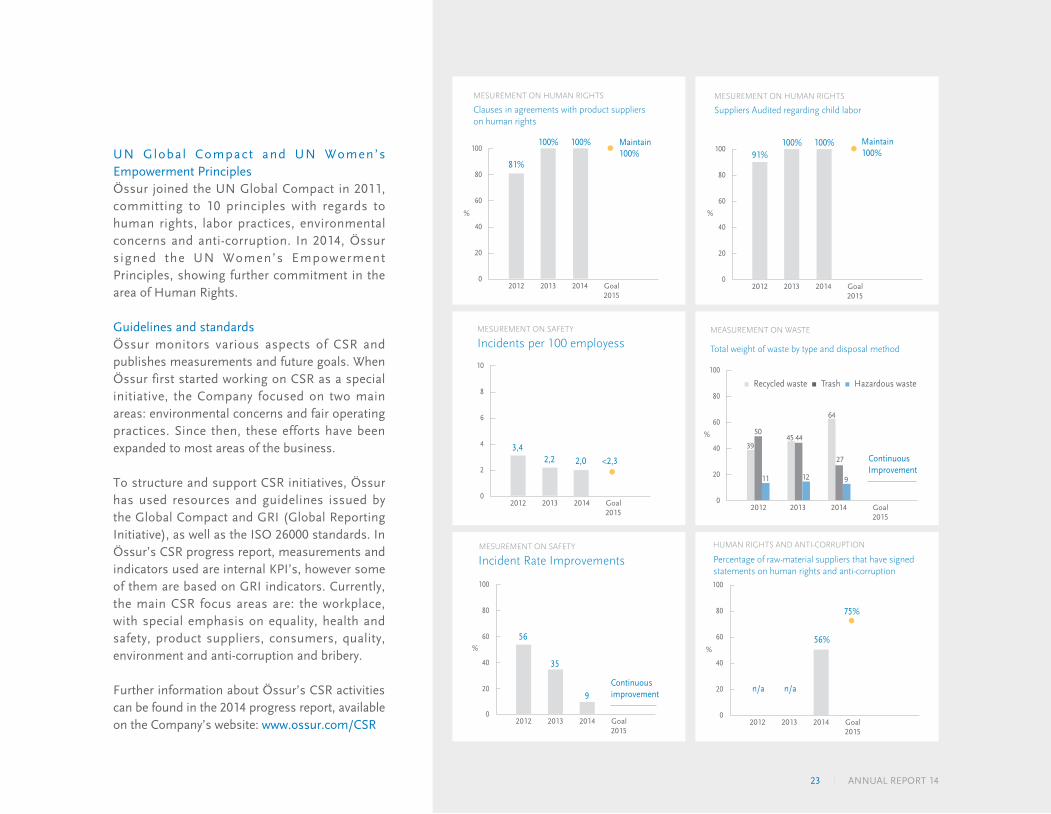
UN Global Compact and UN Women’s Empowerment PrinciplesÖssur joined the UN Global Compact in 2011, committing to 10 principles with regards to human rights, labor practices, environmental concerns and anti-corruption. In 2014, Össur signed the UN Women’s Empowerment Principles, showing further commitment in the area of Human Rights.
Guidelines and standardsÖssur monitors various aspects of CSR and publishes measurements and future goals. When Össur first started working on CSR as a special initiative, the Company focused on two main areas: environmental concerns and fair operating practices. Since then, these efforts have been expanded to most areas of the business.
To structure and support CSR initiatives, Össur has used resources and guidelines issued by the Global Compact and GRI (Global Reporting Initiative), as well as the ISO 26000 standards. In Össur’s CSR progress report, measurements and indicators used are internal KPI’s, however some of them are based on GRI indicators. Currently, the main CSR focus areas are: the workplace, with special emphasis on equality, health and safety, product suppliers, consumers, quality, environment and anti-corruption and bribery.
Further information about Össur’s CSR activities can be found in the 2014 progress report, available on the Company’s website: www.ossur.com/CSR
0
2
4
6
8
10
3,42,2 2,0 <2,3
2012 2013 2014 Goal2015
Incidents per 100 employessMESUREMENT ON SAFETY
20
40
60
80
100
0
81%
100%
2012 2013 2014 Goal2015
100%
Clauses in agreements with product suppliers on human rights
MESUREMENT ON HUMAN RIGHTS
%
Maintain100%
20
40
60
80
100
%
0
Continuous Improvement
▪ Recycled waste ▪ Trash ▪ Hazardous waste
2012
39
5045 44
12
2013 2014 Goal2015
64
27
9
Total weight of waste by type and disposal method
MEASUREMENT ON WASTE
0
20
40
60
80
100
%
2012 2013 2014 Goal2015
Suppliers Audited regarding child labor
MESUREMENT ON HUMAN RIGHTS
91%100% Maintain
100%100%
11
0
35
9Continuous improvement
2012 2013 2014 Goal2015
Incident Rate Improvements
0
20
40
60
80
100
n/a n/a
56%
75%
2012 2013 2014 Goal2015
MESUREMENT ON SAFETY
HUMAN RIGHTS AND ANTI-CORRUPTION
%
20
40
60
80
100
%
Percentage of raw-material suppliers that have signed statements on human rights and anti-corruption
56
0
2
4
6
8
10
3,42,2 2,0 <2,3
2012 2013 2014 Goal2015
Incidents per 100 employessMESUREMENT ON SAFETY
20
40
60
80
100
0
81%
100%
2012 2013 2014 Goal2015
100%
Clauses in agreements with product suppliers on human rights
MESUREMENT ON HUMAN RIGHTS
%
Maintain100%
20
40
60
80
100
%
0
Continuous Improvement
▪ Recycled waste ▪ Trash ▪ Hazardous waste
2012
39
5045 44
12
2013 2014 Goal2015
64
27
9
Total weight of waste by type and disposal method
MEASUREMENT ON WASTE
0
20
40
60
80
100
%
2012 2013 2014 Goal2015
Suppliers Audited regarding child labor
MESUREMENT ON HUMAN RIGHTS
91%100% Maintain
100%100%
11
0
2
4
6
8
10
3,42,2 2,0 <2,3
2012 2013 2014 Goal2015
Incidents per 100 employessMESUREMENT ON SAFETY
20
40
60
80
100
0
81%
100%
2012 2013 2014 Goal2015
100%
Clauses in agreements with product suppliers on human rights
MESUREMENT ON HUMAN RIGHTS
%
Maintain100%
20
40
60
80
100
%
0
Continuous Improvement
▪ Recycled waste ▪ Trash ▪ Hazardous waste
2012
39
5045 44
12
2013 2014 Goal2015
64
27
9
Total weight of waste by type and disposal method
MEASUREMENT ON WASTE
0
20
40
60
80
100
%
2012 2013 2014 Goal2015
Suppliers Audited regarding child labor
MESUREMENT ON HUMAN RIGHTS
91%100% Maintain
100%100%
11
23 ANNUAL REPORT 14
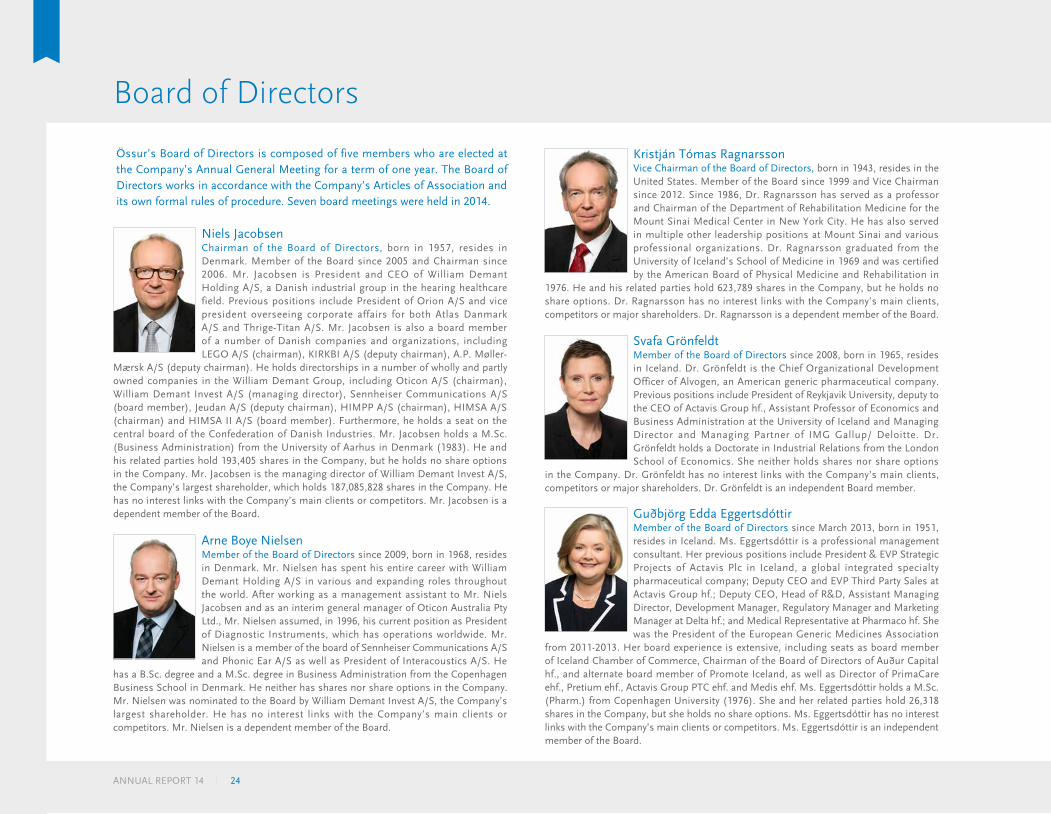
Niels JacobsenChairman of the Board of Directors, born in 1957, resides in Denmark. Member of the Board since 2005 and Chairman since 2006. Mr. Jacobsen is President and CEO of William Demant Holding A/S, a Danish industrial group in the hearing healthcare field. Previous positions include President of Orion A/S and vice president overseeing corporate affairs for both Atlas Danmark A/S and Thrige-Titan A/S. Mr. Jacobsen is also a board member of a number of Danish companies and organizations, including LEGO A/S (chairman), KIRKBI A/S (deputy chairman), A.P. Møller-
Mærsk A/S (deputy chairman). He holds directorships in a number of wholly and partly owned companies in the William Demant Group, including Oticon A/S (chairman), William Demant Invest A/S (managing director), Sennheiser Communications A/S (board member), Jeudan A/S (deputy chairman), HIMPP A/S (chairman), HIMSA A/S (chairman) and HIMSA II A/S (board member). Furthermore, he holds a seat on the central board of the Confederation of Danish Industries. Mr. Jacobsen holds a M.Sc. (Business Administration) from the University of Aarhus in Denmark (1983). He and his related parties hold 193,405 shares in the Company, but he holds no share options in the Company. Mr. Jacobsen is the managing director of William Demant Invest A/S, the Company’s largest shareholder, which holds 187,085,828 shares in the Company. He has no interest links with the Company’s main clients or competitors. Mr. Jacobsen is a dependent member of the Board.
Kristján Tómas RagnarssonVice Chairman of the Board of Directors, born in 1943, resides in the United States. Member of the Board since 1999 and Vice Chairman since 2012. Since 1986, Dr. Ragnarsson has served as a professor and Chairman of the Department of Rehabilitation Medicine for the Mount Sinai Medical Center in New York City. He has also served in multiple other leadership positions at Mount Sinai and various professional organizations. Dr. Ragnarsson graduated from the University of Iceland’s School of Medicine in 1969 and was certified by the American Board of Physical Medicine and Rehabilitation in
1976. He and his related parties hold 623,789 shares in the Company, but he holds no share options. Dr. Ragnarsson has no interest links with the Company’s main clients, competitors or major shareholders. Dr. Ragnarsson is a dependent member of the Board.
Svafa GrönfeldtMember of the Board of Directors since 2008, born in 1965, resides in Iceland. Dr. Grönfeldt is the Chief Organizational Development Officer of Alvogen, an American generic pharmaceutical company. Previous positions include President of Reykjavik University, deputy to the CEO of Actavis Group hf., Assistant Professor of Economics and Business Administration at the University of Iceland and Managing Director and Managing Partner of IMG Gallup/ Deloitte. Dr. Grönfeldt holds a Doctorate in Industrial Relations from the London School of Economics. She neither holds shares nor share options
in the Company. Dr. Grönfeldt has no interest links with the Company’s main clients, competitors or major shareholders. Dr. Grönfeldt is an independent Board member.
Guðbjörg Edda EggertsdóttirMember of the Board of Directors since March 2013, born in 1951, resides in Iceland. Ms. Eggertsdóttir is a professional management consultant. Her previous positions include President & EVP Strategic Projects of Actavis Plc in Iceland, a global integrated specialty pharmaceutical company; Deputy CEO and EVP Third Party Sales at Actavis Group hf.; Deputy CEO, Head of R&D, Assistant Managing Director, Development Manager, Regulatory Manager and Marketing Manager at Delta hf.; and Medical Representative at Pharmaco hf. She was the President of the European Generic Medicines Association
from 2011-2013. Her board experience is extensive, including seats as board member of Iceland Chamber of Commerce, Chairman of the Board of Directors of Auður Capital hf., and alternate board member of Promote Iceland, as well as Director of PrimaCare ehf., Pretium ehf., Actavis Group PTC ehf. and Medis ehf. Ms. Eggertsdóttir holds a M.Sc. (Pharm.) from Copenhagen University (1976). She and her related parties hold 26,318 shares in the Company, but she holds no share options. Ms. Eggertsdóttir has no interest links with the Company’s main clients or competitors. Ms. Eggertsdóttir is an independent member of the Board.
Arne Boye NielsenMember of the Board of Directors since 2009, born in 1968, resides in Denmark. Mr. Nielsen has spent his entire career with William Demant Holding A/S in various and expanding roles throughout the world. After working as a management assistant to Mr. Niels Jacobsen and as an interim general manager of Oticon Australia Pty Ltd., Mr. Nielsen assumed, in 1996, his current position as President of Diagnostic Instruments, which has operations worldwide. Mr. Nielsen is a member of the board of Sennheiser Communications A/S and Phonic Ear A/S as well as President of Interacoustics A/S. He
has a B.Sc. degree and a M.Sc. degree in Business Administration from the Copenhagen Business School in Denmark. He neither has shares nor share options in the Company. Mr. Nielsen was nominated to the Board by William Demant Invest A/S, the Company’s largest shareholder. He has no interest links with the Company’s main clients or competitors. Mr. Nielsen is a dependent member of the Board.
Board of Directors
Össur’s Board of Directors is composed of five members who are elected at the Company’s Annual General Meeting for a term of one year. The Board of Directors works in accordance with the Company’s Articles of Association and its own formal rules of procedure. Seven board meetings were held in 2014.
24ANNUAL REPORT 14

Executive Management
Jón SigurðssonÖssur President and Chief Executive Officer since 1996, born 1956, resides in the United States. He is a board member of Rio Tinto Alcan in Iceland and Chairman of the Icelandic American Chamber of Commerce. Mr. Sigurdsson was the Commercial Counselor for the Icelandic Trade Council in New York (1992-1996), Chief Financial Officer at Álafoss (1989-1991), Head of the International Division of Eimskip (1986-1989) and an engineer for Bang and Olufsen Denmark (1982-1984). He holds a B.Sc. degree in Industrial Engineering from Odense Technical College in Denmark and a Master’s degree in
Business Administration (MBA) from the United States International University in San Diego. Mr. Sigurdsson and his related parties hold 458,834 shares in the Company. He has no interest links with the Company’s main clients, competitors or major shareholders.
Mr. Sigurdsson’s experience as a member of the Board of Directors in other organizations includes:
• The Icelandic American Chamber of Commerce since 2012• Rio Tinto Alcan Iceland since 2003• The Icelandic Chamber of Commerce 2002-2012• Reykjavik University from 2002-2009• Samherji hf. from 2002-2006• The Icelandic Trade Council from 1997-2003• Research Liaison Office of the University of Iceland from 1996-2001
Ólafur GylfasonExecutive Vice President of Sales & Marketing, born 1969. Mr. Gylfason has been with Össur since 1997; from 2001-2013 as the Managing Director of EMEA and previous to that in emerging markets. Mr. Gylfason holds a degree in Business Administration from Bifrost School of Business. He continued his studies at Alborg University in Denmark, graduating with a Master’s degree in International Business Economics in 1997. Mr. Gylfason holds no shares in the Company.
Þorvaldur IngvarssonExecutive Vice President of R&D, born 1960, joined Össur in 2009 as Medical Officer. Dr. Ingvarsson holds an MD from University of Iceland and a Ph.D. from the University of Lund in Sweden with an emphasis on osteoarthritis and health economic outcomes. Prior to joining Össur, he held a medical director position and a CEO position within the hospital setting, and has 19 years of experience as an orthopaedic surgeon. Dr. Ingvarsson has been an Associate Professor at the University of Iceland since 2005 and a board member of Medor since 2011. He is an experienced board member, having served on
the board of the University Hospital in Akureyri (1998-2009) and various governmental committees in Iceland for innovation, healthcare and IT. Dr. Ingvarsson holds no shares in the Company.
Egill JónssonExecutive Vice President of Manufacturing and Operations, born 1957. Mr. Jónsson has been with Össur since 1996, and led the division from that period. He was formerly a Project Manager at VGK hf (1985-1996), an Engineering firm in Reykjavik. Mr. Jónsson has a Master’s degree in Mechanical Engineering from the Technical University in Copenhagen, DTU (1984). He and his related parties hold 822,749 shares in the Company.
Jos van PoortenManaging Director of EMEA, born in 1964. Mr. van Poorten has been with Össur since 2002. For the first 10 years he was the Financial Director for Össur EMEA and, since 2013, the Managing Director of EMEA. He has a Bachelor’s degree in Economics and a Master’s degree in Controlling from the University of Maastricht in Holland. Mr. van Poorten holds no shares in the Company.
Margrét Lára FriðriksdóttirExecutive Vice President of HR and Corporate Strategy, born in 1978. Mrs. Fridriksdóttir has been with Össur since 2000 in various roles. She has a Bachelor’s degree in Business Administration and a Master’s degree in Management and Strategy from the University of Iceland. Mrs. Fridriksdóttir holds 14,100 shares in the Company.
Sveinn SölvasonChief Financial Officer (CFO), since May 2013, born in 1978. Mr. Solvason has been with Össur since 2009, previously as Director of Treasury and Corporate Development. Prior to joining Össur he worked at Marel, Kaupthing Bank, Goldman Sachs and HSH-Nordbank. Mr. Solvason holds a Master’s degree in Finance and Accounting (Cand.Merc.FIR) from Copenhagen Business School. He holds no shares in the Company.
25 ANNUAL REPORT 14
Össur Shares
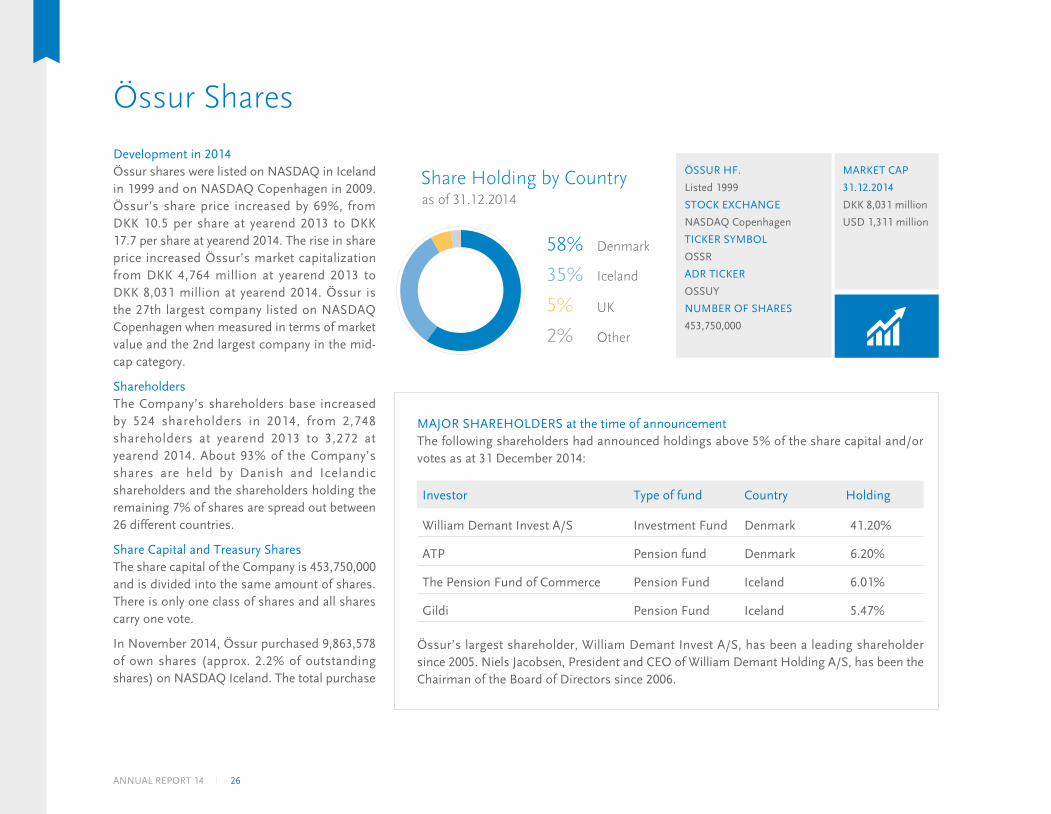
Development in 2014Össur shares were listed on NASDAQ in Iceland in 1999 and on NASDAQ Copenhagen in 2009. Össur’s share price increased by 69%, from DKK 10.5 per share at yearend 2013 to DKK 17.7 per share at yearend 2014. The rise in share price increased Össur’s market capitalization from DKK 4,764 million at yearend 2013 to DKK 8,031 million at yearend 2014. Össur is the 27th largest company listed on NASDAQ Copenhagen when measured in terms of market value and the 2nd largest company in the mid-cap category.
ShareholdersThe Company’s shareholders base increased by 524 shareholders in 2014, from 2,748 shareholders at yearend 2013 to 3,272 at yearend 2014. About 93% of the Company’s shares are held by Danish and Icelandic shareholders and the shareholders holding the remaining 7% of shares are spread out between 26 different countries.
Share Capital and Treasury SharesThe share capital of the Company is 453,750,000 and is divided into the same amount of shares. There is only one class of shares and all shares carry one vote.
In November 2014, Össur purchased 9,863,578 of own shares (approx. 2.2% of outstanding shares) on NASDAQ Iceland. The total purchase
ÖSSUR HF.
Listed 1999
STOCK EXCHANGE
NASDAQ Copenhagen
TICKER SYMBOL
OSSR
ADR TICKER
OSSUY
NUMBER OF SHARES
453,750,000
MARKET CAP
31.12.2014
DKK 8,031 million
USD 1,311 million
58% Denmark
35% Iceland
5% UK
2% Other
Share Holding by Countryas of 31.12.2014
Investor Type of fund Country Holding
William Demant Invest A/S Investment Fund Denmark 41.20%
ATP Pension fund Denmark 6.20%
The Pension Fund of Commerce Pension Fund Iceland 6.01%
Gildi Pension Fund Iceland 5.47%
MAJOR SHAREHOLDERS at the time of announcementThe following shareholders had announced holdings above 5% of the share capital and/or votes as at 31 December 2014:
Össur’s largest shareholder, William Demant Invest A/S, has been a leading shareholder since 2005. Niels Jacobsen, President and CEO of William Demant Holding A/S, has been the Chairman of the Board of Directors since 2006.
26ANNUAL REPORT 14
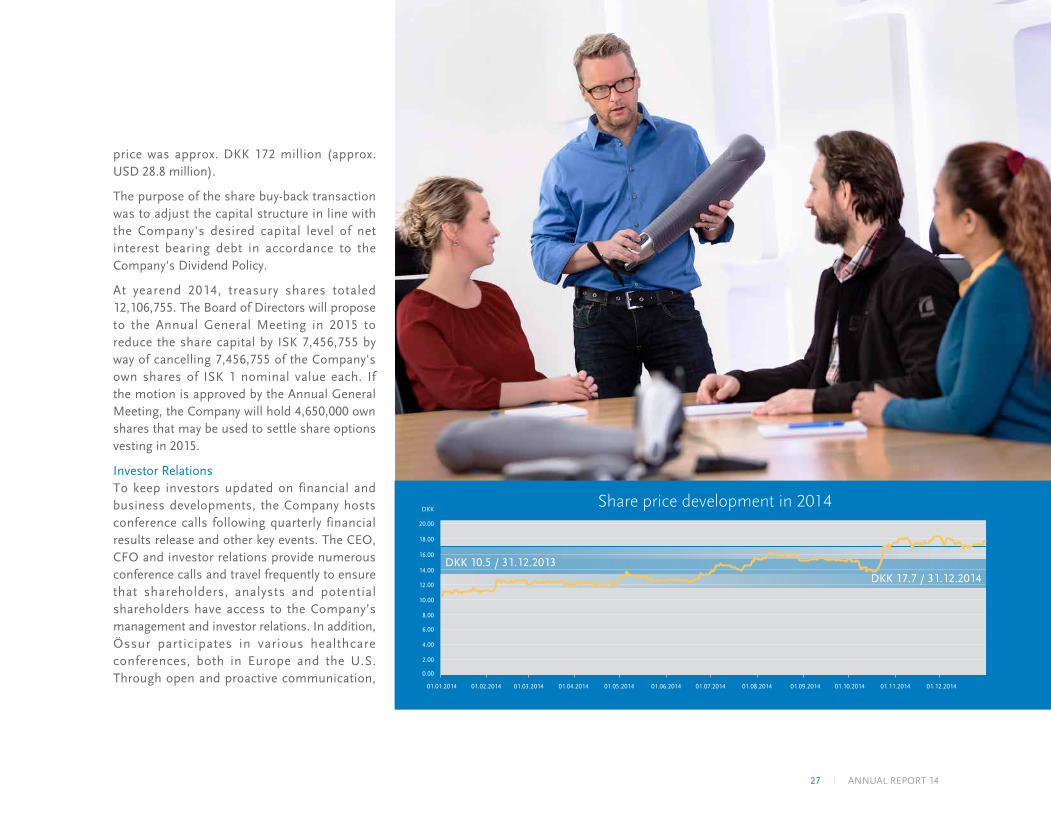
price was approx. DKK 172 million (approx. USD 28.8 million).
The purpose of the share buy-back transaction was to adjust the capital structure in line with the Company's desired capital level of net interest bearing debt in accordance to the Company's Dividend Policy.
At yearend 2014, treasury shares totaled 12,106,755. The Board of Directors will propose to the Annual General Meeting in 2015 to reduce the share capital by ISK 7,456,755 by way of cancelling 7,456,755 of the Company's own shares of ISK 1 nominal value each. If the motion is approved by the Annual General Meeting, the Company will hold 4,650,000 own shares that may be used to settle share options vesting in 2015.
Investor RelationsTo keep investors updated on financial and business developments, the Company hosts conference calls following quarterly financial results release and other key events. The CEO, CFO and investor relations provide numerous conference calls and travel frequently to ensure that shareholders, analysts and potential shareholders have access to the Company’s management and investor relations. In addition, Össur participates in various healthcare conferences, both in Europe and the U.S. Through open and proactive communication, 0.00
2.00
4.00
6.00
8.00
10.00
12.00
14.00
16.00
18.00
20.00
DKK
01.01.2014 01.02.2014 01.03.2014 01.04.2014 01.05.2014 01.06.2014 01.07.2014 01.08.2014 01.09.2014 01.10.2014 01.11.2014 01.12.2014
DKK 10.5 / 31.12.2013DKK 17.7 / 31.12.2014
Share price development in 2014
27 ANNUAL REPORT 14
the Company seeks to provide the basis for fair and efficient pricing of its shares.
Össur regularly hosts Capital Markets Day, presenting and introducing various aspects of the Company to its stakeholders. The next Capital Markets Day will be held in Copenhagen in June 2015.
IR PolicyThe Company’s IR policy is to disclose financial and corporate information in order to provide comprehensive and accurate information to investors, analysts and other stakeholders. This disclosure helps investors, analysts and other stakeholders better understand Össur’s current and expected developments.
At all times, Össur complies with relevant laws and regulations, as well as the disclosure obligations of NASDAQ. Össur adheres to the principle of equal treatment of all stakeholders.
Quiet PeriodThe end of a quarter up until the day of release of the relevant quarterly materials is considered a “quiet period.” For the full-year report, a period of four weeks prior to the release of the report is considered a quiet period. During the quiet period, Össur does not comment on matters related to financial results or expectations.
Further details about Össur’s IR policy can be found on the Company’s website: www.ossur.com/investors
Capital Structure and Dividend PolicyThrough consistent profitability, growth and strong cash flow, Össur has built a strong balance sheet. At yearend 2012, Össur had decreased its debt levels significantly and was in a position to return capital to shareholders. Therefore, the Board of Directors proposed a Dividend Policy to the shareholders at the March 2013 AGM. In February 2015, the Dividend Policy was extended to a Capital Structure and Dividend Policy. The Capital Structure and Dividend Policy enables the management to optimize the capital structure, manage interest bearing debt level and maintain flexibility for acquisitions.
Current Capital Structure and Dividend PolicyÖssur’s policy is to maintain a healthy balance sheet and a level of net interest bearing debt of USD 50-140 million.
Excess capital is returned to shareholders via annual cash dividends and/or purchase of own shares.
Össur’s policy is to distribute a relatively stable cash dividend. The cash dividends will be decided annually in DKK per share.
Return of capital to shareholders is based on objectives of maintaining a solid financial position, operational outlook and investment requirements.
The Board of Directors will propose to the Annual General Meeting in 2015 that the Company pays a cash dividend of DKK 0.12 per share for 2014, an increase of 20% from 2013 and equivalent to 14% of net earnings in 2014.
Annual General MeetingAccording to the Company’s Articles of Association, the AGM should be held before the end of April. The meeting is convened with at least three weeks’ notice, using the same procedures as other shareholders meetings. The AGM results are sent to the Stock Exchange immediately following the meeting, and are also made available on the Company’s website.
Össur’s AGM will be held at the Company’s headquarters in Iceland on 12 March 2015.
Contact Investor Relations:Eva Soley GudbjornsdottirVice President of Investor RelationsTel.: +354 664 1155e-mail: [email protected]
Financial Calendar for 2015
12 March 2015 AGM 2015
29 April 2015 Q1 Results
23 July 2015 Q2 Results
22 October 2015 Q3 Results
2 February 2016 Q4/FY Results
10 March 2016 AGM 2016
28ANNUAL REPORT 14
DENMARK
ABG Sundal Collier Morten LarsenTel: Tel: +45 35 46 30 19e-mail: [email protected]
CarnegieNiels Granholm-Leth Tel: +45 32 88 02 58e-mail: [email protected]
Danske BankThomas BowersTel: +45 45 12 80 44e-mail: [email protected]
Nordea MarketsSøren Vinter Holm SørensenTel: +45 33 33 55 35e-mail: [email protected]
SEB EnskildaPeter Hugreffe Tel: +45 33 28 33 04e-mail: [email protected]
Össur Press Releases in 2014
29.01 FY/Q4 Results 2013 – Conference call 6 Feb
05.02 Full year results 2013
06.02 Share options settled
20.02 Annual General Meeting (AGM)14 March
20.02 Annual Report 2013
28.02 AGM final agenda and proposals
11.03 Candidates to the Board of Directors
14.03 Results of AGM
14.03 Board decisions following the AGM 14 March
25.04 Q1 Results – Conference call 30 April
29.04 Q1 Results
30.04 Insider trading
25.06 Major shareholder announcement
16.07 Q2 Results – Conference call 25 July
24.07 Q2 Results
16.10 Q3 Results – Conference call 24 October
23.10 Q3 Results
03.11 Share options settled
17.11 Trading of own shares
17.11 Major shareholder announcement
17.11 Share buy-back
19.12 Reporting calendar 2015
Shareholder Information on the InternetÖssur’s website is updated frequently throughout the year with information about the Company’s results, strategy, products, and other activities. All company announcements, financial statements and teleconferences can be viewed and downloaded from the website. Information about the share price development
and other share related information can also be found on the website. In addition, the website contains extensive information about the Company’s products and technology.
www.ossur.com –www.ossur.com/investors
ICELAND
Arion banki Stefán Broddi Guðjónsson Tel: +354 444 6959 e-mail: [email protected]
IFS Ráðgjöf Jóhann Viðar Ívarsson Tel: +354 533 4603 e-mail: [email protected]
Össur hf. Analysts
29 ANNUAL REPORT 14
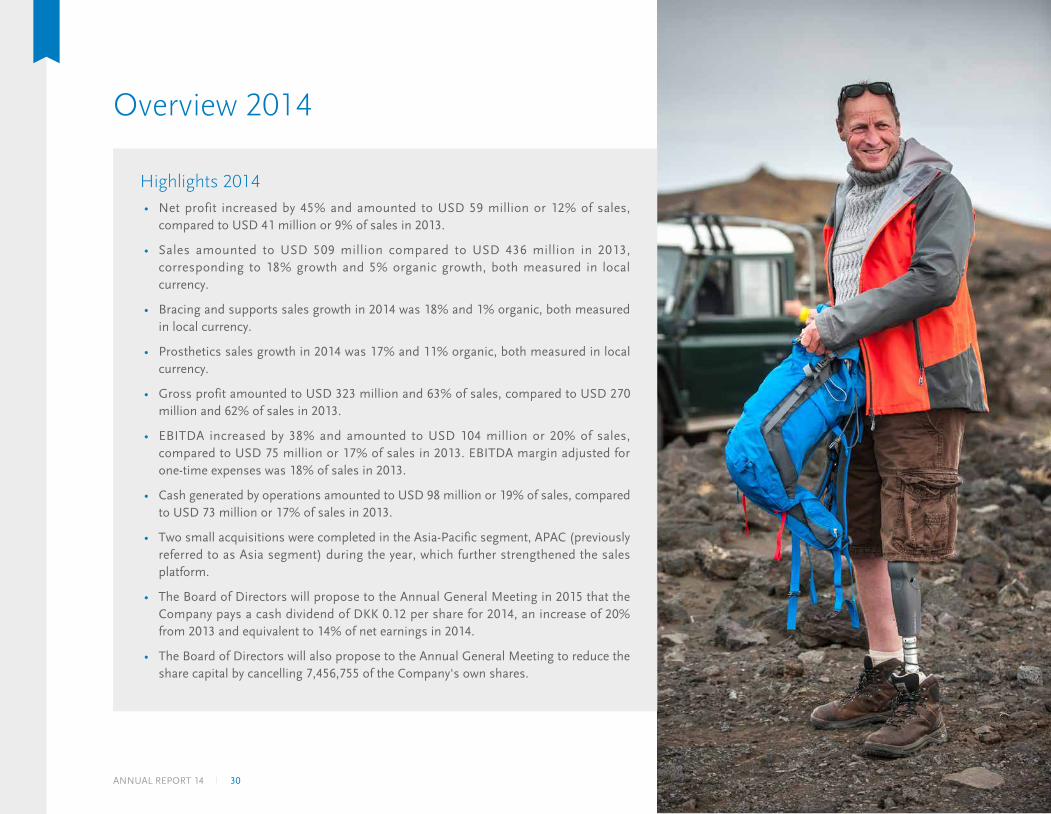
Overview 2014
Highlights 2014 • Net profit increased by 45% and amounted to USD 59 million or 12% of sales,
compared to USD 41 million or 9% of sales in 2013.
• Sales amounted to USD 509 million compared to USD 436 million in 2013, corresponding to 18% growth and 5% organic growth, both measured in local currency.
• Bracing and supports sales growth in 2014 was 18% and 1% organic, both measured in local currency.
• Prosthetics sales growth in 2014 was 17% and 11% organic, both measured in local currency.
• Gross profit amounted to USD 323 million and 63% of sales, compared to USD 270 million and 62% of sales in 2013.
• EBITDA increased by 38% and amounted to USD 104 million or 20% of sales, compared to USD 75 million or 17% of sales in 2013. EBITDA margin adjusted for one-time expenses was 18% of sales in 2013.
• Cash generated by operations amounted to USD 98 million or 19% of sales, compared to USD 73 million or 17% of sales in 2013.
• Two small acquisitions were completed in the Asia-Pacific segment, APAC (previously referred to as Asia segment) during the year, which further strengthened the sales platform.
• The Board of Directors will propose to the Annual General Meeting in 2015 that the Company pays a cash dividend of DKK 0.12 per share for 2014, an increase of 20% from 2013 and equivalent to 14% of net earnings in 2014.
• The Board of Directors will also propose to the Annual General Meeting to reduce the share capital by cancelling 7,456,755 of the Company's own shares.
30ANNUAL REPORT 14
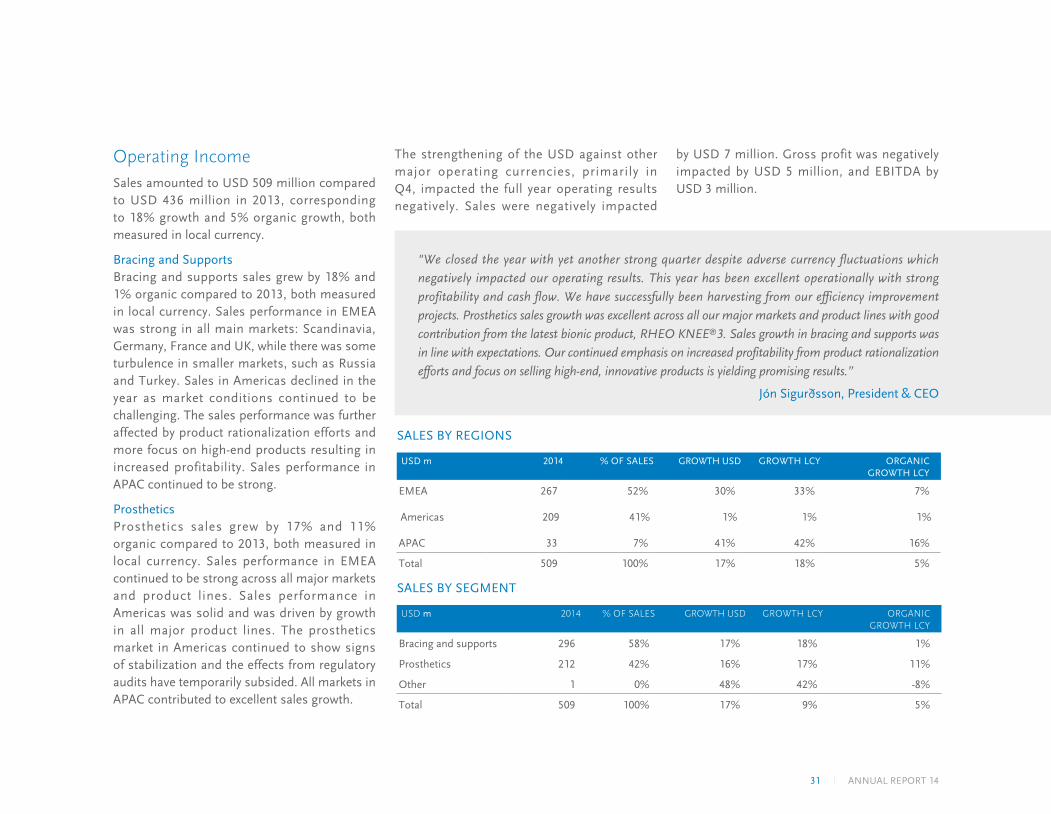
SALES BY REGIONS
USD m 2014 % OF SALES GROWTH USD GROWTH LCY ORGANIC GROWTH LCY
EMEA 267 52% 30% 33% 7%
Americas 209 41% 1% 1% 1%
APAC 33 7% 41% 42% 16%
Total 509 100% 17% 18% 5%
SALES BY SEGMENT
USD m 2014 % OF SALES GROWTH USD GROWTH LCY ORGANIC GROWTH LCY
Bracing and supports 296 58% 17% 18% 1%
Prosthetics 212 42% 16% 17% 11%
Other 1 0% 48% 42% -8%
Total 509 100% 17% 9% 5%
Operating IncomeSales amounted to USD 509 million compared to USD 436 million in 2013, corresponding to 18% growth and 5% organic growth, both measured in local currency.
Bracing and SupportsBracing and supports sales grew by 18% and 1% organic compared to 2013, both measured in local currency. Sales performance in EMEA was strong in all main markets: Scandinavia, Germany, France and UK, while there was some turbulence in smaller markets, such as Russia and Turkey. Sales in Americas declined in the year as market conditions continued to be challenging. The sales performance was further affected by product rationalization efforts and more focus on high-end products resulting in increased profitability. Sales performance in APAC continued to be strong.
ProstheticsProsthetics sales grew by 17% and 11% organic compared to 2013, both measured in local currency. Sales performance in EMEA continued to be strong across all major markets and product lines. Sales performance in Americas was solid and was driven by growth in all major product lines. The prosthetics market in Americas continued to show signs of stabilization and the effects from regulatory audits have temporarily subsided. All markets in APAC contributed to excellent sales growth.
The strengthening of the USD against other major operating currencies, primarily in Q4, impacted the full year operating results negatively. Sales were negatively impacted
"We closed the year with yet another strong quarter despite adverse currency fluctuations which negatively impacted our operating results. This year has been excellent operationally with strong profitability and cash flow. We have successfully been harvesting from our efficiency improvement projects. Prosthetics sales growth was excellent across all our major markets and product lines with good contribution from the latest bionic product, RHEO KNEE®3. Sales growth in bracing and supports was in line with expectations. Our continued emphasis on increased profitability from product rationalization efforts and focus on selling high-end, innovative products is yielding promising results.”
Jón Sigurðsson, President & CEO
by USD 7 million. Gross profit was negatively impacted by USD 5 million, and EBITDA by USD 3 million.
31 ANNUAL REPORT 14
tax rate in 2013. The drop in the effective tax rate in 2014 is due to a one-off revaluation of a deferred tax liability as a result of recent changes in state tax regulations in the U.S.
Net profit increased by 45% and amounted to USD 59 million or 12% of sales, compared to USD 41 million or 9% of sales in 2013.
Diluted earnings per share amounted to 13.1 U.S. cents, compared to 9.1 U.S. cents in 2013, increasing by 44%.
Cash FlowCash generated by operations amounted to USD 98 million or 19% of sales, compared to USD 73 million and 17% of sales in 2013. The cash flow was driven by strong cash flow from operations and positive impact from net working capital.
Capital expenditures during the year amounted to USD 17 million or 3.3% of sales, compared to USD 17 million and 3.9% of sales in 2013.
AcquisitionsTwo small acquisitions were completed in APAC during the year, one in Q1 and the other in the beginning of Q3, further strengthening the sales platform in the region. These acquisitions, and a recent acquisition in Scandinavia, are performing according to plan.
Financial Guidance for 2015 The financial guidance for the full year of 2015 is as follows:
• Total sales growth LCY in the range of 4-6%
• Organic sales growth LCY in the range of 3-5%
• EBITDA margin in the range of 20-21% of sales
• Capital expenditures in the range of 2.5-3.5% of sales
• Effective tax rate around 26%
The financial guidance assumes the prevailing economic outlook in key markets and no major fluctuations of major operating currencies.
Total sales growth is expected to be 4-6% and organic sales growth is expected to be 3-5%, both measured in local currency. The difference between the expected total sales growth and expected organic sales growth is due to full year impact from an acquisition in APAC made in Q3 2014. In prosthetics, continued strong performance is expected in key markets although at lower growth rates than observed in 2014. In bracing and supports, EMEA and APAC sales performance is expected to be good, while sales in Americas will continue to be challenged by difficult market conditions and affected by product rationalization efforts, and an increased focus on high-end products.
Gross ProfitGross profit amounted to USD 323 million and 63% of sales, compared to USD 270 million and 62% of sales in 2013. The increase in the gross profit margin when comparing to 2013 was a result of favorable product mix changes and efficiency in manufacturing while the margin was negatively impacted by currency fluctuations.
EBITDAEBITDA increased by 38% and amounted to USD 104 million or 20% of sales, compared to USD 75 million or 17% of sales. EBITDA margin adjusted for one-time expenses was 18% of sales in 2013.
The increase in EBITDA and EBITDA margin was largely a result of improved gross profit margin and efficient operations. Currency fluctuations have marginal negative impact on the EBITDA margin when compared to 2013.
Financial Items, Tax and Net ProfitNet financial expenses amounted to USD 8 million compared to USD 4 million in 2013. Net exchange rate difference was negative by USD 4 million compared to positive USD 1 million in 2013. However, interest expenses continue to decrease as a result of lower debt and lower interest rates on the debt.
Income tax amounted to USD 18 million, corresponding to a 24% effective tax rate, compared to USD 14 million and 26% effective
32ANNUAL REPORT 14
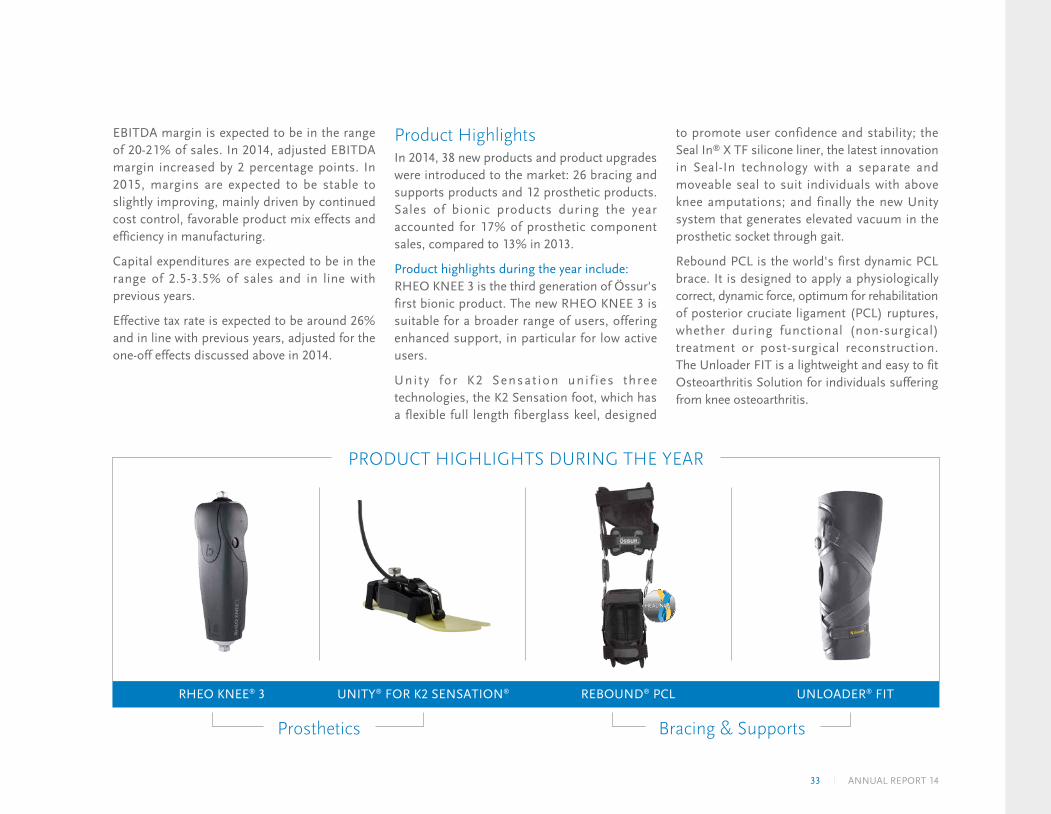
RHEO KNEE® 3 UNITY® FOR K2 SENSATION® REBOUND® PCL UNLOADER® FIT
Prosthetics
PRODUCT HIGHLIGHTS DURING THE YEAR
Bracing & Supports
EBITDA margin is expected to be in the range of 20-21% of sales. In 2014, adjusted EBITDA margin increased by 2 percentage points. In 2015, margins are expected to be stable to slightly improving, mainly driven by continued cost control, favorable product mix effects and efficiency in manufacturing.
Capital expenditures are expected to be in the range of 2.5-3.5% of sales and in line with previous years.
Effective tax rate is expected to be around 26% and in line with previous years, adjusted for the one-off effects discussed above in 2014.
Product HighlightsIn 2014, 38 new products and product upgrades were introduced to the market: 26 bracing and supports products and 12 prosthetic products. Sales of bionic products during the year accounted for 17% of prosthetic component sales, compared to 13% in 2013.
Product highlights during the year include:RHEO KNEE 3 is the third generation of Össur's first bionic product. The new RHEO KNEE 3 is suitable for a broader range of users, offering enhanced support, in particular for low active users.
Uni ty for K2 Sensat ion uni f ies three technologies, the K2 Sensation foot, which has a flexible full length fiberglass keel, designed
to promote user confidence and stability; the Seal In® X TF silicone liner, the latest innovation in Seal-In technology with a separate and moveable seal to suit individuals with above knee amputations; and finally the new Unity system that generates elevated vacuum in the prosthetic socket through gait.
Rebound PCL is the world's first dynamic PCL brace. It is designed to apply a physiologically correct, dynamic force, optimum for rehabilitation of posterior cruciate ligament (PCL) ruptures, whether during functional (non-surgical) treatment or post-surgical reconstruction. The Unloader FIT is a lightweight and easy to fit Osteoarthritis Solution for individuals suffering from knee osteoarthritis.
33 ANNUAL REPORT 14
Risk Factors
Investment in Össur’s shares involves a high degree of risk. Össur’s business, financial conditions and results of operations going forward rest upon certain assumptions and could be seriously harmed if any of the factors described below occur. The Company cannot ensure that its assumptions will be correct. Furthermore, additional risks and uncertainties not presently known to Össur, or that it currently deems immaterial, may adversely affect its business operations and financial results. The risk factors discussed below are not listed in order of priority.
General RisksÖssur’s assumptions regarding market trends may prove incorrect.Assumptions regarding demographic trends are important factors in Össur’s business decisions. The Company expects, for example, that the population of elderly will continue to grow, that an increasing proportion of this population will live an active lifestyle and that the number of people with diabetes will increase in the future. No assurance can be made that these assumptions will prove to be correct or that these demographic trends will result in a demand for the Company’s products and services.
Össur is subject to risks related to its international operations.
Headquartered in Reykjavík, Iceland, Össur has significant operations in the U.S. and Europe, as well as operations in Asia, Australia, Africa and South-America. Össur’s business and operations are therefore subject to various risks inherent to international operations. Such risks include, among others, recessionary trends, inflation, instability of financial markets, exposure to different legal standards and enforcement mechanisms, trade barriers, rules regarding the origins of products, labor unrest, foreign exchange controls, human rights, corruption and political and social instability.
Product liability claims could adversely impact Össur’s financial conditions, operations and reputation.Össur is responsible for the safety and effectiveness of its products. Össur engages in internal quality control and product testing procedures to mitigate the risk and also carries insurance. However, the Company cannot guarantee that it won’t be found liable for a product liability claim in the future or that the insurance coverage is sufficient or will continue to be available on commercially reasonable terms.
Össur’s business is subject to healthcare industry reforms and legislative and regulatory changes. Most of Össur’s products and services are reimbursed by third-party payers, including both government healthcare programs and private health insurance plans. All third-party
payers have developed and continue to develop increasingly sophisticated or aggressive methods of controlling healthcare costs, including review of claims, selective contracting and competitive bidding. These cost-control methods also potentially limit or even eliminate the coverage and the amount of payment for which third-party payers may be willing to pay for medical products and services. As such, the continuing efforts of both governmental and private payers of healthcare to contain or reduce costs, could lead to patients being unable to obtain approval for payment from these third-party payers. If that were to occur, sales of Össur’s products and services may decline significantly and its customers may reduce or eliminate purchases. Reviews of claims may lead to repayment of prior sales. Future legislative or regulatory initiatives directed at reducing costs could be introduced. In addition, changing healthcare trends such as increasing premiums or deductibles for patients may have an adverse effect on Össur’s business. The Company cannot predict the impact of future legislative or regulatory initiatives on its business.
O&P clinics depend on publicly and/or privately funded patients. Insurance coverage varies greatly between countries and considerable sales and profit in Össur’s O&P clinics are directly dependent on government contracts and tender business. Government contracts are subject to policy
34ANNUAL REPORT 14

35 ANNUAL REPORT 14
changes and subsequent loss in sales and profit. Tender contracts for O&P clinical services are regularly renewed and can be lost to competitors with a direct negative impact on the business.
Össur is required to comply with regulatory requirements and receive regulatory clearance and approval for its products or operations.Össur’s products are medical devices that are subject to extensive regulation in the U.S. by the Food and Drug Administration (FDA), and by respective authorities in other countries where Össur conducts its business. Such regulation
can restrict virtually all aspects of a medical device’s design and testing, manufacture, safety, labeling, storage, recordkeeping, reporting, clearance and approval, promotion, distribution and services. Failure to comply with the regulatory requirements of the applicable authority may subject a company to administrative or judicially imposed sanctions ranging from warning letters to criminal penalties or product withdrawal. Össur’s failure to comply with regulatory requirements or receive regulatory clearance and approval for its products or operations, including healthcare fraud and abuse laws and regulations, would
adversely affect Össur’s sales and potential for future growth.
Össur is exposed to litigation from international investors.Össur has an international shareholder base and is therefore exposed to risk of litigation from international investors.
Risks Related to Human Resources Össur needs to attract and retain qualified and competent human resources. Össur continuously works to attract and retain qualified and competent employees to maintain Össur’s innovative edge and financial success. Failing to attract and retain key employees, managers and experts, or not developing them adequately, puts the Company at risk.
Össur is exposed to employee litigation, regulatory sanctions and strikes. Össur is exposed to risk of litigation and regulatory sanctions for employment practices. The Company mitigates these risks by adhering to relevant policies and procedures, educating managers on best practices, monitoring changes to employment legislation and carrying insurance. However, the Company cannot guarantee that it will not be found liable in the future or that insurance coverage is sufficient or will continue to be available on commercially reasonable terms. Össur is also exposed to risk related to strikes.
36ANNUAL REPORT 14
Risks Related to Corporate Finance Risk relating to acquisitions.A substantial proportion of Össur’s growth in recent years has been driven by acquisitions. No assurance can be given that Össur will be successful in identifying appropriate acquisition targets in the key markets in which the Company operates or desires to operate. Acquisitions involve a number of risks, including diversion of management resources and management focus, integration risk, unexpected or high integration costs, failure to retain key employees of the acquired business and failure to attain expected synergies. To mitigate risk, Össur conducts due diligence on the operations of acquisition targets and seeks protection through representations and warranties from the sellers.
Össur is exposed to financing risks and instability within financial markets.As a global business Össur is exposed to various risk factors originating in the international financial markets, among which are liquidity risk, interest rate risk, foreign exchange risk, credit risk and counterparty risk on cash held with financial institutions. These risk factors are managed according to internal rules that are outlined in the Company’s treasury policy. Össur’s functional and reporting currency is the U.S. dollar, hence fluctuations in local currencies can have an impact on the operations of the Company. Össur does not utilize derivatives or other financial instruments for hedging risk relating to currency fluctuations.
Fluctuation in the exchange rates between the U.S. dollar, Euro, Icelandic krona and other markets currencies where Össur operates can therefore have an impact on the financial condition and results of Össur’s operations.
Össur’s financing and tax structure are subject to laws and governmental approvals.Össur is committed to complying with tax rules and paying all legally required taxes. At the same time, the Company has a responsibility to the shareholders to legally minimize costs and maximize earnings. Össur’s tax strategy is to strive for optimizing taxes through a flexible and effective financing and tax structure. The goal is to balance benefits against risks and costs while at the same time meeting reporting obligations, compliance obligations and corporate social responsibilities. Össur recognizes that some areas are not free from doubt and that differing legal interpretations may be possible, meaning that from time to time, tax authorities may not share or question Össur’s interpretation. Also, relevant laws and regulations may change, resulting in higher taxes or required changes may have to be made to the tax and legal structure.
Össur is dependent on IT systems.Össur’s business is supported by several systems. The systems that are classified as mission critical are the ERP, warehouse, phone and email systems, as well as infrastructure like servers, networks, databases and storage systems. Failure in these systems can have
a serious impact on the business, such as reduced or lost ability to receive orders, complete deliveries or manufacture. To improve reliability, Össur consolidated its systems into one highly reliable data center in the U.S. and mission critical systems are replicated in a disaster recovery site located in Europe.
Össur’s activities are subject to privacy laws, which could have an impact on its operations.Data privacy laws and regulations, including the Health Insurance Portability and Accountability Act in the U.S. regulate the transmission, maintenance, use and disclosure of protected health information. There are costs and administrative burdens associated with ongoing compliance with these data privacy laws and any failure to comply with current and applicable future requirements could adversely affect Össur’s profitability.
Risks Related to Research & Development Össur may be adverse l y a f fec ted by developments in medicine.Össur’s main products are intended to improve the quality of life for individuals suffering the effects of injuries, amputations or illnesses. No assurance can be given that Össur’s target market will not be materially diminished by advances in medical science or that Össur will be able to generate comparable sales from alternative market segments.
37 ANNUAL REPORT 14
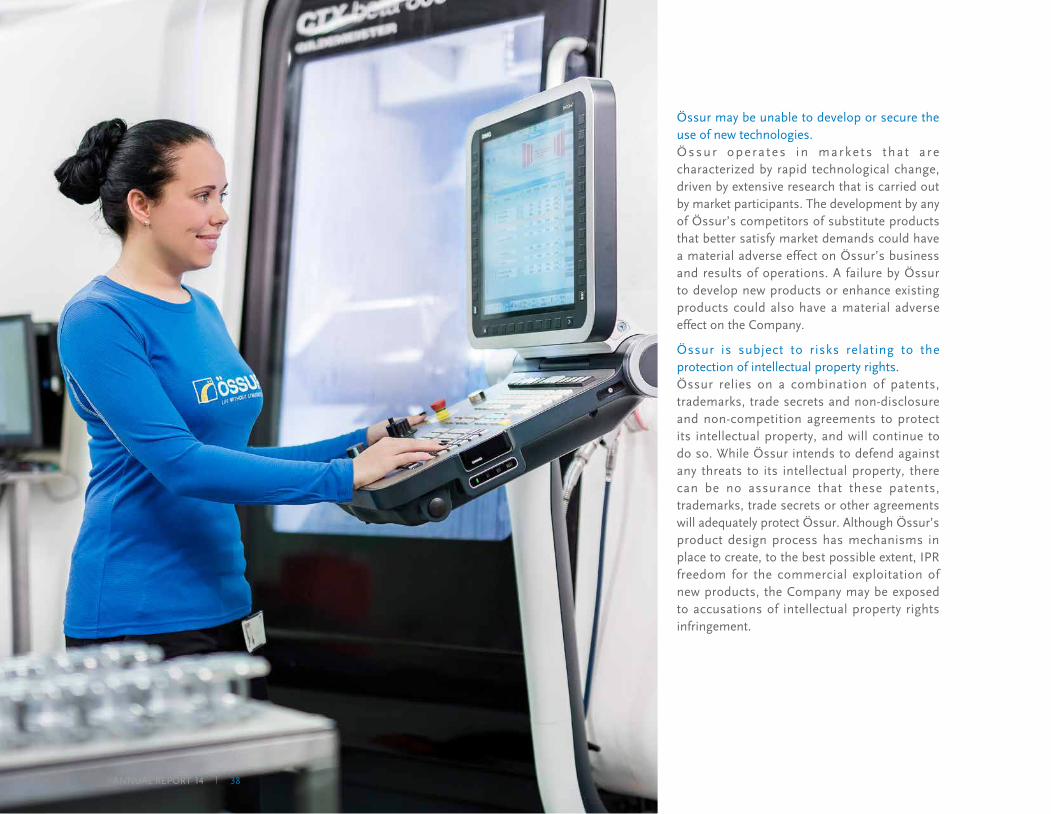
Össur may be unable to develop or secure the use of new technologies.Össur opera tes in marke ts tha t a re characterized by rapid technological change, driven by extensive research that is carried out by market participants. The development by any of Össur’s competitors of substitute products that better satisfy market demands could have a material adverse effect on Össur’s business and results of operations. A failure by Össur to develop new products or enhance existing products could also have a material adverse effect on the Company.
Össur is subject to risks relating to the protection of intellectual property rights.Össur relies on a combination of patents, trademarks, trade secrets and non-disclosure and non-competition agreements to protect its intellectual property, and will continue to do so. While Össur intends to defend against any threats to its intellectual property, there can be no assurance that these patents, trademarks, trade secrets or other agreements will adequately protect Össur. Although Össur’s product design process has mechanisms in place to create, to the best possible extent, IPR freedom for the commercial exploitation of new products, the Company may be exposed to accusations of intellectual property rights infringement.
38ANNUAL REPORT 14
Risks Related to Sales & MarketingÖssur relies on healthcare professionals and other agents in connection with the sale and distribution of its products.Össur’s sales depend primarily on the prescriptions and recommendations of its products by healthcare professionals. The Company has developed and maintained close relationships with a number of orthopaedics and prosthetic (O&P) clinics that support and recommend the Company’s products. A failure to maintain the support of such orthopaedics professionals and O&P clinics, or a failure to develop relationships with new healthcare professionals and O&P clinics, could adversely affect Össur’s business and results of operations.
Össur may not maintain and increase its position as a market leader in non-invasive orthopaedics.Össur’s aim is to play a leading role in the likely continuance of consolidation in its markets. Össur’s success is subject to multiple factors both internal and external. As for external factors, the risk remains that competitors may accelerate the consolidation of the market, and strengthen their own position, at the expense of other participants like Össur. Additionally, competition from emerging markets or new competitors could undermine Össur’s market position.
Össur also positions most of its products and services in the high-end market. Failing to provide sufficient evidence for higher value products and services to payers, customers and patients might result in a price shift or loss of business affecting the overall business of Össur. Össur also maintains its market position by relying upon a strong brand image and reputation, which creates a risk that the brand’s position could be adversely affected by the actions of Össur’s employees or brand ambassadors.
Össur relies on agents and third-party distributors in connection with the sale and distribution of its products.Third-party agents and distributors sell a portion of Össur’s products. The Company’s largest wholesale customer accounted for 5% of the Company’s net sales at year-end 2014. Other distributors accounted for less than 2% of net sales for the same period. These agents and distributors are not employees of Össur and Össur may be unable to influence their actions and performance.
Risks Related to Manufacturing & OperationsÖssur is vulnerable to disruptions to its production and distribution facilities.Össur’s production and distribution facilities may be adversely affected by man-made or natural disasters. Össur has worked on certain
risk ranking programs in all its manufacturing facilities, and successfully reduced the level of risk and increased awareness among employees. However, a disruption of Össur’s production facilities could adversely affect the Company’s production output which, in turn, would impair the Company’s ability to fulfil customer orders. This could lead to a decline in sales and increased costs due to necessary shifts in production within the Company and the possible need to outsource production. The Company maintains insurance to cover such losses. No assurance can be given, however, that insurance payments would be sufficient to cover the full loss resulting from a disruption in Össur’s production or that Össur’s insurance would cover the event that causes the disruption.
Össur is dependent on certain suppliersÖssur is dependent on suppliers that manufacture products for the Company. Failure to deliver products or breakdown of one of Össur’s key suppliers could adversely affect the financial results of the Company. To mitigate this risk Össur audits its suppliers on regular basis.
Össur is dependent on certain raw materials.Össur’s products require silicone, carbon, metals and other raw materials. Such raw materials may not always be available on favourable terms, or at all.
39 ANNUAL REPORT 14
This statutory statement on corporate governance is made in accordance with Article 66 (c) of the Icelandic Financial Statements Act No. 3/2006, as amended. This statement has been approved by the Board of Directors and is published in the Annual Report and on the Company’s website. This statement covers the financial year that ended on 31 December 2014.
This statement includes information on the following items:
• A reference to the corporate governance recommendations the Company follows and how the Company addresses the recommendations, including any deviations and explanations thereto.
• A description of the main aspects of internal controls and risk management systems in connection with the preparation of financial statements.
• A d e s c r i p t i o n o f t h e C o m p a n y ’ s organizational structure and the role and composition of each function.
1. Corporate GovernanceThe Company has chosen to follow the Danish Recommendations on Corporate Governance because the Company’s shares are traded on NASDAQ OMX Copenhagen. In the explanations of clause 4.3 of NASDAQ OMX Copenhagen’s rules for issuers of shares, it is recommended to apply the Danish
Recommendations if foreign companies are not subject to other rules. Applying the Danish Recommendations will also make it easier for investors on the Danish market to assess the Company’s corporate governance practices.
The la tes t Danish Recommendat ions on Corporate Governance, issued by the Corporate Governance Committee in May 2013 and updated in November 2014, are available on the Committee’s website: www.corporategovernance.dk.
The Company complies with the vast majority of the Danish Recommendations. The few deviations are explained below. A complete report on the Company’s compliance with each recommendation is available on the Company’s website.
• The CEO is responsible for the execution of the Company’s equal opportunities plan. The plan is not discussed annually within the Board of Directors.
• The Company’s Articles of Association do not include a provision on a fixed retirement age for members of the Board of Directors. In the Board’s opinion, age is irrelevant as long as the contribution of the respective member of the Board is considered valuable.
• The majority of the Board of Directors (3 of 5) is considered dependent. Two of the members of the Board represent the interest
of the Company’s controlling shareholder. One member has served on the Board for 16 years. The two other members of the Board are considered independent. In the Board’s opinion it is normal and understandable that two of the five members of the Board represent the controlling shareholder. It is also the Board’s opinion that its longest serving member is in fact acting independently of special interests, and his skills and experience, including his medical expertise and knowledge of the U.S. healthcare system, are valuable to the Board and ensures diversity within it.
• No nomination committee has been established and a remuneration committee was abolished in 2010. The Company has not had such a committee since. In the Board’s opinion such committees are not necessary taking into account the size of the Board and the balanced and relevant expertise and experience of the current Board members. The Board has the role and responsibilities such committees would otherwise have.
• The Remuneration Policy does not include criteria that ensure that vesting period for variable components of remuneration agreements are longer than one calendar year. Bonuses for short-term performance may be paid quarterly, semi-annually or annually. The Company believes it is important to have certain flexibility to pay out
Corporate Governance
40ANNUAL REPORT 14

41 ANNUAL REPORT 14
such bonuses. However, the Remuneration Policy states that if bonus payments have clearly been based on false, misleading or insufficient data, such payments shall be repaid to the extent correct data shows that no or lower bonus would have been paid.
• The Company’s Share Incentive Scheme, approved at the Company’s Annual General Meeting in 2012, is not a rollover program. Share options are granted in full at the beginning and not periodically. However, the Company intends to introduce a new Share Incentive Program to the Annual General Meeting in 2015 that will be a rollover program.
2. Main aspects of internal controls and risk management systems in connection with preparation of financial statementsInternal controlsThe Board of Directors has an ongoing dialogue with the CEO about the identification, description and handling of business risks to which the Company may be exposed. Material risks and risk management are discussed in the Annual Report.
The Company’s risk management and internal controls, in relation to financial processes, are designed to control the risk of material misstatements. The Company designs its
processes to ensure there are no material weaknesses with internal controls that could lead to a material misstatement in its financial reporting. The external Auditors’ evaluation of these processes is included in the Auditor’s Report.
The Company goes through a detailed strategic and forecast process each year, and a strategy and forecast report is prepared. The Board approves the Company’s strategy, forecasts and targets each year. Performances against targets are monitored on a monthly basis. This includes a year-by-year comparison where the main reasons for changes are explained. A twelve-month forecast is available at all times. Forecasts are updated quarterly and the reasons for changes in forecasts are explained.
To ensure the accuracy of the Company’s financial reporting systems, the following policies, procedures and guidelines for financial reporting and internal control have been adopted, to which the subsidiaries and reporting units must adhere:
• Continuous analysis of year-by-year comparison.
• Continuous follow-up on results achieved compared to assumptions in forecasts.
• Policies for IT use, insurance, cash management, procurement, etc.
• Reporting instructions as well as reporting and finance manuals.
The responsibility for maintaining sufficient and effective internal control and risk management in connection with financial reporting lies with the CEO.
The Company does not have an internal audit function, but uses internal control systems that are monitored by the Audit Committee and assessed by the external Auditors.
External AuditorsAn auditing firm is elected at the Annual General Meeting for a term of one year. The external Auditors are not allowed to own shares in the Company. The external Auditors shall examine the Company’s annual consolidated financial statements in accordance with international standards on auditing, and shall, for this purpose, inspect account records and other material relating to the operation and financial position of the Company. The external Auditors shall have access to all of the Company’s books and documents at all times. The external Auditors report via the Audit Committee to the Board of Directors on any significant findings regarding accounting matters and any significant internal control deficiencies.
42ANNUAL REPORT 14
3. Organizational structure and the role and composition of each functionAccording to the Company’s Articles of Association the Company is managed by:
• Shareholders’ Meetings
• The Board of Directors
• The Chief Executive Officer
Shareholders’ MeetingsThe supreme authority in all affairs of the Company, within the limits established by the Company’s Articles of Association and statutory law, is in the hands of shareholders at lawful Shareholders’ Meetings.
The Company’s controlling shareholder, William Demant Invest A/S, holds 41.2% of the shares and voting rights.
The Board of Directors According to the Company’s Articles of Association the Board of Directors is responsible for the affairs of the Company between Shareholders’ Meetings.
The Board shall operate in accordance with the Company’s Articles of Association and the Board’s Rules of Procedure. The principal duties of the Board are as follows:
• Appoint a CEO to manage the Company’s daily operations, decide on the salary and terms of employment, establish terms of reference and supervise the CEO’s work.
• Supervise the Company’s activities and ensure that the Company’s organization and operations are in good and proper order.
• Establish goals for the Company in accordance with the Company's objectives pursuant to the Articles of Association, and formulate the policy and strategy required to achieve these goals.
• Ensure adequate surveil lance of the accounting and financial management of the Company.
• Evaluate the Company’s capital structure each year.
The Audit CommitteeThe Audit Committee shall operate in accordance with its Rules of Procedure. The principal duty of the Audit Committee is to ensure the quality of the Company’s Consolidated Financial Statements and other financial information, and the independence of the Company’s Auditors.
The Chief Executive OfficerAccording to the Company’s Articles of Association the Board of Directors appoints a CEO to manage the Company’s daily operations.
The principal duties of the CEO are as follows:
• The CEO is responsible for daily operations and is obliged to follow the Board’s policy and directions, within the limits provided for by the Articles of Association and law. The daily operations do not include measures that are
unusual or extraordinary. The CEO may only take such measures if specifically authorized by the Board, unless it is impossible to wait for the Board’s decision without substantial disadvantage to the Company’s operations. In such an event the CEO shall inform the Board of his measures, without delay. If the Board has granted the CEO authority to sign on behalf of the Company and/or granted him powers of procuration, such authorizations are not limited by the following:
• The CEO shall decide on directorship in the Company’s subsidiaries and associates on behalf of the Company.
• The CEO is responsible for the work and results of Executive Management.
• The CEO shall ensure that the Company’s consolidated financial statements are prepared in accordance with the law and accepted practices, and the Company’s assets are handled in a secure manner.
References to the executive board in the corporate governance recommendations only apply to the CEO.
Further information on the Board of Directors, the Audit Committee and the CEO can be found in the Annual Report and on the Company’s website.
43 ANNUAL REPORT 14
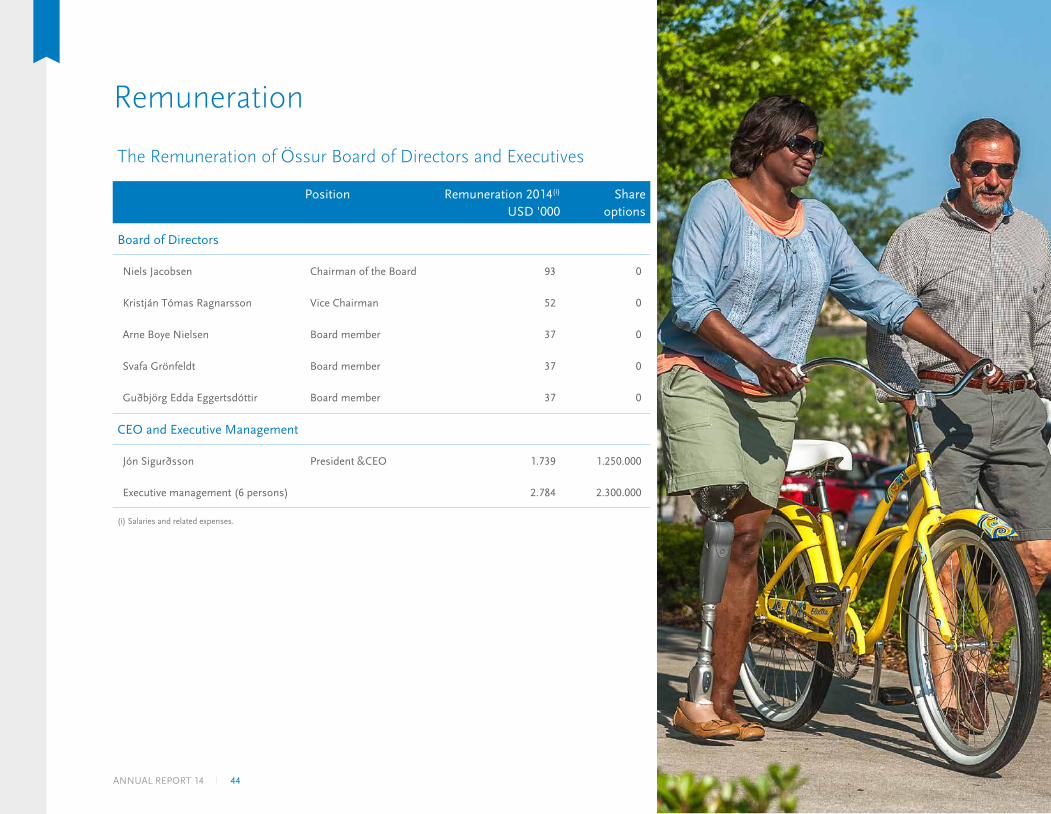
Remuneration
The Remuneration of Össur Board of Directors and Executives
Position Remuneration 2014(i) USD '000
Share options
Board of Directors
Niels Jacobsen Chairman of the Board 93 0
Kristján Tómas Ragnarsson Vice Chairman 52 0
Arne Boye Nielsen Board member 37 0
Svafa Grönfeldt Board member 37 0
Guðbjörg Edda Eggertsdóttir Board member 37 0
CEO and Executive Management
Jón Sigurðsson President &CEO 1.739 1.250.000
Executive management (6 persons) 2.784 2.300.000
(i) Salaries and related expenses.
44ANNUAL REPORT 14
Board of Directors, President & CEO and Executive ManagementIt is the policy and priority of Össur hf. and its subsidiaries (“the Company”) to attract and retain exceptional employees long-term. In order to achieve this, the Company must have in place a competitive compensation structure in each of its operations. To the extent possible, the remuneration of managers and other employees shall be harmonized and fair, taking into account their responsibilities, local trends, performance and other relevant factors.
This Remuneration Policy is designed and implemented to ensure, to the extent possible, the alignment of interest of the Board of Directors, the President & CEO and the Executive Management with the Company’s performance long-term and value creation for shareholders.
The remuneration of the President & CEO and the Executive Management shall be determined as follows:
1. Fixed salary. When determining fixed salary, account should be taken of their responsibilities, local trends, performance and other relevant factors, such as the remuneration of their peers in other international companies of similar size.
2. Bonuses for short-term performance. Bonuses for short-term performance can be up to 67% of the basic salary. In determining
bonuses, special attention shall be given to the Company’s overall results, actual growth, long-term profitability and value creation for shareholders. Bonuses may be paid quarterly, semi-annually or annually.
Bonuses may be paid with shares in the Company, in part or in full. The shares shall not be delivered until three years after the bonus has been determined.
If bonus payments have clearly been based on false, misleading or insufficient data, such payments shall be repaid to the extent correct data shows that no or lower bonus would have been paid.
3. Share-based incentives for long-term performance. Share-based incentives, including share options, may be offered. The key terms of such share-based incentive agreements or plans shall be submitted to a Shareholders’ Meeting for approval. Put options shall not be offered and no loans or guarantees shall be granted.
4. Pension contributions. Pension contributions are paid in accordance with applicable laws and employment agreements. No pension liabilities shall be undertaken, unless required by law.
5. Severance payments. No special retirement agreements shall be made. Instead mutual termination clauses in employment
agreements shall apply. Termination clauses shall not exceed twenty-four (24) months.
6. Other benefits. Other benefits are awarded or reimbursed on the basis of individual employment contracts and local market practices.
The remuneration of the Board of Directors shall be approved by the Company’s Annual General Meeting each year and paid in cash.
This Remuneration Policy shall apply to all future employment agreements with the President & CEO and the Executive Management. Existing agreements shall remain unchanged and in full force unless otherwise agreed by relevant parties.
The Remuneration Policy is binding for the Board as regards to share options, cf. item three above. In other instances the Remuneration Policy shall be of guidance for the Board. Any departure from the Remuneration Policy shall be recorded and reasoned in the Board’s Minutes.
This Remuneration Policy has been approved by the Board of Directors of Össur hf. in accordance with Article 79. a. of the Icelandic Companies Act No. 2/1995, taking into consideration the Danish Recommendations on Corporate Governance. The Remuneration Policy is reviewed once a year and shall be approved at the Company’s Annual General Meeting, with or without amendments.
Remuneration Policy
45 ANNUAL REPORT 14
ÖSSUR HF. CONSOLIDATED FINANCIAL STATEMENTS 2014

47ANNUAL REPORT 14
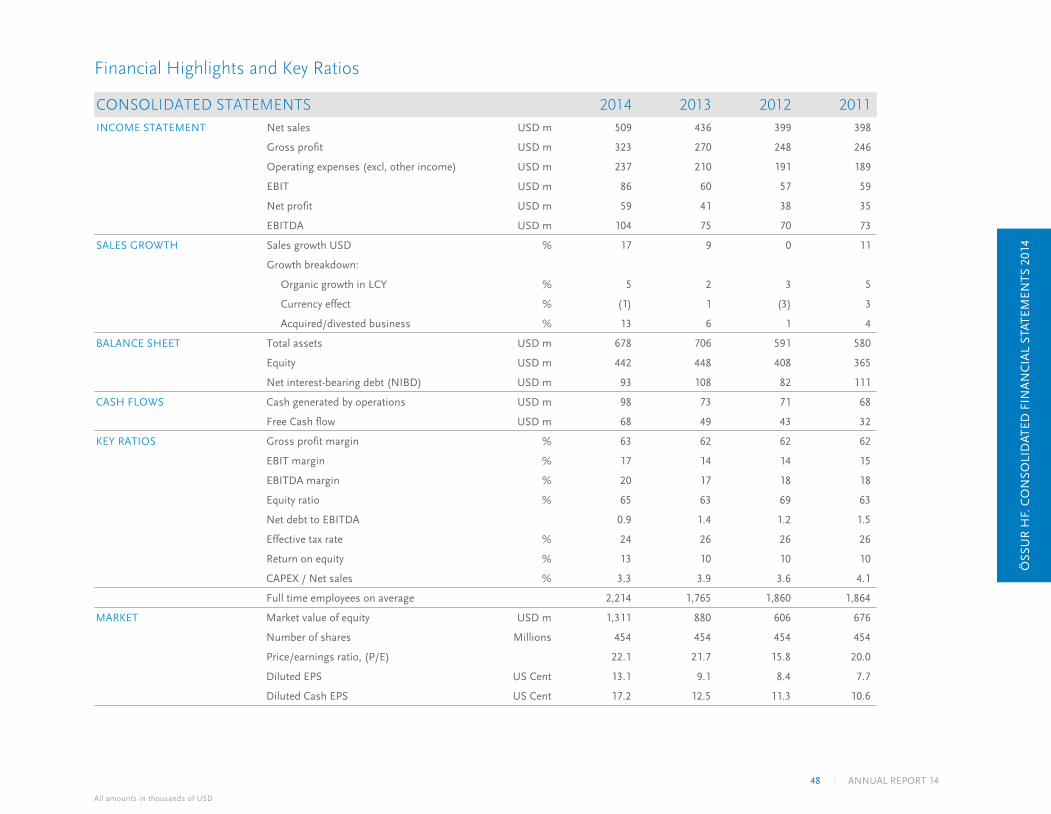
CONSOLIDATED STATEMENTS 2014 2013 2012 2011INCOME STATEMENT Net sales USD m 509 436 399 398
Gross profit USD m 323 270 248 246
Operating expenses (excl, other income) USD m 237 210 191 189
EBIT USD m 86 60 57 59
Net profit USD m 59 41 38 35
EBITDA USD m 104 75 70 73
SALES GROWTH Sales growth USD % 17 9 0 11
Growth breakdown:
Organic growth in LCY % 5 2 3 5
Currency effect % (1) 1 (3) 3
Acquired/divested business % 13 6 1 4
BALANCE SHEET Total assets USD m 678 706 591 580
Equity USD m 442 448 408 365
Net interest-bearing debt (NIBD) USD m 93 108 82 111
CASH FLOWS Cash generated by operations USD m 98 73 71 68
Free Cash flow USD m 68 49 43 32
KEY RATIOS Gross profit margin % 63 62 62 62
EBIT margin % 17 14 14 15
EBITDA margin % 20 17 18 18
Equity ratio % 65 63 69 63
Net debt to EBITDA 0.9 1.4 1.2 1.5
Effective tax rate % 24 26 26 26
Return on equity % 13 10 10 10
CAPEX / Net sales % 3.3 3.9 3.6 4.1
Full time employees on average 2,214 1,765 1,860 1,864
MARKET Market value of equity USD m 1,311 880 606 676
Number of shares Millions 454 454 454 454
Price/earnings ratio, (P/E) 22.1 21.7 15.8 20.0
Diluted EPS US Cent 13.1 9.1 8.4 7.7
Diluted Cash EPS US Cent 17.2 12.5 11.3 10.6
Financial Highlights and Key Ratios
ÖSS
UR
HF.
CO
NSO
LID
ATED
FIN
AN
CIA
L ST
ATEM
ENTS
201
4
All amounts in thousands of USD
48 ANNUAL REPORT 14
It is the opinion of the Board of Directors and the President and
CEO of Össur hf. (the Company), that these Consolidated Financial
Statements present the necessary information to evaluate the
financial position of the Company at year end, the operating results
for the year and financial developments during the year 2014. Össur
Consolidated Financial Statements are prepared in accordance with
International Financial Reporting Standards (IFRS) as adopted by
the European Union and additional Danish disclosure requirements
for listed companies.
Össur hf. designs, manufactures and sells orthopaedic products
specializing in prosthetics and bracing and supports solutions. The
Company is headquartered in Iceland and the Company owns and
operates subsidiaries in the United States, Canada, Mexico, Brazil,
France, the Netherlands, Germany, United Kingdom, Sweden,
Norway, Iceland, Spain, S-Africa, China, Hong Kong, Korea,
Singapore and Australia. The Company sells its products world
wide, but the principal market areas are North America and Europe.
The total sales of the Össur Consolidation amounted to USD 509.4
million, compared to USD 436.3 million in the preceding year. This
represents an increase in sales of 16.8%. Net profit amounted to
USD 59.5 million compared to USD 41.0 million in 2013. Diluted
Earnings per Share amounted to US cents 13.1 compared to US
cents 9.1 in 2013. Earnings before interest, taxes, depreciation and
amortization (EBITDA) amounted to USD 104.3 million compared
to USD 75.5 million in the preceding year.
The total assets of the Össur Consolidation amounted to USD
677.8 million at year end, liabilities were USD 235.7 million and
equity was USD 442.1 million. The equity ratio at year end was 65%,
compared to 63% the preceding year.
In the course of the year the Company employed on average 2,214
employees and 2,233 at year end.
The Board of Directors and President and CEO of Össur hf. hereby
confirm the Consolidated Financial Statements of Össur for the year
2014 with their signatures.
Össur is listed on the NASDAQ Copenhagen. The market value of
the Company at year end was USD 1,311 million. During the year
the share price in DKK increased by 69%. At year end, shareholders
in Össur hf. numbered 3,272 compared to 2,748 at the beginning
of the year. The ten largest shareholders and their ownership
percentage are: William Demant Invest A/S - 41.2%, Lífeyrissjóður
Verslunarmanna (Pension Fund)- 7.7%, Gildi lífeyrissjóður
(Pension Fund) - 5.4%, Arbejdsmarkedets Tillægspension (Pension
Fund) - 5.1%, Lífeyrissjóður starfsmanna ríkisins (Pension Fund) -
4.8%, JP Morgan Chase Bank - 3.8%, Stefnir IS-15 (Equity Fund)
- 1.6%, Sameinaði lífeyrissjóðurinn (Pension Fund) - 1.4%, Stafir
lífeyrissjóður (Pension Fund) - 1.3%, Topdanmark Livforsikring
– 1.2%.
In its procedures, the Board of Directors complies with the Articles
of Association of the Company, the Board of Directors' Rules of
Procedure and follows the Danish Recommendations for Corporate
Governance issued by the Danish Committee on Corporate
Governance. The Rules of Procedure address issues such as
allocation of responsibilities and power of decision within the Board,
independency issues, confidentiality etc. An Audit Committee is
present within the Board. The Board of Directors is composed of
five members elected at each Annual General Meeting for a term of
one year. The Board of Directors consists of two women and three
men and therefore complies with Icelandic law on gender ratio
which entered into effect on the 1st of September 2013. No Össur
employee is sitting on the Board of Directors.
The Board of Directors recommends payment of dividends to
shareholders in 2015 amounting to DKK 0.12 per share, this
approximates USD 8 million and 14% of 2014 net profit. As regards
to changes in the equity of the Company, the Board refers to the
Notes attached to the Consolidated Financial Statements.
Reykjavík, 5 February 2015
BOARD OF DIRECTORS
Niels JacobsenChairman of the Board
Arne Boye Nielsen Kristján T. Ragnarsson
Guðbjörg Edda Eggertsdóttir Svafa Grönfeldt
President and CEO
Jón Sigurðsson
The Board of Directors and President and CEO of Össur hf. hereby confirm the Consolidated Financial Statements of Össur for the year 2014 with their signatures.
Statement by the Board of Directors and President and CEO
ÖSS
UR
HF.
CO
NSO
LID
ATED
FIN
AN
CIA
L ST
ATEM
ENTS
201
4
49ANNUAL REPORT 14
TO THE BOARD OF DIRECTORS AND SHAREHOLDERS
OF ÖSSUR HF.
We have audited the accompanying financial statements of
Össur hf, which comprise the statement of Board of Directors
and the CEO, balance sheet as of 31 December, 2014, the
income statement, statement of comprehensive income,
statement of cash flow and statement of changes in equity, for
the year then ended, and a summary of significant accounting
policies and other explanatory information.
MANAGEMENT'S AND THE BOARD OF DIRECTORS
RESPONSIBILITY FOR THE FINANCIAL STATEMENTS
Management and the board of directors are responsible
for the preparation and fair presentation of these financial
statements in accordance with International Financial
Reporting Standards as adopted by the European Union
and additional Danish disclosure requirements for listed
companies and for such internal control as management and
the board of directors determine is necessary to enable the
preparation of financial statements that are free from material
misstatement, whether due to fraud or error
AUDITOR’S RESPONSIBILITY
Our responsibility is to express an opinion on these financial
statements based on our audit. We conducted our audit in
accordance with International Standards on Auditing. Those
standards require that we comply with ethical requirements
and plan and perform the audit to obtain reasonable
assurance about whether the financial statements are free
from material misstatement.
An audit involves performing procedures to obtain audit
evidence about the amounts and disclosures in the financial
statements. The procedures selected depend on the auditor’s
judgment, including the assessment of the risks of material
misstatement of the financial statements, whether due
to fraud or error. In making those risk assessments, the
auditor considers internal control relevant to the entity’s
preparation of the financial statements in order to design
audit procedures that are appropriate in the circumstances,
but not for the purpose of expressing an opinion on the
effectiveness of the entity's internal control. An audit also
includes evaluating the appropriateness of accounting policies
used and the reasonableness of accounting estimates made
by management, as well as evaluating the presentation of the
financial statements.
We believe that the audit evidence we have obtained is
sufficient and appropriate to provide a basis for our audit
opinion.
OPINION
In our opinion, the Consolidated Financial Statements gives a
true and fair view, of the financial position of Össur hf. as of
31 December 2014, and its financial performance and its cash
flows for the year then ended in accordance with International
Financial Reporting Standards as adopted by the European
Union and additional Danish disclosure requirements for
listed companies.
Kópavogur, 5 February 2015
Deloitte ehf.
Þorsteinn Pétur Guðjónsson
State Authorized Public Accountant
Signý Magnúsdóttir
State Authorized Public Accountant
Independent Auditor’s Report
ÖSS
UR
HF.
CO
NSO
LID
ATED
FIN
AN
CIA
L ST
ATEM
ENTS
201
4
All amounts in thousands of USD
50 ANNUAL REPORT 14
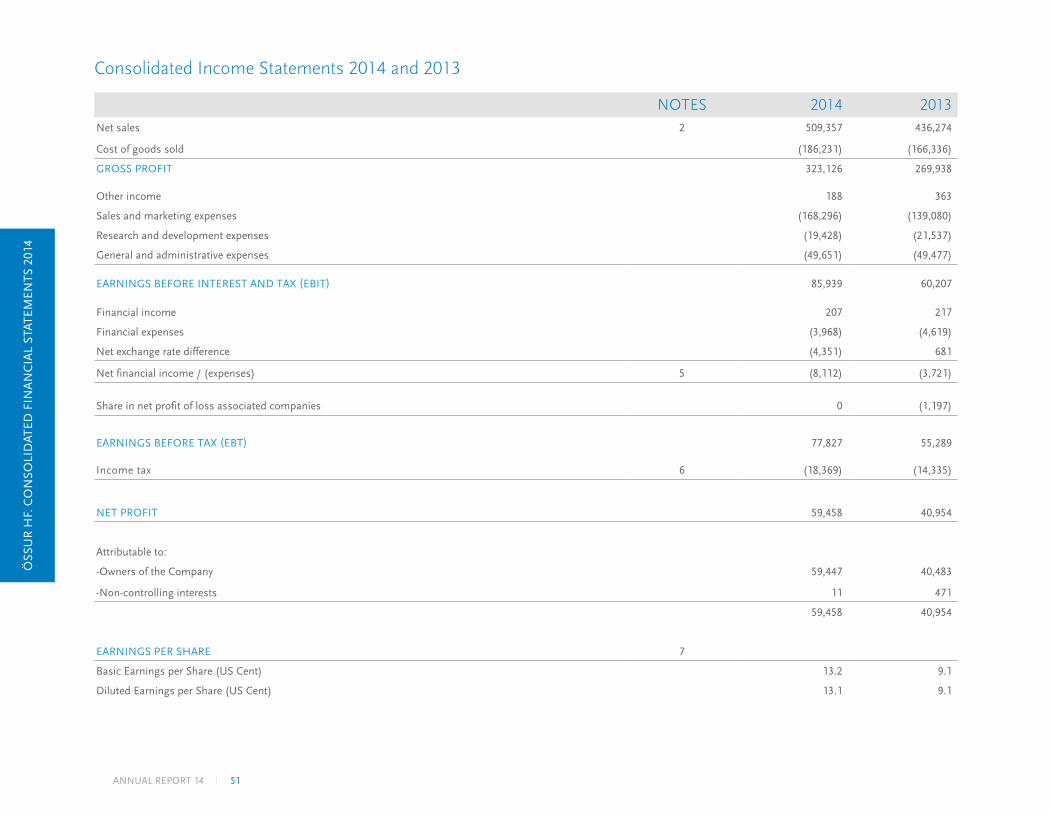
NOTES 2014 2013Net sales 2 509,357 436,274
Cost of goods sold (186,231) (166,336)
GROSS PROFIT 323,126 269,938
Other income 188 363
Sales and marketing expenses (168,296) (139,080)
Research and development expenses (19,428) (21,537)
General and administrative expenses (49,651) (49,477)
EARNINGS BEFORE INTEREST AND TAX (EBIT) 85,939 60,207
Financial income 207 217
Financial expenses (3,968) (4,619)
Net exchange rate difference (4,351) 681
Net financial income / (expenses) 5 (8,112) (3,721)
Share in net profit of loss associated companies 0 (1,197)
EARNINGS BEFORE TAX (EBT) 77,827 55,289
Income tax 6 (18,369) (14,335)
NET PROFIT 59,458 40,954
Attributable to:
-Owners of the Company 59,447 40,483
-Non-controlling interests 11 471
59,458 40,954
EARNINGS PER SHARE 7
Basic Earnings per Share (US Cent) 13.2 9.1
Diluted Earnings per Share (US Cent) 13.1 9.1
Consolidated Income Statements 2014 and 2013
ÖSS
UR
HF.
CO
NSO
LID
ATED
FIN
AN
CIA
L ST
ATEM
ENTS
201
4
51ANNUAL REPORT 14
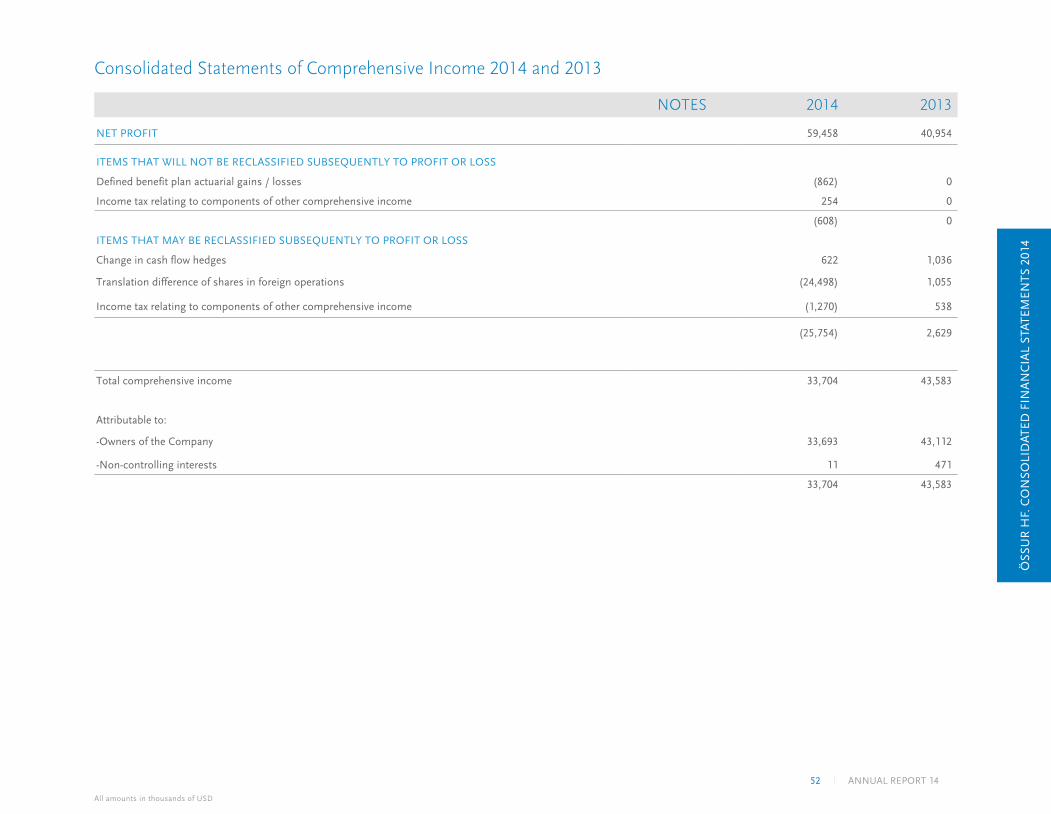
NOTES 2014 2013
NET PROFIT 59,458 40,954
ITEMS THAT WILL NOT BE RECLASSIFIED SUBSEQUENTLY TO PROFIT OR LOSS
Defined benefit plan actuarial gains / losses (862) 0
Income tax relating to components of other comprehensive income 254 0
(608) 0
ITEMS THAT MAY BE RECLASSIFIED SUBSEQUENTLY TO PROFIT OR LOSS
Change in cash flow hedges 622 1,036
Translation difference of shares in foreign operations (24,498) 1,055
Income tax relating to components of other comprehensive income (1,270) 538
(25,754) 2,629
Total comprehensive income 33,704 43,583
Attributable to:
-Owners of the Company 33,693 43,112
-Non-controlling interests 11 471
33,704 43,583
Consolidated Statements of Comprehensive Income 2014 and 2013
ÖSS
UR
HF.
CO
NSO
LID
ATED
FIN
AN
CIA
L ST
ATEM
ENTS
201
4
All amounts in thousands of USD
52 ANNUAL REPORT 14
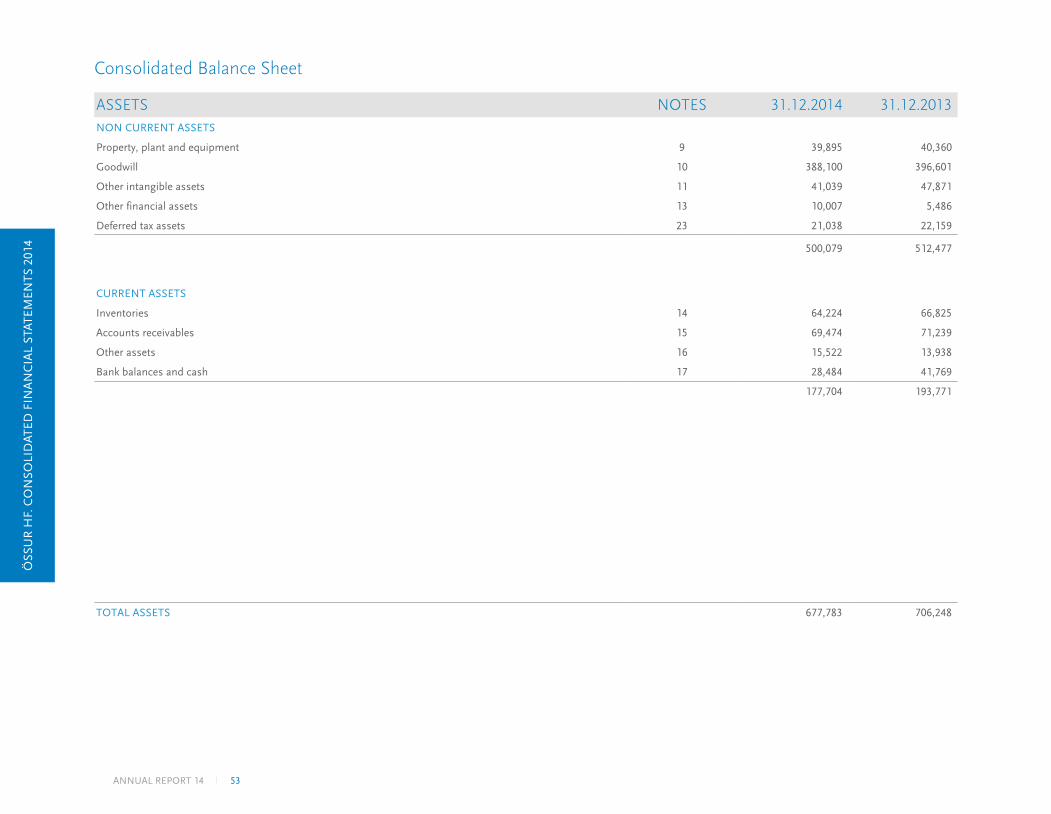
ASSETS NOTES 31.12.2014 31.12.2013NON CURRENT ASSETS
Property, plant and equipment 9 39,895 40,360
Goodwill 10 388,100 396,601
Other intangible assets 11 41,039 47,871
Other financial assets 13 10,007 5,486
Deferred tax assets 23 21,038 22,159
500,079 512,477
CURRENT ASSETS
Inventories 14 64,224 66,825
Accounts receivables 15 69,474 71,239
Other assets 16 15,522 13,938
Bank balances and cash 17 28,484 41,769
177,704 193,771
TOTAL ASSETS 677,783 706,248
Consolidated Balance Sheet
ÖSS
UR
HF.
CO
NSO
LID
ATED
FIN
AN
CIA
L ST
ATEM
ENTS
201
4
53ANNUAL REPORT 14
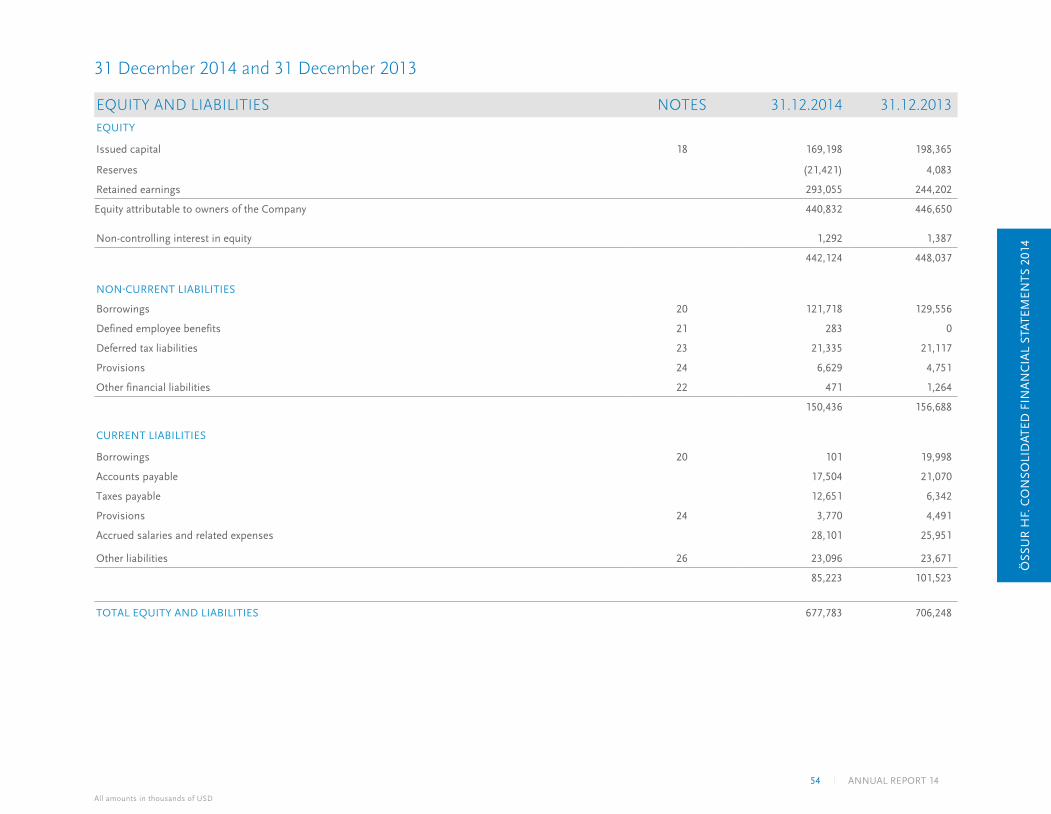
31 December 2014 and 31 December 2013
EQUITY AND LIABILITIES NOTES 31.12.2014 31.12.2013EQUITY
Issued capital 18 169,198 198,365
Reserves (21,421) 4,083
Retained earnings 293,055 244,202
Equity attributable to owners of the Company 440,832 446,650
Non-controlling interest in equity 1,292 1,387
442,124 448,037
NON-CURRENT LIABILITIES
Borrowings 20 121,718 129,556
Defined employee benefits 21 283 0
Deferred tax liabilities 23 21,335 21,117
Provisions 24 6,629 4,751
Other financial liabilities 22 471 1,264
150,436 156,688
CURRENT LIABILITIES
Borrowings 20 101 19,998
Accounts payable 17,504 21,070
Taxes payable 12,651 6,342
Provisions 24 3,770 4,491
Accrued salaries and related expenses 28,101 25,951
Other liabilities 26 23,096 23,671
85,223 101,523
TOTAL EQUITY AND LIABILITIES 677,783 706,248
ÖSS
UR
HF.
CO
NSO
LID
ATED
FIN
AN
CIA
L ST
ATEM
ENTS
201
4
All amounts in thousands of USD
54 ANNUAL REPORT 14
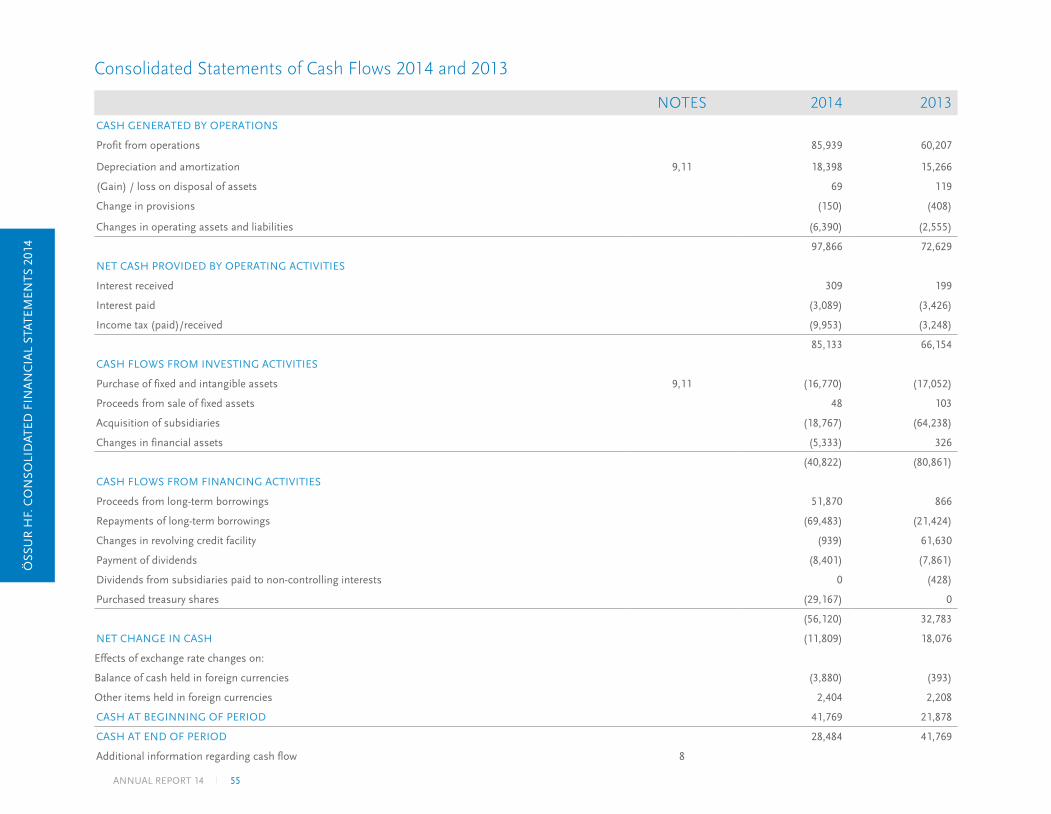
NOTES 2014 2013CASH GENERATED BY OPERATIONS
Profit from operations 85,939 60,207
Depreciation and amortization 9,11 18,398 15,266
(Gain) / loss on disposal of assets 69 119
Change in provisions (150) (408)
Changes in operating assets and liabilities (6,390) (2,555)
97,866 72,629
NET CASH PROVIDED BY OPERATING ACTIVITIES
Interest received 309 199
Interest paid (3,089) (3,426)
Income tax (paid)/received (9,953) (3,248)
85,133 66,154
CASH FLOWS FROM INVESTING ACTIVITIES
Purchase of fixed and intangible assets 9,11 (16,770) (17,052)
Proceeds from sale of fixed assets 48 103
Acquisition of subsidiaries (18,767) (64,238)
Changes in financial assets (5,333) 326
(40,822) (80,861)
CASH FLOWS FROM FINANCING ACTIVITIES
Proceeds from long-term borrowings 51,870 866
Repayments of long-term borrowings (69,483) (21,424)
Changes in revolving credit facility (939) 61,630
Payment of dividends (8,401) (7,861)
Dividends from subsidiaries paid to non-controlling interests 0 (428)
Purchased treasury shares (29,167) 0
(56,120) 32,783
NET CHANGE IN CASH (11,809) 18,076
Effects of exchange rate changes on:
Balance of cash held in foreign currencies (3,880) (393)
Other items held in foreign currencies 2,404 2,208
CASH AT BEGINNING OF PERIOD 41,769 21,878
CASH AT END OF PERIOD 28,484 41,769
Additional information regarding cash flow 8
Consolidated Statements of Cash Flows 2014 and 2013
ÖSS
UR
HF.
CO
NSO
LID
ATED
FIN
AN
CIA
L ST
ATEM
ENTS
201
4
55ANNUAL REPORT 14
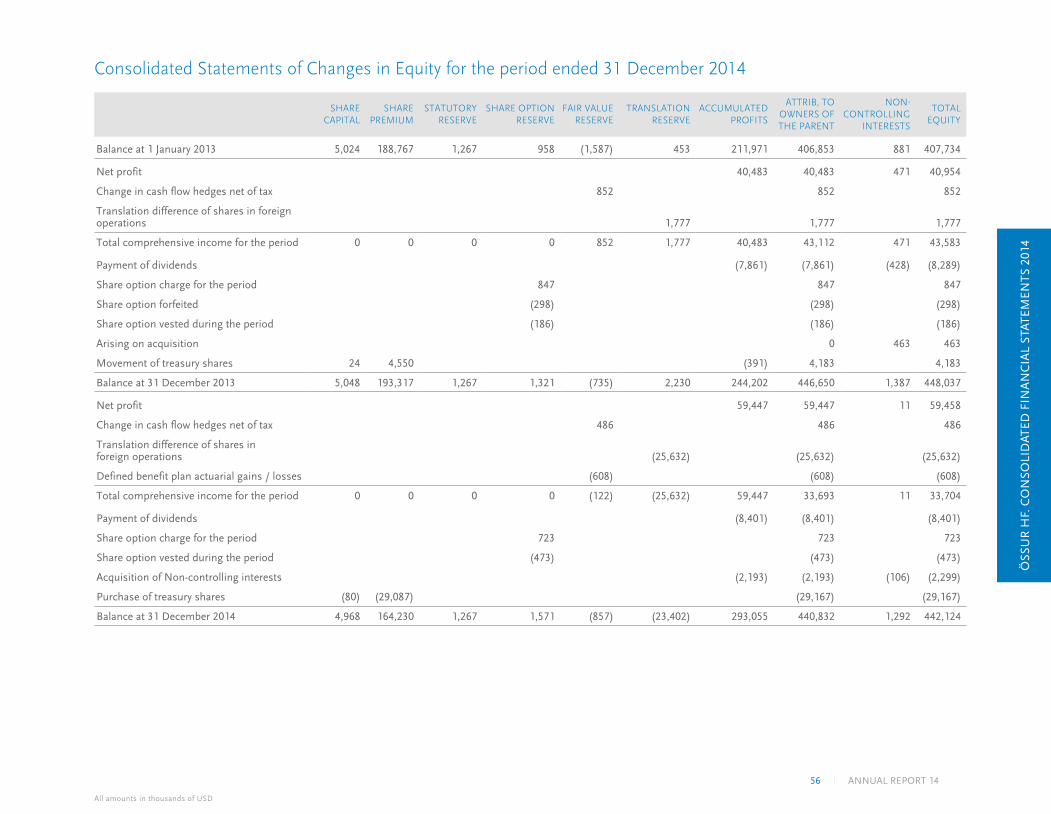
SHARE CAPITAL
SHARE PREMIUM
STATUTORY RESERVE
SHARE OPTION RESERVE
FAIR VALUE RESERVE
TRANSLATION RESERVE
ACCUMULATED PROFITS
ATTRIB, TO OWNERS OF THE PARENT
NON-CONTROLLING
INTERESTS
TOTAL EQUITY
Balance at 1 January 2013 5,024 188,767 1,267 958 (1,587) 453 211,971 406,853 881 407,734
Net profit 40,483 40,483 471 40,954
Change in cash flow hedges net of tax 852 852 852
Translation difference of shares in foreign operations 1,777 1,777 1,777
Total comprehensive income for the period 0 0 0 0 852 1,777 40,483 43,112 471 43,583
Payment of dividends (7,861) (7,861) (428) (8,289)
Share option charge for the period 847 847 847
Share option forfeited (298) (298) (298)
Share option vested during the period (186) (186) (186)
Arising on acquisition 0 463 463
Movement of treasury shares 24 4,550 (391) 4,183 4,183
Balance at 31 December 2013 5,048 193,317 1,267 1,321 (735) 2,230 244,202 446,650 1,387 448,037
Net profit 59,447 59,447 11 59,458
Change in cash flow hedges net of tax 486 486 486
Translation difference of shares in foreign operations (25,632) (25,632) (25,632)
Defined benefit plan actuarial gains / losses (608) (608) (608)
Total comprehensive income for the period 0 0 0 0 (122) (25,632) 59,447 33,693 11 33,704
Payment of dividends (8,401) (8,401) (8,401)
Share option charge for the period 723 723 723
Share option vested during the period (473) (473) (473)
Acquisition of Non-controlling interests (2,193) (2,193) (106) (2,299)
Purchase of treasury shares (80) (29,087) (29,167) (29,167)
Balance at 31 December 2014 4,968 164,230 1,267 1,571 (857) (23,402) 293,055 440,832 1,292 442,124
Consolidated Statements of Changes in Equity for the period ended 31 December 2014
ÖSS
UR
HF.
CO
NSO
LID
ATED
FIN
AN
CIA
L ST
ATEM
ENTS
201
4
All amounts in thousands of USD
56 ANNUAL REPORT 14
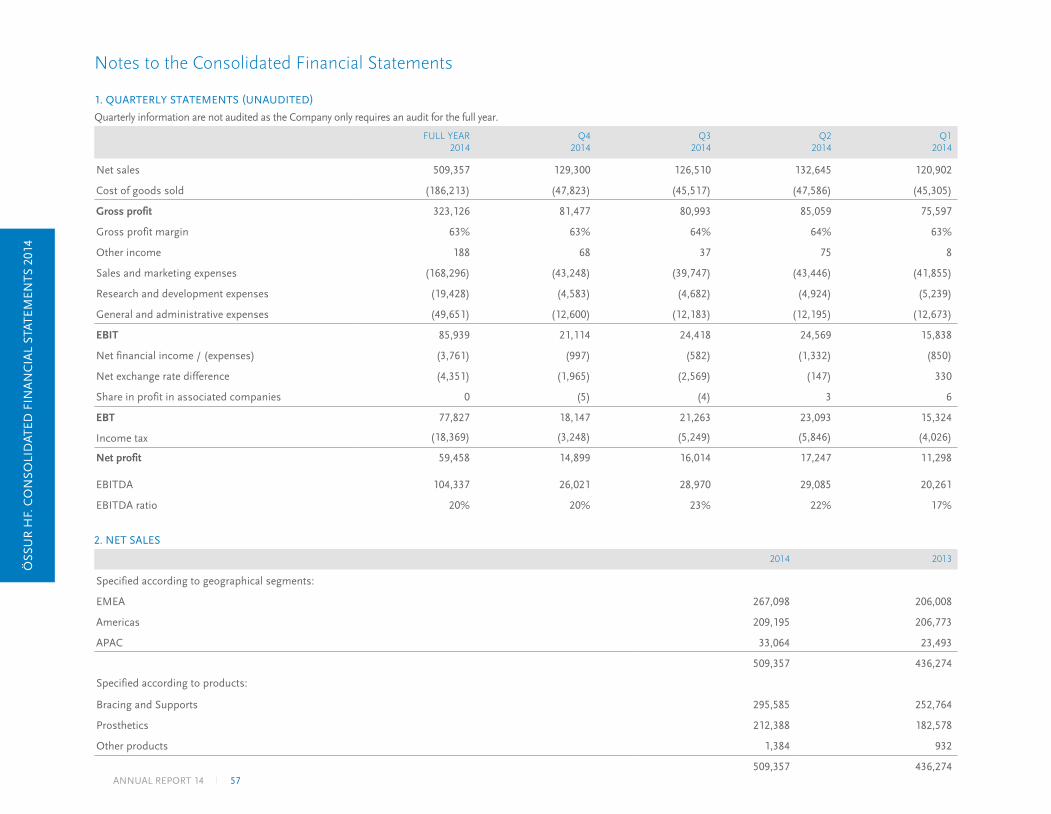
1. QUARTERLY STATEMENTS (UNAUDITED)
Quarterly information are not audited as the Company only requires an audit for the full year.
FULL YEAR2014
Q42014
Q32014
Q22014
Q12014
Net sales 509,357 129,300 126,510 132,645 120,902
Cost of goods sold (186,213) (47,823) (45,517) (47,586) (45,305)
Gross profit 323,126 81,477 80,993 85,059 75,597
Gross profit margin 63% 63% 64% 64% 63%
Other income 188 68 37 75 8
Sales and marketing expenses (168,296) (43,248) (39,747) (43,446) (41,855)
Research and development expenses (19,428) (4,583) (4,682) (4,924) (5,239)
General and administrative expenses (49,651) (12,600) (12,183) (12,195) (12,673)
EBIT 85,939 21,114 24,418 24,569 15,838
Net financial income / (expenses) (3,761) (997) (582) (1,332) (850)
Net exchange rate difference (4,351) (1,965) (2,569) (147) 330
Share in profit in associated companies 0 (5) (4) 3 6
EBT 77,827 18,147 21,263 23,093 15,324
Income tax (18,369) (3,248) (5,249) (5,846) (4,026)
Net profit 59,458 14,899 16,014 17,247 11,298
EBITDA 104,337 26,021 28,970 29,085 20,261
EBITDA ratio 20% 20% 23% 22% 17%
2. NET SALES
2014 2013
Specified according to geographical segments:
EMEA 267,098 206,008
Americas 209,195 206,773
APAC 33,064 23,493
509,357 436,274
Specified according to products:
Bracing and Supports 295,585 252,764
Prosthetics 212,388 182,578
Other products 1,384 932
509,357 436,274
Notes to the Consolidated Financial Statements
ÖSS
UR
HF.
CO
NSO
LID
ATED
FIN
AN
CIA
L ST
ATEM
ENTS
201
4
57ANNUAL REPORT 14
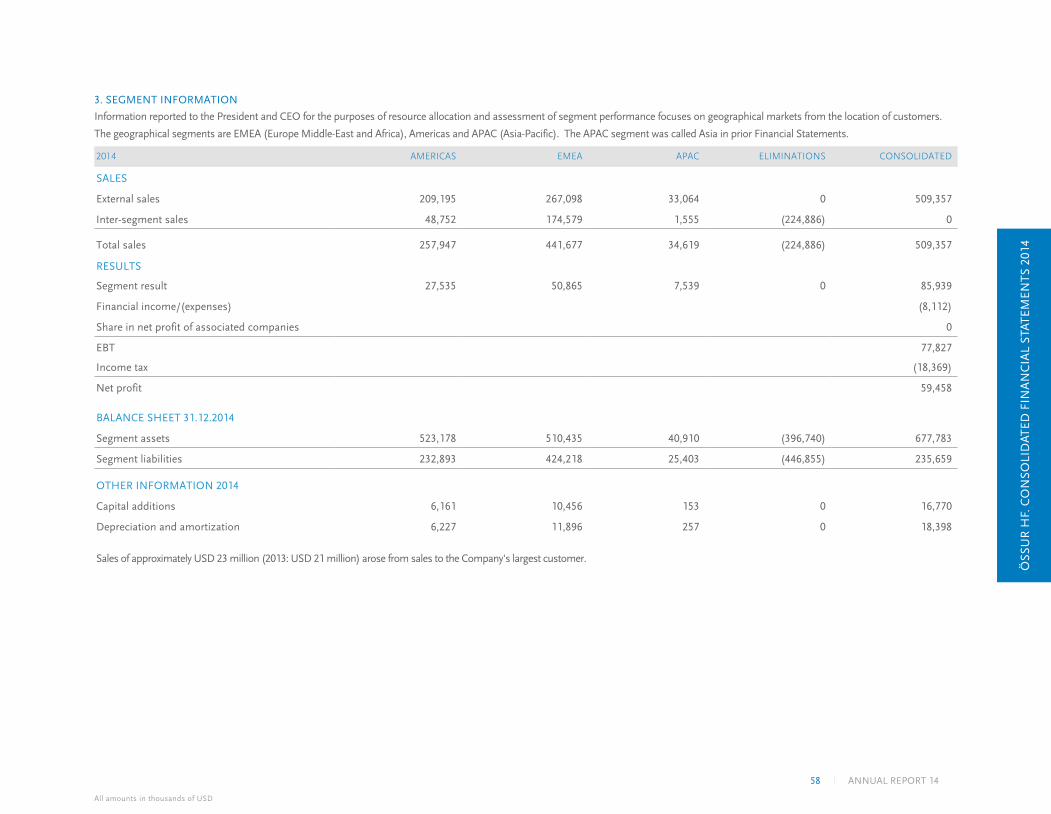
3. SEGMENT INFORMATION
2014 AMERICAS EMEA APAC ELIMINATIONS CONSOLIDATED
SALES
External sales 209,195 267,098 33,064 0 509,357
Inter-segment sales 48,752 174,579 1,555 (224,886) 0
Total sales 257,947 441,677 34,619 (224,886) 509,357
RESULTS
Segment result 27,535 50,865 7,539 0 85,939
Financial income/(expenses) (8,112)
Share in net profit of associated companies 0
EBT 77,827
Income tax (18,369)
Net profit 59,458
Information reported to the President and CEO for the purposes of resource allocation and assessment of segment performance focuses on geographical markets from the location of customers.
The geographical segments are EMEA (Europe Middle-East and Africa), Americas and APAC (Asia-Pacific). The APAC segment was called Asia in prior Financial Statements.
BALANCE SHEET 31.12.2014
Segment assets 523,178 510,435 40,910 (396,740) 677,783
Segment liabilities 232,893 424,218 25,403 (446,855) 235,659
OTHER INFORMATION 2014
Capital additions 6,161 10,456 153 0 16,770
Depreciation and amortization 6,227 11,896 257 0 18,398
Sales of approximately USD 23 million (2013: USD 21 million) arose from sales to the Company's largest customer.
ÖSS
UR
HF.
CO
NSO
LID
ATED
FIN
AN
CIA
L ST
ATEM
ENTS
201
4
All amounts in thousands of USD
58 ANNUAL REPORT 14
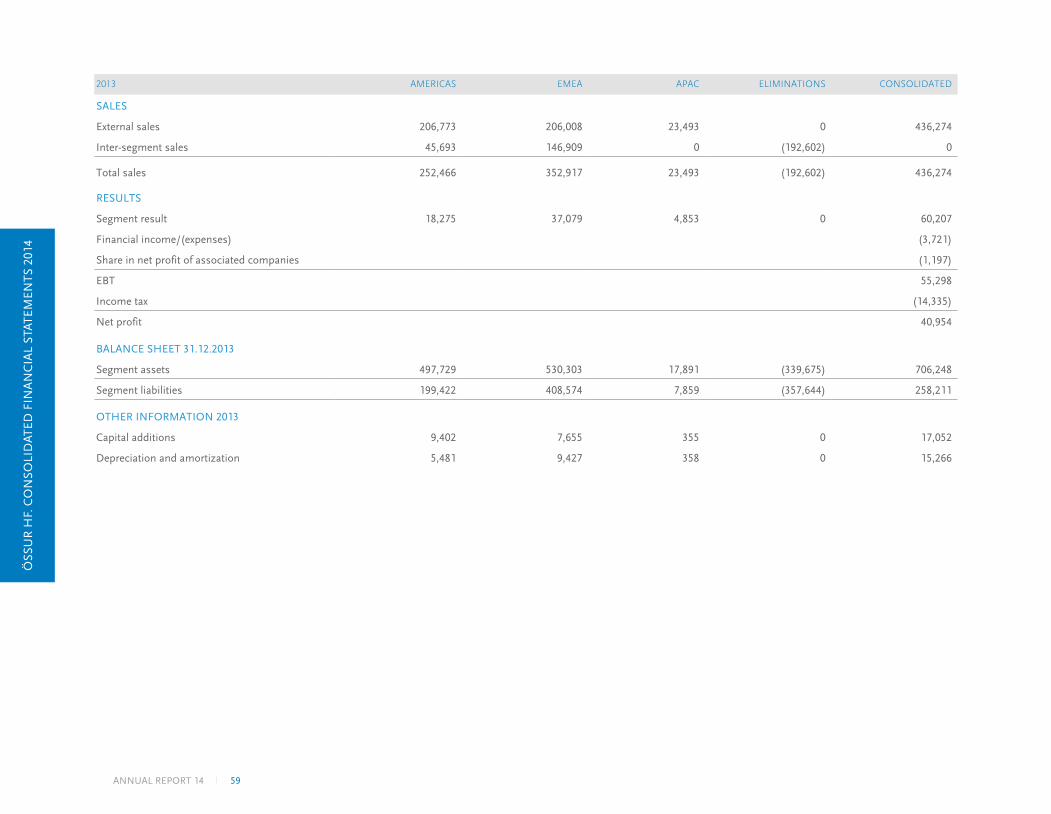
2013 AMERICAS EMEA APAC ELIMINATIONS CONSOLIDATED
SALES
External sales 206,773 206,008 23,493 0 436,274
Inter-segment sales 45,693 146,909 0 (192,602) 0
Total sales 252,466 352,917 23,493 (192,602) 436,274
RESULTS
Segment result 18,275 37,079 4,853 0 60,207
Financial income/(expenses) (3,721)
Share in net profit of associated companies (1,197)
EBT 55,298
Income tax (14,335)
Net profit 40,954
BALANCE SHEET 31.12.2013
Segment assets 497,729 530,303 17,891 (339,675) 706,248
Segment liabilities 199,422 408,574 7,859 (357,644) 258,211
OTHER INFORMATION 2013
Capital additions 9,402 7,655 355 0 17,052
Depreciation and amortization 5,481 9,427 358 0 15,266
ÖSS
UR
HF.
CO
NSO
LID
ATED
FIN
AN
CIA
L ST
ATEM
ENTS
201
4
59ANNUAL REPORT 14
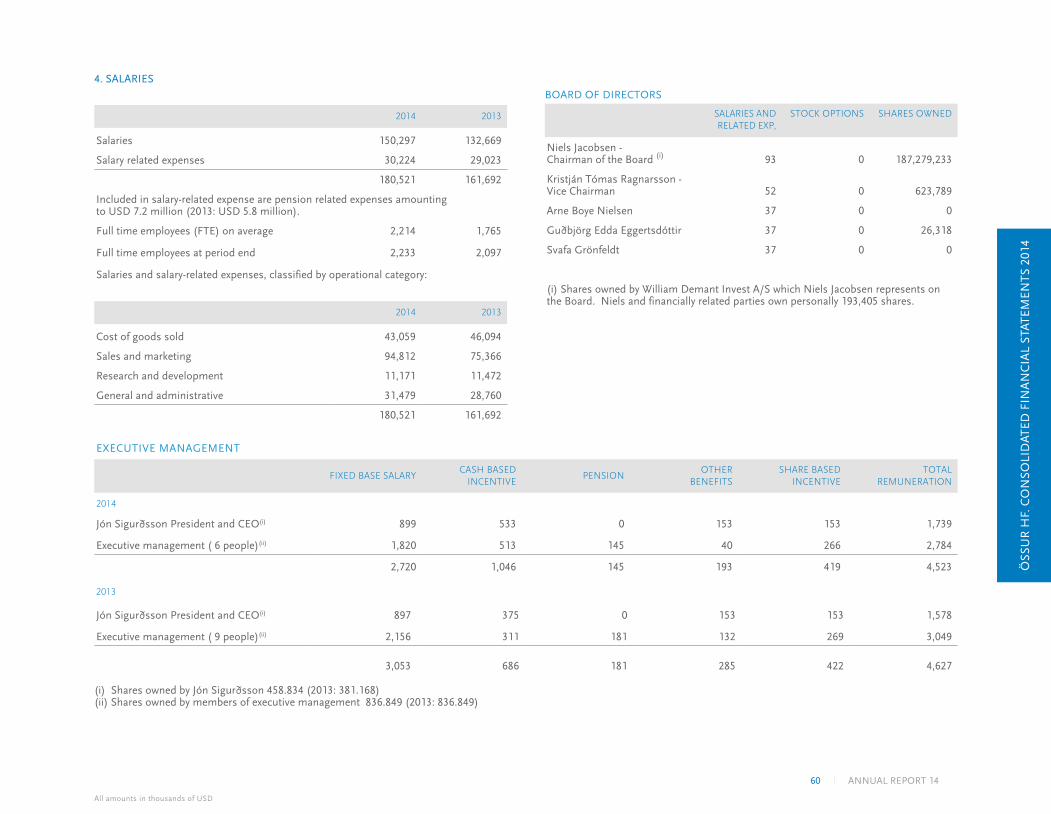
4. SALARIES
2014 2013
Salaries 150,297 132,669
Salary related expenses 30,224 29,023
180,521 161,692
Included in salary-related expense are pension related expenses amounting to USD 7.2 million (2013: USD 5.8 million).
Full time employees (FTE) on average 2,214 1,765
Full time employees at period end 2,233 2,097
Salaries and salary-related expenses, classified by operational category:
2014 2013
Cost of goods sold 43,059 46,094
Sales and marketing 94,812 75,366
Research and development 11,171 11,472
General and administrative 31,479 28,760
180,521 161,692
BOARD OF DIRECTORS
SALARIES AND RELATED EXP,
STOCK OPTIONS SHARES OWNED
Niels Jacobsen - Chairman of the Board (i) 93 0 187,279,233
Kristján Tómas Ragnarsson - Vice Chairman 52 0 623,789
Arne Boye Nielsen 37 0 0
Guðbjörg Edda Eggertsdóttir 37 0 26,318
Svafa Grönfeldt 37 0 0
(i) Shares owned by William Demant Invest A/S which Niels Jacobsen represents on the Board. Niels and financially related parties own personally 193,405 shares.
EXECUTIVE MANAGEMENT
FIXED BASE SALARYCASH BASED
INCENTIVEPENSION
OTHERBENEFITS
SHARE BASEDINCENTIVE
TOTALREMUNERATION
2014
Jón Sigurðsson President and CEO(i) 899 533 0 153 153 1,739
Executive management ( 6 people)(ii) 1,820 513 145 40 266 2,784
2,720 1,046 145 193 419 4,523
2013
Jón Sigurðsson President and CEO(i) 897 375 0 153 153 1,578
Executive management ( 9 people)(ii) 2,156 311 181 132 269 3,049
3,053 686 181 285 422 4,627
(i) Shares owned by Jón Sigurðsson 458.834 (2013: 381.168)(ii) Shares owned by members of executive management 836.849 (2013: 836.849)
ÖSS
UR
HF.
CO
NSO
LID
ATED
FIN
AN
CIA
L ST
ATEM
ENTS
201
4
All amounts in thousands of USD
60 ANNUAL REPORT 14
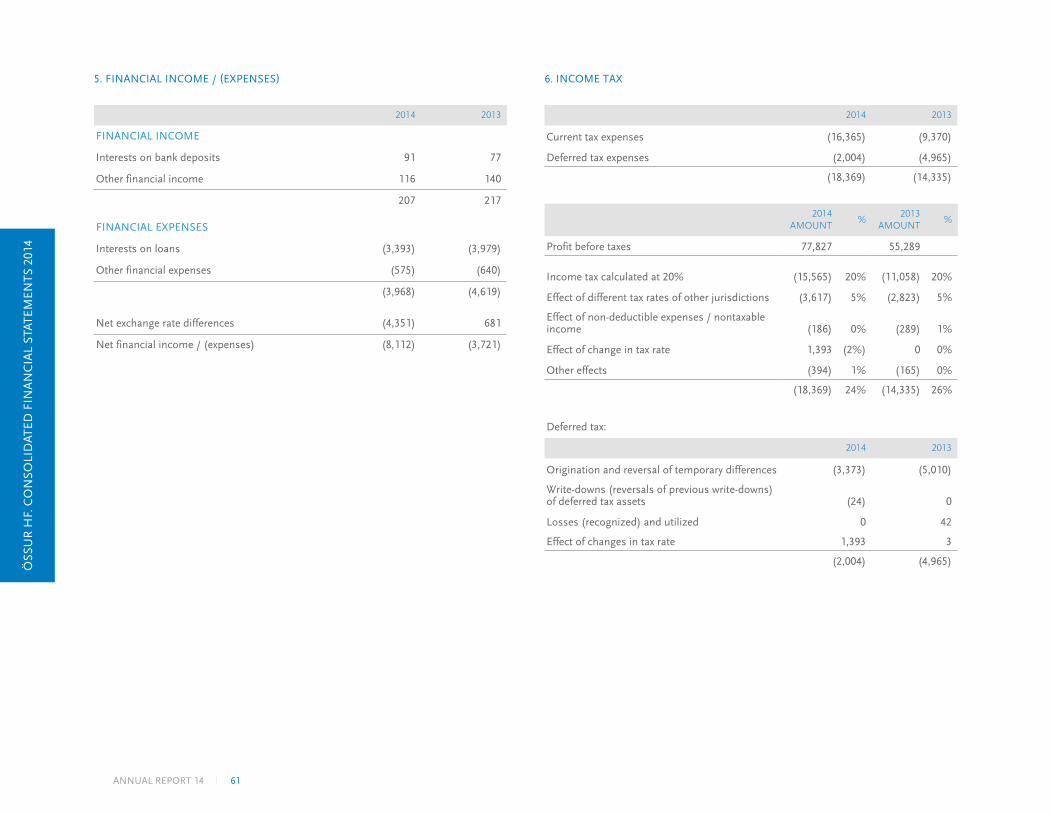
5. FINANCIAL INCOME / (EXPENSES)
2014 2013
FINANCIAL INCOME
Interests on bank deposits 91 77
Other financial income 116 140
207 217
FINANCIAL EXPENSES
Interests on loans (3,393) (3,979)
Other financial expenses (575) (640)
(3,968) (4,619)
Net exchange rate differences (4,351) 681
Net financial income / (expenses) (8,112) (3,721)
6. INCOME TAX
2014 2013
Current tax expenses (16,365) (9,370)
Deferred tax expenses (2,004) (4,965)
(18,369) (14,335)
2014AMOUNT
%2013
AMOUNT%
Profit before taxes 77,827 55,289
Income tax calculated at 20% (15,565) 20% (11,058) 20%
Effect of different tax rates of other jurisdictions (3,617) 5% (2,823) 5%
Effect of non-deductible expenses / nontaxable income (186) 0% (289) 1%
Effect of change in tax rate 1,393 (2%) 0 0%
Other effects (394) 1% (165) 0%
(18,369) 24% (14,335) 26%
Deferred tax:
2014 2013
Origination and reversal of temporary differences (3,373) (5,010)
Write-downs (reversals of previous write-downs) of deferred tax assets (24) 0
Losses (recognized) and utilized 0 42
Effect of changes in tax rate 1,393 3
(2,004) (4,965)ÖSS
UR
HF.
CO
NSO
LID
ATED
FIN
AN
CIA
L ST
ATEM
ENTS
201
4
61ANNUAL REPORT 14
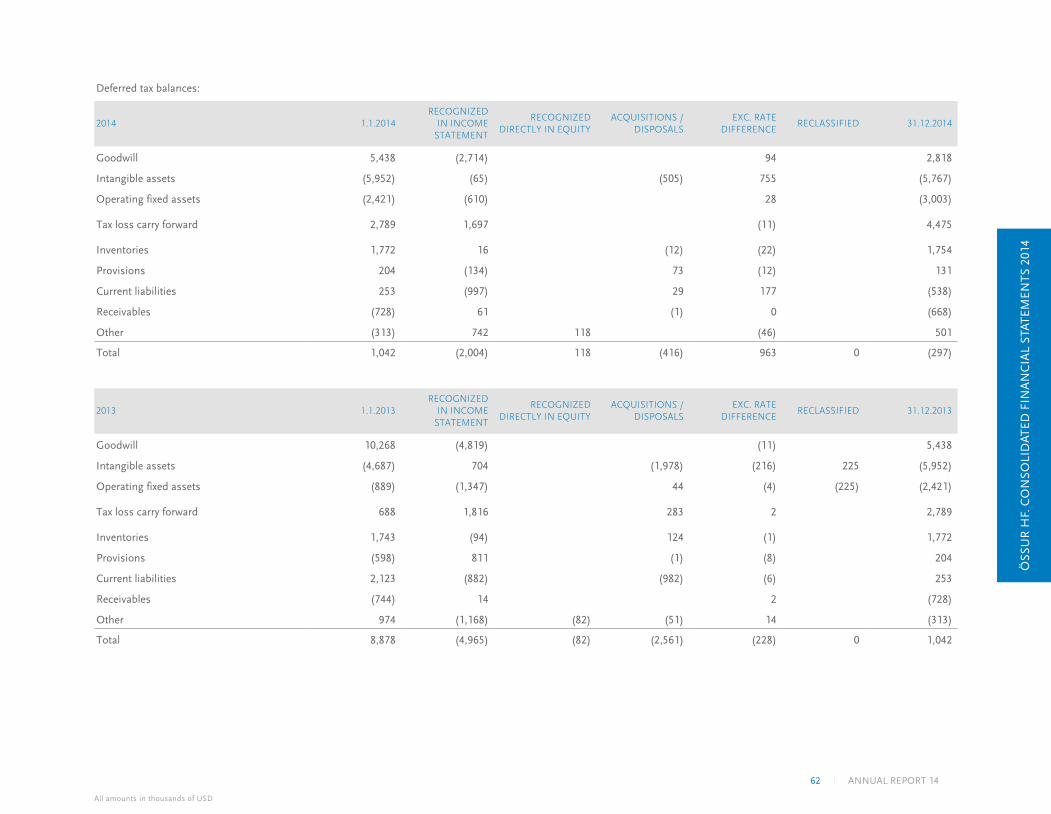
Deferred tax balances:
2014 1.1.2014RECOGNIZED
IN INCOME STATEMENT
RECOGNIZED DIRECTLY IN EQUITY
ACQUISITIONS / DISPOSALS
EXC. RATE DIFFERENCE
RECLASSIFIED 31.12.2014
Goodwill 5,438 (2,714) 94 2,818
Intangible assets (5,952) (65) (505) 755 (5,767)
Operating fixed assets (2,421) (610) 28 (3,003)
Tax loss carry forward 2,789 1,697 (11) 4,475
Inventories 1,772 16 (12) (22) 1,754
Provisions 204 (134) 73 (12) 131
Current liabilities 253 (997) 29 177 (538)
Receivables (728) 61 (1) 0 (668)
Other (313) 742 118 (46) 501
Total 1,042 (2,004) 118 (416) 963 0 (297)
2013 1.1.2013RECOGNIZED
IN INCOME STATEMENT
RECOGNIZED DIRECTLY IN EQUITY
ACQUISITIONS / DISPOSALS
EXC. RATE DIFFERENCE
RECLASSIFIED 31.12.2013
Goodwill 10,268 (4,819) (11) 5,438
Intangible assets (4,687) 704 (1,978) (216) 225 (5,952)
Operating fixed assets (889) (1,347) 44 (4) (225) (2,421)
Tax loss carry forward 688 1,816 283 2 2,789
Inventories 1,743 (94) 124 (1) 1,772
Provisions (598) 811 (1) (8) 204
Current liabilities 2,123 (882) (982) (6) 253
Receivables (744) 14 2 (728)
Other 974 (1,168) (82) (51) 14 (313)
Total 8,878 (4,965) (82) (2,561) (228) 0 1,042
ÖSS
UR
HF.
CO
NSO
LID
ATED
FIN
AN
CIA
L ST
ATEM
ENTS
201
4
All amounts in thousands of USD
62 ANNUAL REPORT 14
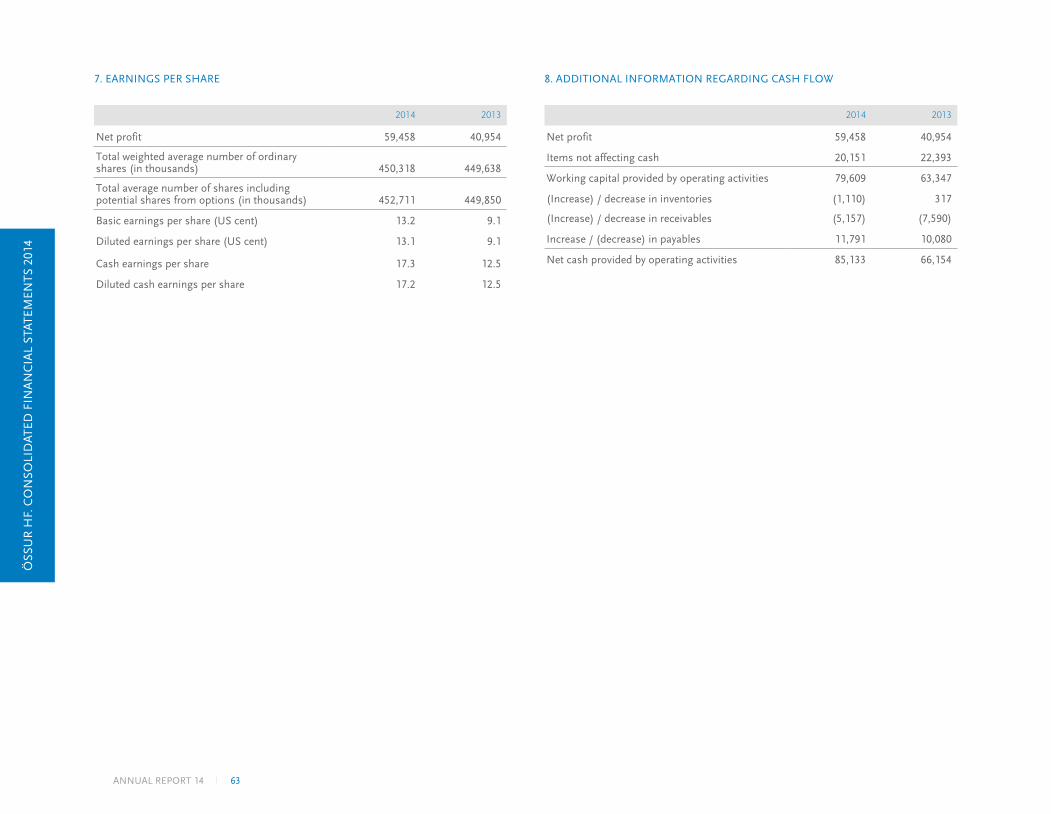
7. EARNINGS PER SHARE
2014 2013
Net profit 59,458 40,954
Total weighted average number of ordinary shares (in thousands) 450,318 449,638
Total average number of shares including potential shares from options (in thousands) 452,711 449,850
Basic earnings per share (US cent) 13.2 9.1
Diluted earnings per share (US cent) 13.1 9.1
Cash earnings per share 17.3 12.5
Diluted cash earnings per share 17.2 12.5
8. ADDITIONAL INFORMATION REGARDING CASH FLOW
2014 2013
Net profit 59,458 40,954
Items not affecting cash 20,151 22,393
Working capital provided by operating activities 79,609 63,347
(Increase) / decrease in inventories (1,110) 317
(Increase) / decrease in receivables (5,157) (7,590)
Increase / (decrease) in payables 11,791 10,080
Net cash provided by operating activities 85,133 66,154
ÖSS
UR
HF.
CO
NSO
LID
ATED
FIN
AN
CIA
L ST
ATEM
ENTS
201
4
63ANNUAL REPORT 14
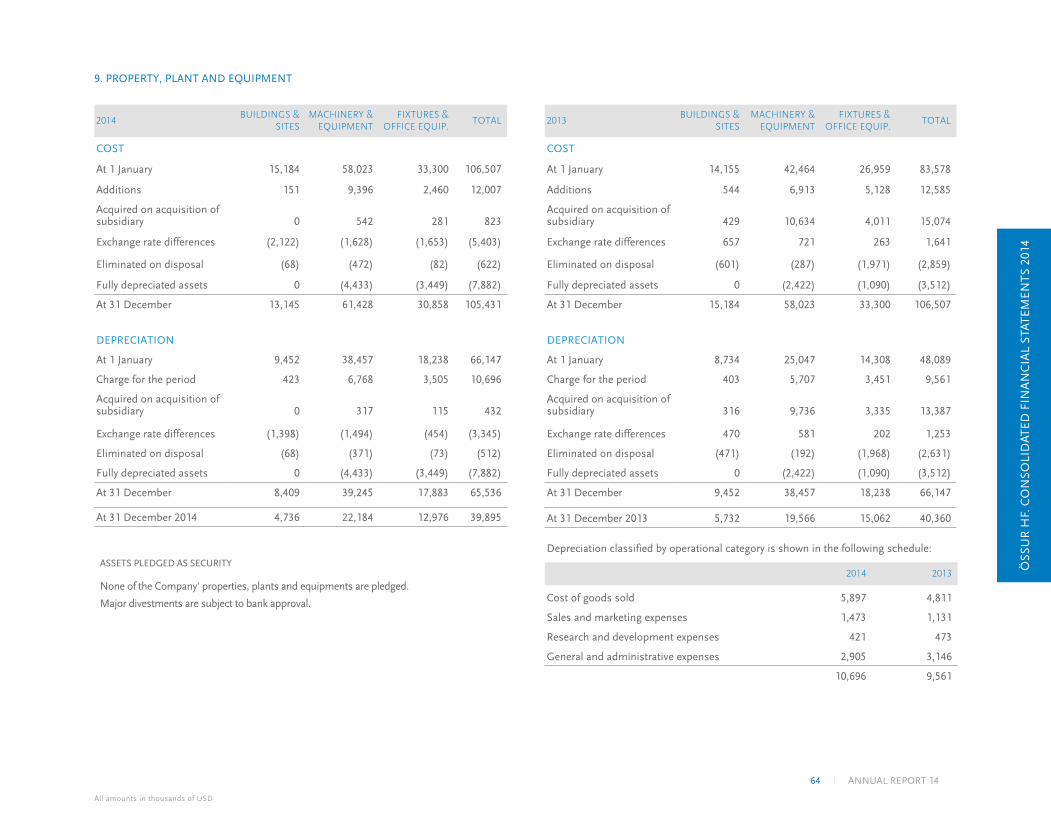
9. PROPERTY, PLANT AND EQUIPMENT
2014BUILDINGS &
SITESMACHINERY &
EQUIPMENTFIXTURES &
OFFICE EQUIP.TOTAL
COST
At 1 January 15,184 58,023 33,300 106,507
Additions 151 9,396 2,460 12,007
Acquired on acquisition of subsidiary 0 542 281 823
Exchange rate differences (2,122) (1,628) (1,653) (5,403)
Eliminated on disposal (68) (472) (82) (622)
Fully depreciated assets 0 (4,433) (3,449) (7,882)
At 31 December 13,145 61,428 30,858 105,431
DEPRECIATION
At 1 January 9,452 38,457 18,238 66,147
Charge for the period 423 6,768 3,505 10,696
Acquired on acquisition of subsidiary 0 317 115 432
Exchange rate differences (1,398) (1,494) (454) (3,345)
Eliminated on disposal (68) (371) (73) (512)
Fully depreciated assets 0 (4,433) (3,449) (7,882)
At 31 December 8,409 39,245 17,883 65,536
At 31 December 2014 4,736 22,184 12,976 39,895
ASSETS PLEDGED AS SECURITY
None of the Company' properties, plants and equipments are pledged.
Major divestments are subject to bank approval.
2013BUILDINGS &
SITESMACHINERY &
EQUIPMENTFIXTURES &
OFFICE EQUIP.TOTAL
COST
At 1 January 14,155 42,464 26,959 83,578
Additions 544 6,913 5,128 12,585
Acquired on acquisition of subsidiary 429 10,634 4,011 15,074
Exchange rate differences 657 721 263 1,641
Eliminated on disposal (601) (287) (1,971) (2,859)
Fully depreciated assets 0 (2,422) (1,090) (3,512)
At 31 December 15,184 58,023 33,300 106,507
DEPRECIATION
At 1 January 8,734 25,047 14,308 48,089
Charge for the period 403 5,707 3,451 9,561
Acquired on acquisition of subsidiary 316 9,736 3,335 13,387
Exchange rate differences 470 581 202 1,253
Eliminated on disposal (471) (192) (1,968) (2,631)
Fully depreciated assets 0 (2,422) (1,090) (3,512)
At 31 December 9,452 38,457 18,238 66,147
At 31 December 2013 5,732 19,566 15,062 40,360
Depreciation classified by operational category is shown in the following schedule:
2014 2013
Cost of goods sold 5,897 4,811
Sales and marketing expenses 1,473 1,131
Research and development expenses 421 473
General and administrative expenses 2,905 3,146
10,696 9,561
ÖSS
UR
HF.
CO
NSO
LID
ATED
FIN
AN
CIA
L ST
ATEM
ENTS
201
4
All amounts in thousands of USD
64 ANNUAL REPORT 14
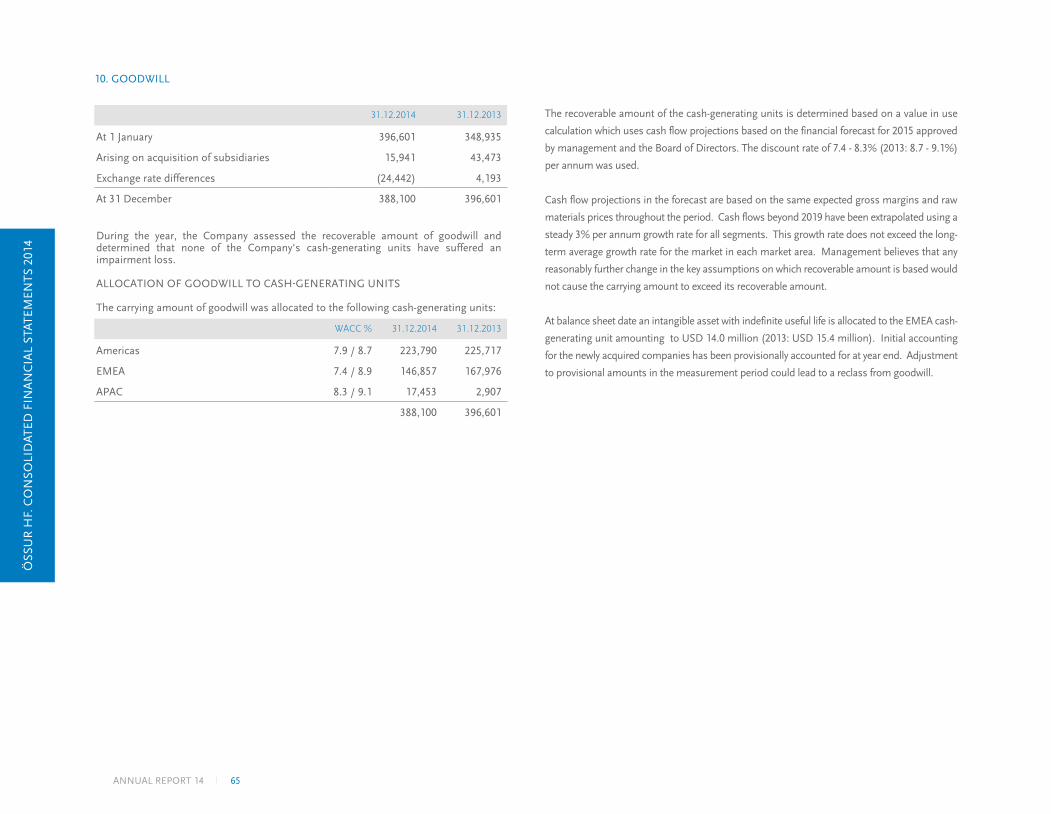
10. GOODWILL
31.12.2014 31.12.2013
At 1 January 396,601 348,935
Arising on acquisition of subsidiaries 15,941 43,473
Exchange rate differences (24,442) 4,193
At 31 December 388,100 396,601
During the year, the Company assessed the recoverable amount of goodwill and determined that none of the Company's cash-generating units have suffered an impairment loss.
ALLOCATION OF GOODWILL TO CASH-GENERATING UNITS
The carrying amount of goodwill was allocated to the following cash-generating units:
WACC % 31.12.2014 31.12.2013
Americas 7.9 / 8.7 223,790 225,717
EMEA 7.4 / 8.9 146,857 167,976
APAC 8.3 / 9.1 17,453 2,907
388,100 396,601
The recoverable amount of the cash-generating units is determined based on a value in use
calculation which uses cash flow projections based on the financial forecast for 2015 approved
by management and the Board of Directors. The discount rate of 7.4 - 8.3% (2013: 8.7 - 9.1%)
per annum was used.
Cash flow projections in the forecast are based on the same expected gross margins and raw
materials prices throughout the period. Cash flows beyond 2019 have been extrapolated using a
steady 3% per annum growth rate for all segments. This growth rate does not exceed the long-
term average growth rate for the market in each market area. Management believes that any
reasonably further change in the key assumptions on which recoverable amount is based would
not cause the carrying amount to exceed its recoverable amount.
At balance sheet date an intangible asset with indefinite useful life is allocated to the EMEA cash-
generating unit amounting to USD 14.0 million (2013: USD 15.4 million). Initial accounting
for the newly acquired companies has been provisionally accounted for at year end. Adjustment
to provisional amounts in the measurement period could lead to a reclass from goodwill.
ÖSS
UR
HF.
CO
NSO
LID
ATED
FIN
AN
CIA
L ST
ATEM
ENTS
201
4
65ANNUAL REPORT 14
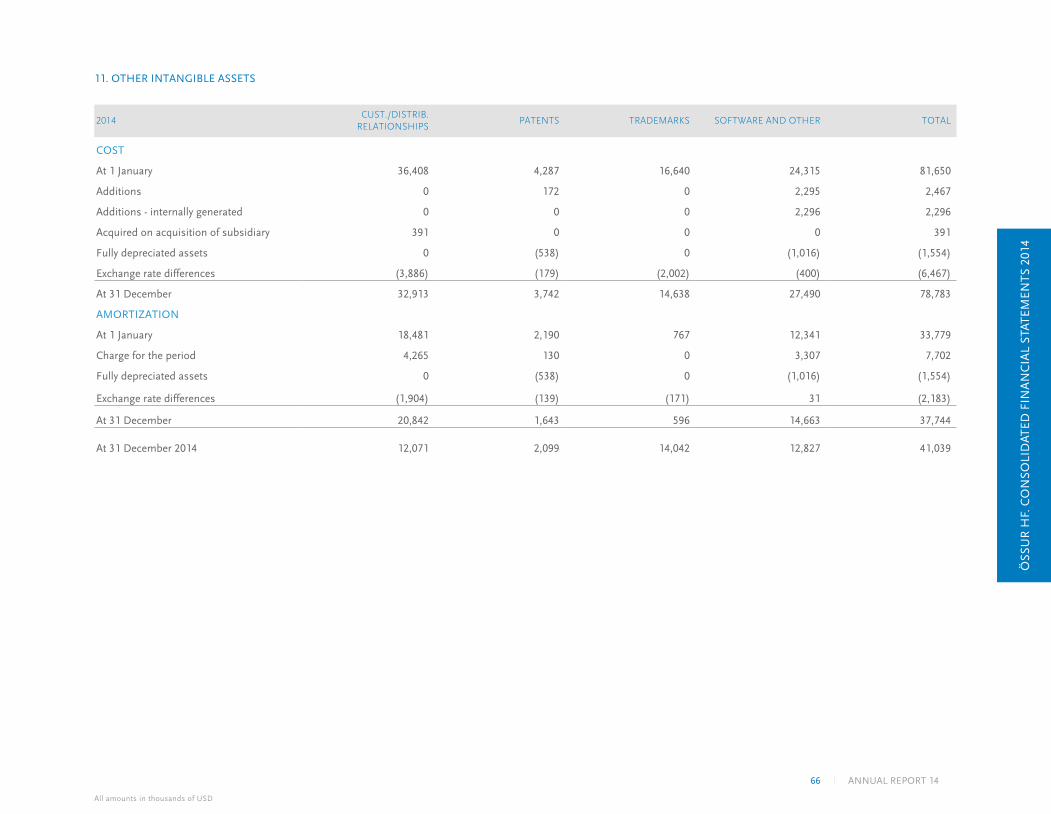
11. OTHER INTANGIBLE ASSETS
2014CUST./DISTRIB.
RELATIONSHIPSPATENTS TRADEMARKS SOFTWARE AND OTHER TOTAL
COST
At 1 January 36,408 4,287 16,640 24,315 81,650
Additions 0 172 0 2,295 2,467
Additions - internally generated 0 0 0 2,296 2,296
Acquired on acquisition of subsidiary 391 0 0 0 391
Fully depreciated assets 0 (538) 0 (1,016) (1,554)
Exchange rate differences (3,886) (179) (2,002) (400) (6,467)
At 31 December 32,913 3,742 14,638 27,490 78,783
AMORTIZATION
At 1 January 18,481 2,190 767 12,341 33,779
Charge for the period 4,265 130 0 3,307 7,702
Fully depreciated assets 0 (538) 0 (1,016) (1,554)
Exchange rate differences (1,904) (139) (171) 31 (2,183)
At 31 December 20,842 1,643 596 14,663 37,744
At 31 December 2014 12,071 2,099 14,042 12,827 41,039
ÖSS
UR
HF.
CO
NSO
LID
ATED
FIN
AN
CIA
L ST
ATEM
ENTS
201
4
All amounts in thousands of USD
66 ANNUAL REPORT 14
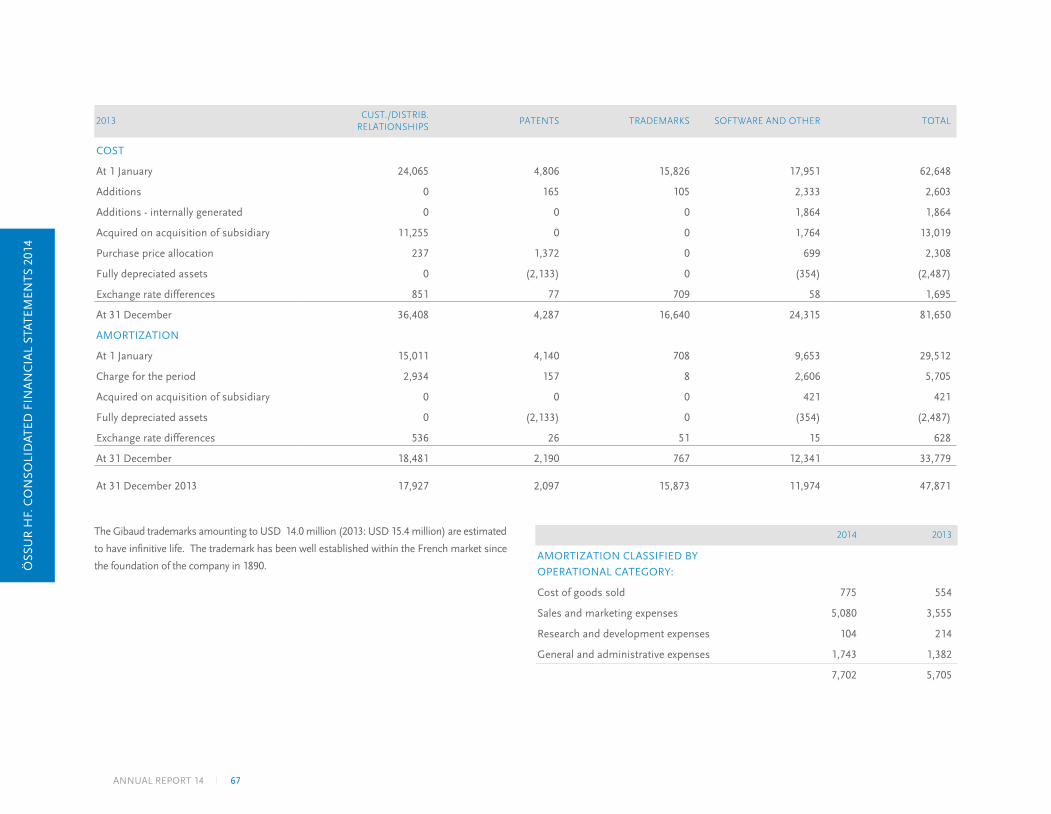
2013CUST./DISTRIB.
RELATIONSHIPSPATENTS TRADEMARKS SOFTWARE AND OTHER TOTAL
COST
At 1 January 24,065 4,806 15,826 17,951 62,648
Additions 0 165 105 2,333 2,603
Additions - internally generated 0 0 0 1,864 1,864
Acquired on acquisition of subsidiary 11,255 0 0 1,764 13,019
Purchase price allocation 237 1,372 0 699 2,308
Fully depreciated assets 0 (2,133) 0 (354) (2,487)
Exchange rate differences 851 77 709 58 1,695
At 31 December 36,408 4,287 16,640 24,315 81,650
AMORTIZATION
At 1 January 15,011 4,140 708 9,653 29,512
Charge for the period 2,934 157 8 2,606 5,705
Acquired on acquisition of subsidiary 0 0 0 421 421
Fully depreciated assets 0 (2,133) 0 (354) (2,487)
Exchange rate differences 536 26 51 15 628
At 31 December 18,481 2,190 767 12,341 33,779
At 31 December 2013 17,927 2,097 15,873 11,974 47,871
2014 2013
AMORTIZATION CLASSIFIED BY
OPERATIONAL CATEGORY:
Cost of goods sold 775 554
Sales and marketing expenses 5,080 3,555
Research and development expenses 104 214
General and administrative expenses 1,743 1,382
7,702 5,705
The Gibaud trademarks amounting to USD 14.0 million (2013: USD 15.4 million) are estimated
to have infinitive life. The trademark has been well established within the French market since
the foundation of the company in 1890. ÖSS
UR
HF.
CO
NSO
LID
ATED
FIN
AN
CIA
L ST
ATEM
ENTS
201
4
67ANNUAL REPORT 14
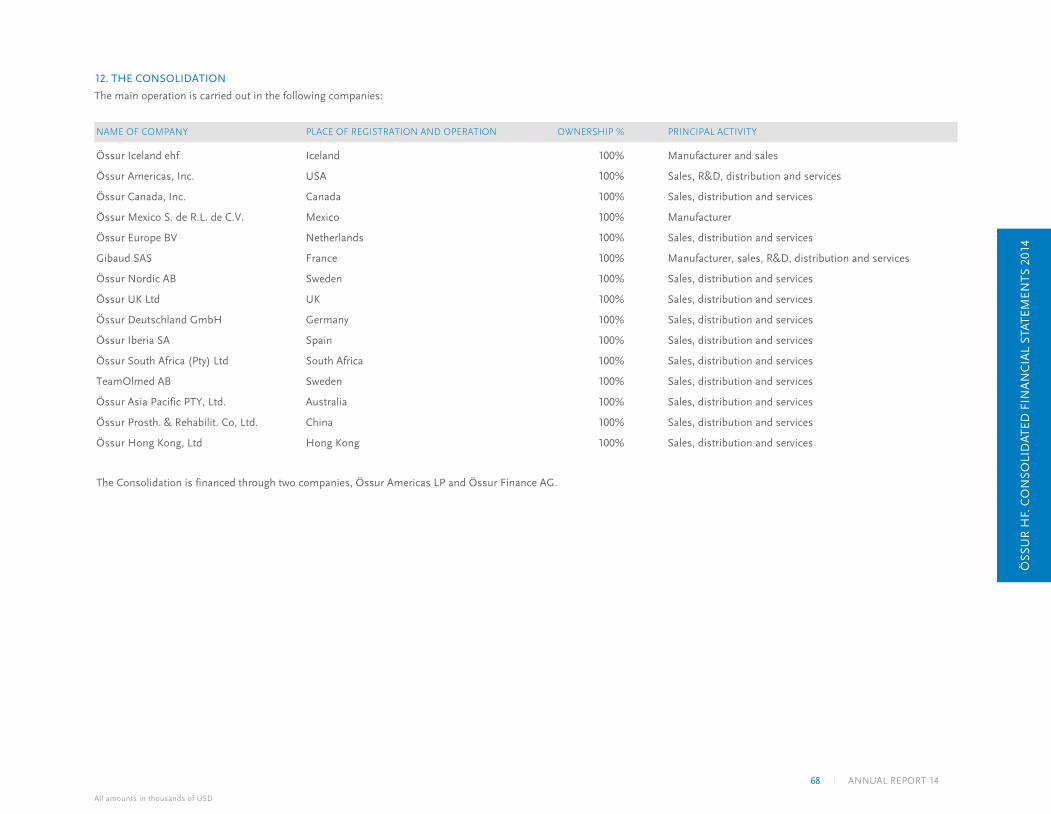
12. THE CONSOLIDATION
The main operation is carried out in the following companies:
NAME OF COMPANY PLACE OF REGISTRATION AND OPERATION OWNERSHIP % PRINCIPAL ACTIVITY
Össur Iceland ehf Iceland 100% Manufacturer and sales
Össur Americas, Inc. USA 100% Sales, R&D, distribution and services
Össur Canada, Inc. Canada 100% Sales, distribution and services
Össur Mexico S. de R.L. de C.V. Mexico 100% Manufacturer
Össur Europe BV Netherlands 100% Sales, distribution and services
Gibaud SAS France 100% Manufacturer, sales, R&D, distribution and services
Össur Nordic AB Sweden 100% Sales, distribution and services
Össur UK Ltd UK 100% Sales, distribution and services
Össur Deutschland GmbH Germany 100% Sales, distribution and services
Össur Iberia SA Spain 100% Sales, distribution and services
Össur South Africa (Pty) Ltd South Africa 100% Sales, distribution and services
TeamOlmed AB Sweden 100% Sales, distribution and services
Össur Asia Pacific PTY, Ltd. Australia 100% Sales, distribution and services
Össur Prosth. & Rehabilit. Co, Ltd. China 100% Sales, distribution and services
Össur Hong Kong, Ltd Hong Kong 100% Sales, distribution and services
The Consolidation is financed through two companies, Össur Americas LP and Össur Finance AG.
ÖSS
UR
HF.
CO
NSO
LID
ATED
FIN
AN
CIA
L ST
ATEM
ENTS
201
4
All amounts in thousands of USD
68 ANNUAL REPORT 14
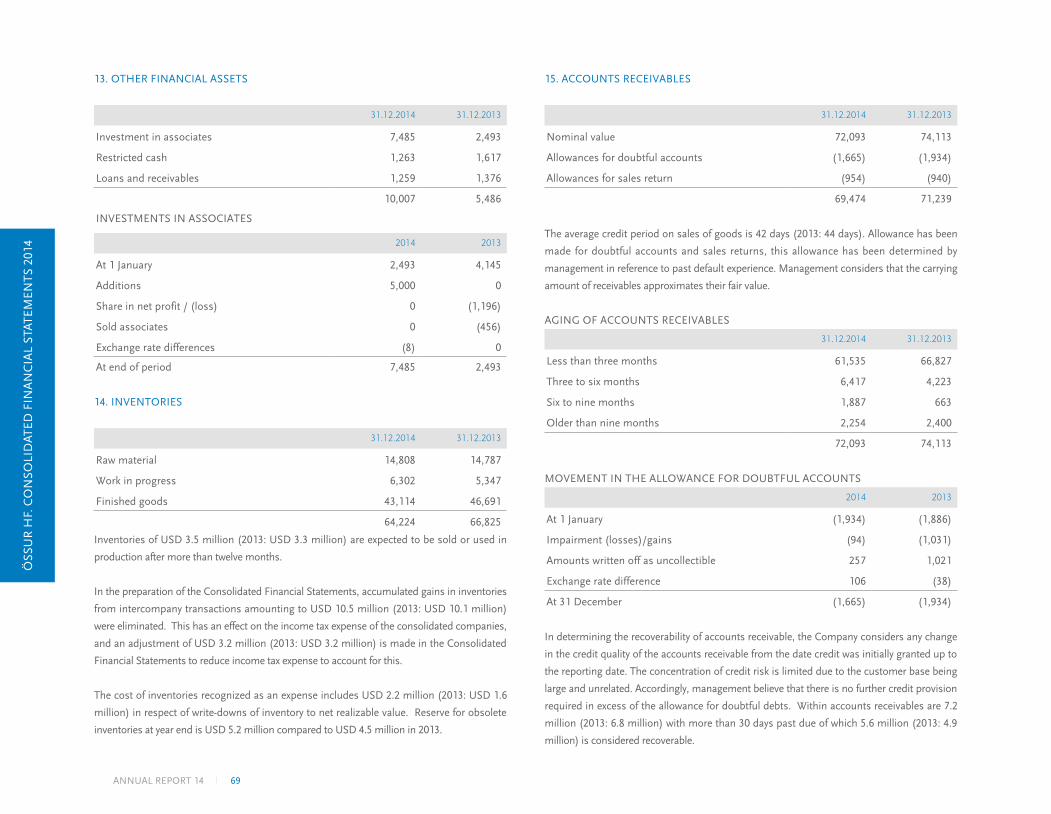
13. OTHER FINANCIAL ASSETS
31.12.2014 31.12.2013
Investment in associates 7,485 2,493
Restricted cash 1,263 1,617
Loans and receivables 1,259 1,376
10,007 5,486
INVESTMENTS IN ASSOCIATES
2014 2013
At 1 January 2,493 4,145
Additions 5,000 0
Share in net profit / (loss) 0 (1,196)
Sold associates 0 (456)
Exchange rate differences (8) 0
At end of period 7,485 2,493
14. INVENTORIES
31.12.2014 31.12.2013
Raw material 14,808 14,787
Work in progress 6,302 5,347
Finished goods 43,114 46,691
64,224 66,825
Inventories of USD 3.5 million (2013: USD 3.3 million) are expected to be sold or used in
production after more than twelve months.
In the preparation of the Consolidated Financial Statements, accumulated gains in inventories
from intercompany transactions amounting to USD 10.5 million (2013: USD 10.1 million)
were eliminated. This has an effect on the income tax expense of the consolidated companies,
and an adjustment of USD 3.2 million (2013: USD 3.2 million) is made in the Consolidated
Financial Statements to reduce income tax expense to account for this.
The cost of inventories recognized as an expense includes USD 2.2 million (2013: USD 1.6
million) in respect of write-downs of inventory to net realizable value. Reserve for obsolete
inventories at year end is USD 5.2 million compared to USD 4.5 million in 2013.
15. ACCOUNTS RECEIVABLES
31.12.2014 31.12.2013
Nominal value 72,093 74,113
Allowances for doubtful accounts (1,665) (1,934)
Allowances for sales return (954) (940)
69,474 71,239
The average credit period on sales of goods is 42 days (2013: 44 days). Allowance has been
made for doubtful accounts and sales returns, this allowance has been determined by
management in reference to past default experience. Management considers that the carrying
amount of receivables approximates their fair value.
AGING OF ACCOUNTS RECEIVABLES
31.12.2014 31.12.2013
Less than three months 61,535 66,827
Three to six months 6,417 4,223
Six to nine months 1,887 663
Older than nine months 2,254 2,400
72,093 74,113
MOVEMENT IN THE ALLOWANCE FOR DOUBTFUL ACCOUNTS
2014 2013
At 1 January (1,934) (1,886)
Impairment (losses)/gains (94) (1,031)
Amounts written off as uncollectible 257 1,021
Exchange rate difference 106 (38)
At 31 December (1,665) (1,934)
In determining the recoverability of accounts receivable, the Company considers any change
in the credit quality of the accounts receivable from the date credit was initially granted up to
the reporting date. The concentration of credit risk is limited due to the customer base being
large and unrelated. Accordingly, management believe that there is no further credit provision
required in excess of the allowance for doubtful debts. Within accounts receivables are 7.2
million (2013: 6.8 million) with more than 30 days past due of which 5.6 million (2013: 4.9
million) is considered recoverable.
ÖSS
UR
HF.
CO
NSO
LID
ATED
FIN
AN
CIA
L ST
ATEM
ENTS
201
4
69ANNUAL REPORT 14
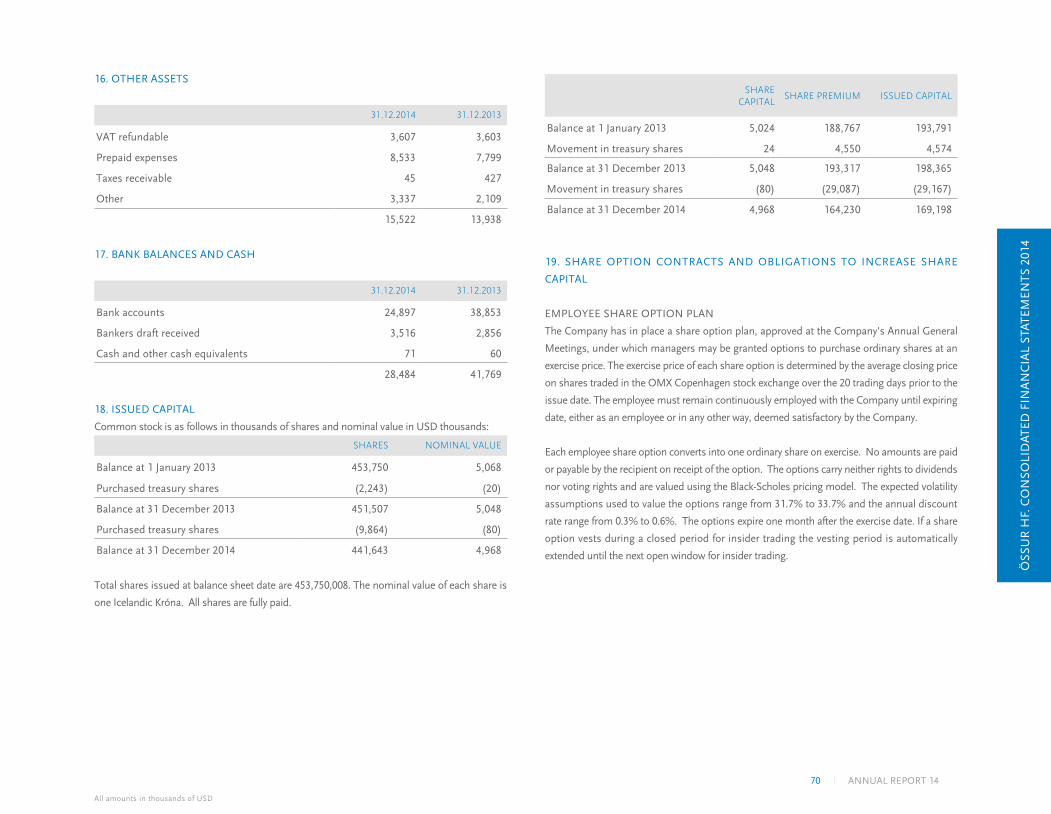
16. OTHER ASSETS
31.12.2014 31.12.2013
VAT refundable 3,607 3,603
Prepaid expenses 8,533 7,799
Taxes receivable 45 427
Other 3,337 2,109
15,522 13,938
17. BANK BALANCES AND CASH
31.12.2014 31.12.2013
Bank accounts 24,897 38,853
Bankers draft received 3,516 2,856
Cash and other cash equivalents 71 60
28,484 41,769
18. ISSUED CAPITAL
Common stock is as follows in thousands of shares and nominal value in USD thousands:
SHARES NOMINAL VALUE
Balance at 1 January 2013 453,750 5,068
Purchased treasury shares (2,243) (20)
Balance at 31 December 2013 451,507 5,048
Purchased treasury shares (9,864) (80)
Balance at 31 December 2014 441,643 4,968
Total shares issued at balance sheet date are 453,750,008. The nominal value of each share is
one Icelandic Króna. All shares are fully paid.
SHARE CAPITAL
SHARE PREMIUM ISSUED CAPITAL
Balance at 1 January 2013 5,024 188,767 193,791
Movement in treasury shares 24 4,550 4,574
Balance at 31 December 2013 5,048 193,317 198,365
Movement in treasury shares (80) (29,087) (29,167)
Balance at 31 December 2014 4,968 164,230 169,198
19. SHARE OPTION CONTRACTS AND OBLIGATIONS TO INCREASE SHARE
CAPITAL
EMPLOYEE SHARE OPTION PLAN
The Company has in place a share option plan, approved at the Company's Annual General
Meetings, under which managers may be granted options to purchase ordinary shares at an
exercise price. The exercise price of each share option is determined by the average closing price
on shares traded in the OMX Copenhagen stock exchange over the 20 trading days prior to the
issue date. The employee must remain continuously employed with the Company until expiring
date, either as an employee or in any other way, deemed satisfactory by the Company.
Each employee share option converts into one ordinary share on exercise. No amounts are paid
or payable by the recipient on receipt of the option. The options carry neither rights to dividends
nor voting rights and are valued using the Black-Scholes pricing model. The expected volatility
assumptions used to value the options range from 31.7% to 33.7% and the annual discount
rate range from 0.3% to 0.6%. The options expire one month after the exercise date. If a share
option vests during a closed period for insider trading the vesting period is automatically
extended until the next open window for insider trading.
ÖSS
UR
HF.
CO
NSO
LID
ATED
FIN
AN
CIA
L ST
ATEM
ENTS
201
4
All amounts in thousands of USD
70 ANNUAL REPORT 14
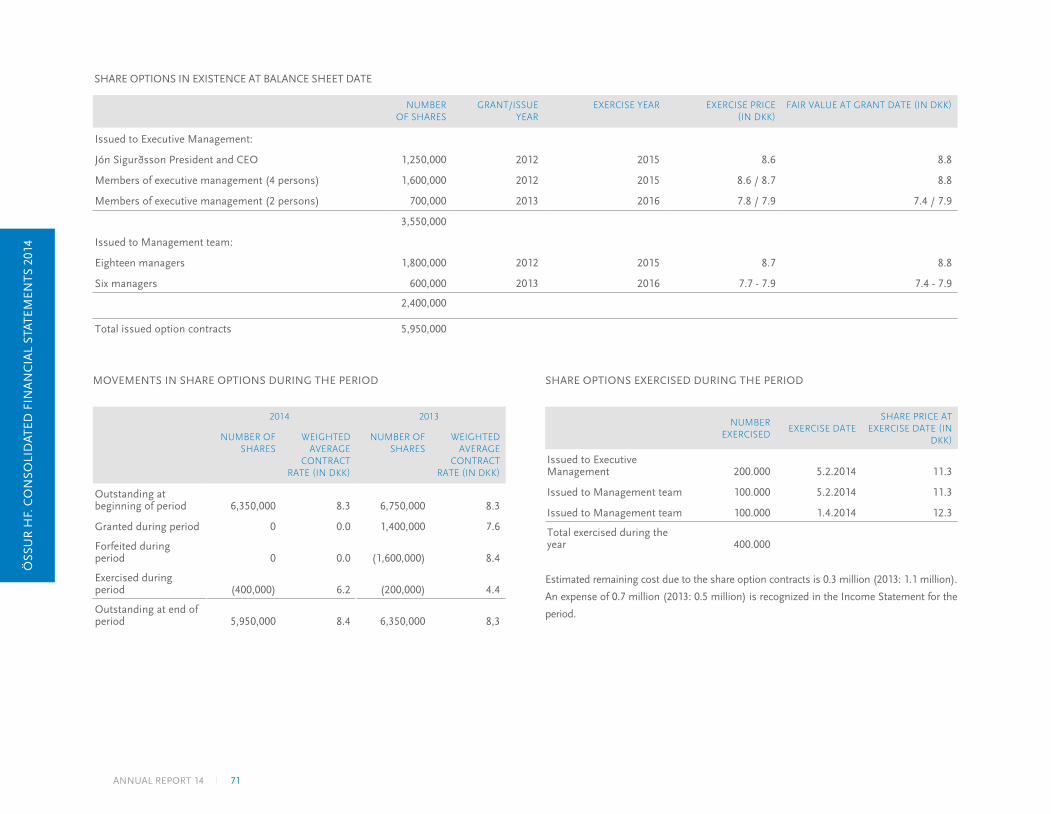
NUMBER OF SHARES
GRANT/ISSUE YEAR
EXERCISE YEAR EXERCISE PRICE (IN DKK)
FAIR VALUE AT GRANT DATE (IN DKK)
Issued to Executive Management:
Jón Sigurðsson President and CEO 1,250,000 2012 2015 8.6 8.8
Members of executive management (4 persons) 1,600,000 2012 2015 8.6 / 8.7 8.8
Members of executive management (2 persons) 700,000 2013 2016 7.8 / 7.9 7.4 / 7.9
3,550,000
Issued to Management team:
Eighteen managers 1,800,000 2012 2015 8.7 8.8
Six managers 600,000 2013 2016 7.7 - 7.9 7.4 - 7.9
2,400,000
Total issued option contracts 5,950,000
SHARE OPTIONS IN EXISTENCE AT BALANCE SHEET DATE
MOVEMENTS IN SHARE OPTIONS DURING THE PERIOD
2014 2013
NUMBER OF SHARES
WEIGHTED AVERAGE
CONTRACT RATE (IN DKK)
NUMBER OF SHARES
WEIGHTED AVERAGE
CONTRACT RATE (IN DKK)
Outstanding at beginning of period 6,350,000 8.3 6,750,000 8.3
Granted during period 0 0.0 1,400,000 7.6
Forfeited during period 0 0.0 (1,600,000) 8.4
Exercised during period (400,000) 6.2 (200,000) 4.4
Outstanding at end of period 5,950,000 8.4 6,350,000 8,3
SHARE OPTIONS EXERCISED DURING THE PERIOD
NUMBER EXERCISED
EXERCISE DATESHARE PRICE AT
EXERCISE DATE (IN DKK)
Issued to Executive Management 200.000 5.2.2014 11.3
Issued to Management team 100.000 5.2.2014 11.3
Issued to Management team 100.000 1.4.2014 12.3
Total exercised during the year 400.000
Estimated remaining cost due to the share option contracts is 0.3 million (2013: 1.1 million).
An expense of 0.7 million (2013: 0.5 million) is recognized in the Income Statement for the
period.
ÖSS
UR
HF.
CO
NSO
LID
ATED
FIN
AN
CIA
L ST
ATEM
ENTS
201
4
71ANNUAL REPORT 14
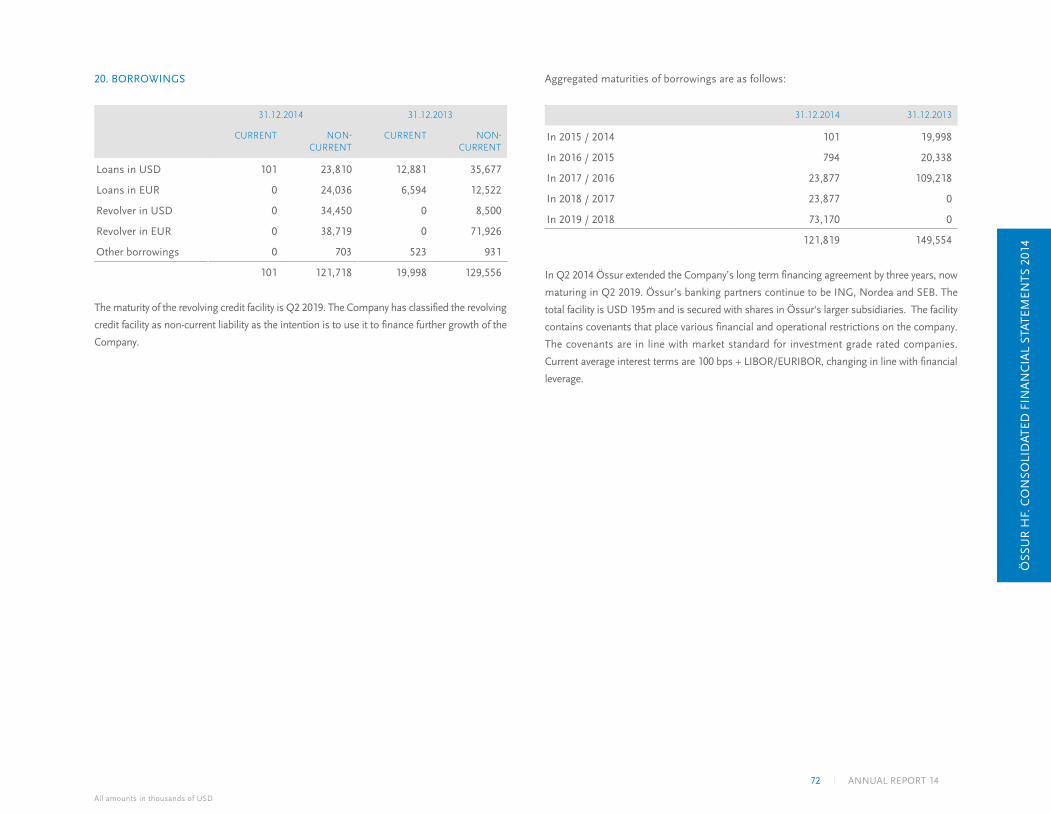
20. BORROWINGS
31.12.2014 31.12.2013
CURRENT NON-CURRENT
CURRENT NON-CURRENT
Loans in USD 101 23,810 12,881 35,677
Loans in EUR 0 24,036 6,594 12,522
Revolver in USD 0 34,450 0 8,500
Revolver in EUR 0 38,719 0 71,926
Other borrowings 0 703 523 931
101 121,718 19,998 129,556
The maturity of the revolving credit facility is Q2 2019. The Company has classified the revolving
credit facility as non-current liability as the intention is to use it to finance further growth of the
Company.
Aggregated maturities of borrowings are as follows:
31.12.2014 31.12.2013
In 2015 / 2014 101 19,998
In 2016 / 2015 794 20,338
In 2017 / 2016 23,877 109,218
In 2018 / 2017 23,877 0
In 2019 / 2018 73,170 0
121,819 149,554
In Q2 2014 Össur extended the Company’s long term financing agreement by three years, now
maturing in Q2 2019. Össur’s banking partners continue to be ING, Nordea and SEB. The
total facility is USD 195m and is secured with shares in Össur‘s larger subsidiaries. The facility
contains covenants that place various financial and operational restrictions on the company.
The covenants are in line with market standard for investment grade rated companies.
Current average interest terms are 100 bps + LIBOR/EURIBOR, changing in line with financial
leverage.
ÖSS
UR
HF.
CO
NSO
LID
ATED
FIN
AN
CIA
L ST
ATEM
ENTS
201
4
All amounts in thousands of USD
72 ANNUAL REPORT 14
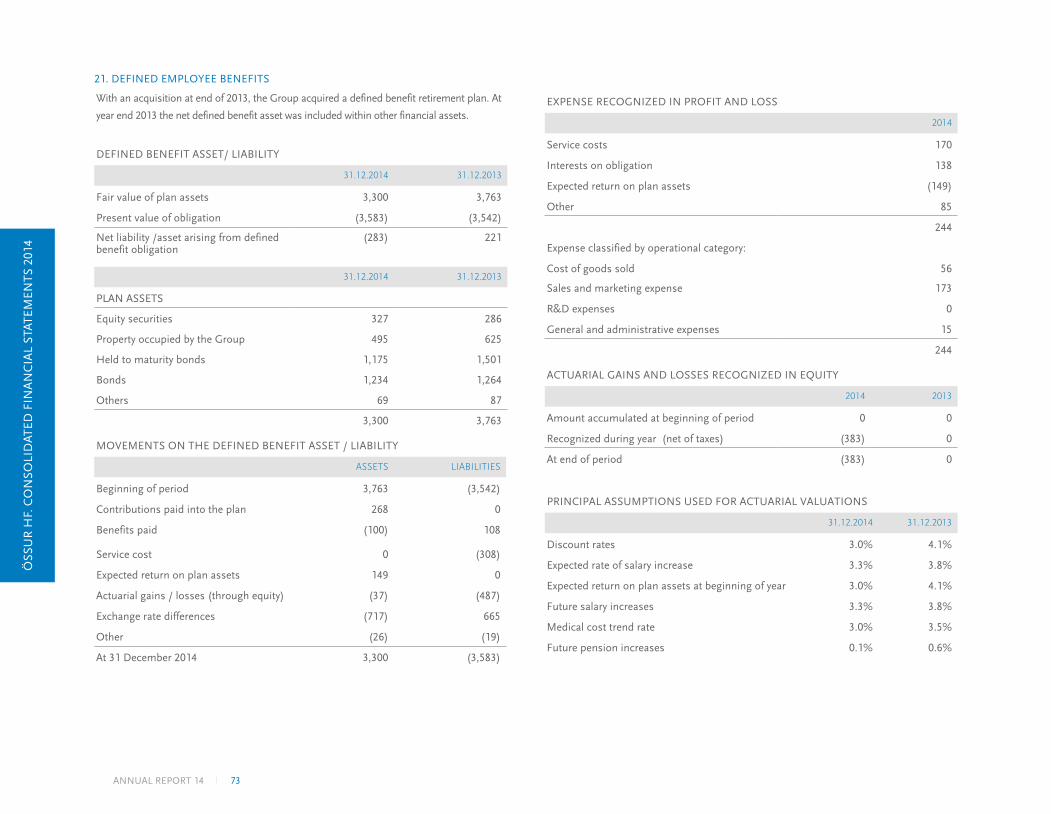
21. DEFINED EMPLOYEE BENEFITS
With an acquisition at end of 2013, the Group acquired a defined benefit retirement plan. At
year end 2013 the net defined benefit asset was included within other financial assets.
DEFINED BENEFIT ASSET/ LIABILITY
31.12.2014 31.12.2013
Fair value of plan assets 3,300 3,763
Present value of obligation (3,583) (3,542)
Net liability /asset arising from defined benefit obligation
(283) 221
31.12.2014 31.12.2013
PLAN ASSETS
Equity securities 327 286
Property occupied by the Group 495 625
Held to maturity bonds 1,175 1,501
Bonds 1,234 1,264
Others 69 87
3,300 3,763
MOVEMENTS ON THE DEFINED BENEFIT ASSET / LIABILITY
ASSETS LIABILITIES
Beginning of period 3,763 (3,542)
Contributions paid into the plan 268 0
Benefits paid (100) 108
Service cost 0 (308)
Expected return on plan assets 149 0
Actuarial gains / losses (through equity) (37) (487)
Exchange rate differences (717) 665
Other (26) (19)
At 31 December 2014 3,300 (3,583)
EXPENSE RECOGNIZED IN PROFIT AND LOSS
2014
Service costs 170
Interests on obligation 138
Expected return on plan assets (149)
Other 85
244
Expense classified by operational category:
Cost of goods sold 56
Sales and marketing expense 173
R&D expenses 0
General and administrative expenses 15
244
ACTUARIAL GAINS AND LOSSES RECOGNIZED IN EQUITY
2014 2013
Amount accumulated at beginning of period 0 0
Recognized during year (net of taxes) (383) 0
At end of period (383) 0
PRINCIPAL ASSUMPTIONS USED FOR ACTUARIAL VALUATIONS
31.12.2014 31.12.2013
Discount rates 3.0% 4.1%
Expected rate of salary increase 3.3% 3.8%
Expected return on plan assets at beginning of year 3.0% 4.1%
Future salary increases 3.3% 3.8%
Medical cost trend rate 3.0% 3.5%
Future pension increases 0.1% 0.6%
ÖSS
UR
HF.
CO
NSO
LID
ATED
FIN
AN
CIA
L ST
ATEM
ENTS
201
4
73ANNUAL REPORT 14
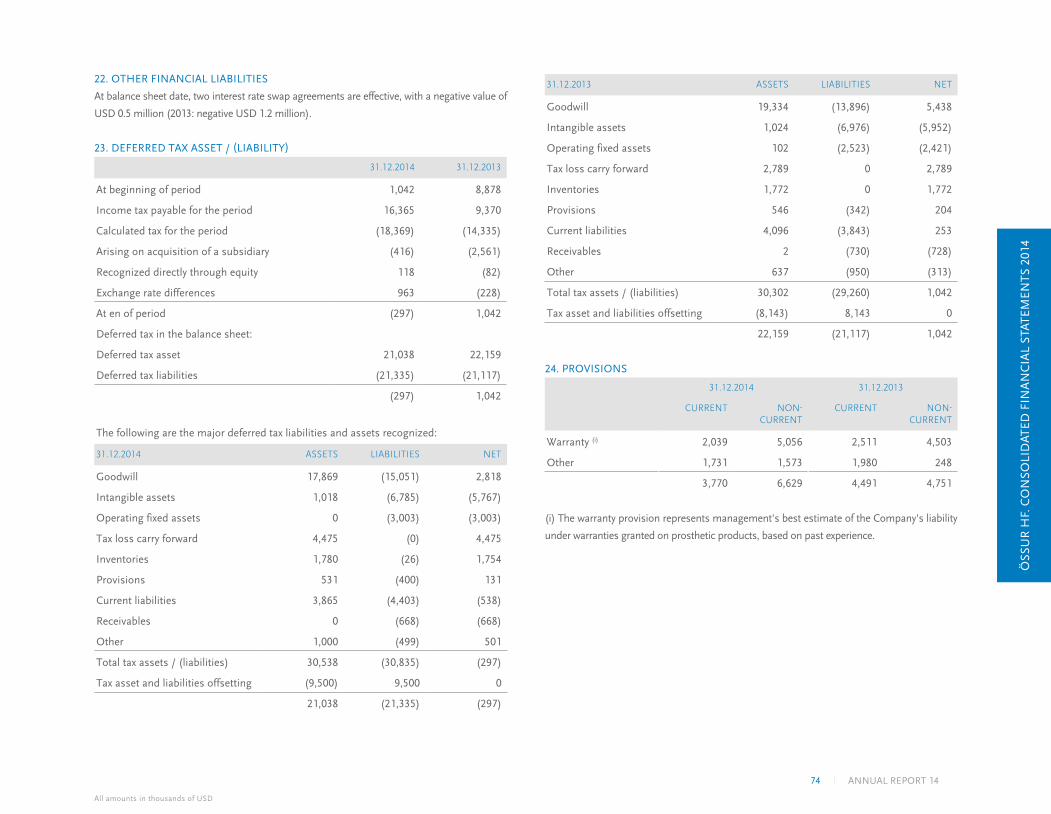
22. OTHER FINANCIAL LIABILITIES
At balance sheet date, two interest rate swap agreements are effective, with a negative value of
USD 0.5 million (2013: negative USD 1.2 million).
23. DEFERRED TAX ASSET / (LIABILITY)
31.12.2014 31.12.2013
At beginning of period 1,042 8,878
Income tax payable for the period 16,365 9,370
Calculated tax for the period (18,369) (14,335)
Arising on acquisition of a subsidiary (416) (2,561)
Recognized directly through equity 118 (82)
Exchange rate differences 963 (228)
At en of period (297) 1,042
Deferred tax in the balance sheet:
Deferred tax asset 21,038 22,159
Deferred tax liabilities (21,335) (21,117)
(297) 1,042
The following are the major deferred tax liabilities and assets recognized:
31.12.2014 ASSETS LIABILITIES NET
Goodwill 17,869 (15,051) 2,818
Intangible assets 1,018 (6,785) (5,767)
Operating fixed assets 0 (3,003) (3,003)
Tax loss carry forward 4,475 (0) 4,475
Inventories 1,780 (26) 1,754
Provisions 531 (400) 131
Current liabilities 3,865 (4,403) (538)
Receivables 0 (668) (668)
Other 1,000 (499) 501
Total tax assets / (liabilities) 30,538 (30,835) (297)
Tax asset and liabilities offsetting (9,500) 9,500 0
21,038 (21,335) (297)
31.12.2013 ASSETS LIABILITIES NET
Goodwill 19,334 (13,896) 5,438
Intangible assets 1,024 (6,976) (5,952)
Operating fixed assets 102 (2,523) (2,421)
Tax loss carry forward 2,789 0 2,789
Inventories 1,772 0 1,772
Provisions 546 (342) 204
Current liabilities 4,096 (3,843) 253
Receivables 2 (730) (728)
Other 637 (950) (313)
Total tax assets / (liabilities) 30,302 (29,260) 1,042
Tax asset and liabilities offsetting (8,143) 8,143 0
22,159 (21,117) 1,042
24. PROVISIONS
31.12.2014 31.12.2013
CURRENT NON-CURRENT
CURRENT NON-CURRENT
Warranty (i) 2,039 5,056 2,511 4,503
Other 1,731 1,573 1,980 248
3,770 6,629 4,491 4,751
(i) The warranty provision represents management's best estimate of the Company's liability
under warranties granted on prosthetic products, based on past experience.
ÖSS
UR
HF.
CO
NSO
LID
ATED
FIN
AN
CIA
L ST
ATEM
ENTS
201
4
All amounts in thousands of USD
74 ANNUAL REPORT 14
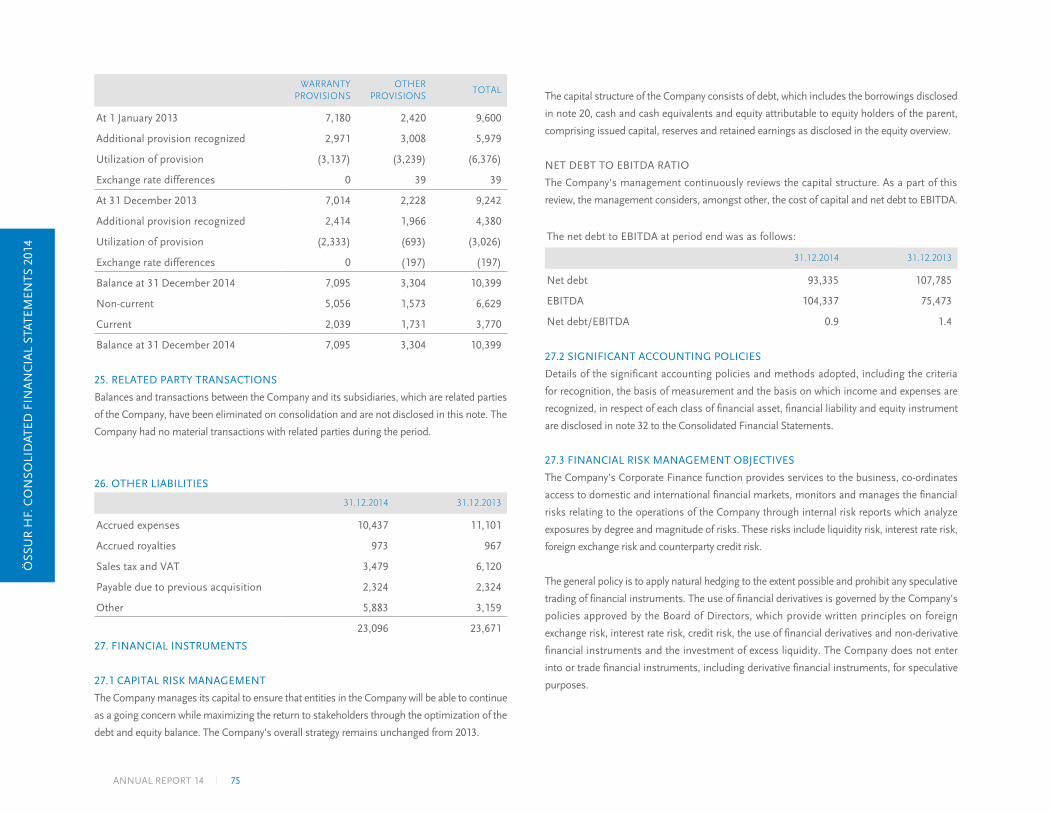
WARRANTY PROVISIONS
OTHERPROVISIONS
TOTAL
At 1 January 2013 7,180 2,420 9,600
Additional provision recognized 2,971 3,008 5,979
Utilization of provision (3,137) (3,239) (6,376)
Exchange rate differences 0 39 39
At 31 December 2013 7,014 2,228 9,242
Additional provision recognized 2,414 1,966 4,380
Utilization of provision (2,333) (693) (3,026)
Exchange rate differences 0 (197) (197)
Balance at 31 December 2014 7,095 3,304 10,399
Non-current 5,056 1,573 6,629
Current 2,039 1,731 3,770
Balance at 31 December 2014 7,095 3,304 10,399
25. RELATED PARTY TRANSACTIONS
Balances and transactions between the Company and its subsidiaries, which are related parties
of the Company, have been eliminated on consolidation and are not disclosed in this note. The
Company had no material transactions with related parties during the period.
26. OTHER LIABILITIES
31.12.2014 31.12.2013
Accrued expenses 10,437 11,101
Accrued royalties 973 967
Sales tax and VAT 3,479 6,120
Payable due to previous acquisition 2,324 2,324
Other 5,883 3,159
23,096 23,671
27. FINANCIAL INSTRUMENTS
27.1 CAPITAL RISK MANAGEMENT
The Company manages its capital to ensure that entities in the Company will be able to continue
as a going concern while maximizing the return to stakeholders through the optimization of the
debt and equity balance. The Company's overall strategy remains unchanged from 2013.
The capital structure of the Company consists of debt, which includes the borrowings disclosed
in note 20, cash and cash equivalents and equity attributable to equity holders of the parent,
comprising issued capital, reserves and retained earnings as disclosed in the equity overview.
NET DEBT TO EBITDA RATIO
The Company's management continuously reviews the capital structure. As a part of this
review, the management considers, amongst other, the cost of capital and net debt to EBITDA.
The net debt to EBITDA at period end was as follows:
31.12.2014 31.12.2013
Net debt 93,335 107,785
EBITDA 104,337 75,473
Net debt/EBITDA 0.9 1.4
27.2 SIGNIFICANT ACCOUNTING POLICIES
Details of the significant accounting policies and methods adopted, including the criteria
for recognition, the basis of measurement and the basis on which income and expenses are
recognized, in respect of each class of financial asset, financial liability and equity instrument
are disclosed in note 32 to the Consolidated Financial Statements.
27.3 FINANCIAL RISK MANAGEMENT OBJECTIVES
The Company's Corporate Finance function provides services to the business, co-ordinates
access to domestic and international financial markets, monitors and manages the financial
risks relating to the operations of the Company through internal risk reports which analyze
exposures by degree and magnitude of risks. These risks include liquidity risk, interest rate risk,
foreign exchange risk and counterparty credit risk.
The general policy is to apply natural hedging to the extent possible and prohibit any speculative
trading of financial instruments. The use of financial derivatives is governed by the Company's
policies approved by the Board of Directors, which provide written principles on foreign
exchange risk, interest rate risk, credit risk, the use of financial derivatives and non-derivative
financial instruments and the investment of excess liquidity. The Company does not enter
into or trade financial instruments, including derivative financial instruments, for speculative
purposes.
ÖSS
UR
HF.
CO
NSO
LID
ATED
FIN
AN
CIA
L ST
ATEM
ENTS
201
4
75ANNUAL REPORT 14
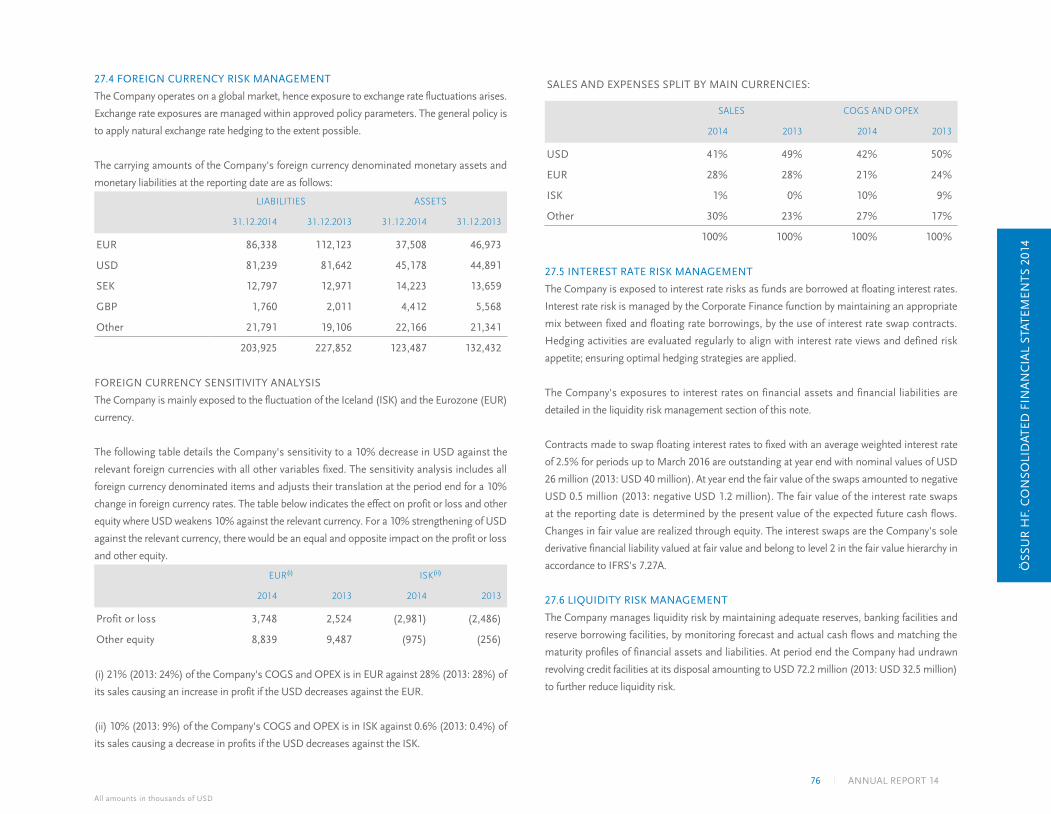
27.4 FOREIGN CURRENCY RISK MANAGEMENT
The Company operates on a global market, hence exposure to exchange rate fluctuations arises.
Exchange rate exposures are managed within approved policy parameters. The general policy is
to apply natural exchange rate hedging to the extent possible.
The carrying amounts of the Company's foreign currency denominated monetary assets and
monetary liabilities at the reporting date are as follows:
LIABILITIES ASSETS
31.12.2014 31.12.2013 31.12.2014 31.12.2013
EUR 86,338 112,123 37,508 46,973
USD 81,239 81,642 45,178 44,891
SEK 12,797 12,971 14,223 13,659
GBP 1,760 2,011 4,412 5,568
Other 21,791 19,106 22,166 21,341
203,925 227,852 123,487 132,432
FOREIGN CURRENCY SENSITIVITY ANALYSIS
The Company is mainly exposed to the fluctuation of the Iceland (ISK) and the Eurozone (EUR)
currency.
The following table details the Company's sensitivity to a 10% decrease in USD against the
relevant foreign currencies with all other variables fixed. The sensitivity analysis includes all
foreign currency denominated items and adjusts their translation at the period end for a 10%
change in foreign currency rates. The table below indicates the effect on profit or loss and other
equity where USD weakens 10% against the relevant currency. For a 10% strengthening of USD
against the relevant currency, there would be an equal and opposite impact on the profit or loss
and other equity.
EUR(i) ISK(ii)
2014 2013 2014 2013
Profit or loss 3,748 2,524 (2,981) (2,486)
Other equity 8,839 9,487 (975) (256)
(i) 21% (2013: 24%) of the Company's COGS and OPEX is in EUR against 28% (2013: 28%) of
its sales causing an increase in profit if the USD decreases against the EUR.
(ii) 10% (2013: 9%) of the Company's COGS and OPEX is in ISK against 0.6% (2013: 0.4%) of
its sales causing a decrease in profits if the USD decreases against the ISK.
SALES AND EXPENSES SPLIT BY MAIN CURRENCIES:
SALES COGS AND OPEX
2014 2013 2014 2013
USD 41% 49% 42% 50%
EUR 28% 28% 21% 24%
ISK 1% 0% 10% 9%
Other 30% 23% 27% 17%
100% 100% 100% 100%
27.5 INTEREST RATE RISK MANAGEMENT
The Company is exposed to interest rate risks as funds are borrowed at floating interest rates.
Interest rate risk is managed by the Corporate Finance function by maintaining an appropriate
mix between fixed and floating rate borrowings, by the use of interest rate swap contracts.
Hedging activities are evaluated regularly to align with interest rate views and defined risk
appetite; ensuring optimal hedging strategies are applied.
The Company's exposures to interest rates on financial assets and financial liabilities are
detailed in the liquidity risk management section of this note.
Contracts made to swap floating interest rates to fixed with an average weighted interest rate
of 2.5% for periods up to March 2016 are outstanding at year end with nominal values of USD
26 million (2013: USD 40 million). At year end the fair value of the swaps amounted to negative
USD 0.5 million (2013: negative USD 1.2 million). The fair value of the interest rate swaps
at the reporting date is determined by the present value of the expected future cash flows.
Changes in fair value are realized through equity. The interest swaps are the Company's sole
derivative financial liability valued at fair value and belong to level 2 in the fair value hierarchy in
accordance to IFRS's 7.27A.
27.6 LIQUIDITY RISK MANAGEMENT
The Company manages liquidity risk by maintaining adequate reserves, banking facilities and
reserve borrowing facilities, by monitoring forecast and actual cash flows and matching the
maturity profiles of financial assets and liabilities. At period end the Company had undrawn
revolving credit facilities at its disposal amounting to USD 72.2 million (2013: USD 32.5 million)
to further reduce liquidity risk.
ÖSS
UR
HF.
CO
NSO
LID
ATED
FIN
AN
CIA
L ST
ATEM
ENTS
201
4
All amounts in thousands of USD
76 ANNUAL REPORT 14
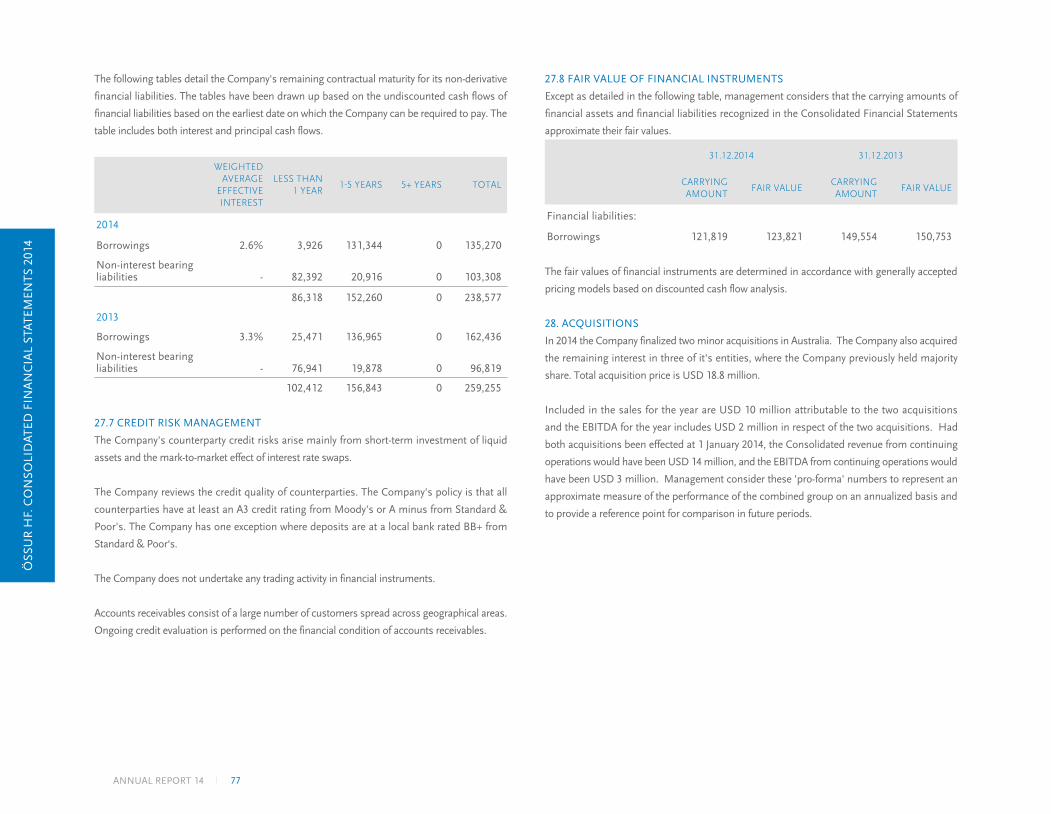
The following tables detail the Company's remaining contractual maturity for its non-derivative
financial liabilities. The tables have been drawn up based on the undiscounted cash flows of
financial liabilities based on the earliest date on which the Company can be required to pay. The
table includes both interest and principal cash flows.
WEIGHTED AVERAGE
EFFECTIVE INTEREST
LESS THAN 1 YEAR
1-5 YEARS 5+ YEARS TOTAL
2014
Borrowings 2.6% 3,926 131,344 0 135,270
Non-interest bearing liabilities - 82,392 20,916 0 103,308
86,318 152,260 0 238,577
2013
Borrowings 3.3% 25,471 136,965 0 162,436
Non-interest bearing liabilities - 76,941 19,878 0 96,819
102,412 156,843 0 259,255
27.7 CREDIT RISK MANAGEMENT
The Company's counterparty credit risks arise mainly from short-term investment of liquid
assets and the mark-to-market effect of interest rate swaps.
The Company reviews the credit quality of counterparties. The Company's policy is that all
counterparties have at least an A3 credit rating from Moody's or A minus from Standard &
Poor's. The Company has one exception where deposits are at a local bank rated BB+ from
Standard & Poor‘s.
The Company does not undertake any trading activity in financial instruments.
Accounts receivables consist of a large number of customers spread across geographical areas.
Ongoing credit evaluation is performed on the financial condition of accounts receivables.
27.8 FAIR VALUE OF FINANCIAL INSTRUMENTS
Except as detailed in the following table, management considers that the carrying amounts of
financial assets and financial liabilities recognized in the Consolidated Financial Statements
approximate their fair values.
31.12.2014 31.12.2013
CARRYING AMOUNT
FAIR VALUECARRYING AMOUNT
FAIR VALUE
Financial liabilities:
Borrowings 121,819 123,821 149,554 150,753
The fair values of financial instruments are determined in accordance with generally accepted
pricing models based on discounted cash flow analysis.
28. ACQUISITIONS
In 2014 the Company finalized two minor acquisitions in Australia. The Company also acquired
the remaining interest in three of it's entities, where the Company previously held majority
share. Total acquisition price is USD 18.8 million.
Included in the sales for the year are USD 10 million attributable to the two acquisitions
and the EBITDA for the year includes USD 2 million in respect of the two acquisitions. Had
both acquisitions been effected at 1 January 2014, the Consolidated revenue from continuing
operations would have been USD 14 million, and the EBITDA from continuing operations would
have been USD 3 million. Management consider these 'pro-forma' numbers to represent an
approximate measure of the performance of the combined group on an annualized basis and
to provide a reference point for comparison in future periods.
ÖSS
UR
HF.
CO
NSO
LID
ATED
FIN
AN
CIA
L ST
ATEM
ENTS
201
4
77ANNUAL REPORT 14
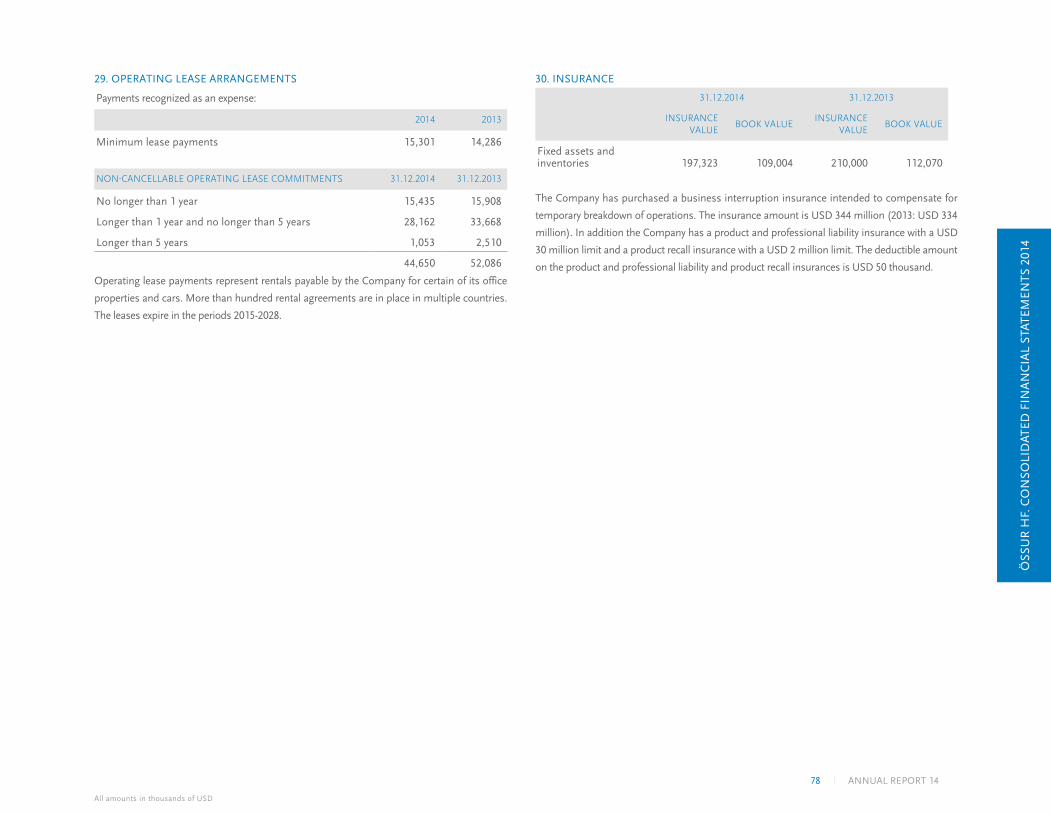
29. OPERATING LEASE ARRANGEMENTS
Payments recognized as an expense:
2014 2013
Minimum lease payments 15,301 14,286
NON-CANCELLABLE OPERATING LEASE COMMITMENTS 31.12.2014 31.12.2013
No longer than 1 year 15,435 15,908
Longer than 1 year and no longer than 5 years 28,162 33,668
Longer than 5 years 1,053 2,510
44,650 52,086
Operating lease payments represent rentals payable by the Company for certain of its office
properties and cars. More than hundred rental agreements are in place in multiple countries.
The leases expire in the periods 2015-2028.
30. INSURANCE
31.12.2014 31.12.2013
INSURANCE VALUE
BOOK VALUEINSURANCE
VALUEBOOK VALUE
Fixed assets and inventories 197,323 109,004 210,000 112,070
The Company has purchased a business interruption insurance intended to compensate for
temporary breakdown of operations. The insurance amount is USD 344 million (2013: USD 334
million). In addition the Company has a product and professional liability insurance with a USD
30 million limit and a product recall insurance with a USD 2 million limit. The deductible amount
on the product and professional liability and product recall insurances is USD 50 thousand.
ÖSS
UR
HF.
CO
NSO
LID
ATED
FIN
AN
CIA
L ST
ATEM
ENTS
201
4
All amounts in thousands of USD
78 ANNUAL REPORT 14
31. ADOPTION OF NEW AND REVISED STANDARDS
31.1 STANDARDS AND INTERPRETATIONS
EFFECTIVE IN THE CURRENT AND PRIOR PERIODS
The Consolidated Financial Statements are presented in
accordance with the new and revised standards (IFRS /
IAS) and new interpretations (IFRIC), applicable in the year
2014. Management believes that those new and revised IFRS
standards do not have material effect on amounts reported
in the Consolidated Financial Statements.
31.2 STANDARDS NOT YET EFFECTIVE
The Company has not early adopted new and revised IFRS's
that have been issued but are not yet effective. Management
believes that implementation of those standards and
interpretations do not have a material effect on the
Consolidated Financial Statements of the Company.
32. SUMMARY OF SIGNIFICANT ACCOUNTING
POLICIES
32.1 STATEMENT OF COMPLIANCE
The Consolidated Financial Statements have been prepared
in accordance with International Financial Reporting
Standards as adopted by the European Union.
32.2 BASIS OF PREPARATION
The Consolidated Financial Statements have been prepared
under the historical cost basis except for certain financial
instruments that are measured at fair values. Historical
cost is generally based on the fair value of the consideration
given in exchange for assets. Fair value is the price that
would be received to sell an asset or paid to transfer a liability
in an orderly transaction between market participants at
the measurement date, regardless of whether that price is
directly observable or estimated using another valuation
technique. In estimating the fair value of an asset or a
liability, the Group takes into account the characteristics of
the asset or liability if market participants would take those
characteristics into account when pricing the asset or liability
at the measurement date. Fair value for measurement
and/or disclosure purposes in these consolidated financial
statements is determined on such a basis, except for share-
based payment transactions that are within the scope of
IFRS 2, leasing transactions that are within the scope of IAS
17, and measurements that have some similarities to fair
value but are not fair value, such as net realizable value in
IAS 2 or value in use in IAS 36.
32.3 BASIS OF CONSOLIDATION
The Consolidated Financial Statements incorporate the
financial statements of the Company and entities controlled
by the Company and its subsidiaries. Control is achieved
when the Company:
• has power over the investee;
• is exposed, or has rights, to variable returns from its
involvement with the investee; and
• has the ability to use its power to affect its returns.
The Company reassesses whether or not it controls an
investee if facts and circumstances indicate that there are
changes to one or more of the three elements of control
listed above.
When the Company has less than a majority of the voting
rights of an investee, it has power over the investee when
the voting rights are sufficient to give it the practical ability to
direct the relevant activities of the investee unilaterally. The
Company considers all relevant facts and circumstances in
assessing whether or not the Company's voting rights in an
investee are sufficient to give it power, including:
• the size of the Company's holding of voting rights relative
to the size and dispersion of holdings of the other vote
holders;
• potential voting rights held by the Company, other vote
holders or other parties;
• rights arising from other contractual arrangements; and
• any additional facts and circumstances that indicate that
the Company has, or does not have, the current ability to
direct the relevant activities at the time that decisions need to
be made, including voting patterns at previous shareholders'
meetings.
Consolidation of a subsidiary begins when the Company
obtains control over the subsidiary and ceases when the
Company loses control of the subsidiary. Specifically, income
and expenses of a subsidiary acquired or disposed of during
the year are included in the consolidated statement of profit
or loss and other comprehensive income from the date the
Company gains control until the date when the Company
ceases to control the subsidiary.
Profit or loss and each component of other comprehensive
income are attributed to the owners of the Company and to
the non-controlling interests. Total comprehensive income
of subsidiaries is attributed to the owners of the Company
and to the non-controlling interests even if this results in the
non-controlling interests having a deficit balance.
When necessary, adjustments are made to the financial
statements of subsidiaries to bring their accounting policies
into line with the Company's accounting policies.
All intragroup assets and liabilities, equity, income, expenses
and cash flows relating to transactions between members of
the Group are eliminated in full on consolidation.
ÖSS
UR
HF.
CO
NSO
LID
ATED
FIN
AN
CIA
L ST
ATEM
ENTS
201
4
79ANNUAL REPORT 14
CHANGES IN THE COMPANY'S OWNERSHIP INTERESTS
IN EXISTING SUBSIDIARIES
Changes in the Company's ownership interests in subsidiaries
that do not result in the Group losing control over the
subsidiaries are accounted for as equity transactions. The
carrying amounts of the Group's interests and the non-
controlling interests are adjusted to reflect the changes in their
relative interests in the subsidiaries. Any difference between
the amount by which the non-controlling interests are adjusted
and the fair value of the consideration paid or received is
recognized directly in equity and attributed to owners of the
Company.
32.4 BUSINESS COMBINATION
Acquisitions of businesses are accounted for using the
acquisition method. The consideration transferred in a
business combination is measured at fair value, which is
calculated as the sum of the acquisition-date fair values of the
assets transferred by the Company, liabilities incurred by the
Company to the former owners of the acquiree and the equity
interests issued by the Company in exchange for control of the
acquiree. Acquisition-related costs are generally recognized in
profit or loss as incurred.
The acquiree's identifiable assets, liabilities and contingent
liabilities that meet the conditions for recognition under IFRS 3
are recognized at their fair value at the acquisition date, except
that:
• deferred tax assets or liabilities and liabilities or assets
related to employee benefit arrangements are recognized and
measured in accordance with IAS 12 Income Taxes and IAS 19
Employee Benefits respectively;
• liabilities or equity instruments related to share-based
payment arrangements of the acquiree or share-based
payment arrangements of the Company entered into to
replace share-based payment arrangements of the acquiree
are measured in accordance with IFRS 2 Share-based Payment
at the acquisition date;
• assets (or disposal groups) that are classified as held for sale
in accordance with IFRS 5 Non-current Assets Held for Sale
and Discontinued Operations are measured in accordance
with that standard."Goodwill arising on acquisition is
recognized as an asset and initially measured at cost, being
the excess of the purchase price of the business combination
over the Company's interest in the net fair value of the
identifiable assets, liabilities, contingent liabilities, the amount
of any non-controlling interests in the acquiree, and the fair
value of the acquirer´s previously held equity interest in the
acquiree. If, after reassessment, the Company's interest in the
net fair value of the acquiree's identifiable assets, liabilities
and contingent liabilities exceeds the cost of the business
combination, the excess is recognized immediately in profit
or loss. Non-controlling interests that are present ownership
interests and entitle their holders to a proportionate share
of the entity's net assets in the event of liquidation may be
initially measured either at fair value or at the non-controlling
interests' proportionate share of the recognized amounts
of the acquiree's identifiable net assets. The choice of
measurement basis is made on a transaction-by-transaction
basis. Other types of non-controlling interests are measured at
fair value or, when applicable, on the basis specified in another
IFRS.
When the consideration transferred by the Company in a
business combination includes assets or liabilities resulting
from a contingent consideration arrangement, the contingent
consideration is measured at its acquisition-date fair value
and included as part of the consideration transferred in
a business combination. Changes in the fair value of the
contingent consideration that qualify as measurement
period adjustments are adjusted retrospectively, with
corresponding adjustments against goodwill. Measurement
period adjustments are adjustments that arise from additional
information obtained during the ‘measurement period’ about
facts and circumstances that existed at the acquisition date.
The subsequent accounting for changes in the fair value of the
contingent consideration that do not qualify as measurement
period adjustments depends on how the contingent
consideration is classified. Contingent consideration that is
classified as equity is not remeasured at subsequent reporting
dates and its subsequent settlement is accounted for within
equity. Contingent consideration that is classified as an asset
or a liability is remeasured at subsequent reporting dates in
accordance with IAS 39, or IAS 37 Provisions, Contingent
Liabilities and Contingent Assets, as appropriate, with the
corresponding gain or loss being recognized in profit or loss.
If the initial accounting for a business combination is
incomplete by the end of the reporting period in which
the combination occurs, the Company reports provisional
amounts for the items for which the accounting is incomplete.
Those provisional amounts are adjusted during the
measurement period (see below), or additional assets or
liabilities are recognized, to reflect new information obtained
about facts and circumstances that existed at the acquisition
date that, if known, would have affected the amounts
recognized at that date.
When a business combination is achieved in stages, the
Company's previously held equity interest in the acquire is
remeasured to fair value at the acquisition date (i.e. the date
when the Company obtains control) and the resulting gain or
loss, if any, is recognized in profit or loss. Amounts arising
from interests in the acquire prior to the acquisition date that
have previously been recognized in other comprehensive
income are reclassified to profit or loss where such treatment
would be appropriate if that interest were disposed of.
The measurement period is the period from the date of
acquisition to the date the Company obtains complete
ÖSS
UR
HF.
CO
NSO
LID
ATED
FIN
AN
CIA
L ST
ATEM
ENTS
201
4
All amounts in thousands of USD
80 ANNUAL REPORT 14
information about facts and circumstances that existed as
of the acquisition date – and is subject to a maximum of one
year.
32.5 INVESTMENTS IN ASSOCIATES
An associate is an entity over which the Company has
significant influence. Significant influence is the power to
participate in the financial and operating policy decisions
of the investee but is not control or joint control over those
policies.
The results, assets and liabilities of associates are incorporated
in the Consolidated Financial Statements using the equity
method of accounting. Under the equity method, investments
in associates are initially recognized in the balance sheet
and adjusted for post-acquisition changes in the Company's
share of the net assets of the associate, less any impairment
in the value of individual investments. Losses of an associate
in excess of the Company's interest in that associate are
recognized only to the extent that the Company has incurred
legal or constructive obligations or made payments on behalf
of the associate.
Any excess of the cost of acquisition over the Company's share
of the net fair value of the identifiable assets, liabilities and
contingent liabilities of the associate recognized at the date of
acquisition is recognized as goodwill. The goodwill is included
within the carrying amount of the investment and is assessed
for impairment as part of that investment. Any excess of the
Company's share of the net fair value of the identifiable assets,
liabilities and contingent liabilities over the cost of acquisition,
after reassessment, is recognized immediately in profit or loss.
The requirements of IAS 39 are applied to determine whether it
is necessary to recognize any impairment loss with respect to
the Company’s investment in an associate. When necessary,
the entire carrying amount of the investment (including
goodwill) is tested for impairment in accordance with IAS
36 Impairment of Assets as a single asset by comparing its
recoverable amount (higher of value in use and fair value less
costs of disposal) with its carrying amount, Any impairment
loss recognized forms part of the carrying amount of the
investment. Any reversal of that impairment loss is recognized
in accordance with IAS 36 to the extent that the recoverable
amount of the investment subsequently increases.
The Company discontinues the use of the equity method from
the date when the investment ceases to be an associate, or
when the investment is classified as held for sale. When the
Company retains an interest in the former associate and the
retained interest is a financial asset, the Group measures the
retained interest at fair value at that date and the fair value is
regarded as its fair value on initial recognition in accordance
with IAS 39. The difference between the carrying amount of the
associate or joint venture at the date the equity method was
discontinued, and the fair value of any retained interest and
any proceeds from disposing of a part interest in the associate
or joint venture is included in the determination of the gain or
loss on disposal of the associate or joint venture. In addition,
the Company accounts for all amounts previously recognized
in other comprehensive income in relation to that associate
on the same basis as would be required if that associate had
directly disposed of the related assets or liabilities. Therefore,
if a gain or loss previously recognized in other comprehensive
income by that associate would be reclassified to profit or loss
on the disposal of the related assets or liabilities, the company
reclassifies the gain or loss from equity to profit or loss (as
a reclassification adjustment) when the equity method is
discontinued.
Where a group entity transacts with an associate of the
Company, profits and losses are eliminated to the extent of the
Company's interest in the relevant associate.
32.6 GOODWILL
Goodwill is initially recognized as an asset at cost and
is subsequently measured at cost less any accumulated
impairment losses.
Goodwill is not amortized but is reviewed for impairment at
least annually. For the purpose of impairment testing, goodwill
is allocated to each of the Company's cash-generating units
expected to benefit from the synergies of the combination.
Cash-generating units to which goodwill has been allocated
are tested for impairment annually, or more frequently when
there is an indication that the unit may be impaired. If the
recoverable amount of the cash-generating unit is less than
its carrying amount, the impairment loss is allocated first to
reduce the carrying amount of any goodwill allocated to the
unit and then to the other assets of the unit pro-rata on the
basis of the carrying amount of each asset in the unit. Any
impairment loss for goodwill is recognized directly in profit or
loss in the Consolidated Income Statement. An impairment
loss recognized for goodwill is not reversed in a subsequent
period.
On disposal of the relevant cash-generating unit, the
attributable amount of goodwill is included in the
determination of the profit or loss on disposal.
The Company's policy for goodwill arising on the acquisition
of an associate is described at 32.5 above.
32.7 REVENUE RECOGNITION
Revenue is measured at the fair value of the consideration
received or receivable. Revenue is reduced for estimated
customer returns, rebates and other similar allowances.
SALE OF GOODS
Revenue from the sale of goods is recognized when all
the following conditions are satisfied; the Company has
transferred to the buyer the significant risks and rewards
ÖSS
UR
HF.
CO
NSO
LID
ATED
FIN
AN
CIA
L ST
ATEM
ENTS
201
4
81ANNUAL REPORT 14
of ownership of the goods, the Company retains neither
continuing managerial involvement to the degree usually
associated with ownership nor effective control over the
goods sold, the amount of revenue can be measured reliably,
it is probable that the economic benefits associated with the
transaction will flow to the entity and the costs incurred or
to be incurred in respect of the transaction can be measured
reliably.
ROYALTIES
Royalty revenue is recognized on an accrual basis in
accordance with the substance of the relevant agreement.
Royalties determined on a time basis are recognized on a
straight-line basis over the period of the agreement. Royalty
arrangements that are based on production, sales and other
measures are recognized by reference to the underlying
arrangement (provided that it is probable that the economic
benefits will flow to the Company and the amount of revenue
can be measured reliably).
INTEREST REVENUE AND DIVIDEND
Interest income from a financial asset is recognized when it is
probable that the economic benefits will flow to the Company
and the amount of income can be measured reliably. Interest
income is accrued on a time basis, by reference to the principal
outstanding and at the effective interest rate applicable, which
is the rate that exactly discounts estimated future cash receipts
through the expected life of the financial asset to that asset's
net carrying amount on initial recognition. Dividend income
from investments is recognized when the shareholder's right
to receive payment has been established.
32.8 LEASING
Operating lease payments are recognized as an expense
on a straight-line basis over the lease term, except where
another systematic basis is more representative of the time
pattern in which economic benefits from the leased assets are
consumed. Contingent rentals arising under operating leases
are recognized as an expense in the period in which they are
incurred.
In the event that lease incentives are received to enter
into operating leases, such incentives are recognized as a
liability. The aggregate benefit of incentives is recognized as
a reduction of rental expense on a straight-line basis, except
where another systematic basis is more representative of
the time pattern in which economic benefits from the leased
assets are consumed.
32.9 FOREIGN CURRENCIES
For the purpose of presenting Consolidated Financial
Statements, the assets and liabilities of the Company's
foreign operations are expressed in USD using exchange rates
prevailing at the balance sheet date. Income and expense
items are translated at the average exchange rates for each
month, unless exchange rates fluctuated significantly during
that period, in which case the exchange rates at the dates of
the transactions are used. Exchange differences arising, if
any, are classified as equity and transferred to the Company's
translation reserve (attributed to non-controlling interests as
appropriate).
Goodwill and fair value adjustments arising on the acquisition
of a foreign operation are treated as assets and liabilities of the
foreign operation and translated at the closing rate. Exchange
differences arising, if any, are recognized in equity.
On the disposal of a foreign operation (i.e. a disposal of the
Company's entire interest in a foreign operation, or a disposal
involving loss of control over a subsidiary that includes a
foreign operation or a disposal involving loss of significant
influence over an associate that includes a foreign operation)
all of the exchange differences accumulated in equity in respect
of that operation attributable to the owners of the Company
are reclassified to profit or loss.
In addition, in relation to a partial disposal of a subsidiary
that does not result in the Company losing control over the
subsidiary, the proportionate share of accumulated exchange
differences are re-attributed to non-controlling interests
and are not recognized in profit or loss. For all other partial
disposals (i.e. partial disposals of associates that do not result
in the Company losing significant influence), the proportionate
share of the accumulated exchange differences is reclassified
to profit or loss.
Exchange differences are recognized in the Income Statement
in the period they occur, except for exchange differences
on monetary items receivable from or payable to a foreign
operation for which settlement is neither planned nor likely
to occur (therefore forming part of the net investment in
the foreign operation), which are recognized initially in other
comprehensive income and reclassified from equity to profit
or loss on repayment of the monetary items and exchange
difference on hedge on net investments in foreign operations.
Exchange differences on hedge on net investments in foreign
operations are recognized in the Income Statement in the
period which the foreign operations are disposed of.
32.10 BORROWING COSTS
All borrowing cost are recognized in profit or loss in the period
in which they incurred.
32.11 SHARE-BASED PAYMENTS
Equity-settled share-based payments to employees and others
providing similar services are measured at the fair value of
the equity instruments at the grant date. Details regarding the
determination of the fair value of equity-settled share-based
transactions are set out in note 19.
The fair value determined at the grant date of the equity-settled
share-based payments is expensed on a straight-line basis over
the vesting period, based on the Company's estimate of equity
instruments that will eventually vest, with a corresponding
ÖSS
UR
HF.
CO
NSO
LID
ATED
FIN
AN
CIA
L ST
ATEM
ENTS
201
4
All amounts in thousands of USD
82 ANNUAL REPORT 14
increase in equity. At the end of each reporting period,
the Company revises its estimate of the number of equity
instruments expected to vest. The impact of the revision of the
original estimates, if any, is recognized in profit or loss such
that the cumulative expense reflects the revised estimate, with
a corresponding adjustment to the equity-settled employee
benefits reserve.
32.12 TAXATION
Income tax expense represents the sum of the tax currently
payable and deferred tax.
CURRENT TAX
The tax currently payable is based on taxable profit for the
period. Taxable profit differs from net profit as reported in the
Consolidated Income Statement because it excludes items
of income or expense that are taxable or deductible in other
periods and it further excludes items that are never taxable or
deductible. The Company’s current tax is calculated using tax
rates that have been enacted or substantively enacted by the
end of the reporting period.
DEFERRED TAX
Deferred tax is recognized on temporary differences
between the carrying amounts of assets and liabilities in the
Consolidated Financial Statements and the corresponding
tax bases used in the computation of taxable profit. Deferred
tax liabilities are generally recognized for all taxable temporary
differences. Deferred tax assets are generally recognized for
all deductible temporary differences to the extent that it is
probable that taxable profits will be available against which
those deductible temporary differences can be utilized. Such
deferred tax assets and liabilities are not recognized if the
temporary difference arises from goodwill or from the initial
recognition (other than in a business combination) of other
assets and liabilities in a transaction that affects neither the
taxable profit nor the accounting profit.
Deferred tax liabilities are recognized for taxable temporary
differences associated with investments in subsidiaries and
associates, except where the Company is able to control the
reversal of the temporary difference and it is probable that
the temporary difference will not reverse in the foreseeable
future. Deferred tax assets arising from deductible temporary
differences associated with such investments and interests are
only recognized to the extent that it is probable that there will
be sufficient taxable profits against which to utilize the benefits
of the temporary differences and they are expected to reverse
in the foreseeable future.
The carrying amount of deferred tax assets is reviewed at
each balance sheet date and reduced to the extent that it is no
longer probable that sufficient taxable profits will be available
to allow all or part of the asset to be recovered.
Deferred tax assets and liabilities are measured at the tax rates
that are expected to apply in the period in which the liability is
settled or the asset realized, based on tax rates (and tax laws)
that have been enacted or substantively enacted at the balance
sheet date. The measurement of deferred tax liabilities and
assets reflects the tax consequences that would follow from
the manner in which the Company expects, at the reporting
date, to recover or settle the carrying amount of its assets and
liabilities.
Deferred tax assets and liabilities are offset when there is a
legally enforceable right to set off current tax assets against
current tax liabilities and when they relate to income taxes
levied by the same taxation authority and the Company intends
to settle its current tax assets and liabilities on a net basis.
In the preparation of the Consolidated Financial Statements,
accumulated gains in inventories from intercompany
transactions are eliminated. This has an effect on the
income tax expenses of the consolidated companies, and
an adjustment is included in the deferred tax asset. Income
tax expense is calculated in accordance with tax rates in the
countries where the inventories are purchased.
CURRENT AND DEFERRED TAX FOR THE YEAR
Current and deferred tax are recognized in profit or loss,
except when they relate to items that are recognized in other
comprehensive income or directly in equity, in which case,
the current and deferred tax are also recognized in other
comprehensive income or directly in equity respectively. Where
current tax or deferred tax arises from the initial accounting
for a business combination, the tax effect is included in the
accounting for the business combination.
32.13 PROPERTY, PLANT AND EQUIPMENT
Property, plant and equipment are recognized as an asset
when it is probable that future economic benefits associated
with the asset will flow to the Company and the cost of the
asset can be measured in a reliable manner.
Property, plant and equipment which qualify for recognition as
an asset are initially measured at cost.
The cost of a property, plant and equipment comprises its
purchase price and any directly attributable cost of bringing
the asset to working condition for its intended use.
The depreciable amount of the asset is allocated on a straight-
line basis over its useful life. The depreciation charge for each
period is recognized as an expense. The estimated useful lives,
residual values and depreciation method are reviewed at each
balance sheet date, with the effect of any changes in estimate
accounted for on a prospective basis.
In the disposal or retirement of an asset is determined as
the difference between the sales proceeds and the carrying
amount of the asset and is recognized in the Consolidated
Income Statement.
ÖSS
UR
HF.
CO
NSO
LID
ATED
FIN
AN
CIA
L ST
ATEM
ENTS
201
4
83ANNUAL REPORT 14
The following useful lives are used in the calculation of
depreciation:
Buildings 20 - 50 years
Fixtures and furniture 2 -10 years
Machinery and equipment 2 - 10 years
32.14 INTANGIBLE ASSETS
INTANGIBLE ASSETS ACQUIRED SEPARATELY
Intangible assets with finite useful life are reported at cost
less accumulated amortization and accumulated impairment
losses. Amortization is allocated on a straight-line basis over
their estimated useful lives. The estimated useful life and
amortization method are reviewed at the end of each balance
sheet date, with the effect of any changes in estimate being
accounted for on a prospective basis. Intangible assets with
indefinite useful lives are carried at cost less accumulated
impairment losses.
Part of the intangible assets included above have finite useful
lives, over which the assets are amortized. These intangible
assets will be amortized on a straight line basis over their
useful lives.
The following useful lives are used in the calculation of
amortization:
Customer and distribution relationships 4 - 10 years
Patents 5 - 50 years
Trademarks 3 - infinitive
Software and other 2 - 10 years
INTERNALLY-GENERATED INTANGIBLE ASSETS -
RESEARCH AND DEVELOPMENT EXPENDITURE
Expenditure on research activities is recognized as an expense
in the period in which it is incurred.
An internally-generated intangible asset arising from the
Company's development is recognized only if all of the
following conditions are met: the technical feasibility of
completing the intangible asset so that it will be available for
use or sale; the intention to complete the intangible asset
and use or sell it; the ability to use or sell the intangible asset;
the intangible asset will generate probable future economic
benefits; the availability of adequate technical, financial and
other resources to complete the development and to use or
sell the intangible asset and the ability to measure reliably
the expenditure attributable to the intangible asset during its
development.
The amount initially recognized for internally-generated
intangible assets is the sum of the expenditure incurred from
the date when the intangible asset first meets the recognition
criteria listed above. Where no internally-generated intangible
asset can be recognized, development expenditure is charged
to profit or loss in the period in which it is incurred.
Subsequent to initial recognition, internally-generated
intangible assets are reported at cost less accumulated
amortization and accumulated impairment losses, on the
same basis as intangible assets acquired separately.
INTANGIBLE ASSETS ACQUIRED IN A BUSINESS
COMBINATION
Intangible assets acquired in a business combination are
identified and recognized separately from goodwill where they
satisfy the definition of an intangible asset and their fair values
can be measured reliably. The cost of such intangible assets is
their fair value at the acquisition date.
Subsequent to initial recognition, intangible assets acquired in
a business combination are reported at cost less accumulated
amortization and accumulated impairment losses, on the
same basis as intangible assets acquired separately.
DERECOGNITION OF INTANGIBLE ASSETS
An intangible asset is derecognized on disposal, or when no
future economic benefits are expected from use or disposal.
Gains or losses arising from derecognition of an intangible
asset, measured as the difference between the net disposal
proceeds and the carrying amount of the asset, are recognized
in profit or loss when the asset is derecognized.
32.15 IMPAIRMENT OF TANGIBLE AND INTANGIBLE
ASSETS EXCLUDING GOODWILL
At each balance sheet date, the Company reviews the carrying
amounts of its tangible and intangible assets to determine
whether there is any indication that those assets have
suffered an impairment loss. If any such indication exists,
the recoverable amount of the asset is estimated in order to
determine the extent of the impairment loss (if any). Where
it is not possible to estimate the recoverable amount of an
individual asset, the Company estimates the recoverable
amount of the cash-generating unit to which the asset belongs.
Where a reasonable and consistent basis of allocation can be
identified, corporate assets are also allocated to individual
cash-generating units, or otherwise they are allocated to the
smallest group of cash-generating units for which a reasonable
and consistent allocation basis can be identified.
Intangible assets with indefinite useful lives and intangible
assets not yet available for use are tested for impairment
annually, and whenever there is an indication that the asset
may be impaired.
Recoverable amount is the higher of fair value less costs to
sell and value in use. In assessing value in use, the estimated
future cash flows are discounted to their present value using a
pre-tax discount rate that reflects current market assessments
of the time value of money and the risks specific to the asset
for which the estimates of future cash flows have not been
adjusted.
ÖSS
UR
HF.
CO
NSO
LID
ATED
FIN
AN
CIA
L ST
ATEM
ENTS
201
4
All amounts in thousands of USD
84 ANNUAL REPORT 14
If the recoverable amount of an asset (or cash-generating
unit) is estimated to be less than its carrying amount, the
carrying amount of the asset (cash-generating unit) is reduced
to its recoverable amount. An impairment loss is recognized
immediately in profit or loss.
32.16 INVENTORIES
Inventories are stated at the lower of cost and net realizable
value. Costs, including an appropriate portion of fixed and
variable overhead expenses, are assigned to inventories held
by the method most appropriate to the particular class of
inventory, with the majority being valued on a standard cost
basis. Net realizable value represents the estimated selling
price for inventories less all estimated costs of completion and
costs necessary to make the sale.
32.17 PROVISIONS
Provisions are recognized when the Company has a present
obligation as a result of a past event, it is probable that the
Company will be required to settle the obligation, and a
reliable estimate can be made of the amount of the obligation.
The amount recognized as a provision is the best estimate
of the consideration required to settle the present obligation
at the balance sheet date, taking into account the risks and
uncertainties surrounding the obligation. Where a provision is
measured using the cash flows estimated to settle the present
obligation, its carrying amount is the present value of those
cash flows.
When some or all of the economic benefits required to settle
a provision are expected to be recovered from a third party,
the receivable is recognized as an asset if it is virtually certain
that reimbursement will be received and the amount of the
receivable can be measured reliably.
WARRANTIES
Provisions for expected warranty costs are recognized at the
date of sale of the relevant products, at management´s best
estimate of the expenditure required to settle the Company's
obligation.
32.18 RISK MANAGEMENT
Financial risk management is governed by the Company's
Treasury Manual, approved by the Board of Directors. The
policy sets limits to the extent of financial risks and guidelines
for financial transactions in general. The general policy is to
apply natural currency hedging to the extent possible and
prohibit any speculative trading of financial instruments.
Long term financing is managed from the Company's
Corporate Finance function and individual subsidiaries do not
engage in substantial external financing contracts with banks
and/or credit institutions.
The Company is exposed to normal business risk in collecting
accounts receivable. Adequate allowance is made for bad debt
expenses.
32.19 FINANCIAL ASSETS
Financial assets are recognized when the Company becomes a
party to the contractual provisions of the instrument.
Financial assets are initially measured at fair value. Transaction
costs that are directly attributable to the acquisition or issue
of financial assets (other than financial assets at fair value
through profit or loss) are added to or deducted from the
fair value of the financial assets, as appropriate, on initial
recognition. Transaction costs directly attributable to the
acquisition of financial assets at fair value through profit or
loss are recognized immediately in profit or loss.
Financial assets are classified into the following specified
categories: financial assets as ‘at fair value through profit or
loss’ (FVTPL) and ‘loans and receivables’. The classification
depends on the nature and purpose of the financial assets and
is determined at the time of initial recognition.
EFFECTIVE INTEREST METHOD
The effective interest method is a method of calculating the
amortized cost of a debt instrument and of allocating interest
income over the relevant period. The effective interest rate is
the rate that exactly discounts estimated future cash receipts
(including all fees on points paid or received that form an
integral part of the effective interest rate, transaction costs and
other premiums or discounts) through the expected life of the
debt instrument or, where appropriate, a shorter period to the
net carrying amount on initial recognition.
Income is recognized on an effective interest basis for debt
instruments other than those financial assets classified as at
fair value through profit or loss.
FINANCIAL ASSETS AT FAIR VALUE THROUGH PROFIT
OR LOSS
Financial assets are classified as at fair value through profit or
loss where the financial asset is either held for trading or it is
designated as at fair value through profit or loss.
Financial assets at fair value through profit or loss are stated
at fair value, with any resultant gain or loss recognized in
profit or loss. The net gain or loss recognized in profit or loss
incorporates any dividend or interest earned on the financial
asset.
LOANS AND RECEIVABLES
Account receivables, loans and other receivables that have
fixed or determinable payments that are not quoted in an
active market are classified as loans and receivables. Loans
and receivables are measured at amortized cost using the
effective interest method, less any impairment. Interest
income is recognized by applying the effective interest rate,
ÖSS
UR
HF.
CO
NSO
LID
ATED
FIN
AN
CIA
L ST
ATEM
ENTS
201
4
85ANNUAL REPORT 14
except for short-term receivables when the recognition of
interest would be immaterial.
IMPAIRMENT OF FINANCIAL ASSETS
Financial assets, other than those at fair value through profit
or loss, are assessed for indicators of impairment at each
balance sheet date. Financial assets are impaired where there
is objective evidence that, as a result of one or more events
that occurred after the initial recognition of the financial asset,
the estimated future cash flows of the investment have been
impacted.
For certain categories of financial assets, such as account
receivables, assets that are assessed not to be impaired
individually are subsequently assessed for impairment on
a collective basis. Objective evidence of impairment for a
portfolio of receivables could include the Company's past
experience of collecting payments, an increase in the number
of delayed payments in the portfolio past the Company's
average credit period, as well as observable changes in
national or local economic conditions that correlate with
default on receivables.
For financial assets carried at amortized cost, the amount of
the impairment is the difference between the asset's carrying
amount and the present value of estimated future cash flows,
discounted at the financial asset's original effective interest
rate.
The carrying amount of the financial asset is reduced by
the impairment loss directly for all financial assets with the
exception of accounts receivables, where the carrying amount
is reduced through the use of an allowance account. When an
accounts receivable is considered uncollectible, it is written
off against the allowance account. Subsequent recoveries
of amounts previously written off are credited against the
allowance account. Changes in the carrying amount of the
allowance account are recognized in profit or loss.
DERECOGNITION OF FINANCIAL ASSETS
The Company derecognizes a financial asset only when the
contractual rights to the cash flows from the asset expire, or
when it transfers the financial asset and substantially all the
risks and rewards of ownership of the asset to another entity.
On derecognition of a financial asset, the difference between
the asset's carrying amount and the sum of the consideration
received and receivable and the cumulative gain or loss that
had been recognized in Other Comprehensive Income and
accumulated in equity is recognized in profit or loss. The
difference between the carrying amount of the financial liability
derecognized and the consideration paid and payable is
recognized in profit or loss.
32.20 FINANCIAL LIABILITIES
Financial liabilities are recognized when the Company
becomes a party to the contractual provisions of the
instrument. Financial liabilities are classified as either financial
liabilities at ‘fair value through profit and loss’ or ‘other
financial liabilities’.
Financial liabilities are initially measured at fair value.
Transaction costs that are directly attributable to the
acquisition or issue of financial liabilities (other than financial
liabilities at fair value through profit or loss) are added to
or deducted from the fair value of the financial liabilities, as
appropriate, on initial recognition. Transaction costs directly
attributable to the acquisition of financial liabilities at fair value
through profit or loss are recognized immediately in profit or
loss.
FINANCIAL LIABILITIES AT FAIR VALUE THROUGH PROFIT
OR LOSS
Financial liabilities are classified at fair value through profit or
loss when the financial liability is either held for trading or it is
designated as at fair value through profit or loss.
Financial liabilities at fair value through profit or loss are
stated at fair value, with any gains or losses arising on
remeasurement recognized in profit or loss. The net gain or
loss recognized in profit or loss incorporates any interest paid
on the financial liability and is included in the ‘other gains and
losses’ line item in the Income Statement.
OTHER FINANCIAL LIABILITIES
Other financial liabilities, including borrowings, are initially
measured at fair value, net of transaction costs.
Other financial liabilities are subsequently measured at
amortized cost using the effective interest method, with
interest expense recognized on an effective yield basis.
The effective interest method is a method of calculating the
amortized cost of a financial liability and of allocating interest
expense over the relevant period. The effective interest rate is
the rate that exactly discounts estimated future cash payments
through the expected life of the financial liability or, where
appropriate, a shorter period to the net carrying amount on
initial recognition.
DERECOGNITION OF FINANCIAL LIABILITIES
The Company derecognizes financial liabilities when, and only
when, the Company's obligations are discharged, cancelled or
they expire.
32.21 DEFINED EMPLOYEE BENEFITS
Retirement benefit costs and termination benefits
Payments to defined contribution retirement benefit plans
are recognized as an expense when employees have rendered
service entitling them to the contributions.
For defined benefit retirement benefit plans, the cost of
providing benefits is determined using the projected unit credit
method, with actuarial valuations being carried out at the end
ÖSS
UR
HF.
CO
NSO
LID
ATED
FIN
AN
CIA
L ST
ATEM
ENTS
201
4
All amounts in thousands of USD
86 ANNUAL REPORT 14
of each annual reporting period. Remeasurement, comprising
actuarial gains and losses, the effect of the changes to the
asset ceiling (if applicable) and the return on plan assets
(excluding interest), is reflected immediately in the statement
of financial position with a charge or credit recognized in other
comprehensive income in the period in which they occur.
Remeasurement recognized in other comprehensive income
is reflected immediately in retained earnings and will not be
reclassified to profit or loss. Past service cost is recognized in
profit or loss in the period of a plan amendment. Net interest
is calculated by applying the discount rate at the beginning of
the period to the net defined benefit liability or asset. Defined
benefit costs are categorized as follows:
• service cost (including current service cost, past service cost,
as well as gains and losses on curtailments and settlements);
• net interest expense or income; and
• remeasurement.
The retirement benefit obligation recognized in the balance
sheet represents the actual deficit or surplus in the Company’s
defined benefit plans. Any surplus resulting from this
calculation is limited to the present value of any economic
benefits available in the form of refunds from the plans or
reductions in future contributions to the plans.
A liability for a termination benefit is recognized at the earlier
of when the entity can no longer withdraw the offer of the
termination benefit and when the entity recognizes any related
restructuring costs.
32.22 DERIVATIVE FINANCIAL INSTRUMENTS
The Company enters into derivative financial instruments to
manage its exposure to interest rate risk. Further details of
derivative financial instruments are disclosed in note 27.
Derivatives are initially recognized at fair value at the date
a derivative contract is entered into and are subsequently
remeasured to their fair value at each balance sheet date.
The resulting gain or loss is recognized in profit or loss
immediately unless the derivative is designated and effective
as a hedging instrument, in which event the timing of
the recognition in profit or loss depends on the nature of
the hedge relationship. The Company designates certain
derivatives as either hedges of cash flow of recognized
liabilities or hedges of net investments in foreign operations.
A derivative is presented as a non-current asset or a non-
current liability if the remaining maturity of the instrument is
more than 12 months and it is not expected to be realized or
settled within 12 months. Other derivatives are presented as
current assets or current liabilities.
HEDGE ACCOUNTING
The Company designates certain hedging instruments, which
include derivatives and non-derivatives in respect of foreign
currency risk and interest rate risk, as either cash flow hedges
or hedges of net investment in foreign operations.
At the inception of the hedge relationship the entity
documents the relationship between the hedging instrument
and hedged item, along with its risk management objectives
and its strategy for undertaking various hedge transactions.
Furthermore, at the inception of the hedge and on an
ongoing basis, the Company documents whether the hedging
instrument that is used in a hedging relationship is highly
effective in offsetting changes in fair values or cash flows of
the hedged item.
The hedging reserve within equity represents the cumulative
portion of gains and losses on hedging instruments deemed
effective in cash flow hedges. The cumulative deferred gain or
loss on the hedging instrument is reclassified to profit or loss
only when the hedged transaction affects the profit or loss, or
is included as a basis adjustment to the non-financial hedged
item, consistent with the relevant accounting policy.
Note 24 sets out details of the fair values of the derivative
instruments used for hedging purposes. Movements in the
hedging reserve in equity are detailed in the equity overview.
HEDGES OF NET INVESTMENTS IN FOREIGN
OPERATIONS
Any gain or loss on the hedging instrument relating to the
effective portion of the hedge is recognized in equity in the
foreign currency translation reserve.
Gains and losses deferred in the foreign currency translation
reserve are recognized in profit or loss on disposal of the
foreign operation.
CASH FLOW HEDGES
The effective portion of changes in the fair value of derivatives,
that are designated and qualify as cash flow hedges, is
recognized in other comprehensive income and accumulated
under the heading of hedging reserve. The gain or loss relating
to the ineffective portion is recognized immediately in profit or
loss, and is included in the ‘other financial expense / income'
line item.
Amounts previously recognized in other comprehensive
income and accumulated in equity are reclassified to profit
or loss in the periods when the hedged item is recognized in
profit or loss, in the same line of the income statement as the
recognized hedged item. However, when the hedged forecast
transaction results in the recognition of a non-financial asset
or a non-financial liability, the gains and losses previously
recognized in other comprehensive income and accumulated
in equity are transferred from equity and included in the initial
measurement of the cost of the non-financial asset or non-
financial liability.
Hedge accounting is discontinued when the Company revokes
the hedging relationship, when the hedging instrument
expires, is sold, terminated, exercised, or when it no longer
ÖSS
UR
HF.
CO
NSO
LID
ATED
FIN
AN
CIA
L ST
ATEM
ENTS
201
4
87ANNUAL REPORT 14
qualifies for hedge accounting. Any gain or loss recognized
in other comprehensive income and accumulated in equity at
that time remains in equity and is recognized when the forecast
transaction is ultimately recognized in profit or loss. When a
forecast transaction is no longer expected to occur, the gain
or loss accumulated in equity is recognized immediately in the
income statement.
33.CRITICAL ACCOUNTING JUDGMENTS AND KEY
SOURCES OF ESTIMATION UNCERTAINTY I n
the application of the Company's accounting policies, which
are described in note 32, management is required to make
judgments, estimates and assumptions about the carrying
amounts of assets and liabilities that are not readily apparent
from other sources. The estimates and associated assumptions
are based on historical experience and other factors that are
considered to be relevant. Actual results may differ from these
estimates.
The estimates and underlying assumptions are reviewed on
an ongoing basis. Revisions to accounting estimates are
recognized in the period in which the estimate is revised if the
revision affects only that period or in the period of the revision
and future periods if the revision affects both current and future
periods.
Determining whether goodwill is impaired requires an
estimation of the value in use of the cash-generating units to
which goodwill has been allocated. The value in use calculation
requires the entity to estimate the future cash flows expected
to arise from the cash-generating unit and a suitable discount
rate in order to calculate present value. Details of impairment
calculations are set out in note 10.
As described at 32.15, the Company reviews the estimated
useful lives of property, plant and equipment at the end of each
balance sheet date.
ÖSS
UR
HF.
CO
NSO
LID
ATED
FIN
AN
CIA
L ST
ATEM
ENTS
201
4
All amounts in thousands of USD
88 ANNUAL REPORT 14
The Össur Annual Report has been prepared in-house by Össur employees. All photos in the report are existing marketing material.
The only external cost occurred is for proofreading and printing.
Forward-Looking Statements
This annual report contains projections and other forward-looking statements regarding future events and/or the future financial
performance of Össur hf. You can identify forward-looking statements by terms, such as “expect,” “believe,” “anticipate,” “estimate,”
“intend,” “will,” “could,” “may” or “might” or the negative of such terms or other similar expressions. We wish to caution you that these
statements are only predictions, and that actual events or results may differ materially. We do not intend to update these statements to
reflect events and circumstances occurring after the date hereof or to reflect the occurrence of unanticipated events. Many factors could
cause the actual results to differ materially from those contained in our projections or forward-looking statements, including, among
others, general economic conditions, our competitive environment, rapid technological and market change in our industries, as well as
many other risks specifically related to Össur hf. and its operations.
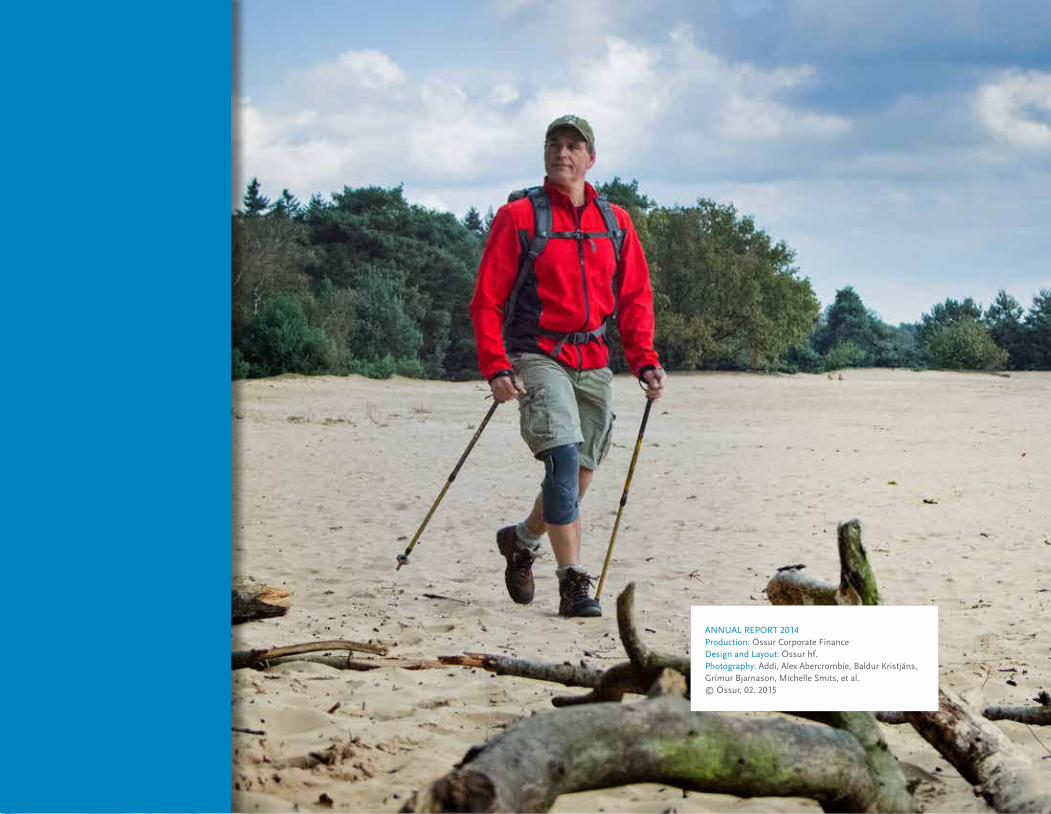
ANNUAL REPORT 2014Production: Össur Corporate FinanceDesign and Layout: Össur hf.Photography: Addi, Alex Abercrombie, Baldur Kristjáns, Grímur Bjarnason, Michelle Smits, et al.© Össur, 02. 2015
Össur hf. Head OfficeGrjótháls 1-5110 ReykjavíkIceland
TEL +354 515 1300FAX +354 515 1366 [email protected]
WWW.OSSUR.COM
FOLLOW ÖSSUR ON