Embed Size (px)
Citation preview
STA 218: Statistics for Management
Al Nosedal.University of Toronto.
Fall 2017
Al Nosedal. University of Toronto. STA 218: Statistics for Management
My momma always said: ”Life was like a box of chocolates. Younever know what you’re gonna get.”
Forrest Gump.
Al Nosedal. University of Toronto. STA 218: Statistics for Management
Population, Sample, Sampling Design
The population in a statistical study is the entire group ofindividuals about which we want information.A sample is a part of the population from which we actuallycollect information. We use a sample to draw conclusions aboutthe entire population.A sampling design describes exactly how to choose a sample fromthe population.The first step in planning a sample survey is to say exactly whatpopulation we want to describe. The second step is to say exactlywhat we want to measure, that is, to give exact definitions of ourvariables.
Al Nosedal. University of Toronto. STA 218: Statistics for Management
Customer satisfaction
A department store mails a customer satisfaction survey to peoplewho make credit card purchases at the store. This month, 45,000people made credit card purchases. Surveys are mailed to 1000 ofthese people, chosen at random, and 137 people return the surveyform.a) What is the population of interest for this survey?b) What is the sample? From what group is information actuallyobtained?
Al Nosedal. University of Toronto. STA 218: Statistics for Management
Solutions
a) The population is all 45,000 people who made credit cardpurchases.b) The sample is the 137 people who returned the survey form.
Al Nosedal. University of Toronto. STA 218: Statistics for Management
How to sample badly
The final step in planning a sample survey is the sampling design.A sampling design is a specific method for choosing a sample fromthe population. The easiest- but not the best - design just choosesindividuals close at hand. A sample selected by taking themembers of the population that are easiest to reach is called aconvenience sample. Convenience samples often produceunrepresentative data.
Al Nosedal. University of Toronto. STA 218: Statistics for Management
Bias
The design of a statistical study is biased if it systematically favorscertain outcomes.
Al Nosedal. University of Toronto. STA 218: Statistics for Management
Voluntary response sample
A voluntary response sample consists of people who choosethemselves by responding to a broad appeal. Voluntary responsesamples are biased because people with strong opinions are mostlikely to respond.
Al Nosedal. University of Toronto. STA 218: Statistics for Management
Sampling on campus
You see a woman student standing in front of the student center,now and then stopping other students to ask them questions. Shesays that she is collecting student opinions for a class assignment.Explain why this sampling method is almost certainly biased.
Al Nosedal. University of Toronto. STA 218: Statistics for Management
Solution
It is a convenience sample; she is only getting opinions fromstudents who are at the student center at a certain time of day.This might underrepresent some group: commuters, graduatestudents, or nontraditional students, for example.
Al Nosedal. University of Toronto. STA 218: Statistics for Management
Simple Random Sampling
A simple random sample (SRS) of size n consists of n individualsfrom the population chosen in such a way that every set of nindividuals has an equal chance to be the sample actually selected.
Al Nosedal. University of Toronto. STA 218: Statistics for Management
Random digits
A table of random digits is a long string of the digits 0, 1, 2, 3,4, 5, 6, 7, 8, 9 with these two properties:1. Each entry in the table is equally likely to be any of the 10digits 0 through 9.2. The entries are independent of each other. That is, knowledgeof one part of the table gives no information about any other part.
Al Nosedal. University of Toronto. STA 218: Statistics for Management
Using Table B to choose an SRS
Label: Give each member of the population a numerical label ofthe same length.Table: To choose a SRS, read from Table B successive groups ofdigits of the length you used as labels. Your sample contains theindividuals whose labels you find in the table.
Al Nosedal. University of Toronto. STA 218: Statistics for Management
Apartment living
You are planning a report on apartment living in a college town.You decide to select three apartment complexes at random forin-depth interviews with residents. Use software or Table B toselect a simple random sample of 4 of the following apartmentcomplexes. If you use Table B, start at line 122.
Al Nosedal. University of Toronto. STA 218: Statistics for Management
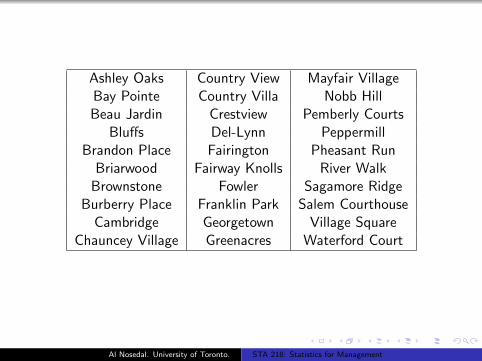
Ashley Oaks Country View Mayfair VillageBay Pointe Country Villa Nobb HillBeau Jardin Crestview Pemberly Courts
Bluffs Del-Lynn PeppermillBrandon Place Fairington Pheasant Run
Briarwood Fairway Knolls River WalkBrownstone Fowler Sagamore Ridge
Burberry Place Franklin Park Salem CourthouseCambridge Georgetown Village Square
Chauncey Village Greenacres Waterford Court
Al Nosedal. University of Toronto. STA 218: Statistics for Management
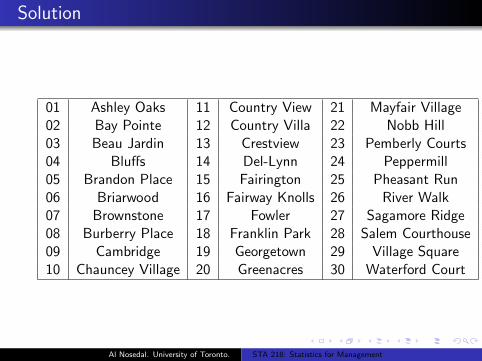
Solution
01 Ashley Oaks 11 Country View 21 Mayfair Village02 Bay Pointe 12 Country Villa 22 Nobb Hill03 Beau Jardin 13 Crestview 23 Pemberly Courts04 Bluffs 14 Del-Lynn 24 Peppermill05 Brandon Place 15 Fairington 25 Pheasant Run06 Briarwood 16 Fairway Knolls 26 River Walk07 Brownstone 17 Fowler 27 Sagamore Ridge08 Burberry Place 18 Franklin Park 28 Salem Courthouse09 Cambridge 19 Georgetown 29 Village Square10 Chauncey Village 20 Greenacres 30 Waterford Court
Al Nosedal. University of Toronto. STA 218: Statistics for Management
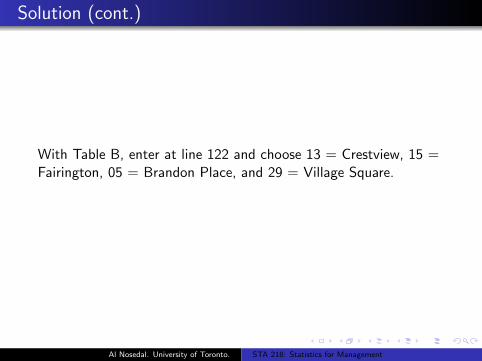
Solution (cont.)
With Table B, enter at line 122 and choose 13 = Crestview, 15 =Fairington, 05 = Brandon Place, and 29 = Village Square.
Al Nosedal. University of Toronto. STA 218: Statistics for Management
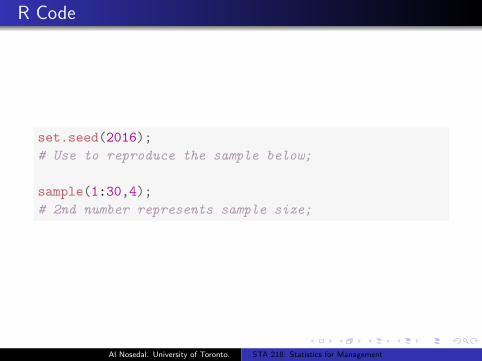
R Code
set.seed(2016);
# Use to reproduce the sample below;
sample(1:30,4);
# 2nd number represents sample size;
Al Nosedal. University of Toronto. STA 218: Statistics for Management
R Code
## [1] 6 5 24 4
Al Nosedal. University of Toronto. STA 218: Statistics for Management
Inference about the Population
The purpose of a sample is to give us information about a largerpopulation. The process of drawing conclusions about a populationon the basis of sample data is called inference because we inferinformation about the population from what we know about thesample.Inference from convenience samples or voluntary response sampleswould be misleading because these methods of choosing a sampleare biased. We are almost certain that the sample does not fairlyrepresent the population. The first reason to rely on randomsampling is to eliminate bias in selecting samples from thelist of available individuals.
Al Nosedal. University of Toronto. STA 218: Statistics for Management
Sampling frame
The list of individuals from which a sample is actually selected iscalled the sampling frame. Ideally, the frame should list everyindividual in the population, but in practice this is often difficult. Aframe that leaves out part of the population is a common source ofundercoverage.Suppose that a sample of households in a community is selected atrandom from the telephone directory. What households areomitted from this frame? What types of people do you think arelikely to live in these households? These people will probably beunderrepresented in the sample.
Al Nosedal. University of Toronto. STA 218: Statistics for Management
Solution
This design would omit households without telephones or withunlisted numbers. Such households would likely be made up ofpoor individuals (who cannot afford a phone), those who choosenot to have phones, and those who do not wish to have theirphone number published.
Al Nosedal. University of Toronto. STA 218: Statistics for Management
Cautions about sample surveys
Random selection eliminates bias in the choice of a sample from alist of the population. When the population consists of humanbeings, however, accurate information from a sample requires morethan a good sampling design.To begin, we need an accurate and complete list of the population.Because such a list is rarely available, most samples suffer fromsome degree of undercoverage. A sample survey of households,for example, will miss not only homeless people but prison inmatesand students in dormitories. An opinion poll conducted by callinglandline telephone numbers will miss households that have only cellphones as well as households without a phone. The results ofnational sample surveys therefore have some bias if the people notcovered differ from the rest of the population.A more serious source of bias in most sample surveys isnonresponse, which occurs when a selected individual cannot becontacted or refuses to cooperate.
Al Nosedal. University of Toronto. STA 218: Statistics for Management
Nonresponse
Academic sample surveys, unlike commercial polls, often discussnonresponse. A survey of drivers began by randomly sampling alllisted residential telephone numbers in the United States.Of 45,956 calls to these numbers, 5029 were completed. What wasthe rate of nonresponse for this sample? (Only one call was madeto each number. Nonresponse would be lower if more calls weremade.)
Al Nosedal. University of Toronto. STA 218: Statistics for Management
Solution
The response rate was 502945956 = 0.1094, so the nonresponse rate
was 1− 0.1094 = 0.8906
Al Nosedal. University of Toronto. STA 218: Statistics for Management
Undercoverage and nonresponse
Undercoverage occurs when some groups in the population areleft out of the process of choosing the sample.Nonresponse occurs when an individual chosen for the samplecan’t be contacted or refuses to participate.
Al Nosedal. University of Toronto. STA 218: Statistics for Management
Stratified Random Sample
To select a stratified random sample, first divide the populationinto groups of similar individuals, called strata. Then choose aseparate SRS in each stratum and combine these SRSs to form thefull sample.
Al Nosedal. University of Toronto. STA 218: Statistics for Management
Toy Example
Suppose we have a population of size 5. We measure a variable foreach of these 5 individuals, the result of our measurements follows:50, 55, 60, 70, and 80. Now, we compute the population mean,which we denote by µ, µ = 63.
Al Nosedal. University of Toronto. STA 218: Statistics for Management
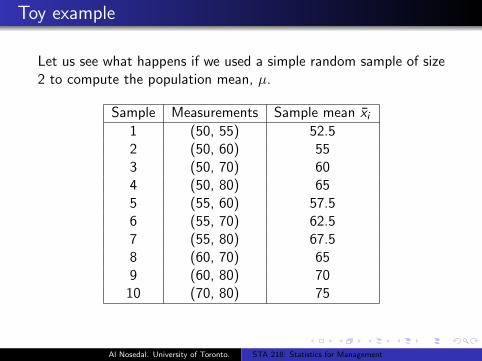
Toy example
Let us see what happens if we used a simple random sample of size2 to compute the population mean, µ.
Sample Measurements Sample mean x̄i1 (50, 55) 52.52 (50, 60) 553 (50, 70) 604 (50, 80) 655 (55, 60) 57.56 (55, 70) 62.57 (55, 80) 67.58 (60, 70) 659 (60, 80) 70
10 (70, 80) 75
Al Nosedal. University of Toronto. STA 218: Statistics for Management
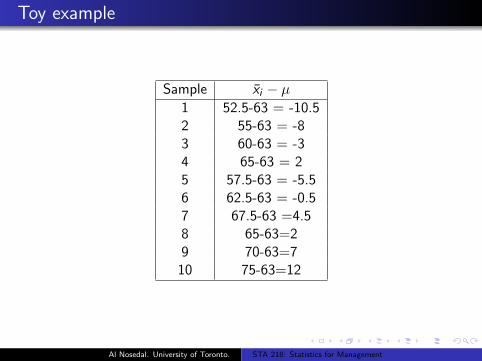
Toy example
Sample x̄i − µ1 52.5-63 = -10.52 55-63 = -83 60-63 = -34 65-63 = 25 57.5-63 = -5.56 62.5-63 = -0.57 67.5-63 =4.58 65-63=29 70-63=7
10 75-63=12
Al Nosedal. University of Toronto. STA 218: Statistics for Management
Toy example
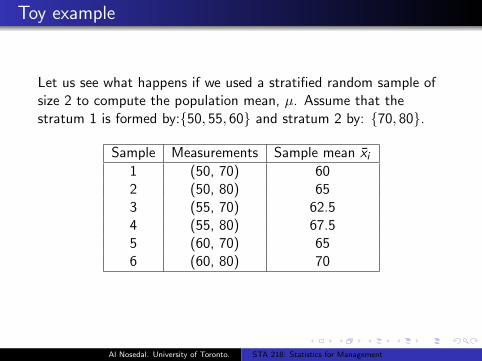
Let us see what happens if we used a stratified random sample ofsize 2 to compute the population mean, µ. Assume that thestratum 1 is formed by:{50, 55, 60} and stratum 2 by: {70, 80}.
Sample Measurements Sample mean x̄i1 (50, 70) 602 (50, 80) 653 (55, 70) 62.54 (55, 80) 67.55 (60, 70) 656 (60, 80) 70
Al Nosedal. University of Toronto. STA 218: Statistics for Management
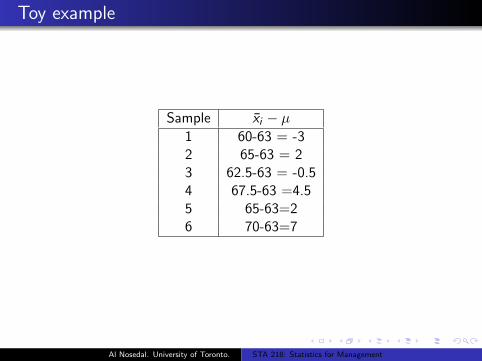
Toy example
Sample x̄i − µ1 60-63 = -32 65-63 = 23 62.5-63 = -0.54 67.5-63 =4.55 65-63=26 70-63=7
Al Nosedal. University of Toronto. STA 218: Statistics for Management