Embed Size (px)
Citation preview
STABILITY ANALYSIS AND SUPPORT DESIGN OF
MANIPURA DIVERSION TUNNELS IN MYANMAR
Banyar Soe
A Thesis Submitted in Partial Fulfillment of the Requirements for
the Degree of Master of Engineering in Geotechnology
Suranaree University of Technology
Academic Year 2010

การวเิคราะห์เสถยีรภาพและการออกแบบคํ�ายันของ อุโมงค์ผนันํ�าแมนนิปูร่าในประเทศพม่า
นายบัญญา โซอ์
วทิยานิพนธ์นี�เป็นส่วนหนึ+งของการศึกษาตามหลกัสูตรปริญญาวศิวกรรมศาสตรมหาบัณฑิต
สาขาวชิาเทคโนโลยธีรณี
มหาวทิยาลัยเทคโนโลยสุีรนารี
ปีการศึกษา 2553
STABILITY ANALYSIS AIID SUPPORT DESIGN OF
MANIPT]RA DIVERSION TT]IINELS IN MYANMAR
Suranaree University of Technology has approved this thesis submitted
partial fulfillment of the requirements for a Master's Degree.
Thesis Examining Committee
d(Asst. Prof. Thara Lekuthai)
Chairperson
<T-R'W(Assoc. Prof. Dr. Kittitep Fuenkajom)
Member (Thesis Advisor)
F.f*,-ux_@r. Prachya Tepnarong)-
Member
w./.-. V,/</r*,N(Prof. Dr. Sukit Limpijumnong) (Assoc. Prof. Grp. Capt. dr. vorapot Khompis)
Vice Rector for Academic Affairs Dean of Institute of Engineering
tirUrU'r lryd' : nr:irn:rsr{rads:n'rilrrnufltruun,,uuri''fiurolqlrulriri'urirrrruufi:J:'r
luil:srvrsnrir (STABILITY ANALYSTS AND SUPPORT DESTGN oF MANTPURA
DIVERSION TLTNNELS IN MYANMAN) OrOr:dfirjfNgr : Io{fl]dnIl0r:d q:.
frnsr^ryrvr rfrlosro:, ttz vflt
Y,!.,au aa I dj o d a o v 6 a s dt{1U?0UU:Jqqil:ed.:nlil0?tn51vilrdCIu:r'r'r]llrasoontruufilgudl14tilq lrulnqruru
druir:vrrulirornln:rnr:aixrtiouu:rufi{:'r Inrunr:d'ldairrrfiou#u,,riri,,ruufirJdrtrrradrrdrfrroqjvf r.:orfltil-o{flrrn rflflrfro{n'rrn rJ:srilevlrjr rflu:sucmxil:yruru sz filar:rsr: Iqu
lnr:snt:fiisrqil:sa{rirfio{'qld'fidrdrriufifirnsn:n::ru,ilr u')u 20,z42ranrflof uns14fierq
" ' AJ * dr an:srra'lv'hilrtrnfld'srrurirdrmfuldluffufiriu q1rrrri{ruruiln?'l:ru'l? t,oso riln: lnufi- ,J v d t4 c) Aa t ,- s /r lo g, qs)urird'nrflugrJrfion:irfrfrnrtrunitr I2 r:Jer: qTrurri{rurufifirduvrrInoerldqrrrlnufi
I aa{ a. ,a iq ' ia .y - j ^ I s dq !:
14il:sd{nlil0r1JuYrflvr1.1fl1: lilnflo{u1 tus?{ytiln]:d51{strmouuu1nruyN q trulrir.ruilriln
'f 9t t
to fl oGI: t{ tt tilEqil?afr u 3 grlull n^o lryufi I : rfl um^ururufi fi :cd'unr: r1fi'lrJrunat{fi {illns i- C o !a - - Itryufrz : tflufiuryu?uyrtJ:&erunr:tiv{{alfirilrunax uaclryud g
'rflur^uuu':ufifi:sri'ut9,y
nr:ryr{'.rdrad'uf'ufi'rfrum:'rurn:t.irr?n nr:il:srru^uyn{r:rfirmnu^ntorJryurix 1 u^orfrurioqnjrnv d d ot 'fr '[ pir r n n r : rir : e o n r : d'r rn n t u R r n du 1 rJ r ra s fl 1 : yt er d o u lu #o I rJ g^risr^n r :
q ^- lrra- j - s < r a t u1u.: ruTo'ufr"[6'frnu rrfrurn'l nr:qnrd'nuarscJo.til ?nH'u n1: il:sr:J-urirpi.:rnJ: fi
.1^.^Z--y^-^.^_-=-. - a d a ! - a s / atn0?1o{fluil?nilu fil:?[n:'rst4tdou:fl1vr rraeflt:00fltt1JU:v1JUfi1uu14u:ouq trulri :J?afiu
aaoen?'tuut?fl0{qlu{ri"ldqn,f rrtunlquld:yuilnr:drrrunutnfrurfi.:rJ:sdilnt:sfd{ilil1u4 o a I dgt:?tJd{ :suufl'l:'il'lrlunfr'ud?u:suilnt:'[fnsuuu (RMR) :vilud'sfiqarntilil?afruluqfu.:ni
flo{ NGI (Q-system) :uilud'sfiilrnfiu (RMi) 6'rfinrrruu{.:I:tfiirur (csr) nird'td:sfivr3"4 r a v t ! - Aqy- rfl?ltJUnilqUfl0{:J?ailU ttnsa?t[lJ:fl0{ Hook-Brown ttlJ?Yl1{fl1:OOflttulritdufrl,fn'Uoqj
rfihJ ld'qnrjrrurtdrJ:cnouri'llt{nnr:,ilrrrunqildnsuvrLor:J?ail^uludorufio?s nr5,ilrno{
d':tluul'fltaos6'rtat (Ierulil:un:ru phase2) endrilrldrfioil:yrn^urafiu:RrnlJo{ofusr{r{,rvr'fil4 ra ! - * i d aqa a i ottns"lrjfr:s:turitUu lerufrrnil.]inr:Tfdro.r:J':afrufirauoIqu Hoek u0& Brown qnrir:lrld
I A o i< _- _4 @ J 3 - jil:vrfruuir:nrfrfinr:n:rnttavflr:lflAousr'xq{qqflowr^u:olqlru{fi :silufirdufrrruvritld'ld
lquif;tfilil:vdilnr:ni (Empirical) qnldlunr:finurd':unr:'ilraorrfird'rrar drrJ:vno:Ld'ru4aAllvt@ar
ilrynuqilu unsnouflSnviu:rrun'usn{run?q Ea{6yrJUerllotarufirfluriiriu rdu fl?uJU1?ron4 A a J a o d r ht ot j hn4ott-nfru :suunI:60d'sr4orOnfru unefl?r:J14urflo{noufl5n}iu tdqnldnrrufi:vq 1{1uif;
A I r r d- e---.--J- ! t d ;;. a s /rnr qls{lJ:sdiln1:il nouvrovilnr:sisrsrs:suilfI1uu lt'ufrvtrnernr:fl:'lnro{14'xJ:ouq hi{ri'[dqnd'.:mn
il
4--^^------4-- isy< r a qt o 4 j e a i d r afrlornnanr:dnutBltiuTu'it frut.til€U141rn-af,urfrurduradu:n1r'tlJo{EIrulri nrirrfiofld{01ntt99
fi6nd't:vurrirfrurrdr frufrfirn^nn1:n:'rn:ouqllrriunv:suvro{n'r:rfinrflunaracr'nnld^^^-+-^i-^^-.-4--* s dq 4 y jSoya , i-oana{ oflYl{fl1:[nnousr?q{qn1o.:q til{nu{ana{on9r?u cu{s tt4lliu?1 :u1Jiln1:f{1riililn?]il
I
t?ttJtvdilfr0srirh{rfinradu:nrrwo.tqlru.rril6'Isruanrrvfi6fiqn:vn'j'l.tr{afl1:oonuulJd1f,ilY AdA I J ad t d a4ta - I ut o j oqdruTirfrl:J:sd:JR1:ni uavTGill{6ru:vriiurJTr-rfr.:d"lrartiu 'ldqnrirnuprrffol#lunt:
grlto I A o v * do ;
o o n u u u ri 1 du fr ru ru r v aru d r r il q I ru': dfiu d r r ru u u^ { d r
aiv4A1UilOTOlJflflNU1arrr?sr rvrnluln6r:d
drdilnl:dnu1 2553 aruil^os^oorrr:dfirJinu 1 l'l' -
BANYAR SOE : STABILITY ANALYSIS AND SUPPORT DESIGN OF
MANIPURA DTVERSION TLTNNELS IN MYANMAR. THESIS ADVISOR:
ASSOC. PROF. KITTITEP FUENKAJORN, Ph.D., P.E., 112 PP.
TUNNEL/DE SIGN/S TAB ILITY/SUPP ORT/DTVERSION/N{ANIPURA
The objective of this study is to perform stability analysis and support design
for two parallel diversion tunnels of the Manipura multi-purposed dam project. The
project is located on the Manipura River, 52 km from the Kalay Town, Kalay
Township, Sagaing Division, Myanmar. The two parallel tunnels are 1,050 m long
with 12 m wide modified horseshoe shape. The diversion tunnels penetrate three
different zones of rock mass : zone I : moderately to highly weathered slate; zone 2 :
slightly to moderately weathered slate; and zone 3 : slightly weathered slate with
alternation of greywacke sandstone band. The geotechnical evaluation of these zones
is relied on the exploratory data, field observations and laboratory test results.
The proposed research involves rock mass characteizations, evaluation of
rock mass parameters and stability analysis, and support design for the rock mass
around the tunnels. The rock masses along the tunnels are classified by using
empirical rock mass classification systems including rock mass rating system (RMR),
NGI tunneling quality index (Q system), rock mass index (RMi) and geological
strength index (GSD. Traditional guidelines for the rock support have been used based
on the results of the site characterizations. A series of numerical simulations (using
Phase2 code) is performed to assess the stability conditions of the tunnels with and without
the support systems. Hoek and Brown failure criterion is used to estimate yielding
TV
zone around the tunnels and the morimum displacement. The support systems
suggested by empirical methods are employed in numerical modeling. The properties
of the support elements, such as bolt length, bolt pattems and thickness of shotcrete
are similar to those proposed by the empirical methods. Before support installation,
yielding zones are observed. The results indicate that there would be some stability
problems for the tunnels. After support installation, the number of yielding zones and
the radius of plastic zone are decreased. The maximum displacement is also reduced.
This indicates that the applied support systems are.adequate to obtain the tunnel
stability. Optimization between the empirical and numerical results is made to obtain
the suitable support design for the Manipura diversion tunnels.
S chool o f Gpqlcshoglegy_
Academic Year 2010
Student's Signature
Advisor's Signature

ACKNOWLEDGEMENTS
I would like to express my deepest gratitude to my advisor Assoc. Prof. Dr.
Kittitep Fuenkajorn for his valuable guidance and efficient supervision. I am indebted
for his strong support, encouragement, suggestion and comments during the research
period. My heartiest thanks to Asst. Prof. Thara Lekuthai and Dr. Prachaya
Tepnarong for their constructive advice, valuable suggestions, and comments on my
research work as thesis committee members.
I am sincerely thankful to the Thailand International Development
Cooperation Agency (TICA), Ministry of Foreign Affairs, Thailand, for providing me
scholarship grants to study at Suranaree University of Technology (SUT).
Very special thank to Minister, Ministry of Agriculture and Irrigation,
Myanmar for his kind support. I am very grateful to Director, Deputy Director and
other officials from Irrigation Department, Ministry of Agriculture and Irrigation,
Myanmar for their informative support and facilitation during my research.
Thanks to all staffs at School of Geotechnology for their kind assistance. Very
special thanks are given to my seniors, classmates, junior and all staff of
Geomechanics Research Unit (GMR) for their loving support during my study days in
SUT.
Finally, I would like to thank beloved parents for their love, moral support and
constant encouragement.
Banyar Soe
TABLE OF CONTENTS
Page
ABSTRACT (THAI) I
ABSTRACT (ENGLISH) III
ACKNOWLEDGEMENTS V
TABLE OF CONTENTS VI
LIST OF TABLES X
LIST OF FIGURES XII
SYMBOLS AND ABBREVIATIONS XIV
CHAPTER
I INTRODUCTION 1
1.1 Background of Problems and Significance
of the Study 1
1.2 Research Objectives 4
1.3 Research Methodology 4
1.3.1 Literature Review 4
1.3.2 Geological Data Collection 5
1.3.3 Rock Mass Characterizations 5
1.3.4 Geotechnical Rock Mass Parameter
Estimation and Stability Analysis 5
VII
TABLE OF CONTENTS (Continued)
Page
1.3.5 Support Design and Comparisons 7
1.3.6 Discussions, Conclusions and
Thesis Writing 7
1.4 Scope and Limitations of the Study 7
1.5 Thesis Contents 8
II LITERATURE REVIEW 9
2.1 Introduction 9
2.2 Rock Mass Classification Systems 9
2.2.1 Rock Mass Rating System (RMR) 10
2.2.2 NGI Tunnelling Quality Index
(Q System) 10
2.2.3 Rock Mass Index (RMi) 13
2.2.4 Geological Strength Index (GSI) 14
2.3 Deere’s Rock Quality Designation (RQD) 15
2.4 Numerical Method 16
2.5 Review of Papers 17
III GEOLOGICAL DATA COLLECTION 21
3.1 Introduction 21
3.2 Geology of Project Area 22
3.3 Engineering Geology 23
3.4 Laboratory Testing 26
VIII
TABLE OF CONTENTS (Continued)
Page
IV ROCK MASS CHARACTERIZATIONS 27
4.1 Introduction 27
4.2 Rock Mass Rating System (RMR) 27
4.3 NGI Tunneling Quality Index (Q system) 29
4.4 Rock Mass Index (RMi) 31
4.5 Geological Strength Index (GSI) 33
4.6 Comparison of the Rock Mass Classification
Results from Four Different Rock Mass
Classification Systems 35
V GEOTECHNICAL ROCK MASS PARAMETER
ESTIMATION AND STABILITY ANALYSIS 37
5.1 Introduction 37
5.2 Geotechnical Rock Mass Parameter
Estimation 37
5.2.1 Rock Mass Deformation Modulus 38
5.2.2 Hoek and Brown Parameters 41
5.2.3 Rock Mass Strength 46
5.3 Stability Analysis 49
5.3.1 Stand-up Time and Maximum
Unsupported Span 49
IX
TABLE OF CONTENTS (Continued)
Page
5.3.2 In Situ Stress Analysis and
Safety Factor 51
VI SUPPORT DESIGN 54
6.1 Introduction 54
6.2 Support Capacity Estimation 54
6.3 Support Design Using Empirical Methods 57
6.3.1 Rock Mass Rating System (RMR) 57
6.3.2 NGI Tunneling Quality Index (Q System) 58
6.3.3 Rock Mass Index (RMi) 60
6.4 Support Design Using Numerical Method 62
6.5 Comparisons 80
VII DISCUSSIONS, CONCLUSIONS AND
RECOMMENDATIONS FOR
FUTURE STUDIES 82
7.1 Discussions 82
7.2 Conclusions 85
7.3 Recommendations for Future Studies 86
REFERENCES 87
APPENDIX
APPENDIX A. Technical Publications 94
BIOGRAPHY 112
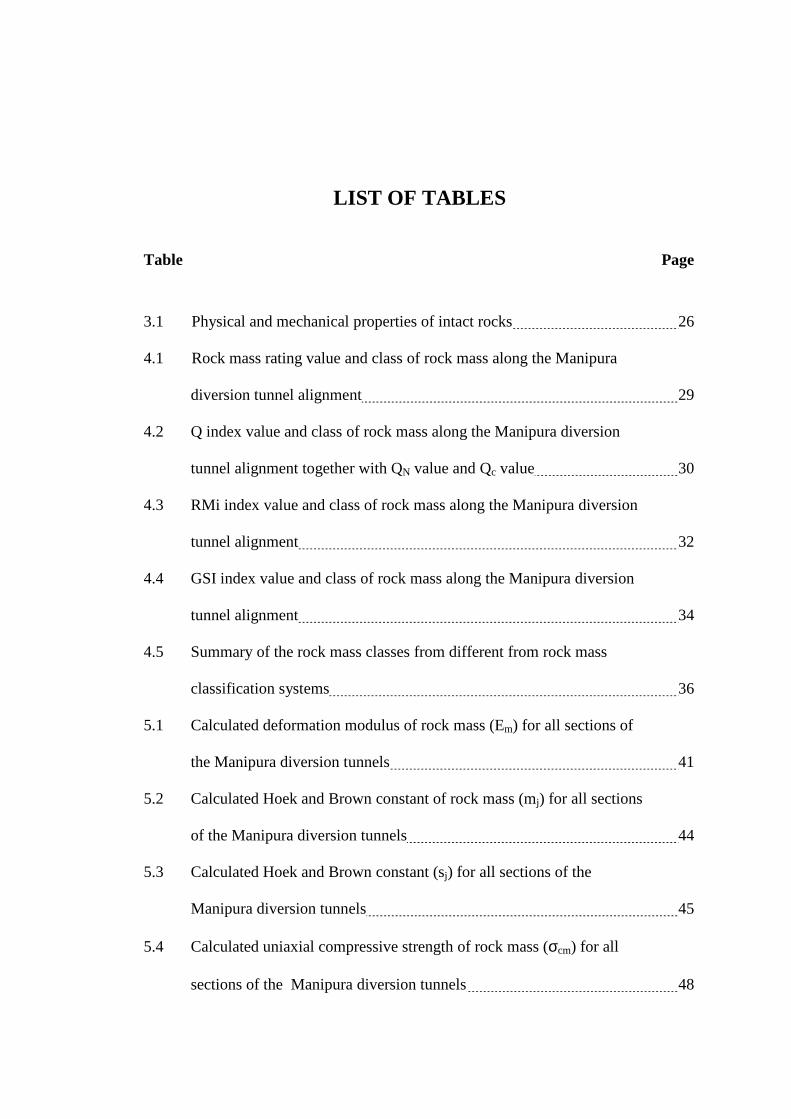
LIST OF TABLES
Table Page
3.1 Physical and mechanical properties of intact rocks 26
4.1 Rock mass rating value and class of rock mass along the Manipura
diversion tunnel alignment 29
4.2 Q index value and class of rock mass along the Manipura diversion
tunnel alignment together with QN value and Qc value 30
4.3 RMi index value and class of rock mass along the Manipura diversion
tunnel alignment 32
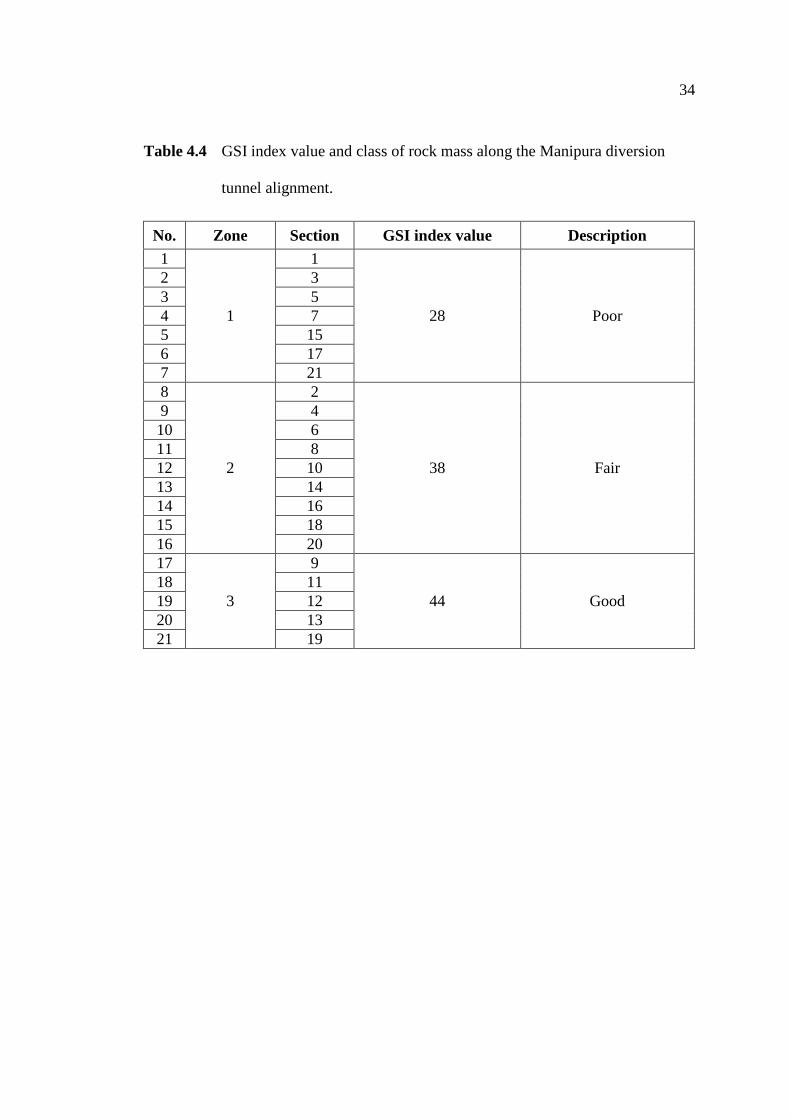
4.4 GSI index value and class of rock mass along the Manipura diversion
tunnel alignment 34
4.5 Summary of the rock mass classes from different from rock mass
classification systems 36
5.1 Calculated deformation modulus of rock mass (Em) for all sections of
the Manipura diversion tunnels 41
5.2 Calculated Hoek and Brown constant of rock mass (mj) for all sections
of the Manipura diversion tunnels 44
5.3 Calculated Hoek and Brown constant (sj) for all sections of the
Manipura diversion tunnels 45
5.4 Calculated uniaxial compressive strength of rock mass (σcm) for all
sections of the Manipura diversion tunnels 48
XI
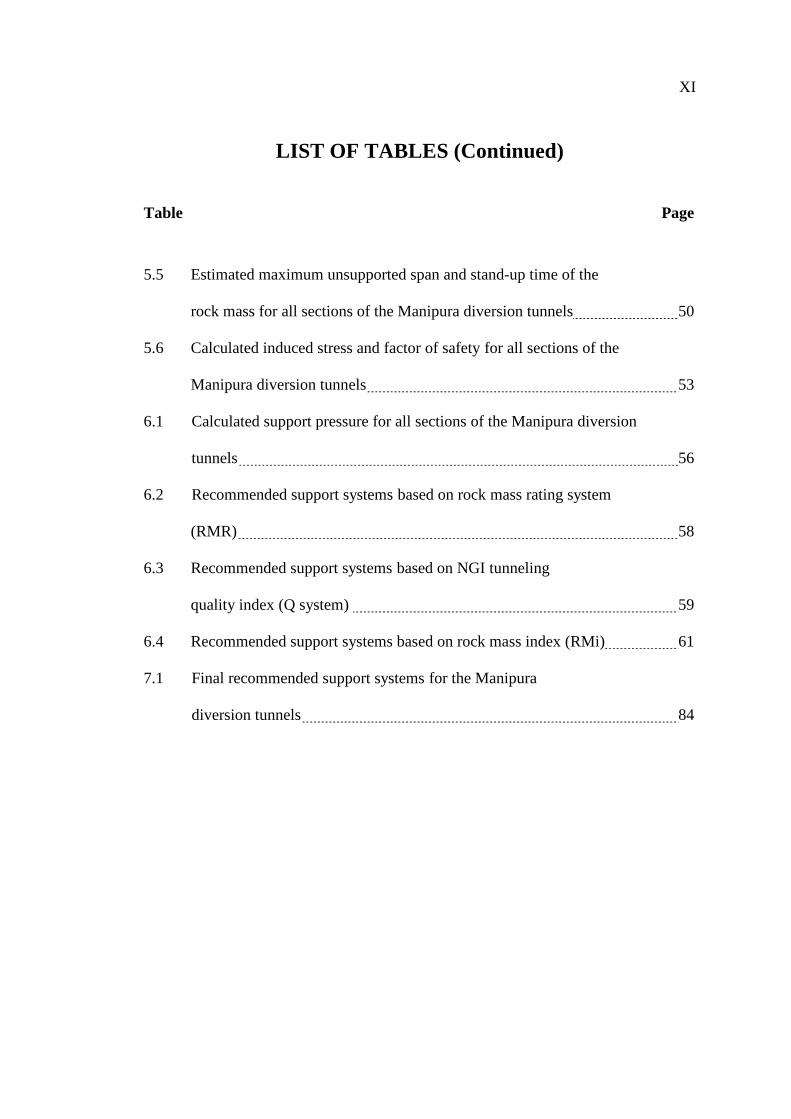
LIST OF TABLES (Continued)
Table Page
5.5 Estimated maximum unsupported span and stand-up time of the
rock mass for all sections of the Manipura diversion tunnels 50
5.6 Calculated induced stress and factor of safety for all sections of the
Manipura diversion tunnels 53
6.1 Calculated support pressure for all sections of the Manipura diversion
tunnels 56
6.2 Recommended support systems based on rock mass rating system
(RMR) 58
6.3 Recommended support systems based on NGI tunneling
quality index (Q system) 59
6.4 Recommended support systems based on rock mass index (RMi) 61
7.1 Final recommended support systems for the Manipura
diversion tunnels 84
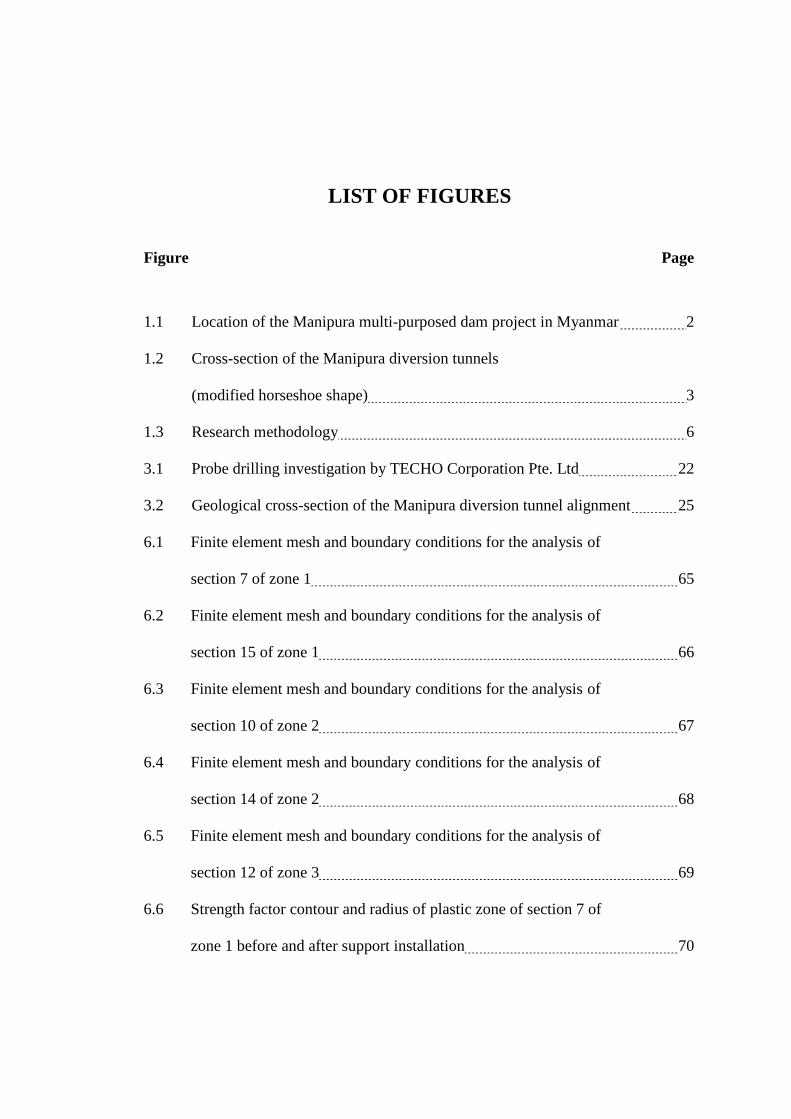
LIST OF FIGURES
Figure Page
1.1 Location of the Manipura multi-purposed dam project in Myanmar 2
1.2 Cross-section of the Manipura diversion tunnels
(modified horseshoe shape) 3
1.3 Research methodology 6
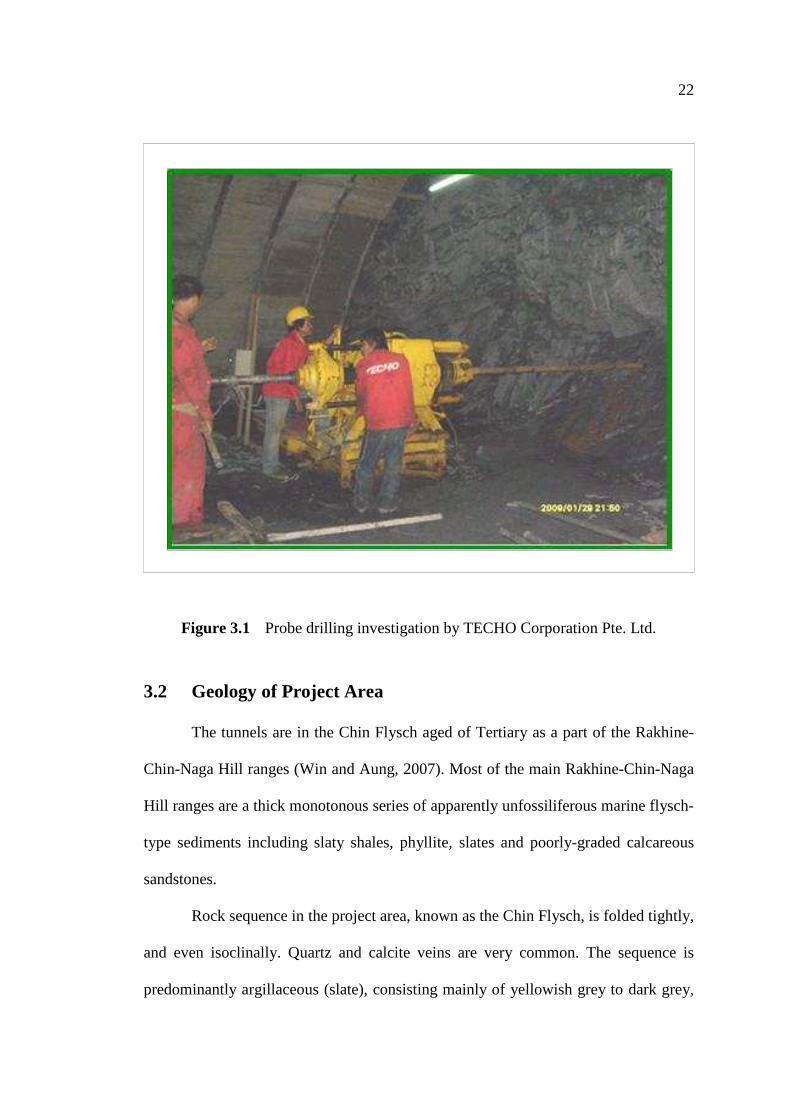
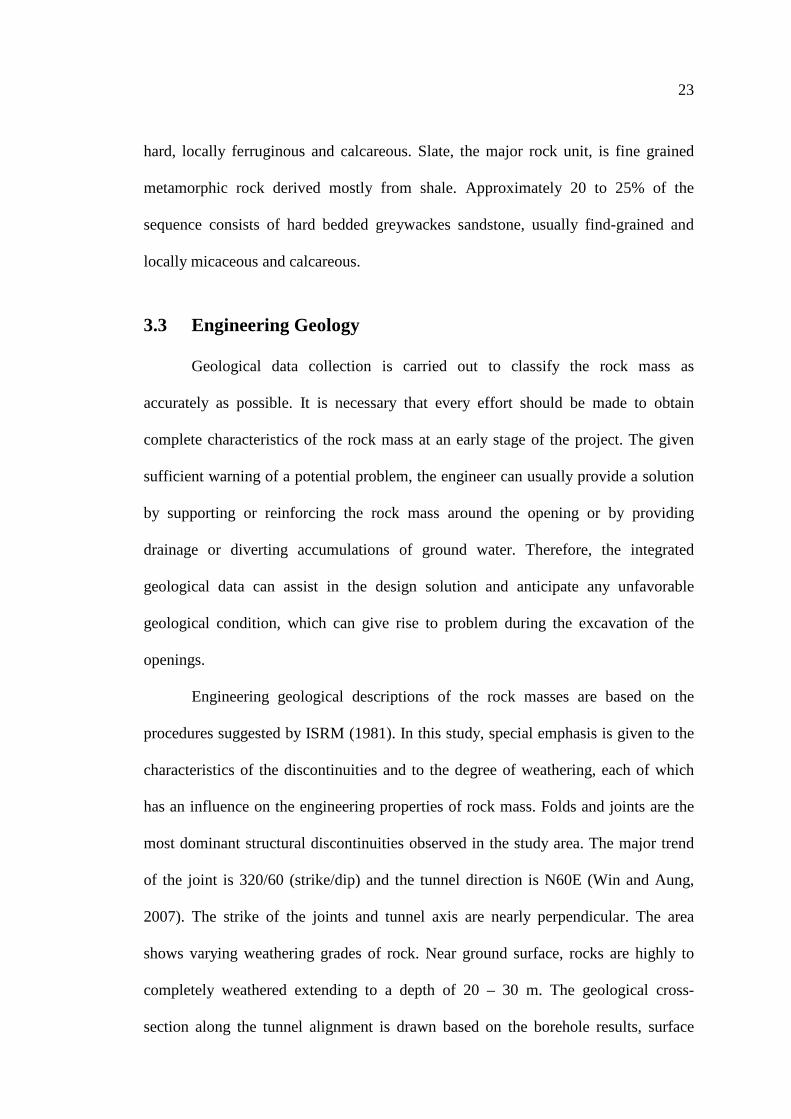
3.1 Probe drilling investigation by TECHO Corporation Pte. Ltd 22
3.2 Geological cross-section of the Manipura diversion tunnel alignment 25
6.1 Finite element mesh and boundary conditions for the analysis of
section 7 of zone 1 65
6.2 Finite element mesh and boundary conditions for the analysis of
section 15 of zone 1 66
6.3 Finite element mesh and boundary conditions for the analysis of
section 10 of zone 2 67
6.4 Finite element mesh and boundary conditions for the analysis of
section 14 of zone 2 68
6.5 Finite element mesh and boundary conditions for the analysis of
section 12 of zone 3 69
6.6 Strength factor contour and radius of plastic zone of section 7 of
zone 1 before and after support installation 70
XIII
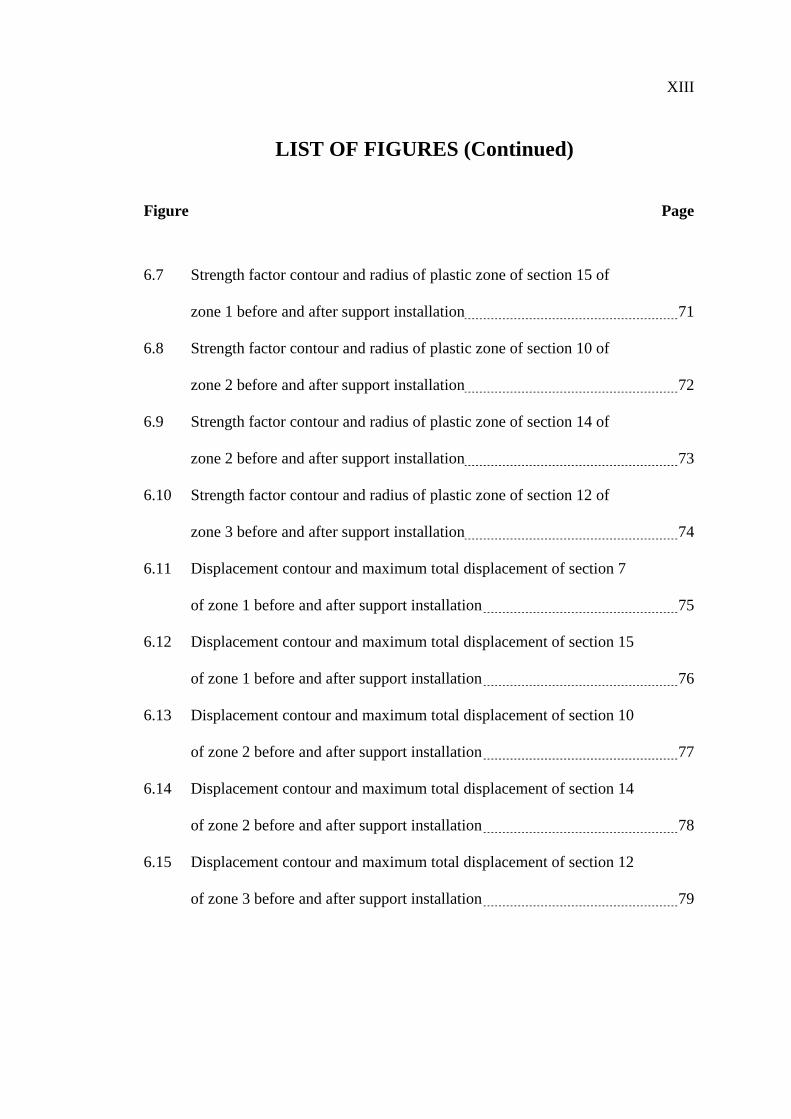
LIST OF FIGURES (Continued)
Figure Page
6.7 Strength factor contour and radius of plastic zone of section 15 of
zone 1 before and after support installation 71
6.8 Strength factor contour and radius of plastic zone of section 10 of
zone 2 before and after support installation 72
6.9 Strength factor contour and radius of plastic zone of section 14 of
zone 2 before and after support installation 73
6.10 Strength factor contour and radius of plastic zone of section 12 of
zone 3 before and after support installation 74
6.11 Displacement contour and maximum total displacement of section 7
of zone 1 before and after support installation 75
6.12 Displacement contour and maximum total displacement of section 15
of zone 1 before and after support installation 76
6.13 Displacement contour and maximum total displacement of section 10
of zone 2 before and after support installation 77
6.14 Displacement contour and maximum total displacement of section 14
of zone 2 before and after support installation 78
6.15 Displacement contour and maximum total displacement of section 12
of zone 3 before and after support installation 79
SYMBOLS AND ABBREVIATIONS
A = Empirical constant for equation (5.24)
a = Empirical constant for equation (5.20)
B = Width of tunnel for equation (5.22)
B = Empirical constant for equation (5.25)
Cg = Competency factor
D = Disturbance factor
Db = Block diameter
De = Equivalent dimension of excavation
ESR = Excavation support ratio
Ei = Young’s modulus
Em = Deformation modulus of rock mass
FS = Safety factor
fσ = Massivity parameter
GSI = Geological strength index
Gc = Ground condition factor
H = Height of the overburden
JC = Joint conditions
JP = Jointing parameter
Ja = Joint alternation number
Jn = Joint set number
Jr = Joint roughness number
XV
SYMBOLS AND ABBREVIATIONS (Continued)
Jv = Volumetric joint count
Jw = Joint water reduction number
jA = Joint alteration
jL = Joint length
jR = Joint roughness
k = Stress ratio
mi = Hoek and Brown constant of intact rock
mj = Hoek and Brown constant of rock mass
Proof = Support pressure
Q = NGI tunneling quality index
Qc = Normalization of Q value
QN = Stress free from Q
RMi = Rock mass index
RMR = Rock mass rating value
RQD = Rock quality designation
SCR = Surface condition rating
SR = Structure rating
SRF = Stress reduction factor.
Sr = Size ratio
si = Hoek and Brown constant of intact rock
sj = Hoek and Brown constant of rock mass
Vb = Block volume
XVI
SYMBOLS AND ABBREVIATIONS (Continued)
W = Width of opening
β = Block shape factor
γ = Unit weight
υ = Poisson’s ratio
σc = Uniaxial compressive strength of intact rock
σcm = Uniaxial compressive strength of rock mass
σh = Horizontal stress
σv = Vertical stress
σθroof = Tangential stress at roof
σθwall = Tangential stress at wall
CHAPTER I
INTRODUCTION
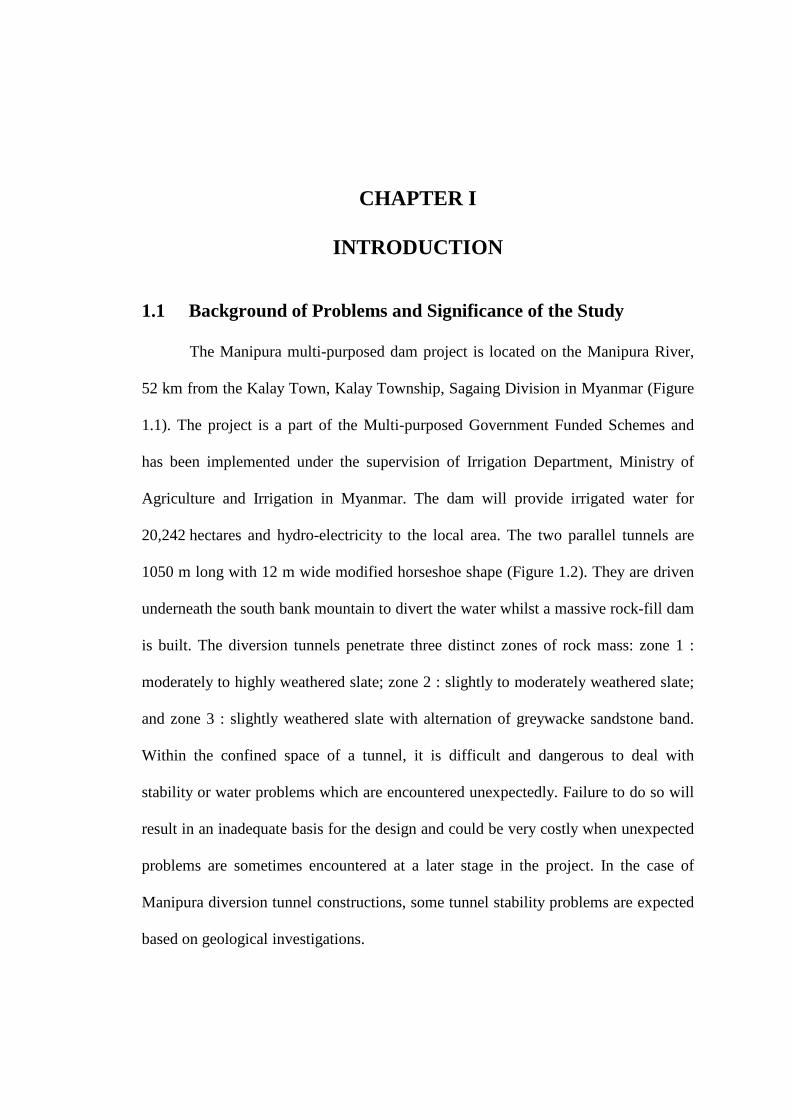
1.1 Background of Problems and Significance of the Study
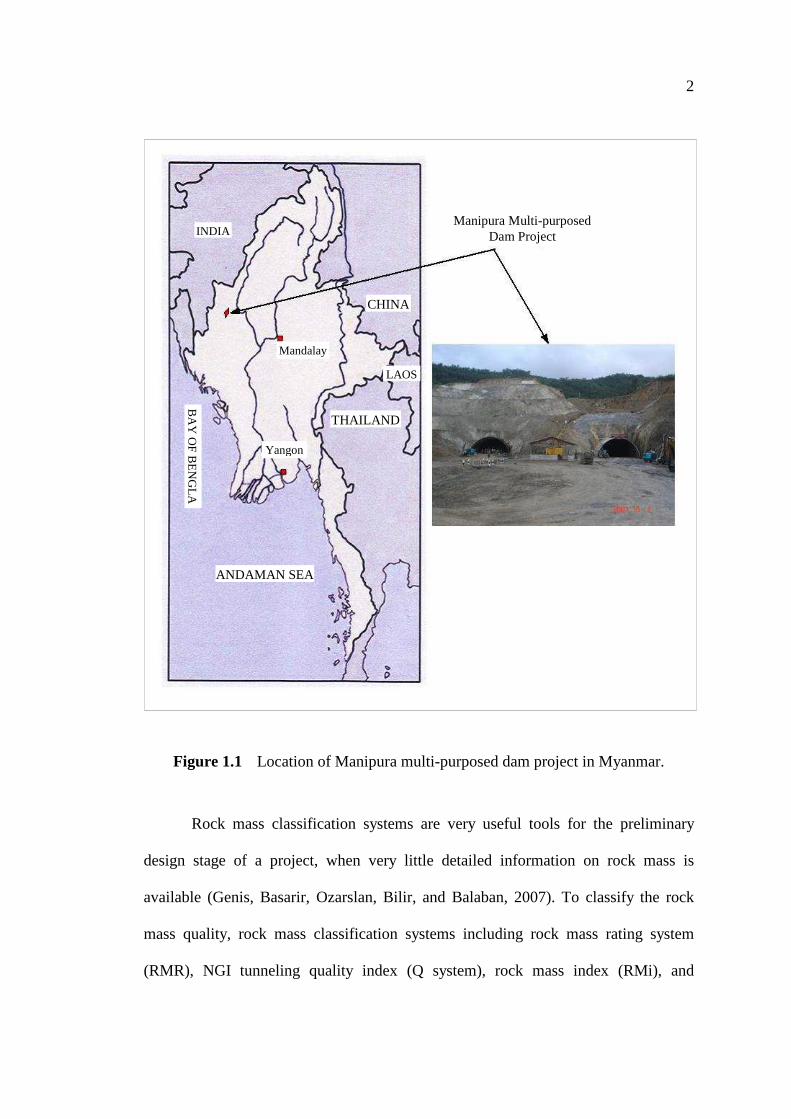
The Manipura multi-purposed dam project is located on the Manipura River,
52 km from the Kalay Town, Kalay Township, Sagaing Division in Myanmar (Figure
1.1). The project is a part of the Multi-purposed Government Funded Schemes and
has been implemented under the supervision of Irrigation Department, Ministry of
Agriculture and Irrigation in Myanmar. The dam will provide irrigated water for
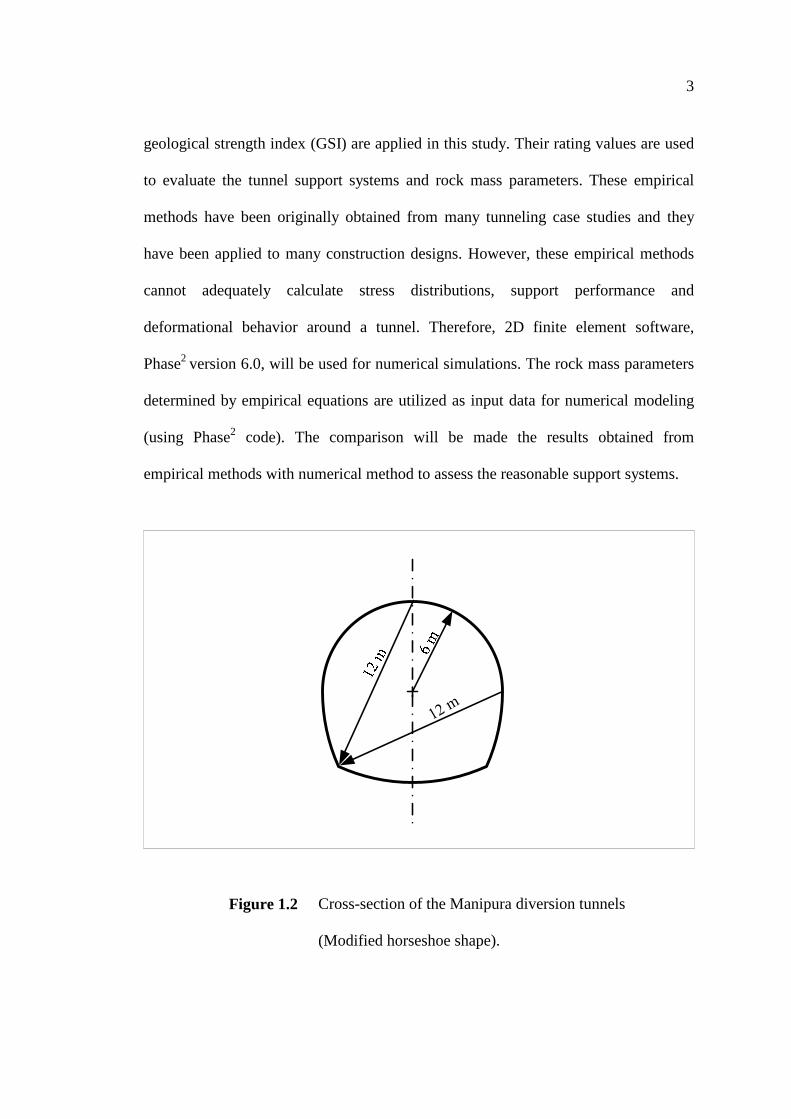
20,242 hectares and hydro-electricity to the local area. The two parallel tunnels are
1050 m long with 12 m wide modified horseshoe shape (Figure 1.2). They are driven
underneath the south bank mountain to divert the water whilst a massive rock-fill dam
is built. The diversion tunnels penetrate three distinct zones of rock mass: zone 1 :
moderately to highly weathered slate; zone 2 : slightly to moderately weathered slate;
and zone 3 : slightly weathered slate with alternation of greywacke sandstone band.
Within the confined space of a tunnel, it is difficult and dangerous to deal with
stability or water problems which are encountered unexpectedly. Failure to do so will
result in an inadequate basis for the design and could be very costly when unexpected
problems are sometimes encountered at a later stage in the project. In the case of
Manipura diversion tunnel constructions, some tunnel stability problems are expected
based on geological investigations.
2
Figure 1.1 Location of Manipura multi-purposed dam project in Myanmar.
Rock mass classification systems are very useful tools for the preliminary
design stage of a project, when very little detailed information on rock mass is
available (Genis, Basarir, Ozarslan, Bilir, and Balaban, 2007). To classify the rock
mass quality, rock mass classification systems including rock mass rating system
(RMR), NGI tunneling quality index (Q system), rock mass index (RMi), and
ANDAMAN SEA
THAILAND
CHINA
LAOS
INDIA
Mandalay
Yangon
BA
Y O
F B
EN
GL
A
Manipura Multi-purposed Dam Project
3
geological strength index (GSI) are applied in this study. Their rating values are used
to evaluate the tunnel support systems and rock mass parameters. These empirical
methods have been originally obtained from many tunneling case studies and they
have been applied to many construction designs. However, these empirical methods
cannot adequately calculate stress distributions, support performance and
deformational behavior around a tunnel. Therefore, 2D finite element software,
Phase2 version 6.0, will be used for numerical simulations. The rock mass parameters
determined by empirical equations are utilized as input data for numerical modeling
(using Phase2 code). The comparison will be made the results obtained from
empirical methods with numerical method to assess the reasonable support systems.
12 m
Figure 1.2 Cross-section of the Manipura diversion tunnels
(Modified horseshoe shape).
4
1.2 Research Objectives
The objective of the proposed research is to perform stability analysis and
support design for the two parallel diversion tunnels of the Manipura multi-purposed
dam project. The proposed research involves conducting a design methodology of the
actual diversion tunnel and comparing the support design results obtained from
empirical methods with numerical method. The effort comprises the characterizations
of rock mass by using rock mass classification systems, determination of input
parameters, stability analysis, support design by empirical approaches and numerical
method (using Phase2 code). The feasible support designs are assessed by comparing
the results with those obtained from the empirical and numerical methods.
1.3 Research Methodology
This research consists of six main tasks: literature review, geological data
collection, rock mass characterizations, geotechnical rock mass parameter estimation
and stability analysis, support design (empirical methods and numerical method) and
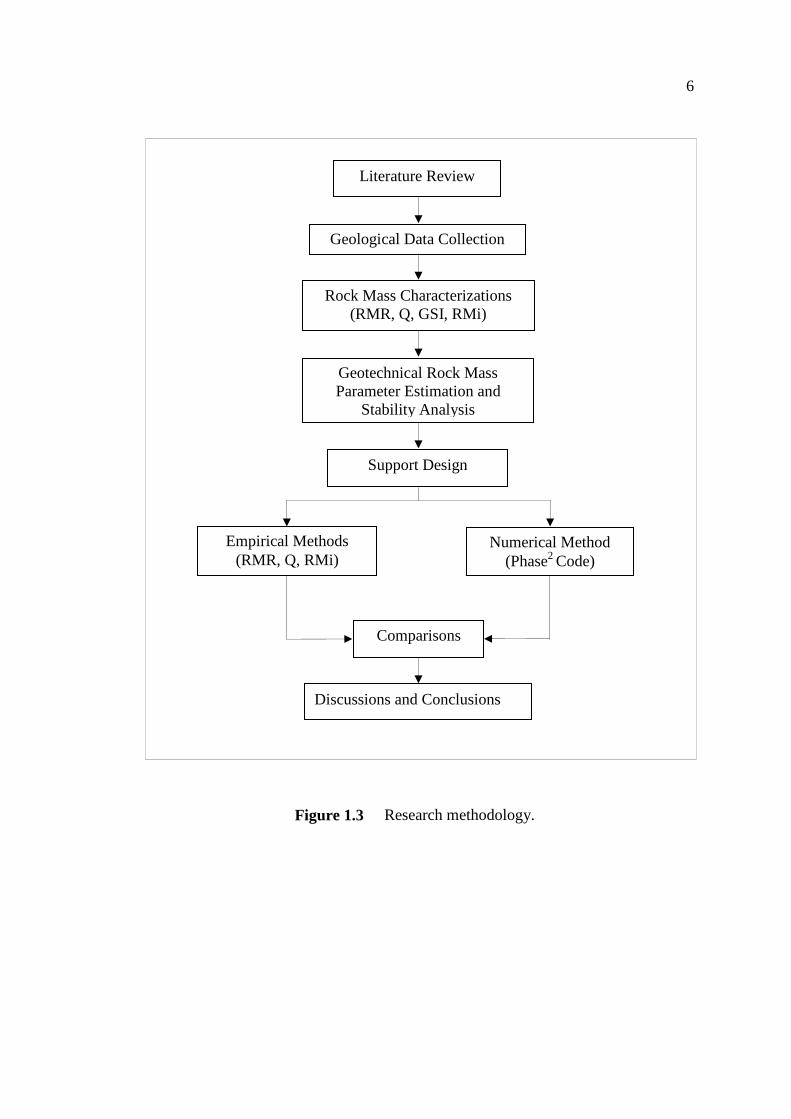
comparisons, and discussions, conclusions and thesis writing. The research
methodology is illustrated in Figure 1.3.
1.3.1 Literature Review
Literature review has been carried out to study the rock mass
classification systems, estimation of rock mass parameters and stability analysis,
determination of support systems by using empirical methods and numerical method
(using Phase2 code), and case studies in Myanmar. The sources of information are
from journals, technical reports and conference papers. A summary of the literature
review will be given in the thesis.
5
1.3.2 Geological Data Collection
Engineering Geology Office 2, Irrigation Department, Ministry of
Agriculture and Irrigation in Myanmar, carried out the preliminary geological
investigation in 2004 by drilling four vertical boreholes along the tunnel alignment
with total depth of 239 m and continuous investigations have been performed. The
geotechnical parameter evaluation of the Manipura diversion tunnels is relied on the
exploratory data, field observations and laboratory test results.
1.3.3 Rock Mass Characterizations
The rock masses along the tunnel alignment are classified by using the
rock mass classification systems; rock mass rating system (RMR), NGI tunneling
quality index (Q system), rock mass index (RMi), and geological strength index
(GSI). Their rating values are used to evaluate the rock mass parameters and support
designs for the Manipura diversion tunnels.
1.3.4 Geotechnical Rock Mass Parameter Estimation and
Stability Analysis
Geotechnical rock mass parameters such as Hoek and Brown
constants, deformation modulus of the rock mass and uniaxial compressive strength
of the rock mass are estimated by empirical equations. The stability for all sections of
the tunnels has been evaluated in terms of stand-up time of rock mass, estimation of
maximum unsupported span and safety factor.
6
Figure 1.3 Research methodology.
Geological Data Collection
Empirical Methods (RMR, Q, RMi)
Numerical Method (Phase2 Code)
Discussions and Conclusions
Literature Review
Support Design
Comparisons
Rock Mass Characterizations (RMR, Q, GSI, RMi)
Geotechnical Rock Mass Parameter Estimation and
Stability Analysis
7
1.3.5 Support Design and Comparisons
The empirical methods including rock mass rating system (RMR),
NGI tunneling quality index (Q system) and rock mass index (RMi) are used to
determine the support systems for the diversion tunnels dealing with their rating
values.
The performances of the support elements suggested from empirical
methods are analyzed by numerical method. A series of numerical simulations (using
Phase2 code) are performed to assess the stability conditions of the tunnels with and
without the support systems. Results obtained from empirical methods are compared
with the support systems obtained from the numerical method (Phase2 code).
1.3.6 Discussions, Conclusions and Thesis Writing
The research results will be concluded and provided the recommended
support systems for the Manipura diversion tunnels.
All research activities, methods, and results will be documented and
complied in the thesis. The research or findings will be published in the conferences,
proceedings or journals.
1.4 Scope and Limitations of the Study
Extensive literature review of the design methodology of the Manipura
diversion tunnels is conducted. The shapes of the Manipura diversion tunnels are
modified horseshoe shape. The engineering geological properties of the two tunnels
are assumed the same. The two tunnels have been constructed by using drill-and-blast
technique. The geological investigation of the Manipura diversion tunnels is relied on
8
the exploratory data, field observations and laboratory test results. The comparison of
the results obtained from empirical methods and numerical method will be made.
1.5 Thesis Contents
Chapter I introduces the thesis by briefly describing the background of
problems and significance of the study. The research objectives, methodology, scope
and limitations are identified. Chapter II summarizes the results of the literature
review. Chapter III describes the geological data collection including geology of the
project area, engineering geology and laboratory test results. Chapter IV presents the
characterizations of rock mass by using rock mass classification systems. Chapter V
discusses the estimation of geotechnical rock mass parameters by using empirical
equations and stability analysis. Chapter VI describes the evaluation of support
designs for the diversion tunnels. Estimating the feasible support designs of the
tunnels are divided into 3 tests, including (1) support designs by using empirical
methods, (2) numerical simulations (using Phase2 code), and (3) comparisons the
results obtained from empirical methods with numerical method. Chapter VII
concludes the research results and provides recommendations for future research
studies.
.
CHAPTER II
LITERATURE REVIEW
2.1 Introduction
This chapter summarizes the results of literature review carried out to improve
an understanding of rock mass characterizations, stability analysis and support design
of tunnels. Topics relevant to this research involve rock mass classification systems
including rock mass rating system (RMR), NGI tunneling quality index (Q system),
geological strength index (GSI), and rock mass index (RMi), Deere’s rock quality
designation (RQD), numerical modeling (Phase2 code) and published papers.
2.2 Rock Mass Classification Systems
The rock mass characterization processes are normally used to assess the rock
mass quality in accordance with the existing engineering rock mass classification
systems. The result becomes effective parameters for the application of the tunnel
stability and design. The four methods of quantitative rock mass classification
systems including rock mass rating system (RMR), NGI tunneling quality index (Q
system), geological strength index (GSI), and rock mass index (RMi) will be applied
in this research.
10
2.2.1 Rock Mass Rating System (RMR)
Bieniswski (1973) initially developed the rock mass rating system
(RMR), otherwise known as the geomechanics classification. It was modified over the
years as more case histories, became available and to conform to international
standards and procedures (Bieniawski, 1979).
Bieniawski provided the system as the most common quantitative
method for describing the quality of the rock mass for tunneling. Uniaxial
compressive strength of intact rock (UCS), rock quality designation (RQD), spacing
of discontinuities, conditions of discontinuities, ground water condition and
orientation of discontinuities are utilized parameters. After the determination of the
important ratings of the each parameter, they are summed to describe the basic RMR
rating of the rock mass. In tunneling, the rating value must be made adjustment for
discontinuity orientation. The rock mass rating classification table (Bieniawski, 1989)
will be used in this research. Bienawski (1979) has described a chart to check the
stand-up time of rock mass and to estimate maximum unsupported span of
underground openings. In 1989, Bieniawski has provided guidelines for the selection
of rock support for horseshoe shaped tunnel excavated by the drill-and-blast
technique.
2.2.2 NGI Tunneling Quality Index (Q system)
The Q system of rock mass classification was developed in Norway by
Barton, Lien, and Lunde (1974), all of the Norwegian Geotechnical Institute. Its
development represented a major contribution to the subject of rock mass
classification for a number of reasons: the system was proposed based on the analysis
of 212 tunnel case histories from Scandinavia, it is a quantitative classification system
11
and it is an engineering system facilitating the design of tunnel supports. The Q
system is based on a numerical assessment of the rock mass quality using six different
parameters:
1) Rock quality designation
2) Joint set number
3) Joint roughness number
4) Joint alternation number
5) Joint water reduction number
6) Stress reduction factor
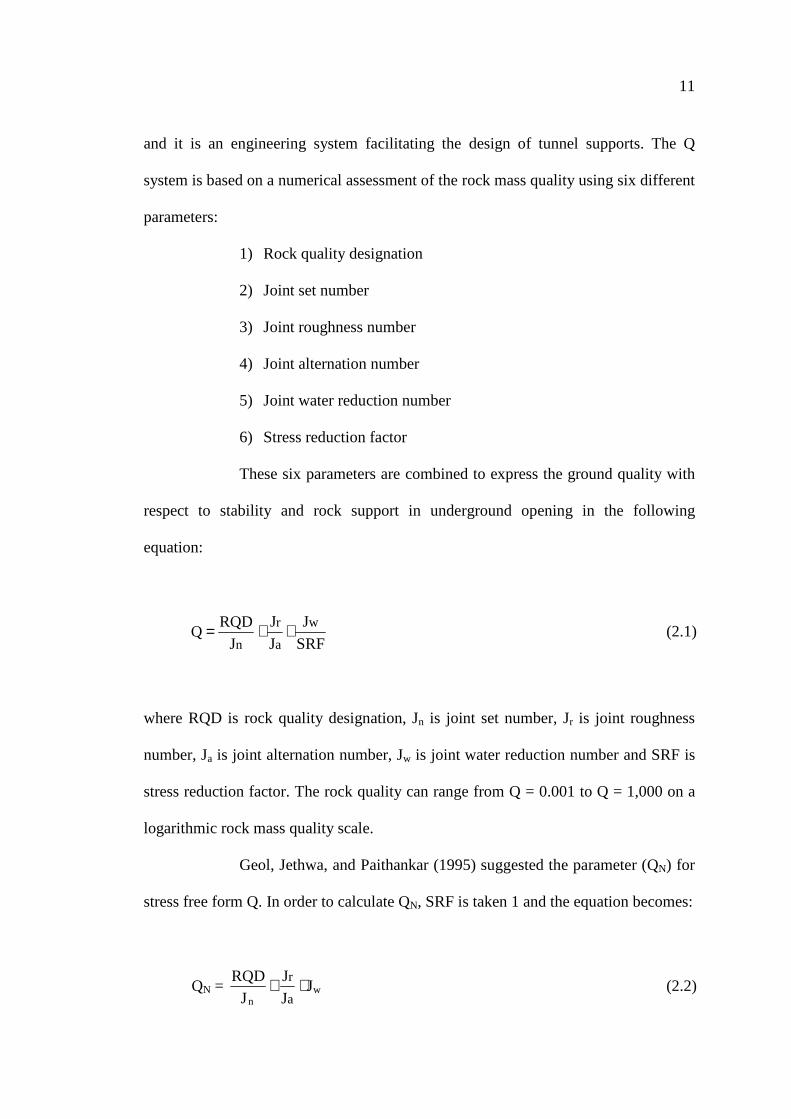
These six parameters are combined to express the ground quality with
respect to stability and rock support in underground opening in the following
equation:
nJ
RQDQ = ⋅
a
r
J
J ⋅ SRF
Jw (2.1)
where RQD is rock quality designation, Jn is joint set number, Jr is joint roughness
number, Ja is joint alternation number, Jw is joint water reduction number and SRF is
stress reduction factor. The rock quality can range from Q = 0.001 to Q = 1,000 on a
logarithmic rock mass quality scale.
Geol, Jethwa, and Paithankar (1995) suggested the parameter (QN) for
stress free form Q. In order to calculate QN, SRF is taken 1 and the equation becomes:
QN = nJ
RQD ⋅ a
r
J
J ⋅ Jw (2.2)
12
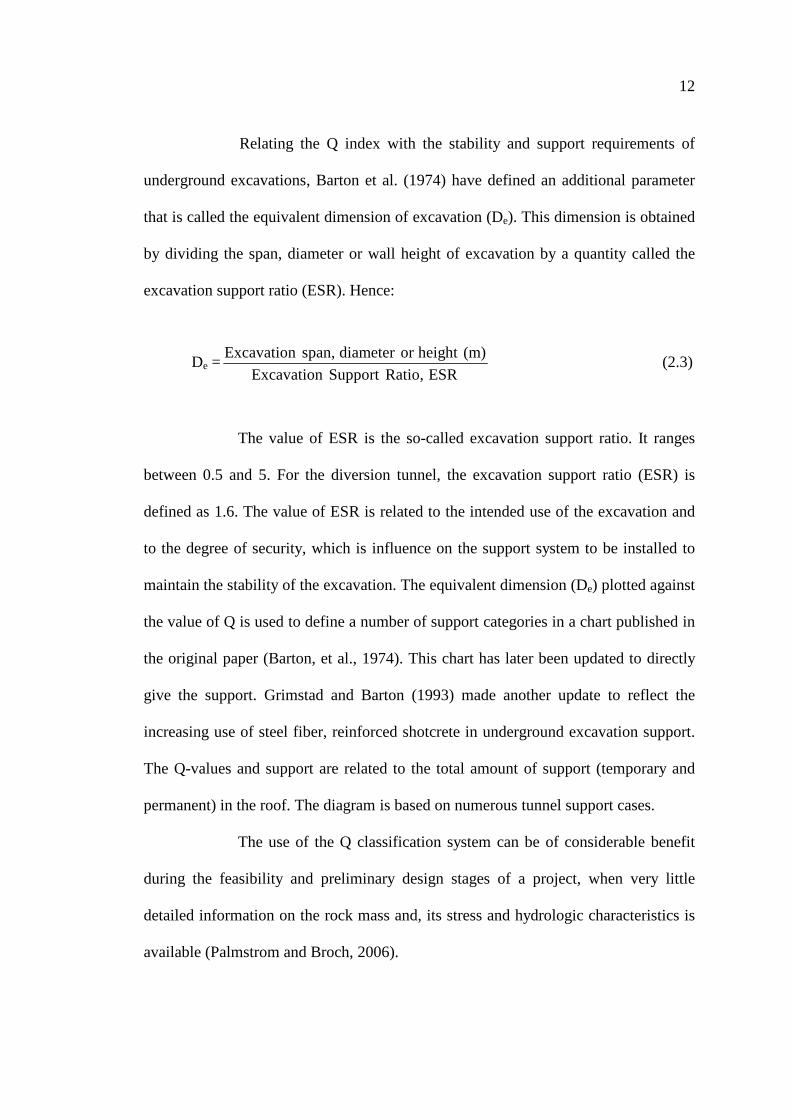
Relating the Q index with the stability and support requirements of
underground excavations, Barton et al. (1974) have defined an additional parameter
that is called the equivalent dimension of excavation (De). This dimension is obtained
by dividing the span, diameter or wall height of excavation by a quantity called the
excavation support ratio (ESR). Hence:
De =ESR Ratio,Support Excavation
(m)height or diameter span, Excavation (2.3)
The value of ESR is the so-called excavation support ratio. It ranges
between 0.5 and 5. For the diversion tunnel, the excavation support ratio (ESR) is
defined as 1.6. The value of ESR is related to the intended use of the excavation and
to the degree of security, which is influence on the support system to be installed to
maintain the stability of the excavation. The equivalent dimension (De) plotted against
the value of Q is used to define a number of support categories in a chart published in
the original paper (Barton, et al., 1974). This chart has later been updated to directly
give the support. Grimstad and Barton (1993) made another update to reflect the
increasing use of steel fiber, reinforced shotcrete in underground excavation support.
The Q-values and support are related to the total amount of support (temporary and
permanent) in the roof. The diagram is based on numerous tunnel support cases.
The use of the Q classification system can be of considerable benefit
during the feasibility and preliminary design stages of a project, when very little
detailed information on the rock mass and, its stress and hydrologic characteristics is
available (Palmstrom and Broch, 2006).
13
2.2.3 Rock Mass Index (RMi)
The rock mass index (RMi) was first presented by Palmstrom in 1995
and has been further developed and presented in several papers. It is a volumetric
parameter indicating the approximate uniaxial compressive strength of a rock mass.
The RMi value is applied as input for estimating rock support and input to other rock
engineering methods (Palmstrom, 2009). The RMi system has some input parameters
similar to those of the Q system. Thus, the joint and jointing features are almost the
same.
The input parameters used can be determined by commonly used field
observations and measurements. The RMi value can be calculated as follow:
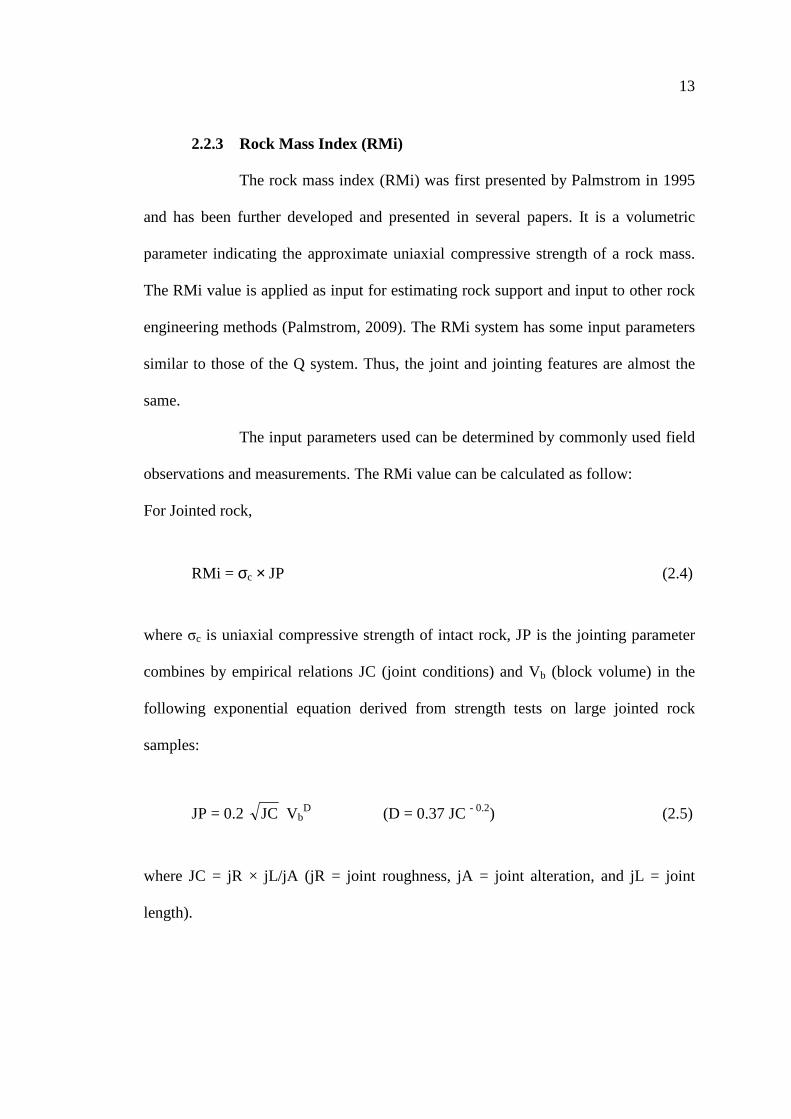
For Jointed rock,
RMi = σc × JP (2.4)
where σc is uniaxial compressive strength of intact rock, JP is the jointing parameter
combines by empirical relations JC (joint conditions) and Vb (block volume) in the
following exponential equation derived from strength tests on large jointed rock
samples:
JP = 0.2 JC VbD (D = 0.37 JC - 0.2) (2.5)
where JC = jR × jL/jA (jR = joint roughness, jA = joint alteration, and jL = joint
length).
14
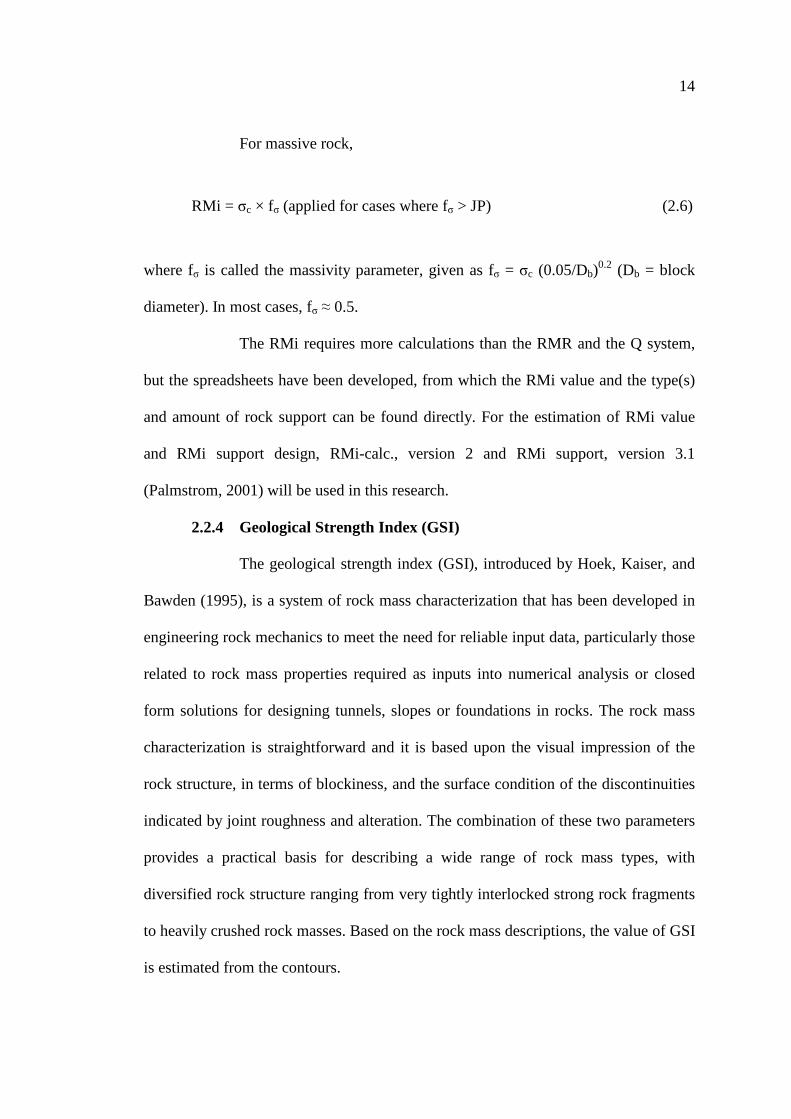
For massive rock,
RMi = σc × fσ (applied for cases where fσ > JP) (2.6)
where fσ is called the massivity parameter, given as fσ = σc (0.05/Db)0.2 (Db = block
diameter). In most cases, fσ ≈ 0.5.
The RMi requires more calculations than the RMR and the Q system,
but the spreadsheets have been developed, from which the RMi value and the type(s)
and amount of rock support can be found directly. For the estimation of RMi value
and RMi support design, RMi-calc., version 2 and RMi support, version 3.1
(Palmstrom, 2001) will be used in this research.
2.2.4 Geological Strength Index (GSI)
The geological strength index (GSI), introduced by Hoek, Kaiser, and
Bawden (1995), is a system of rock mass characterization that has been developed in
engineering rock mechanics to meet the need for reliable input data, particularly those
related to rock mass properties required as inputs into numerical analysis or closed
form solutions for designing tunnels, slopes or foundations in rocks. The rock mass
characterization is straightforward and it is based upon the visual impression of the
rock structure, in terms of blockiness, and the surface condition of the discontinuities
indicated by joint roughness and alteration. The combination of these two parameters
provides a practical basis for describing a wide range of rock mass types, with
diversified rock structure ranging from very tightly interlocked strong rock fragments
to heavily crushed rock masses. Based on the rock mass descriptions, the value of GSI
is estimated from the contours.
15
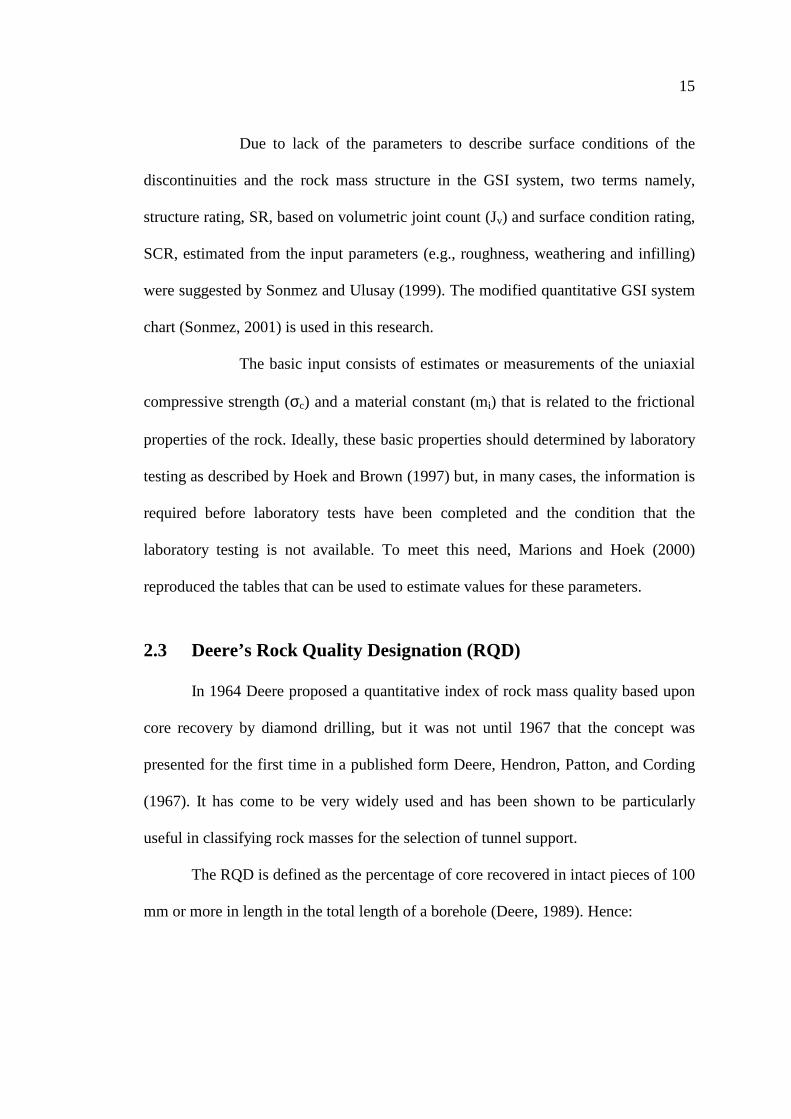
Due to lack of the parameters to describe surface conditions of the
discontinuities and the rock mass structure in the GSI system, two terms namely,
structure rating, SR, based on volumetric joint count (Jv) and surface condition rating,
SCR, estimated from the input parameters (e.g., roughness, weathering and infilling)
were suggested by Sonmez and Ulusay (1999). The modified quantitative GSI system
chart (Sonmez, 2001) is used in this research.
The basic input consists of estimates or measurements of the uniaxial
compressive strength (σc) and a material constant (mi) that is related to the frictional
properties of the rock. Ideally, these basic properties should determined by laboratory
testing as described by Hoek and Brown (1997) but, in many cases, the information is
required before laboratory tests have been completed and the condition that the
laboratory testing is not available. To meet this need, Marions and Hoek (2000)
reproduced the tables that can be used to estimate values for these parameters.
2.3 Deere’s Rock Quality Designation (RQD)
In 1964 Deere proposed a quantitative index of rock mass quality based upon
core recovery by diamond drilling, but it was not until 1967 that the concept was
presented for the first time in a published form Deere, Hendron, Patton, and Cording
(1967). It has come to be very widely used and has been shown to be particularly
useful in classifying rock masses for the selection of tunnel support.
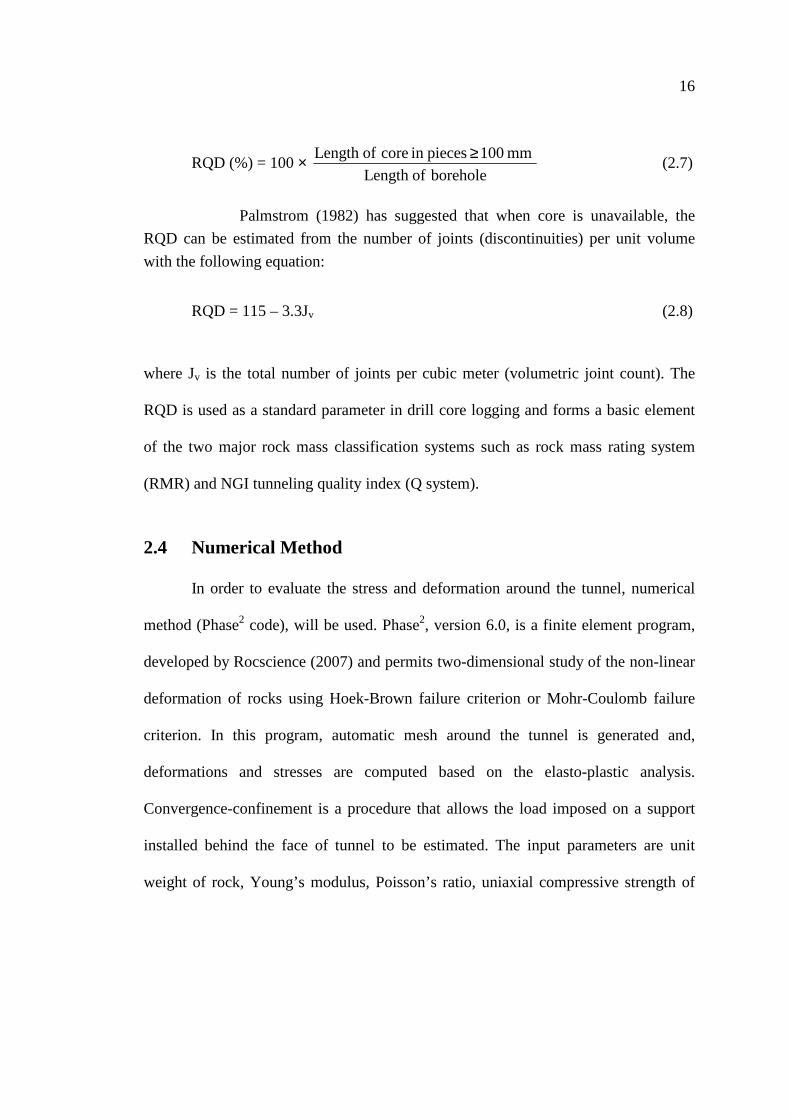
The RQD is defined as the percentage of core recovered in intact pieces of 100
mm or more in length in the total length of a borehole (Deere, 1989). Hence:
16
RQD (%) = 100 × borehole ofLength
mm 100 piecesin core ofLength ≥ (2.7)
Palmstrom (1982) has suggested that when core is unavailable, the
RQD can be estimated from the number of joints (discontinuities) per unit volume
with the following equation:
RQD = 115 – 3.3Jv (2.8)
where Jv is the total number of joints per cubic meter (volumetric joint count). The
RQD is used as a standard parameter in drill core logging and forms a basic element
of the two major rock mass classification systems such as rock mass rating system
(RMR) and NGI tunneling quality index (Q system).
2.4 Numerical Method
In order to evaluate the stress and deformation around the tunnel, numerical
method (Phase2 code), will be used. Phase2, version 6.0, is a finite element program,
developed by Rocscience (2007) and permits two-dimensional study of the non-linear
deformation of rocks using Hoek-Brown failure criterion or Mohr-Coulomb failure
criterion. In this program, automatic mesh around the tunnel is generated and,
deformations and stresses are computed based on the elasto-plastic analysis.
Convergence-confinement is a procedure that allows the load imposed on a support
installed behind the face of tunnel to be estimated. The input parameters are unit
weight of rock, Young’s modulus, Poisson’s ratio, uniaxial compressive strength of
17
intact rock, in-situ stresses, Hoek-Brown constants or Mohr-Coulomb constants and
tunnel radius.
2.5 Review of Papers
Basarir, Ozsan, and Karakus (2005) suggested that more reliable support
design could be achieved by using the finite element method together with the
empirical methods. A case study was carried out at the diversion tunnel project of
Guledar dam site, which was located at the North of Ankara, Turkey. Based on the
collected information in the field and rock properties determined in the laboratory,
rock masses were characterized by means of rock mass classification systems (RMR,
Q, RMi and GSI). These classification systems were also employed to estimate
support requirements for the diversion tunnel. Convergence-confinement method was
employed to perform stability analysis. Based upon the performed stability analysis it
was decided to use the support systems recommended by rock mass classification
systems. Finite element analysis was utilized to assess the stability of the tunnel and
evaluate the performance of support recommended by the empirical methods. The
strength parameters necessary for finite element analysis were estimated from the
empirical methods and input into the finite element code (Phase2).
The empirical methods recommend the utilization of bolt and shotcrete as
support elements for sandstone formation at Guledar diversion tunnel project.
Convergence-confinement and numerical methods showed that small deformations
occur and a limited plastic zone develops around the tunnel. When the recommended
support systems by the empirical methods were applied, these yielded elements
disappeared in the finite element analysis. The empirical methods indicate that
18
substantial support was necessary for diabase formation and both convergence-
confinement and numerical methods agreed that the size of the plastic zone and the
deformations increase and reach their maximum values for this formation. However,
after installation of support elements recommended by the empirical method, the
finite element analysis showed that there was not any yielded element and plastic
zone around the tunnel. The results proved that the empirical and numerical methods
agree with each other. Thus, it is suggested that when designing a support system for
a tunnel driven in rock mass, empirical and numerical methods are to be used together
(Basarir, et al., 2005). However, the validity of the proposed support system, obtained
from combination of empirical and numerical modeling should be verified by
comparing predictions with actual measurements during construction.
Ozsan and Basaria (2002) carried out the support capacity estimation of the
diversion tunnel at Urus dam site located in the central part of Turkey on the Suveri
River. The project area is in weathered tuff and weak zone. Tunneling in weak rock
requires some special considerations, since misjudgment in support design results in
costly failures. There are several ways of estimating rock support pressure and
selecting support. However, all systems suffer from their characteristic limitations in
achieving objectives. Thus, it is more useful to use different methods for estimating
support pressure and type of support. The support pressure (pi) was established by
three different methods. These methods are the (1) empirical methods based on rock
mass rating system (RMR) and rock mass quality index (Q system), (2) ground
support interaction analysis (GSIA) and (3) numerical methods, namely, Phase2 finite
element program. Rock masses were characterized in terms of RSR, RMR, Q system
19
and GSI. Finally, the required support system was proposed and evaluated by
different methods in the highly weathered tuff and weak zone of the diversion tunnel.
Oo (2003) evaluated the rock mass quality and estimated support design of Ye
Nwe diversion tunnel by using rock mass classification systems. The project is
located on Ye Nwe River, near Myochaung village, Kyauktaga Township, Bago
Diversion, Myanmar. The four methods of engineering rock mass classification
schemes, RMR, Q, RMi and GSI, are independently applied to assess the geological
input data with practical experience and engineering judgment. According to the
engineering geological data obtained from those characterizations, the rock mass
quality is defined as the assigned rating values, which enable to evaluate the in-situ
rock mass strength, deformation modulus, Mohr-coulomb parameters and Hoek-
Brown parameters. The rock mass strength was estimated by the empirical method.
The required initial rock support for each structural region have been recommended
by RMR, Q and RMi, and then correlated with each other.
Rasouli (2009) studied at Garmi Chay Diversion Tunnels Project in the
northwest of Iran focusing on stabilization analysis and support design. The diversion
tunnel of the dam has a diameter of 5.5 m and a length of 420 m and was driven in
slightly to highly weathered micaschist and trachy andesite rock units. The tunnel
alignment was divided into three geotechnical zones. For every zone, support capacity
of rock masses was evaluated by means of empirical and numerical methods. The
rock mass classification systems (RMR, Q, GSI, RSR, SRC and RMi), the
convergence-confinement method and a 2D finite element computer software, Phase2
were used for empirical and numerical method, respectively. According to the results
acquired from these methods, some stability problems were expected in the tunnel.
20
The support system, suggested by empirical method, was applied and its
performance was evaluated by means of numerical modeling. After installation, the
support suggested by Phase2 program, the thickness of plastic zone and deformations
around the tunnel decreased significantly. Consequently, the agreement of these
methods with each other was resulted and using combination of them was
recommended for more reliable support design (Rasouli, 2009).
CHAPTER III
GEOLOGICAL DATA COLLECTION
3.1 Introduction
The careful exploration of local engineering geological conditions is an
important phase of investigation for tunneling. It is a prerequisite to the successful
and optimized design of engineering structures and underground excavations.
Accordingly, a site investigation can foresee and provide against difficulties that may
arise during construction because of the uncertainties of the ground and/or other local
conditions. Investigation should not cease once construction begins. It is essential that
the prediction of ground conditions that constitute the basic design assumption be
checked as construction proceeds and designs modified accordingly if conditions are
revealed to be different from those predicted. In the case of the Manipura diversion
tunnel constructions, four vertical boreholes along the tunnel alignment with total
depth of 239 m were drilled by Engineering Geology Office 2, Irrigation Department,
Ministry of Agriculture and Irrigation, Myanmar, as a preliminary geological
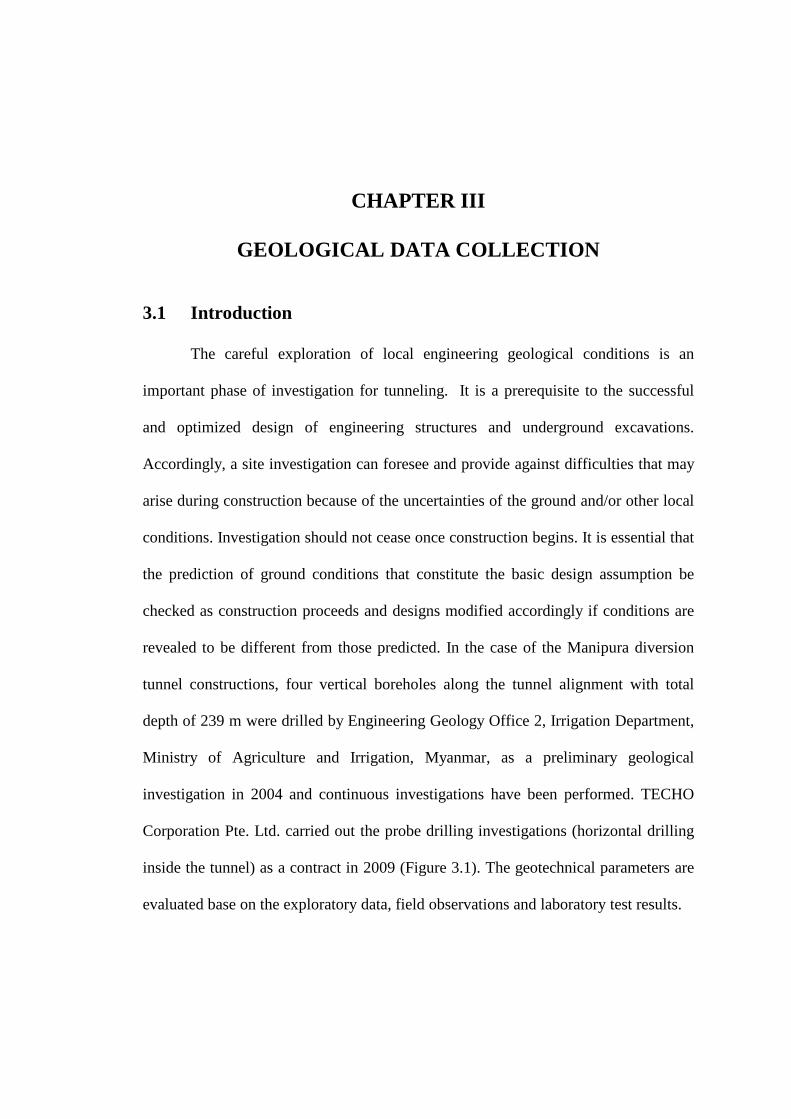
investigation in 2004 and continuous investigations have been performed. TECHO
Corporation Pte. Ltd. carried out the probe drilling investigations (horizontal drilling
inside the tunnel) as a contract in 2009 (Figure 3.1). The geotechnical parameters are
evaluated base on the exploratory data, field observations and laboratory test results.
22
Figure 3.1 Probe drilling investigation by TECHO Corporation Pte. Ltd.
3.2 Geology of Project Area
The tunnels are in the Chin Flysch aged of Tertiary as a part of the Rakhine-
Chin-Naga Hill ranges (Win and Aung, 2007). Most of the main Rakhine-Chin-Naga
Hill ranges are a thick monotonous series of apparently unfossiliferous marine flysch-
type sediments including slaty shales, phyllite, slates and poorly-graded calcareous
sandstones.
Rock sequence in the project area, known as the Chin Flysch, is folded tightly,
and even isoclinally. Quartz and calcite veins are very common. The sequence is
predominantly argillaceous (slate), consisting mainly of yellowish grey to dark grey,
23
hard, locally ferruginous and calcareous. Slate, the major rock unit, is fine grained
metamorphic rock derived mostly from shale. Approximately 20 to 25% of the
sequence consists of hard bedded greywackes sandstone, usually find-grained and
locally micaceous and calcareous.
3.3 Engineering Geology
Geological data collection is carried out to classify the rock mass as
accurately as possible. It is necessary that every effort should be made to obtain
complete characteristics of the rock mass at an early stage of the project. The given
sufficient warning of a potential problem, the engineer can usually provide a solution
by supporting or reinforcing the rock mass around the opening or by providing
drainage or diverting accumulations of ground water. Therefore, the integrated
geological data can assist in the design solution and anticipate any unfavorable
geological condition, which can give rise to problem during the excavation of the
openings.
Engineering geological descriptions of the rock masses are based on the
procedures suggested by ISRM (1981). In this study, special emphasis is given to the
characteristics of the discontinuities and to the degree of weathering, each of which
has an influence on the engineering properties of rock mass. Folds and joints are the
most dominant structural discontinuities observed in the study area. The major trend
of the joint is 320/60 (strike/dip) and the tunnel direction is N60E (Win and Aung,
2007). The strike of the joints and tunnel axis are nearly perpendicular. The area
shows varying weathering grades of rock. Near ground surface, rocks are highly to
completely weathered extending to a depth of 20 – 30 m. The geological cross-
section along the tunnel alignment is drawn based on the borehole results, surface
24
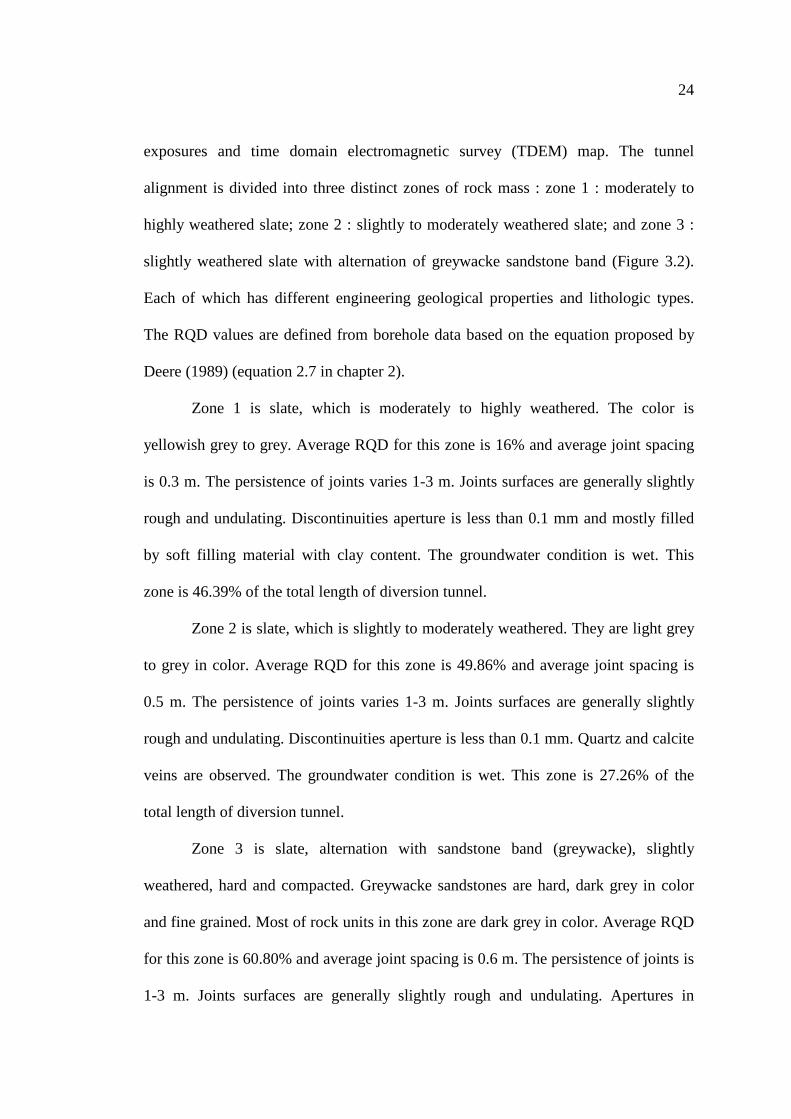
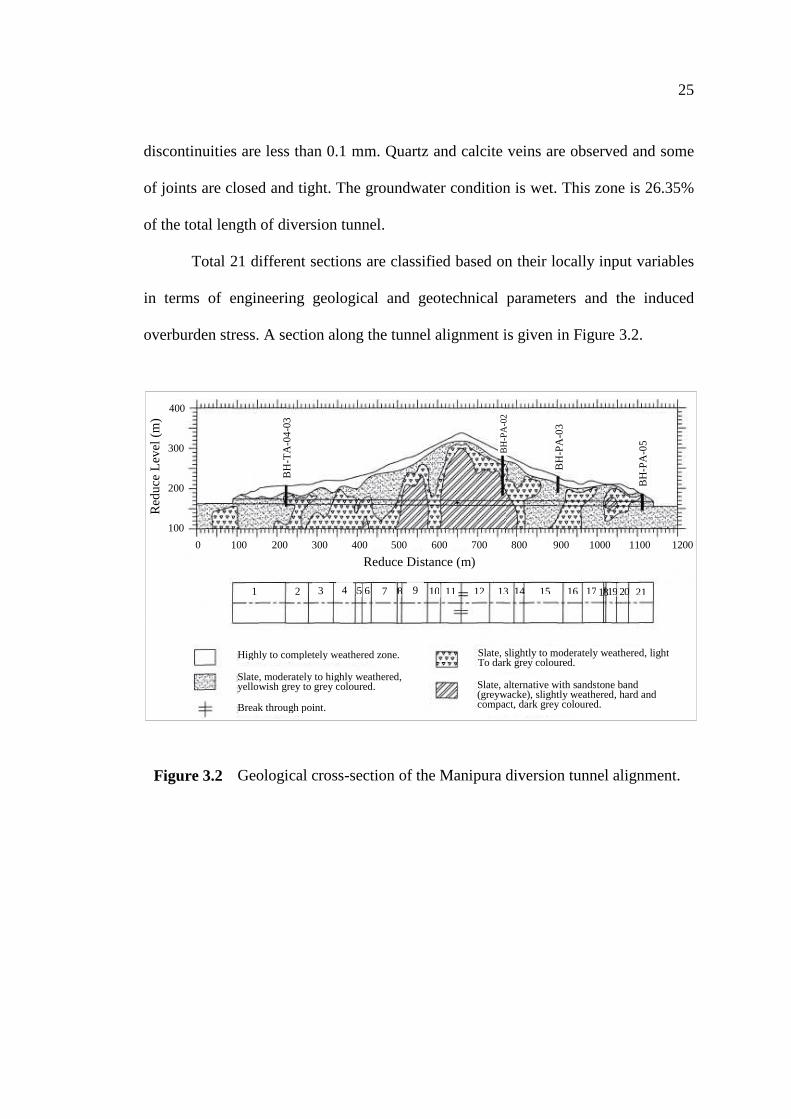
exposures and time domain electromagnetic survey (TDEM) map. The tunnel
alignment is divided into three distinct zones of rock mass : zone 1 : moderately to
highly weathered slate; zone 2 : slightly to moderately weathered slate; and zone 3 :
slightly weathered slate with alternation of greywacke sandstone band (Figure 3.2).
Each of which has different engineering geological properties and lithologic types.
The RQD values are defined from borehole data based on the equation proposed by
Deere (1989) (equation 2.7 in chapter 2).
Zone 1 is slate, which is moderately to highly weathered. The color is
yellowish grey to grey. Average RQD for this zone is 16% and average joint spacing
is 0.3 m. The persistence of joints varies 1-3 m. Joints surfaces are generally slightly
rough and undulating. Discontinuities aperture is less than 0.1 mm and mostly filled
by soft filling material with clay content. The groundwater condition is wet. This
zone is 46.39% of the total length of diversion tunnel.
Zone 2 is slate, which is slightly to moderately weathered. They are light grey
to grey in color. Average RQD for this zone is 49.86% and average joint spacing is
0.5 m. The persistence of joints varies 1-3 m. Joints surfaces are generally slightly
rough and undulating. Discontinuities aperture is less than 0.1 mm. Quartz and calcite
veins are observed. The groundwater condition is wet. This zone is 27.26% of the
total length of diversion tunnel.
Zone 3 is slate, alternation with sandstone band (greywacke), slightly
weathered, hard and compacted. Greywacke sandstones are hard, dark grey in color
and fine grained. Most of rock units in this zone are dark grey in color. Average RQD
for this zone is 60.80% and average joint spacing is 0.6 m. The persistence of joints is
1-3 m. Joints surfaces are generally slightly rough and undulating. Apertures in
25
discontinuities are less than 0.1 mm. Quartz and calcite veins are observed and some
of joints are closed and tight. The groundwater condition is wet. This zone is 26.35%
of the total length of diversion tunnel.
Total 21 different sections are classified based on their locally input variables
in terms of engineering geological and geotechnical parameters and the induced
overburden stress. A section along the tunnel alignment is given in Figure 3.2.
Figure 3.2 Geological cross-section of the Manipura diversion tunnel alignment.
Red
uce
Lev
el (
m)
Reduce Distance (m)
400
300
200
100
100 200 300 400 500 600 700 800 900 1000 1100 1200 0
BH
-TA
-04-
03
BH
-PA
-02
BH
-PA
-03
BH
-PA
-05
7 9 11 12 13 15 16 17 21 6
Highly to completely weathered zone.
Slate, moderately to highly weathered, yellowish grey to grey coloured. Break through point.
Slate, slightly to moderately weathered, light To dark grey coloured. Slate, alternative with sandstone band (greywacke), slightly weathered, hard and compact, dark grey coloured.
1 2 3 4 5 8 10 14 18 19 20
26
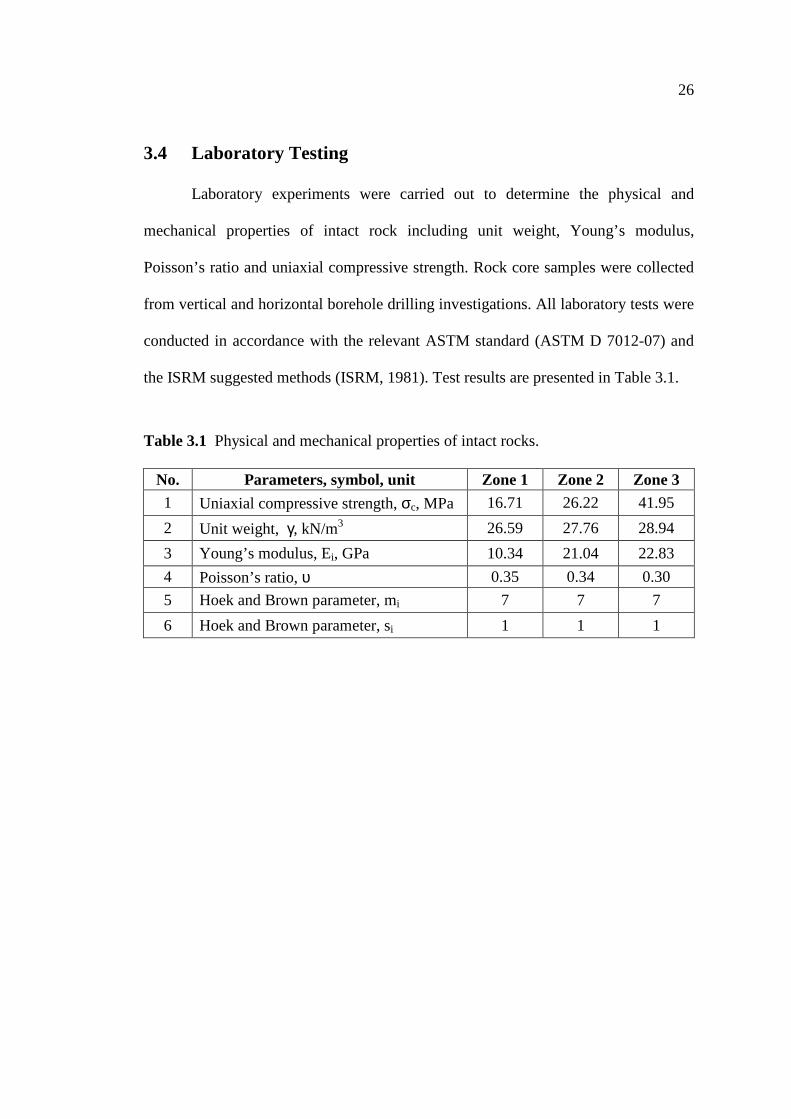
3.4 Laboratory Testing
Laboratory experiments were carried out to determine the physical and
mechanical properties of intact rock including unit weight, Young’s modulus,
Poisson’s ratio and uniaxial compressive strength. Rock core samples were collected
from vertical and horizontal borehole drilling investigations. All laboratory tests were
conducted in accordance with the relevant ASTM standard (ASTM D 7012-07) and
the ISRM suggested methods (ISRM, 1981). Test results are presented in Table 3.1.
Table 3.1 Physical and mechanical properties of intact rocks.
No. Parameters, symbol, unit Zone 1 Zone 2 Zone 3 1 Uniaxial compressive strength, σc, MPa 16.71 26.22 41.95
2 Unit weight, γ, kN/m3 26.59 27.76 28.94
3 Young’s modulus, Ei, GPa 10.34 21.04 22.83
4 Poisson’s ratio, υ 0.35 0.34 0.30
5 Hoek and Brown parameter, mi 7 7 7
6 Hoek and Brown parameter, si 1 1 1
CHAPTER IV
ROCK MASS CHARACTERIZATIONS
4.1 Introduction
This chapter describes the characterizations of rock mass around the proposed
tunnels by using rock mass classification systems and comparison of the rock mass
classification results. Rock mass classification schemes have been developing for
over 100 years since Ritter (1879) attempted to formalize an empirical approach to
tunnel design, in particular for determining support requirements. Rock mass
classification systems evaluate the quality and expected behavior of rock masses
based on the most important parameters that influence the rock mass quality.
Therefore, the rock mass characterization has been performed to access the rock
mass quality in accordance with the existing engineering rock mass classification
systems.
Rock masses along the tunnel alignment are classified by four individual rock
mass classification systems including rock mass rating system (RMR), NGI tunneling
quality index (Q system), rock mass index (RMi) and geological strength index (GSI).
The required input parameters and engineering geological properties for the rock
mass classification systems are described in chapter 3.
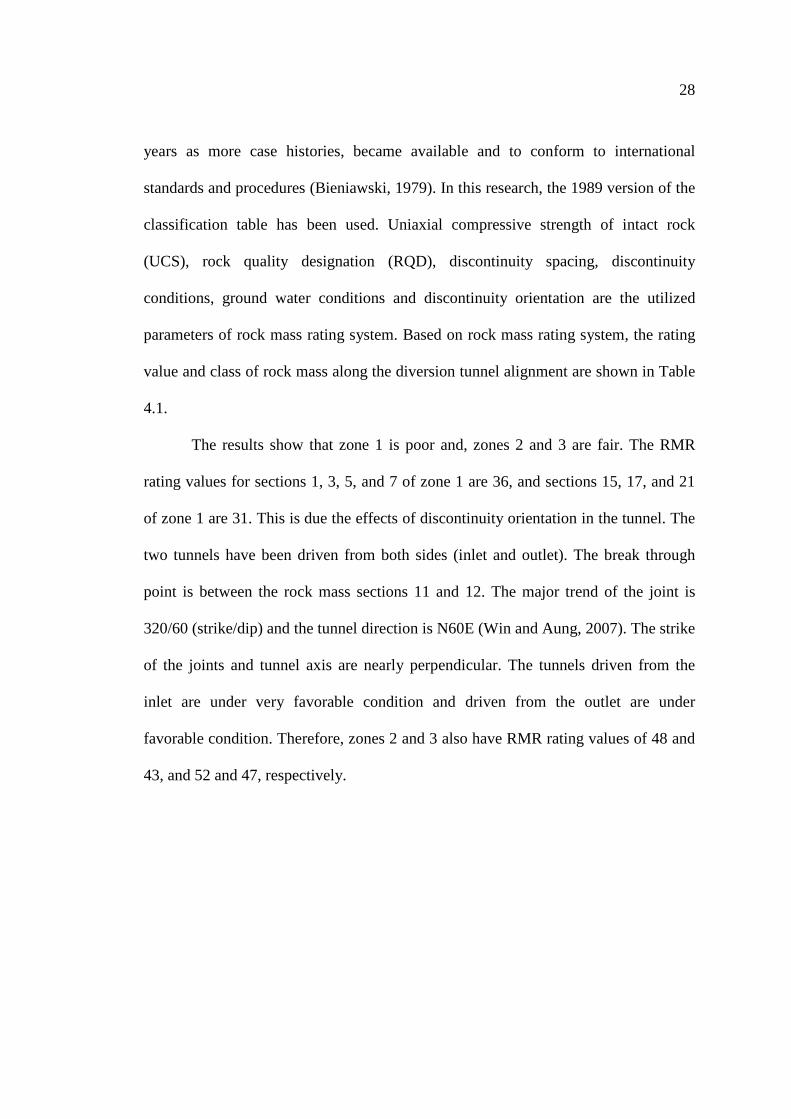
4.2 Rock Mass Rating System (RMR)
The rock mass rating system was initially developed by Bieniawski (1973),
otherwise known as geomechanics classification system. It was modified over the
28
years as more case histories, became available and to conform to international
standards and procedures (Bieniawski, 1979). In this research, the 1989 version of the
classification table has been used. Uniaxial compressive strength of intact rock
(UCS), rock quality designation (RQD), discontinuity spacing, discontinuity
conditions, ground water conditions and discontinuity orientation are the utilized
parameters of rock mass rating system. Based on rock mass rating system, the rating
value and class of rock mass along the diversion tunnel alignment are shown in Table
4.1.
The results show that zone 1 is poor and, zones 2 and 3 are fair. The RMR
rating values for sections 1, 3, 5, and 7 of zone 1 are 36, and sections 15, 17, and 21
of zone 1 are 31. This is due the effects of discontinuity orientation in the tunnel. The
two tunnels have been driven from both sides (inlet and outlet). The break through
point is between the rock mass sections 11 and 12. The major trend of the joint is
320/60 (strike/dip) and the tunnel direction is N60E (Win and Aung, 2007). The strike
of the joints and tunnel axis are nearly perpendicular. The tunnels driven from the
inlet are under very favorable condition and driven from the outlet are under
favorable condition. Therefore, zones 2 and 3 also have RMR rating values of 48 and
43, and 52 and 47, respectively.
29
Table 4.1 Rock mass rating value and class of rock mass along the Manipura
diversion tunnel alignment.
No. Zone Section RMR rating value RMR Class Description 1
1
1
36
IV Poor
2 3 3 5 4 7 5 15
31 6 17 7 21 8
2
2
48
III Fair
9 4 10 6 11 8 12 10 13 14
43 14 16 15 18 16 20 17
3
9 52
III Fair 18 11 19 12
47 20 13 21 19
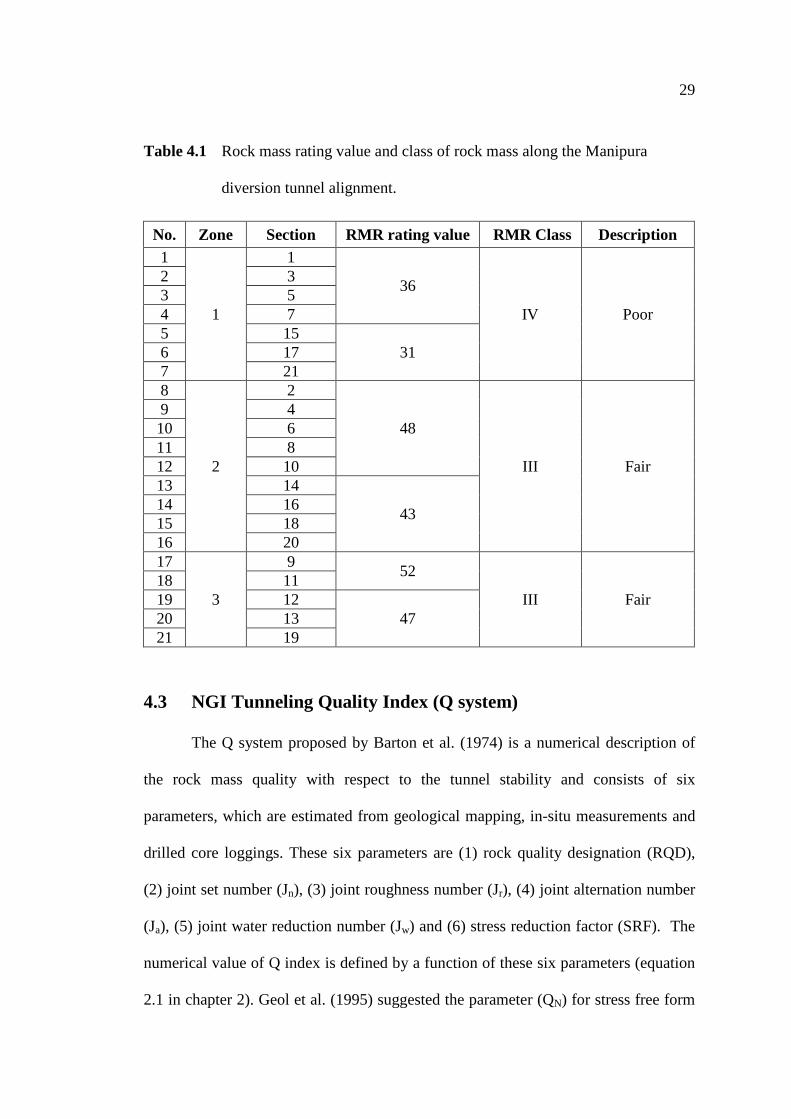
4.3 NGI Tunneling Quality Index (Q system)
The Q system proposed by Barton et al. (1974) is a numerical description of
the rock mass quality with respect to the tunnel stability and consists of six
parameters, which are estimated from geological mapping, in-situ measurements and
drilled core loggings. These six parameters are (1) rock quality designation (RQD),
(2) joint set number (Jn), (3) joint roughness number (Jr), (4) joint alternation number
(Ja), (5) joint water reduction number (Jw) and (6) stress reduction factor (SRF). The
numerical value of Q index is defined by a function of these six parameters (equation
2.1 in chapter 2). Geol et al. (1995) suggested the parameter (QN) for stress free form
30
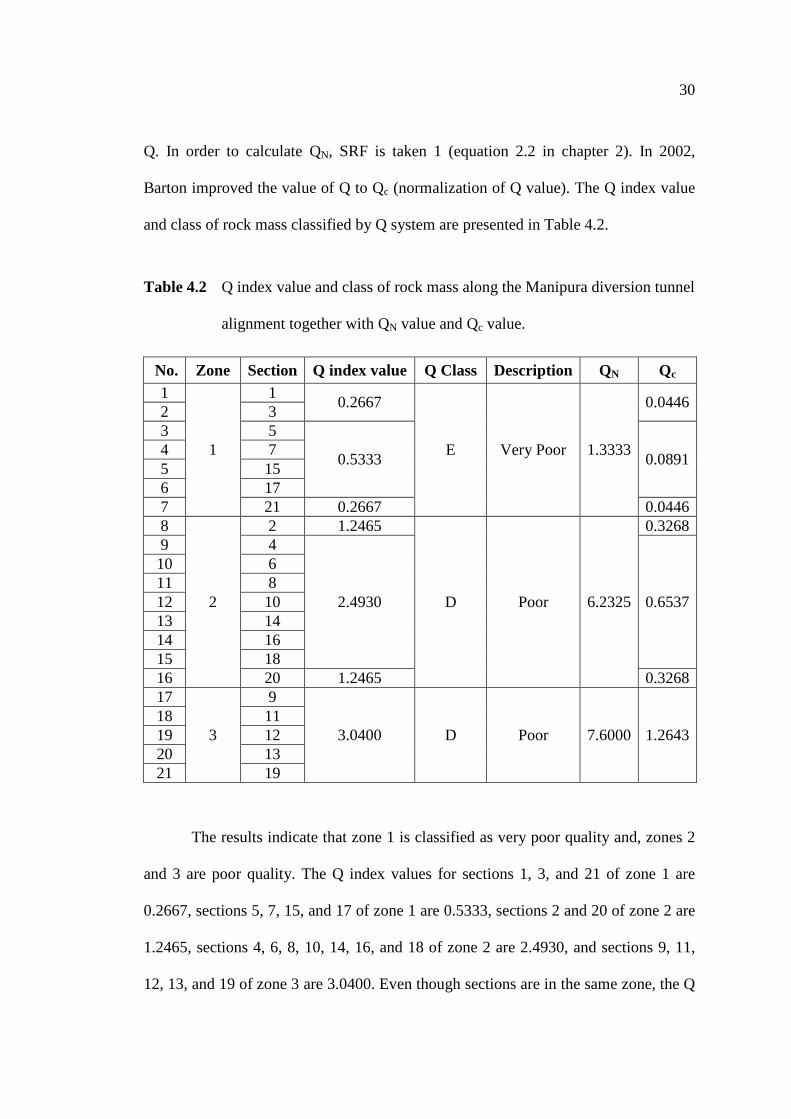
Q. In order to calculate QN, SRF is taken 1 (equation 2.2 in chapter 2). In 2002,
Barton improved the value of Q to Qc (normalization of Q value). The Q index value
and class of rock mass classified by Q system are presented in Table 4.2.
Table 4.2 Q index value and class of rock mass along the Manipura diversion tunnel
alignment together with QN value and Qc value.
No. Zone Section Q index value Q Class Description QN Qc 1
1
1 0.2667
E Very Poor 1.3333
0.0446 2 3 3 5
0.5333 0.0891 4 7 5 15 6 17 7 21 0.2667 0.0446 8
2
2 1.2465
D Poor 6.2325
0.3268 9 4
2.4930 0.6537
10 6 11 8 12 10 13 14 14 16 15 18 16 20 1.2465 0.3268 17
3
9
3.0400 D Poor 7.6000 1.2643 18 11 19 12 20 13 21 19
The results indicate that zone 1 is classified as very poor quality and, zones 2
and 3 are poor quality. The Q index values for sections 1, 3, and 21 of zone 1 are
0.2667, sections 5, 7, 15, and 17 of zone 1 are 0.5333, sections 2 and 20 of zone 2 are
1.2465, sections 4, 6, 8, 10, 14, 16, and 18 of zone 2 are 2.4930, and sections 9, 11,
12, 13, and 19 of zone 3 are 3.0400. Even though sections are in the same zone, the Q
31
index values are different. This is due to the value of stress reduction factor (SRF).
Stress reduction factor varies according to depth of excavation.
4.4 Rock Mass Index (RMi)
Palmstrom (1995) proposed rock mass index (RMi) for general
characterization and it has been developed over the years. For the jointed rock, RMi is
defined as the multiplication of the uniaxial compressive strength of intact rock (σc)
and the reducing effect of joint penetrating (JP) of rock mass (equation 2.4 in chapter
2). JP is the jointing parameter combined by the empirical relations jC (joint
conditions) and Vb (block volume) as shown in equation 2.5 in chapter 2. Block
volume (Vb) was estimated by the following equation proposed by Palmstrom (1995):
Vb = β × Jv3− (4.1)
where Jv is the volumetric joint count and β is the block shape factor.
Equations 2.4 through 2.6 in chapter 2 can be used to estimate the RMi value
of the rock mass. The RMi requires more calculations than the RMR and the Q
system, but the spreadsheets have been developed. The RMi-calc., version 2 and RMi
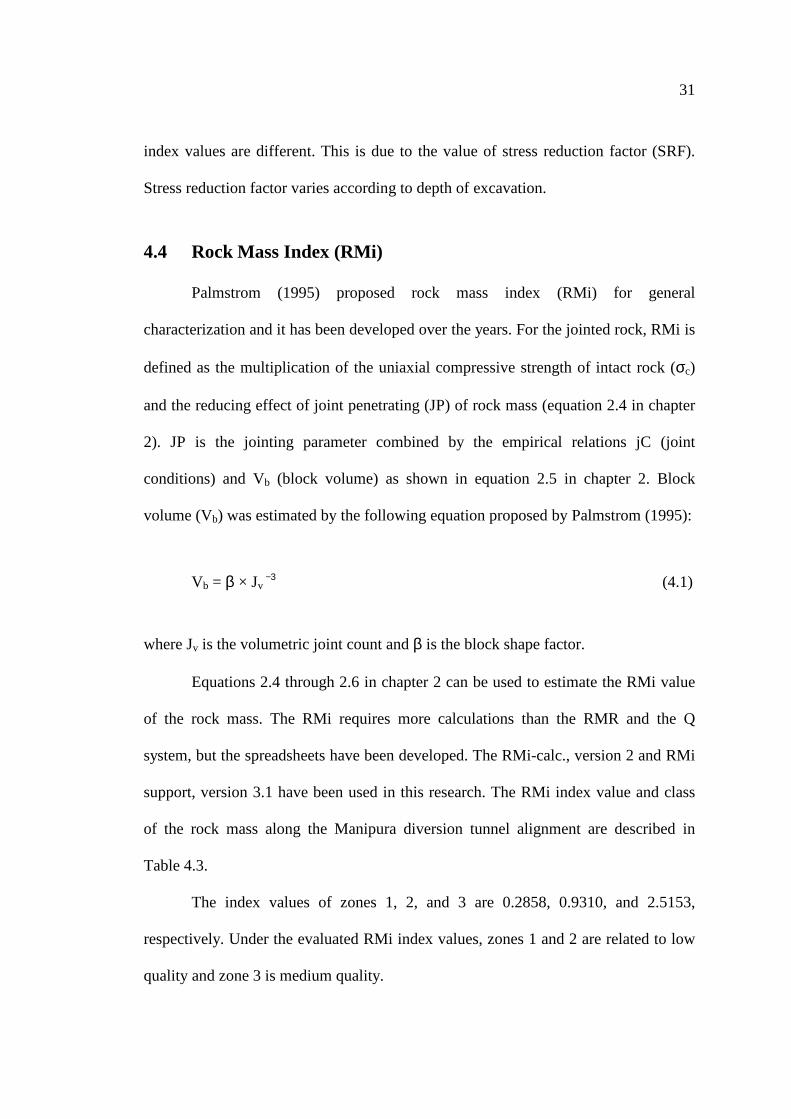
support, version 3.1 have been used in this research. The RMi index value and class
of the rock mass along the Manipura diversion tunnel alignment are described in
Table 4.3.
The index values of zones 1, 2, and 3 are 0.2858, 0.9310, and 2.5153,
respectively. Under the evaluated RMi index values, zones 1 and 2 are related to low
quality and zone 3 is medium quality.
32
Table 4.3 RMi index value and class of rock mass along the Manipura diversion
tunnel alignment.
No. Zone Section RMi index value Description
1
1
1
0.2858 Low
2 3 3 5 4 7 5 15 6 17 7 21 8
2
2
0.9310 Low
9 4 10 6 11 8 12 10 13 14 14 16 15 18 16 20 17
3
9
2.5153 Medium 18 11 19 12 20 13 21 19
33
4.5 Geological Strength Index (GSI)
The geological strength index (GSI) was proposed by Hoek et al. (1995). It
has been developed in engineering rock mechanics to meet the need for reliable input
data, particularly those related to rock mass properties required as inputs into
numerical analysis or closed form solutions for designing tunnels, slopes or
foundations in rock. The GSI is based on the appearance of rock mass and its
structure (e.g very good, good) and the structure of the rock mass (eg. blocky,
disturbed and disintegrated). Sonmez and Ulusay (1999) proposed two terms namely,
structural rating (SR) and surface condition rating (SCR). Structural rating (SR) is
based on volumetric joint count (Jv) and surface condition rating (SCR) is estimated
from the input parameters including roughness, weathering and infilling of
discontinuities.
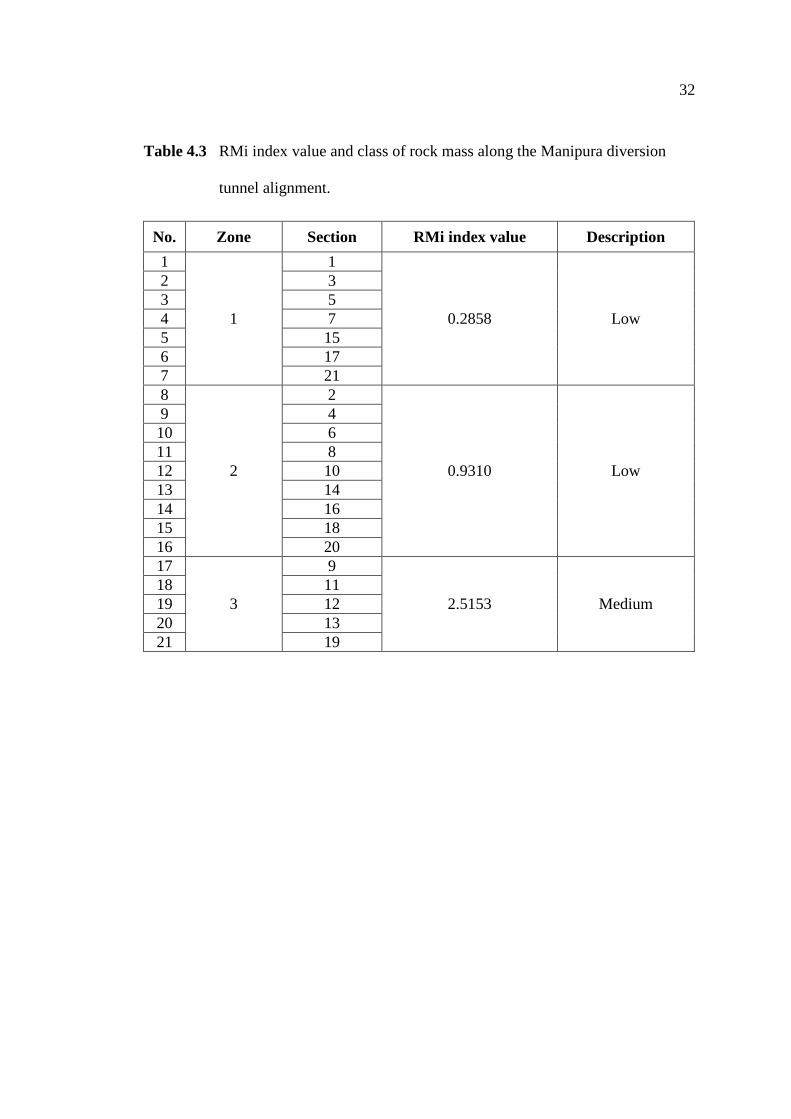
The modified quantitative GSI table (Sonmez, 2001) is used in this research.
The GSI index value and class of rock mass along the Manipura diversion tunnel
alignment are shown in Table 4.4. Based on the modified quantitative GSI table
developed by Sonmez (2001), the GSI values of zones 1, 2, and 3 are 28, 38, and 44,
respectively. As a result, zone 1 is poor, zone 2 is fair, and zone 3 is good quality.
34
Table 4.4 GSI index value and class of rock mass along the Manipura diversion
tunnel alignment.
No. Zone Section GSI index value Description
1
1
1
28 Poor
2 3 3 5 4 7 5 15 6 17 7 21 8
2
2
38 Fair
9 4 10 6 11 8 12 10 13 14 14 16 15 18 16 20 17
3
9
44 Good 18 11 19 12 20 13 21 19
35
4.6 Comparison of the Rock Mass Classification Results from Four
Different Rock Mass Classification Systems
Bieniawski (1989) modified the rock mass rating classification table. There
are five categories of rock mass class : (1) very good rock, (2) good rock, (3) fair
rock, (4) poor rock and (5) very poor rock. These rock mass classes are determined
based on five parameters of rock mass rating system.
In NGI tunneling quality index (Q system), there are seven categories of rock
mass class based on Q index value: (1) A : exceptionally good, extremely good and
very good; (2) B : good; (3) C : fair; (4) D : poor; (5) E : very poor; (6) F : extremely
poor; and (7) G : exceptionally poor. These rock mass classes are determined based
on six parameters.
The rock mass index (RMi) categorizes three rock mass classes : (1) low; (2)
medium; (3) high; based on the uniaxial compressive strength of intact rock and the
reducing effect of joint penetrating of rock mass. The geological strength index (GSI)
categorizes five rock mass classes based on surface condition rating (SCR). These
five rock mass classes are the same to those of rock mass rating system.
In rock mass rating system, there is no input parameter for rock stresses but
stresses up to 25 MPa are included in the estimated RMR value. The number of joint
set is considered indirectly in rock mass rating classification system. The Q system
considers being a function of only three parameters which are crude measures of
block size, inter-block shear strength and active stress. The RMi system has similar
input parameters to those of Q system. Jointing parameters are almost the same. The
GSI system classifies the rock mass class based on the surface condition rating such
as roughness rating, weathering rating and infilling rating. All systems consider the
36
condition of discontinuities. The RMR and Q systems consider ground water
condition which is indirectly considered in the RMi and GSI systems. The utilized
parameters of the four different rock mass classification systems are varied.
Therefore, they classify different rock mass classes in accordance with their utilized
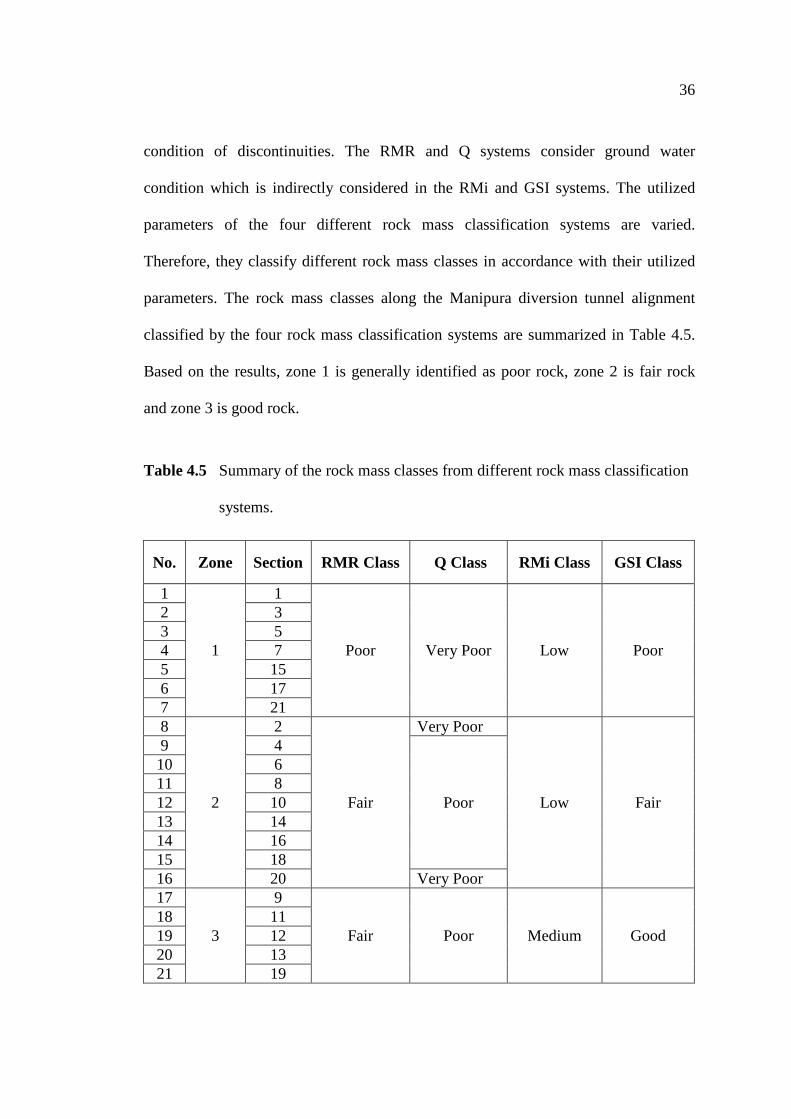
parameters. The rock mass classes along the Manipura diversion tunnel alignment
classified by the four rock mass classification systems are summarized in Table 4.5.
Based on the results, zone 1 is generally identified as poor rock, zone 2 is fair rock
and zone 3 is good rock.
Table 4.5 Summary of the rock mass classes from different rock mass classification
systems.
No. Zone Section RMR Class Q Class RMi Class GSI Class
1
1
1
Poor Very Poor Low Poor
2 3 3 5 4 7 5 15 6 17 7 21 8
2
2
Fair
Very Poor
Low Fair
9 4
Poor
10 6 11 8 12 10 13 14 14 16 15 18 16 20 Very Poor 17
3
9
Fair Poor Medium Good 18 11 19 12 20 13 21 19
CHAPTER V
GEOTECHNICAL ROCK MASS PARAMETER
ESTIMATION AND STABILITY ANALYSIS
5.1 Introduction
This chapter describes the estimation of geotechnical rock mass parameters
and stability analysis. The geotechnical rock mass parameters are evaluated by
empirical equations which are developed by many researchers based on the rock mass
classification systems. The stability of tunnels is evaluated in terms of stand-up time,
estimation of maximum unsupported span and factor of safety for all sections of
tunnel alignment.
5.2 Geotechnical Rock Mass Parameter Estimation
Rock mass properties such as Hoek and Brown constants, deformation
modulus of rock mass and strength of rock mass are important parameters for the
stability analysis and support design of tunnel. Reliable input parameters to finite
element method can produce meaningful calculations and feasible support design.
Field tests to determine some parameters directly are time consuming and expensive.
Consequently, several authors have proposed empirical relationships for estimating
the value of isotropic rock mass parameters based on empirical rock mass
classification schemes.
38
5.2.1 Rock Mass Deformation Modulus
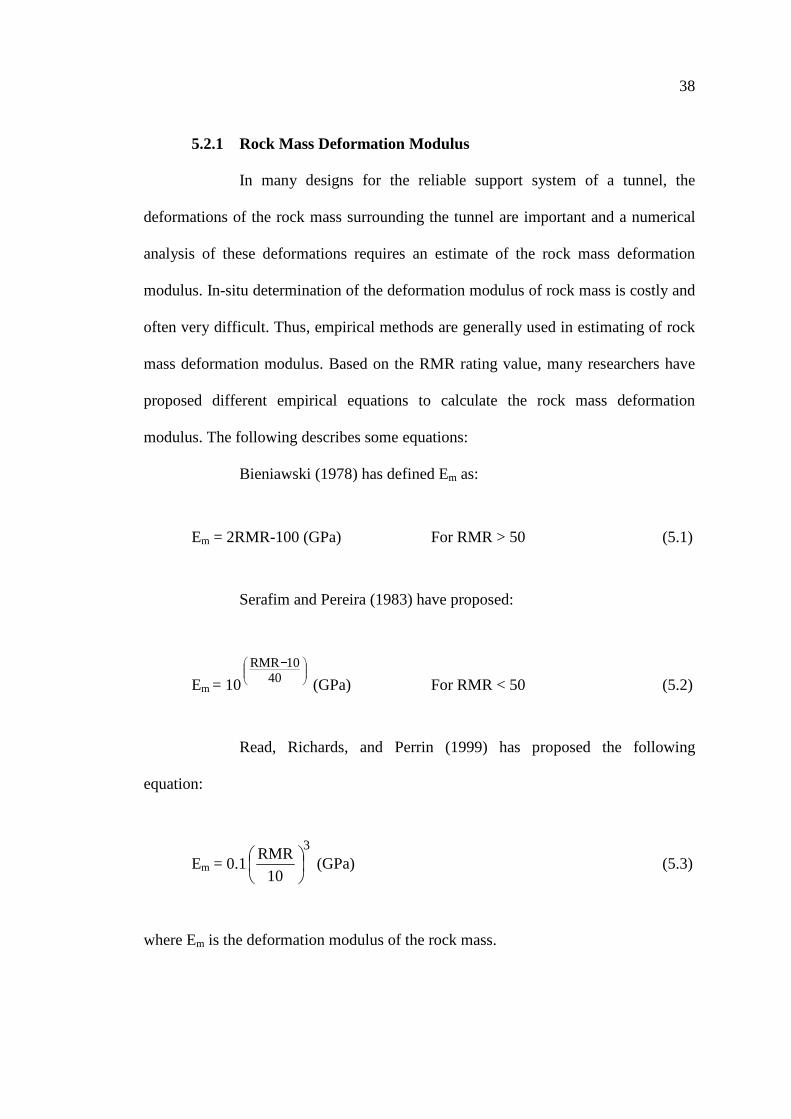
In many designs for the reliable support system of a tunnel, the
deformations of the rock mass surrounding the tunnel are important and a numerical
analysis of these deformations requires an estimate of the rock mass deformation
modulus. In-situ determination of the deformation modulus of rock mass is costly and
often very difficult. Thus, empirical methods are generally used in estimating of rock
mass deformation modulus. Based on the RMR rating value, many researchers have
proposed different empirical equations to calculate the rock mass deformation
modulus. The following describes some equations:
Bieniawski (1978) has defined Em as:
Em = 2RMR-100 (GPa) For RMR > 50 (5.1)
Serafim and Pereira (1983) have proposed:
Em = 10
−40
10RMR
(GPa) For RMR < 50 (5.2)
Read, Richards, and Perrin (1999) has proposed the following
equation:
Em = 0.13
10
RMR
(GPa) (5.3)
where Em is the deformation modulus of the rock mass.
39
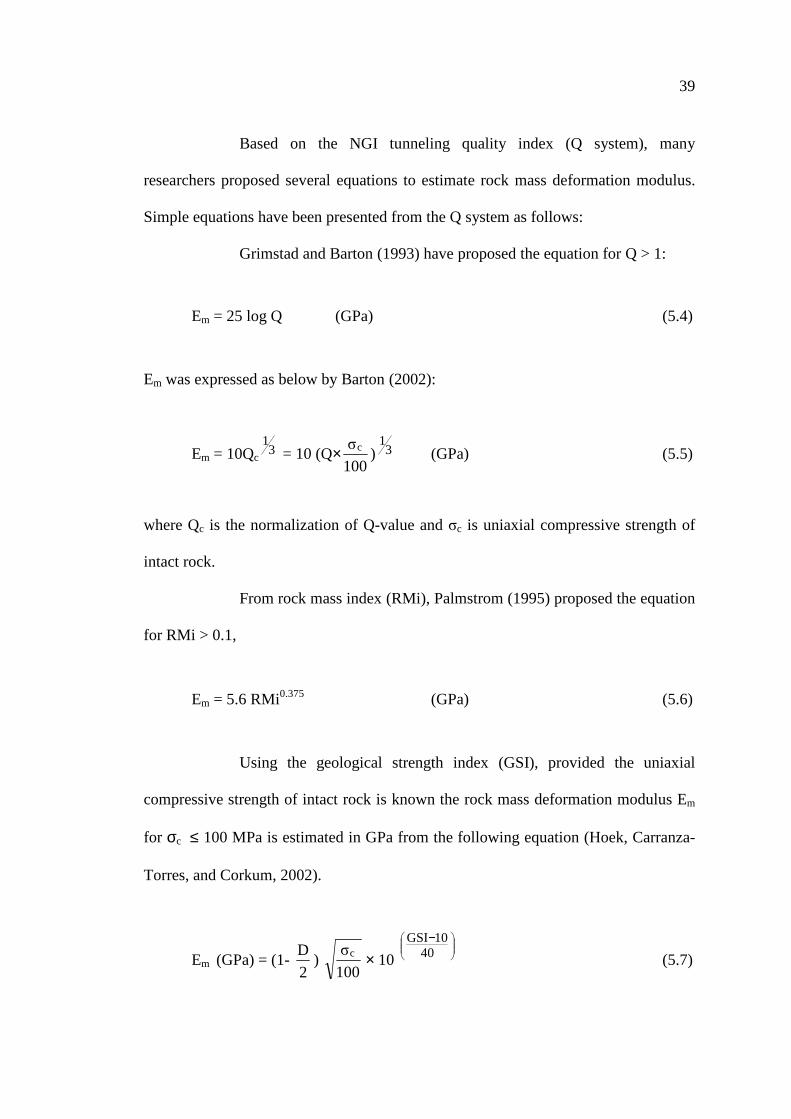
Based on the NGI tunneling quality index (Q system), many
researchers proposed several equations to estimate rock mass deformation modulus.
Simple equations have been presented from the Q system as follows:
Grimstad and Barton (1993) have proposed the equation for Q > 1:
Em = 25 log Q (GPa) (5.4)
Em was expressed as below by Barton (2002):
Em = 10Qc3
1 = 10 (Q×
100
σc ) 31
(GPa) (5.5)
where Qc is the normalization of Q-value and σc is uniaxial compressive strength of
intact rock.
From rock mass index (RMi), Palmstrom (1995) proposed the equation
for RMi > 0.1,
Em = 5.6 RMi0.375 (GPa) (5.6)
Using the geological strength index (GSI), provided the uniaxial
compressive strength of intact rock is known the rock mass deformation modulus Em
for σc ≤ 100 MPa is estimated in GPa from the following equation (Hoek, Carranza-
Torres, and Corkum, 2002).
Em (GPa) = (1- 2
D)
100
σc × 10
−40
10GSI
(5.7)
40
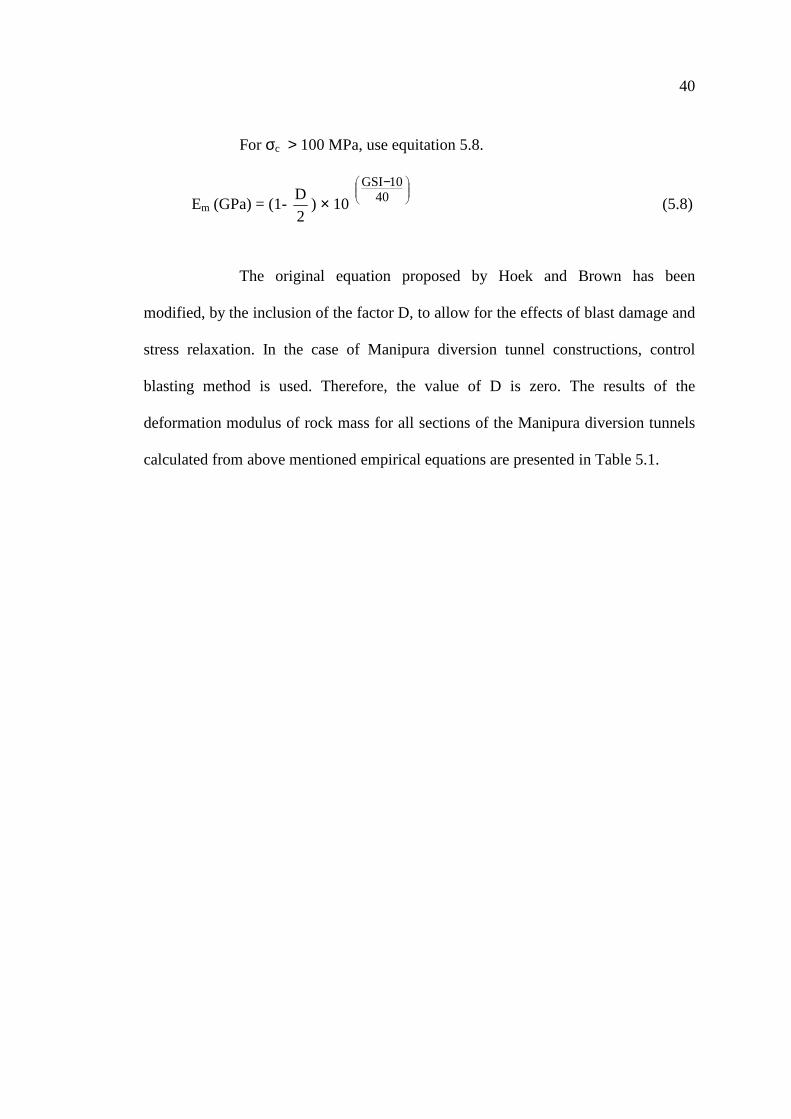
For σc > 100 MPa, use equitation 5.8.
Em (GPa) = (1- 2
D) × 10
−40
10GSI
(5.8)
The original equation proposed by Hoek and Brown has been
modified, by the inclusion of the factor D, to allow for the effects of blast damage and
stress relaxation. In the case of Manipura diversion tunnel constructions, control
blasting method is used. Therefore, the value of D is zero. The results of the
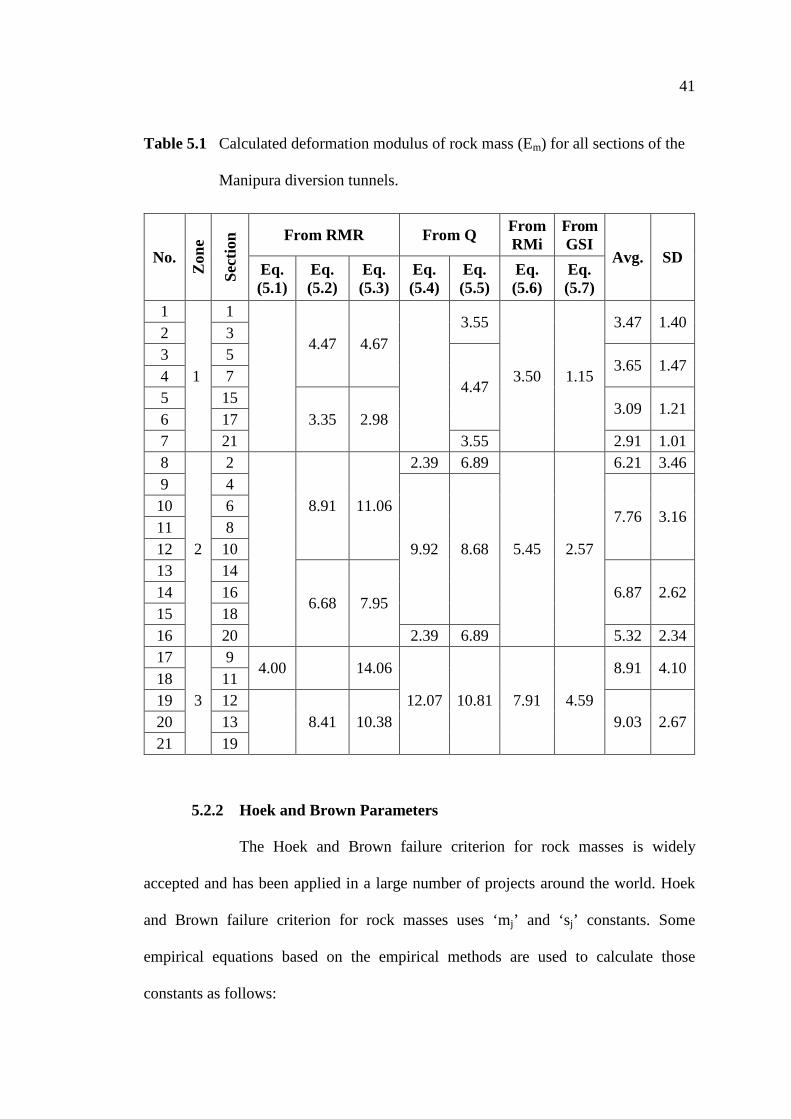
deformation modulus of rock mass for all sections of the Manipura diversion tunnels
calculated from above mentioned empirical equations are presented in Table 5.1.
41
Table 5.1 Calculated deformation modulus of rock mass (Em) for all sections of the
Manipura diversion tunnels.
No.
Zon
e
Sect
ion From RMR From Q From
RMi From GSI
Avg. SD Eq. (5.1)
Eq. (5.2)
Eq. (5.3)
Eq. (5.4)
Eq. (5.5)
Eq. (5.6)
Eq. (5.7)
1
1
1
4.47 4.67
3.55
3.50 1.15
3.47 1.40 2 3 3 5
4.47 3.65 1.47
4 7 5 15
3.35 2.98 3.09 1.21
6 17 7 21 3.55 2.91 1.01 8
2
2
8.91 11.06
2.39 6.89
5.45 2.57
6.21 3.46 9 4
9.92 8.68
7.76 3.16 10 6 11 8 12 10 13 14
6.68 7.95 6.87 2.62 14 16
15 18 16 20 2.39 6.89 5.32 2.34 17
3
9 4.00
14.06
12.07 10.81 7.91 4.59
8.91 4.10 18 11 19 12
8.41 10.38 9.03 2.67 20 13
21 19
5.2.2 Hoek and Brown Parameters
The Hoek and Brown failure criterion for rock masses is widely
accepted and has been applied in a large number of projects around the world. Hoek
and Brown failure criterion for rock masses uses ‘mj’ and ‘sj’ constants. Some
empirical equations based on the empirical methods are used to calculate those
constants as follows:
42
Hoek and Brown (1988) proposed a set of relations between the RMR
and the parameters ‘mj’ and ‘sj’.
For disturbed rock mass,
mj = mi exp
−14
100RMR (5.9)
sj = exp
−6
100RMR (5.10)
For undisturbed rock mass,
mj = mi exp
−28
100RMR (5.11)
sj = exp
−9
100RMR (5.12)
Singh, Viladkar, Samadhiya, and Mehrota (1997) has described the
following approximations to calculate mj and sj constants for tunnels:
i
j
m
m= 0.135 QN
31
(5.13)
sj = 0.002 QN (5.14)
where, QN is the stress free from Q, shown in equation 2.2 in chapter 2.
43
Palmstorm (1995) offered a method to calculate the Hoek and Brown
constants ‘mj’ and ‘sj’ as follow:
mj = mi JP0.64 (5.15)
mj = mi JP0.857 (5.16)
sj = JP2.0 (5.17)
where JP is the jointing parameter combines by empirical relations JC (joint
conditions) and Vb (block volume) as described in equation 2.5 in chapter 2.
Hoek et al. (2002) expressed as mj, a reduced value of material
constant mi and, sj. They are constants for the rock mass given by the following
relationships:
mj = mi exp
−−14D28
100GSI (5.18)
sj = exp
−−3D9
100GSI (5.19)
a = 2
1 +
6
1
− 3
20 -15GSI -
ee (5.20)
where D is a factor which depends upon the degree of disturbance to which the rock
mass has been subjected by blast damage and stress relaxation. It varies from 0 for
undisturbed in-situ rock masses to 1 for very disturbed rock masses. For the control
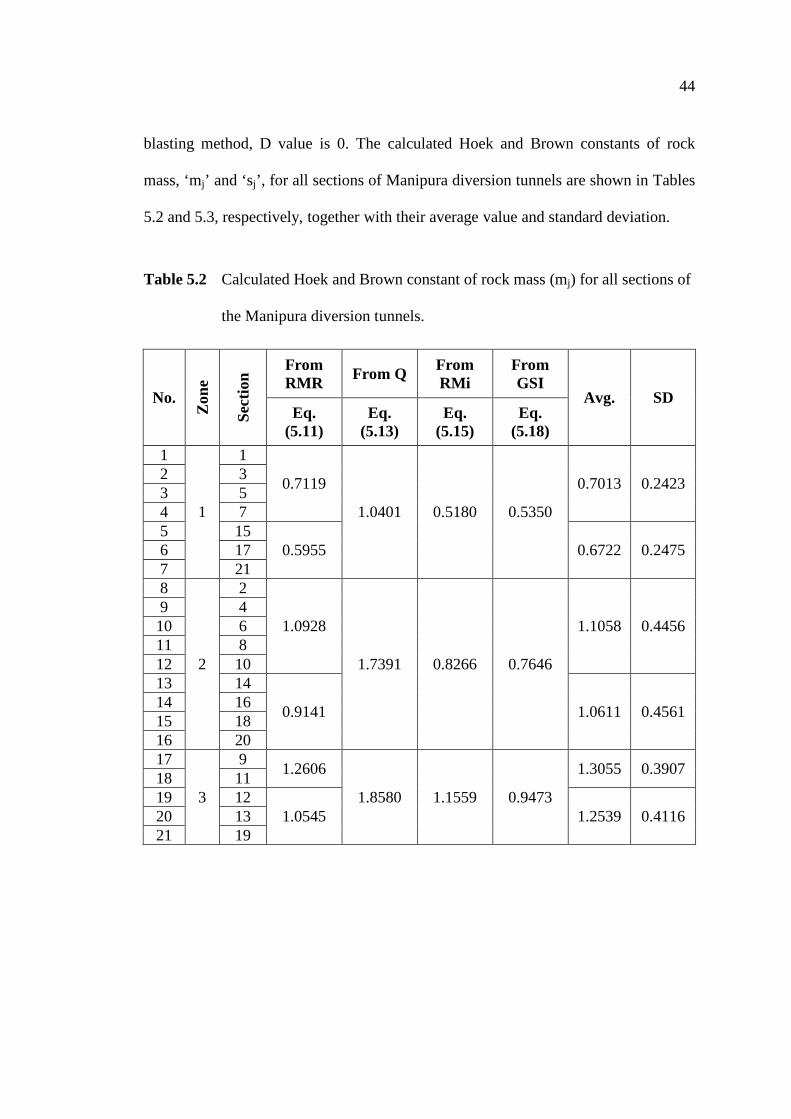
44
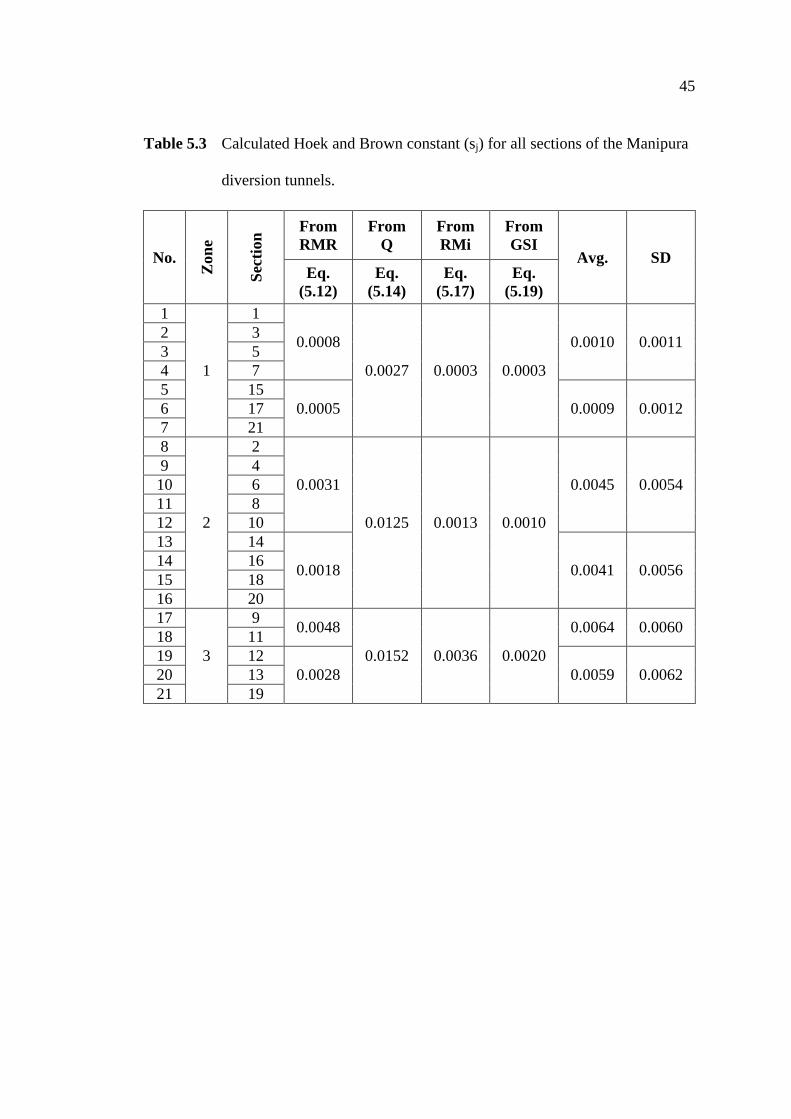
blasting method, D value is 0. The calculated Hoek and Brown constants of rock
mass, ‘mj’ and ‘sj’, for all sections of Manipura diversion tunnels are shown in Tables
5.2 and 5.3, respectively, together with their average value and standard deviation.
Table 5.2 Calculated Hoek and Brown constant of rock mass (mj) for all sections of
the Manipura diversion tunnels.
No.
Zon
e
Sect
ion
From RMR
From Q From RMi
From GSI
Avg. SD Eq.
(5.11) Eq.
(5.13) Eq.
(5.15) Eq.
(5.18)
1
1
1
0.7119
1.0401 0.5180 0.5350
0.7013 0.2423 2 3 3 5 4 7 5 15
0.5955 0.6722 0.2475 6 17 7 21 8
2
2
1.0928
1.7391 0.8266 0.7646
1.1058 0.4456 9 4 10 6 11 8 12 10 13 14
0.9141 1.0611 0.4561 14 16 15 18 16 20 17
3
9 1.2606
1.8580 1.1559 0.9473
1.3055 0.3907 18 11 19 12
1.0545 1.2539 0.4116 20 13 21 19
45
Table 5.3 Calculated Hoek and Brown constant (sj) for all sections of the Manipura
diversion tunnels.
No.
Zon
e
Sect
ion
From RMR
From Q
From RMi
From GSI
Avg. SD Eq.
(5.12) Eq.
(5.14) Eq.
(5.17) Eq.
(5.19) 1
1
1
0.0008
0.0027 0.0003 0.0003
0.0010 0.0011 2 3 3 5 4 7 5 15
0.0005 0.0009 0.0012 6 17 7 21 8
2
2
0.0031
0.0125 0.0013 0.0010
0.0045 0.0054 9 4 10 6 11 8 12 10 13 14
0.0018 0.0041 0.0056 14 16 15 18 16 20 17
3
9 0.0048
0.0152 0.0036 0.0020
0.0064 0.0060 18 11 19 12
0.0028 0.0059 0.0062 20 13 21 19
46
5.2.3 Rock Mass Strength
The rock mass strength is one of the important parameters for the
design of all types of underground excavation and stability analysis. A frequently
applied approach for estimation of the rock mass strength is through an empirical
failure criterion, often in conjunction with rock mass classification systems. Many
researchers have proposed several empirical equations to calculate the strength of
rock mass (σcm) based on rock mass classification systems as follows:
Ramamurthy (1986) proposed the following equation based on the
RMR rating value:
σcm = σc exp
−18.75
100RMR (5.21)
Goel (1994) suggested the following equation based on QN:
σcm =
σγ
0.1c
31
N
B
Q5.5 (5.22)
where QN is the stress free from Q (equation 2.2 in chapter 2), γ is the unit weight of
rock mass (t/m3), σc is the uniaxial compressive strength of intact rock (MPa) and B is
the width of tunnel (m).
The main principle in the development of RMi has been focusing on
the effects of the defects in a rock mass in reducing the strength of the intact rock. As
it meant to express the compressive strength of the rock mass, it can be defined as
(Palmstrom, 1995):
47
σcm = RMi = σc JP (5.23)
where σc is the uniaxial compressive strength of intact rock and JP is the jointing
parameter.
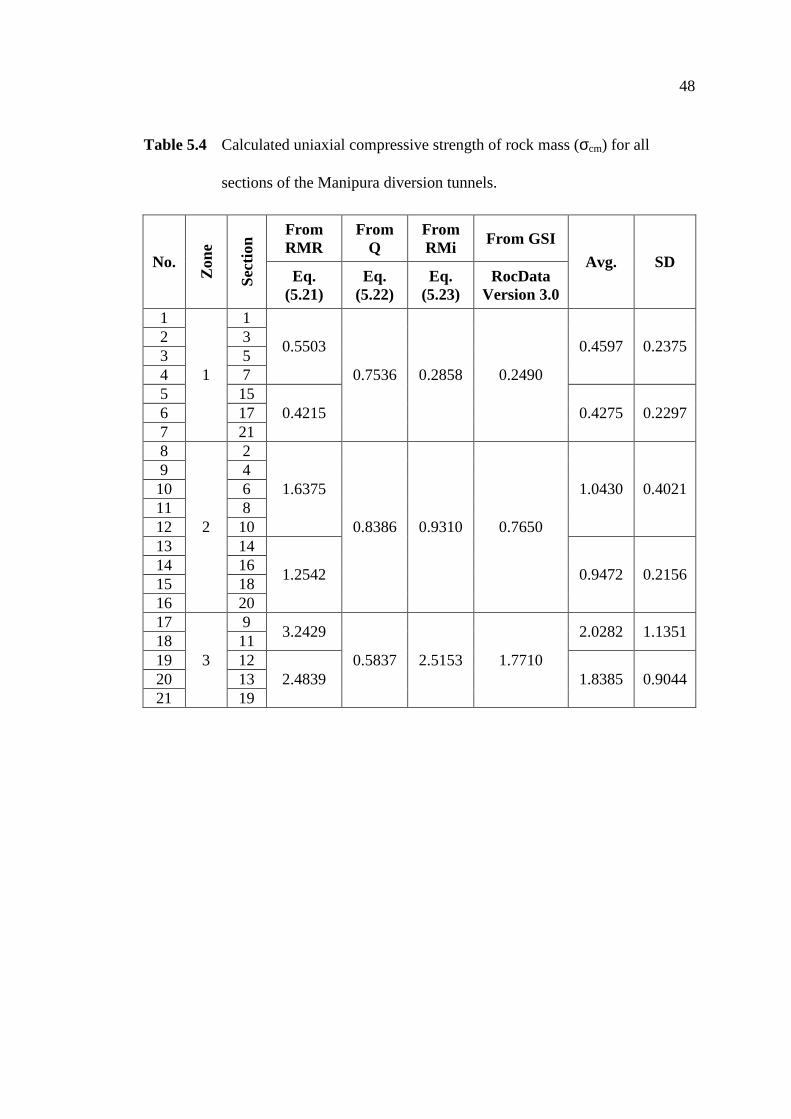
In order to apply the Hoek and Brown criterion for estimating the
strength of rock masses, three properties of the rock mass have to be estimated. These
are the uniaxial compressive strength of the intact rock (σc), the value of the Hoek and
Brown constant (mi) for the intact rock and the value of GSI for the rock mass.
RocData software version 3.0 (2004) is used in this research to estimate the uniaxial
compressive strength of rock mass by using geological strength index (GSI). The
calculated uniaxial compressive strength of rock mass for all sections of Manipura
diversion tunnels is presented in Table 5.4.
To overcome the characteristic limitation of the equations, several
equations proposed by many researchers have been used to estimate the rock mass
parameters along the Manipura diversion tunnel alignment. The average value is used
as input parameter for numerical simulation and stability analysis.
48
Table 5.4 Calculated uniaxial compressive strength of rock mass (σcm) for all
sections of the Manipura diversion tunnels.
No.
Zon
e
Sect
ion
From RMR
From Q
From RMi From GSI
Avg. SD Eq.
(5.21) Eq.
(5.22) Eq.
(5.23) RocData
Version 3.0
1
1
1
0.5503
0.7536 0.2858 0.2490
0.4597 0.2375 2 3 3 5 4 7 5 15
0.4215 0.4275 0.2297 6 17 7 21 8
2
2
1.6375
0.8386 0.9310 0.7650
1.0430 0.4021 9 4 10 6 11 8 12 10 13 14
1.2542 0.9472 0.2156 14 16 15 18 16 20 17
3
9 3.2429
0.5837 2.5153 1.7710
2.0282 1.1351 18 11 19 12
2.4839 1.8385 0.9044 20 13 21 19
49
5.3 Stability Analysis
The classical approach used in the design of engineering structures is to
consider the relationship between the capacity C (strength or resisting force) of the
element and the demand D (stress or disturbing force). The factor of safety of the
structure is defined as FS = C/D and failure is assumed to occur when FS is less than
1. In the case of underground excavation, the in-situ stress is required to analyze for
stability. The stand-up time and estimation of maximum unsupported span are also
some of the important issues for the safety of the underground excavation.
5.3.1 Stand-up Time and Maximum Unsupported Span
The stand-up time of the rock mass and the evaluation of maximum
unsupported span are important for the tunneling sequence and safety for the tunnel
construction. Bieniawski (1976) proposed the relationship between the stand-up time
of an unsupported underground excavation span and the CSIR geomechanics
classification, rock mass rating system (RMR). The chart is useful to estimate the
stand-up time of the rock mass and maximum unsupported span. This may lead to
provide effective planning of the excavation and supporting sequences for the tunnel
construction.
Based on the NGI tunneling quality index (Q system), Barton et al.
(1974) defined an additional quantity, the equivalent dimension (De), to evaluate the
maximum unsupported span and support requirements for a particular dimension of
underground excavation. The equivalent dimension (De) is obtained by dividing the
span, diameter or wall height of the excavation by a quantity called the excavation
support ratio (ESR) (equation 2.3 in chapter 2). For the diversion tunnel, ESR value
is 1.6. In order to estimate the maximum unsupported span of underground
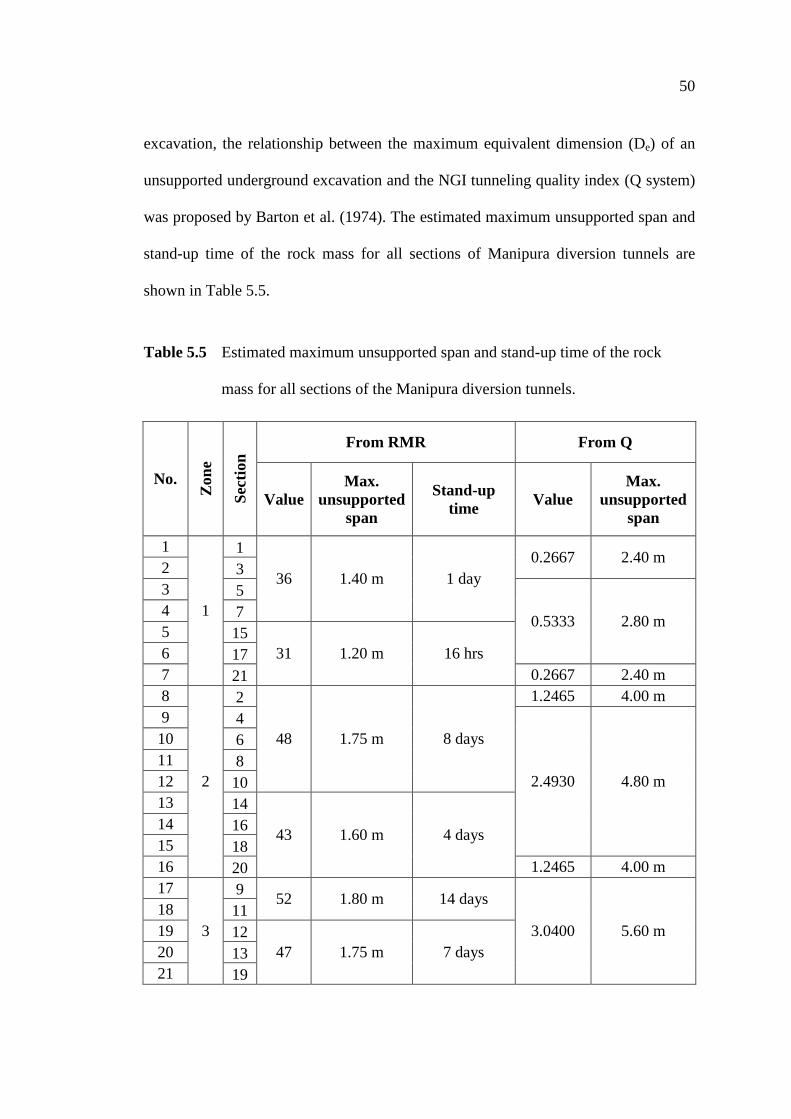
50
excavation, the relationship between the maximum equivalent dimension (De) of an
unsupported underground excavation and the NGI tunneling quality index (Q system)
was proposed by Barton et al. (1974). The estimated maximum unsupported span and
stand-up time of the rock mass for all sections of Manipura diversion tunnels are
shown in Table 5.5.
Table 5.5 Estimated maximum unsupported span and stand-up time of the rock
mass for all sections of the Manipura diversion tunnels.
No.
Zon
e
Sect
ion
From RMR From Q
Value Max.
unsupported span
Stand-up time Value
Max. unsupported
span
1
1
1
36 1.40 m 1 day 0.2667 2.40 m
2 3 3 5
0.5333 2.80 m 4 7 5 15
31 1.20 m 16 hrs 6 17 7 21 0.2667 2.40 m 8
2
2
48 1.75 m 8 days
1.2465 4.00 m 9 4
2.4930 4.80 m
10 6 11 8 12 10 13 14
43 1.60 m 4 days 14 16 15 18 16 20 1.2465 4.00 m 17
3
9 52 1.80 m 14 days
3.0400 5.60 m 18 11 19 12
47 1.75 m 7 days 20 13 21 19
51
5.3.2 In-situ Stress Analysis and Safety Factor
The stresses naturally exist in the rock mass related to the weight of
the overlying strata and the geological history of the rock mass. When an
underground excavation is made in the rock, these stresses are disturbed and new
stresses are re-distributed in the rock in the immediate vicinity of the underground
opening. In that case, failure of the rock adjacent to the excavation boundary can lead
to instability. Therefore, the estimation of in-situ stress at the boundary of the
underground opening is required to control the instability problem.
The condition that the only stresses, which can exist at the boundary of
an excavation, are the stresses tangential to the boundary holds true for all excavation
shapes which are free of internal loading. The tangential stress at the boundary of the
underground opening can be estimated by the following equations proposed by Hoek
and Brown (1990):
For the tangential stress at roof,
σθroof = (A × k - 1) σv (5.24)
For the tangential stress at side wall,
σθwall = (B - 1) σv (5.25)
where σv is the vertical stress, k is the stress ratio (σh/σv) and, A and B are the
constants. In the case of Manipura diversion tunnel, modified horseshoe shape, A is
3.1 and B is 2.7. The horizontal stress is difficult to estimate. It is known that they are
variable at shallow depth, tending to a hydrostatic state in deep environment. The
52
magnitude of horizontal stress is usually more than vertical stress at shallow depths
(less than 500 m) whereas they trend to a hydrostatic state at depth of about 1000 m
below the surface (Hoek and Brown, 1990). In this research, the ratio of horizontal
stress to vertical stress (k) is assumed to be 1 as suggested by Hoek (2003). The
vertical stress (σv) is directly proportional to the unit weight (γ) of overlying rock load
and the height of the overburden (H). The vertical stresses for all sections of
Manipura diversion tunnels are calculated by the following equation:
σv = γ H (5.26)
After estimating the overall stresses for all sections of Manipura
diversion tunnels, these results are summarized for the calculation of safety factor as
shown in Table 5.6.
The safety factor is taken as the ratio between the rock mass strength
and the stress around the underground opening. The calculated values of rock mass
strength for all sections of the Manipura diversion tunnels are described in Table 4.7
and the average values of rock mass strength are used to calculate the factor of safety.
To maintain stability, the acceptable factor of safety should be greater than 1.
The results show that all of the sections are under failure condition and
they need to be supported to increase safety factor.
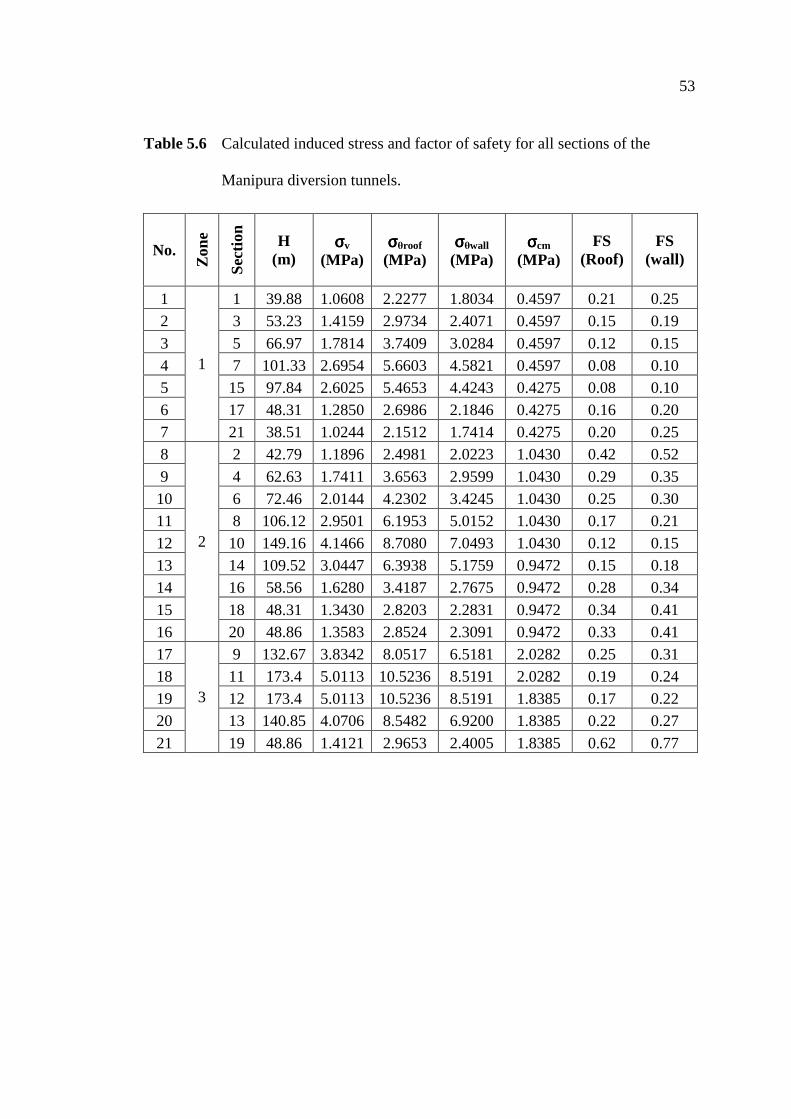
53
Table 5.6 Calculated induced stress and factor of safety for all sections of the
Manipura diversion tunnels.
No.
Zon
e
Sect
ion
H (m)
σσσσv (MPa)
σσσσθroof (MPa)
σσσσθwall (MPa)
σσσσcm (MPa)
FS (Roof)
FS (wall)
1
1
1 39.88 1.0608 2.2277 1.8034 0.4597 0.21 0.25 2 3 53.23 1.4159 2.9734 2.4071 0.4597 0.15 0.19
3 5 66.97 1.7814 3.7409 3.0284 0.4597 0.12 0.15 4 7 101.33 2.6954 5.6603 4.5821 0.4597 0.08 0.10 5 15 97.84 2.6025 5.4653 4.4243 0.4275 0.08 0.10 6 17 48.31 1.2850 2.6986 2.1846 0.4275 0.16 0.20 7 21 38.51 1.0244 2.1512 1.7414 0.4275 0.20 0.25 8
2
2 42.79 1.1896 2.4981 2.0223 1.0430 0.42 0.52
9 4 62.63 1.7411 3.6563 2.9599 1.0430 0.29 0.35 10 6 72.46 2.0144 4.2302 3.4245 1.0430 0.25 0.30 11 8 106.12 2.9501 6.1953 5.0152 1.0430 0.17 0.21 12 10 149.16 4.1466 8.7080 7.0493 1.0430 0.12 0.15 13 14 109.52 3.0447 6.3938 5.1759 0.9472 0.15 0.18 14 16 58.56 1.6280 3.4187 2.7675 0.9472 0.28 0.34
15 18 48.31 1.3430 2.8203 2.2831 0.9472 0.34 0.41 16 20 48.86 1.3583 2.8524 2.3091 0.9472 0.33 0.41 17
3
9 132.67 3.8342 8.0517 6.5181 2.0282 0.25 0.31 18 11 173.4 5.0113 10.5236 8.5191 2.0282 0.19 0.24 19 12 173.4 5.0113 10.5236 8.5191 1.8385 0.17 0.22 20 13 140.85 4.0706 8.5482 6.9200 1.8385 0.22 0.27
21 19 48.86 1.4121 2.9653 2.4005 1.8385 0.62 0.77
CHAPTER VI
SUPPORT DESIGN
6.1 Introduction
This chapter describes the estimation of support capacity and the design of
support systems for the Manipura diversion tunnels by using empirical methods and
numerical method. The performance of support elements, such as rock bolt and
shotcrete, is analyzed by numerical modeling. The design results are compared with
those obtained from empirical methods and numerical method.
6.2 Support Capacity Estimation
The prediction of support capacity is one of the important tasks for the
assessment of the reliable support systems for underground openings. Several
relations based on rock mass classification systems are used to estimate the required
support capacity for all sections of the Manipura diversion tunnels.
Bieniawski (1974) proposed the following equation to estimate the support
pressure (Proof) based on rock mass rating system (RMR):
Proof = )Wγ100
RMR-100( (6.1)
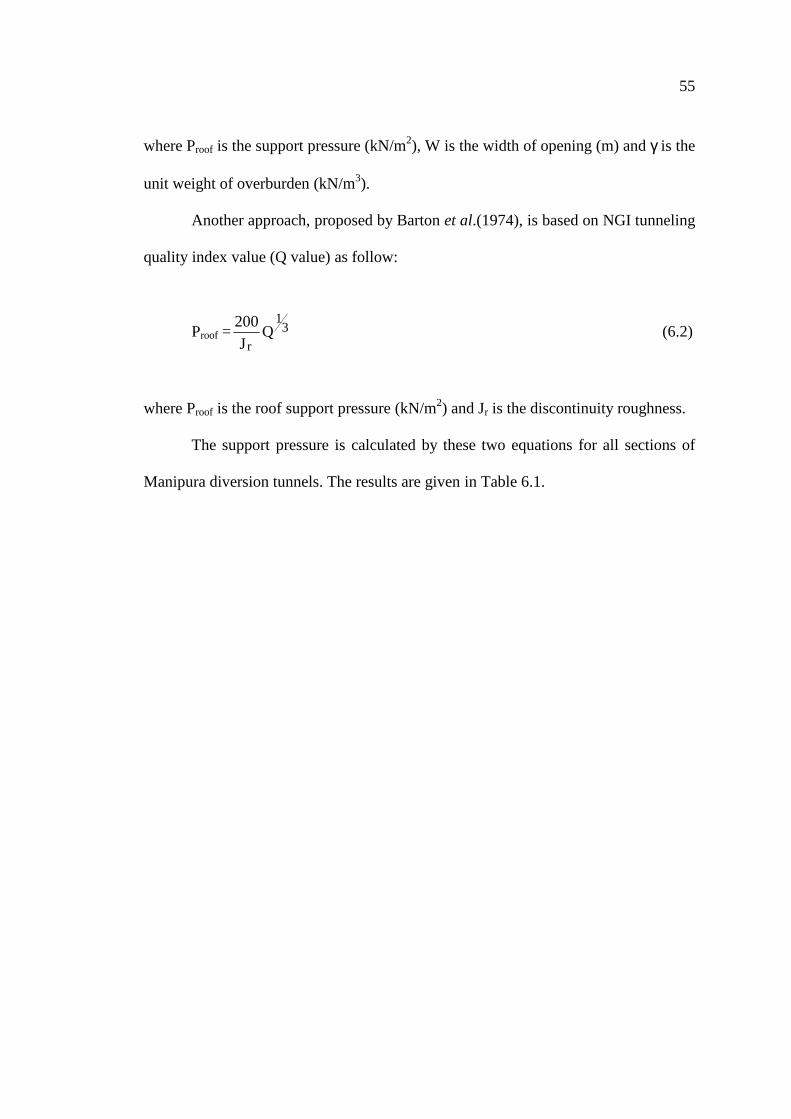
55
where Proof is the support pressure (kN/m2), W is the width of opening (m) and γ is the
unit weight of overburden (kN/m3).
Another approach, proposed by Barton et al.(1974), is based on NGI tunneling
quality index value (Q value) as follow:
Proof = 31
rQ
J
200 (6.2)
where Proof is the roof support pressure (kN/m2) and Jr is the discontinuity roughness.
The support pressure is calculated by these two equations for all sections of
Manipura diversion tunnels. The results are given in Table 6.1.
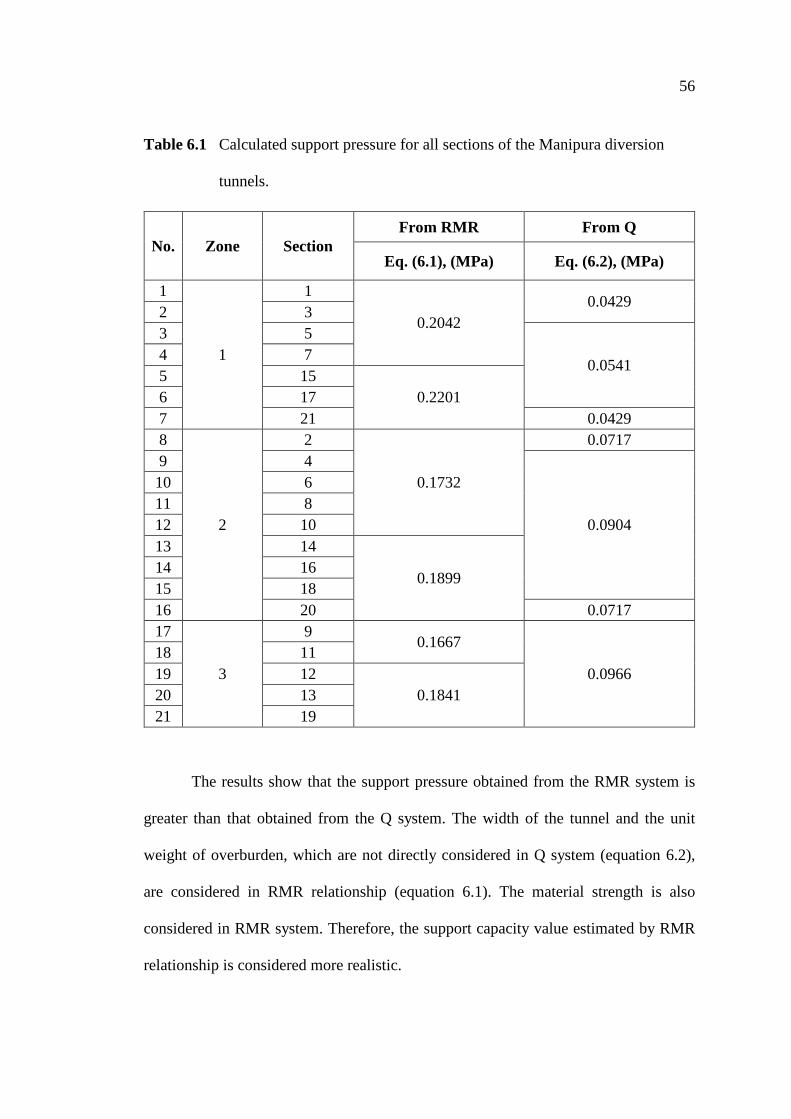
56
Table 6.1 Calculated support pressure for all sections of the Manipura diversion
tunnels.
No. Zone Section From RMR From Q
Eq. (6.1), (MPa) Eq. (6.2), (MPa)
1
1
1
0.2042 0.0429
2 3 3 5
0.0541 4 7 5 15
0.2201 6 17 7 21 0.0429 8
2
2
0.1732
0.0717 9 4
0.0904
10 6 11 8 12 10 13 14
0.1899 14 16 15 18 16 20 0.0717 17
3
9 0.1667
0.0966 18 11 19 12
0.1841 20 13 21 19
The results show that the support pressure obtained from the RMR system is
greater than that obtained from the Q system. The width of the tunnel and the unit
weight of overburden, which are not directly considered in Q system (equation 6.2),
are considered in RMR relationship (equation 6.1). The material strength is also
considered in RMR system. Therefore, the support capacity value estimated by RMR
relationship is considered more realistic.
57
6.3 Support Design using Empirical Methods
Empirical methods are based on rock mass classification systems: rock mass
rating system (RMR), NGI tunneling quality index (Q system) and rock mass index
(RMi). All these systems have quantitative estimation of the rock mass quality linked
with empirical design rules to estimate adequate rock support measures such as rock
bolt, shotcrete and steel set.
6.3.1 Rock Mass Rating System (RMR)
The rock mass rating system (RMR), proposed by Bieniawski (1989),
provides guidelines for the selection of rock reinforcement for tunnels. The method of
excavation is provided based on the rock mass rating value.
The results suggest the two excavation methods : (1) top heading and
bench cut excavation method (1.0-1.5 m advance in top heading, install support
concurrently with excavation, 10 m from face, for zone 1) and (2) top heading and
bench cut excavation method (1.5-3 m advance in top heading, commence support
after each blast, complete support 10 m from face, for zone 2 and 3 of the tunnel). For
zone 1, the RMR support table suggests that light to medium steel sets with spacing of
1.5 m should be installed where required. The suggested support systems assessed
based on rock mass rating system (RMR) for each zone are presented in Table 6.2.
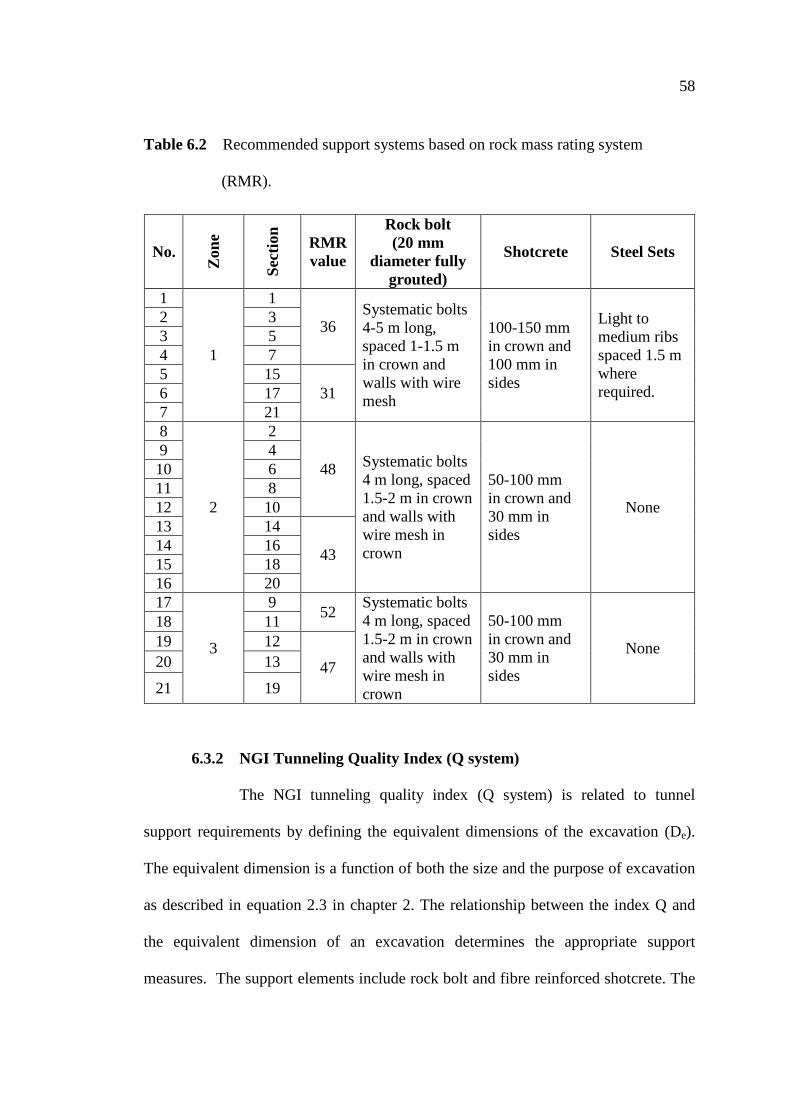
58
Table 6.2 Recommended support systems based on rock mass rating system
(RMR).
No.
Zon
e
Sect
ion
RMR value
Rock bolt (20 mm
diameter fully grouted)
Shotcrete Steel Sets
1
1
1
36 Systematic bolts 4-5 m long, spaced 1-1.5 m in crown and walls with wire mesh
100-150 mm in crown and 100 mm in sides
Light to medium ribs spaced 1.5 m where required.
2 3 3 5 4 7 5 15
31 6 17 7 21 8
2
2
48 Systematic bolts 4 m long, spaced 1.5-2 m in crown and walls with wire mesh in crown
50-100 mm in crown and 30 mm in sides
None
9 4 10 6 11 8 12 10 13 14
43 14 16 15 18 16 20 17
3
9 52
Systematic bolts 4 m long, spaced 1.5-2 m in crown and walls with wire mesh in crown
50-100 mm in crown and 30 mm in sides
None
18 11 19 12
47 20 13
21 19
6.3.2 NGI Tunneling Quality Index (Q system)
The NGI tunneling quality index (Q system) is related to tunnel
support requirements by defining the equivalent dimensions of the excavation (De).
The equivalent dimension is a function of both the size and the purpose of excavation
as described in equation 2.3 in chapter 2. The relationship between the index Q and
the equivalent dimension of an excavation determines the appropriate support
measures. The support elements include rock bolt and fibre reinforced shotcrete. The
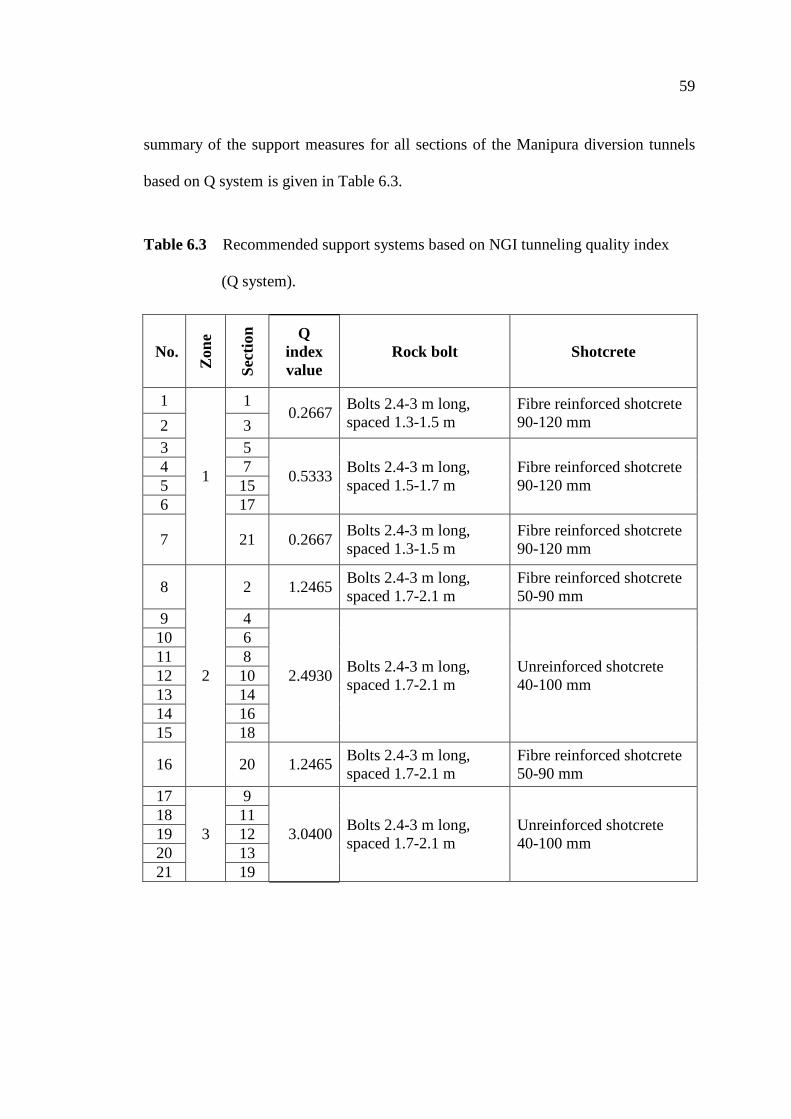
59
summary of the support measures for all sections of the Manipura diversion tunnels
based on Q system is given in Table 6.3.
Table 6.3 Recommended support systems based on NGI tunneling quality index
(Q system).
No.
Zon
e
Sect
ion Q
index value
Rock bolt Shotcrete
1
1
1 0.2667
Bolts 2.4-3 m long, spaced 1.3-1.5 m
Fibre reinforced shotcrete 90-120 mm 2 3
3 5
0.5333 Bolts 2.4-3 m long, spaced 1.5-1.7 m
Fibre reinforced shotcrete 90-120 mm
4 7 5 15 6 17
7 21 0.2667 Bolts 2.4-3 m long, spaced 1.3-1.5 m
Fibre reinforced shotcrete 90-120 mm
8
2
2 1.2465 Bolts 2.4-3 m long, spaced 1.7-2.1 m
Fibre reinforced shotcrete 50-90 mm
9 4
2.4930 Bolts 2.4-3 m long, spaced 1.7-2.1 m
Unreinforced shotcrete 40-100 mm
10 6 11 8 12 10 13 14 14 16 15 18
16 20 1.2465 Bolts 2.4-3 m long, spaced 1.7-2.1 m
Fibre reinforced shotcrete 50-90 mm
17
3
9
3.0400 Bolts 2.4-3 m long, spaced 1.7-2.1 m
Unreinforced shotcrete 40-100 mm
18 11 19 12 20 13 21 19
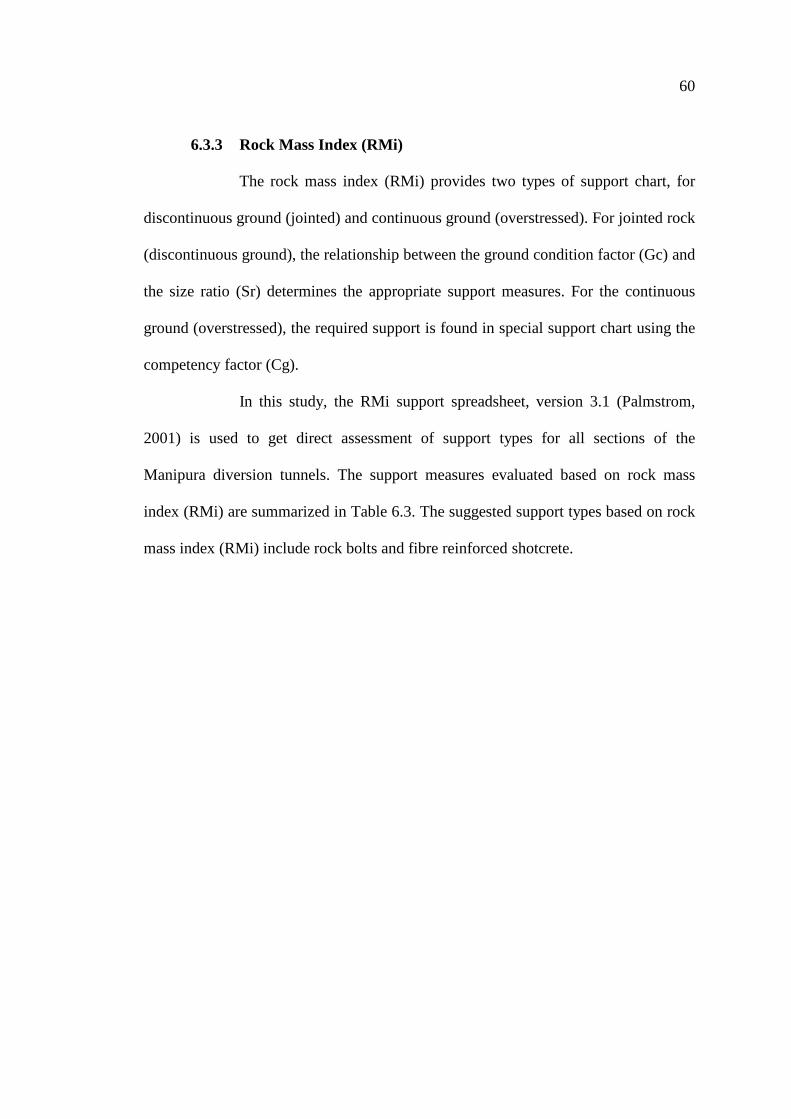
60
6.3.3 Rock Mass Index (RMi)
The rock mass index (RMi) provides two types of support chart, for
discontinuous ground (jointed) and continuous ground (overstressed). For jointed rock
(discontinuous ground), the relationship between the ground condition factor (Gc) and
the size ratio (Sr) determines the appropriate support measures. For the continuous
ground (overstressed), the required support is found in special support chart using the
competency factor (Cg).
In this study, the RMi support spreadsheet, version 3.1 (Palmstrom,
2001) is used to get direct assessment of support types for all sections of the
Manipura diversion tunnels. The support measures evaluated based on rock mass
index (RMi) are summarized in Table 6.3. The suggested support types based on rock
mass index (RMi) include rock bolts and fibre reinforced shotcrete.
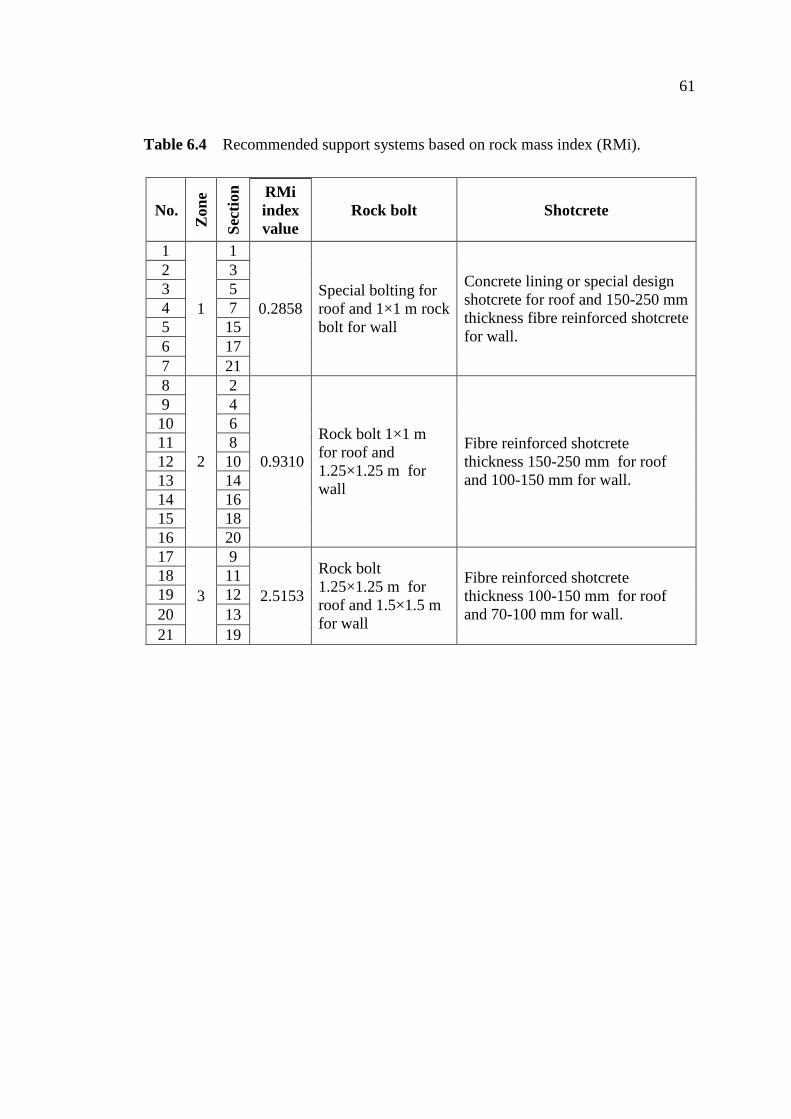
61
Table 6.4 Recommended support systems based on rock mass index (RMi).
No. Z
one
Sect
ion RMi
index value
Rock bolt Shotcrete
1
1
1
0.2858 Special bolting for roof and 1×1 m rock bolt for wall
Concrete lining or special design shotcrete for roof and 150-250 mm thickness fibre reinforced shotcrete for wall.
2 3 3 5 4 7 5 15 6 17 7 21 8
2
2
0.9310
Rock bolt 1×1 m for roof and 1.25×1.25 m for wall
Fibre reinforced shotcrete thickness 150-250 mm for roof and 100-150 mm for wall.
9 4 10 6 11 8 12 10 13 14 14 16 15 18 16 20 17
3
9
2.5153
Rock bolt 1.25×1.25 m for roof and 1.5×1.5 m for wall
Fibre reinforced shotcrete thickness 100-150 mm for roof and 70-100 mm for wall.
18 11 19 12 20 13 21 19
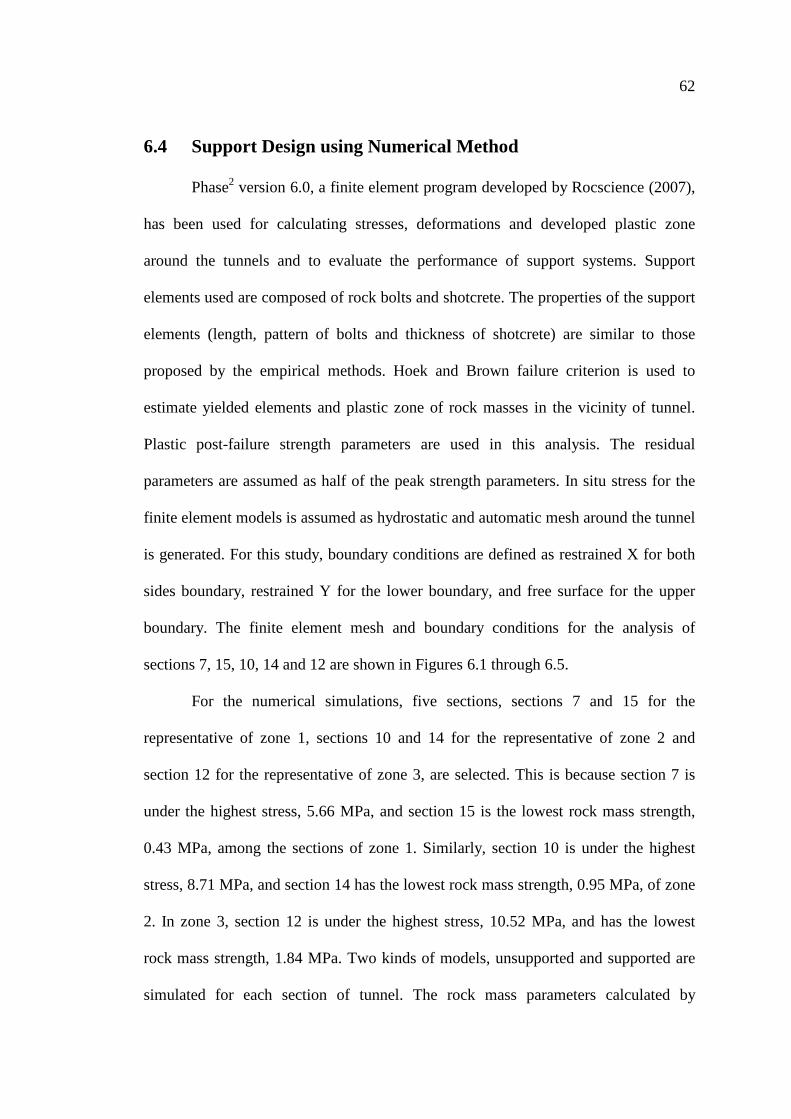
62
6.4 Support Design using Numerical Method
Phase2 version 6.0, a finite element program developed by Rocscience (2007),
has been used for calculating stresses, deformations and developed plastic zone
around the tunnels and to evaluate the performance of support systems. Support
elements used are composed of rock bolts and shotcrete. The properties of the support
elements (length, pattern of bolts and thickness of shotcrete) are similar to those
proposed by the empirical methods. Hoek and Brown failure criterion is used to
estimate yielded elements and plastic zone of rock masses in the vicinity of tunnel.
Plastic post-failure strength parameters are used in this analysis. The residual
parameters are assumed as half of the peak strength parameters. In situ stress for the
finite element models is assumed as hydrostatic and automatic mesh around the tunnel
is generated. For this study, boundary conditions are defined as restrained X for both
sides boundary, restrained Y for the lower boundary, and free surface for the upper
boundary. The finite element mesh and boundary conditions for the analysis of
sections 7, 15, 10, 14 and 12 are shown in Figures 6.1 through 6.5.
For the numerical simulations, five sections, sections 7 and 15 for the
representative of zone 1, sections 10 and 14 for the representative of zone 2 and
section 12 for the representative of zone 3, are selected. This is because section 7 is
under the highest stress, 5.66 MPa, and section 15 is the lowest rock mass strength,
0.43 MPa, among the sections of zone 1. Similarly, section 10 is under the highest
stress, 8.71 MPa, and section 14 has the lowest rock mass strength, 0.95 MPa, of zone
2. In zone 3, section 12 is under the highest stress, 10.52 MPa, and has the lowest
rock mass strength, 1.84 MPa. Two kinds of models, unsupported and supported are
simulated for each section of tunnel. The rock mass parameters calculated by
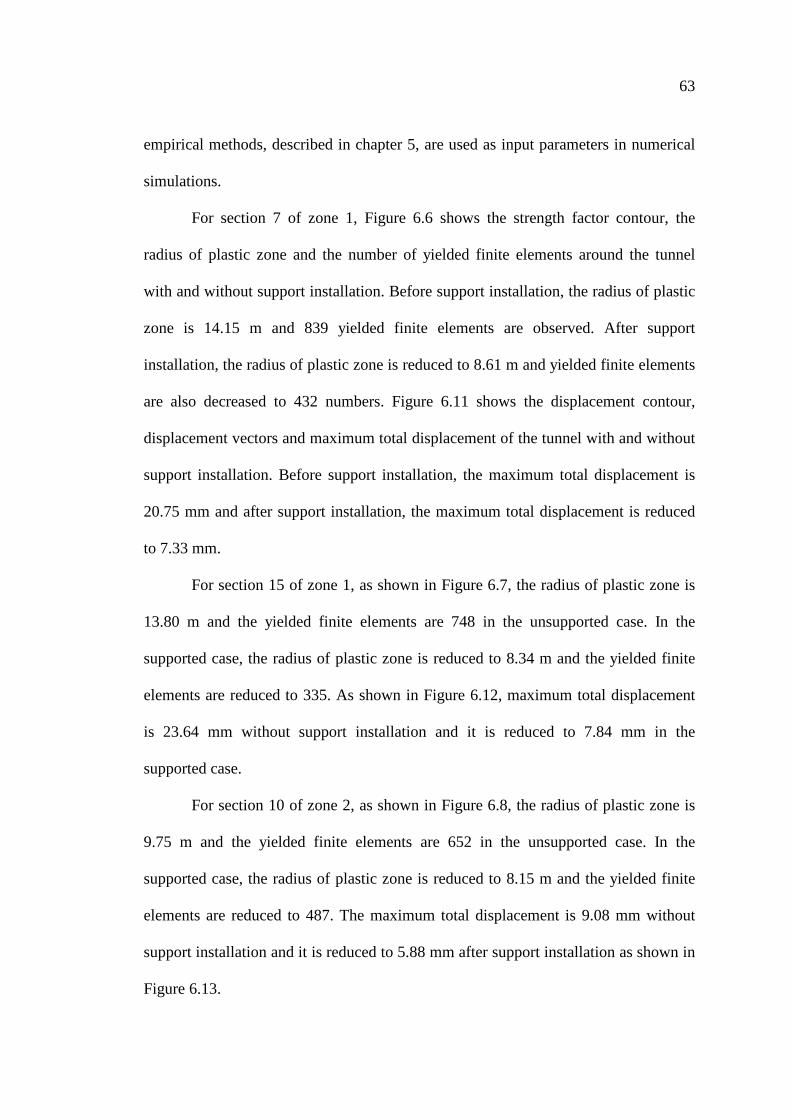
63
empirical methods, described in chapter 5, are used as input parameters in numerical
simulations.
For section 7 of zone 1, Figure 6.6 shows the strength factor contour, the
radius of plastic zone and the number of yielded finite elements around the tunnel
with and without support installation. Before support installation, the radius of plastic
zone is 14.15 m and 839 yielded finite elements are observed. After support
installation, the radius of plastic zone is reduced to 8.61 m and yielded finite elements
are also decreased to 432 numbers. Figure 6.11 shows the displacement contour,
displacement vectors and maximum total displacement of the tunnel with and without
support installation. Before support installation, the maximum total displacement is
20.75 mm and after support installation, the maximum total displacement is reduced
to 7.33 mm.
For section 15 of zone 1, as shown in Figure 6.7, the radius of plastic zone is
13.80 m and the yielded finite elements are 748 in the unsupported case. In the
supported case, the radius of plastic zone is reduced to 8.34 m and the yielded finite
elements are reduced to 335. As shown in Figure 6.12, maximum total displacement
is 23.64 mm without support installation and it is reduced to 7.84 mm in the
supported case.
For section 10 of zone 2, as shown in Figure 6.8, the radius of plastic zone is
9.75 m and the yielded finite elements are 652 in the unsupported case. In the
supported case, the radius of plastic zone is reduced to 8.15 m and the yielded finite
elements are reduced to 487. The maximum total displacement is 9.08 mm without
support installation and it is reduced to 5.88 mm after support installation as shown in
Figure 6.13.
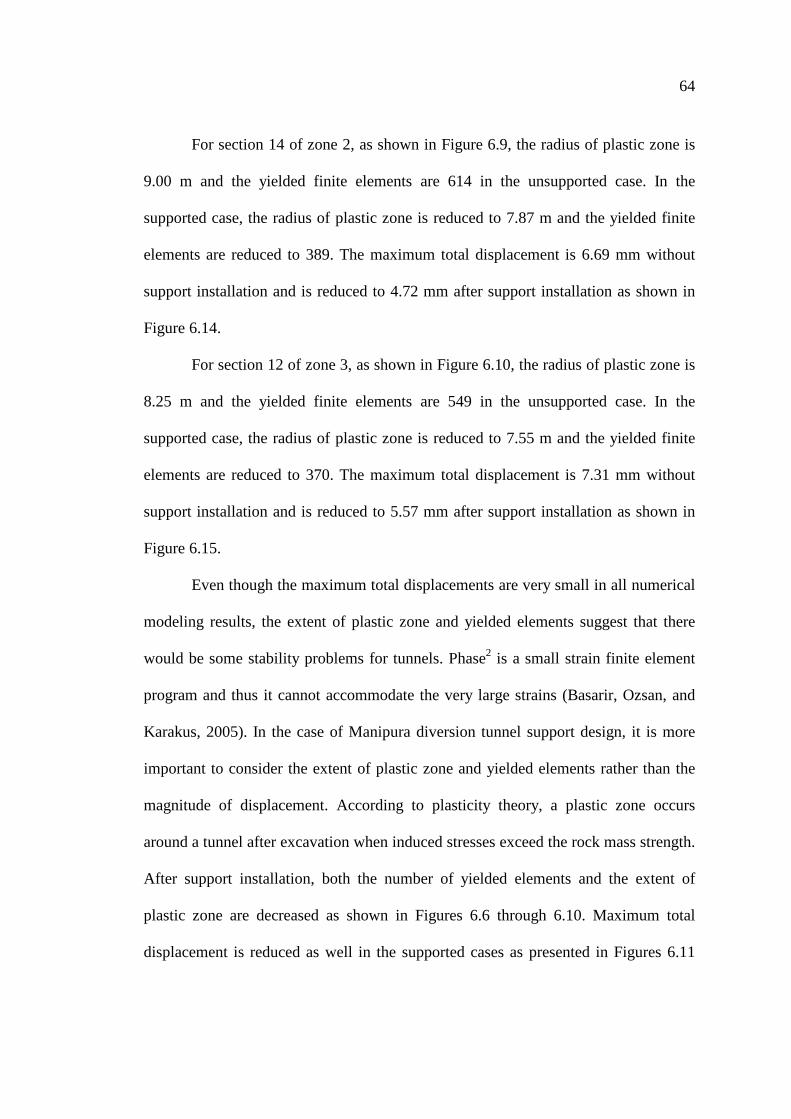
64
For section 14 of zone 2, as shown in Figure 6.9, the radius of plastic zone is
9.00 m and the yielded finite elements are 614 in the unsupported case. In the
supported case, the radius of plastic zone is reduced to 7.87 m and the yielded finite
elements are reduced to 389. The maximum total displacement is 6.69 mm without
support installation and is reduced to 4.72 mm after support installation as shown in
Figure 6.14.
For section 12 of zone 3, as shown in Figure 6.10, the radius of plastic zone is
8.25 m and the yielded finite elements are 549 in the unsupported case. In the
supported case, the radius of plastic zone is reduced to 7.55 m and the yielded finite
elements are reduced to 370. The maximum total displacement is 7.31 mm without
support installation and is reduced to 5.57 mm after support installation as shown in
Figure 6.15.
Even though the maximum total displacements are very small in all numerical
modeling results, the extent of plastic zone and yielded elements suggest that there
would be some stability problems for tunnels. Phase2 is a small strain finite element
program and thus it cannot accommodate the very large strains (Basarir, Ozsan, and
Karakus, 2005). In the case of Manipura diversion tunnel support design, it is more
important to consider the extent of plastic zone and yielded elements rather than the
magnitude of displacement. According to plasticity theory, a plastic zone occurs
around a tunnel after excavation when induced stresses exceed the rock mass strength.
After support installation, both the number of yielded elements and the extent of
plastic zone are decreased as shown in Figures 6.6 through 6.10. Maximum total
displacement is reduced as well in the supported cases as presented in Figures 6.11
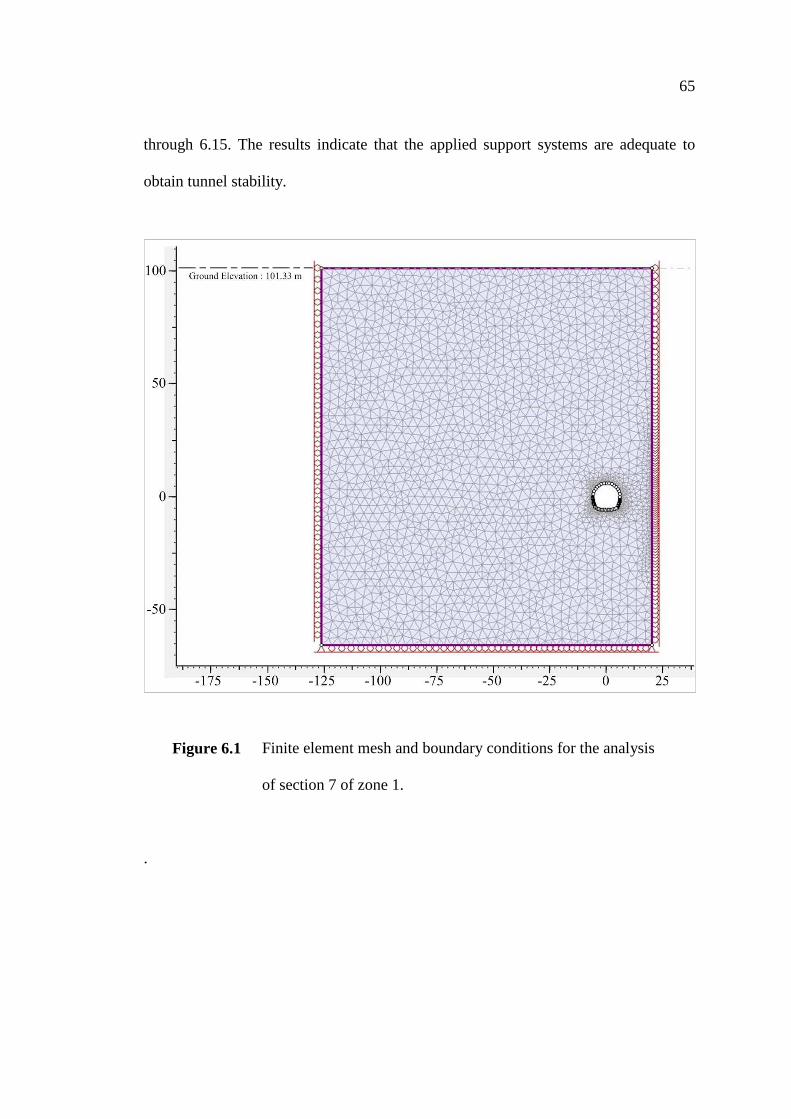
65
through 6.15. The results indicate that the applied support systems are adequate to
obtain tunnel stability.
Figure 6.1 Finite element mesh and boundary conditions for the analysis
of section 7 of zone 1.
.
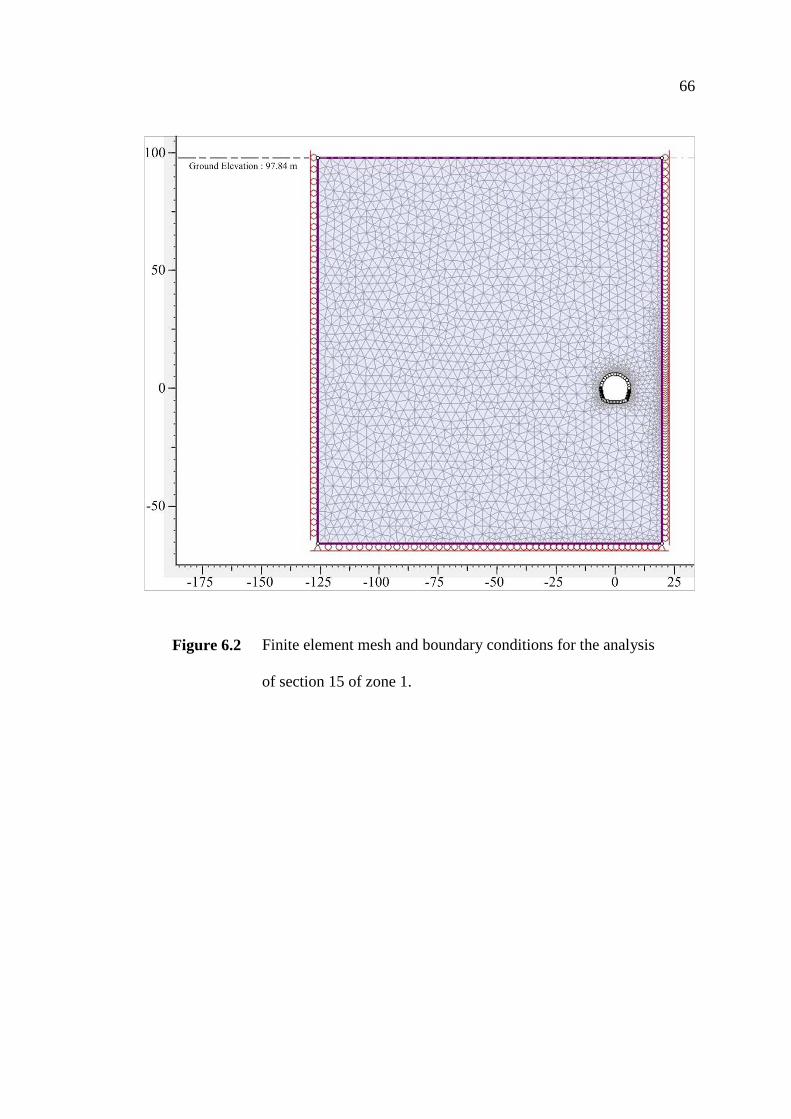
66
Figure 6.2 Finite element mesh and boundary conditions for the analysis
of section 15 of zone 1.
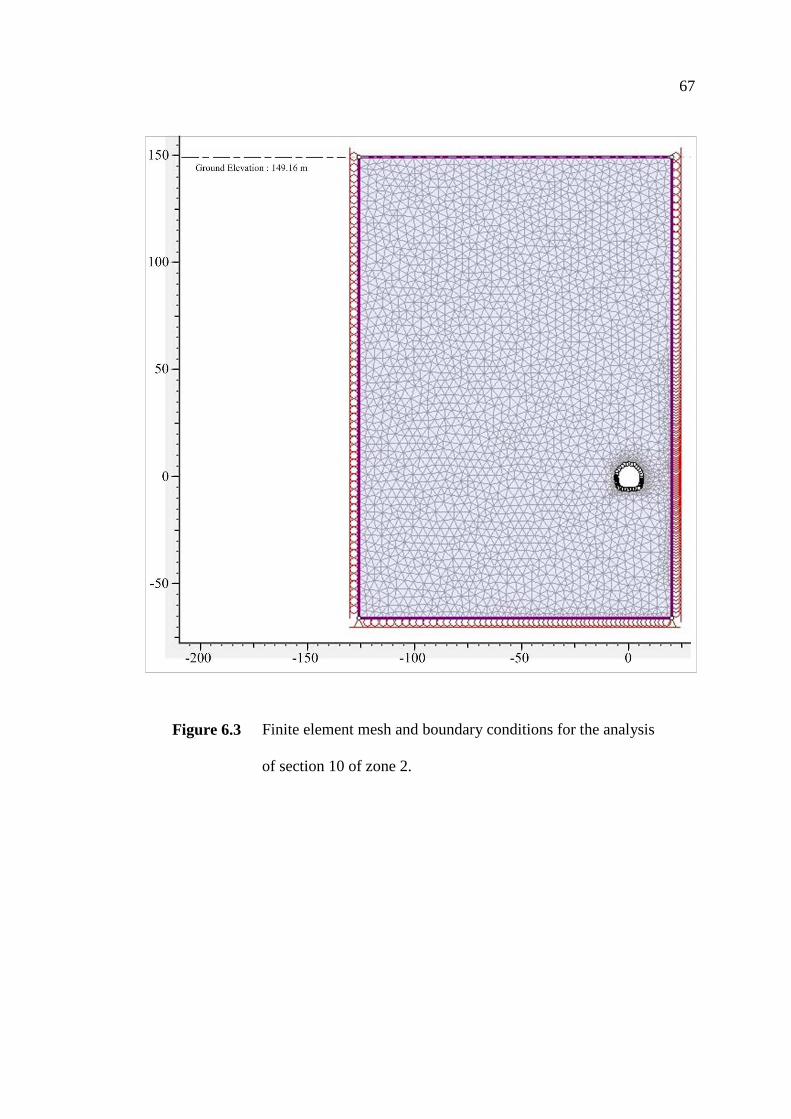
67
Figure 6.3 Finite element mesh and boundary conditions for the analysis
of section 10 of zone 2.
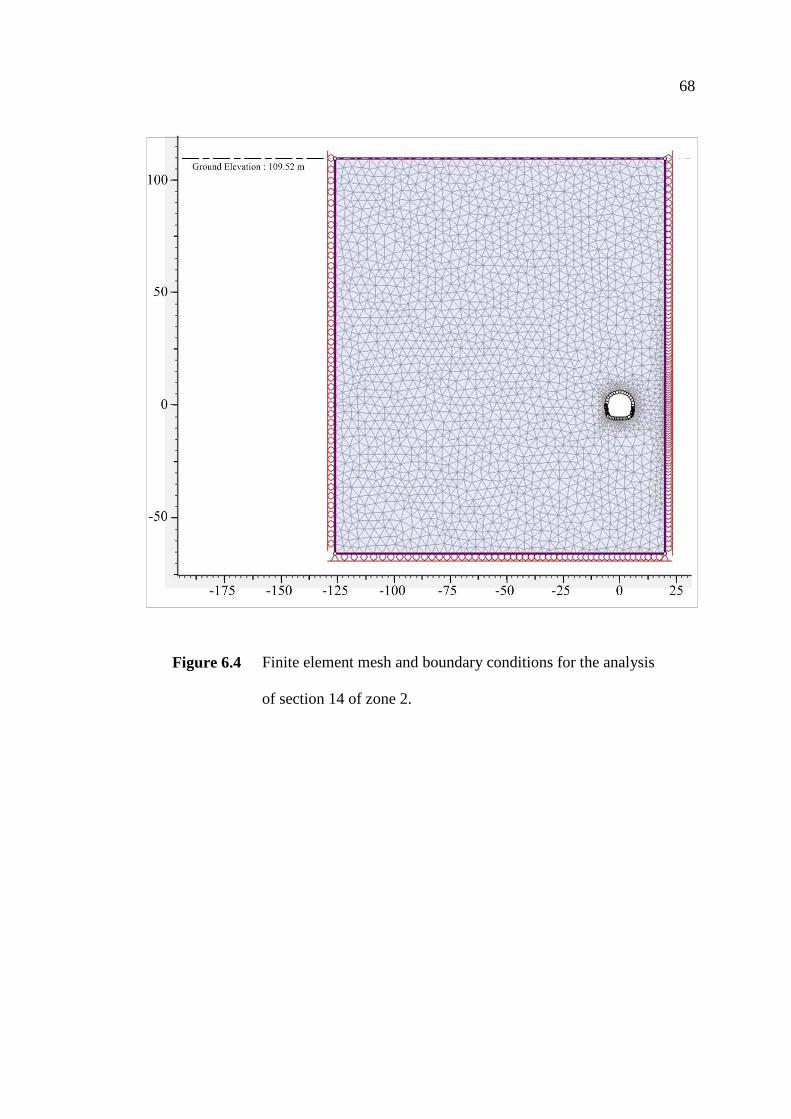
68
Figure 6.4 Finite element mesh and boundary conditions for the analysis
of section 14 of zone 2.
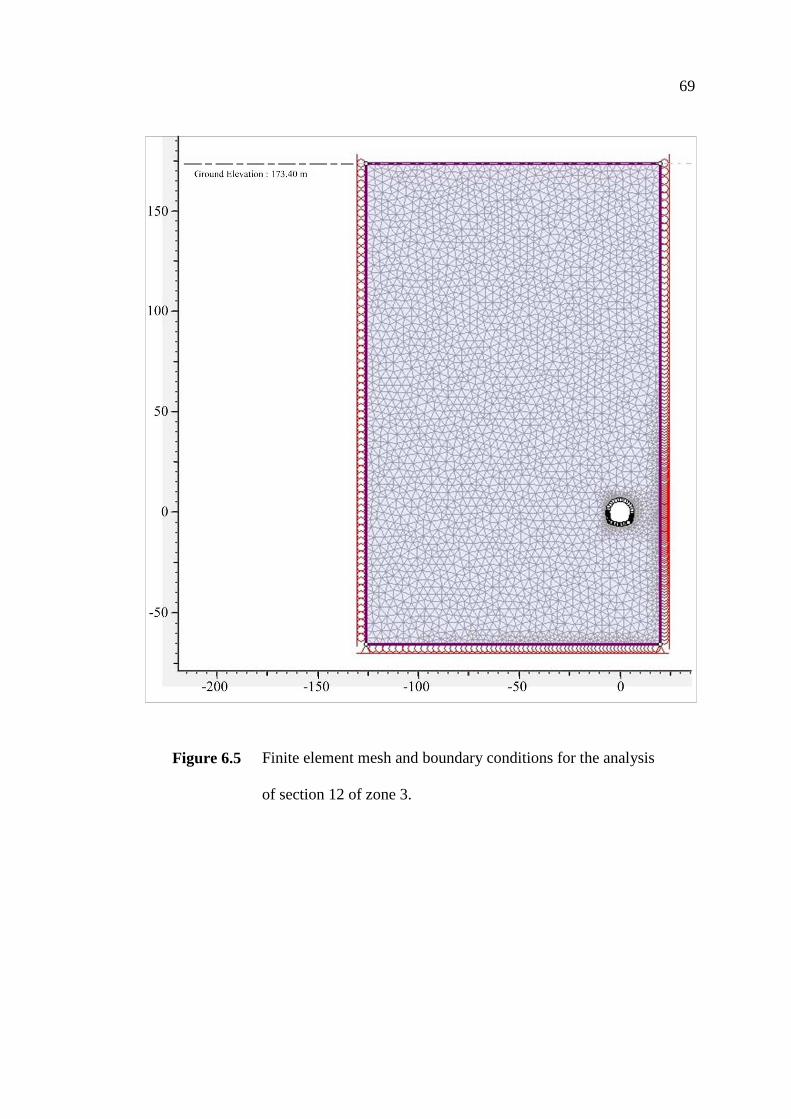
69
Figure 6.5 Finite element mesh and boundary conditions for the analysis
of section 12 of zone 3.
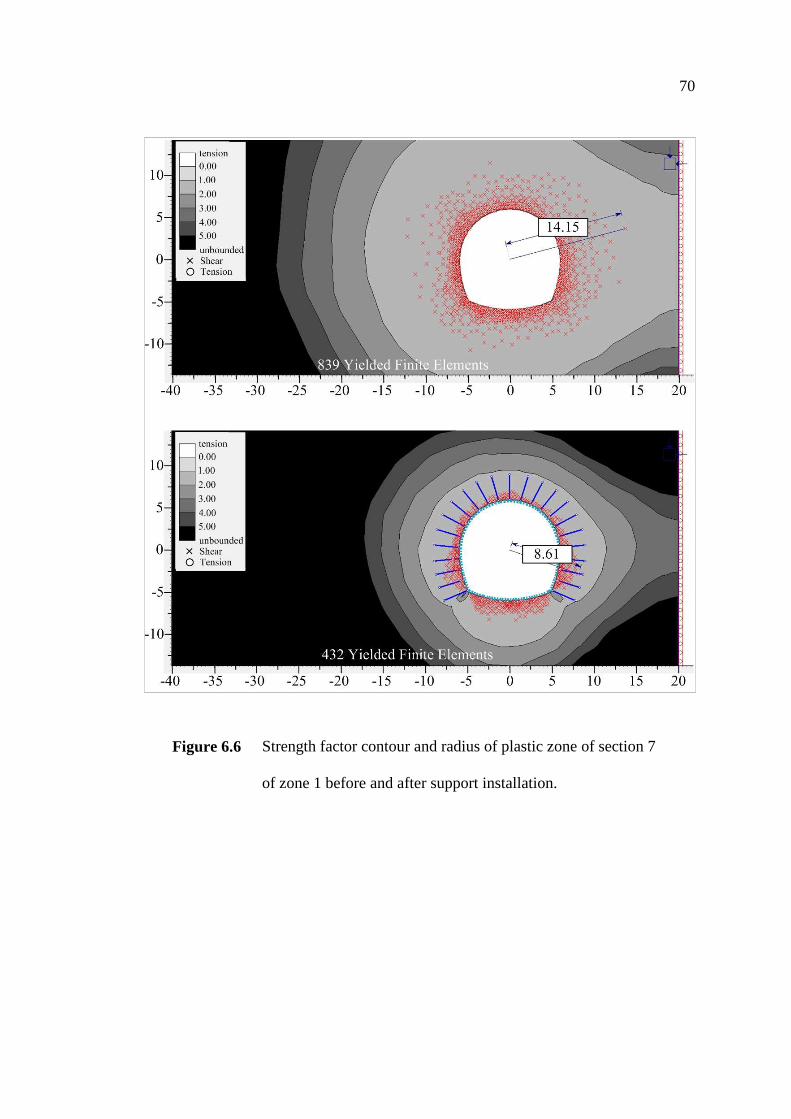
70
Figure 6.6 Strength factor contour and radius of plastic zone of section 7
of zone 1 before and after support installation.
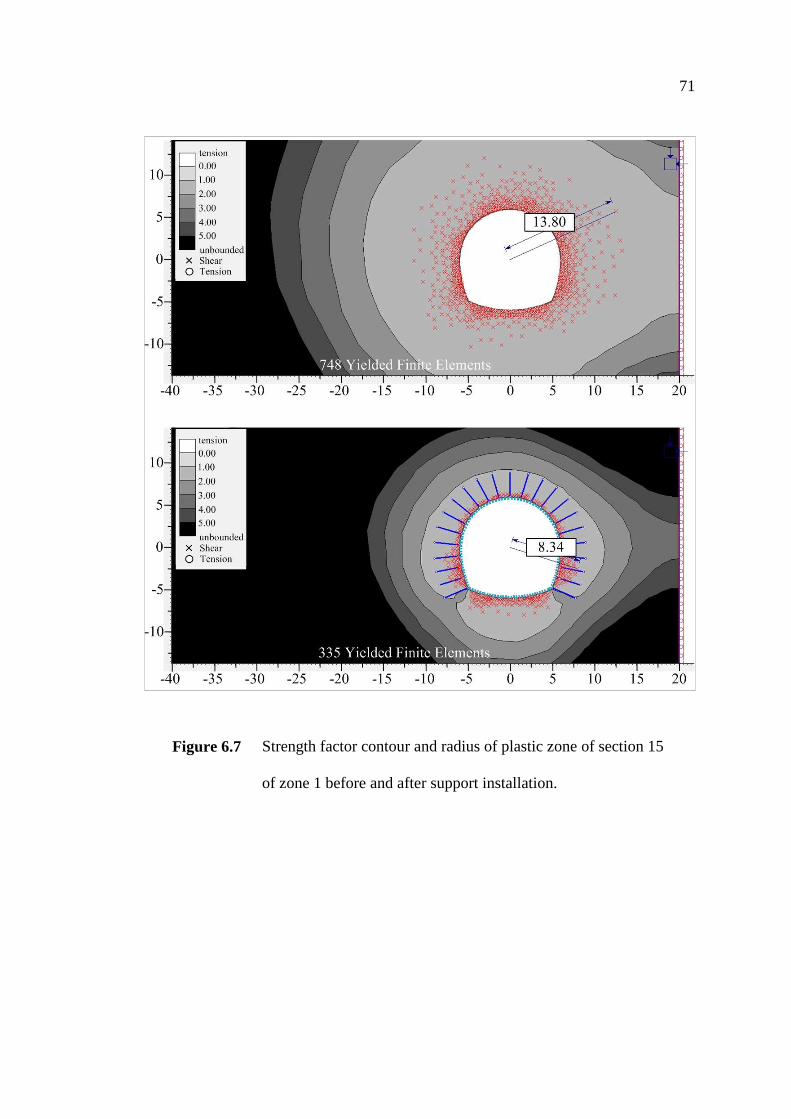
71
Figure 6.7 Strength factor contour and radius of plastic zone of section 15
of zone 1 before and after support installation.
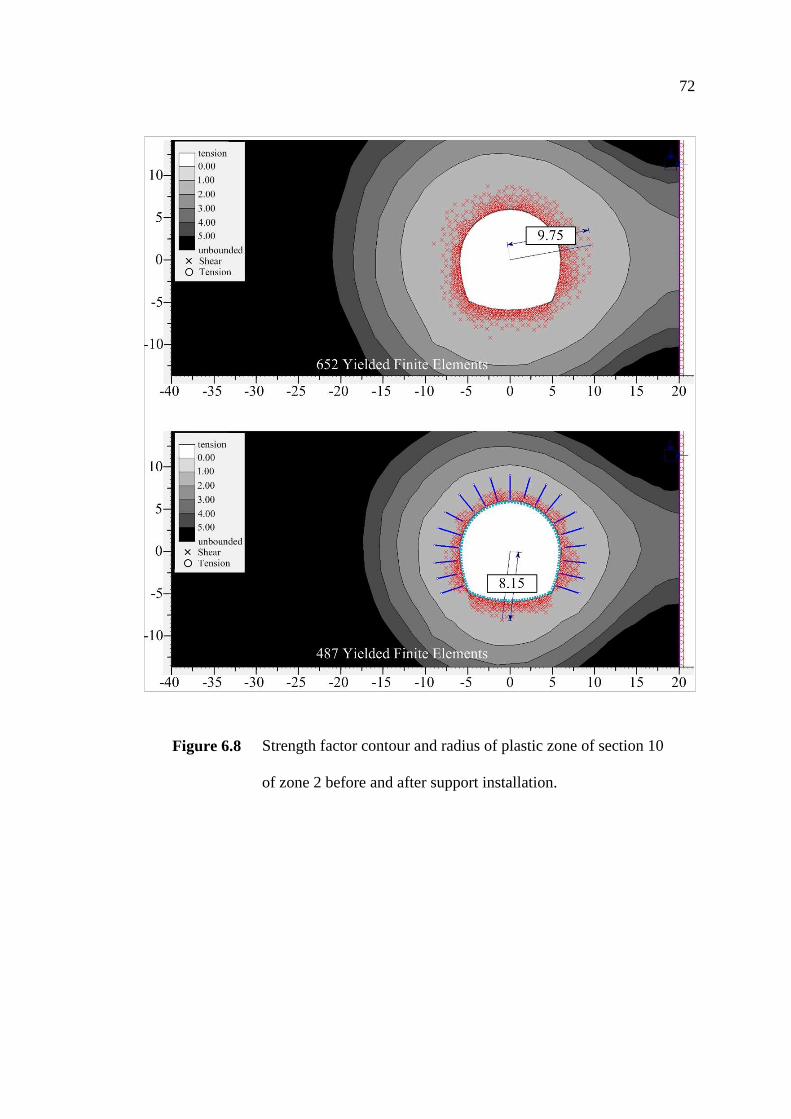
72
Figure 6.8 Strength factor contour and radius of plastic zone of section 10
of zone 2 before and after support installation.
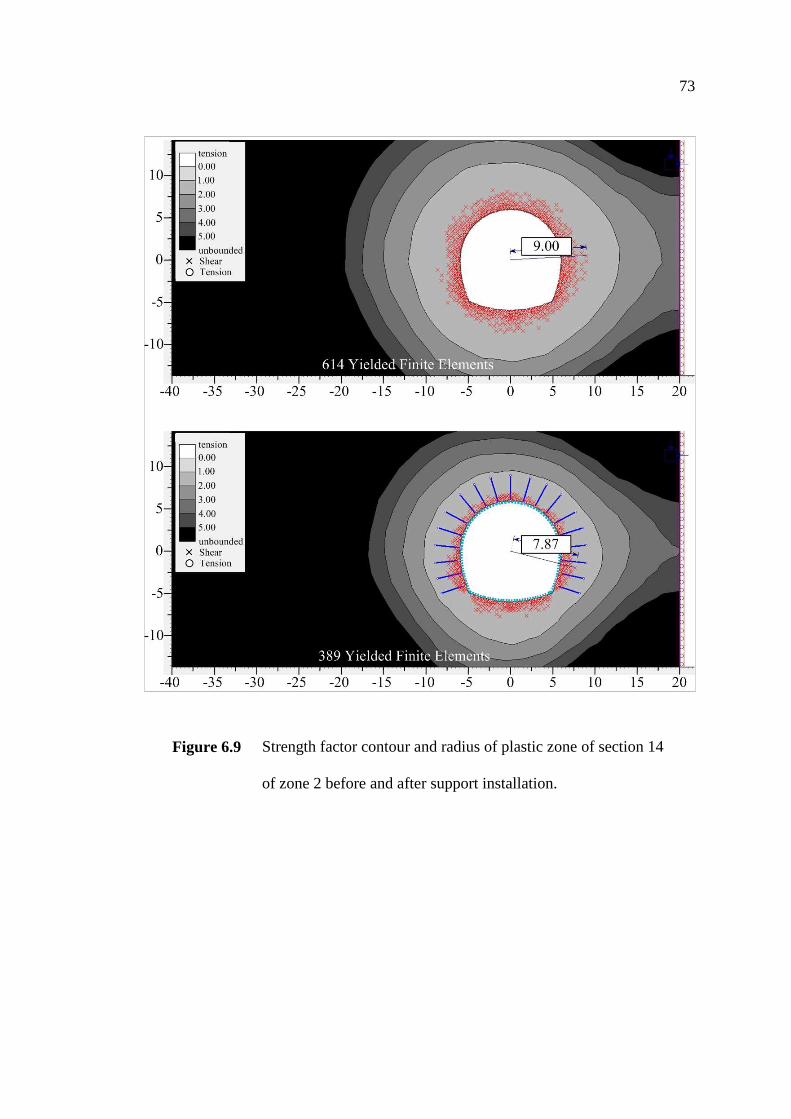
73
Figure 6.9 Strength factor contour and radius of plastic zone of section 14
of zone 2 before and after support installation.
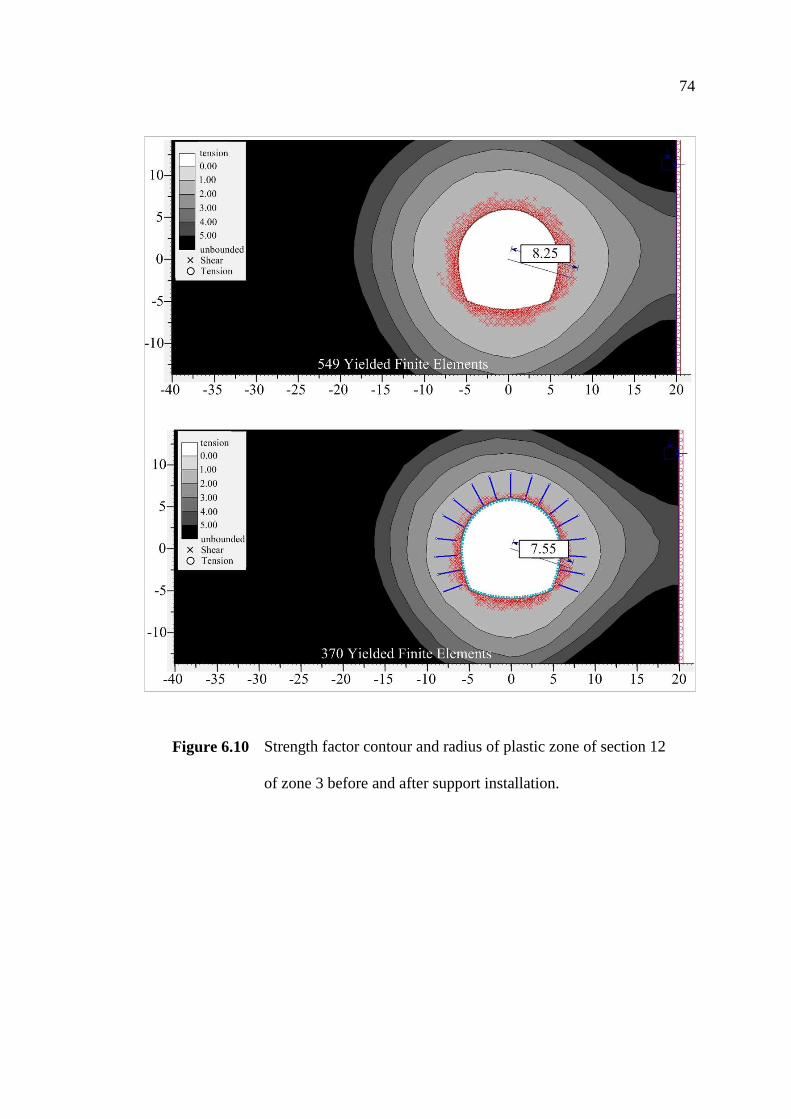
74
Figure 6.10 Strength factor contour and radius of plastic zone of section 12
of zone 3 before and after support installation.
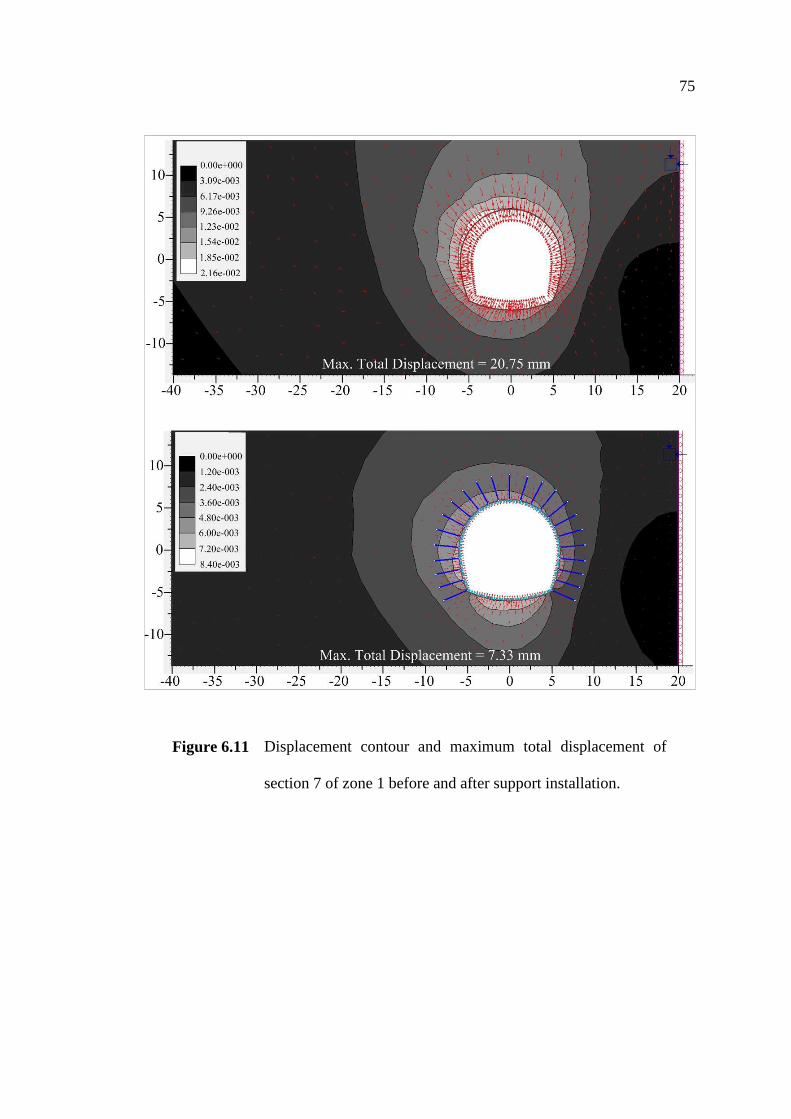
75
Figure 6.11 Displacement contour and maximum total displacement of
section 7 of zone 1 before and after support installation.
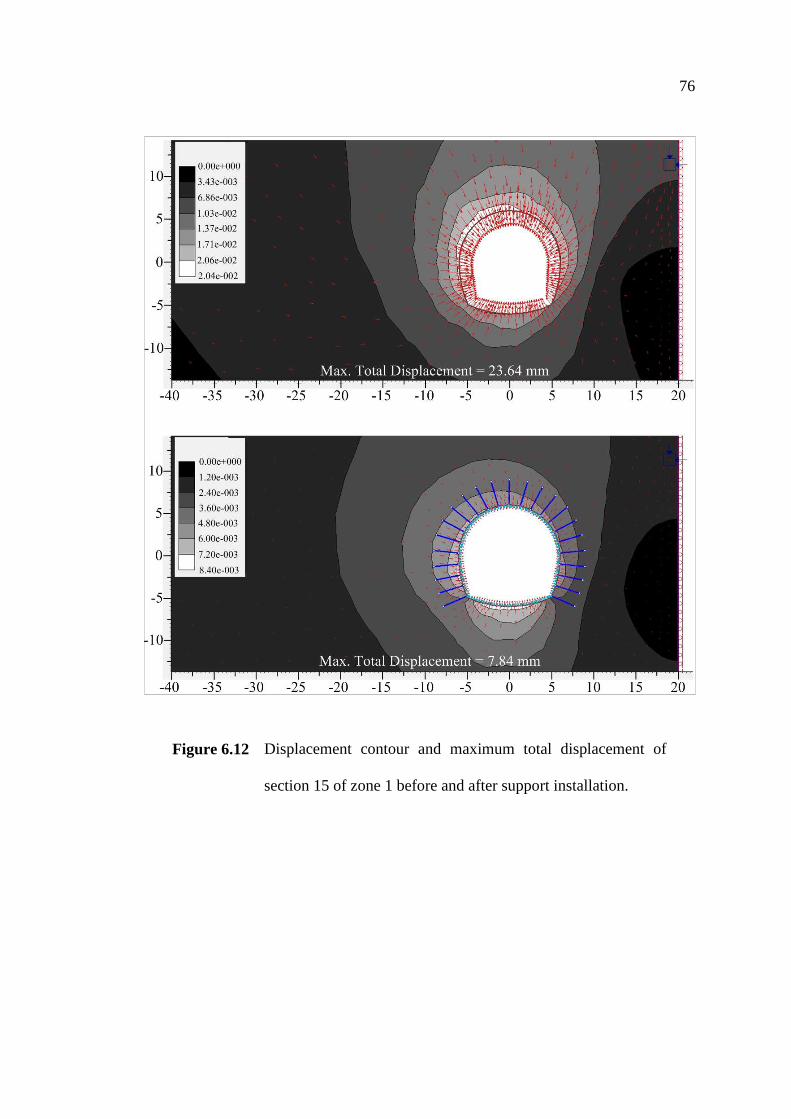
76
Figure 6.12 Displacement contour and maximum total displacement of
section 15 of zone 1 before and after support installation.
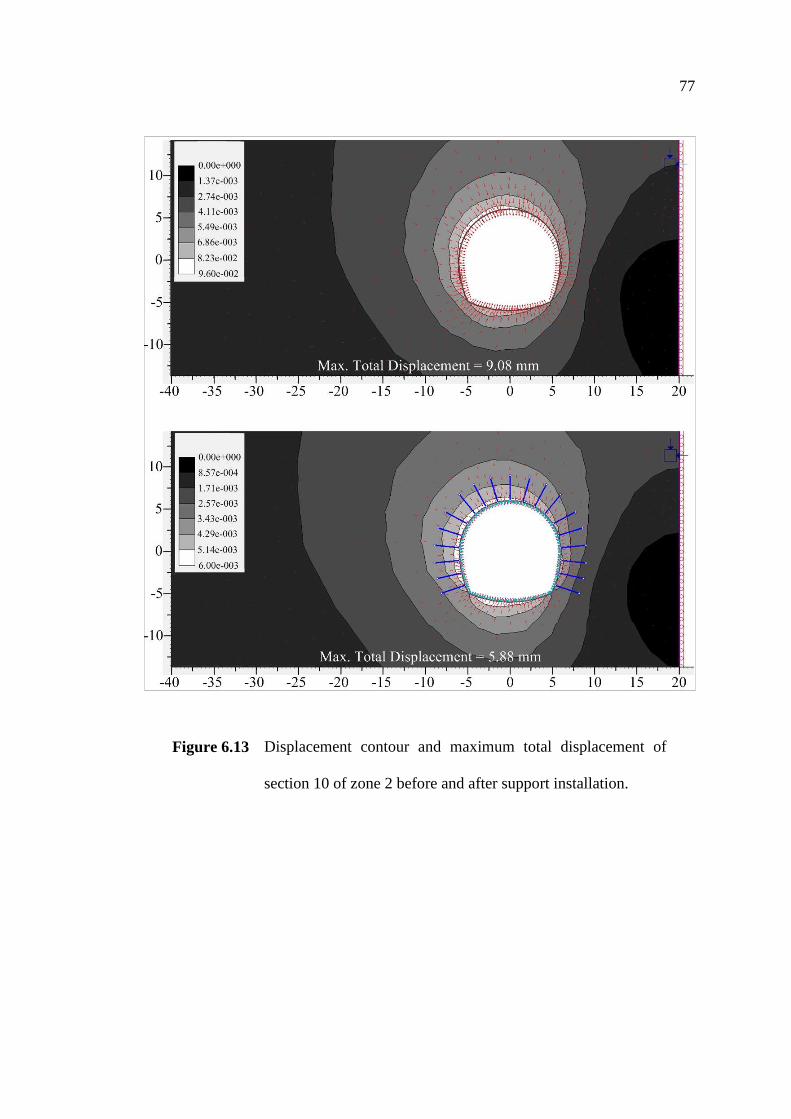
77
Figure 6.13 Displacement contour and maximum total displacement of
section 10 of zone 2 before and after support installation.
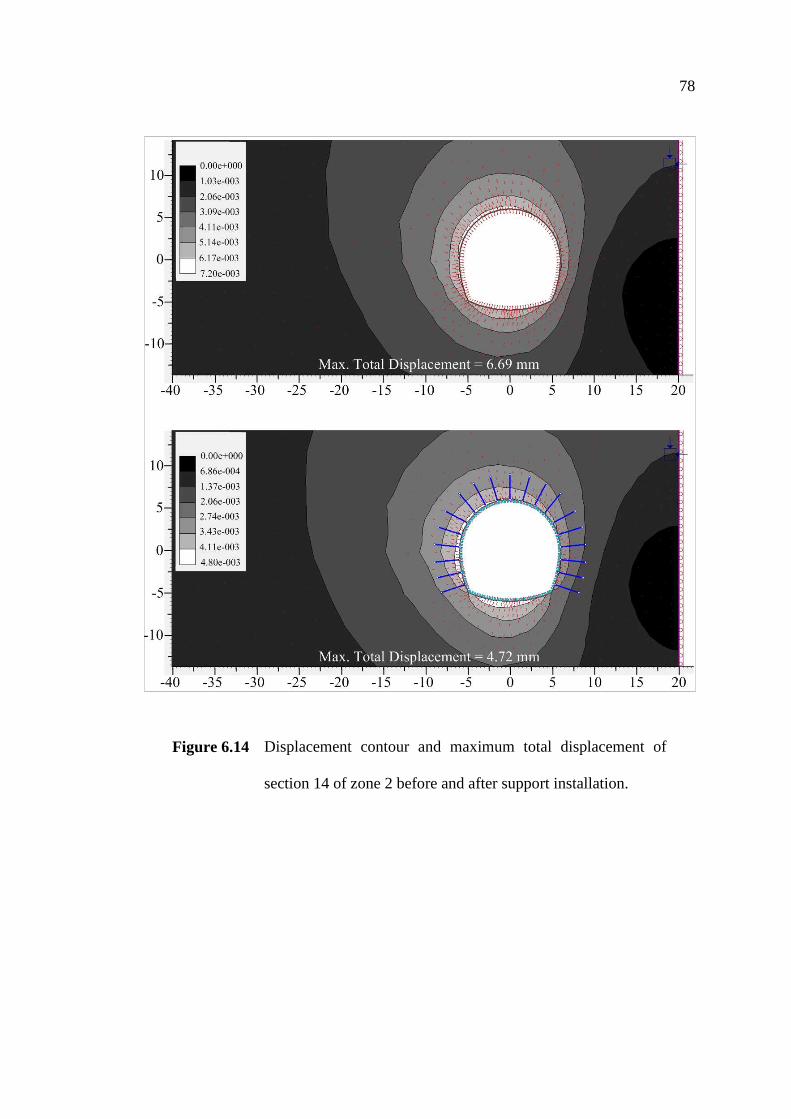
78
Figure 6.14 Displacement contour and maximum total displacement of
section 14 of zone 2 before and after support installation.
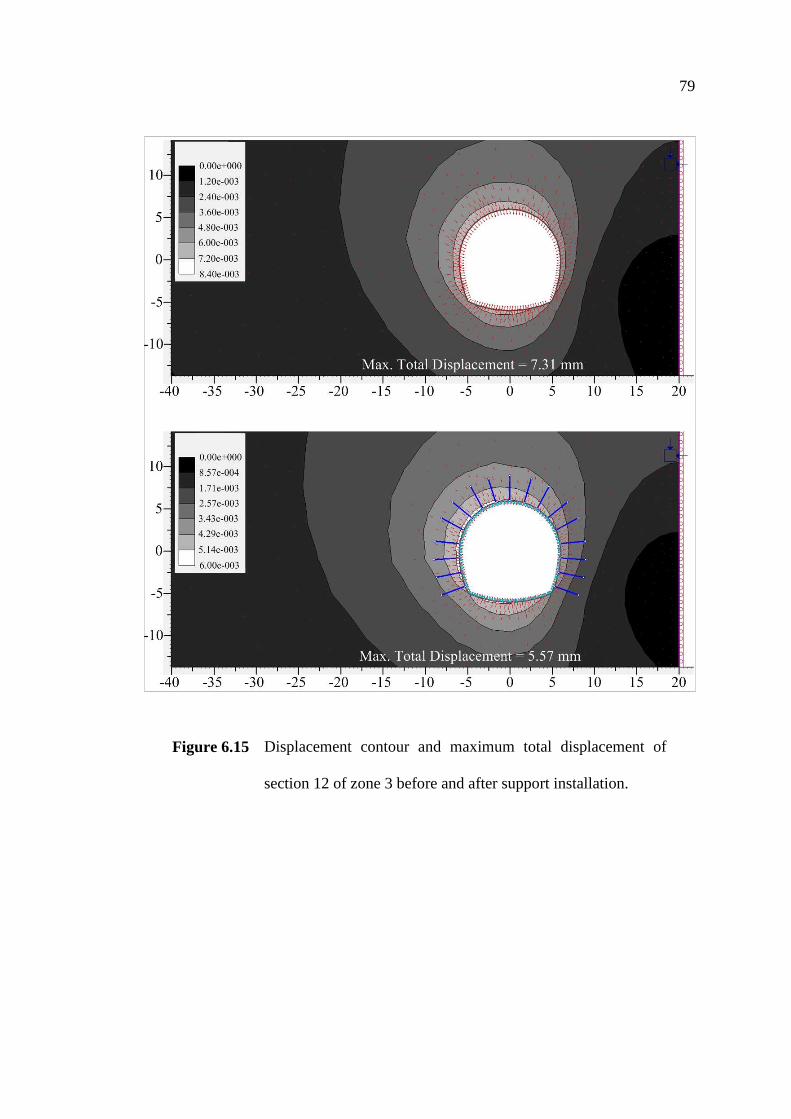
79
Figure 6.15 Displacement contour and maximum total displacement of
section 12 of zone 3 before and after support installation.
80
6.5 Comparisons
The estimation of reliable support system is one of the most difficult tasks in
rock engineering. Several systems have been developed to estimate the support
system. In the case of Manipura diversion tunnel constructions, the empirical methods
and numerical method are used to assess the reliable support system and the
comparison is made between the results obtained from empirical methods and
numerical method.
For zone 1, the rock mass rating system provides the support system
(systematic rock bolts 4-5 m long, 1-1.5 m spacing, 100-150 mm thickness shotcrete
and light to medium steel ribs spaced 1.5 m where required). The NGI tunneling
quality index (Q system) provides systematic rock bolts 2.4-3 m long, 1.3-1.5 m
spacing and 90-120 mm thickness Fibre reinforced shotcrete. The rock mass index
(RMi) system provides special bolting for roof and systematic rock bolts 1 m spacing,
and concrete lining or special design shotcrete for roof and 150-250 mm thickness
fibre reinforced shotcrete for wall. The numerical method provides systematic rock
bolts 3 m long, 1.3 m spacing, and 200 mm thickness shotcrete.
For zone 2, the rock mass rating system recommends the support system; the
systematic rock bolts 4-5 m long, 1.5-2 m spacing and 50-100 mm thickness
shotcrete. The NGI tunneling quality index (Q system) recommends providing
systematic rock bolts 2.4-3 m long, 1.7-2.1 m spacing and 50-90 mm thickness fibre
reinforced shotcrete. The rock mass index (RMi) system recommends providing 1 m
spacing rock bolts for roof and 1.25 m spacing for wall, and 150-250 mm thickness
fibre reinforced shotcrete for roof and 100-150 mm thickness fibre reinforced
81
shotcrete for wall. The numerical method recommends providing systematic rock
bolts 3 m long, 1.5 m spacing, and 150 mm thickness shotcrete.
For zone 3, the rock mass rating system suggests the support system; the
systematic rock bolts 4 m long, 1.5-2 m spacing and 50-100 mm thickness shotcrete.
The NGI tunneling quality index (Q system) suggests providing the systematic rock
bolts 2.4-3 m long, 1.7-2.1 m spacing and 40-100 mm thickness unreinforced
shotcrete. The rock mass index (RMi) system suggests providing 1.25 m spacing rock
bolts for roof and 1.5 m spacing for wall, and 100-150 mm fibre reinforced shotcrete
for roof and 70-100 mm thickness fibre reinforced shotcrete for wall. The numerical
method provides systematic rock bolts 3 m long, 1.5 m spacing, and 120 mm
thickness shotcrete.
The rock mass rating system suggests longer rock bolt than do numerical
method and other empirical methods. The thickness of shotcrete is similar with
numerical method. The support systems suggested by NGI tunneling quality index (Q
system) has thinner shotcrete thickness than does numerical method. The rock mass
index (RMi) suggests overestimate support systems than numerical method and other
empirical methods. Kaiser and Gale (1985) indicated that the Q system gave a better
forecast of support quantities. The results from the rock mass rating system and NGI
tunneling quality index (Q system) reasonably agree with numerical method. Very
small discrepancies remain.
CHAPTER VII
DISCUSSIONS, CONCLUSIONS, AND
RECOMMENDATIONS FOR FUTURE STUDIES
7.1 Discussions
In this study, empirical methods are applied along with numerical method to
assess reliable support systems for rock zones around the Manipura twin tunnels. The
RMR system considers the orientation of discontinuities and material strength, which
are not directly included in the Q system. However, the Q system considers stress and
the joint set number of rock mass, which are only indirectly considered in the RMR
system. Both systems include condition of discontinuities and ground water. The
largest difference between the RMR and Q systems is the lack of stress parameters in
the RMR system. The RMi system has similar input parameters to those of Q system.
The RMi system applies best to massive, jointed and crushed rock masses where the
joints in the various sets have similar properties. The GSI system is based on the
visual impression of the rock structure, in terms of blockiness, and the surface
condition of the discontinuities indicated by joint roughness and alternation. All
empirical methods have their characteristic limitations to achieve their objectives,
therefore, to overcome these limitations, the rock mass strength parameters along the
tunnel alignment are estimated by four different empirical methods and their average
values are used as input parameters for finite element analysis.
83
For the rock support systems of the Manipura diversion tunnels, the results
indicate that the numerical method suggests more shotcrete thickness than do the
empirical methods. The empirical methods suggest longer rock bolt than does the
numerical method. This may be because the numerical method considers the
overburden as continuous medium and the empirical methods considers the
overburden as discontinuous medium.
The comparison is made between the support systems obtained from empirical
methods and the results obtained from numerical method for every zone. After several
trials of the finite element program are carried out based on the support systems
suggested by empirical methods, the final reasonable estimate of tunnel support
systems are determined as shown in Table 7.1.
In addition, the excavation methods which are top heading and bench cut
excavation method (1.0-1.7 m advance in top heading, install support concurrently
with excavation and 10 m from face) is recommended. Concrete lining or special
design shotcrete is suggested to support at the corners of the tunnel floor to prevent
high stress concentration caused by corner effect.
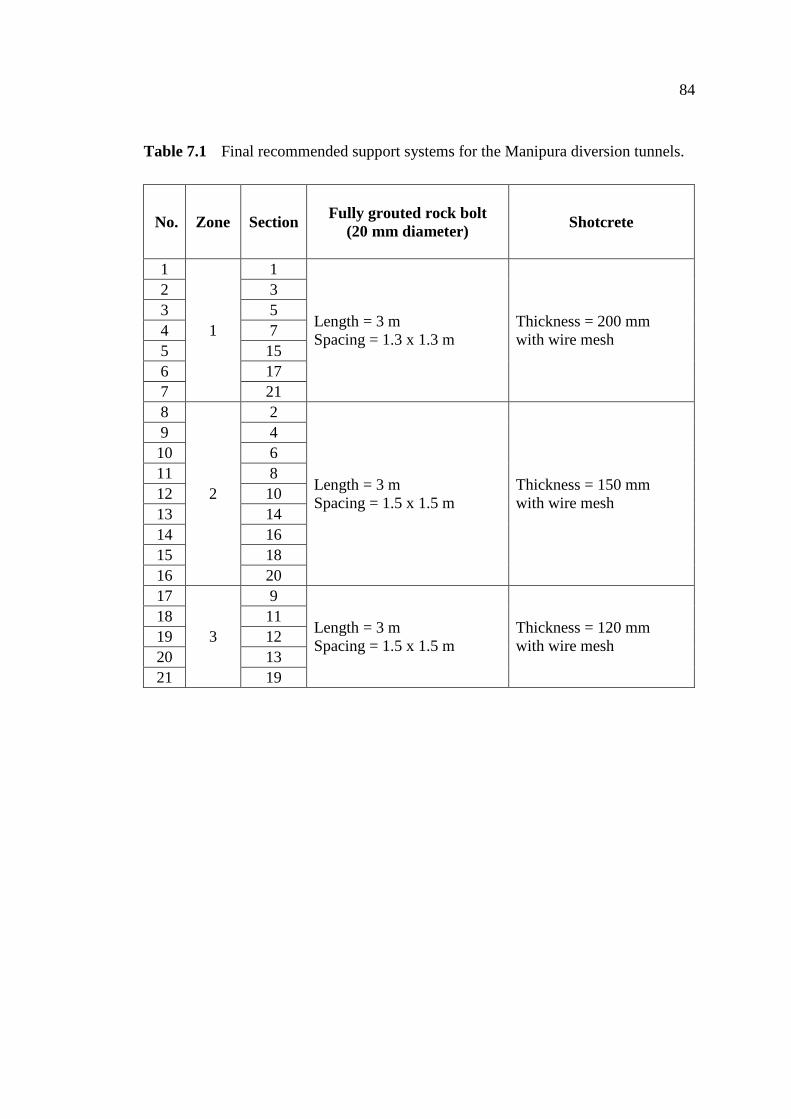
84
Table 7.1 Final recommended support systems for the Manipura diversion tunnels.
No. Zone Section Fully grouted rock bolt (20 mm diameter)
Shotcrete
1
1
1
Length = 3 m Spacing = 1.3 x 1.3 m
Thickness = 200 mm with wire mesh
2 3 3 5 4 7 5 15 6 17 7 21 8
2
2
Length = 3 m Spacing = 1.5 x 1.5 m
Thickness = 150 mm with wire mesh
9 4 10 6 11 8 12 10 13 14 14 16 15 18 16 20 17
3
9
Length = 3 m Spacing = 1.5 x 1.5 m
Thickness = 120 mm with wire mesh
18 11 19 12 20 13 21 19
85
7.2 Conclusions
Rock masses along the Manipura tunnel alignment are characterized by means
of rock mass classification systems based on the vertical borehole data, field
investigations, engineering geological observations and laboratory test results.
According to the results acquired from the rock mass characterizations and stability
analysis, there are some stability problems in each zone. The empirical methods, rock
mass classification systems, are also employed to estimate support requirements and
required support capacities for the diversion tunnels. Five numerical models are
constructed by using finite element software, Phase2 code, to determine the induced
stresses, deformations developed around the tunnel and evaluate the performance of
the support system recommended by the empirical methods.
The strength parameters required for finite element analysis are estimated
from the rock mass classification systems including rock mass rating system (RMR),
NGI tunneling quality index (Q system), rock mass index (RMi) and geological
strength index (GSI). Used support elements are rock bolts and shotcrete as proposed
by the empirical methods. The properties of support elements including length,
pattern of bolts and the thickness of shotcrete are similar to those proposed by RMR
system and Q system. Several iterations of the finite element program are performed
to assess the more appropriate support elements. It leads to the final reasonable
estimate of tunnel support systems. When the recommended support systems have
been applied, the number of yielded elements and displacements are reduced
significantly in numerical analysis. These results indicate that the recommended
applied support systems are adequate to obtain tunnel stability. It also proves that the
empirical methods reasonably agree with numerical method.
86
In many tunnel support designs, empirical methods are widely used due to
their simplicity, however, they fail to predict interaction between the surrounding
rock mass and supporting system.
Based on the result findings, it can be postulated that empirical methods
should be applied together with numerical method for the safe tunnel support design.
A great deal of judgment may be needed in the application of all kinds of rock mass
classification systems in support design.
7.3 Recommendations for Future Studies
Hoek and Brown failure criterion has been used in this research. This failure
criterion is widely accepted and has been used in a large number of projects around
the world. In addition, the use of the Mohr-Coulomb criterion with strength
parameters (cohesion and friction angle) is desirable to assess the effects of
discontinuity conditions. The friction angle of the rock mass can be interpreted as the
friction resistance along pre-existing discontinuities and asperities on these
discontinuities (overriding of asperities). The cohesion can be thought of as the shear
resistance of intact rock bridges in the rock mass, or the shear resistance of asperities
on a discontinuity surface (shear through asperities). Therefore, studying the
application of Mohr-Coulomb criterion for the estimation of underground support
systems should be conducted. Moreover, the validity of the proposed support systems,
obtained from combination of empirical and numerical method, should be checked by
comparing predictions of the rock mass quality with actual measurements carried out
during construction.
REFERENCES
ASTM D 7012-07. Compressive strength and elastic moduli of intact rock core
specimens under varying states of stress and temperatures In Annual Book
of ASTM Standards. Philadelphia, PA: 04.08. West Conshohocken:
American Society for Testing and Materials.
Barton, N. (2002). Some new Q-value correlations to assist in site characterization
and tunnel design. International Journal of Rock Mechanics and Mining
Sciences 39: 185-216.
Barton, N., Lien, R., and Lunde, J. (1974). Engineering classification of rock masses
for the design of tunnel support. Rock Mechanics 6: 183-236.
Basarir, H., Ozsan, A., and Karakus, M. (2005). Analysis of support requirements for
a shallow diversion tunnel at Guledar dam site, Turkey. Engineering
Geology 81: 131-145.
Bieniawski, Z. T. (1973). Engineering classification of jointed rock masses.
Transactions, South African Institution of civil Engineer 15: 335-344.
Bieniawski, Z. T. (1974). Advances in rock mechanics 2. Washington, D.C.:
National Academy of Science.
Bieniawski, Z. T. (1976). Rock mass classification in rock engineering. In
Proceeding of the Symposium on Exploration for Rock Engineering (pp
97-106). Johannesburg, South Africa: Geotechnical Division of the South
African Institution of Civil Engineers and the South African National Group
on Rock Mechanics.
88
Bieniawski, Z. T. (1978). Determining rock mass deformability. Experience from
case histories. International Journal of Rock Mechanics and Mining
Science & Geomechanics Abstracts 15: 237-147.
Bieniawski, Z. T. (1979). The geomechanics classification in rock engineering
application. In Proceeding of the 4th International Congress on Rock
Mechanics (pp 41-48). Montreux, Switzerland: Plenum.
Bieniawski, Z. T. (1983). The geomechanics classification (RMR System) in design
applications to underground excavations. In Proceeding of the
International Symposium on Engineering Geology and Underground
Construction (pp 33-47). Lisbon, Portugal: LNEC.
Bieniawski, Z. T. (1986). Rock mass classification in rock engineering. In Z. T.
Bieniawski and A. A. Balkema (Eds.). Exploration for rock engineering
(pp. 97-106). Johannesburg, South Africa.
Bieniawski, Z. T. (1989). Engineering rock mass classifications: A complete
manual for engneers and geologists in mining, civil, and petroleum
engineering. New York, NY: John Wiley & Sons.
Deere, D. U. (1989). Rock Quality Designation (RQD) after twenty years. In U.S.
Armey Corps of Engineers Contract Report GL-89-1 (pp. 67).
Vicksburg, MS: Waterways Experiment Station.
Deere, D. U., Hendron, A. J., Patton, F. D., and Cording, E. J. (1967). Design of
surface and near surface construction in rock. In Proceeding of the 8th US
Symposium on Rock Mechanics (pp 237-302). New York, NY: AIME.
89
Genis, M., Basarir, H., Ozarslan, A., Bilir, E., and Balaban, E. (2007). Engineering
geological appraisal of the rock masses and preliminary support design.
Engineering Geology 92: 14-26.
Goel, R. K. (1994). Correlations for predicting support pressures and closures in
tunnels. PhD Thesis, Nagpur University, Nagpur, India.
Goel, R. K., Jethwa, J. L., and Paithankar, A. G. (1995). Indian experiences with Q
and RMR systems. Tunnelling and Underground Space Technology 10:
97-109.
Grimstad, E. and Barton, N. (1993). Updating of the Q-system for NMT. In
Proceeding of the International Symposium on Sprayed Concrete (pp
46-66). Fagernes, Oslo: Norwegian Concrete Association.
Hoek, E. (2003). Numerical modeling for shallow tunnels in weak rocks
[On-line]. Available: http://www.rocscience.com.
Hoek, E. and Brown, E. T. (1988). The Hoek-Brown failure criterion, a 1988 update.
In Proceeding of the 15th Canadian Rock Mechanics Symposium (pp 31-
48). Toronto, Canada: University of Toronto.
Hoek, E. and Brown, E. T. (1990). Underground excavations in rock. London, UK:
Institution of Mining and Metallurgy.
Hoek, E. and Brown, E. T. (1997). Practical estimates or rock mass strength.
International Journal of Rock Mechanics and Mining Science &
Geomechanics Abstracts 34: 1165-1186.
90
Hoek, E., Carranza-Torres, C., and Corkum, B. (2002). Hoek-Brown failure criterion.
In Proceeding of the 5th North American Rock Mechanics Symposium
and the 17th Tunnelling Association of Canada Conference (pp 267-
273). Toronto, Ontario: University of Toronto.
Hoek, E. and Diederichs, M. S. (2005). Empirical estimation of rock mass modulus.
International Journal of Rock Mechanics and Mining Sciences 43: 203-
215.
Hoek, E., Kaiser, P. K., and Bawden, W. F. (1995). Support of underground
excavations in hard rock. Rotterdam, The Netherlands: Balkema,
Rotterdam.
Hoek, E., Marinos, P., and Benissi, M. (1998). Applicability of the geological
strength index (GSI), Classification for very weak and sheared rock masses.
The case of the Athens Schist Formation. Bulletin of Engineering Geology
and the Environment 57: 151-160.
ISRM (1981). Rock characterization, testing and monitoring. In E. T. Brown (Ed.),
ISRM Suggested methods (pp. 211). New York, NY: Pergamon.
Kaiser, T. K. and Gale, A. D. (1985). Evaluation of cost and emprical support
design at B.C. rail tumbler ridge tunnels Canadian tunneling. New
York, NY: Tunneling Association of Canada, Wiley.
Mahtab, M. A. and Grasso, P. (1992). Geomechanics principles in the design of
tunnels and caverns in rocks. New York, NY: Elsevier.
91
Marinos, P. and Hoek, E. (2000). GSI: A geologically friendly tool for rock mass
strength estimation. In Proceeding of the International Conference on
Geotechnical and Geological Engineering (pp 1422-1442). Melbourne:
ICMS.
Marinos, P. and Hoek, E. (2001). Estimating the geotechnical properties of
heterogeneous rock masses such as flysch. Bulletin of the Engineering
Geology & the Environment 60: 85-92.
Oo, Z. S. (2003). Systematic approach to geotechnical investigation of `Ye Nwe
diversion tunnel. M. Eng. Thesis, Yangon Technological University,
Yangon, Myanmar.
Ozsan, A. and Basarir, H. (2002). Support capacity estimation of a diversion tunnel in
weak rock. Engineering Geology 68: 319-331.
Palmstrom, A. (1982). The volumetric joint count - a useful and simple measure of
the degree of rock jointing. In Proceeding of the 4th International
Congress, International Association of Engineering Geology (pp 221-
228). Dehli: Indian Society of Engineering Geology.
Palmstrom, A. (1995). RMi - A rock mass characterization system for rock
engineering purposes. Ph.D. Thesis, University of Oslo, Norway.
Palmstrom, A. (2001). RMi-calc., version 2 and RMi support, version 3.1
[On-line]. Available: http://www.rockmass.net.
Palmstrom, A. (2009). Combining the RMR, Q, and RMi classification systems
[On-line]. Available: http://www.rockmass.net.
92
Palmstrom, A. and Broch, E. (2006). Use and misuse of rock mass classification
systems with particular reference to the Q-system. International Journal of
Tunnels and Underground Space Technology 21: 575-593.
Ramamurthy, T. (1986). Stability of rock mass. the 8th Annual Lecture, Indian
Geotech Journal 12: 1-74.
Rasouli, M. (2009). Engineering geological studies of the diversion tunnel focusing
on stabilization analysis and support design, Iran. Engineering Geology
108: 208-224.
Read, S. A. L., Richards, L. R., and Perrin, N. D. (1999). Applicability of the Hoek-
Brown failure criterion to New Zealand greywacke rocks. In Proceeding of
the 9th International Society for Rock Mechanics Congress (pp 655-660).
Paris, France: Pergamon.
Ritter, W. (1879). Die Statik der Tunnelgewölbe. Berlin: Springer.
Rocscience (2004). RocData User's Guide [On-line]. Available:
http://www.roccscience.com.
Rocscience (2007). Phase2 User's Guide [On-line]. Available:
http://www.rocscience.com.
Serafim, J. L. and Pereira, J. P. (1983). Considerations of the geomechanics
classification of Bieniawski. In Proceeding of the International
Symposium Engineering Geology and Underground Construction (pp
1133-1142). Rotterdam, The Netherlands: Balkema, Rotterdam.
Singh, B., Viladkar, M. N., Samadhiya, N. K., and Mehrota, V. K. (1997). Rock mass
strength parameters mobilized in tunnels. Tunneling and Underground
Space Technology 12: 47-54.
93
Sonmez, H. (2001). Investigation of the applicability of the Hoek-Brown criteria
to the failure behaviour of the fissured clays. Ph.D. Thesis, Hacettepe
University, Ankara, Turkey.
Sonmez, H. and Ulusay, R. (1999). Modifications to the Geological Strength Index
(GSI) and their applicability to stability of slopes. International Journal of
Rock Mechanics and Mining Sciences 36: 743-760.
Win, H. A. K. and Aung, K. (2007). Engineering Geology Office 2 Report.
Myanmar: Irrigation Department.
APPENDIX A
TECHNICAL PUBLICATIONS
PUBLICATIONS
Soe, B. and Fuenkajorn, K. (2010). Analysis of support design for Manipura
diversion tunnels in Myanmar. In Proceeding of EIT-JSCE Joint
Symposium on Engineering for Geo-Hazards: Earthquakes and Landslides -
for Surface and Subsurface Structures, Bangkok, Thailand, 6-8 September,
2010.
Soe, B. and Fuenkajorn, K. (2010). Stability analysis and support design of
Manipura diversion tunnels in Myanmar. In Proceeding of the ISRM
International Symposium 2010 and 6th Asian Rock Mechanics Symposium,
New Delhi, India, 23-28 October, 2010.
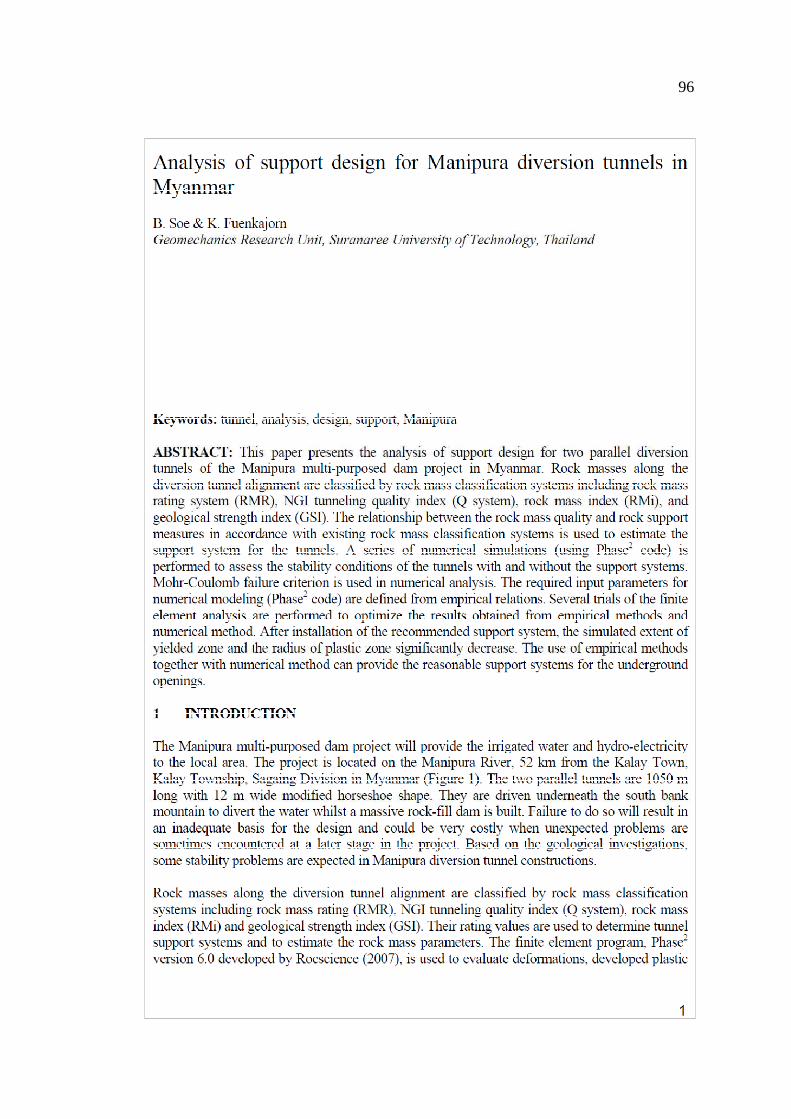
96
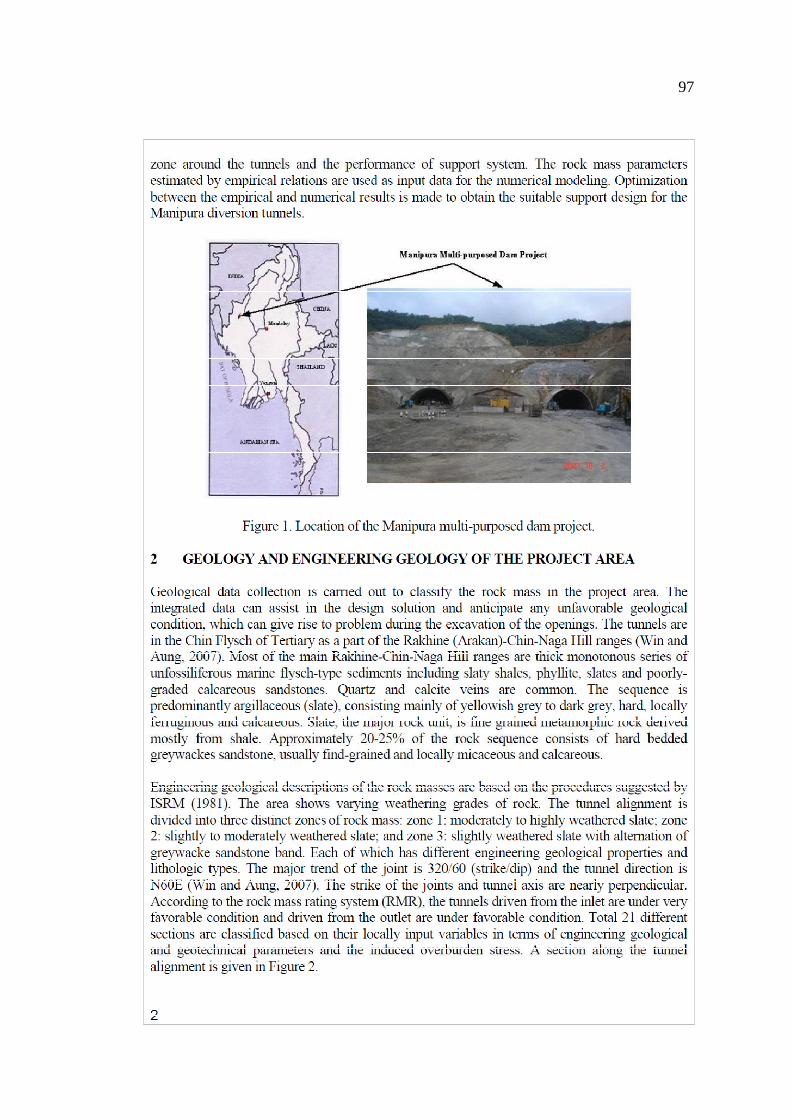
97
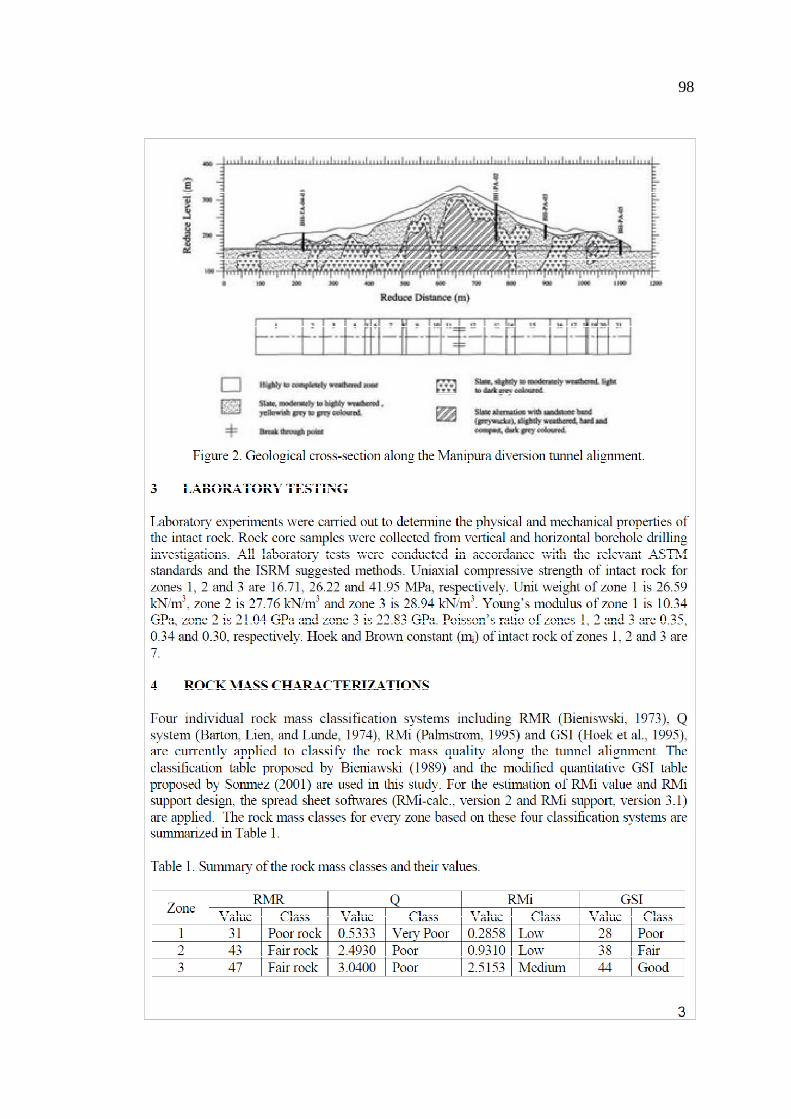
98
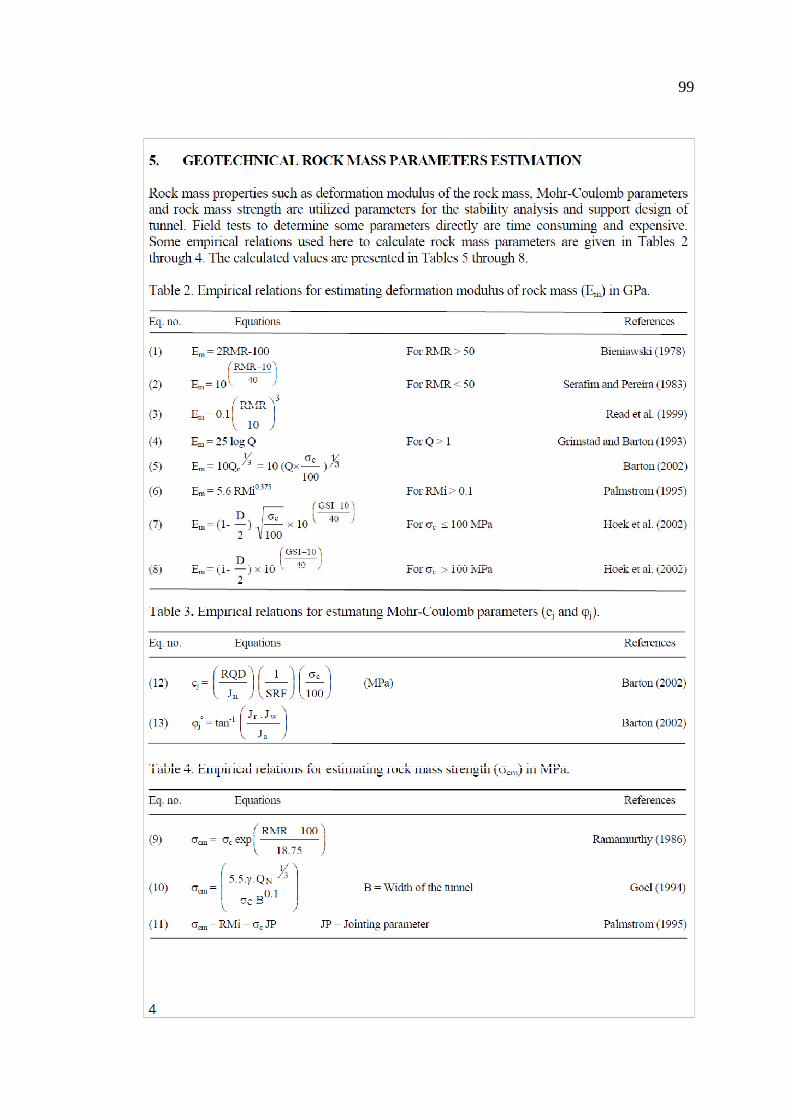
99
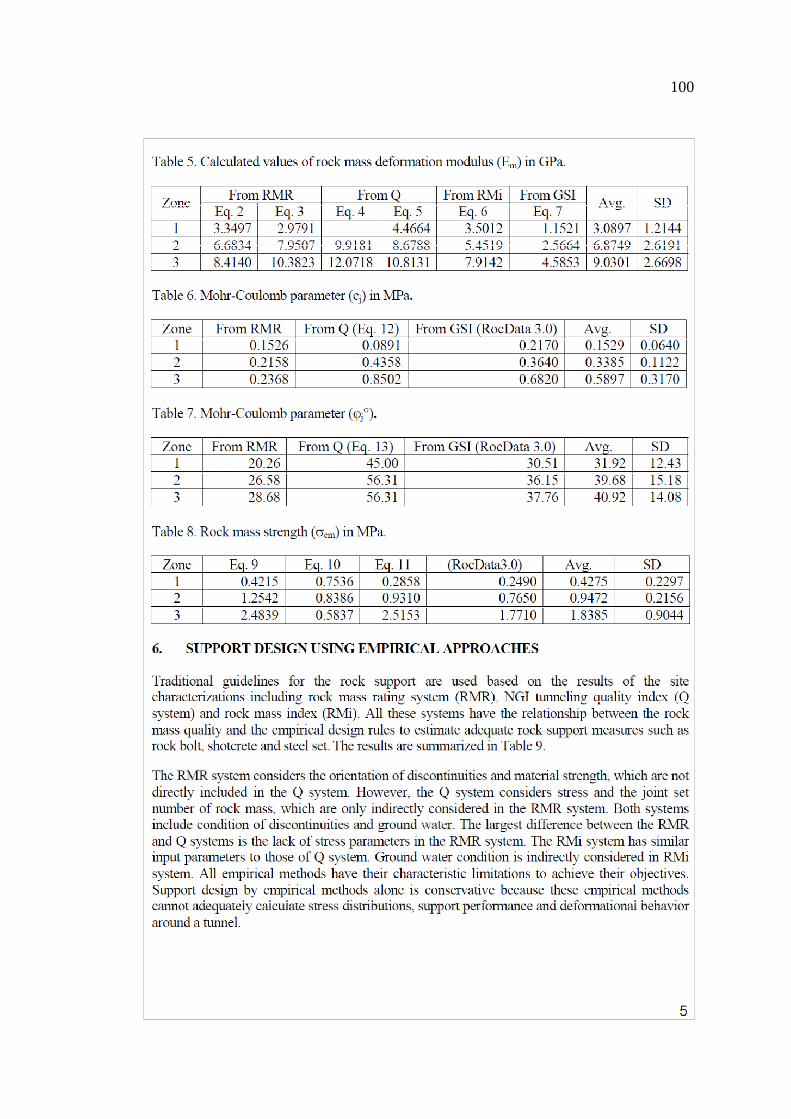
100
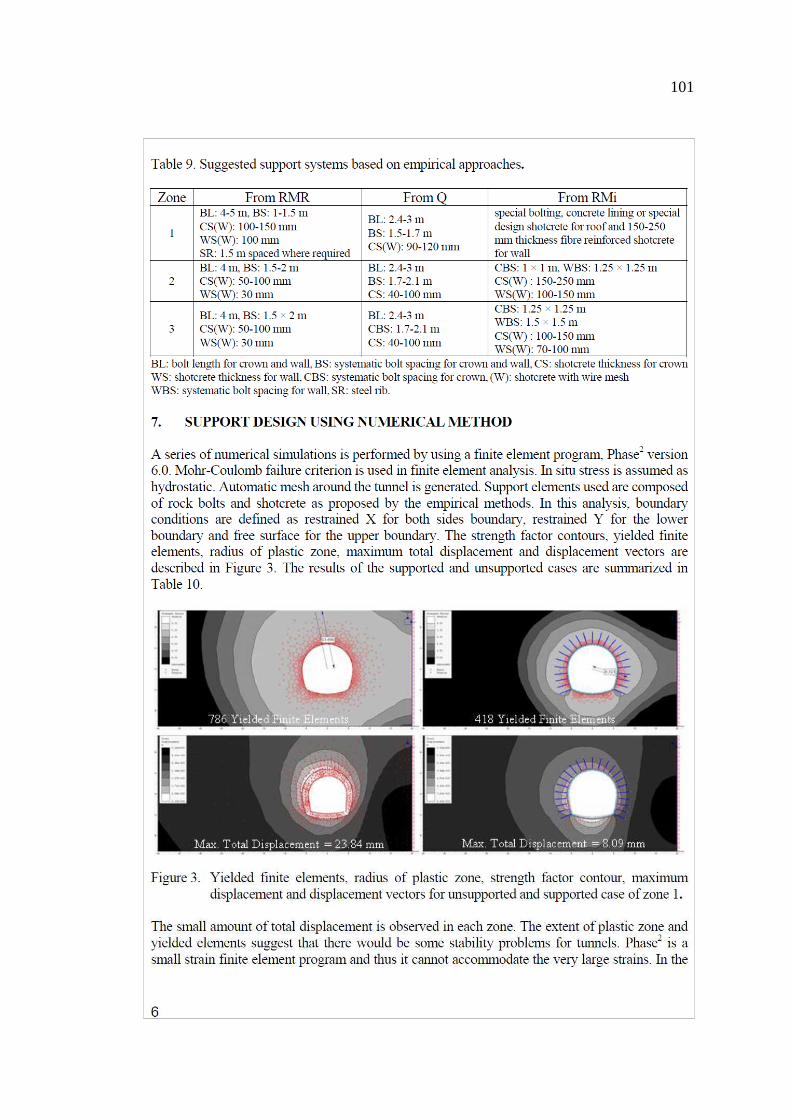
101
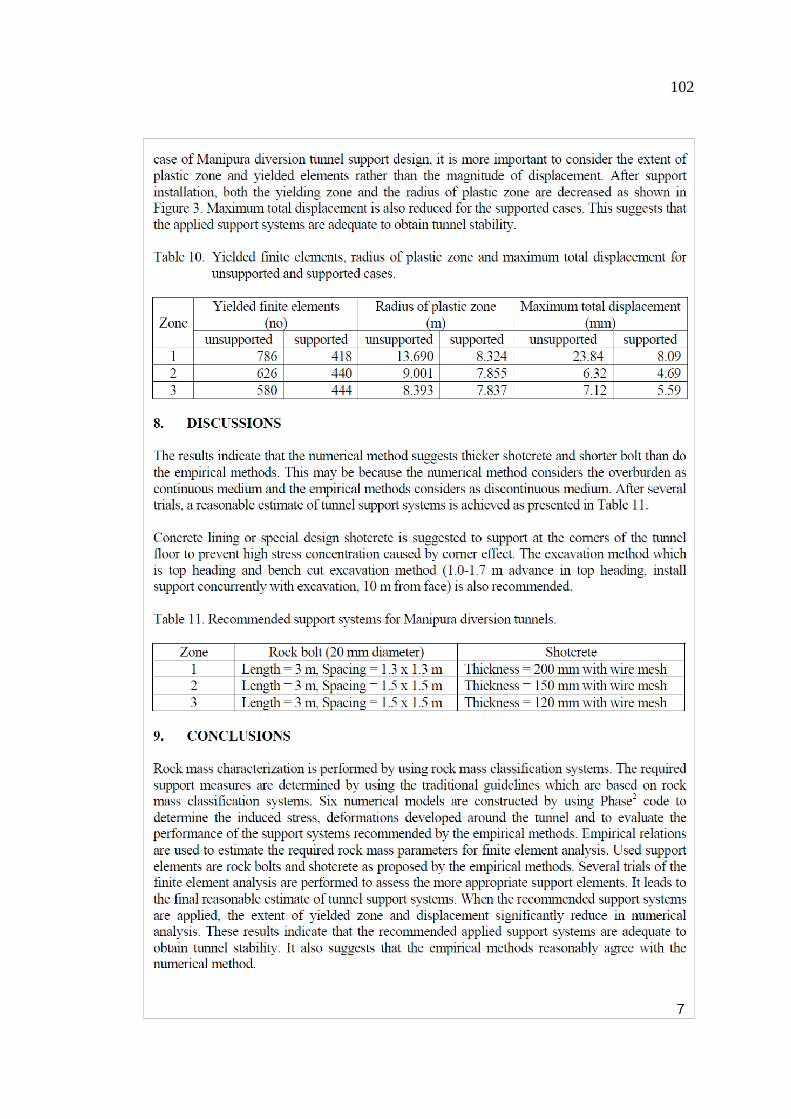
102
103
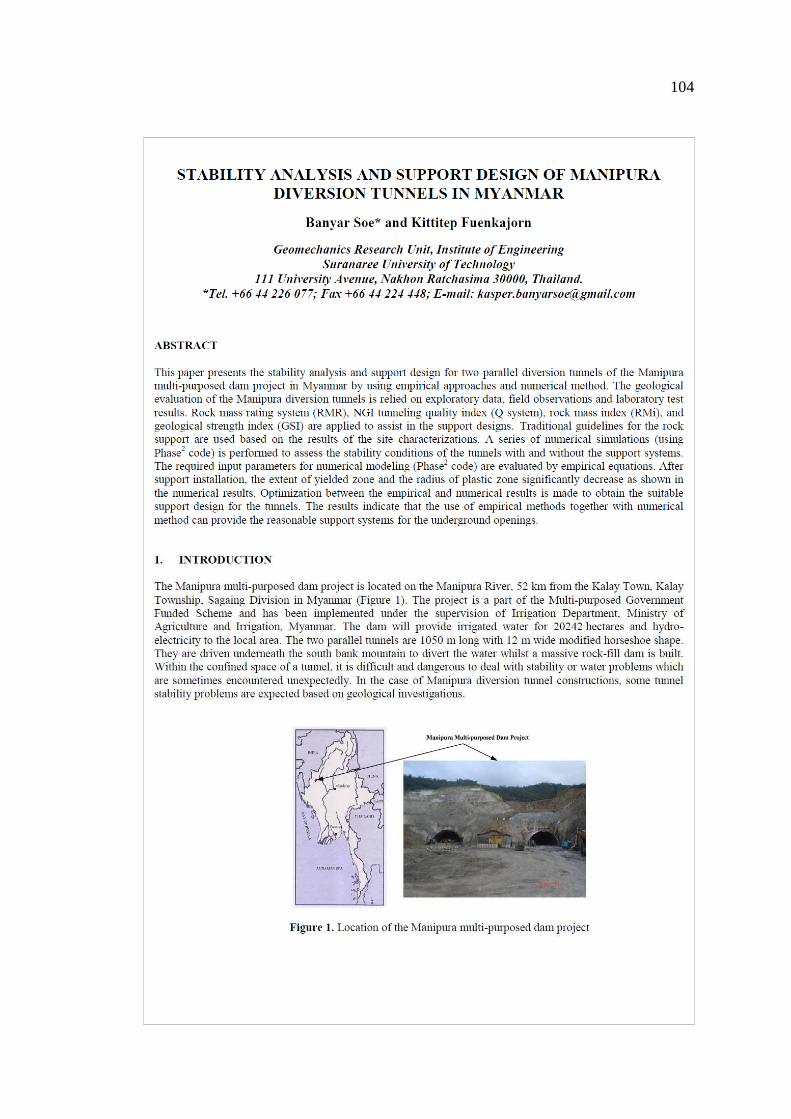
104
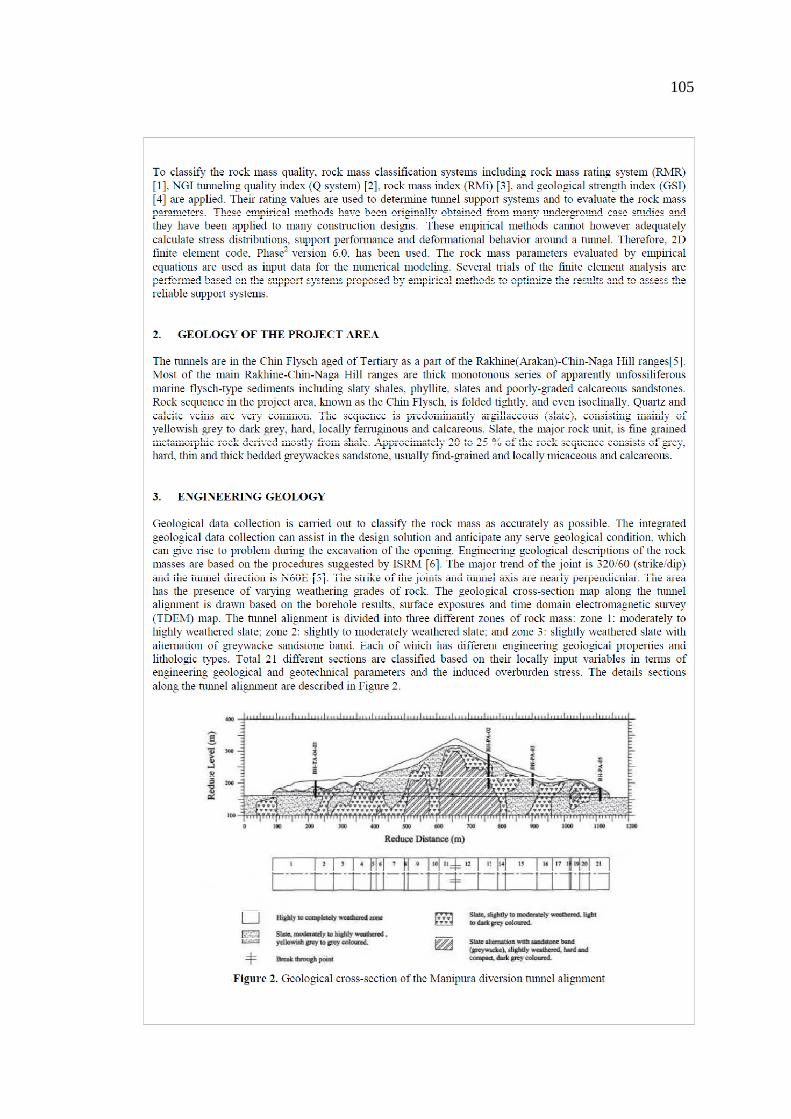
105
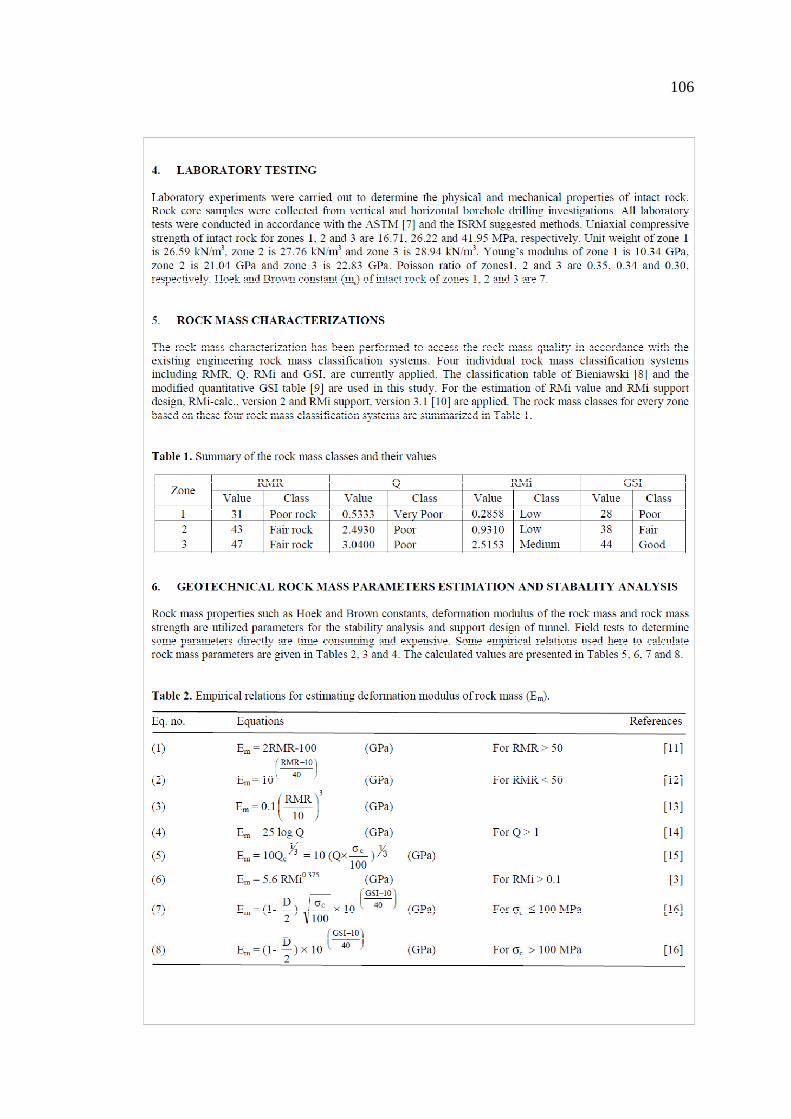
106
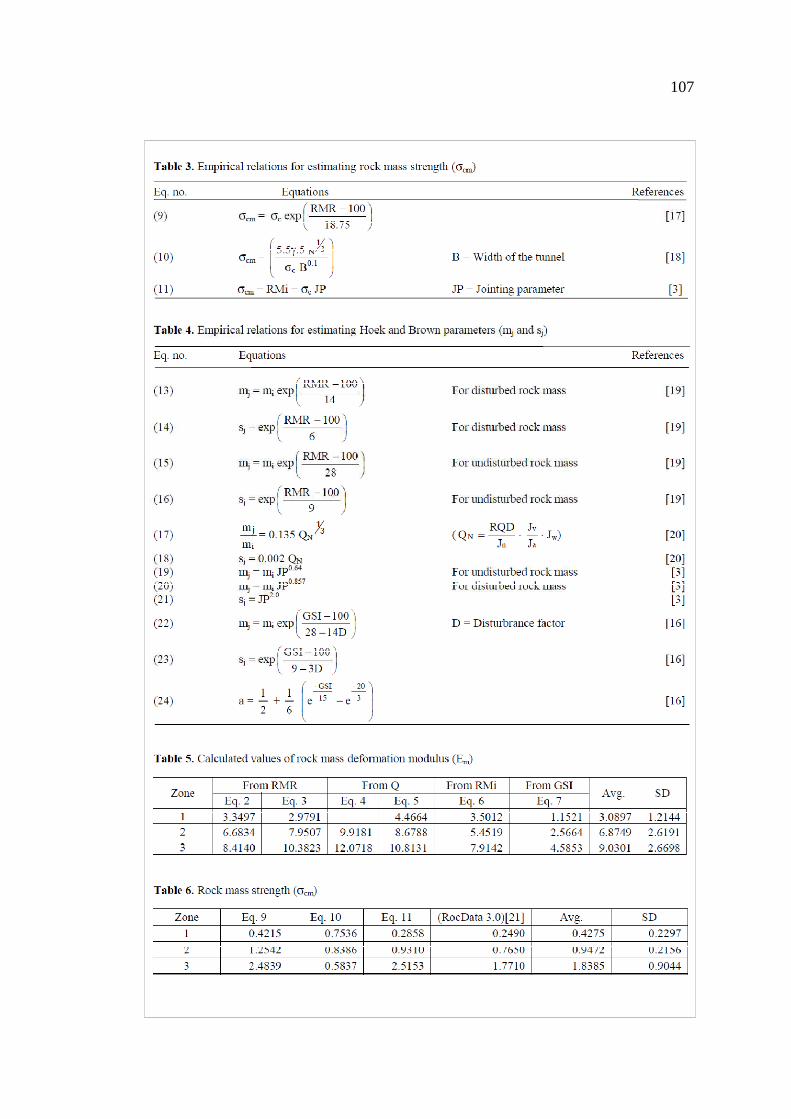
107
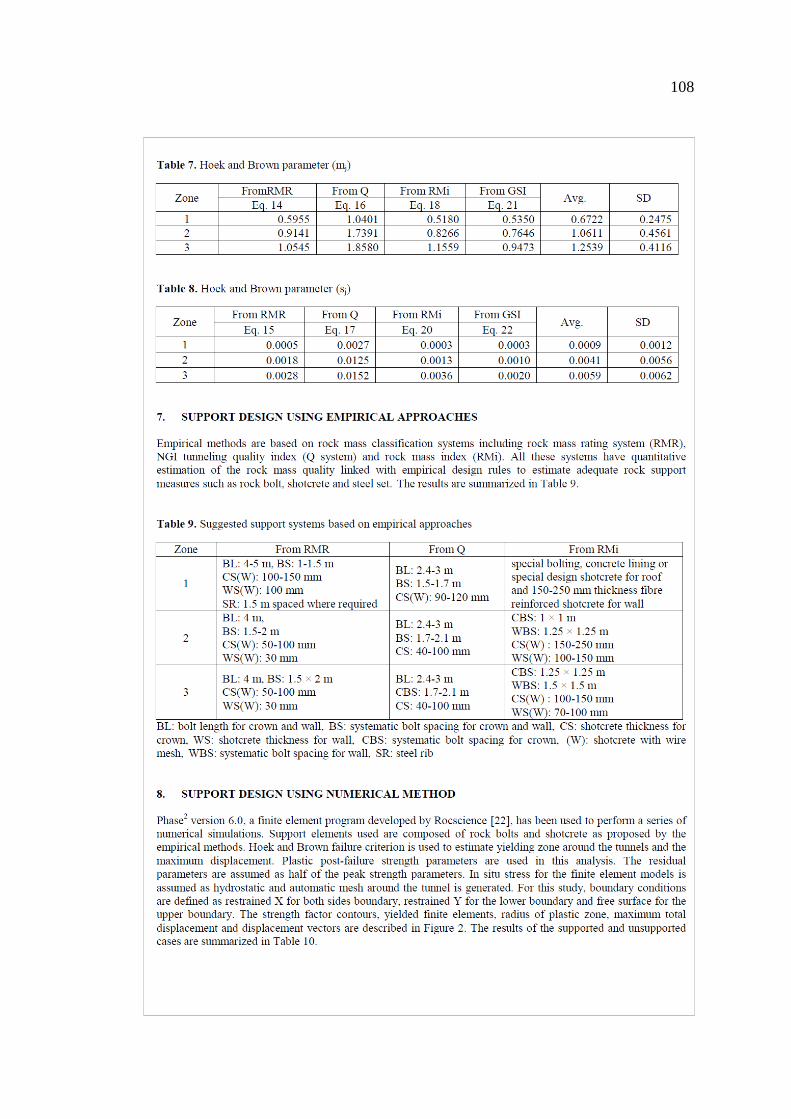
108
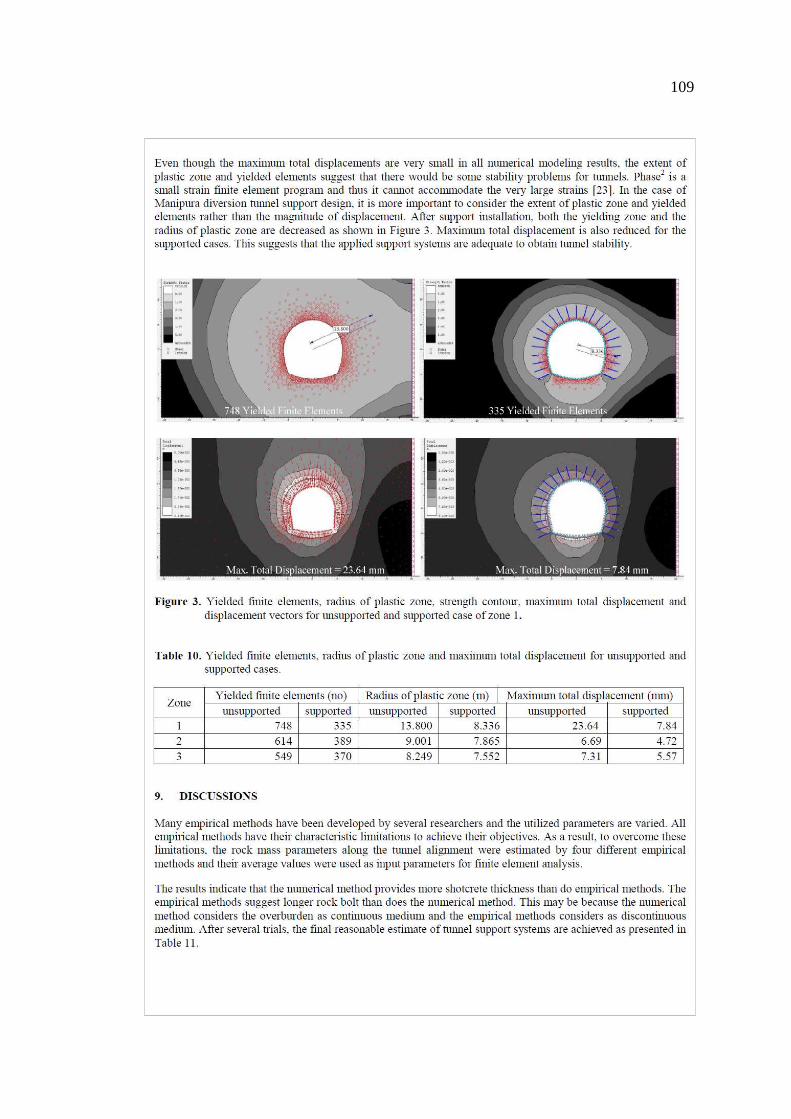
109
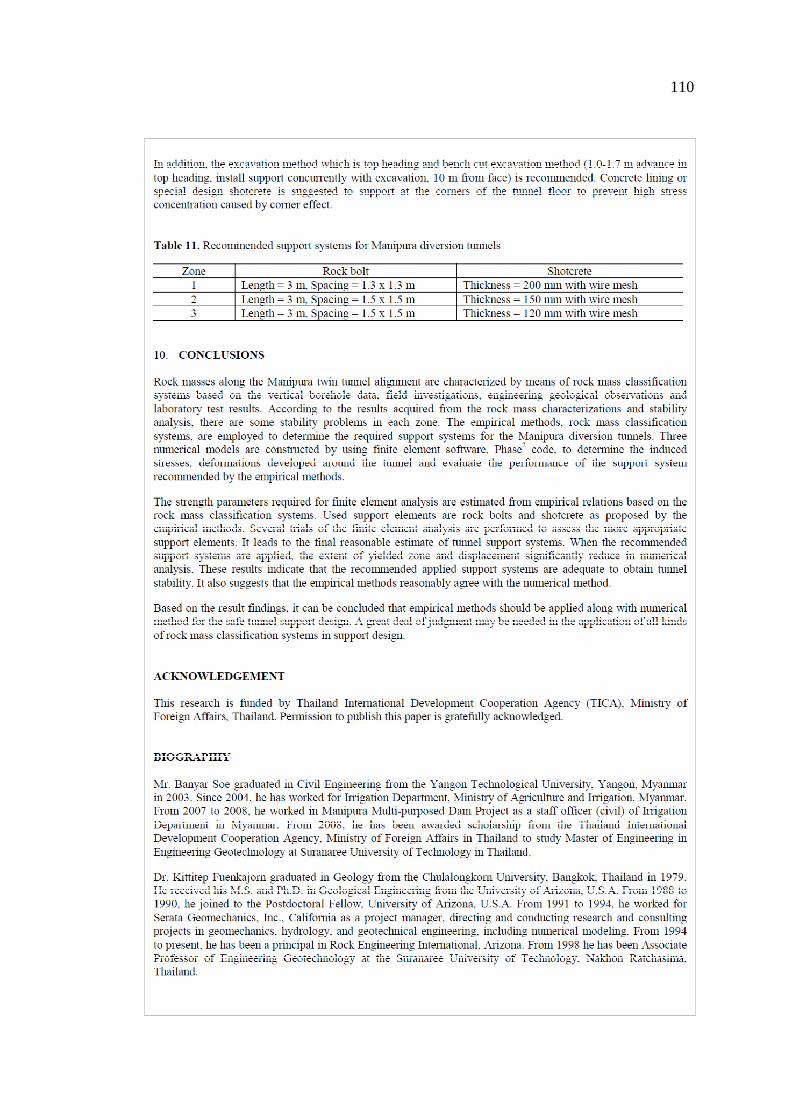
110
111
BIOGRAPHY
Mr. Banyar Soe was born on August 12, 1978 in Mawlamying, Mon State,
Myanmar. He received his Bachelor’s Degree in Civil Engineering from the Yangon
Technological University (formerly Yangon Institute of Technology) in 2003. Since
2004, he has worked for Irrigation Department, Ministry of Agriculture and Irrigation,
Myanmar. From 2007 to 2008, he worked in Manipura Multi-purposed Dam Project
as a staff officer (civil) of Irrigation Department in Myanmar. In 2008, he was
selected by Irrigation Department and has been awarded scholarship from the
Thailand International Development Cooperation Agency, Ministry of Foreign Affairs
in Thailand to study Master of Engineering in Engineering Geotechnology at
Suranaree University of Technology in Thailand. He has published two technical
papers related to rock mechanics, titled “Stability Analysis and Support Design of
Manipura Diversion Tunnels in Myanmar” published in the ISRM International
Symposium and 6th Asian Rock Mechanics Symposium, India, and “Analysis of
support design for Manipura diversion tunnels in Myanmar” published in the
EIT-JSCE Joint Symposium on Engineering for Geo-Hazards: Earthquakes and
Landslides -for Surface and Subsurface Structures, Bangkok, Thailand.