Embed Size (px)
Citation preview

1
Stand-off Detection of Trace Explosives by Infrared Photothermal Imaging
Chris Kendziora, Robert Furstenberg, Michael Papantonakis, Jennifer Stepnowski, Viet Nguyen and R. Andrew McGill
US Naval Research LaboratoryMaterials and Sensors Branch, Code 6365Washington, DC 20375
Kendziora et. al.Naval Research Laboratory 9 October 2009
Explosives Detection Workshopat the University of Rhode Island
Trace Contamination• For manufacture there are Mil
Spec explosives particulate sizes
• Munitions or IED surfaces are contaminated with trace particulate explosives.
• Fingerprints from C4 particles generate particle size range
– @ 20 micron original size of particle
– @ 4 µgrams in 1st print– @ 0.4 µgrams in 10th print
100 microns
NIST (J. Verkouteren)Journal of Forensic Sciences 52 (2), 335–340
Understand the source
RDX fingerprint

2
Kendziora et. al.Naval Research Laboratory 9 October 2009
Explosives Detection Workshopat the University of Rhode Island
Explosives & Spectral Characteristics• Example Infrared Absorption
Bands:– Covalent nitrate: 6.1-6.6 µm– Ionic nitrate: 7.0-7.5 µm
Explosive FunctionalityTNT C-NO2RDX C-N-NO2HMX C-N-NO2TETRYL C-N-NO2PETN C-O-NO2NG C-NO2EGDN C-O-NO2Am. Nitrate NH4NO3Urea Nitrate CH5N2O, NO3
6.25 microns targets the common explosives(Common materials have low absorption in this region)
Kendziora et. al.Naval Research Laboratory 9 October 2009
Explosives Detection Workshopat the University of Rhode Island
Infrared Spectra of TNT, DNT & RDX• Low transmission at
absorption bands• Several absorption bands
are common to these explosive materials
• 6.25 µm targets common explosives
– N-O asymmetric stretch– common materials exhibit low
absorption in this region
• Fortuitous transmission window at 6.25 µm
– offers stand-off interrogation800 1000 1200 1400 1600 1800
0.2
0.4
0.6
0.8
141312 11 10 9 8 7 6
RDX
Tran
smis
sion
Wavenumbers (cm-1)
0.00.20.40.60.8
TNT
0.4
0.6
0.8
DNT
0.50.60.70.80.91.0
6.25
µm
7.41
µm
11.0
µm
12.6
2 µm
Air13.6
5 µm
Wavelength (µm)
R. Furstenberg et. al, Applied Physics Letters, 93, 224103 (2008)

3
Kendziora et. al.Naval Research Laboratory 9 October 2009
Explosives Detection Workshopat the University of Rhode Island
Remote Explosive Detector (RED)Concept
• IR lasers can be used to resonantly couple energy to explosives, drugs, or other chemicals
• Eye-safe, stealth detection• Thermal radiation can be collected and analyzed at stand-off distances
...
.
.Surface contaminated with trace particles of explosives
6.25 µm
@ 9 µm
incident laser light
thermal radiation
Quantum Cascade Laser
Thermal Imaging Array
U. S. Patent Application 12/255,103International Patent # WO2009055370
Kendziora et. al.Naval Research Laboratory 9 October 2009
Explosives Detection Workshopat the University of Rhode Island
Quantum Cascade Laser IR photon source
• Microfabricated laser– foundry fabrication in quantity
inexpensive devices– Compact IR source
• Single wavelength output– targets specific functional groups
• Room temperature operation
• Up to 1 Watt CW output• Commercially available
– We buy C-mounted QCL from AdTech Optics
– We buy turn-key QCL from Daylight Solutions, Inc.
Quantum Cascade Laser (QCL)
2 cm 6.25 µm
QCL device from M. RazeghiNorthwestern University
Center for Quantum Devices

4
Kendziora et. al.Naval Research Laboratory 9 October 2009
Explosives Detection Workshopat the University of Rhode Island
NRL (FLIR) Thermal Imager• FLIR (Indigo) Photon Block II
– Un-cooled bolometer array– 320 X 240 pixels (38 µm)– Analog and digital output– B&W or false color images– Movies here with 50 mm IR lens– NETD (noise equivalent temperature) @85 mK– Filter limits coverage to 7-12 microns (2-12 nominal)– “OEM” platform – already fielded for applications– Small, light, relatively low power– 30 frames/sec (33 mS between frames)– Intrinsically limited response time (slow cooling)
Kendziora et. al.Naval Research Laboratory 9 October 2009
Explosives Detection Workshopat the University of Rhode Island
Remote Explosives Detection (RED) Testbed
Opt
ical
Rai
l
Optical Rail Optical RailBig Lens
FLIR
MCT
QC
L 1
QC
L 2
Door to H
allway
SampleStage
Visi
ble/
Alig
nmen
t
EnvironmentalChamber
IR Camera
QCL Laser
Sample
IR CameraImage
Digital SoftwareInterface
1 meter standoff
• Dedicated Testbed• 4’ X 8’ table• Co-aligned lasers • Co-linear incident and detection paths• Digital software interface array readout• Environmental chamber (not shown in photo)
Environmental Chamber
Lens
Sample
Detector Optical RailFLIR
MCT

5
Kendziora et. al.Naval Research Laboratory 9 October 2009
Explosives Detection Workshopat the University of Rhode Island
Thermal images of RDX on gold mirror illuminated with chopped QCL IR beam
Differential Imaging1. Pulse or chop laser at video frame rate2. Compare “Laser On” vs. “Laser Off” frames3. Overlay differential with visible image
Laser Off Laser On DifferentialCould repeat with on/off resonance or other laser wavelengths to increase sensitivity and selectivity.
Kendziora et. al.Naval Research Laboratory 9 October 2009
Explosives Detection Workshopat the University of Rhode Island
Differential images of QCL-heated samples:1650 1600 1550 1500
0.0
0.2
0.4
0.6
0.8
1.0
Frequency (cm-1)
RDX
TNT
Tran
smis
sion
ν1 ν2 ν3 ν4
ν1 =1635 cm-1 ν2 =1618 cm-1 ν3 =1600 cm-1 ν4 =1585 cm-1
Off-resonance TNT resonance RDX & TNT RDX resonance
Sample illuminated by a heatgun: no laser
Analyte Selectivity for Dual Analyte Sample(RDX & TNT)
NOTE: Red circles indicate the laser spot size.
Furstenberg et. al, APL, 93, 224103 (2008)
Tunable QCL from
Daylight Solutions
6
Kendziora et. al.Naval Research Laboratory 9 October 2009
Explosives Detection Workshopat the University of Rhode Island
Standoff Detection of TNT
“Heat Gun” Thermal Image Laser Differential Image
• 1 meter standoff (not limited to this distance)• 20 mW, λ=6.25 micron, 10 mm diameter QCL beam• ∆T is ~ 1 oC for bright grain seen in both images.• Individual particles @ 10-100 microns (0.8 – 800 ng)
IlluminatedArea
TNT grains
TNT grains
1 inchR. Furstenberg et. al, Applied Physics Letters, 93, 224103 (2008)
Kendziora et. al.Naval Research Laboratory 9 October 2009
Explosives Detection Workshopat the University of Rhode Island
Cart-based System DesignFor Field Testing
• “Cart-mounted” components:1.QCL module (4 lasers)2.Collection optics (lenses and
mirrors)3.Steering gimbal4.Co-focused:
• IR detector • visible camera
5.Computer based:• System control software• Signal processing/alarm
algorithm
DETECTOR
LENS
LASER(QCL)
IMAGE STABILIZATIONGIMBAL
PC
DETECTOR
LENS
LASER(QCL)
IMAGE STABILIZATIONGIMBAL
PC
RED cart-mounted system of integrated components for field testing.
target2 ft.2 ft.
5 5 ½½ ft.ft.
3 ft.3 ft.

7
Kendziora et. al.Naval Research Laboratory 9 October 2009
Explosives Detection Workshopat the University of Rhode Island
Optical Layout• Modular design• Co-aligned:
– QCL excitation– IR detection– Visible alignment
• 12 mm collimated beam for long standoff
• IR and visible imaging systems are co-focused
• Approved eye-safe for use around people by Navy Laser Safety Review Board
LasersLasers
TemperatureTemperatureControllerController
Pulse GeneratorPulse Generator
ReferenceReference
DetectorDetector
SignalSignalDetectorDetector
Signal from sampleSignal from sampleLaser to sampleLaser to sample
Visual Visual CameraCamera
GimbalGimbal
Kendziora et. al.Naval Research Laboratory 9 October 2009
Explosives Detection Workshopat the University of Rhode Island
QCL Module LayoutRED QCL Module
• 5.2 µm (~30 mW) “off resonance 1”
• 6.25 µm (~30 mW) “on resonance 1”
• 7.41 µm (~30 mW) “on resonance 2”
• 658 nm –alignment laser (~ 1 mW)
• Co-linear, 12 mm collimated
• Pick-off beam for output power normalization
• Operate independent of temperature
5.2 µm7.41 µm 6.25 µm658 nm
8
Kendziora et. al.Naval Research Laboratory 9 October 2009
Explosives Detection Workshopat the University of Rhode Island
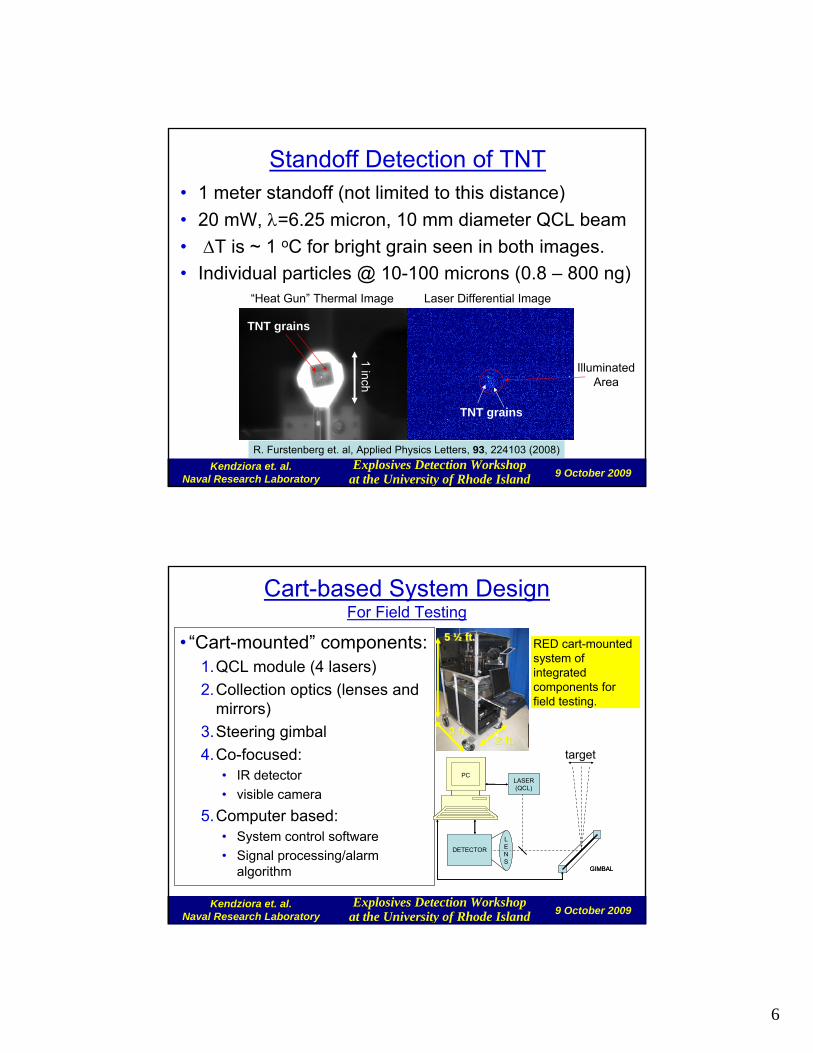
RED Cart Software Interface
• Written in-house for this specific application
• Microsoft Visual Studio C Sharp
• Synchronizes experiment
• Monitors output• Graphic display• Analyzes data
Laser ParametersLaser Parameters
Experimental Experimental SequenceSequence
Data AcquisitionData Acquisition
Graphic Display
Data AnalysisData Analysis
Kendziora et. al.Naval Research Laboratory 9 October 2009
Explosives Detection Workshopat the University of Rhode Island
Experimental Sequence and Signal Processing1. Control/synchronize QCL pulsing sequence2. Correlate detector signal with output λ3. Turn a series of signals into a differential4. Then into an on/off resonance comparison5. Three wavelengths for enhanced selectivity6. Process into an alarm signal
ALARM!Pulse Visible Pulse 6.2 QCLPulse 7.4 QCL Pulse 5.2 QCL
Signal 1 Signal 3Signal 2 Signal 4
Algorithm
Controller
< 1 second of time in total

9
Kendziora et. al.Naval Research Laboratory 9 October 2009
Explosives Detection Workshopat the University of Rhode Island
Field Testing at Yuma Proving Ground
• Effects of temperature, sunlight, humidity, dust
• TNT, RDX, PETN, C4, Tetryl, Comp B, PBX4, PE4
• Best data at 10 meter • Data out to 30 meter
– difficult to stabilize optics • Camera and single channel• Very challenging environment
– For electronics, optics, people
Kendziora et. al.Naval Research Laboratory 9 October 2009
Explosives Detection Workshopat the University of Rhode Island
λ=0.65µm (off res.) λ=7.4µm (on res.) λ=6.3µm (on res.) λ=5.2µm (off res.)
∆=-0.04 counts ∆=1.28 counts ∆=1.02 counts ∆=-0.09 counts
Differential images
IR image
Sample: RDXStand-off distance: 10mTamb. = 22 oCRH = 13%Vwind = 10 mph
Field Testing at Yuma Proving Ground
RDX detected
at 10 meter
stand-off3 inch

10
Kendziora et. al.Naval Research Laboratory 9 October 2009
Explosives Detection Workshopat the University of Rhode Island
λ=0.65µm λ=7.4µm λ=6.3µm λ=5.2µm
∆=0.07 counts ∆=0.95 counts ∆=1.09 counts ∆=-0.04 counts
Differential images
Sample: TNTStand-off distance: 10mTamb. = 22 oCRH = 14%Vwind = 10 mph
Field Testing at Yuma Proving Ground
IR image
TNT detected
at 10 meter
stand-off3 inch
Kendziora et. al.Naval Research Laboratory 9 October 2009
Explosives Detection Workshopat the University of Rhode Island
Conclusions• Eye-safe IR lasers have been utilized to selectively heat
trace amounts of explosives to for photothermal imaging analysis.
• In photothermal detection applications (RED) a miniature IR quantum cascade laser (QCL) and thermal imaging detector have been used to detect and map trace explosives in a stand- off configuration.
• RED concept has been demonstrated on variety of substrates, analytes, in/out doors, and at significant standoff distances.
• Sponsored by OSD/RRTO and NRL

11
Kendziora et. al.Naval Research Laboratory 9 October 2009
Explosives Detection Workshopat the University of Rhode Island
Air Infrared Transmission
• The fortuitous air window for explosives between 6 and 6.5 microns is away from night vision and missile heat seeking wavelengths
• We need to detect in LWIR because explosives are not “black bodies”
• Kirchhoff’s Law – their emissivity matches their absorptivity
MWIR
LWIR
Kendziora et. al.Naval Research Laboratory 9 October 2009
Explosives Detection Workshopat the University of Rhode Island
NRL/AdTech Optics QCL
0 100 200 300 400 500 600 700 800 900 10000
1
2
3
4
5
6
7
8
9
10
11
12
0
20
40
60
80
100
120
140
160
180
200
Vol
tage
(V)
Current (mA)
Opt
ical
Pow
er O
utpu
t (m
W)
• OEM/COTS c-mounted QCL from AdTech Optics• Operates at room temperature and slightly above• Temperature controlled for constant output λ and power• >180 mW Continuous Wave (higher in pulsed mode)
1400 1500 1600 1700 1800
7 6.8 6.6 6.4 6.2 6 5.8 5.6
Inte
nsity
Frequency (cm-1)
wavelength (µm)
12
Kendziora et. al.Naval Research Laboratory 9 October 2009
Explosives Detection Workshopat the University of Rhode Island
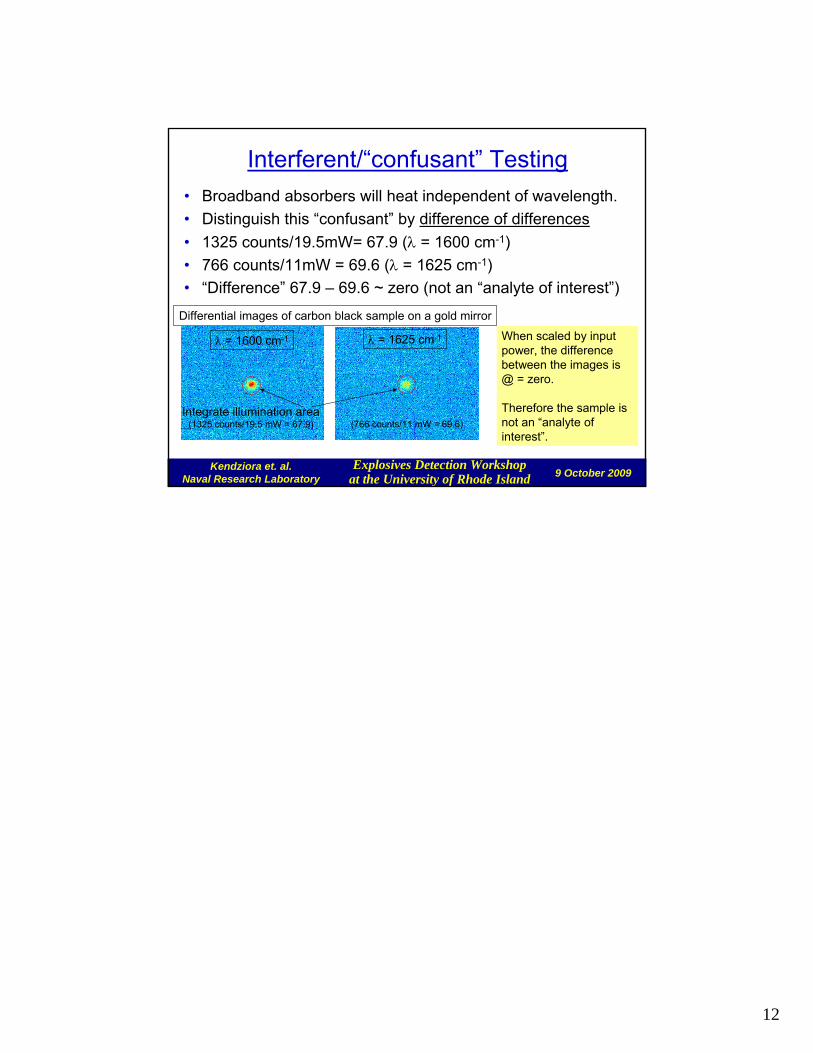
Interferent/“confusant” Testing• Broadband absorbers will heat independent of wavelength.• Distinguish this “confusant” by difference of differences• 1325 counts/19.5mW= 67.9 (λ = 1600 cm-1)• 766 counts/11mW = 69.6 (λ = 1625 cm-1)• “Difference” 67.9 – 69.6 ~ zero (not an “analyte of interest”)
Differential images of carbon black sample on a gold mirror
Integrate illumination area(1325 counts/19.5 mW = 67.9)
λ = 1600 cm-1 λ = 1625 cm-1 When scaled by input power, the difference between the images is @ = zero.
Therefore the sample is not an “analyte of interest”.
(766 counts/11 mW = 69.6)