Embed Size (px)
Citation preview
1
Standards and Technical Regulations and Firms in Developing Countries:
New Evidence from A World Bank Technical Barriers to Trade Survey
John S. Wilson
and
Tsunehiro Otsuki
The World Bank
(Preliminary Draft)
June 2004
John S. Wilson, The World Bank, 1818 H Street N.W., Washington DC 20433, [email protected] Tsunehiro Otsuki, The World Bank, 1818 H Street N.W., Washington DC 20433, [email protected] The findings, interpretations, and conclusions expressed in this paper are entirely those of the authors. They do not necessarily represent the view of the World Bank, its Executive Directors, or the countries they represent.
2
Section 1. Approach
The use of standards and technical regulations as instruments of commercial policy in unilateral, regional, and global trade contexts has increased as tariff and quota barriers continue to decline (Maskus and Wilson, 2001). Standards and technical regulations are principally used to mitigate food, animal and plant safety risks, and to provide common norms for product characteristics. However, these technical requirements also can constitute barriers to trade by imposing unnecessary costly and time consuming tests or by laying out various requirements in different markets. These technical requirements are of particular concern to developing countries that are seeking to penetrate industrialized country markets. The World Bank Technical Barriers to Trade Survey is the first attempt to globally investigate the impacts of technical requirements. The intent of the survey is to solicit input from agricultural, manufacturing, and trade firms in various emerging market countries regarding technical barriers encountered abroad, which impact their ability to successfully export products. The data collected covers 689 firms in over twenty industries in 17 developing countries. One of the main goals of this survey project is the evaluation of the impact of standards and technical barriers to trade at the firm level. This paper will provide a comprehensive description of the World Bank Technical Barriers to Trade Survey dataset. This paper also will provide an overview of domestic and foreign technical regulations, international standards, and other various impediments to business and export surrounding the firms in developing countries as well as their response to the situation. The comparison is made across countries and industries regarding standards and regulations, and their impacts on firms’ production and conformance activities. Information on technical regulations specific to five major export markets also enables us to compare the stringency and importance of technical regulations by export markets such as the EU, the US, Japan, Canada, and Australia. The paper is organized as follows: Section 1 explains survey methods and sample selection for the World Bank Technical Barriers to Trade Survey, Sections 2 provides an overview of the characteristics of firms and export orientation of the surveyed firms. Section 3 provides an overview of mandatory technical regulations and conformity assessments that the surveyed firms have faced. Section 4 provides an overview of firms’ reaction to selected international standards. Section 5 provides an overview of firms’ reaction to mutual recognition agreements (MRAs). Section 6 provides a summary and implications.
3
1.1 Related Work and The World Bank Technical Barriers to Trade Survey There have been survey efforts to identify factors affecting the private business environment. Those include World Business Environment Survey (WBES) and Investment Climate Assessments (ICAs) of the World Bank and the survey on technical regulations conducted by OECD. WBES collected a set of enterprise data, based on a survey of more than 10,000 firms in 80 countries conducted between late 1999 and mid 2000. Basic econometric analysis of these data indicates that taxes and regulations, financing, governance and other business constraints are significant factors in explaining a firm’s performance and behavior. ICAs, a part of the World Bank Group’s Public Sector Development strategy, is an initiative to examine conditions for private investment and enterprise growth in countries all around the world. The purpose of this survey is to understand conditions in the local investment climate and how they impact firm-level productivity. OECD (2000) conducted a survey of 55 firms in three different sectors of the U.S., Japan, the U.K and Germany on the costs associated with technical standards and conformity assessment procedures in order to assess the extent to which technical standards and conformity assessment procedures hinder trade. The sectors studied were terminal telecommunications equipment, dairy products, and automotive components.. The World Bank Technical Barriers to Trade Survey was designed to support an in-depth analysis of the impact of standards and technical regulations. Particular attention was paid to address the importance and costs of various types of standards and technical regulations that firms in developing countries confront in exporting to the major developed country markets. The data were collected to cover a wide range of industries from raw agricultural products to electronics, and a wide range of geographic regions. A cross-country and cross-industry analysis will be supported by a sufficient number of samples.
1.2 Survey Methods and Questionnaire The data collection in the field was contracted to local consulting companies by Harris Interactive. Harris Interactive used its member network of research suppliers in order to undertake data collection in the global regions. Questionnaire preparation Research materials were prepared in English and translated into appropriate languages for each of the countries where the survey was conducted.
4
Interviewer Briefing Supervisors conducted briefings with all interviewers before they began working on the survey project, making sure that the interviewers were clear about the qualifications and administration of the screener and main questionnaire, discussing specific interviewing techniques required for each project, and conducting a “round robin” role-playing exercise with all interviewers. Pilot and Full Field Interviews Three pilot interviews with each local consulting firms were conducted in order to validate the data collection process and ensure effectiveness before full field interviews. A total of 24 pilot interviews were conducted. According to the experience from pilot interviews, questionnaires were improved in terms of efficiency in capturing desirable forms of responses.
1.3 Sample Selection Country Selection The countries included cover a range of economic development and export experience yet have sufficiently deep agricultural and industrial structures to permit sectoral comparisons. The following countries have been selected for study:
Eastern Europe: Bulgaria, The Czech Republic, Poland Latin America and Caribbean: Argentina, Chile, Honduras, Panama Middle East: Iran, Jordan South Asia: India, Pakistan Sub-Saharan Africa: Kenya, Mozambique, Nigeria, Senegal, South Africa, Uganda
Selection of Firms to be Interviewed The interviewed firms are selected according to the following criteria: (1) current or potential involvement in export, (2) experience of technical regulations, (3) firm size, and (4) industry composition. (1) Current or Potential Involvement in Export The survey includes firms that are currently exporting some of their products as well as firms that wish to export but that are not able to due to various impediments, as well as. The majority of firms in the world supply goods and services only for the domestic market. They are either not interested in export or they are willing to export but do not have the ability to overcome tariffs, foreign technical regulations, transportation costs, and other business impediments. It is important to investigate the reasons for firms not exporting. (2) Experience of Technical Regulations The survey was designed to include a sufficient number of surveyed firms face standards and regulations, mainly in the EU, the United States, Canada, Japan, and Australia, but not exclusively. The EU countries include France, Germany, United Kingdom, Austria, Belgium, Denmark, Finland, Greece, Ireland, Italy, the Netherlands, Luxembourg,
5
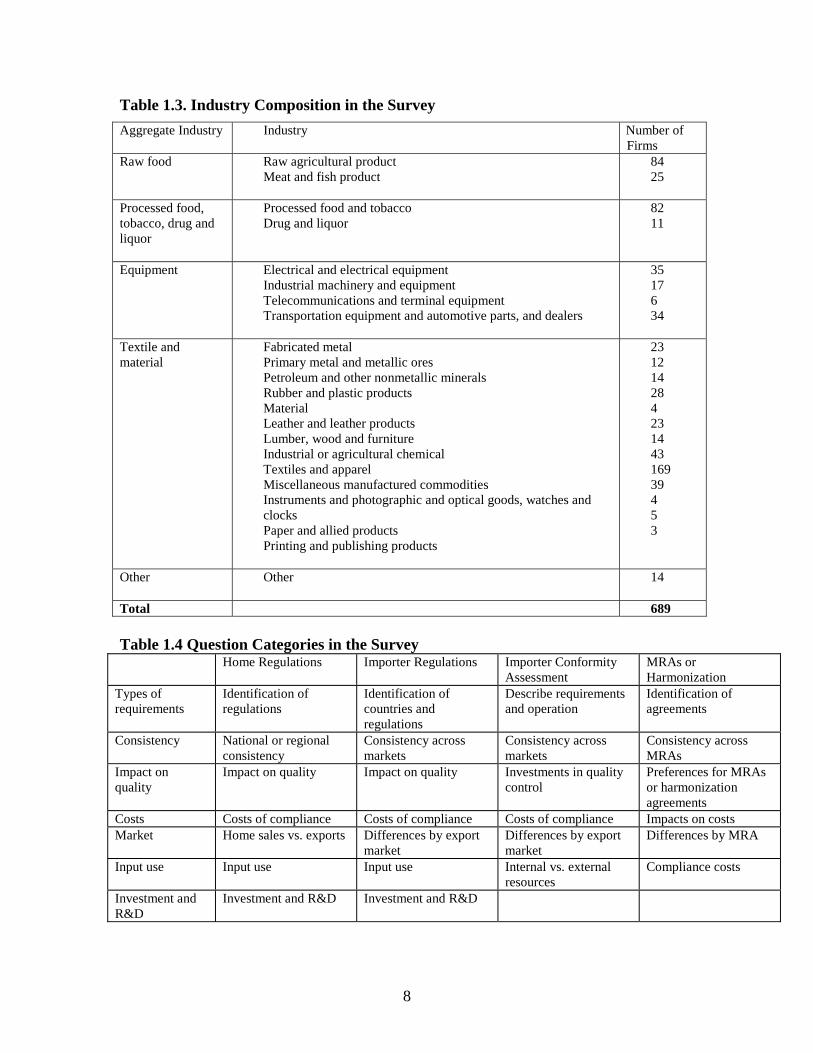
Portugal, Spain, and Sweden. The firms surveyed shall be ones subject to mandatory technical regulations in export markets in which they are active. (3) Firm Size The survey was designed to include various size of firms are included. The surveys mainly cover small and medium enterprises, but also include large enterprises, which make the comparison of firms’ characteristics and behavior feasible. (4) Industry Composition The survey was designed to include various industries are covered. The industrial sectors chosen for study are those of actual and potential comparative advantage for developing countries, as well as those in which technical regulations are important for market access. Table 1.3 presents the number of firms in each industry.
1.4 Question Categories Questions in the survey were designed so that question categories could be linked across different types of regulatory requirements and types of responses. It makes the analysis more structural. Table 1.4 depicts the matrix of question categories.
1.5 Profile of the Countries The selected 17 countries are diverse in income levels. According to the World Bank classification, they are categorized as:
Low income: India, Pakistan, Kenya, Mozambique, Uganda, Nigeria, and Senegal.1
Lower-middle: Honduras, Bulgaria, Iran, Jordan, and South Africa. Upper-middle: Argentina, Chile, Panama, The Czech Republic, and Poland.
Export profile According to the United Nations Comtrade data, all countries export to the EU, and the share of export to the EU is the greatest among the exporting partners in all the 17 countries except Jordan and Panama. At the same time, the share of export to the US is also large in most of the 17 countries, except Iran and Mozambique. The rest of export destinations tend to be countries within their regions. In addition to the EU and the US partnership excluding regional countries, Japan and China lead East Asia as export partners , and Australia and Canada are partners even though Honduras exports to Canada due to their bilateral relationship. Australia does not have a free trade agreement except with New Zealand.
1 Economies are divided according to 2001 GNI per capita, calculated using the World Bank Atlas method. The groups are: low income, $745 or less; lower middle income, $746 - $2,975; and upper middle income, $2,976 - $9,205.
6
Commodity Principal export products vary by country, region, and country size. However, their export products are concentrated mainly in agricultural and manufactured products. Latin America, in particular, has a strong tendency to export primary products such as bananas, shrimp, and processed food, however, commodities of economically more matured countries such as Argentina and Chile are more diversified. Exports of Eastern Europe consists mostly of machinery. The structure of exports to the advanced market economies was initially biased towards raw materials and basic products (EIU). South Asian countries mainly export textile goods. Their textile-related products account for more than half of their export earnings. African countries export not only agricultural products but also mining commodities.
7
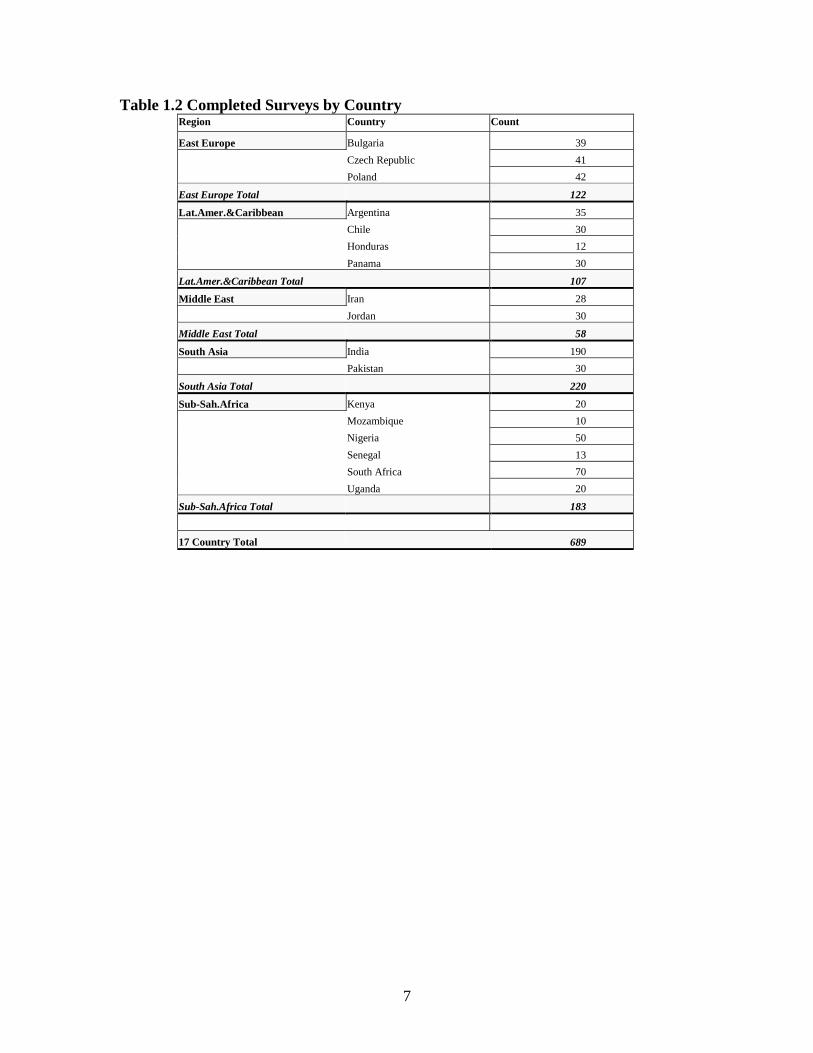
Table 1.2 Completed Surveys by Country Region Country Count
East Europe Bulgaria 39
Czech Republic 41
Poland 42
East Europe Total 122
Lat.Amer.&Caribbean Argentina 35
Chile 30
Honduras 12
Panama 30
Lat.Amer.&Caribbean Total 107
Middle East Iran 28
Jordan 30
Middle East Total 58
South Asia India 190
Pakistan 30
South Asia Total 220
Sub-Sah.Africa Kenya 20
Mozambique 10
Nigeria 50
Senegal 13
South Africa 70
Uganda 20
Sub-Sah.Africa Total 183
17 Country Total 689
8
Table 1.3. Industry Composition in the Survey
Aggregate Industry Industry Number of Firms
Raw food Raw agricultural product Meat and fish product
84 25
Processed food, tobacco, drug and liquor
Processed food and tobacco Drug and liquor
82 11
Equipment Electrical and electrical equipment Industrial machinery and equipment Telecommunications and terminal equipment Transportation equipment and automotive parts, and dealers
35 17 6 34
Textile and material
Fabricated metal Primary metal and metallic ores Petroleum and other nonmetallic minerals Rubber and plastic products Material Leather and leather products Lumber, wood and furniture Industrial or agricultural chemical Textiles and apparel Miscellaneous manufactured commodities Instruments and photographic and optical goods, watches and clocks Paper and allied products Printing and publishing products
23 12 14 28 4 23 14 43 169 39 4 5 3
Other Other
14
Total 689 Table 1.4 Question Categories in the Survey
Home Regulations Importer Regulations Importer Conformity Assessment
MRAs or Harmonization
Types of requirements
Identification of regulations
Identification of countries and regulations
Describe requirements and operation
Identification of agreements
Consistency National or regional consistency
Consistency across markets
Consistency across markets
Consistency across MRAs
Impact on quality
Impact on quality Impact on quality Investments in quality control
Preferences for MRAs or harmonization agreements
Costs Costs of compliance Costs of compliance Costs of compliance Impacts on costs Market Home sales vs. exports Differences by export
market Differences by export market
Differences by MRA
Input use Input use Input use Internal vs. external resources
Compliance costs
Investment and R&D
Investment and R&D Investment and R&D
9
Section 2. Characteristics and Export Orientation of the Surveyed Firms
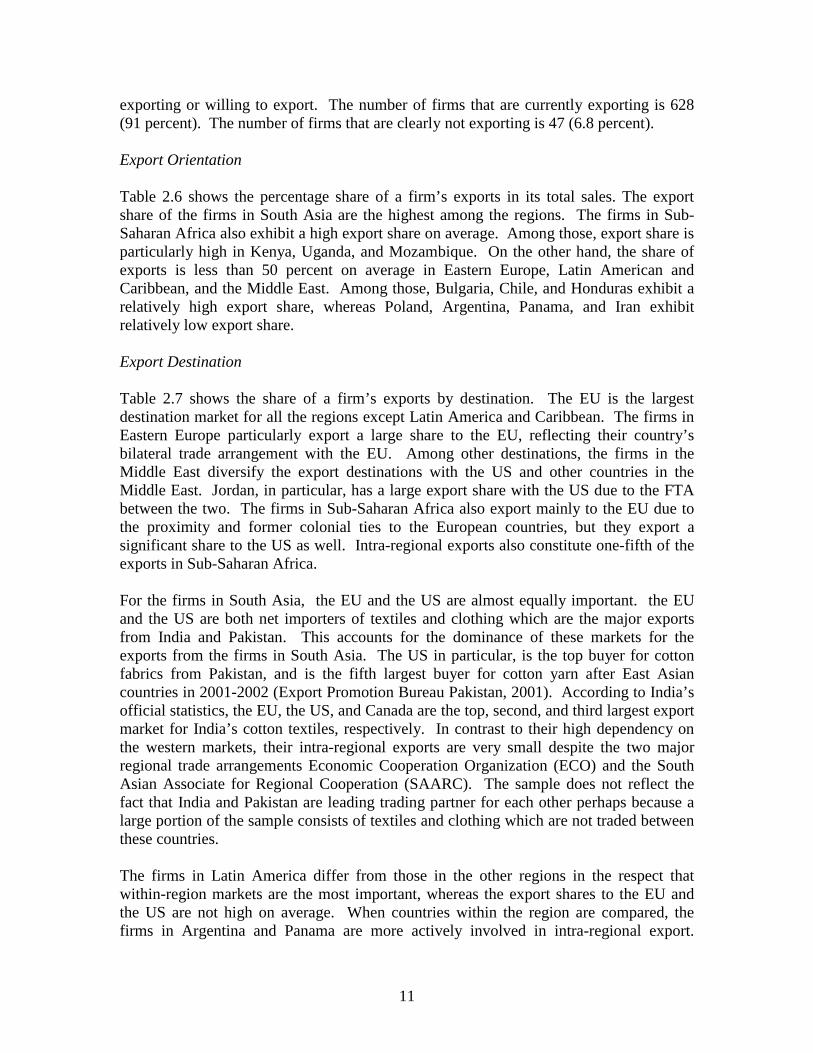
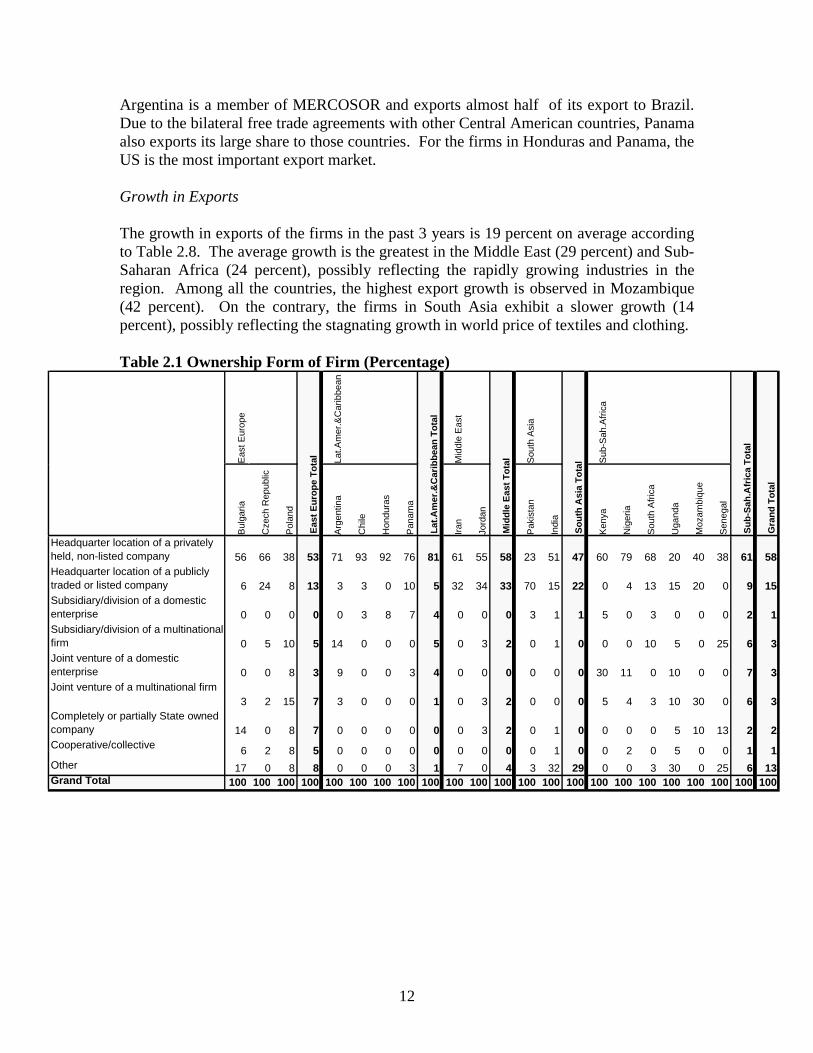
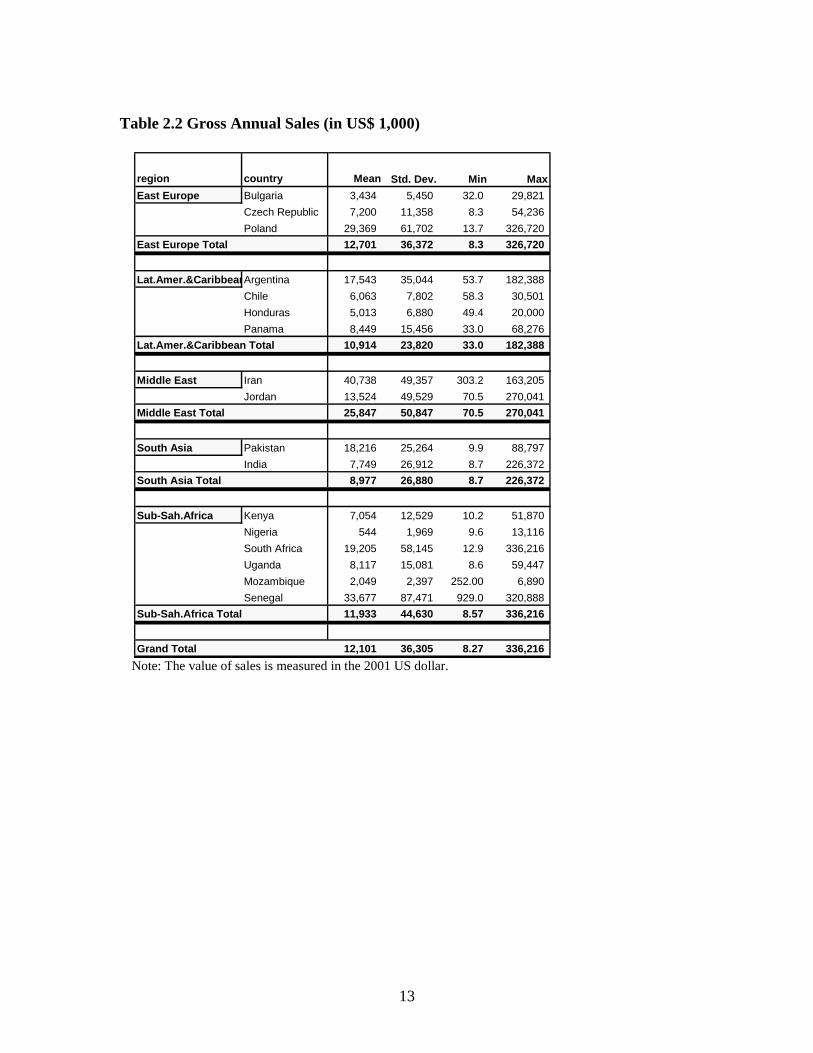
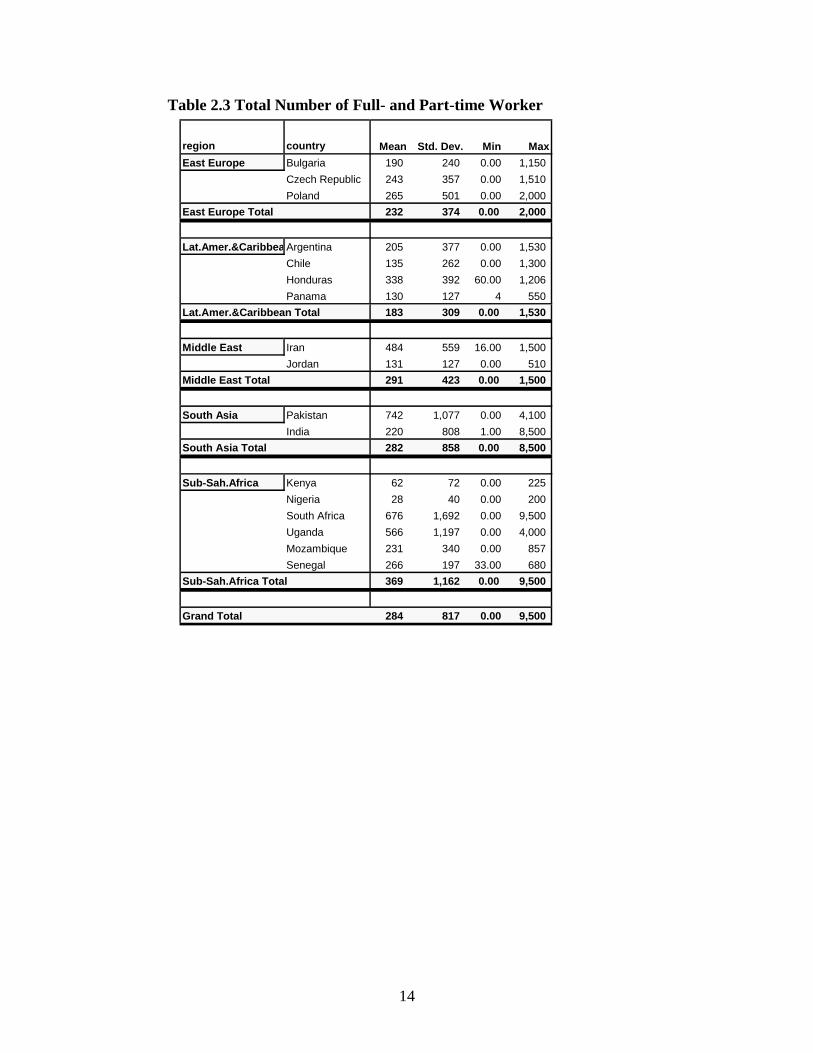
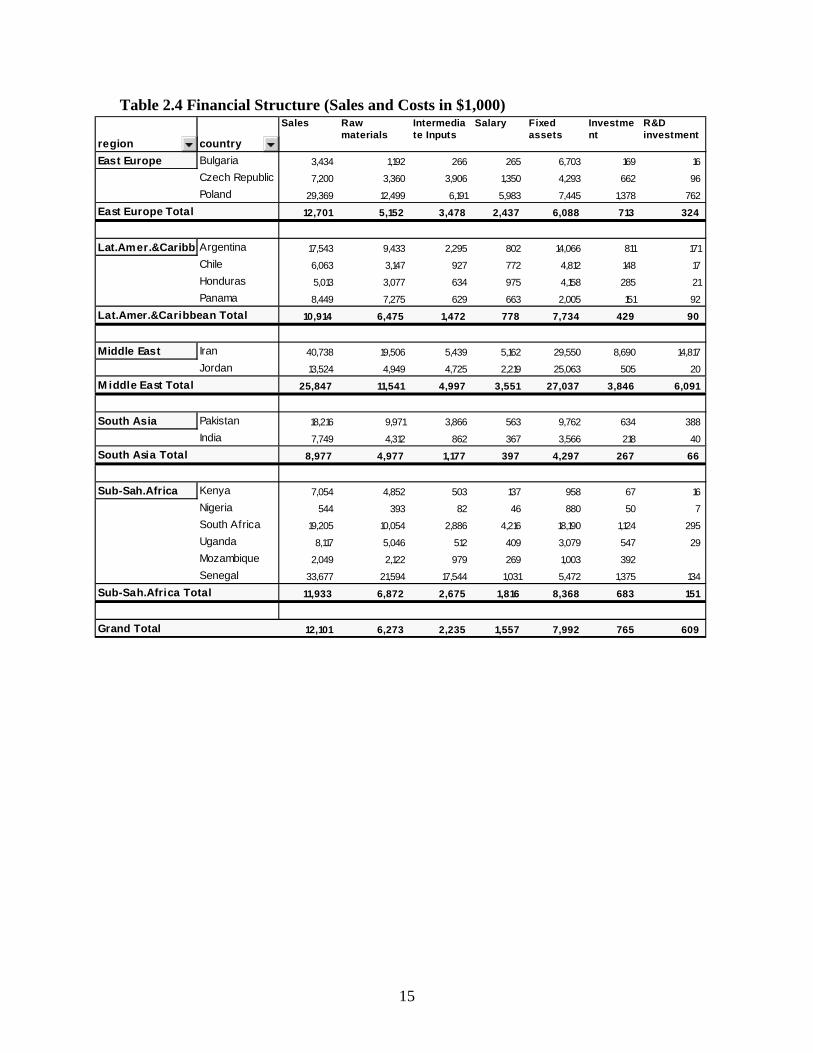
2.1 Firm Characteristics The survey includes firms with various characteristics. They differ in terms of form of ownership, the amount of sales, the size of employment, and export patterns. Firm characteristics may account to some degree for firms’ response to standards and technical barriers to trade as they can promote or constrain its ability and willingness to comply with these technical requirements. This subsection presents observations of firm characteristics. Ownership form Table 2.1 shows the form of firm ownership in terms of private or public, headquarters or subsidiary, degree of joint venture with foreign enterprises, and others. In all the five regions, 56 percent of firms can be categorized as the headquarters location of a privately held, non-listed company. Latin America and Caribbean has a largest share of firms in this category (81 percent). Chile is the country that has the highest percentage (93 percent) of firms in this category. On the other hand, 15 percent of the firms belong to the ownership category listed as the headquarters of a publicly traded or listed company. In fact, 70 percent of Pakistan firms are listed under this category. On the contrary, India has only 15 percent of its firms with this form of ownership. Firm sales and employment size There are a large variation in firm sales and employment size among the firms in the sample. The high standard deviation relative to the mean in Table 2.2 and Table 2.3 implies a high variation in sales and employment size. Iran exhibits the highest average sales, followed by Poland ($29 million). The high average sales in Iran reflects the presence of large chemical producers in the sample. On the contrary, the average sales are smallest in Nigeria ($ 0.5 million). Nigerian firms have the lowest level of employment on average with the total number being 28. This results from the dominant presence of small food producers in the sample from Nigeria As Table 2.3 shows the average number of full- or part-time- workers among the 17 countries is 284. The average number of workers is the greatest in the Sub-Saharan African firms, but the high standard deviation implies a high variation in the firm size. Pakistan has the highest average (742 people), resulting from the dominance of large textiles firms in the sample from Pakistan. Latin America and Caribbean is at the bottom of the list for average employment size. Financial Structure Table 2.4 presents the average level of factors of production and investment along with the average sales. It gives an idea of the costs of the firms. In the Middle-Eastern region
10
we identified Iran as the country with the highest sales. However, when we look at different components for costs, Iranian firms appear to have very high cost levels as well. For example, Iranian firms spend $20 million on raw materials, $30 million on fixed assets, and $15 million on R&D investment. Senegal, which has the highest amount of average sales among all the countries in our sample, also has very high cost elements—on average, raw materials cost $22 million and intermediate inputs cost $18 million. On the other hand, firms in Nigeria that have very low average sales ($544 thousands) also incur very low costs. This table also contains information about profit margin of the firms in each country. Sales value indicates the revenue of the firms whereas raw materials, intermediate inputs, and salary are variable cost components. Firms in Mozambique and Senegal have cost elements—raw materials, intermediate inputs, and salary adding up to $3.4 million in Mozambique and $40 million in Senegal on average. However, the sales in Mozambique amount to only $2 million and Senegal has an average sales of $34 million. Clearly, the firms in Mozambique and Senegal are incurring losses on average. Overall in Sub-Saharan Africa firms have a very low profit margin of only $570,000. Czech Republic firms also have the same story with costs amounting to $8.6 million and sales of only $7.2 million. Panama also incurs a loss in the amount of $118,000. However, all the regions retain some profit with the Middle East having the highest level of profit amounting to $5.8 million.
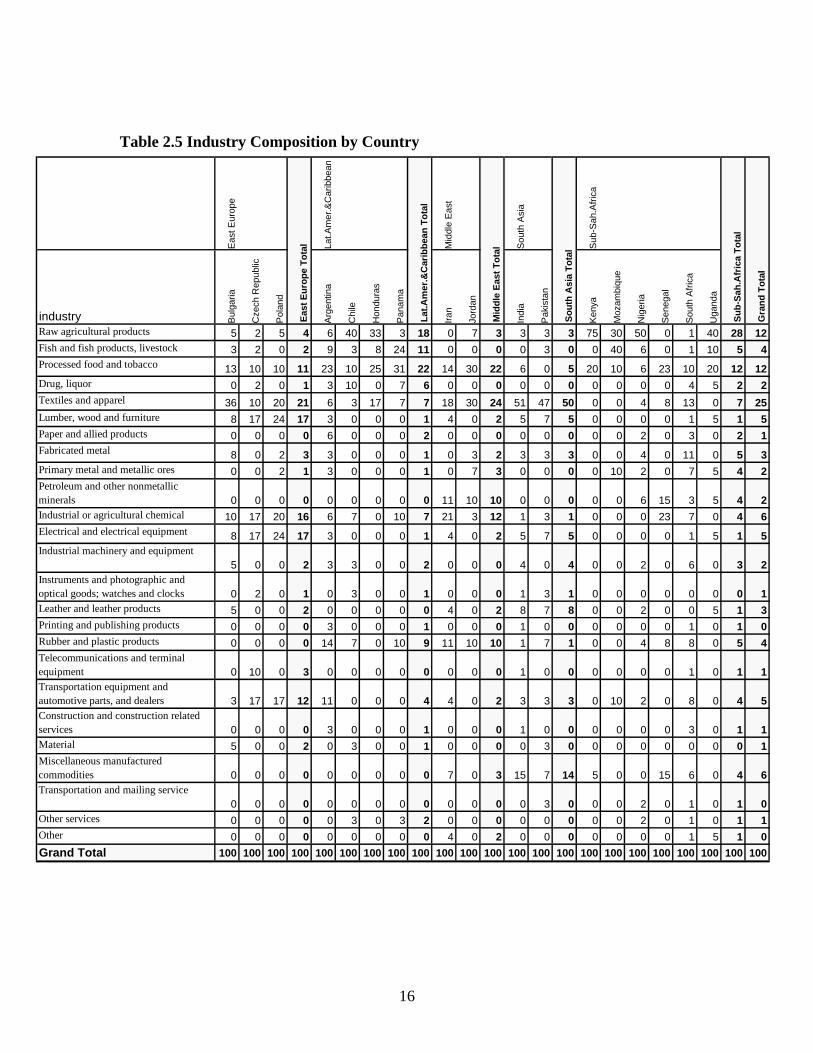
2.2 Industry Composition Table 2.5 indicates the percentage share of each of 25 industries. In our sample of 689 firms within these 25 industries, 169 firms produce textiles and apparel followed by raw agricultural products (with 84 total firms) and 82 processed food and tobacco firms. Overall, the food industry (including tobacco and drug), when put together, is dominant in the sample, constituting 28 percent of the sample. The pattern found in the sample largely follows the observation of the general trade patterns. The food industry is particularly dominant in Latin America and Caribbean and Sub-Saharan Africa. This is consistent with the trade statistics. In Kenya 75 percent of the firms are raw agricultural products, whereas 50 percent in Nigeria and 40 percent in Chile are raw agricultural products. Textile firms are dominant in India and Pakistan with 51 percent in India and 47 percent in Pakistan. Eastern Europe has a higher share of manufactured goods such as textiles and apparel, electrical equipment, lumber, wood and furniture, and transportation equipment and automotive parts, in contrast to its low agricultural products.
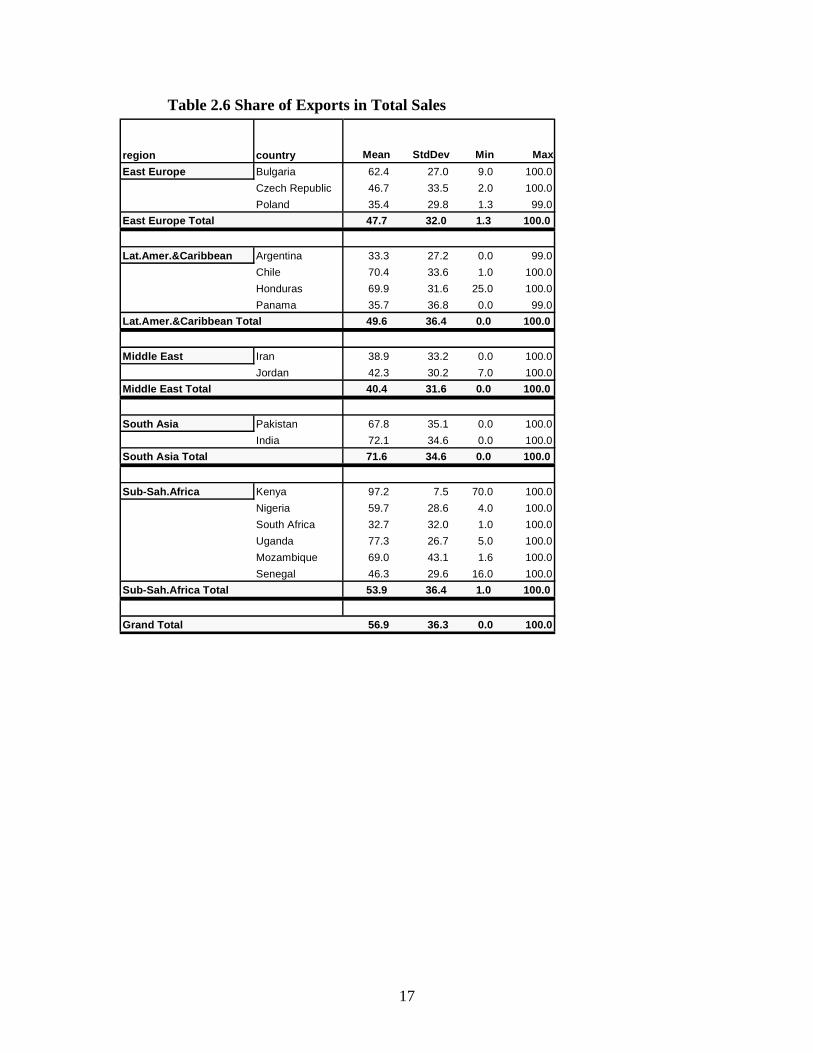
2.3 Exports The majority of the firms in the sample export at least some of their products. Due to the nature of the purpose of the survey, the sample consists of firms that are either currently
11
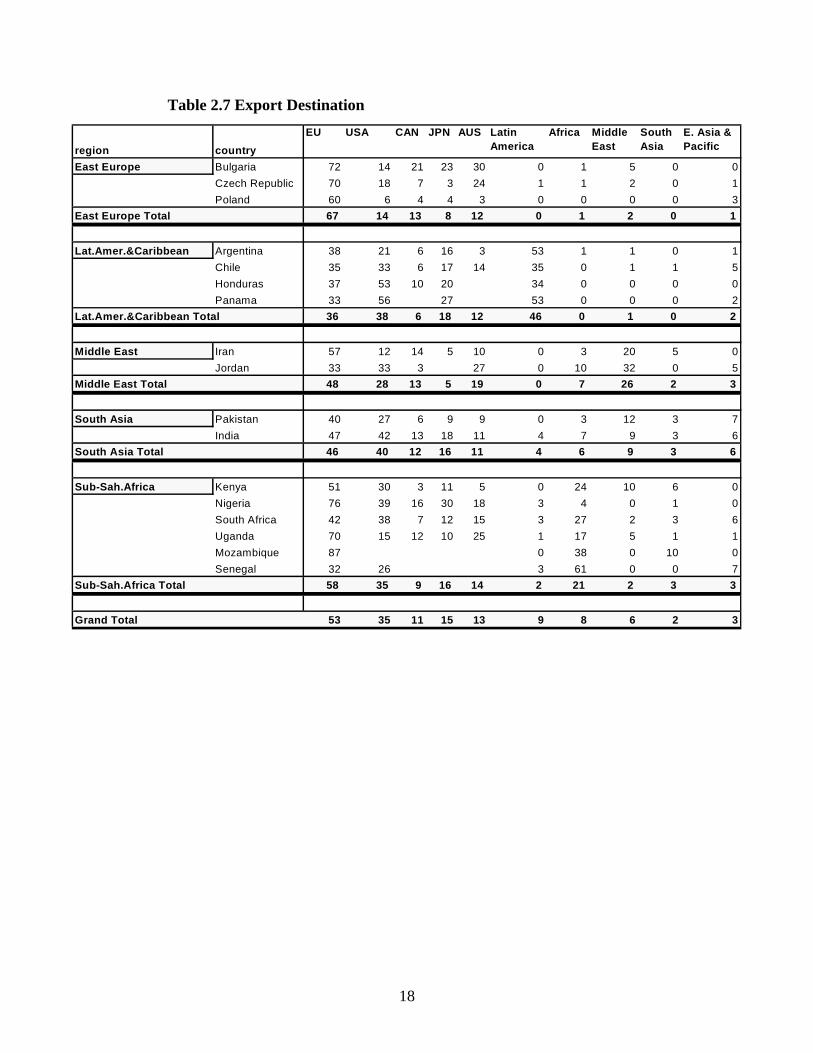
exporting or willing to export. The number of firms that are currently exporting is 628 (91 percent). The number of firms that are clearly not exporting is 47 (6.8 percent). Export Orientation Table 2.6 shows the percentage share of a firm’s exports in its total sales. The export share of the firms in South Asia are the highest among the regions. The firms in Sub-Saharan Africa also exhibit a high export share on average. Among those, export share is particularly high in Kenya, Uganda, and Mozambique. On the other hand, the share of exports is less than 50 percent on average in Eastern Europe, Latin American and Caribbean, and the Middle East. Among those, Bulgaria, Chile, and Honduras exhibit a relatively high export share, whereas Poland, Argentina, Panama, and Iran exhibit relatively low export share. Export Destination Table 2.7 shows the share of a firm’s exports by destination. The EU is the largest destination market for all the regions except Latin America and Caribbean. The firms in Eastern Europe particularly export a large share to the EU, reflecting their country’s bilateral trade arrangement with the EU. Among other destinations, the firms in the Middle East diversify the export destinations with the US and other countries in the Middle East. Jordan, in particular, has a large export share with the US due to the FTA between the two. The firms in Sub-Saharan Africa also export mainly to the EU due to the proximity and former colonial ties to the European countries, but they export a significant share to the US as well. Intra-regional exports also constitute one-fifth of the exports in Sub-Saharan Africa. For the firms in South Asia, the EU and the US are almost equally important. the EU and the US are both net importers of textiles and clothing which are the major exports from India and Pakistan. This accounts for the dominance of these markets for the exports from the firms in South Asia. The US in particular, is the top buyer for cotton fabrics from Pakistan, and is the fifth largest buyer for cotton yarn after East Asian countries in 2001-2002 (Export Promotion Bureau Pakistan, 2001). According to India’s official statistics, the EU, the US, and Canada are the top, second, and third largest export market for India’s cotton textiles, respectively. In contrast to their high dependency on the western markets, their intra-regional exports are very small despite the two major regional trade arrangements Economic Cooperation Organization (ECO) and the South Asian Associate for Regional Cooperation (SAARC). The sample does not reflect the fact that India and Pakistan are leading trading partner for each other perhaps because a large portion of the sample consists of textiles and clothing which are not traded between these countries. The firms in Latin America differ from those in the other regions in the respect that within-region markets are the most important, whereas the export shares to the EU and the US are not high on average. When countries within the region are compared, the firms in Argentina and Panama are more actively involved in intra-regional export.
12
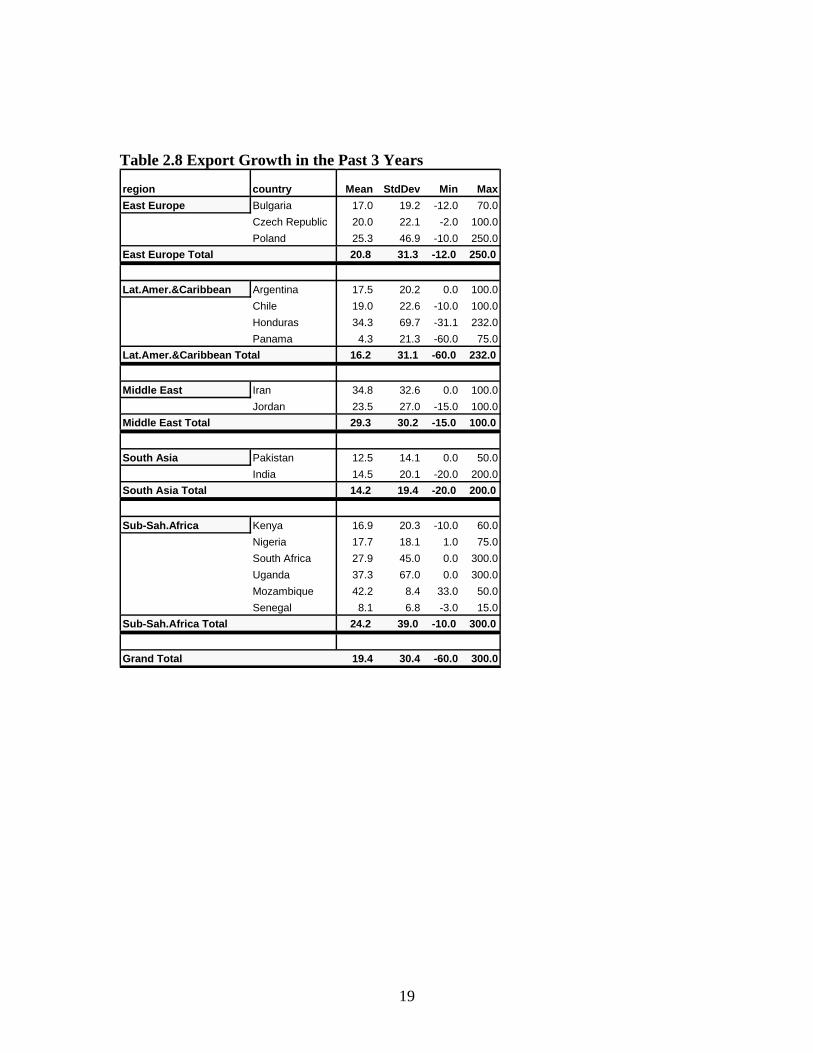
Argentina is a member of MERCOSOR and exports almost half of its export to Brazil. Due to the bilateral free trade agreements with other Central American countries, Panama also exports its large share to those countries. For the firms in Honduras and Panama, the US is the most important export market. Growth in Exports The growth in exports of the firms in the past 3 years is 19 percent on average according to Table 2.8. The average growth is the greatest in the Middle East (29 percent) and Sub-Saharan Africa (24 percent), possibly reflecting the rapidly growing industries in the region. Among all the countries, the highest export growth is observed in Mozambique (42 percent). On the contrary, the firms in South Asia exhibit a slower growth (14 percent), possibly reflecting the stagnating growth in world price of textiles and clothing. Table 2.1 Ownership Form of Firm (Percentage)
Eas
t Eur
ope
Lat.A
mer
.&C
arib
bean
Mid
dle
Eas
t
Sou
th A
sia
Sub
-Sah
.Afr
ica
Bul
garia
Cze
ch R
epub
lic
Pol
and
Arg
entin
a
Chi
le
Hon
dura
s
Pan
ama
Iran
Jord
an
Pak
ista
n
Indi
a
Ken
ya
Nig
eria
Sou
th A
fric
a
Uga
nda
Moz
ambi
que
Sen
egal
Headquarter location of a privately held, non-listed company 56 66 38 53 71 93 92 76 81 61 55 58 23 51 47 60 79 68 20 40 38 61 58Headquarter location of a publicly traded or listed company 6 24 8 13 3 3 0 10 5 32 34 33 70 15 22 0 4 13 15 20 0 9 15Subsidiary/division of a domestic enterprise 0 0 0 0 0 3 8 7 4 0 0 0 3 1 1 5 0 3 0 0 0 2 1Subsidiary/division of a multinational firm 0 5 10 5 14 0 0 0 5 0 3 2 0 1 0 0 0 10 5 0 25 6 3Joint venture of a domestic enterprise 0 0 8 3 9 0 0 3 4 0 0 0 0 0 0 30 11 0 10 0 0 7 3Joint venture of a multinational firm
3 2 15 7 3 0 0 0 1 0 3 2 0 0 0 5 4 3 10 30 0 6 3Completely or partially State owned company 14 0 8 7 0 0 0 0 0 0 3 2 0 1 0 0 0 0 5 10 13 2 2Cooperative/collective 6 2 8 5 0 0 0 0 0 0 0 0 0 1 0 0 2 0 5 0 0 1 1Other 17 0 8 8 0 0 0 3 1 7 0 4 3 32 29 0 0 3 30 0 25 6 13Grand Total 100 100 100 100 100 100 100 100 100 100 100 100 100 100 100 100 100 100 100 100 100 100 100
So
uth
Asi
a T
ota
l
Su
b-S
ah.A
fric
a T
ota
l
Gra
nd
To
tal
Eas
t E
uro
pe
To
tal
Lat
.Am
er.&
Car
ibb
ean
To
tal
Mid
dle
Eas
t T
ota
l
13
Table 2.2 Gross Annual Sales (in US$ 1,000)
Note: The value of sales is measured in the 2001 US dollar.
region country Mean Std. Dev. Min Max
East Europe Bulgaria 3,434 5,450 32.0 29,821
Czech Republic 7,200 11,358 8.3 54,236
Poland 29,369 61,702 13.7 326,720
East Europe Total 12,701 36,372 8.3 326,720
Lat.Amer.&CaribbeanArgentina 17,543 35,044 53.7 182,388
Chile 6,063 7,802 58.3 30,501
Honduras 5,013 6,880 49.4 20,000
Panama 8,449 15,456 33.0 68,276
Lat.Amer.&Caribbean Total 10,914 23,820 33.0 182,388
Middle East Iran 40,738 49,357 303.2 163,205
Jordan 13,524 49,529 70.5 270,041
Middle East Total 25,847 50,847 70.5 270,041
South Asia Pakistan 18,216 25,264 9.9 88,797
India 7,749 26,912 8.7 226,372
South Asia Total 8,977 26,880 8.7 226,372
Sub-Sah.Africa Kenya 7,054 12,529 10.2 51,870
Nigeria 544 1,969 9.6 13,116
South Africa 19,205 58,145 12.9 336,216
Uganda 8,117 15,081 8.6 59,447
Mozambique 2,049 2,397 252.00 6,890
Senegal 33,677 87,471 929.0 320,888
Sub-Sah.Africa Total 11,933 44,630 8.57 336,216
Grand Total 12,101 36,305 8.27 336,216
14
Table 2.3 Total Number of Full- and Part-time Worker
region country Mean Std. Dev. Min Max
East Europe Bulgaria 190 240 0.00 1,150
Czech Republic 243 357 0.00 1,510
Poland 265 501 0.00 2,000
East Europe Total 232 374 0.00 2,000
Lat.Amer.&CaribbeanArgentina 205 377 0.00 1,530
Chile 135 262 0.00 1,300
Honduras 338 392 60.00 1,206
Panama 130 127 4 550
Lat.Amer.&Caribbean Total 183 309 0.00 1,530
Middle East Iran 484 559 16.00 1,500
Jordan 131 127 0.00 510
Middle East Total 291 423 0.00 1,500
South Asia Pakistan 742 1,077 0.00 4,100
India 220 808 1.00 8,500
South Asia Total 282 858 0.00 8,500
Sub-Sah.Africa Kenya 62 72 0.00 225
Nigeria 28 40 0.00 200
South Africa 676 1,692 0.00 9,500
Uganda 566 1,197 0.00 4,000
Mozambique 231 340 0.00 857
Senegal 266 197 33.00 680
Sub-Sah.Africa Total 369 1,162 0.00 9,500
Grand Total 284 817 0.00 9,500
15
Table 2.4 Financial Structure (Sales and Costs in $1,000)
region country
Sales Raw materials
Intermediate Inputs
Salary Fixed assets
Investment
R&D investment
East Europe Bulgaria 3,434 1,192 266 265 6,703 169 16
Czech Republic 7,200 3,360 3,906 1,350 4,293 662 96
Poland 29,369 12,499 6,191 5,983 7,445 1,378 762
East Europe Total 12,701 5,152 3,478 2,437 6,088 713 324
Lat.Amer.&CaribbeArgentina 17,543 9,433 2,295 802 14,066 811 171
Chile 6,063 3,147 927 772 4,812 148 17
Honduras 5,013 3,077 634 975 4,158 285 21
Panama 8,449 7,275 629 663 2,005 151 92
Lat.Amer.&Caribbean Total 10,914 6,475 1,472 778 7,734 429 90
Middle East Iran 40,738 19,506 5,439 5,162 29,550 8,690 14,817
Jordan 13,524 4,949 4,725 2,219 25,063 505 20
M iddle East Total 25,847 11,541 4,997 3,551 27,037 3,846 6,091
South Asia Pakistan 18,216 9,971 3,866 563 9,762 634 388
India 7,749 4,312 862 367 3,566 218 40
South Asia Total 8,977 4,977 1,177 397 4,297 267 66
Sub-Sah.Africa Kenya 7,054 4,852 503 137 958 67 16
Nigeria 544 393 82 46 880 50 7
South Africa 19,205 10,054 2,886 4,216 18,190 1,124 295
Uganda 8,117 5,046 512 409 3,079 547 29
Mozambique 2,049 2,122 979 269 1,003 392
Senegal 33,677 21,594 17,544 1,031 5,472 1,375 134
Sub-Sah.Africa Total 11,933 6,872 2,675 1,816 8,368 683 151
Grand Total 12,101 6,273 2,235 1,557 7,992 765 609
16
Table 2.5 Industry Composition by Country
Eas
t Eur
ope
Lat.A
mer
.&C
arib
bean
Mid
dle
Eas
t
Sou
th A
sia
Sub
-Sah
.Afr
ica
industry Bul
garia
Cze
ch R
epub
lic
Pol
and
Arg
entin
a
Chi
le
Hon
dura
s
Pan
ama
Iran
Jord
an
Indi
a
Pak
ista
n
Ken
ya
Moz
ambi
que
Nig
eria
Sen
egal
Sou
th A
fric
a
Uga
nda
Raw agricultural products 5 2 5 4 6 40 33 3 18 0 7 3 3 3 3 75 30 50 0 1 40 28 12Fish and fish products, livestock 3 2 0 2 9 3 8 24 11 0 0 0 0 3 0 0 40 6 0 1 10 5 4Processed food and tobacco 13 10 10 11 23 10 25 31 22 14 30 22 6 0 5 20 10 6 23 10 20 12 12Drug, liquor 0 2 0 1 3 10 0 7 6 0 0 0 0 0 0 0 0 0 0 4 5 2 2Textiles and apparel 36 10 20 21 6 3 17 7 7 18 30 24 51 47 50 0 0 4 8 13 0 7 25Lumber, wood and furniture 8 17 24 17 3 0 0 0 1 4 0 2 5 7 5 0 0 0 0 1 5 1 5Paper and allied products 0 0 0 0 6 0 0 0 2 0 0 0 0 0 0 0 0 2 0 3 0 2 1Fabricated metal 8 0 2 3 3 0 0 0 1 0 3 2 3 3 3 0 0 4 0 11 0 5 3Primary metal and metallic ores 0 0 2 1 3 0 0 0 1 0 7 3 0 0 0 0 10 2 0 7 5 4 2Petroleum and other nonmetallic minerals 0 0 0 0 0 0 0 0 0 11 10 10 0 0 0 0 0 6 15 3 5 4 2Industrial or agricultural chemical 10 17 20 16 6 7 0 10 7 21 3 12 1 3 1 0 0 0 23 7 0 4 6Electrical and electrical equipment 8 17 24 17 3 0 0 0 1 4 0 2 5 7 5 0 0 0 0 1 5 1 5Industrial machinery and equipment
5 0 0 2 3 3 0 0 2 0 0 0 4 0 4 0 0 2 0 6 0 3 2Instruments and photographic and optical goods; watches and clocks 0 2 0 1 0 3 0 0 1 0 0 0 1 3 1 0 0 0 0 0 0 0 1Leather and leather products 5 0 0 2 0 0 0 0 0 4 0 2 8 7 8 0 0 2 0 0 5 1 3Printing and publishing products 0 0 0 0 3 0 0 0 1 0 0 0 1 0 0 0 0 0 0 1 0 1 0Rubber and plastic products 0 0 0 0 14 7 0 10 9 11 10 10 1 7 1 0 0 4 8 8 0 5 4Telecommunications and terminal equipment 0 10 0 3 0 0 0 0 0 0 0 0 1 0 0 0 0 0 0 1 0 1 1Transportation equipment and automotive parts, and dealers 3 17 17 12 11 0 0 0 4 4 0 2 3 3 3 0 10 2 0 8 0 4 5Construction and construction related services 0 0 0 0 3 0 0 0 1 0 0 0 1 0 0 0 0 0 0 3 0 1 1Material 5 0 0 2 0 3 0 0 1 0 0 0 0 3 0 0 0 0 0 0 0 0 1Miscellaneous manufactured commodities 0 0 0 0 0 0 0 0 0 7 0 3 15 7 14 5 0 0 15 6 0 4 6Transportation and mailing service
0 0 0 0 0 0 0 0 0 0 0 0 0 3 0 0 0 2 0 1 0 1 0Other services 0 0 0 0 0 3 0 3 2 0 0 0 0 0 0 0 0 2 0 1 0 1 1Other 0 0 0 0 0 0 0 0 0 4 0 2 0 0 0 0 0 0 0 1 5 1 0
Grand Total 100 100 100 100 100 100 100 100 100 100 100 100 100 100 100 100 100 100 100 100 100 100 100
Su
b-S
ah.A
fric
a T
ota
l
Gra
nd
To
tal
Eas
t E
uro
pe
To
tal
Lat
.Am
er.&
Car
ibb
ean
To
tal
Mid
dle
Eas
t T
ota
l
So
uth
Asi
a T
ota
l
17
Table 2.6 Share of Exports in Total Sales
region country Mean StdDev Min Max
East Europe Bulgaria 62.4 27.0 9.0 100.0
Czech Republic 46.7 33.5 2.0 100.0
Poland 35.4 29.8 1.3 99.0
East Europe Total 47.7 32.0 1.3 100.0
Lat.Amer.&Caribbean Argentina 33.3 27.2 0.0 99.0
Chile 70.4 33.6 1.0 100.0
Honduras 69.9 31.6 25.0 100.0
Panama 35.7 36.8 0.0 99.0
Lat.Amer.&Caribbean Total 49.6 36.4 0.0 100.0
Middle East Iran 38.9 33.2 0.0 100.0
Jordan 42.3 30.2 7.0 100.0
Middle East Total 40.4 31.6 0.0 100.0
South Asia Pakistan 67.8 35.1 0.0 100.0
India 72.1 34.6 0.0 100.0
South Asia Total 71.6 34.6 0.0 100.0
Sub-Sah.Africa Kenya 97.2 7.5 70.0 100.0
Nigeria 59.7 28.6 4.0 100.0
South Africa 32.7 32.0 1.0 100.0
Uganda 77.3 26.7 5.0 100.0
Mozambique 69.0 43.1 1.6 100.0
Senegal 46.3 29.6 16.0 100.0
Sub-Sah.Africa Total 53.9 36.4 1.0 100.0
Grand Total 56.9 36.3 0.0 100.0
18
Table 2.7 Export Destination
region country
EU USA CAN JPN AUS Latin America
Africa Middle East
South Asia
E. Asia & Pacific
East Europe Bulgaria 72 14 21 23 30 0 1 5 0 0
Czech Republic 70 18 7 3 24 1 1 2 0 1
Poland 60 6 4 4 3 0 0 0 0 3
East Europe Total 67 14 13 8 12 0 1 2 0 1
Lat.Amer.&Caribbean Argentina 38 21 6 16 3 53 1 1 0 1
Chile 35 33 6 17 14 35 0 1 1 5
Honduras 37 53 10 20 34 0 0 0 0
Panama 33 56 27 53 0 0 0 2
Lat.Amer.&Caribbean Total 36 38 6 18 12 46 0 1 0 2
Middle East Iran 57 12 14 5 10 0 3 20 5 0
Jordan 33 33 3 27 0 10 32 0 5
Middle East Total 48 28 13 5 19 0 7 26 2 3
South Asia Pakistan 40 27 6 9 9 0 3 12 3 7
India 47 42 13 18 11 4 7 9 3 6
South Asia Total 46 40 12 16 11 4 6 9 3 6
Sub-Sah.Africa Kenya 51 30 3 11 5 0 24 10 6 0
Nigeria 76 39 16 30 18 3 4 0 1 0
South Africa 42 38 7 12 15 3 27 2 3 6
Uganda 70 15 12 10 25 1 17 5 1 1
Mozambique 87 0 38 0 10 0
Senegal 32 26 3 61 0 0 7
Sub-Sah.Africa Total 58 35 9 16 14 2 21 2 3 3
Grand Total 53 35 11 15 13 9 8 6 2 3
19
Table 2.8 Export Growth in the Past 3 Years
region country Mean StdDev Min Max
East Europe Bulgaria 17.0 19.2 -12.0 70.0
Czech Republic 20.0 22.1 -2.0 100.0
Poland 25.3 46.9 -10.0 250.0
East Europe Total 20.8 31.3 -12.0 250.0
Lat.Amer.&Caribbean Argentina 17.5 20.2 0.0 100.0
Chile 19.0 22.6 -10.0 100.0
Honduras 34.3 69.7 -31.1 232.0
Panama 4.3 21.3 -60.0 75.0
Lat.Amer.&Caribbean Total 16.2 31.1 -60.0 232.0
Middle East Iran 34.8 32.6 0.0 100.0
Jordan 23.5 27.0 -15.0 100.0
Middle East Total 29.3 30.2 -15.0 100.0
South Asia Pakistan 12.5 14.1 0.0 50.0
India 14.5 20.1 -20.0 200.0
South Asia Total 14.2 19.4 -20.0 200.0
Sub-Sah.Africa Kenya 16.9 20.3 -10.0 60.0
Nigeria 17.7 18.1 1.0 75.0
South Africa 27.9 45.0 0.0 300.0
Uganda 37.3 67.0 0.0 300.0
Mozambique 42.2 8.4 33.0 50.0
Senegal 8.1 6.8 -3.0 15.0
Sub-Sah.Africa Total 24.2 39.0 -10.0 300.0
Grand Total 19.4 30.4 -60.0 300.0
20
Section 3. Technical Regulations and Conformity Assessments
Technical regulations and mandatory standards set by importing countries, and conformity assessments required by importing countries, such as testing and certification, can affect a firm’s ability to export and its decisions on resource reallocation to comply with the requirements. Furthermore firms are not always informed of the standards and technical regulations required to sell their products in their home country market and in foreign markets. Firms make input allocation decisions between traditional production activities and efforts that are devoted to comply with the technical requirements. These technical requirements include the need to satisfy specific safety, quality, and performance standards, and firms are often required to perform a conformity assessment. These technical requirements are perceived to hinder trade due to the compliance costs born by the exporting firms. In the empirical literature, however, there is not yet a consensus as to whether standards set by importing countries can promote trade or impede trade. Swann, Temple and Shurmer (1996) supports that country-specific standards pose barriers to trade. Blind and Jungmittag (1999) and Moenius (2000) do not support nor dispute this relationship. This section starts with an investigation of the general leading factors that affect firms’ business operation, followed by an investigation of factors that impede or promote export. It then discusses the various types of mandatory standards that are present and firms’ perception of and reactions to these standards. It finally discusses firms’ approaches to conformance testing and certification, and their effect on their operation.
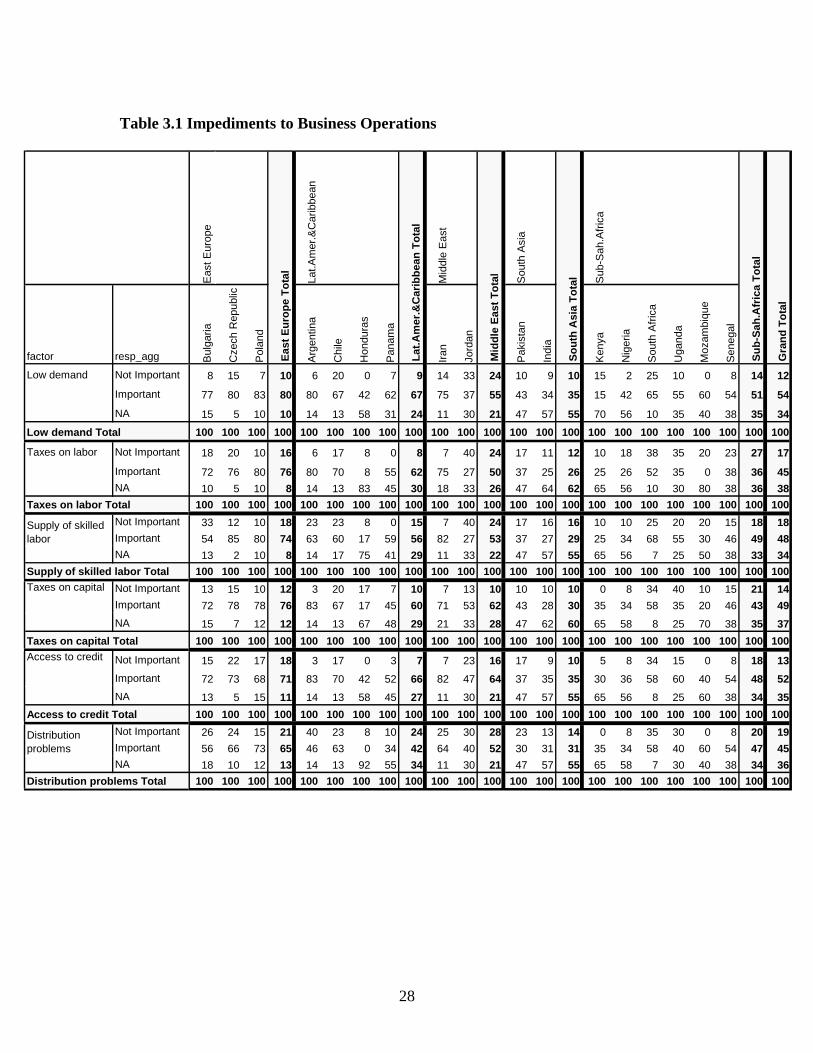
3.1 General Impediments to Business Operations Table 3.1 shows the importance of different factors on a firm’s ability to expand domestic sales. In the survey the factors considered to affect a firm’s ability to expand domestic sales include low demand in the market, taxes on labor, supply of skilled labor, access to credits, taxes on capital, and distribution problems. The greatest number of firms consider low demand to be important among the six factors to be considered. In our sample of 689 firms 54 percent think low demand is an important (on a scale of somewhat important, important, and very important) factor that affects a firm’s ability to expand domestic sales. This contrasts to the low 12 percent share of firms that consider low demand to be not at all important. Fifty-two percent of the firms consider access to credit to be important. In the other categories, the share of the firms that consider the factor to be important is dominant. We can look at the same table from a different angle and try to study the importance of the factors for each country and region. In Eastern Europe all the factors turn out to be “important” by a very high percentage of firms. Low demand is the factor that is considered “important” by more than 50 percent of the firms in all the regions except for South Asia. However, the importance of low demand varies among different countries. In Latin America, for example, 80 percent of the firms in Argentina consider low demand
21
to be “important,” whereas in Honduras only 42 percent firms think low demand is “important.” Similarly, in Sub-Saharan Africa, 65 percent of South African firms consider low demand to be important as opposed to only 15 percent in Kenya. Another important factor, “access to credit,” also has varied importance across regions. It is considered “important” by 71 percent firms in Eastern Europe, however only 35 percent firms in South Asia consider it to be important.
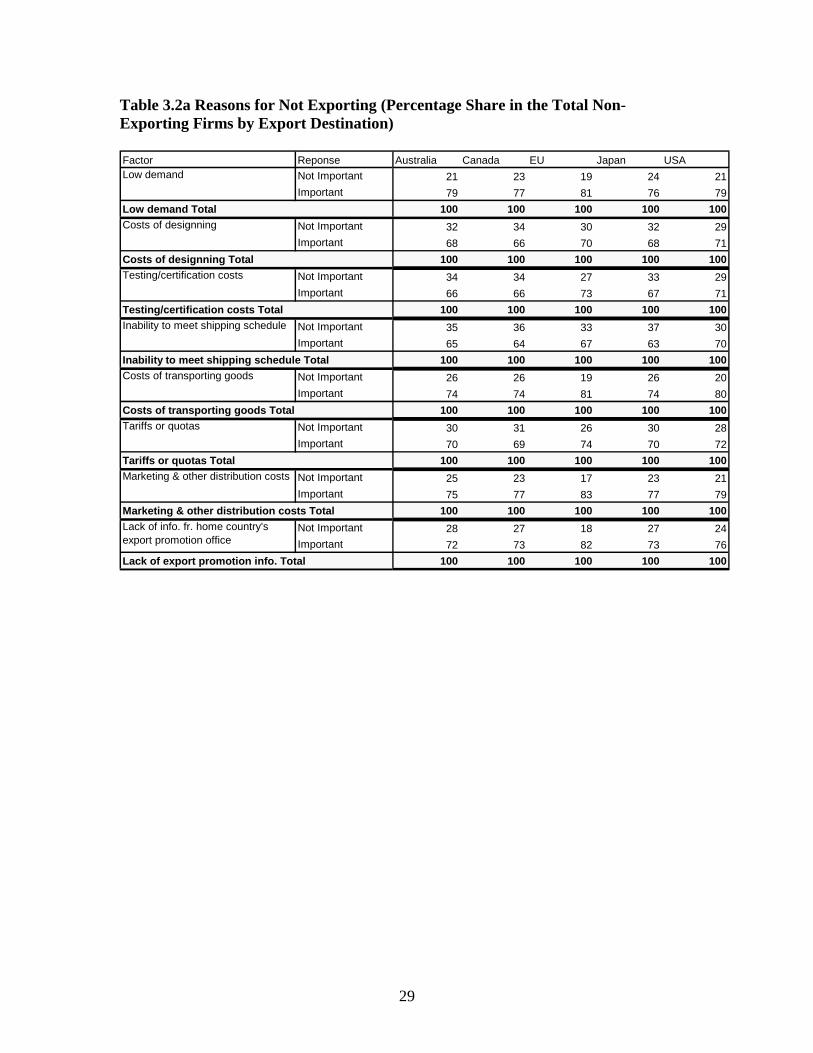
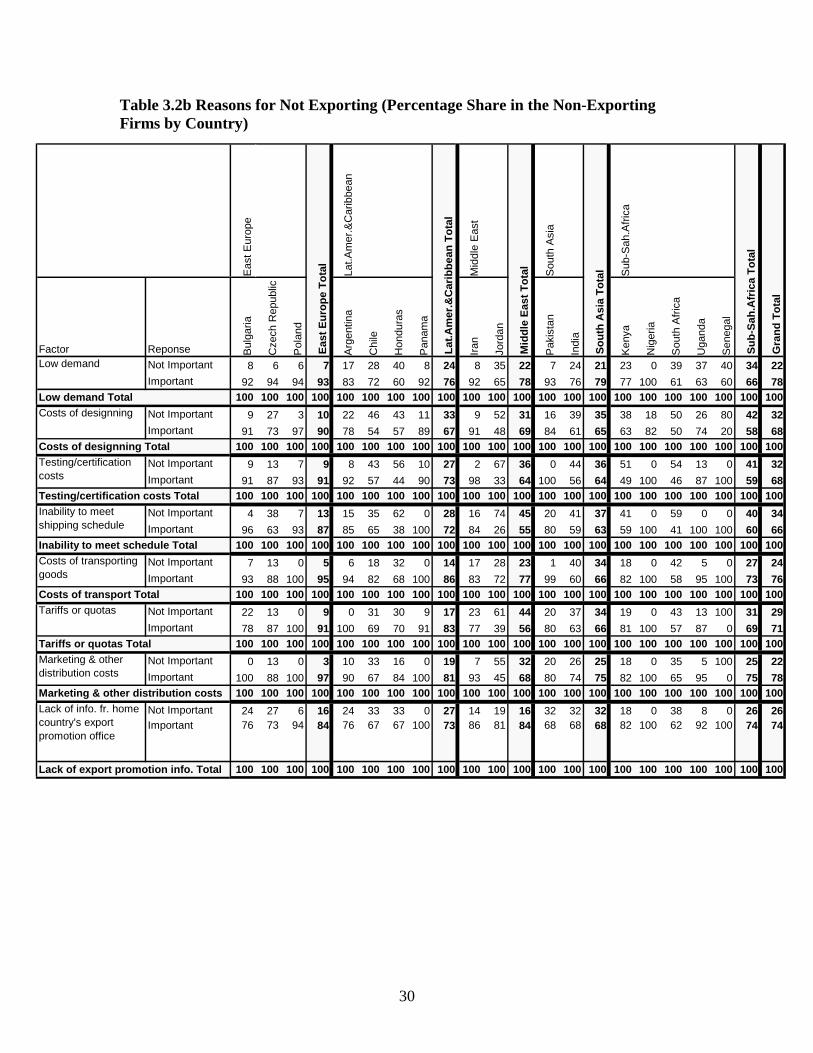
3.2 Factors Impeding and Promoting Export Tables 3.2a and 3.2b show the importance of different factors in restraining a firm’s ability to penetrate major destination markets like the EU, the US, Australia, Canada, and Japan. These factors include low demand, cost of designing, testing/certification costs, inability to meet shipping schedule, costs of transporting goods, tariffs or quotas, marketing and other distribution costs, and lack of information from the home country’s export promotion offices. In these tables, the percentage share of the firms that respond as ‘important’ or ‘not important’ to each category is computed against the total of the firms that are not currently exporting. Table 3.2a shows the response with respect to the five export destinations. Overall, it indicates that the selected factors are impediments to a majority of the firms throughout the export destinations. These factors appear to be particularly impeding the firms to export to the EU market. Consider the EU market: eighty-three percent of firms who are not exporting to the EU attribute it to marketing and other distribution costs, 82 percent to lack of information from the home country’s export promotion offices, and 81 percent to low demand and cost of transporting goods. The factors that play important roles as restraining factors for the US are costs of transporting goods (80 percent of firms say it is important), low demand and marketing and other distribution costs (79 percent say they are important). Table 3.2b reorganizes the responses by country. The two most important factors, when we disregard destination, are low demand and marketing and other distribution costs—78 percent of the non exporters consider these factors to be important. In Eastern Europe, all the factors are considered to be important by at least 80 percent of the firms. Low demand is considered important by 93 percent of non-exporting firms in Eastern Europe as opposed to only 66 percent in Sub-Saharan Africa. Also, the importance varies among countries in the same region. In Nigeria 100 percent of firms consider low demand to be important whereas only 60 percent in Senegal and 61 percent in South Africa do. Importance of marketing and other distribution costs also varies across regions and countries. In Eastern Europe 97 percent of firms say it is important as compared to only 68 percent in the Middle East, where there is a huge variation between firms in Iran (93 percent) and Jordan (45 percent). In Sub-Saharan Africa, 100 percent of Nigerian firms consider marketing and other distribution costs to be important, while not a single firm in Senegal thinks it is.
22
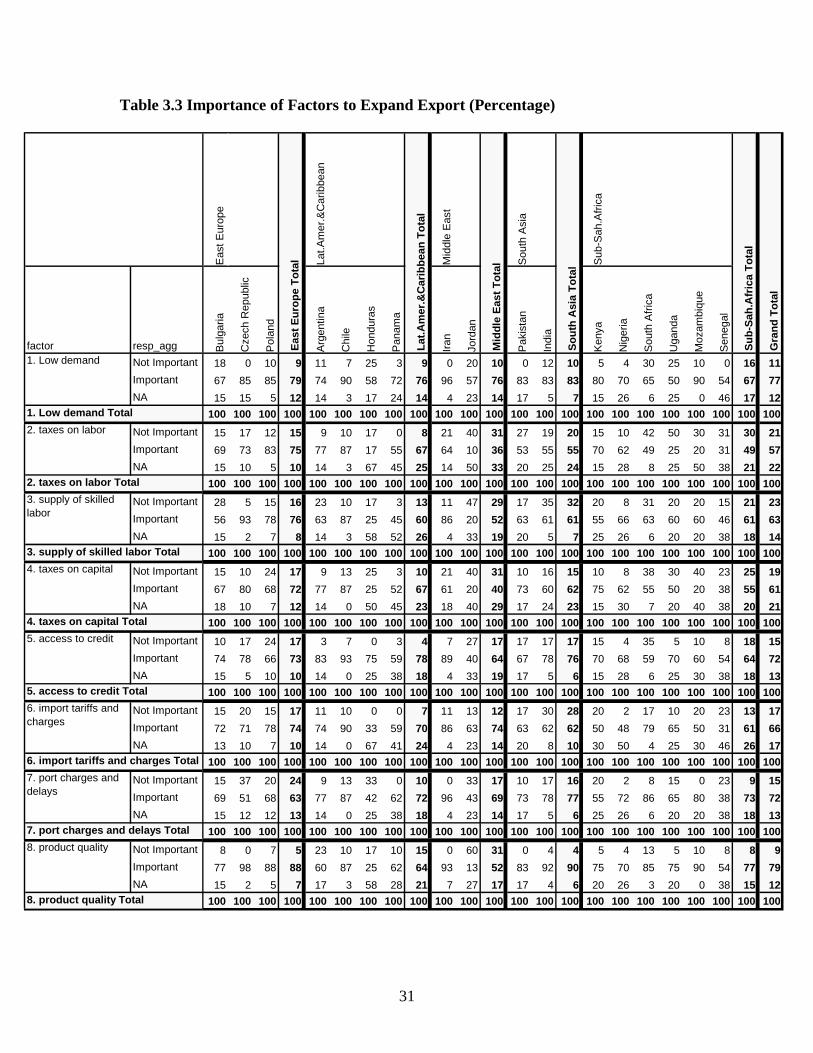
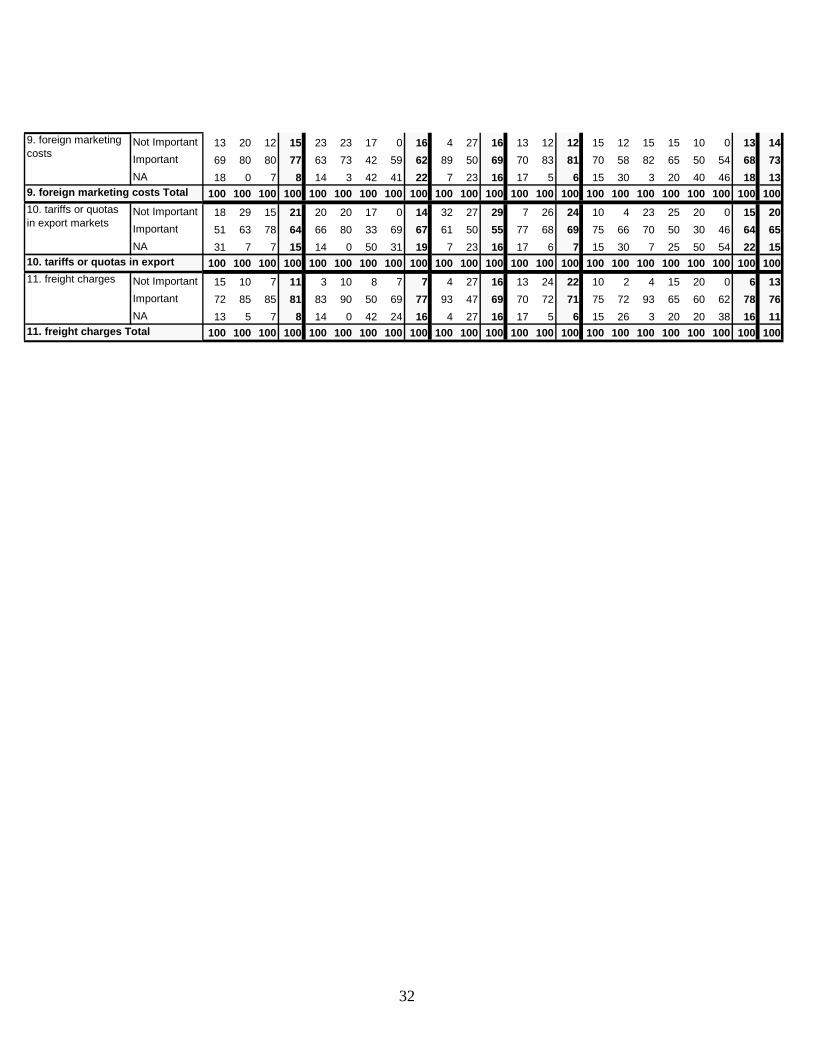
Table 3.3 shows the importance of different factors on a firm’s ability to expand exports. Product quality appears to be the most important factor affecting this. Seventy-nine percent of the firms say product quality and 77 percent say low demand are important (ranging from somewhat to –very important) factors for a firm’s ability to expand exports. The other factors are all important as well. This question can also be studied from the perspective of different countries. Product quality is considered important by 90 percent of firms in South Asia, but by only 52 percent in the Middle East. The Middle East has very different responses from two of its countries—Iran and Jordan. In Iran 93 percent of firms consider product quality to be important as compared to a low percentage of 13 in Jordan. Low demand also has varied importance across countries. In Sub-Saharan Africa, 90 percent of the firms in Mozambique consider low demand to be important, whereas 50 percent consider it important in Uganda.
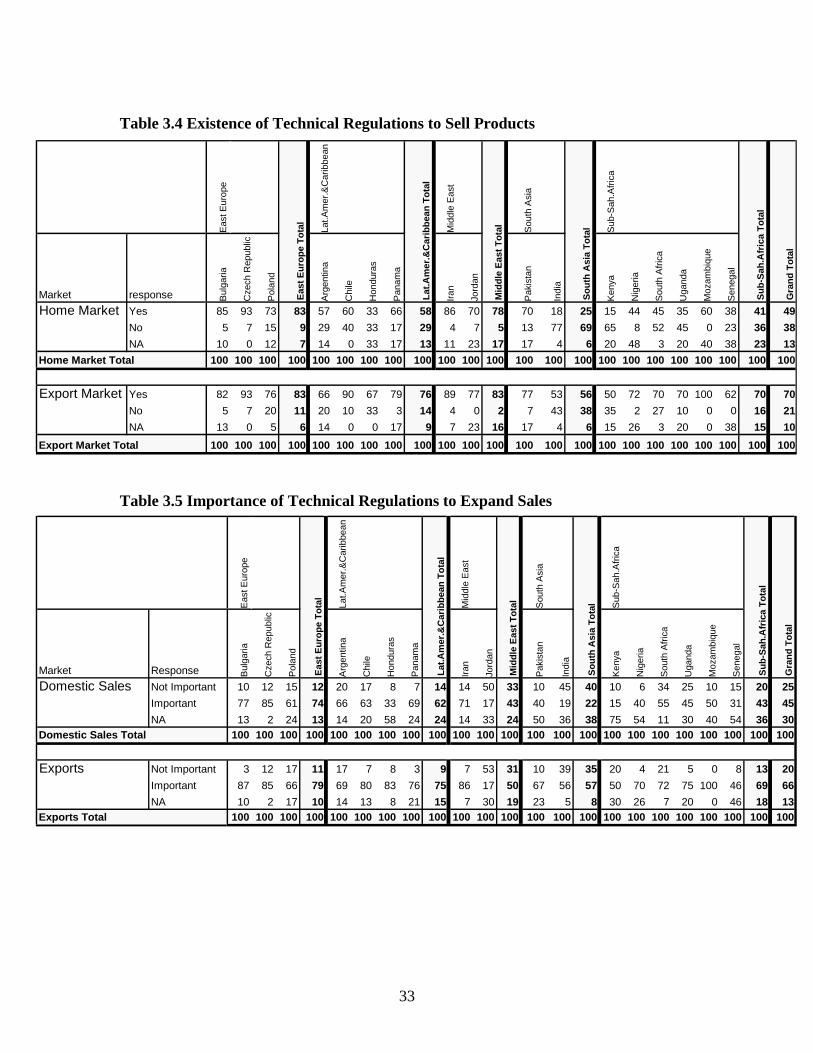
3.3 Domestic and Foreign Technical Regulations 3.3.1 The Presence of Mandatory Domestic and Foreign Technical Regulations Table 3.4 shows the percentage share of firms that face or do not face technical regulations to sell their products in both home and export markets. Overall, the majority of the firms face technical regulations. The share of firms that face domestic technical regulations is particularly high in Eastern Europe and the Middle East. The share of firms facing domestic regulations is the lowest in Kenya (15 percent) and the highest in the Czech Republic (93 percent). Apparently there is no similarity in terms of the share between countries in a given region, but the share facing domestic technical regulations is the highest in Eastern Europe (83 percent) on average. It is also interesting to note that in the South Asian region, Pakistan and India exhibit a sharp difference in their answers. Seventy percent of firms in Pakistan face domestic technical regulations, whereas in India only 18 do. There seems to be a positive correlation between the share of firms that face domestic technical regulation and those which face technical regulations in the export market. The share of firms that face foreign technical regulations is also high in Eastern Europe and the Middle East. But many more firms in Sub-Saharan Africa face foreign technical regulations than domestic technical regulations. The lowest share is found in Kenya (50 percent), and the highest share is found in Mozambique (100 percent). When compared between home and export markets, 70 percent of the firms in the total sample face technical regulations in an export market, which is 21 percent higher than the share of the firms that face technical regulations in the domestic market. All the countries in the sample except for Bulgaria and the Czech Republic exhibit higher shares of firms that face foreign technical regulations than those which face domestic technical regulations.
23
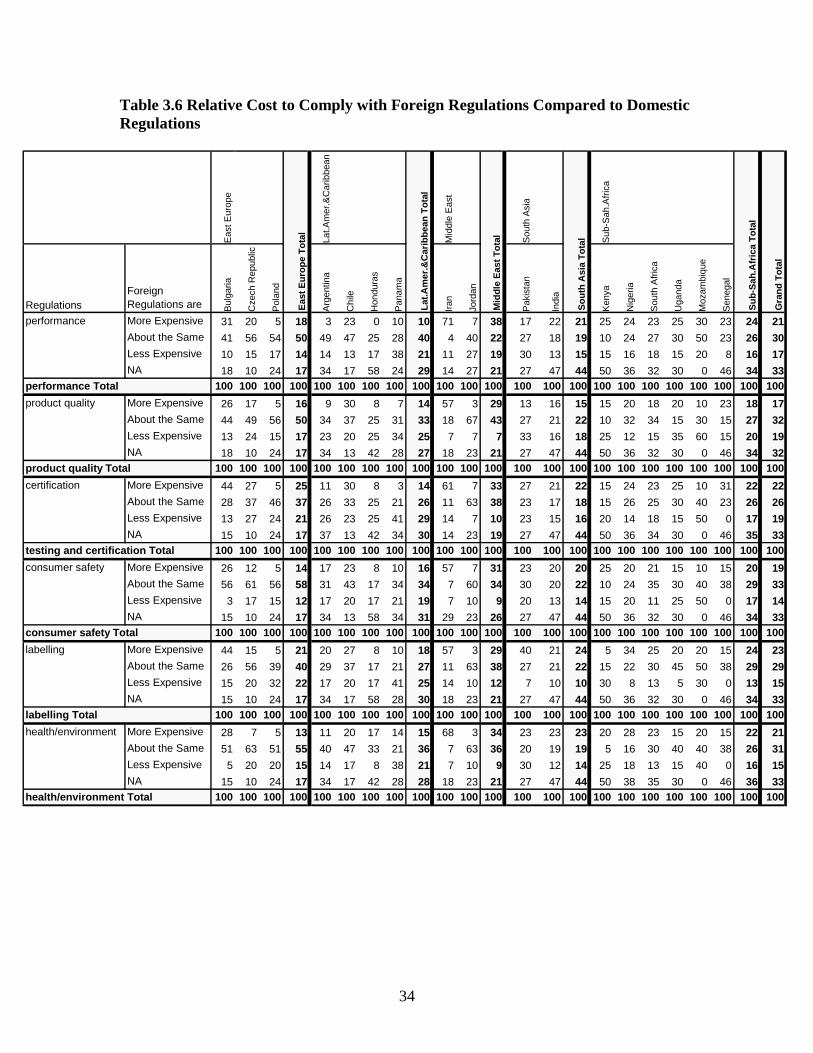
3.3.2 Importance of Domestic and Foreign Technical Regulations Table 3.5 shows the share of firms that consider technical regulations in home and export markets to be ‘important’ or ‘not important’ for the expansion of sales. All the countries in the sample exhibit equal or higher shares of firms that consider foreign technical regulations to be important than those which consider domestic technical regulations to be important. Sixty-six percent of the total firms in the sample consider technical regulations in export markets to be important, and this share is 21 percent greater than the share of firms that consider technical regulations in home markets to be important. Among the regions, Eastern Europe and Latin America and Caribbean exhibit relatively large shares of firms that consider technical regulations to be important both in home and export markets. Iran and Jordan in the Middle East region exhibit differences in importance of regulations for sales expansion both in the home and export market. In Iran 71 percent of firms consider technical regulations to be important for domestic sales as compared to 17 percent in Jordan. Similarly for exports, 86 percent of firms in Iran think technical regulation is important as opposed to 17 percent in Jordan. 3.3.3 Importance of Technical Regulations Table 3.6 shows relative cost to comply with domestic technical regulations compared to foreign ones. It is useful as it provides objective comparison of the impact of the regulations between home and export markets. The technical regulations to be considered include performance standards, product quality standards, certification requirement, consumer safety standards, labeling requirement, and health/environmental standards. Although not a dominant factor, the largest share of firms responded that the compliance costs are about the same between domestic and foreign technical regulations throughout the categories. There is no significant difference in the share of firms which respond that domestic regulations are more costly to comply with than foreign regulation and those which respond that foreign regulations are more costly than domestic regulations. In all the categories with the exception of ‘product quality,’ more firms respond that foreign regulations are more costly but only by a slight difference. There are no notable patterns of response across countries. Now we shall focus on the technical regulations in the export market. The importance of the technical regulations can be compared across destination markets and across exporting countries. Table 3.7a compares the importance by the five leading export markets for each category of foreign technical regulations. Table 3.7b organizes the response by country instead of export markets. The technical regulations in the EU market are considered to be important by the largest share of firms in the sample. The share varies from 48 percent for ‘health/environmental standards’ to 61 percent for ‘product quality standards.’ The US regulations are also considered important by a large share of the firms, varying from 27 to 37 percent. The technical regulations in Australia, Canada and Japan seem not to be widely perceived as ‘important.’
24
Among the regulation categories, ‘product quality standards’ are most widely perceived to be important. ‘Performance standards’ and ‘testing/certification requirement’ are also widely perceived to be important by an almost equal share of the firms. Table 3.7b indicates that the share of firms that consider these technical regulations to be important is the highest in South Asia. These requirements are much less relevant to the Middle East. There is a high correlation between the responses to the regulation categories for a given country or region, where the shares to respond ‘important’ are collectively high or low. This implies that, for a country or region to which the performance standards are important, other regulations such as product quality standards are also important. Comparison between Table 3.4 with Table 3.7b shows that, in overall, most of the firms that confront foreign technical regulations perceive these regulations to be important. In summary, foreign technical regulations are applied to a wider range of firms than domestic technical regulations, and also their importance is perceived by a wider range of firms. The regional variation seems to be quite high reflecting the differing conditions in terms of domestic and foreign technical regulations across exporting countries. Part of the cause of the regional difference in the existence and the importance of foreign technical regulations is simply the different export shares by destination markets as Table 2.8 indicates. For example, the EU, whose market is generally perceived as most important, is the major export market for both Eastern Europe and the Middle East, and so the perceived importance of the foreign technical regulations is heavily weighted by the EU market. The regional difference may also be associated with the discriminatory treatment of their exports by the importing countries, say with different degrees of enforcement of the regulations. 3.3.4 Information Availability by Export Markets In the real world, firms usually confront constraints to obtain information about foreign regulations. The lack of information about foreign regulations crucially limits a firm’s ability to forecast the likelihood of rejection of their exports in the destination markets due to technical regulations. Thus, firms tend to stay away from new export markets in which information on regulations are scarce, and to stay in the market whose regulations are familiar to them. Table 3.8 indicates the share of firms that have difficulty obtaining information about regulations in the major five export markets, along with those that do not have difficulty. It is surprising that the majority of the firms do not consider obtaining information to be difficult.
25
3.3.5 Compliance Costs of Technical Regulations Firms react to domestic and foreign technical regulations in various manners. When firms decide to comply with these requirements, they typically employ additional resources to make an improvement in product quality. As shown in Table 3.9a, the surveyed firms invest in additional plant or equipment, one-time product redesign, product redesign for each export market, additional labor for production, additional labor for testing and certification, or lay off workers instead of making these types of investment in order to keep the costs from increasing. Table 3.9a indicates that the majority of the firms do not make any investment or lay off workers to comply with the technical requirements. This implies that, in most cases, compliance can be met within the existing plant, equipment, workers and technology. Among the firms that take any action, investment in additional plant or equipment is most common (38 percent). Product re-design and additional employment are also common types of compliance efforts. Thirty-one percent of the firms invest in one-time product re-design, and thirty percent of the firms hire additional workers to comply with the technical regulations. Table 3.9b shows the costs of compliance as a share of investment costs by regulation categories. The cost share is most concentrated in the lowest range between 1 and 10 percent, and the majority of firms that responded fall under the range below 25 percent. Product re-design and additional employment are particularly concentrated in the lowest-cost range. These perhaps require smaller amount of installation costs, making them attractive to financially-constrained firms. While Table 3.9 does not suggest significant cost effects, actual production costs and the amount of new investment can be compared by those who confront foreign technical regulations and those who do not. Figure 3.1 shows that, on average, variable costs, new investment, and fixed assets are higher for firms who confront foreign technical regulations. While this comparison is not statistically founded, it suggests that technical regulations possibly reduce production costs including investment costs, and also reduce fixed assets needed to comply with foreign technical regulations. 3.3.6 The Impact of Technical Regulations on Export Figure 3.2 shows that, on average, export share in total sales is slightly higher for those who do not confront foreign technical regulations. The exception is the EU market. The higher share is found for those who confront foreign technical regulations. It possibly suggests that the EU standards and technical regulations have a net trade promoting effect. While this comparison also lacks statistical foundation, it suggests that technical regulations possibly reduce export. The obligation to meet these requirements may discourage export while it is found earlier that the majority of those who responded perceive technical regulations to be important for entering an export market. Tables 3.10a and 3.10b show the total investment cost in technical regulations as a share in value of sales, summarized by country and industry, respectively.
26
3.4 Conformity Assessment
Table 3.11 shows whether the products exported are tested for conformity with foreign technical regulations before they are shipped to foreign markets. The highest percentage (51 percent) of products tested for conformity assessment are those shipped to the EU. On the other hand, only 3 percent of the firms carry out conformity assessment for products shipped to Australia. If we look at individual countries, Bulgarian firms are on top of the list where 72 percent of the firms are tested for conformity assessment before they are shipped to the EU, followed by Iran (68 percent). There are several countries that do not carry out conformity assessment at all for their products shipped to Australia, Canada, Japan, and the US. Among all the regions, Eastern Europe has the highest level (65 percent) of conformity assessment test carried out for their products shipped to the EU. For shipment to the US, Latin America and Caribbean perform the maximum conformity assessment test (47 percent). It is interesting to note that countries like Honduras and Mozambique that perform a high level of conformity assessment test for the EU and the US (for Honduras only) do not carry out any testing for their shipments to some other countries. Seventy five percent of firms in Honduras do testing for shipment to the US and 50 percent for EU shipment, whereas for Australia there is no testing done. Similarly in Mozambique, 60 percent firms carry out conformity assessment for products shipped to the EU, however no other conformity assessment is done for any other destination market. Table 3.12 shows whether the testing is done within the firm, by a private testing facility, or by an agency of the government. Overall, 36 percent of the testing is done within the firm, 33 percent by a private testing facility, and 22 percent by an agency of the government. In Eastern Europe, Latin America and Caribbean, the Middle East, and Sub-Saharan Africa, testing within the firm reaches the maximum percentage: 56 percent being for Latin America and Caribbean and 48 percent being for Europe. However, for South Asia, a private testing facility does the testing for 40 percent of the firms, which is the highest in the region. The method of testing varies between firms from different countries, even if they belong to the same region. In Sub-Saharan Africa 80 percent of firms carry out testing within their own firms whereas the same testing procedure is carried out by only 20 percent of firms in Kenya. Similarly, in the same region 70 percent of firms in Mozambique get their testing done through a government agency as compared to only 13 percent in South Africa. Table 3.13 shows the comparison of cost of product testing (as a percentage of total production cost) within the firm and outside the firm, i.e., by a private testing facility or by a government agency. The cost of product testing within the firm is higher than outside the firm for all the regions. Overall, the cost within the firm is 6.2 percent as compared to 3.1 percent for outside the firm. Among all the regions, in Eastern Europe the cost within the firm is the highest, i.e. 8.3 percent. When we look at the countries, in Sub-Saharan Africa region, Uganda and Senegal have costs for testing done within the firms as 19 percent and 10 percent respectively. However, in the same region Kenya has 0.3 percent.
27
Table 3.14 presents the effort of duplication of testing procedures to meet foreign requirements once domestic requirements have been met. The table shows that 44 percent of the firms have to carry out significant duplication as opposed to 7 percent that do not have to perform any duplication to meet foreign requirements. A maximum effort in duplication is observed in South Asia where 50 percent of firms carry out significant duplication, 36 percent complete duplication, and 7 percent only minor duplication. In Senegal 63 percent of the firms carry out complete duplication to meet foreign requirements and 70 percent in Mozambique have to perform significant duplication. Overall, the firms have to carry out some duplication as opposed to no duplication. However, in Iran and Pakistan a much higher percentage of firms do not have to perform duplication. In Iran the percentage for no duplication is 39 as opposed to 7 percent for Jordan belonging to the same region. For Pakistan the percentage is 30 as compared to 1 percent for India in the same region.
28
Table 3.1 Impediments to Business Operations
Eas
t Eur
ope
Lat.A
mer
.&C
arib
bean
Mid
dle
Eas
t
Sou
th A
sia
Sub
-Sah
.Afr
ica
factor resp_agg Bul
garia
Cze
ch R
epub
lic
Pol
and
Arg
entin
a
Chi
le
Hon
dura
s
Pan
ama
Iran
Jord
an
Pak
ista
n
Indi
a
Ken
ya
Nig
eria
Sou
th A
fric
a
Uga
nda
Moz
ambi
que
Sen
egal
Low demand Not Important 8 15 7 10 6 20 0 7 9 14 33 24 10 9 10 15 2 25 10 0 8 14 12
Important 77 80 83 80 80 67 42 62 67 75 37 55 43 34 35 15 42 65 55 60 54 51 54
NA 15 5 10 10 14 13 58 31 24 11 30 21 47 57 55 70 56 10 35 40 38 35 34
100 100 100 100 100 100 100 100 100 100 100 100 100 100 100 100 100 100 100 100 100 100 100
Taxes on labor Not Important 18 20 10 16 6 17 8 0 8 7 40 24 17 11 12 10 18 38 35 20 23 27 17
Important 72 76 80 76 80 70 8 55 62 75 27 50 37 25 26 25 26 52 35 0 38 36 45NA 10 5 10 8 14 13 83 45 30 18 33 26 47 64 62 65 56 10 30 80 38 36 38
100 100 100 100 100 100 100 100 100 100 100 100 100 100 100 100 100 100 100 100 100 100 100
Not Important 33 12 10 18 23 23 8 0 15 7 40 24 17 16 16 10 10 25 20 20 15 18 18Important 54 85 80 74 63 60 17 59 56 82 27 53 37 27 29 25 34 68 55 30 46 49 48NA 13 2 10 8 14 17 75 41 29 11 33 22 47 57 55 65 56 7 25 50 38 33 34
100 100 100 100 100 100 100 100 100 100 100 100 100 100 100 100 100 100 100 100 100 100 100
Not Important 13 15 10 12 3 20 17 7 10 7 13 10 10 10 10 0 8 34 40 10 15 21 14Important 72 78 78 76 83 67 17 45 60 71 53 62 43 28 30 35 34 58 35 20 46 43 49
NA 15 7 12 12 14 13 67 48 29 21 33 28 47 62 60 65 58 8 25 70 38 35 37
100 100 100 100 100 100 100 100 100 100 100 100 100 100 100 100 100 100 100 100 100 100 100
Not Important 15 22 17 18 3 17 0 3 7 7 23 16 17 9 10 5 8 34 15 0 8 18 13
Important 72 73 68 71 83 70 42 52 66 82 47 64 37 35 35 30 36 58 60 40 54 48 52
NA 13 5 15 11 14 13 58 45 27 11 30 21 47 57 55 65 56 8 25 60 38 34 35
100 100 100 100 100 100 100 100 100 100 100 100 100 100 100 100 100 100 100 100 100 100 100
Not Important 26 24 15 21 40 23 8 10 24 25 30 28 23 13 14 0 8 35 30 0 8 20 19Important 56 66 73 65 46 63 0 34 42 64 40 52 30 31 31 35 34 58 40 60 54 47 45NA 18 10 12 13 14 13 92 55 34 11 30 21 47 57 55 65 58 7 30 40 38 34 36
100 100 100 100 100 100 100 100 100 100 100 100 100 100 100 100 100 100 100 100 100 100 100
Supply of skilled labor Total
Access to credit
Supply of skilled labor
Distribution problems Total
Taxes on capital
Taxes on capital Total
Access to credit Total
Distribution problems
Su
b-S
ah.A
fric
a T
ota
l
Gra
nd
To
tal
Low demand Total
Taxes on labor Total
Eas
t E
uro
pe
To
tal
Lat
.Am
er.&
Car
ibb
ean
To
tal
Mid
dle
Eas
t T
ota
l
So
uth
Asi
a T
ota
l
29
Table 3.2a Reasons for Not Exporting (Percentage Share in the Total Non-Exporting Firms by Export Destination)
Factor Reponse Australia Canada EU Japan USA
Not Important 21 23 19 24 21
Important 79 77 81 76 79
100 100 100 100 100
Not Important 32 34 30 32 29
Important 68 66 70 68 71
100 100 100 100 100
Not Important 34 34 27 33 29
Important 66 66 73 67 71
100 100 100 100 100
Not Important 35 36 33 37 30
Important 65 64 67 63 70
100 100 100 100 100
Not Important 26 26 19 26 20
Important 74 74 81 74 80
100 100 100 100 100
Not Important 30 31 26 30 28
Important 70 69 74 70 72
100 100 100 100 100
Not Important 25 23 17 23 21
Important 75 77 83 77 79
100 100 100 100 100
Not Important 28 27 18 27 24
Important 72 73 82 73 76
100 100 100 100 100
Costs of transporting goods TotalTariffs or quotas
Low demand Total
Costs of designning TotalTesting/certification costs
Testing/certification costs Total
Lack of export promotion info. Total
Low demand
Costs of designning
Costs of transporting goods
Tariffs or quotas TotalMarketing & other distribution costs
Marketing & other distribution costs TotalLack of info. fr. home country's export promotion office
Inability to meet shipping schedule
Inability to meet shipping schedule Total
30
Table 3.2b Reasons for Not Exporting (Percentage Share in the Non-Exporting Firms by Country)
Eas
t Eur
ope
Lat.A
mer
.&C
arib
bean
Mid
dle
Eas
t
Sou
th A
sia
Sub
-Sah
.Afr
ica
Factor Reponse Bul
garia
Cze
ch R
epub
lic
Pol
and
Arg
entin
a
Chi
le
Hon
dura
s
Pan
ama
Iran
Jord
an
Pak
ista
n
Indi
a
Ken
ya
Nig
eria
Sou
th A
fric
a
Uga
nda
Sen
egal
Low demand Not Important 8 6 6 7 17 28 40 8 24 8 35 22 7 24 21 23 0 39 37 40 34 22Important 92 94 94 93 83 72 60 92 76 92 65 78 93 76 79 77 100 61 63 60 66 78
100 100 100 100 100 100 100 100 100 100 100 100 100 100 100 100 100 100 100 100 100 100Costs of designning Not Important 9 27 3 10 22 46 43 11 33 9 52 31 16 39 35 38 18 50 26 80 42 32
Important 91 73 97 90 78 54 57 89 67 91 48 69 84 61 65 63 82 50 74 20 58 68100 100 100 100 100 100 100 100 100 100 100 100 100 100 100 100 100 100 100 100 100 100
Not Important 9 13 7 9 8 43 56 10 27 2 67 36 0 44 36 51 0 54 13 0 41 32Important 91 87 93 91 92 57 44 90 73 98 33 64 100 56 64 49 100 46 87 100 59 68
100 100 100 100 100 100 100 100 100 100 100 100 100 100 100 100 100 100 100 100 100 100
Not Important 4 38 7 13 15 35 62 0 28 16 74 45 20 41 37 41 0 59 0 0 40 34Important 96 63 93 87 85 65 38 100 72 84 26 55 80 59 63 59 100 41 100 100 60 66
100 100 100 100 100 100 100 100 100 100 100 100 100 100 100 100 100 100 100 100 100 100
Not Important 7 13 0 5 6 18 32 0 14 17 28 23 1 40 34 18 0 42 5 0 27 24Important 93 88 100 95 94 82 68 100 86 83 72 77 99 60 66 82 100 58 95 100 73 76
100 100 100 100 100 100 100 100 100 100 100 100 100 100 100 100 100 100 100 100 100 100
Not Important 22 13 0 9 0 31 30 9 17 23 61 44 20 37 34 19 0 43 13 100 31 29Important 78 87 100 91 100 69 70 91 83 77 39 56 80 63 66 81 100 57 87 0 69 71
100 100 100 100 100 100 100 100 100 100 100 100 100 100 100 100 100 100 100 100 100 100
Not Important 0 13 0 3 10 33 16 0 19 7 55 32 20 26 25 18 0 35 5 100 25 22Important 100 88 100 97 90 67 84 100 81 93 45 68 80 74 75 82 100 65 95 0 75 78
100 100 100 100 100 100 100 100 100 100 100 100 100 100 100 100 100 100 100 100 100 100
Not Important 24 27 6 16 24 33 33 0 27 14 19 16 32 32 32 18 0 38 8 0 26 26Important 76 73 94 84 76 67 67 100 73 86 81 84 68 68 68 82 100 62 92 100 74 74
100 100 100 100 100 100 100 100 100 100 100 100 100 100 100 100 100 100 100 100 100 100
Costs of transport TotalTariffs or quotas
Tariffs or quotas Total
Testing/certification costs
Testing/certification costs TotalInability to meet shipping schedule
Inability to meet schedule Total
Marketing & other distribution costs
Marketing & other distribution costs Lack of info. fr. home country's export promotion office
Lack of export promotion info. TotalG
ran
d T
ota
l
Su
b-S
ah.A
fric
a T
ota
l
Costs of transporting goods
Eas
t E
uro
pe
To
tal
Lat
.Am
er.&
Car
ibb
ean
To
tal
Mid
dle
Eas
t T
ota
l
So
uth
Asi
a T
ota
l
Low demand Total
Costs of designning Total
31
Table 3.3 Importance of Factors to Expand Export (Percentage)
Eas
t Eur
ope
Lat.A
mer
.&C
arib
bean
Mid
dle
Eas
t
Sou
th A
sia
Sub
-Sah
.Afr
ica
factor resp_agg Bul
garia
Cze
ch R
epub
lic
Pol
and
Arg
entin
a
Chi
le
Hon
dura
s
Pan
ama
Iran
Jord
an
Pak
ista
n
Indi
a
Ken
ya
Nig
eria
Sou
th A
fric
a
Uga
nda
Moz
ambi
que
Sen
egal
Not Important 18 0 10 9 11 7 25 3 9 0 20 10 0 12 10 5 4 30 25 10 0 16 11
Important 67 85 85 79 74 90 58 72 76 96 57 76 83 83 83 80 70 65 50 90 54 67 77
NA 15 15 5 12 14 3 17 24 14 4 23 14 17 5 7 15 26 6 25 0 46 17 12
100 100 100 100 100 100 100 100 100 100 100 100 100 100 100 100 100 100 100 100 100 100 100
Not Important 15 17 12 15 9 10 17 0 8 21 40 31 27 19 20 15 10 42 50 30 31 30 21
Important 69 73 83 75 77 87 17 55 67 64 10 36 53 55 55 70 62 49 25 20 31 49 57
NA 15 10 5 10 14 3 67 45 25 14 50 33 20 25 24 15 28 8 25 50 38 21 22
100 100 100 100 100 100 100 100 100 100 100 100 100 100 100 100 100 100 100 100 100 100 100
Not Important 28 5 15 16 23 10 17 3 13 11 47 29 17 35 32 20 8 31 20 20 15 21 23
Important 56 93 78 76 63 87 25 45 60 86 20 52 63 61 61 55 66 63 60 60 46 61 63
NA 15 2 7 8 14 3 58 52 26 4 33 19 20 5 7 25 26 6 20 20 38 18 14
100 100 100 100 100 100 100 100 100 100 100 100 100 100 100 100 100 100 100 100 100 100 100
Not Important 15 10 24 17 9 13 25 3 10 21 40 31 10 16 15 10 8 38 30 40 23 25 19
Important 67 80 68 72 77 87 25 52 67 61 20 40 73 60 62 75 62 55 50 20 38 55 61
NA 18 10 7 12 14 0 50 45 23 18 40 29 17 24 23 15 30 7 20 40 38 20 21
100 100 100 100 100 100 100 100 100 100 100 100 100 100 100 100 100 100 100 100 100 100 100
Not Important 10 17 24 17 3 7 0 3 4 7 27 17 17 17 17 15 4 35 5 10 8 18 15
Important 74 78 66 73 83 93 75 59 78 89 40 64 67 78 76 70 68 59 70 60 54 64 72
NA 15 5 10 10 14 0 25 38 18 4 33 19 17 5 6 15 28 6 25 30 38 18 13
100 100 100 100 100 100 100 100 100 100 100 100 100 100 100 100 100 100 100 100 100 100 100
Not Important 15 20 15 17 11 10 0 0 7 11 13 12 17 30 28 20 2 17 10 20 23 13 17
Important 72 71 78 74 74 90 33 59 70 86 63 74 63 62 62 50 48 79 65 50 31 61 66
NA 13 10 7 10 14 0 67 41 24 4 23 14 20 8 10 30 50 4 25 30 46 26 17
100 100 100 100 100 100 100 100 100 100 100 100 100 100 100 100 100 100 100 100 100 100 100
Not Important 15 37 20 24 9 13 33 0 10 0 33 17 10 17 16 20 2 8 15 0 23 9 15
Important 69 51 68 63 77 87 42 62 72 96 43 69 73 78 77 55 72 86 65 80 38 73 72
NA 15 12 12 13 14 0 25 38 18 4 23 14 17 5 6 25 26 6 20 20 38 18 13
100 100 100 100 100 100 100 100 100 100 100 100 100 100 100 100 100 100 100 100 100 100 100
Not Important 8 0 7 5 23 10 17 10 15 0 60 31 0 4 4 5 4 13 5 10 8 8 9
Important 77 98 88 88 60 87 25 62 64 93 13 52 83 92 90 75 70 85 75 90 54 77 79
NA 15 2 5 7 17 3 58 28 21 7 27 17 17 4 6 20 26 3 20 0 38 15 12
100 100 100 100 100 100 100 100 100 100 100 100 100 100 100 100 100 100 100 100 100 100 100
1. Low demand
2. taxes on labor
3. supply of skilled labor
4. taxes on capital
5. access to credit
7. port charges and delays Total
8. product quality Total
2. taxes on labor Total
8. product quality
5. access to credit Total
6. import tariffs and charges Total
6. import tariffs and charges
7. port charges and delays
Su
b-S
ah.A
fric
a T
ota
l
Gra
nd
To
tal
1. Low demand Total
Eas
t E
uro
pe
To
tal
Lat
.Am
er.&
Car
ibb
ean
To
tal
Mid
dle
Eas
t T
ota
l
So
uth
Asi
a T
ota
l
3. supply of skilled labor Total
4. taxes on capital Total
32
Not Important 13 20 12 15 23 23 17 0 16 4 27 16 13 12 12 15 12 15 15 10 0 13 14
Important 69 80 80 77 63 73 42 59 62 89 50 69 70 83 81 70 58 82 65 50 54 68 73
NA 18 0 7 8 14 3 42 41 22 7 23 16 17 5 6 15 30 3 20 40 46 18 13
100 100 100 100 100 100 100 100 100 100 100 100 100 100 100 100 100 100 100 100 100 100 100
Not Important 18 29 15 21 20 20 17 0 14 32 27 29 7 26 24 10 4 23 25 20 0 15 20
Important 51 63 78 64 66 80 33 69 67 61 50 55 77 68 69 75 66 70 50 30 46 64 65
NA 31 7 7 15 14 0 50 31 19 7 23 16 17 6 7 15 30 7 25 50 54 22 15
100 100 100 100 100 100 100 100 100 100 100 100 100 100 100 100 100 100 100 100 100 100 100
Not Important 15 10 7 11 3 10 8 7 7 4 27 16 13 24 22 10 2 4 15 20 0 6 13
Important 72 85 85 81 83 90 50 69 77 93 47 69 70 72 71 75 72 93 65 60 62 78 76
NA 13 5 7 8 14 0 42 24 16 4 27 16 17 5 6 15 26 3 20 20 38 16 11
100 100 100 100 100 100 100 100 100 100 100 100 100 100 100 100 100 100 100 100 100 100 100
10. tariffs or quotas in export markets
11. freight charges
11. freight charges Total
9. foreign marketing costs
9. foreign marketing costs Total
10. tariffs or quotas in export markets Total
33
Table 3.4 Existence of Technical Regulations to Sell Products
Table 3.5 Importance of Technical Regulations to Expand Sales
Eas
t Eur
ope
Lat.A
mer
.&C
arib
bean
Mid
dle
Eas
t
Sou
th A
sia
Sub
-Sah
.Afr
ica
Market response Bul
garia
Cze
ch R
epub
lic
Pol
and
Arg
entin
a
Chi
le
Hon
dura
s
Pan
ama
Iran
Jord
an
Pak
ista
n
Indi
a
Ken
ya
Nig
eria
Sou
th A
fric
a
Uga
nda
Moz
ambi
que
Sen
egal
Home Market Yes 85 93 73 83 57 60 33 66 58 86 70 78 70 18 25 15 44 45 35 60 38 41 49
No 5 7 15 9 29 40 33 17 29 4 7 5 13 77 69 65 8 52 45 0 23 36 38
NA 10 0 12 7 14 0 33 17 13 11 23 17 17 4 6 20 48 3 20 40 38 23 13
100 100 100 100 100 100 100 100 100 100 100 100 100 100 100 100 100 100 100 100 100 100 100
Export Market Yes 82 93 76 83 66 90 67 79 76 89 77 83 77 53 56 50 72 70 70 100 62 70 70
No 5 7 20 11 20 10 33 3 14 4 0 2 7 43 38 35 2 27 10 0 0 16 21
NA 13 0 5 6 14 0 0 17 9 7 23 16 17 4 6 15 26 3 20 0 38 15 10
100 100 100 100 100 100 100 100 100 100 100 100 100 100 100 100 100 100 100 100 100 100 100
Mid
dle
Eas
t T
ota
l
So
uth
Asi
a T
ota
l
Home Market Total
Export Market Total
Eas
t E
uro
pe
To
tal
Lat
.Am
er.&
Car
ibb
ean
To
tal
Su
b-S
ah.A
fric
a T
ota
l
Gra
nd
To
tal
Eas
t Eur
ope
Lat.A
mer
.&C
arib
bean
Mid
dle
Eas
t
Sou
th A
sia
Sub
-Sah
.Afr
ica
Market Response Bul
garia
Cze
ch R
epub
lic
Pol
and
Arg
entin
a
Chi
le
Hon
dura
s
Pan
ama
Iran
Jord
an
Pak
ista
n
Indi
a
Ken
ya
Nig
eria
Sou
th A
fric
a
Uga
nda
Moz
ambi
que
Sen
egal
Domestic Sales Not Important 10 12 15 12 20 17 8 7 14 14 50 33 10 45 40 10 6 34 25 10 15 20 25
Important 77 85 61 74 66 63 33 69 62 71 17 43 40 19 22 15 40 55 45 50 31 43 45
NA 13 2 24 13 14 20 58 24 24 14 33 24 50 36 38 75 54 11 30 40 54 36 30100 100 100 100 100 100 100 100 100 100 100 100 100 100 100 100 100 100 100 100 100 100 100
Exports Not Important 3 12 17 11 17 7 8 3 9 7 53 31 10 39 35 20 4 21 5 0 8 13 20
Important 87 85 66 79 69 80 83 76 75 86 17 50 67 56 57 50 70 72 75 100 46 69 66
NA 10 2 17 10 14 13 8 21 15 7 30 19 23 5 8 30 26 7 20 0 46 18 13100 100 100 100 100 100 100 100 100 100 100 100 100 100 100 100 100 100 100 100 100 100 100
Su
b-S
ah.A
fric
a T
ota
l
Gra
nd
To
tal
Domestic Sales Total
Exports Total
Eas
t E
uro
pe
To
tal
Lat
.Am
er.&
Car
ibb
ean
To
tal
Mid
dle
Eas
t T
ota
l
So
uth
Asi
a T
ota
l
34
Table 3.6 Relative Cost to Comply with Foreign Regulations Compared to Domestic Regulations
Eas
t Eur
ope
Lat.A
mer
.&C
arib
bean
Mid
dle
Eas
t
Sou
th A
sia
Sub
-Sah
.Afr
ica
RegulationsForeign Regulations are B
ulga
ria
Cze
ch R
epub
lic
Pol
and
Arg
entin
a
Chi
le
Hon
dura
s
Pan
ama
Iran
Jord
an
Pak
ista
n
Indi
a
Ken
ya
Nig
eria
Sou
th A
fric
a
Uga
nda
Moz
ambi
que
Sen
egal
performance More Expensive 31 20 5 18 3 23 0 10 10 71 7 38 17 22 21 25 24 23 25 30 23 24 21About the Same 41 56 54 50 49 47 25 28 40 4 40 22 27 18 19 10 24 27 30 50 23 26 30Less Expensive 10 15 17 14 14 13 17 38 21 11 27 19 30 13 15 15 16 18 15 20 8 16 17NA 18 10 24 17 34 17 58 24 29 14 27 21 27 47 44 50 36 32 30 0 46 34 33
100 100 100 100 100 100 100 100 100 100 100 100 100 100 100 100 100 100 100 100 100 100 100
product quality More Expensive 26 17 5 16 9 30 8 7 14 57 3 29 13 16 15 15 20 18 20 10 23 18 17About the Same 44 49 56 50 34 37 25 31 33 18 67 43 27 21 22 10 32 34 15 30 15 27 32Less Expensive 13 24 15 17 23 20 25 34 25 7 7 7 33 16 18 25 12 15 35 60 15 20 19NA 18 10 24 17 34 13 42 28 27 18 23 21 27 47 44 50 36 32 30 0 46 34 32
100 100 100 100 100 100 100 100 100 100 100 100 100 100 100 100 100 100 100 100 100 100 100
certification More Expensive 44 27 5 25 11 30 8 3 14 61 7 33 27 21 22 15 24 23 25 10 31 22 22About the Same 28 37 46 37 26 33 25 21 26 11 63 38 23 17 18 15 26 25 30 40 23 26 26Less Expensive 13 27 24 21 26 23 25 41 29 14 7 10 23 15 16 20 14 18 15 50 0 17 19NA 15 10 24 17 37 13 42 34 30 14 23 19 27 47 44 50 36 34 30 0 46 35 33
100 100 100 100 100 100 100 100 100 100 100 100 100 100 100 100 100 100 100 100 100 100 100
consumer safety More Expensive 26 12 5 14 17 23 8 10 16 57 7 31 23 20 20 25 20 21 15 10 15 20 19About the Same 56 61 56 58 31 43 17 34 34 7 60 34 30 20 22 10 24 35 30 40 38 29 33Less Expensive 3 17 15 12 17 20 17 21 19 7 10 9 20 13 14 15 20 11 25 50 0 17 14NA 15 10 24 17 34 13 58 34 31 29 23 26 27 47 44 50 36 32 30 0 46 34 33
100 100 100 100 100 100 100 100 100 100 100 100 100 100 100 100 100 100 100 100 100 100 100
labelling More Expensive 44 15 5 21 20 27 8 10 18 57 3 29 40 21 24 5 34 25 20 20 15 24 23About the Same 26 56 39 40 29 37 17 21 27 11 63 38 27 21 22 15 22 30 45 50 38 29 29Less Expensive 15 20 32 22 17 20 17 41 25 14 10 12 7 10 10 30 8 13 5 30 0 13 15NA 15 10 24 17 34 17 58 28 30 18 23 21 27 47 44 50 36 32 30 0 46 34 33
100 100 100 100 100 100 100 100 100 100 100 100 100 100 100 100 100 100 100 100 100 100 100
health/environment More Expensive 28 7 5 13 11 20 17 14 15 68 3 34 23 23 23 20 28 23 15 20 15 22 21About the Same 51 63 51 55 40 47 33 21 36 7 63 36 20 19 19 5 16 30 40 40 38 26 31Less Expensive 5 20 20 15 14 17 8 38 21 7 10 9 30 12 14 25 18 13 15 40 0 16 15NA 15 10 24 17 34 17 42 28 28 18 23 21 27 47 44 50 38 35 30 0 46 36 33
100 100 100 100 100 100 100 100 100 100 100 100 100 100 100 100 100 100 100 100 100 100 100
testing and certification Total
consumer safety Total
labelling Total
health/environment Total
Su
b-S
ah.A
fric
a T
ota
l
Gra
nd
To
tal
performance Total
product quality Total
Eas
t E
uro
pe
To
tal
Lat
.Am
er.&
Car
ibb
ean
To
tal
Mid
dle
Eas
t T
ota
l
So
uth
Asi
a T
ota
l
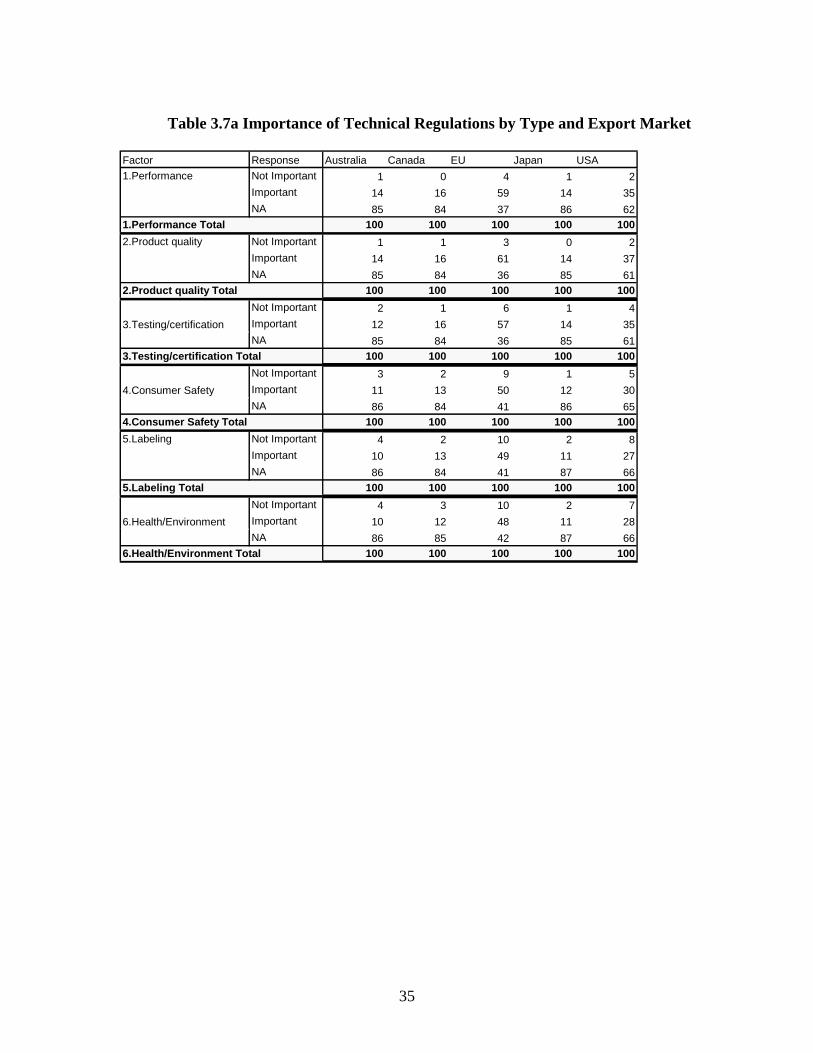
35
Table 3.7a Importance of Technical Regulations by Type and Export Market
Factor Response Australia Canada EU Japan USA
1.Performance Not Important 1 0 4 1 2
Important 14 16 59 14 35
NA 85 84 37 86 62100 100 100 100 100
2.Product quality Not Important 1 1 3 0 2
Important 14 16 61 14 37
NA 85 84 36 85 61100 100 100 100 100
Not Important 2 1 6 1 4
Important 12 16 57 14 35
NA 85 84 36 85 61100 100 100 100 100
Not Important 3 2 9 1 5
Important 11 13 50 12 30
NA 86 84 41 86 65100 100 100 100 100
5.Labeling Not Important 4 2 10 2 8
Important 10 13 49 11 27
NA 86 84 41 87 66100 100 100 100 100
Not Important 4 3 10 2 7
Important 10 12 48 11 28
NA 86 85 42 87 66100 100 100 100 1006.Health/Environment Total
4.Consumer Safety
4.Consumer Safety Total
5.Labeling Total
6.Health/Environment
1.Performance Total
2.Product quality Total
3.Testing/certification
3.Testing/certification Total
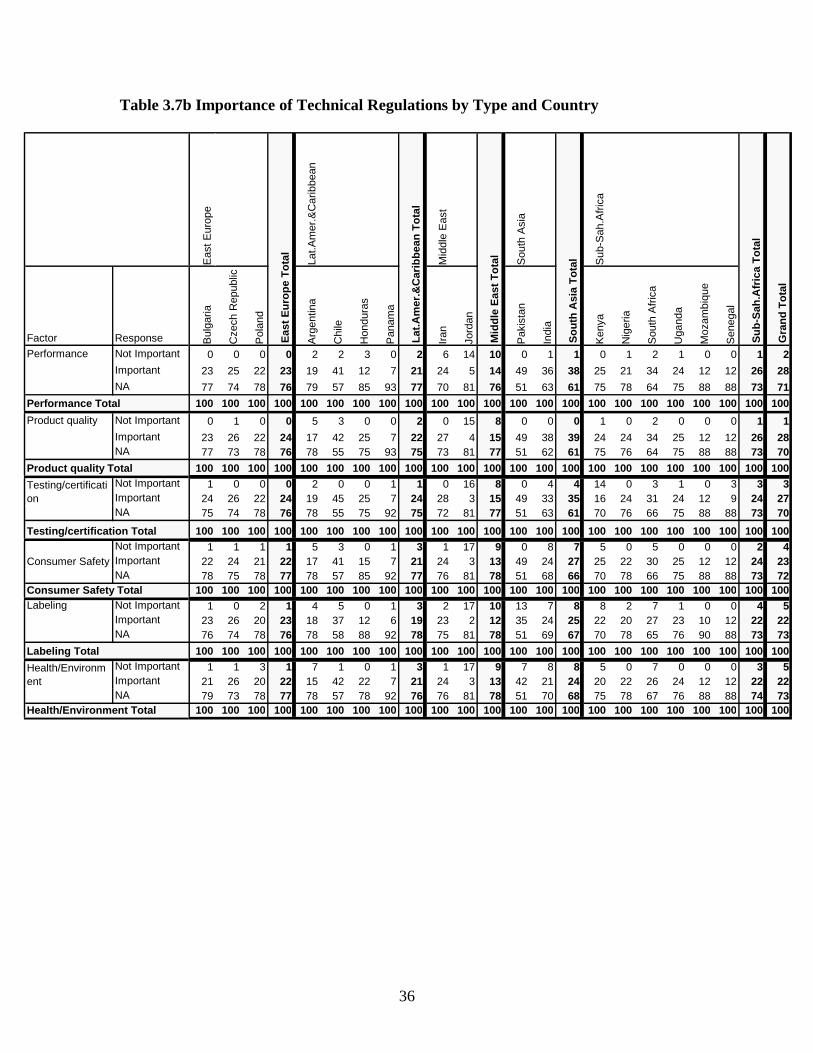
36
Table 3.7b Importance of Technical Regulations by Type and Country
Eas
t Eur
ope
Lat.A
mer
.&C
arib
bean
Mid
dle
Eas
t
Sou
th A
sia
Sub
-Sah
.Afr
ica
Factor Response Bul
garia
Cze
ch R
epub
lic
Pol
and
Arg
entin
a
Chi
le
Hon
dura
s
Pan
ama
Iran
Jord
an
Pak
ista
n
Indi
a
Ken
ya
Nig
eria
Sou
th A
fric
a
Uga
nda
Moz
ambi
que
Sen
egal
Performance Not Important 0 0 0 0 2 2 3 0 2 6 14 10 0 1 1 0 1 2 1 0 0 1 2Important 23 25 22 23 19 41 12 7 21 24 5 14 49 36 38 25 21 34 24 12 12 26 28NA 77 74 78 76 79 57 85 93 77 70 81 76 51 63 61 75 78 64 75 88 88 73 71
100 100 100 100 100 100 100 100 100 100 100 100 100 100 100 100 100 100 100 100 100 100 100
Product quality Not Important 0 1 0 0 5 3 0 0 2 0 15 8 0 0 0 1 0 2 0 0 0 1 1Important 23 26 22 24 17 42 25 7 22 27 4 15 49 38 39 24 24 34 25 12 12 26 28NA 77 73 78 76 78 55 75 93 75 73 81 77 51 62 61 75 76 64 75 88 88 73 70
100 100 100 100 100 100 100 100 100 100 100 100 100 100 100 100 100 100 100 100 100 100 100Not Important 1 0 0 0 2 0 0 1 1 0 16 8 0 4 4 14 0 3 1 0 3 3 3Important 24 26 22 24 19 45 25 7 24 28 3 15 49 33 35 16 24 31 24 12 9 24 27NA 75 74 78 76 78 55 75 92 75 72 81 77 51 63 61 70 76 66 75 88 88 73 70
100 100 100 100 100 100 100 100 100 100 100 100 100 100 100 100 100 100 100 100 100 100 100Not Important 1 1 1 1 5 3 0 1 3 1 17 9 0 8 7 5 0 5 0 0 0 2 4Important 22 24 21 22 17 41 15 7 21 24 3 13 49 24 27 25 22 30 25 12 12 24 23NA 78 75 78 77 78 57 85 92 77 76 81 78 51 68 66 70 78 66 75 88 88 73 72
100 100 100 100 100 100 100 100 100 100 100 100 100 100 100 100 100 100 100 100 100 100 100Labeling Not Important 1 0 2 1 4 5 0 1 3 2 17 10 13 7 8 8 2 7 1 0 0 4 5
Important 23 26 20 23 18 37 12 6 19 23 2 12 35 24 25 22 20 27 23 10 12 22 22NA 76 74 78 76 78 58 88 92 78 75 81 78 51 69 67 70 78 65 76 90 88 73 73
100 100 100 100 100 100 100 100 100 100 100 100 100 100 100 100 100 100 100 100 100 100 100Not Important 1 1 3 1 7 1 0 1 3 1 17 9 7 8 8 5 0 7 0 0 0 3 5Important 21 26 20 22 15 42 22 7 21 24 3 13 42 21 24 20 22 26 24 12 12 22 22NA 79 73 78 77 78 57 78 92 76 76 81 78 51 70 68 75 78 67 76 88 88 74 73
100 100 100 100 100 100 100 100 100 100 100 100 100 100 100 100 100 100 100 100 100 100 100
Health/Environment
Consumer Safety
Testing/certification Total
Consumer Safety Total
Labeling Total
Health/Environment Total
Su
b-S
ah.A
fric
a T
ota
l
Gra
nd
To
tal
Performance Total
Product quality Total
Eas
t E
uro
pe
To
tal
Lat
.Am
er.&
Car
ibb
ean
To
tal
Mid
dle
Eas
t T
ota
l
So
uth
Asi
a T
ota
l
Testing/certification
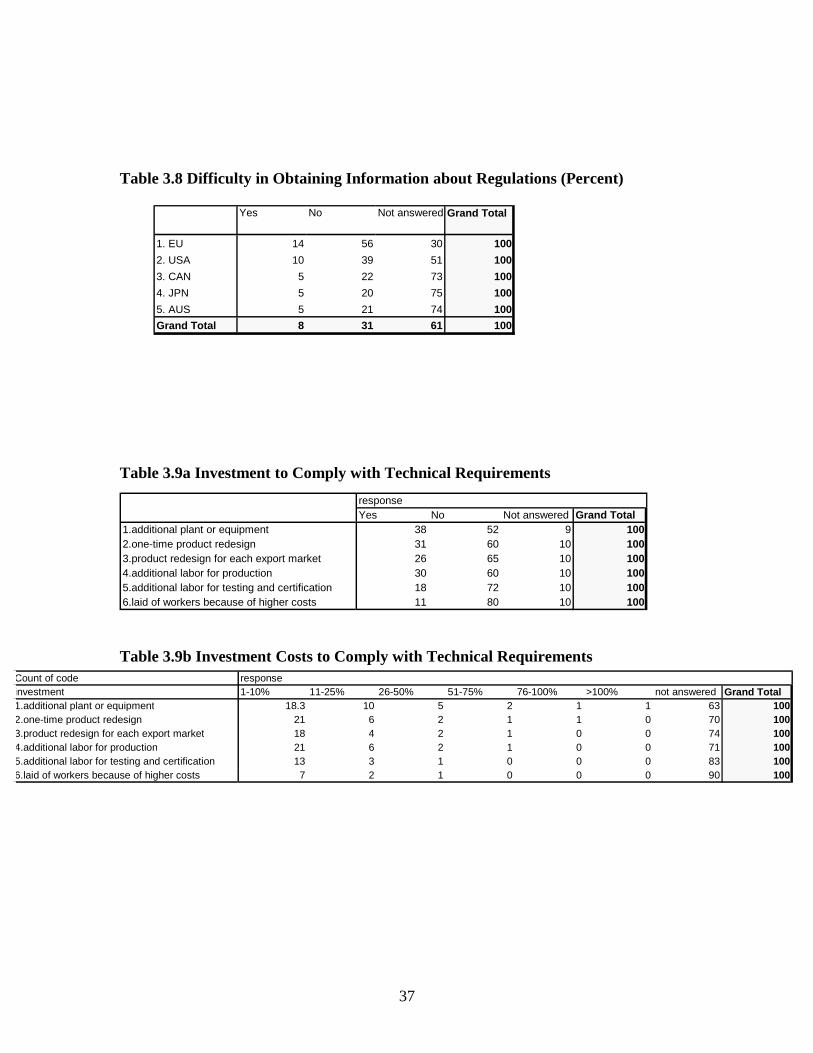
37
Table 3.8 Difficulty in Obtaining Information about Regulations (Percent)
Table 3.9a Investment to Comply with Technical Requirements
Table 3.9b Investment Costs to Comply with Technical Requirements
Yes No Not answered Grand Total
1. EU 14 56 30 100
2. USA 10 39 51 100
3. CAN 5 22 73 100
4. JPN 5 20 75 100
5. AUS 5 21 74 100
Grand Total 8 31 61 100
responseYes No Not answered Grand Total
1.additional plant or equipment 38 52 9 1002.one-time product redesign 31 60 10 1003.product redesign for each export market 26 65 10 1004.additional labor for production 30 60 10 1005.additional labor for testing and certification 18 72 10 1006.laid of workers because of higher costs 11 80 10 100
Count of code responseinvestment 1-10% 11-25% 26-50% 51-75% 76-100% >100% not answered Grand Total1.additional plant or equipment 18.3 10 5 2 1 1 63 1002.one-time product redesign 21 6 2 1 1 0 70 1003.product redesign for each export market 18 4 2 1 0 0 74 1004.additional labor for production 21 6 2 1 0 0 71 1005.additional labor for testing and certification 13 3 1 0 0 0 83 1006.laid of workers because of higher costs 7 2 1 0 0 0 90 100
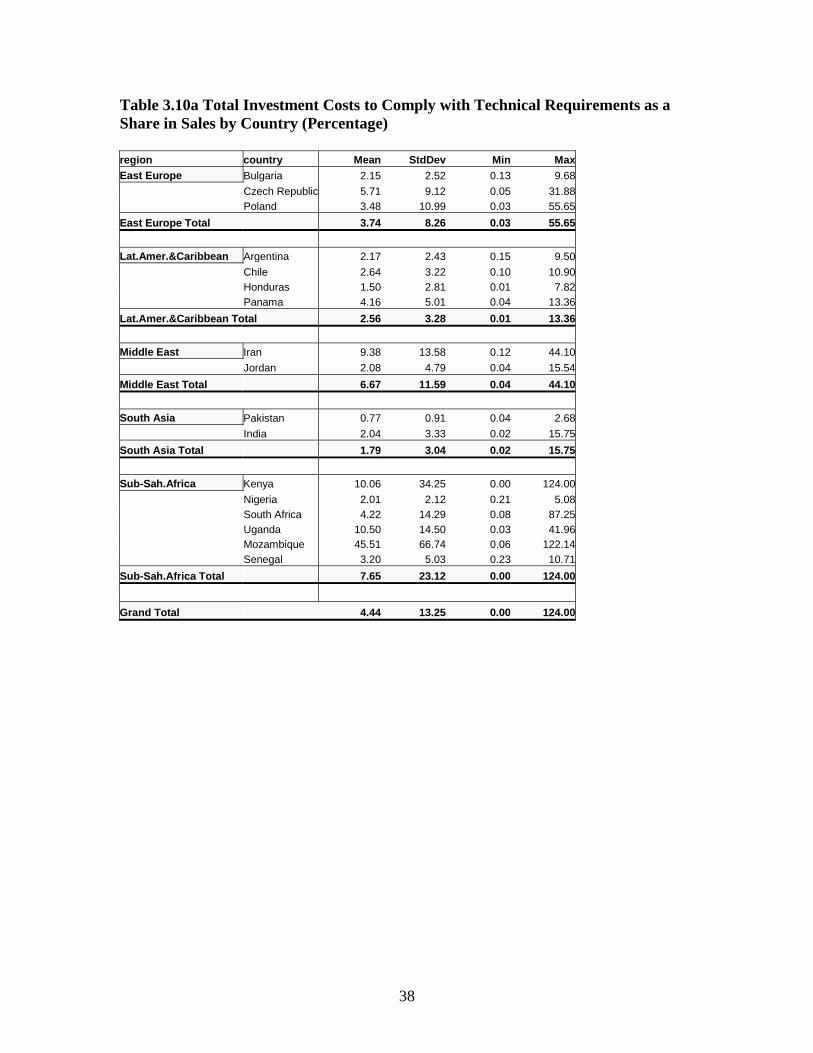
38
Table 3.10a Total Investment Costs to Comply with Technical Requirements as a Share in Sales by Country (Percentage) region country Mean StdDev Min MaxEast Europe Bulgaria 2.15 2.52 0.13 9.68
Czech Republic 5.71 9.12 0.05 31.88 Poland 3.48 10.99 0.03 55.65
East Europe Total 3.74 8.26 0.03 55.65
Lat.Amer.&Caribbean Argentina 2.17 2.43 0.15 9.50
Chile 2.64 3.22 0.10 10.90 Honduras 1.50 2.81 0.01 7.82 Panama 4.16 5.01 0.04 13.36
Lat.Amer.&Caribbean Total 2.56 3.28 0.01 13.36
Middle East Iran 9.38 13.58 0.12 44.10
Jordan 2.08 4.79 0.04 15.54
Middle East Total 6.67 11.59 0.04 44.10
South Asia Pakistan 0.77 0.91 0.04 2.68
India 2.04 3.33 0.02 15.75
South Asia Total 1.79 3.04 0.02 15.75
Sub-Sah.Africa Kenya 10.06 34.25 0.00 124.00
Nigeria 2.01 2.12 0.21 5.08 South Africa 4.22 14.29 0.08 87.25 Uganda 10.50 14.50 0.03 41.96 Mozambique 45.51 66.74 0.06 122.14 Senegal 3.20 5.03 0.23 10.71
Sub-Sah.Africa Total 7.65 23.12 0.00 124.00
Grand Total 4.44 13.25 0.00 124.00
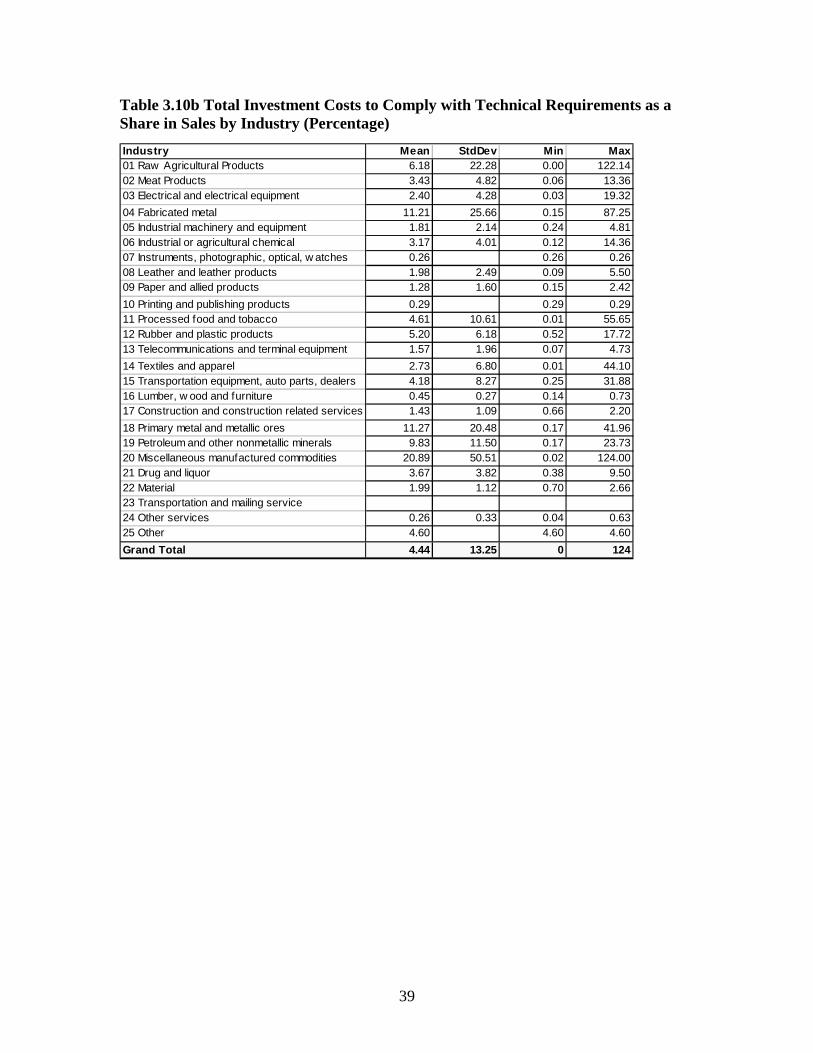
39
Table 3.10b Total Investment Costs to Comply with Technical Requirements as a Share in Sales by Industry (Percentage)
Industry Mean StdDev Min Max01 Raw Agricultural Products 6.18 22.28 0.00 122.1402 Meat Products 3.43 4.82 0.06 13.3603 Electrical and electrical equipment 2.40 4.28 0.03 19.32
04 Fabricated metal 11.21 25.66 0.15 87.2505 Industrial machinery and equipment 1.81 2.14 0.24 4.8106 Industrial or agricultural chemical 3.17 4.01 0.12 14.3607 Instruments, photographic, optical, w atches 0.26 0.26 0.2608 Leather and leather products 1.98 2.49 0.09 5.5009 Paper and allied products 1.28 1.60 0.15 2.42
10 Printing and publishing products 0.29 0.29 0.2911 Processed food and tobacco 4.61 10.61 0.01 55.6512 Rubber and plastic products 5.20 6.18 0.52 17.7213 Telecommunications and terminal equipment 1.57 1.96 0.07 4.73
14 Textiles and apparel 2.73 6.80 0.01 44.1015 Transportation equipment, auto parts, dealers 4.18 8.27 0.25 31.8816 Lumber, w ood and furniture 0.45 0.27 0.14 0.7317 Construction and construction related services 1.43 1.09 0.66 2.20
18 Primary metal and metallic ores 11.27 20.48 0.17 41.9619 Petroleum and other nonmetallic minerals 9.83 11.50 0.17 23.7320 Miscellaneous manufactured commodities 20.89 50.51 0.02 124.0021 Drug and liquor 3.67 3.82 0.38 9.5022 Material 1.99 1.12 0.70 2.6623 Transportation and mailing service24 Other services 0.26 0.33 0.04 0.6325 Other 4.60 4.60 4.60
Grand Total 4.44 13.25 0 124
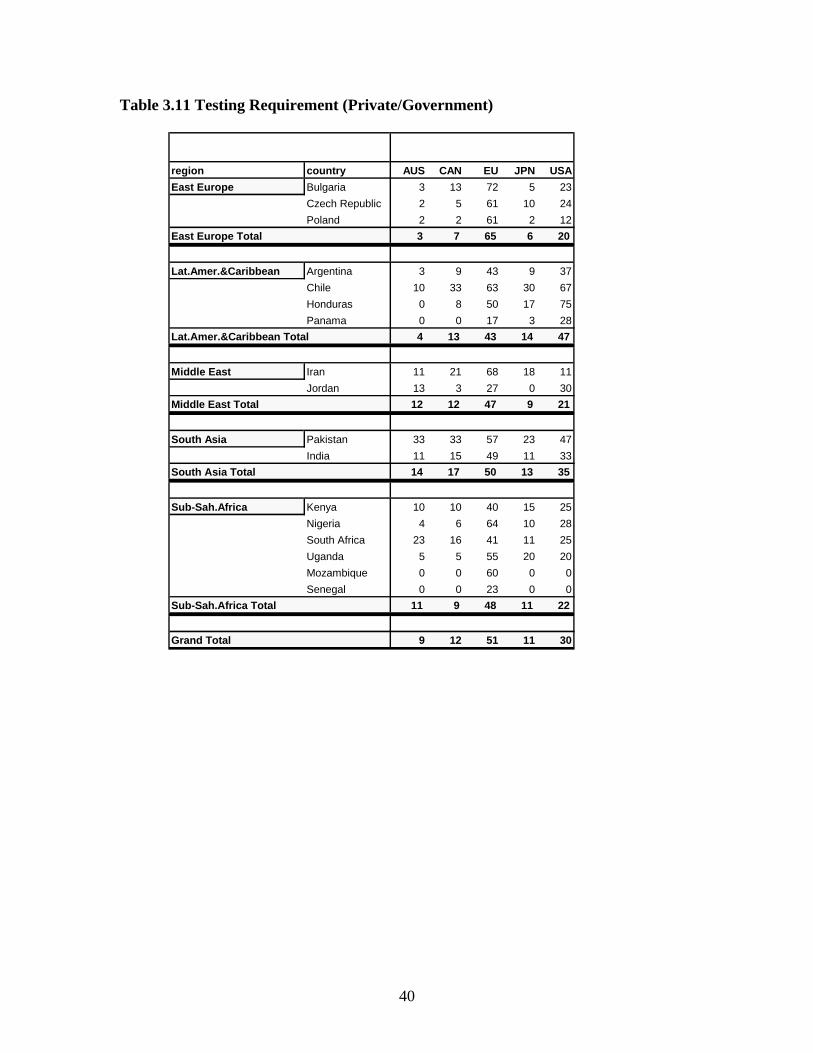
40
Table 3.11 Testing Requirement (Private/Government)
region country AUS CAN EU JPN USA
East Europe Bulgaria 3 13 72 5 23
Czech Republic 2 5 61 10 24
Poland 2 2 61 2 12
East Europe Total 3 7 65 6 20
Lat.Amer.&Caribbean Argentina 3 9 43 9 37
Chile 10 33 63 30 67
Honduras 0 8 50 17 75
Panama 0 0 17 3 28
Lat.Amer.&Caribbean Total 4 13 43 14 47
Middle East Iran 11 21 68 18 11
Jordan 13 3 27 0 30
Middle East Total 12 12 47 9 21
South Asia Pakistan 33 33 57 23 47
India 11 15 49 11 33
South Asia Total 14 17 50 13 35
Sub-Sah.Africa Kenya 10 10 40 15 25
Nigeria 4 6 64 10 28
South Africa 23 16 41 11 25
Uganda 5 5 55 20 20
Mozambique 0 0 60 0 0
Senegal 0 0 23 0 0
Sub-Sah.Africa Total 11 9 48 11 22
Grand Total 9 12 51 11 30
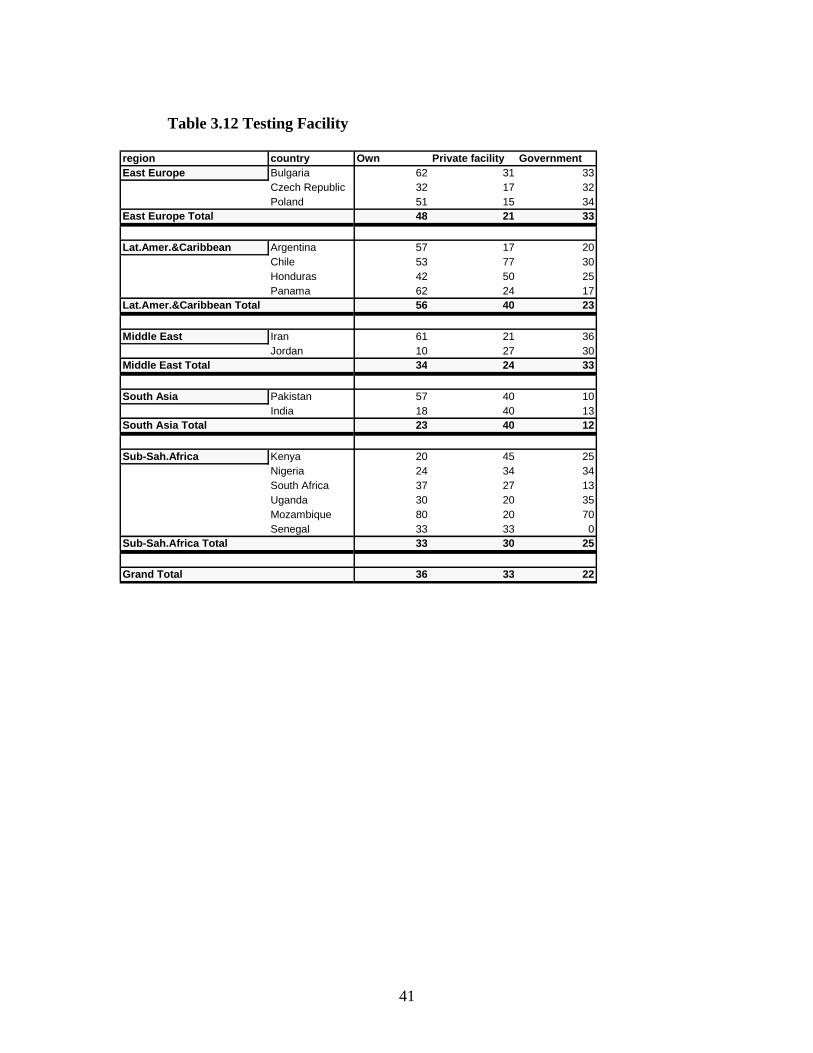
41
Table 3.12 Testing Facility region country Own Private facility GovernmentEast Europe Bulgaria 62 31 33
Czech Republic 32 17 32Poland 51 15 34
East Europe Total 48 21 33
Lat.Amer.&Caribbean Argentina 57 17 20Chile 53 77 30Honduras 42 50 25Panama 62 24 17
Lat.Amer.&Caribbean Total 56 40 23
Middle East Iran 61 21 36Jordan 10 27 30
Middle East Total 34 24 33
South Asia Pakistan 57 40 10India 18 40 13
South Asia Total 23 40 12
Sub-Sah.Africa Kenya 20 45 25Nigeria 24 34 34South Africa 37 27 13Uganda 30 20 35Mozambique 80 20 70Senegal 33 33 0
Sub-Sah.Africa Total 33 30 25
Grand Total 36 33 22
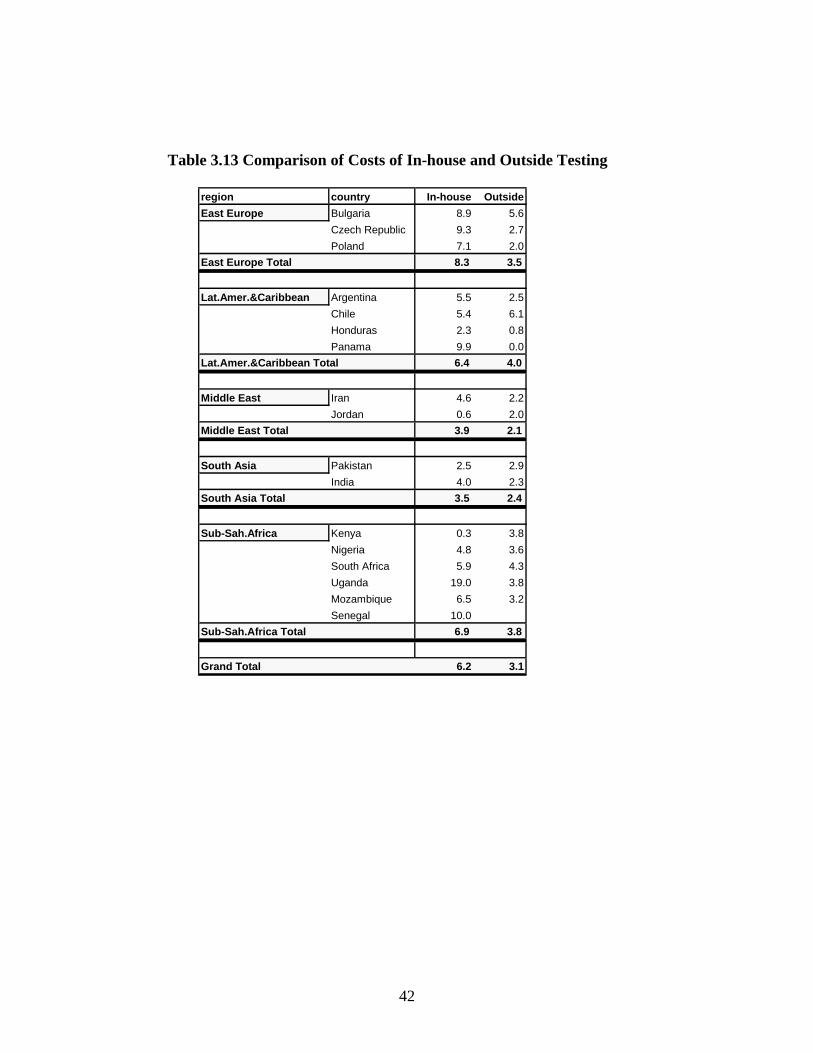
42
Table 3.13 Comparison of Costs of In-house and Outside Testing
region country In-house Outside
East Europe Bulgaria 8.9 5.6
Czech Republic 9.3 2.7
Poland 7.1 2.0
East Europe Total 8.3 3.5
Lat.Amer.&Caribbean Argentina 5.5 2.5
Chile 5.4 6.1
Honduras 2.3 0.8
Panama 9.9 0.0
Lat.Amer.&Caribbean Total 6.4 4.0
Middle East Iran 4.6 2.2
Jordan 0.6 2.0
Middle East Total 3.9 2.1
South Asia Pakistan 2.5 2.9
India 4.0 2.3
South Asia Total 3.5 2.4
Sub-Sah.Africa Kenya 0.3 3.8
Nigeria 4.8 3.6
South Africa 5.9 4.3
Uganda 19.0 3.8
Mozambique 6.5 3.2
Senegal 10.0
Sub-Sah.Africa Total 6.9 3.8
Grand Total 6.2 3.1
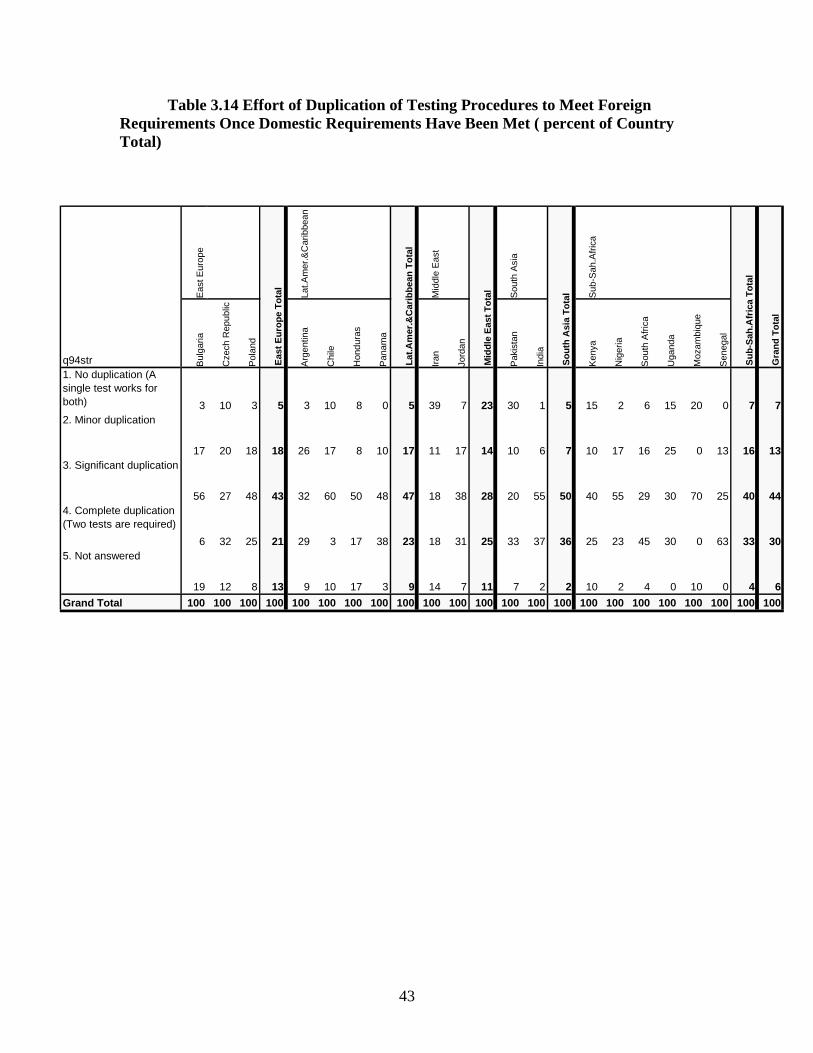
43
Table 3.14 Effort of Duplication of Testing Procedures to Meet Foreign Requirements Once Domestic Requirements Have Been Met ( percent of Country Total)
Eas
t Eur
ope
Lat.A
mer
.&C
arib
bean
Mid
dle
Eas
t
Sou
th A
sia
Sub
-Sah
.Afr
ica
q94str Bul
garia
Cze
ch R
epub
lic
Pol
and
Arg
entin
a
Chi
le
Hon
dura
s
Pan
ama
Iran
Jord
an
Pak
ista
n
Indi
a
Ken
ya
Nig
eria
Sou
th A
fric
a
Uga
nda
Moz
ambi
que
Sen
egal
1. No duplication (A single test works for both) 3 10 3 5 3 10 8 0 5 39 7 23 30 1 5 15 2 6 15 20 0 7 72. Minor duplication
17 20 18 18 26 17 8 10 17 11 17 14 10 6 7 10 17 16 25 0 13 16 133. Significant duplication
56 27 48 43 32 60 50 48 47 18 38 28 20 55 50 40 55 29 30 70 25 40 444. Complete duplication (Two tests are required)
6 32 25 21 29 3 17 38 23 18 31 25 33 37 36 25 23 45 30 0 63 33 305. Not answered
19 12 8 13 9 10 17 3 9 14 7 11 7 2 2 10 2 4 0 10 0 4 6
Grand Total 100 100 100 100 100 100 100 100 100 100 100 100 100 100 100 100 100 100 100 100 100 100 100
So
uth
Asi
a T
ota
l
Su
b-S
ah.A
fric
a T
ota
l
Gra
nd
To
tal
Eas
t E
uro
pe
To
tal
Lat
.Am
er.&
Car
ibb
ean
To
tal
Mid
dle
Eas
t T
ota
l
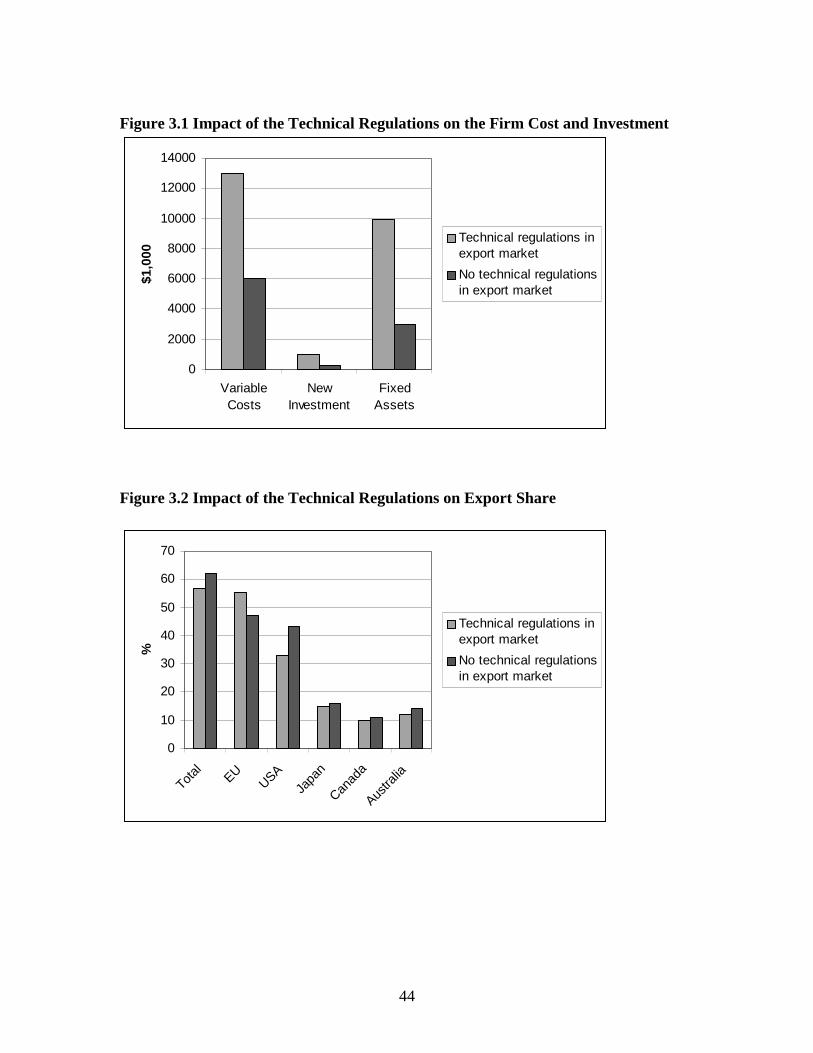
44
Figure 3.1 Impact of the Technical Regulations on the Firm Cost and Investment
0
2000
4000
6000
8000
10000
12000
14000
VariableCosts
NewInvestment
FixedAssets
$1,0
00
Technical regulations inexport market
No technical regulationsin export market
Figure 3.2 Impact of the Technical Regulations on Export Share
0
10
20
30
40
50
60
70
Total EU
USAJa
pan
Canad
a
Austra
lia
%
Technical regulations inexport market
No technical regulationsin export market
45
Section 4. International Standards
There is a considerable effort being made to harmonize national standards setting (where it exists) with international standards. Such international standards setting bodies include the International Standards Organization (ISO), International Electrotechnical Commission (IEC), Codex Alimentarius Commission (Codex), and others. The World Trade Organization’s (WTO) Technical Barriers to Trade (TBT) Agreement and Sanitary and Phytosanitary (SPS) Agreement encourage countries to use international standards where appropriate, however international standards are not mandatory. Conformance with internationally shared standards are generally considered to promote trade by increasing the reputation of the product, as found in some empirical literature (Swann, Temple and Shurmer, 1996; Blind and Jungmittag, 1999; Moenius 2000). The World Bank Technical Barriers to Trade data will enable us to investigate the firm’s perception of the benefit of complying with international standards. ISO standards are the most widely aligned international standards in the world. Our samples, except for Senegal and Uganda, participate in ISO in different manners. Fifteen countries are member bodies 2 each representing their respective national standards, Mozambique is a Correspondent member3 having not yet fully developed their national standards, and Honduras is a Subscriber member4 since it is a country with a small economy. There is no pattern among regions, but it can be observed that fewer African nations follow international standards. Many countries are making an effort to harmonize their national standards with either international, the EU, the US, or regional standards. Among those countries, ISO standards are included as part of their national standards and obtained voluntarily depending on either the industry or firm. Situation of each of the studied countries with respect to alignment with international standards along with some bilaterally imposed standards is summarized in the table in Annex II. Due to the voluntary nature of international standards, the alignment to the international standards is the choice of the individual country’s government or firm. A country or a firm is expected to align with international standards only when it finds the alignment to be welfare-improving. This section investigates the pattern of alignment with various international standards, and their effect on firms’ costs and their benefits. Table 4.1 presents the different international standards which the national governments have chosen to align with. Except for Panama and Mozambique, all the countries have a high percentage of firms aligned with ISO standards because those countries need to follow the framework which ISO with IEC and ITU provide for trading goods and
2 A member body of ISO is the national body "most representative of standardization in its country". Only one such body for each country is accepted for membership in ISO. Member bodies are entitled to participate and exercise full voting rights on any technical committee and policy committee of ISO. 3 A correspondent member is usually an organization in a country which does not yet have a fully-developed national standards activity. Correspondent members do not take an active part in the technical and policy development work, but are entitled to be kept fully informed about the work of interest to them. 4 Subscriber membership has been established for countries with very small economies. Subscriber members pay reduced membership fees that nevertheless allow them to maintain contact with international standardization.
46
services internationally. These three organizations have a strategic partnership with WTO, and ISO has the most important rules among the three agencies. Therefore, the political agreements in WTO require underpinning by technical agreements of ISO. The following four countries have a high alignment with international standards. Bulgaria has 46 percent of its firms aligned with ISO standard followed by Kenya and Uganda each with 45 percent and Nigeria 44 percent of its firms aligned with the ISO standards. Those countries follow the EU-based international standards which is the second most common. The major exporter of these four countries is the EU according to Table 2.8 of Export Destination. Since the EU is the major market for Bulgaria, Kenya, Uganda and Nigeria. The EU-base international standards has an important rule for these counters. On the other hand, Panama has only 3 percent in alignment with international standards, because there is no legal limitation in the ISO-9000 program in Panama even though they have registered to participate in it. In Panama the majority of firms are aligned with either US-based international standards or sanitary and phytosanitary-related international standards such as CODEX, OIE and IPPC. This fact is consistent with the country’s observed pattern of trade—high export shares with the US and Latin American countries. The firms in Panama are inclined harmonize their standards to their major exporters. The majority of the firms in Mozambique follow some “other” standard. Eastern Europe has the highest percentage (38 percent) of firms aligned with ISO standard. As an individual country Bulgaria has the highest percentage (46 percent) of ISO based firms. In Sub-Saharan Africa, Kenya and Uganda each have 45 percent ISO based firms. Overall, 28 percent of firms are aligned with ISO standards, the highest share coming from Eastern Europe (38 percent). Our statistical data is consistent with the fact that EU-based standards is the second common and the EU is the major exporter of Eastern Europe. Table 4.2 shows whether alignment with international standards—in terms of new equipment and facilities as a percentage of investment costs, labor costs as a percentage of production costs, and inspection costs as a percentage of production costs—results in cost savings or additional cost or neither. Even though a majority of the firms find the question is not applicable or they do not answer the question, the percentage of firms answering additional costs is more than cost savings in terms of the three above- mentioned categories. However, when the standard related factor is labor costs as a percentage of production costs, 15 percent of the firms answer “neither” which is 1 percent more than additional costs. Table 4.3 shows the importance of international standards for the success of the product in domestic and international markets. A majority of the firms leave the question unanswered. However, a far greater number of firms answering the question find international standards “important (on a scale of somewhat to –very important) as opposed to “not all important.” In Eastern Europe 29 percent of the firms find
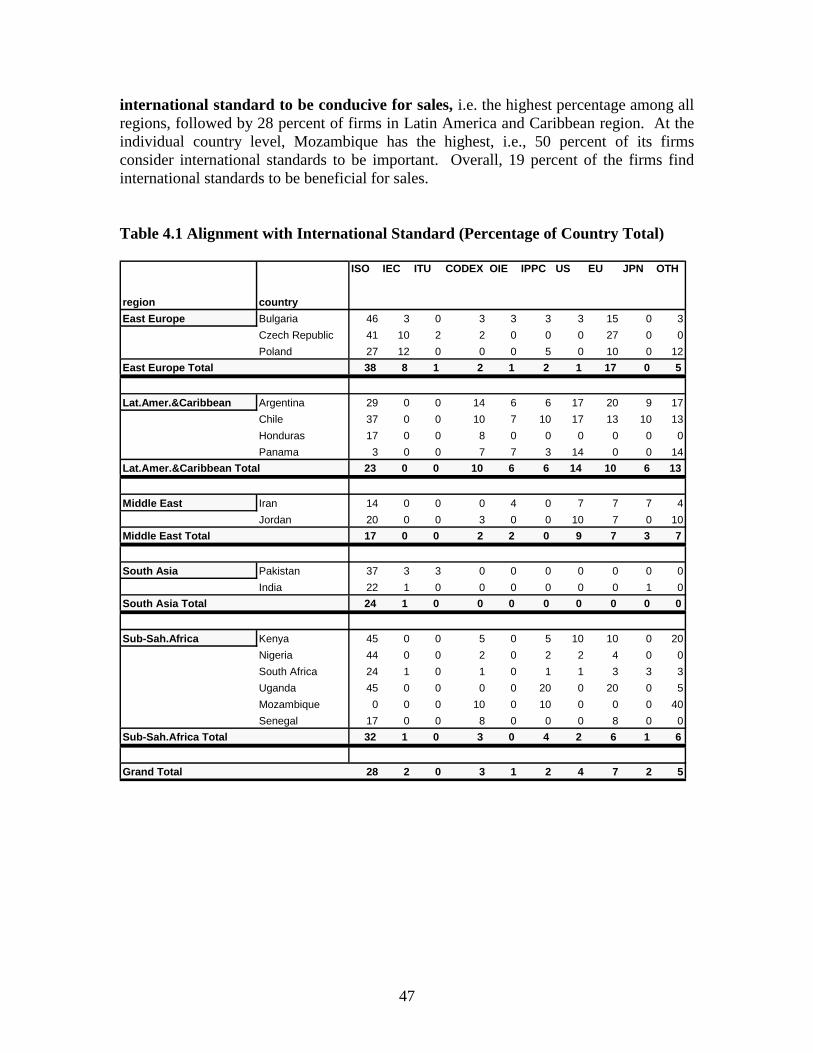
47
international standard to be conducive for sales, i.e. the highest percentage among all regions, followed by 28 percent of firms in Latin America and Caribbean region. At the individual country level, Mozambique has the highest, i.e., 50 percent of its firms consider international standards to be important. Overall, 19 percent of the firms find international standards to be beneficial for sales. Table 4.1 Alignment with International Standard (Percentage of Country Total)
region country
ISO IEC ITU CODEX OIE IPPC US EU JPN OTH
East Europe Bulgaria 46 3 0 3 3 3 3 15 0 3
Czech Republic 41 10 2 2 0 0 0 27 0 0
Poland 27 12 0 0 0 5 0 10 0 12
East Europe Total 38 8 1 2 1 2 1 17 0 5
Lat.Amer.&Caribbean Argentina 29 0 0 14 6 6 17 20 9 17
Chile 37 0 0 10 7 10 17 13 10 13
Honduras 17 0 0 8 0 0 0 0 0 0
Panama 3 0 0 7 7 3 14 0 0 14
Lat.Amer.&Caribbean Total 23 0 0 10 6 6 14 10 6 13
Middle East Iran 14 0 0 0 4 0 7 7 7 4
Jordan 20 0 0 3 0 0 10 7 0 10
Middle East Total 17 0 0 2 2 0 9 7 3 7
South Asia Pakistan 37 3 3 0 0 0 0 0 0 0
India 22 1 0 0 0 0 0 0 1 0
South Asia Total 24 1 0 0 0 0 0 0 0 0
Sub-Sah.Africa Kenya 45 0 0 5 0 5 10 10 0 20
Nigeria 44 0 0 2 0 2 2 4 0 0
South Africa 24 1 0 1 0 1 1 3 3 3
Uganda 45 0 0 0 0 20 0 20 0 5
Mozambique 0 0 0 10 0 10 0 0 0 40
Senegal 17 0 0 8 0 0 0 8 0 0
Sub-Sah.Africa Total 32 1 0 3 0 4 2 6 1 6
Grand Total 28 2 0 3 1 2 4 7 2 5
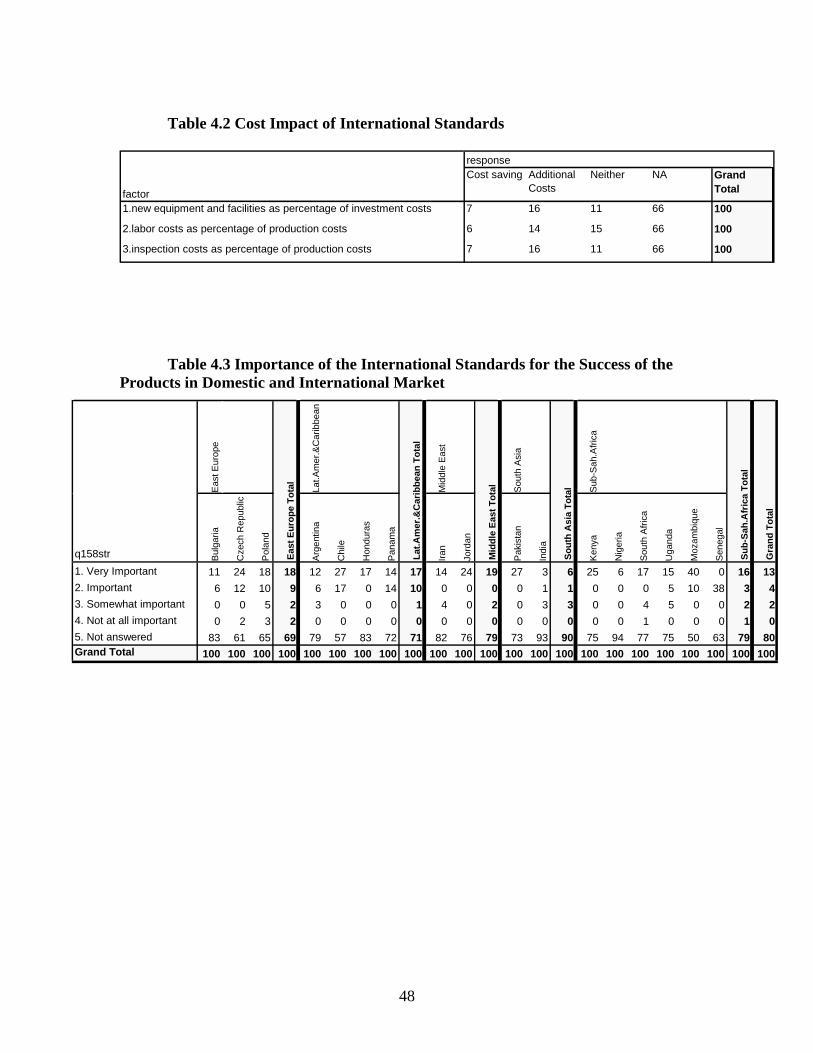
48
Table 4.2 Cost Impact of International Standards
Table 4.3 Importance of the International Standards for the Success of the Products in Domestic and International Market
Eas
t Eur
ope
Lat.A
mer
.&C
arib
bean
Mid
dle
Eas
t
Sou
th A
sia
Sub
-Sah
.Afr
ica
q158str Bul
garia
Cze
ch R
epub
lic
Pol
and
Arg
entin
a
Chi
le
Hon
dura
s
Pan
ama
Iran
Jord
an
Pak
ista
n
Indi
a
Ken
ya
Nig
eria
Sou
th A
fric
a
Uga
nda
Moz
ambi
que
Sen
egal
1. Very Important 11 24 18 18 12 27 17 14 17 14 24 19 27 3 6 25 6 17 15 40 0 16 132. Important 6 12 10 9 6 17 0 14 10 0 0 0 0 1 1 0 0 0 5 10 38 3 43. Somewhat important 0 0 5 2 3 0 0 0 1 4 0 2 0 3 3 0 0 4 5 0 0 2 24. Not at all important 0 2 3 2 0 0 0 0 0 0 0 0 0 0 0 0 0 1 0 0 0 1 05. Not answered 83 61 65 69 79 57 83 72 71 82 76 79 73 93 90 75 94 77 75 50 63 79 80Grand Total 100 100 100 100 100 100 100 100 100 100 100 100 100 100 100 100 100 100 100 100 100 100 100
So
uth
Asi
a T
ota
l
Su
b-S
ah.A
fric
a T
ota
l
Gra
nd
To
tal
Mid
dle
Eas
t T
ota
l
Eas
t E
uro
pe
To
tal
Lat
.Am
er.&
Car
ibb
ean
To
tal
response
factor
Cost saving Additional Costs
Neither NA Grand Total
1.new equipment and facilities as percentage of investment costs 7 16 11 66 100
2.labor costs as percentage of production costs 6 14 15 66 100
3.inspection costs as percentage of production costs 7 16 11 66 100
49
Section 5. Mutual Recognition Agreements
A Mutual Recognition Agreement (MRA) is an agreement in which one government recognizes another country’s testing and certification requirements as acceptable, without undertaking its own testing or customs inspections. Since the MRA approach requires a high level of trust in a partner nation’s governance capacity, it is really a matter of credibility for the developing nations. As a consequence, most MRA agreements tend to exclude the developing nations. According to Baldwin (2001), this gives rise to a two-tier system of market access, with developing countries occupying the second tier. There are some problems associated with this kind of framework. First, it violates the non-discriminatory and multilateral spirit of the WTO and as a result undermines the rule-based world trade system. Also, an MRA agreement between two developed nations may divert investment from a third developing nation. For example, the EU-US MRA may divert investment from a nation like Mexico. Due to all these problems, currently there are ongoing talks to include developing countries as part of the MRA agreement. Table 5.1 shows whether any product of the firms in the sample is subjected to an MRA. The majority (69 percent) of the firms do not subject their product to a MRA, whereas only 23 percent do. The firms in Eastern Europe and Latin America and Caribbean most actively participate in MRAs. South Asia has the highest percentage, i.e., 84 percent of the firms do not have products subject to MRAs—with India having 94 percent of its firms answering in the negative. On the contrary, 63 percent of firms in Pakistan, 59 percent in the Czech Republic, and 58 percent in Honduras say that they have products that are subject to a MRA. Despite the fact that the overall participation rate in MRAs is low, more firms find participation in MRAs will reduce export costs. Table 5.2 shows whether there are any cost savings from MRA recognition. Overall, more firms consider MRA recognition to be cost saving. Forty-one percent of firms in the Czech Republic think that there are cost savings from MRA recognition, whereas 33 percent of firms in Honduras say there are no cost savings. In Eastern Europe 24 percent of the firms consider MRA to be cost saving, which is the highest among the regions. On the other hand, the highest percentage answering in the negative for cost savings are Latin American and Caribbean firms (18 percent) despite their high participation rate in MRAs. Table 5.3 indicates whether an MRA agreement with a potential destination market will make it easier for the country to export there. In fact, for destination markets such as the EU, the US, Canada, Japan, and Australia, 60 percent of the firms in our sample of countries say that it will be somewhat easier for them to export to a destination with an MRA agreement. Sixty nine percent of firms say an MRA will ease the export process to Japan to a certain extent and 62 percent say that export to the US will be somewhat easier with an MRA agreement. The low participation in MRAs may reflect the difficulties that developing countries face in reaching MRAs with other nations as they typically fail to establish credibility in their
50
inspection procedures, which makes it more difficult for developing countries to participate in MRAs with developed countries (Chapter 3, Global Economic Prospects, World Bank, 2002). But the tables also suggest that once a country enters into MRAs, these agreement tend to reduce export costs. The firms in Eastern Europe are the most successful in leveraging the opportunity and benefits of MRAs.
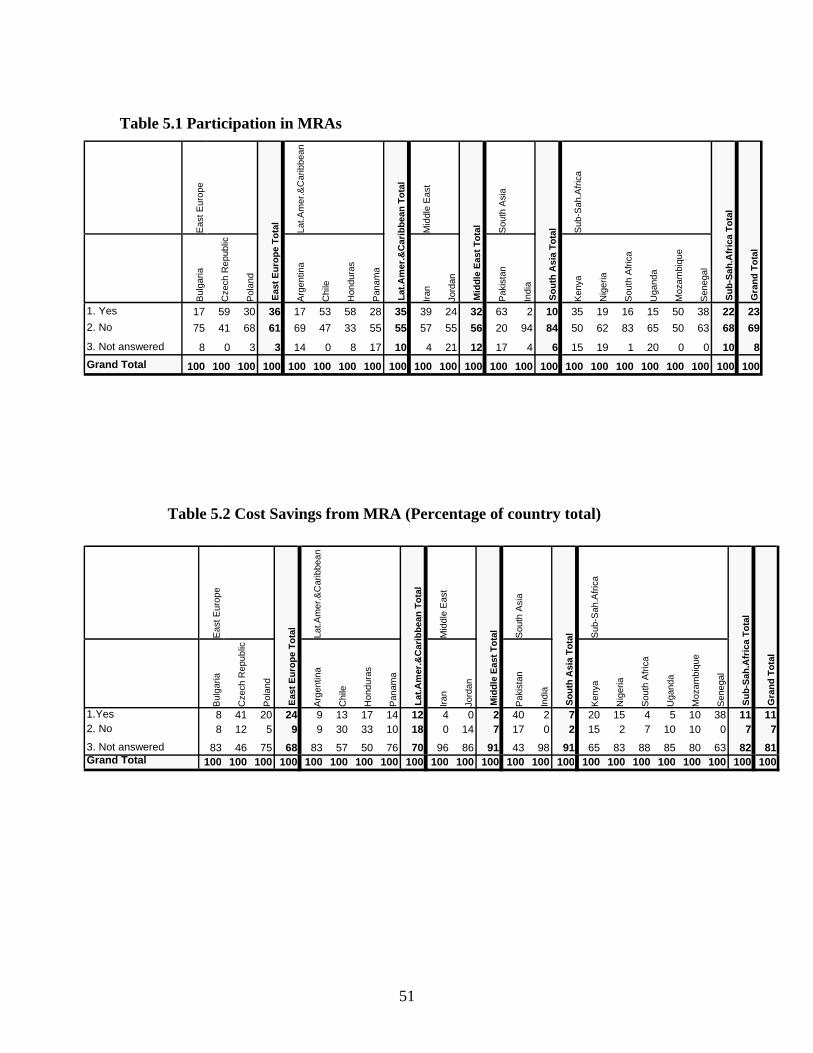
51
Table 5.1 Participation in MRAs
Table 5.2 Cost Savings from MRA (Percentage of country total)
Eas
t Eur
ope
Lat.A
mer
.&C
arib
bean
Mid
dle
Eas
t
Sou
th A
sia
Sub
-Sah
.Afr
ica
Bul
garia
Cze
ch R
epub
lic
Pol
and
Arg
entin
a
Chi
le
Hon
dura
s
Pan
ama
Iran
Jord
an
Pak
ista
n
Indi
a
Ken
ya
Nig
eria
Sou
th A
fric
a
Uga
nda
Moz
ambi
que
Sen
egal
1.Yes 8 41 20 24 9 13 17 14 12 4 0 2 40 2 7 20 15 4 5 10 38 11 112. No 8 12 5 9 9 30 33 10 18 0 14 7 17 0 2 15 2 7 10 10 0 7 7
3. Not answered 83 46 75 68 83 57 50 76 70 96 86 91 43 98 91 65 83 88 85 80 63 82 81Grand Total 100 100 100 100 100 100 100 100 100 100 100 100 100 100 100 100 100 100 100 100 100 100 100
Mid
dle
Eas
t T
ota
l
Eas
t E
uro
pe
To
tal
Lat
.Am
er.&
Car
ibb
ean
To
tal
So
uth
Asi
a T
ota
l
Su
b-S
ah.A
fric
a T
ota
l
Gra
nd
To
tal
Eas
t Eur
ope
Lat.A
mer
.&C
arib
bean
Mid
dle
Eas
t
Sou
th A
sia
Sub
-Sah
.Afr
ica
Bul
garia
Cze
ch R
epub
lic
Pol
and
Arg
entin
a
Chi
le
Hon
dura
s
Pan
ama
Iran
Jord
an
Pak
ista
n
Indi
a
Ken
ya
Nig
eria
Sou
th A
fric
a
Uga
nda
Moz
ambi
que
Sen
egal
1. Yes 17 59 30 36 17 53 58 28 35 39 24 32 63 2 10 35 19 16 15 50 38 22 232. No 75 41 68 61 69 47 33 55 55 57 55 56 20 94 84 50 62 83 65 50 63 68 69
3. Not answered 8 0 3 3 14 0 8 17 10 4 21 12 17 4 6 15 19 1 20 0 0 10 8
Grand Total 100 100 100 100 100 100 100 100 100 100 100 100 100 100 100 100 100 100 100 100 100 100 100
Mid
dle
Eas
t T
ota
l
Eas
t E
uro
pe
To
tal
Lat
.Am
er.&
Car
ibb
ean
To
tal
So
uth
Asi
a T
ota
l
Su
b-S
ah.A
fric
a T
ota
l
Gra
nd
To
tal
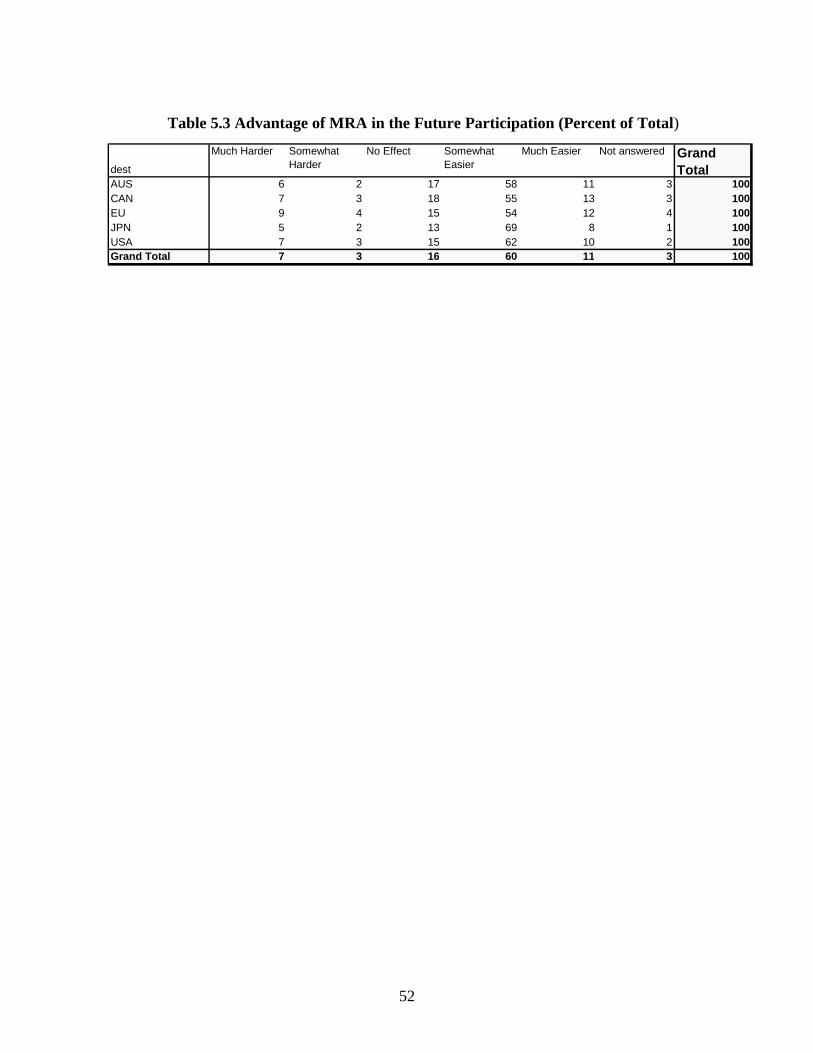
52
Table 5.3 Advantage of MRA in the Future Participation (Percent of Total)
dest
Much Harder Somewhat Harder
No Effect Somewhat Easier
Much Easier Not answered Grand Total
AUS 6 2 17 58 11 3 100CAN 7 3 18 55 13 3 100EU 9 4 15 54 12 4 100JPN 5 2 13 69 8 1 100USA 7 3 15 62 10 2 100Grand Total 7 3 16 60 11 3 100
53
Section 6. Summary of Findings and Implications
The World Bank Technical Barriers to Trade Survey is the fundamental first step in the effort to measure and analyze the firm-level impact of standards and technical regulations. The overview provided in this paper suggests that standards and technical regulations are perceived to be one of the important factors affecting a firm’s operation and ability to export. The findings of the survey can be used to design domestic and trade policies that effectively promote exports of small and medium firms to major western markets, which leads to a nation’s economic development. The survey was conducted in countries that differ in stages of development, leading export commodities, and export markets. Further, firms in a variety of industries, of ownership forms, and of employment size were interviewed. These make comparative analysis more interesting. In addition to the investigation of the issues over the entire sample, this paper conducts a regional comparison to illustrate the variation of the impact of standards and technical regulations, and other trade- promoting and impeding factors. The major findings include: General factors that affect business • Limited access to credits and low demand are the most crucial impediments to business among both exporting and non exporting firms. Product quality and existence of high demand are found to be major factors to increase ability to export. For firms that are willing but unable to export, low demand and costs of transporting goods are major impediments to exports. Mandatory standards and Technical Regulations • 70 percent of firms that export are confronted by mandatory standards and technical regulations. The majority of those who responded perceive technical regulations to be important for entering export markets but the obligation to meet these requirements may discourage export. • More firms confront mandatory standards and technical regulations than domestic technical regulations, but compliance costs to meet the regulations are about the same between domestic and foreign regulations. • Among the major export markets studied, the EU is the export market whose technical regulations are most widely perceived to be important, followed by the US. • By regional comparison, a large share of firms in Eastern Europe and LAC consider technical regulations to be important. • Among foreign technical regulations, product quality standards are most widely perceived to be important for success in export, followed by performance standards and testing/certification requirements. In general, variation across countries is notable. • Technical regulations possibly reduce production costs and the ability to export. Compliance • Compliance to technical regulations is most commonly done within the capacity of the
54
existing plant, equipment, workers, and technology. Among the firms that incur any cost for compliance, additional cost per type of effort is commonly within 10 percent of investment cost. • But among the firms that incur any cost of compliance, investment in additional plant or equipment is the most common effort. • Product re-design and additional employment are also common types of compliance efforts because they require smaller amounts of installation costs. Conformity assessment • The EU conformity assessment is most widely imposed. • Own conformity testing is typically more expensive than outsourcing. International standards • Among international standards, ISO is most commonly used. • The majority of firms that responded consider international standards to be important for successful sales in domestic and foreign markets. Mutual Recognition Agreements • Mutual Recognition Agreements are generally not common among the firms in the 17 studied countries. • Relatively, Eastern Europe and Latin America and Caribbean most actively participate in MRAs. • The majority of firms that responded consider that Mutual Recognition Agreements lead to cost saving. In summary, mandatory standards and technical regulations as well as international standards are important factors that affect domestic sales and the ability to export. Production and investment costs tend to be higher for firms that face technical regulations, and the investment for the compliance is typically below 10 percent of the total investment costs. While the current participation level is low, MRAs would provide more export opportunity. Relatively advanced countries are more likely to succeed in MRAs but less developed nations should raise their capacity in providing more credible accreditation to attract potential partner countries.
55
Bibliography
Baldwin, R (2001). Regulatory Protectionism, Developing Nations and Two-Tier World Trade System. In Maskus, K.E. and Wilson, J.S. (Eds.) Quantifying Trade Effect of Technical Barriers: Can it be done? University of Michigan Press, Ann Arbor, Michigan.
Blind, K. and A. Jungmittag (1999). The Impacts of Innovations and Standards and
German Trade in General and on trade with the UK in Particular. Internal Paper of Fraunhofer 2: 205-221.
Maskus, K. E. and J. S. Wilson, and T. Otsuki (2001). An Empirical Framework for
Analyzing Technical Regulations and Trade. In Maskus, K.E. and Wilson, J.S. (Eds.) Quantifying Trade Effect of Technical Barriers: Can it be done? University of Michigan Press, Ann Arbor, MI.
Moenius, J. (2000). Three Essays on Trade Barriers and Trade Volumes. Ph.D.
Dissertation. University of California, San Diego. Organization for Economic Development and Cooperation. (2000). An Assessment of the
Costs for International Trade in Meeting Regulatory Requirements. TD/TC/WP(99)8/FINAL, OECD, Paris.
Swann, P., P. Temple, and M. Shurmer (1996). Standards and Trade Performance: The
UK experience. Economic Journal 106: 1297-1313. WBES: World Business Environment Survey (2000) by Batra, G., Kaufman, D., and
Stone, A.H.W. The World Bank Group.