Embed Size (px)
Citation preview
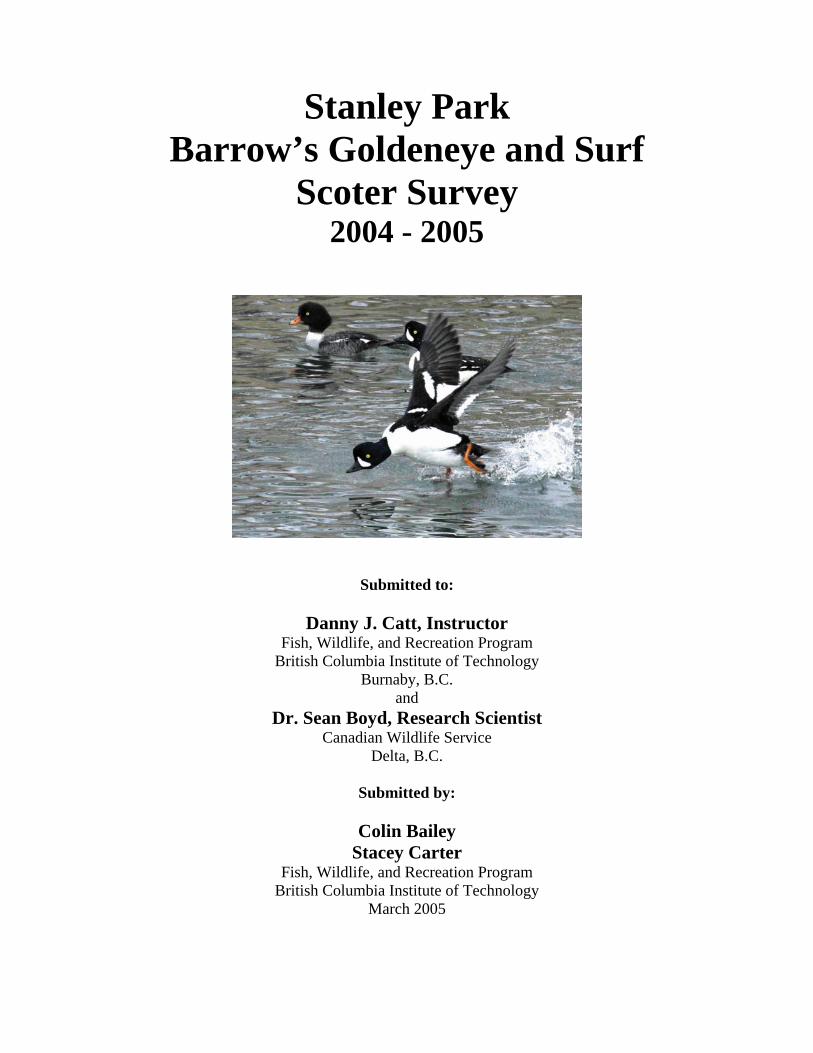
Stanley Park Barrow’s Goldeneye and Surf
Scoter Survey 2004 - 2005
Submitted to:
Danny J. Catt, Instructor
Fish, Wildlife, and Recreation Program British Columbia Institute of Technology
Burnaby, B.C. and
Dr. Sean Boyd, Research Scientist Canadian Wildlife Service
Delta, B.C.
Submitted by:
Colin Bailey Stacey Carter
Fish, Wildlife, and Recreation Program British Columbia Institute of Technology
March 2005
Researchers: Colin Bailey and Stacey Carter
Table of Contents Table of Contents................................................................................................................ 2 List of Figures ..................................................................................................................... 3 List of Tables ...................................................................................................................... 5 Acknowledgements............................................................................................................. 6 1.0 Introduction............................................................................................................. 7
1.1 Background and Objectives ............................................................................ 7 1.2 Life History..................................................................................................... 9 1.2.1 Barrow’s Goldeneye ................................................................................... 9 1.2.2 Surf Scoter ................................................................................................ 10
2.0 Study Area ............................................................................................................ 11 2.1 Site Description............................................................................................. 11 2.2 Survey Area and Zones................................................................................. 12
3.0 Materials and Methods.......................................................................................... 13 3.1 Materials ....................................................................................................... 13 3.2 Bird Survey Procedures ................................................................................ 14 3.2.1 Synchronous Diving Behavior.................................................................. 15 3.2.2 Milling....................................................................................................... 15 3.2.3 Large Scale Dispersal ............................................................................... 15 3.3 Bird Species Identification............................................................................ 16 3.3.1 Barrow’s Goldeneye ................................................................................. 16 3.3.2 Surf Scoter ................................................................................................ 18 3.4 Bird Data Analysis........................................................................................ 19 3.5 G.P.S. Data................................................................................................... 20
4.0 Results and Discussion ......................................................................................... 21 4.1 Seawall Closures................................................................................................ 21 4.2 Barrow’s Goldeneye .......................................................................................... 22 4.3 Surf Scoter ......................................................................................................... 26 4.4 Other Species Observed...................................................................................... 31 4.5 Rare Species....................................................................................................... 34
5.0 Recommendations................................................................................................. 35 6.0 References Cited ................................................................................................... 36 7.0 Appendix............................................................................................................... 38
Stanley Park Barrow’s Goldeneye and Surf Scoter Survey, 2004 - 2005
2
Researchers: Colin Bailey and Stacey Carter
List of Figures Figure 1. Range map of the Barrow’s Goldeneye (source: Sibley, 2000). ....................... 7 Figure 2. A pair of Barrow's Goldeneye, male in the forefront, female in the background
(source: Learn for Life website, 2003). .................................................................. 9 Figure 3. Range map of the Surf Scoters in North America (source: Sibley, 2000). ...... 10 Figure 4. Stanley Park lies directly between English Bay and Burrard Inlet, British
Columbia (source: Vancouver Parks Board of Recreation, 2004)....................... 11 Figure 5. Portion of the Stanley Park seawall between the commemorative Smallbone
bench and Discovery Bridge (Zone 64) (source: Vancouver Parks Board of Recreation, 2004).................................................................................................. 12
Figure 6. Orthophoto of Stanley Park showing the twenty-two survey zones (source: Watts and Breault, 1996 in Williams, 2000)......................................................... 13
Figure 7. Identification features of Barrow's Goldeneye (source: Sibley, 2000). ........... 17 Figure 8. Identification features of the Common Goldeneye (source: Sibley, 2000). ..... 18 Figure 9. Identification features of the Surf Scoter (source: Sibley, 2000). .................... 19 Figure 10. Mudslides due to heavy precipitation on the west side of the Stanley Park
seawall. (source: Vancouver Parks Board of Recreation, 2004). ....................... 21 Figure 11. Seawall closures due to mudslides, cliff scaling, and blasting closed public
access to the seawall from south of Siwash Rock to east of the Lions Gate Bridge (source: Vancouver Parks Board of Recreation, 2004). ...................................... 22
Figure 12. Abundance of Barrow's Goldeneye observed along the Stanley Park foreshore. October 13, 2004 to April 13, 2005. The n/d indicates weeks when the survey was not conducted due to a seawall closure. An H indicates a week the survey was not conducted due to a holiday). ........................................................ 22
Figure 13. Comparison in abundance of Barrow's Goldeneye along the Stanley Park foreshore from October to April 2003, 2004, 2005. (An H indicates a week that the survey was not conducted due to a holiday. An n/d indicates a week the survey was not conducted due to a seawall closure). Data from previous years from (Boisclair-Joly and Worcester, 2002) and (Marshal et. al., 2003). .............. 23
Figure 14. Average number of Barrow's Goldeneye per survey in the 22 survey zones along the Stanley Park foreshore, October 13, 2004 to April 13, 2005................ 24
Figure 15. Males, females, and pairing totals of the Barrow's Goldeneye observed along the Stanley Park foreshore October 13, 2004 to April 13, 2005. (An H indicates a week the survey was not conducted due to a holiday. An n/d indicates a seawall closure).................................................................................................................. 25
Figure 16. Total number of juvenile Barrow's Goldeneye observed along the Stanley Park foreshore October 13, 2004 to April 13, 2005. (An H indicates a week the survey was not conducted due to a holiday. An n/d indicates a seawall closure).26
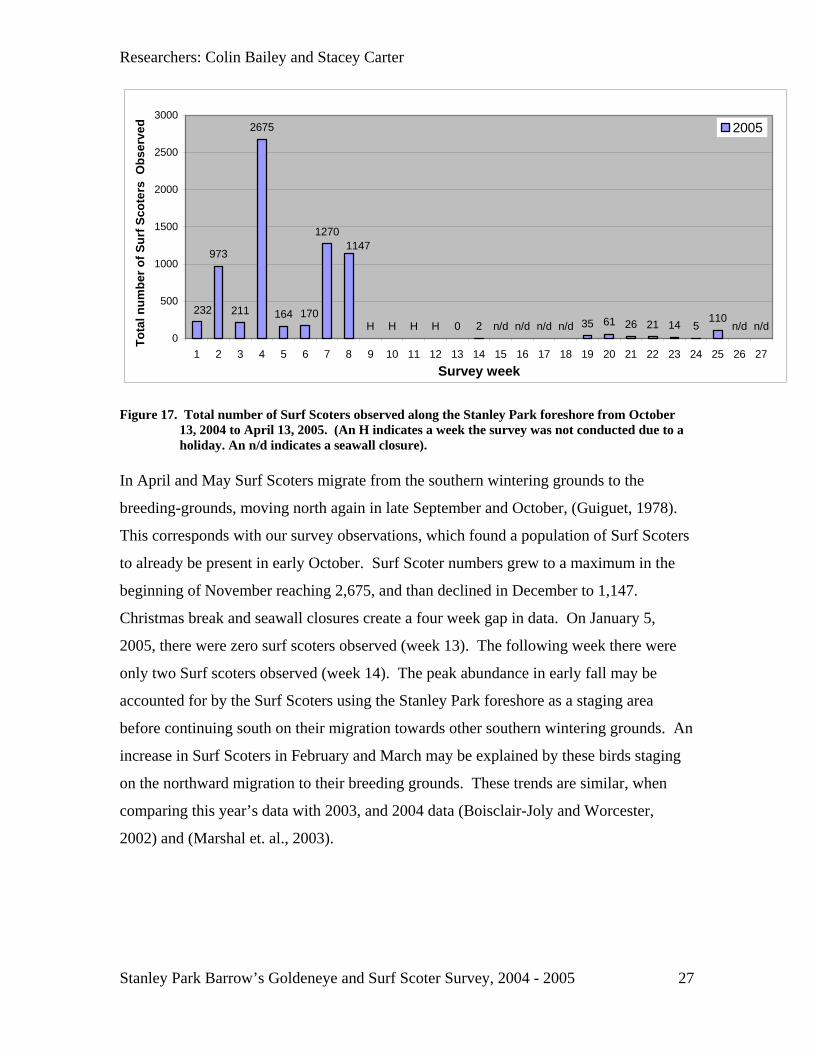
Figure 17. Total number of Surf Scoters observed along the Stanley Park foreshore from October 13, 2004 to April 13, 2005. (An H indicates a week the survey was not conducted due to a holiday. An n/d indicates a seawall closure).......................... 27
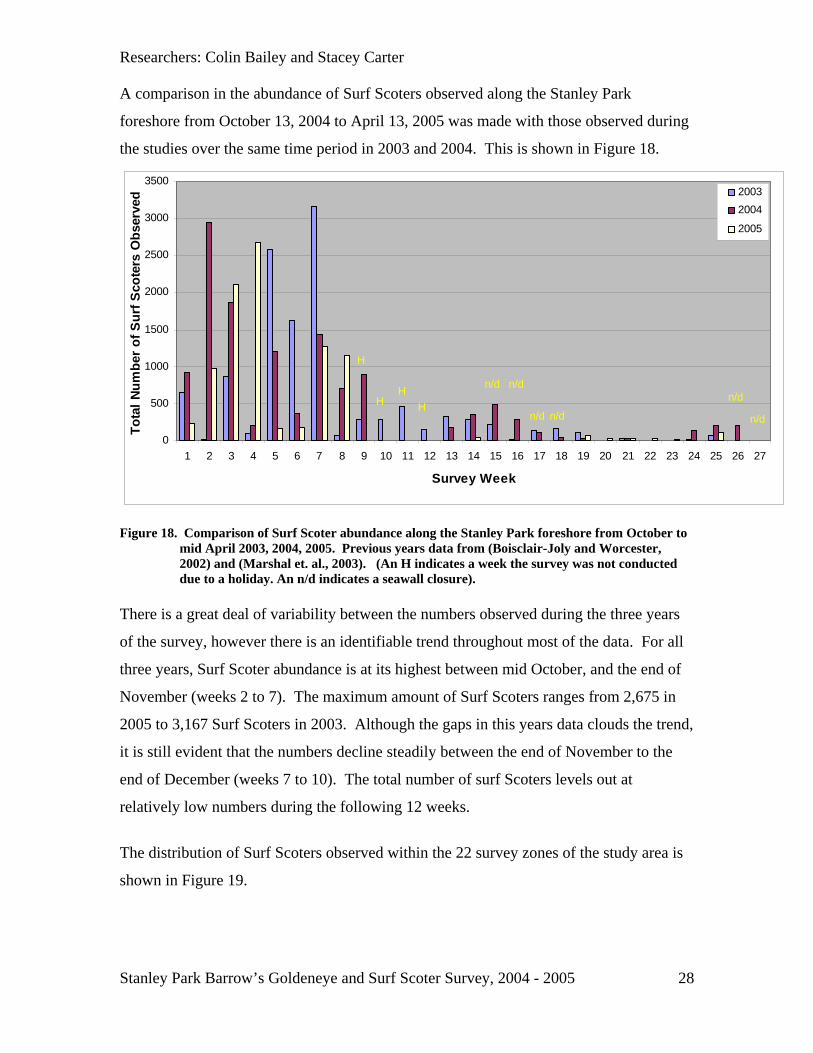
Figure 18. Comparison of Surf Scoter abundance along the Stanley Park foreshore from October to mid April 2003, 2004, 2005. Previous years data from (Boisclair-Joly and Worcester, 2002) and (Marshal et. al., 2003). (An H indicates a week the survey was not conducted due to a holiday. An n/d indicates a seawall closure). 28
Stanley Park Barrow’s Goldeneye and Surf Scoter Survey, 2004 - 2005
3
Researchers: Colin Bailey and Stacey Carter
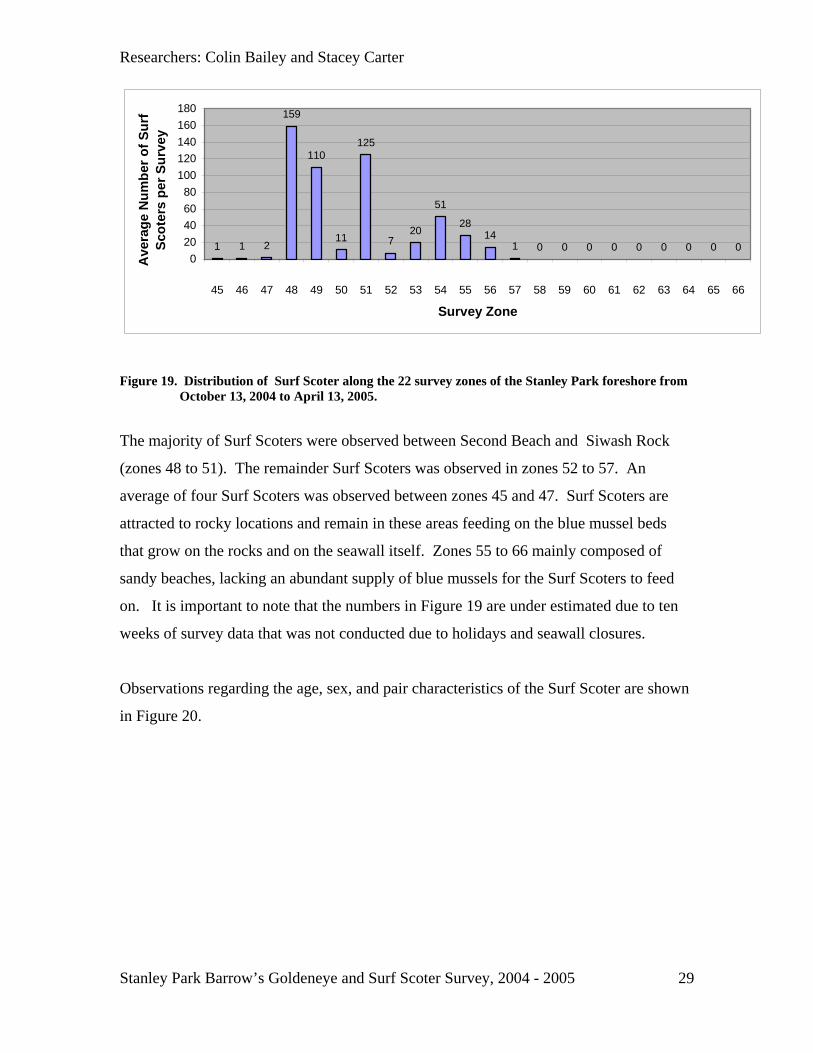
Figure 19. Distribution of Surf Scoter along the 22 survey zones of the Stanley Park foreshore from October 13, 2004 to April 13, 2005. ............................................ 29
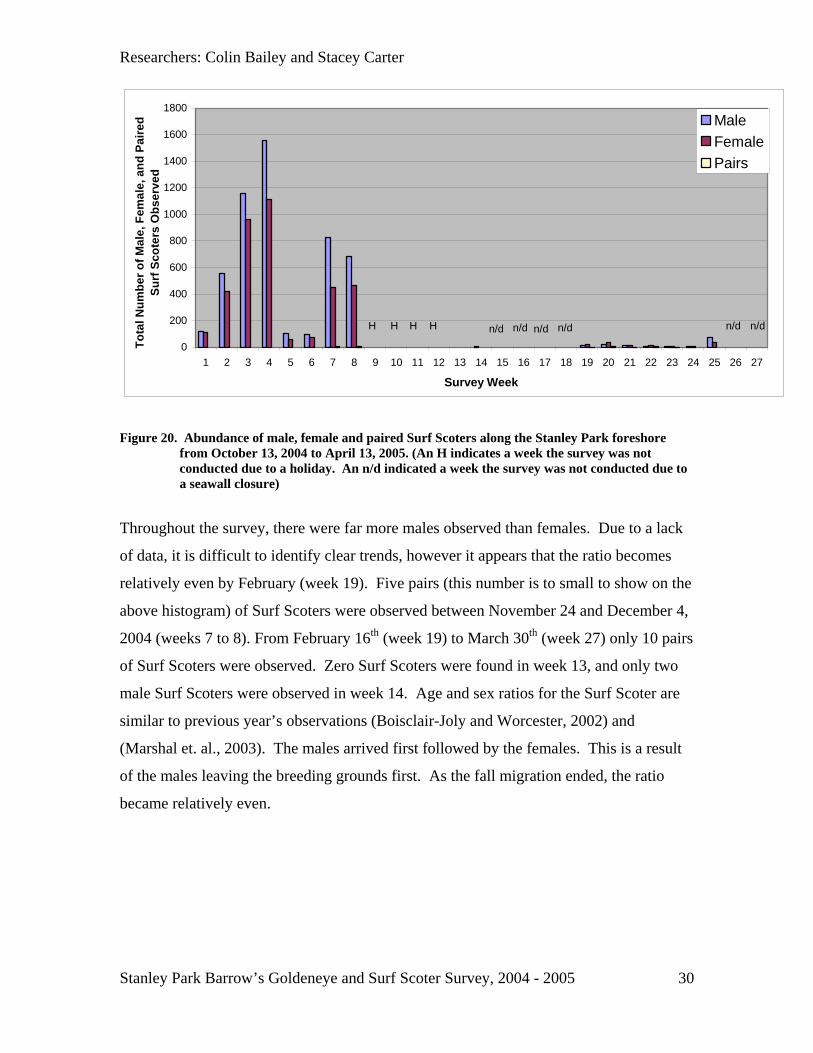
Figure 20. Abundance of male, female and paired Surf Scoters along the Stanley Park foreshore from October 13, 2004 to April 13, 2005. (An H indicates a week the survey was not conducted due to a holiday. An n/d indicated a week the survey was not conducted due to a seawall closure) ........................................................ 30
Figure 21. Abundance of juvenile Surf scoters observed on the Stanley Park foreshore from October 13, 2004 to April 13, 2005 (An H indicates a week the survey was not conducted due to a holiday. An n/d indicates a week the survey was not conducted due to a seawall closure)...................................................................... 31
Figure 22. Abundance of seabirds (excluding the Barrow's Goldeneye and Surf Scoter) observed along the Stanley Park foreshore, October 13, 2004 to April 13, 2005. (An H indicates a week the survey was not conducted due to a holiday. An n/d indicates a week the survey was not conducted due to a seawall closure). .......... 32
Figure 23. Eurasian Wigeon (source: Parigo website, 2004)........................................... 34 Figure 24. Long-Tailed Duck (source: Birds of Kolkata website, 2005). ....................... 34 Figure 25. Red-faced Cormorant (source: Observe Tours website, 2004). ..................... 35
Stanley Park Barrow’s Goldeneye and Surf Scoter Survey, 2004 - 2005
4
Researchers: Colin Bailey and Stacey Carter
List of Tables Table 1. G.P.S. coordinates recorded for each zone boundary along the Stanley Park
seawall. These coordinates were recorded on March 13, 2005 and will insure consistency of zone boundaries for....................................................................... 20
Table 2. All seabird species observed during the 2004-2005 Barrow's Goldeneye and Surf Scoter survey along the Stanley Park seawall............................................... 32
Stanley Park Barrow’s Goldeneye and Surf Scoter Survey, 2004 - 2005
5
Researchers: Colin Bailey and Stacey Carter
Acknowledgements We would like to thank first and foremost Dr. Sean Boyd, Research Scientist for the
Canadian Wildlife Service for the opportunity to carry out the sixth year of this research
project. Dr. Boyd played a key role in establishing initial objectives for the survey.
Danny Catt, Recreational Land Management Instructor at B.C.I.T., has given full support
on this project and has helped us to establish objectives as well as provided us with
advice and direction on numerous occasions. In class instruction and field experience in
Applied Ecology, taught by Danny, has given us the needed bird identification skills to
conduct this survey. Danny was also kind enough to lend us a pair of spotting scopes.
Thank you Danny.
Thanks to all of the students who have contributed to the survey in the past. By viewing
the final copies of the year end reports, it becomes very apparent that this project has
been carried out with the highest regard.
A special thanks to Brenda Andres for developing the original project and providing key
information.
Stanley Park Barrow’s Goldeneye and Surf Scoter Survey, 2004 - 2005
6
Researchers: Colin Bailey and Stacey Carter
1.0 Introduction
1.1 Background and Objectives
The western coast of British Columbia (B.C.) plays a significant role in providing
wintering habitat for many different species of shorebirds and waterfowl. Two seaduck
species that winter in large numbers along the south coast of British Columbia are the
Barrow’s Goldeneye (Bucephala islandica) and the Surf Scoter (Melanitta perspicallata).
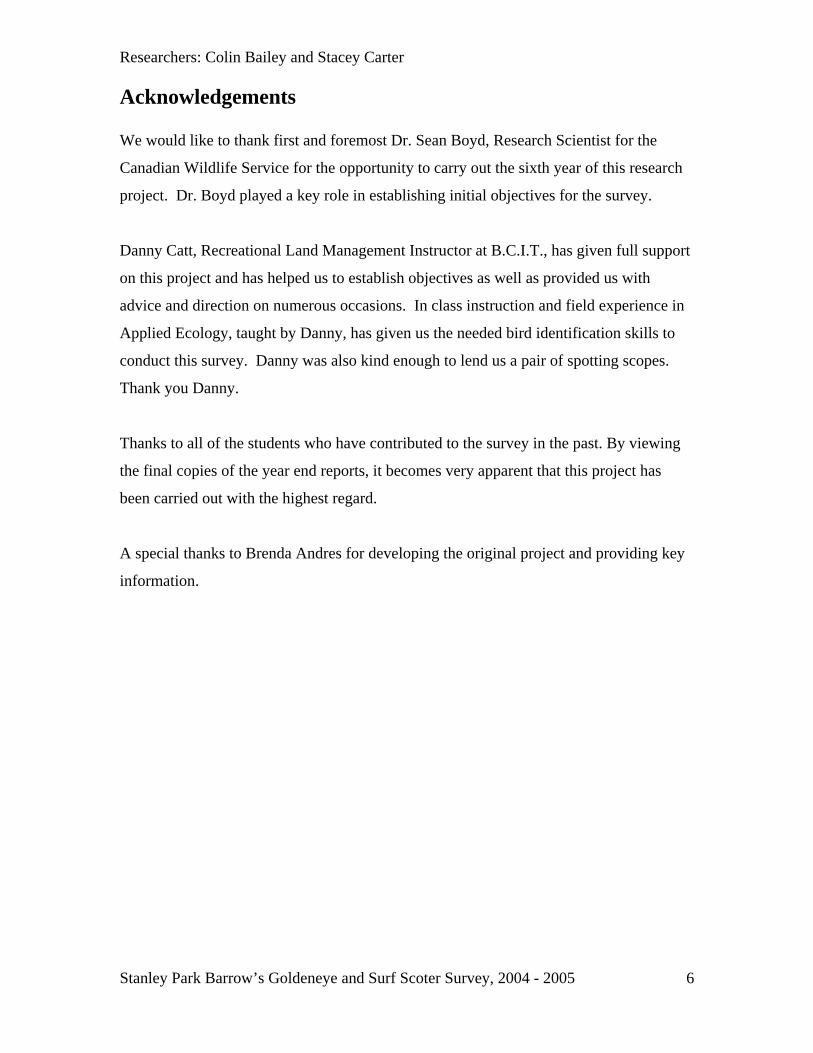
The majority of the continental population of Barrow’s Goldeneye winter along the
Pacific coast (Figure 1) (Johnsgard, 1975).
Waters around Vancouver have the largest known winter concentrations of Barrow’s
Goldeneye in the world, as documented by the Vancouver Natural History Society’s
(V.N.H.S) Christmas bird counts (Aitchison, 2001).
Figure 1. Range map of the Barrow’s Goldeneye (source: Sibley, 2000). A local abundance of food rather than availability of nest sites determine distribution
patterns of this species in British Columbia (Johnsgard, 1975). Tidal areas are the
Stanley Park Barrow’s Goldeneye and Surf Scoter Survey, 2004 - 2005
7
Researchers: Colin Bailey and Stacey Carter
primary winter feeding locations for Barrow’s Goldeneye and Surf Scoters
(Guiguet,1978). The foreshore of Stanley Park, located in Vancouver, provides the ideal
set of resources for birds seeking winter food in the form of fish and invertebrates.
For the purpose of this study, the term “seabirds” includes: loons (family Gaviidae);
grebes (Podicipedidae); cormorants (Phalacrocoracidae); bitterns, herons and allies
(Ardeidae); swans, geese and ducks (Anatidae); shorebirds (Charadriidae,
Haematopodidae, Recurvirostrade, and Scolpacidae); auks, murres, and puffins (Alcidae);
and kingfishers (Alcedinidae) (Marshall et. al., 2003).
This survey is the sixth in a series of year long projects carried out by the Fish, Wildlife
and Recreation students at the British Columbia Institute of Technology (B.C.I.T.), in
cooperation with the Canadian Wildlife Service (C.W.S.)(Rotinsky, 1999)(Marshal et. al.,
2003).
We set out to achieve three main objectives in this study for the period of October 2004
to April 2005.
1. Determine the relative abundance and distribution of the Barrow’s Goldeneye,
Surf Scoters, and all other seabirds along the foreshore of Stanley Park.
2. Collect sex, age, and pairing data on the Barrow’s Goldeneye and Surf Scoters
along the foreshore of Stanley Park.
3. Collect Global Positioning (G.P.S) data, defining all of the survey zones
within the study area around the Stanley Park seawall.
Stanley Park Barrow’s Goldeneye and Surf Scoter Survey, 2004 - 2005
8
Researchers: Colin Bailey and Stacey Carter
1.2 Life History
1.2.1 Barrow’s Goldeneye
Environment Canada indicates that the world population of Barrow’s Goldeneye consists
of approximately 200,000 individuals. Over 90% breed west of the Rockies, while the
remaining live in scattered pockets in eastern North America (Environment Canada,
2004). The majority of the western population occupies a range that extends from Alaska
to California, with the central distribution located in British Columbia (Figure 1).
Smaller populations breed in Iceland, southwest Greenland, and northern Labrador.
The Barrow’s Goldeneye is a secondary cavity nesting duck using pre-existing holes in
trees for nesting. The species builds its nest close to productive cold water lakes, pools,
or rivers. The female Barrow’s Goldeneye is territorial during breeding season and will
defend against intrusions (Todd, 1979).
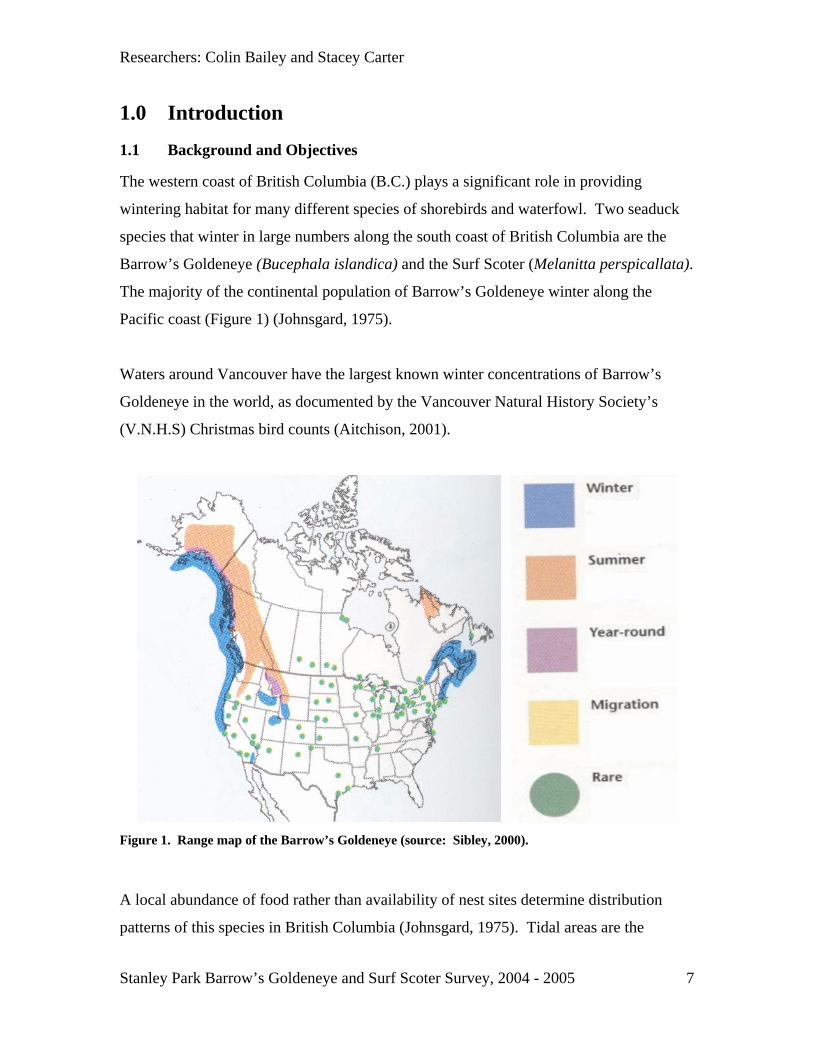
The Barrow’s Goldeneye is a diving sea duck (Figure 2) whose primary winter food
source is blue mussels (Mytilus ssp.) and aquatic invertebrates (Johnsgard, 1975). These
mussels are abundant along the south west Stanley Park foreshore.
Figure 2. A pair of Barrow's Goldeneye, male in the forefront, female in the background (source:
Learn for Life website, 2003).
Stanley Park Barrow’s Goldeneye and Surf Scoter Survey, 2004 - 2005
9
Researchers: Colin Bailey and Stacey Carter
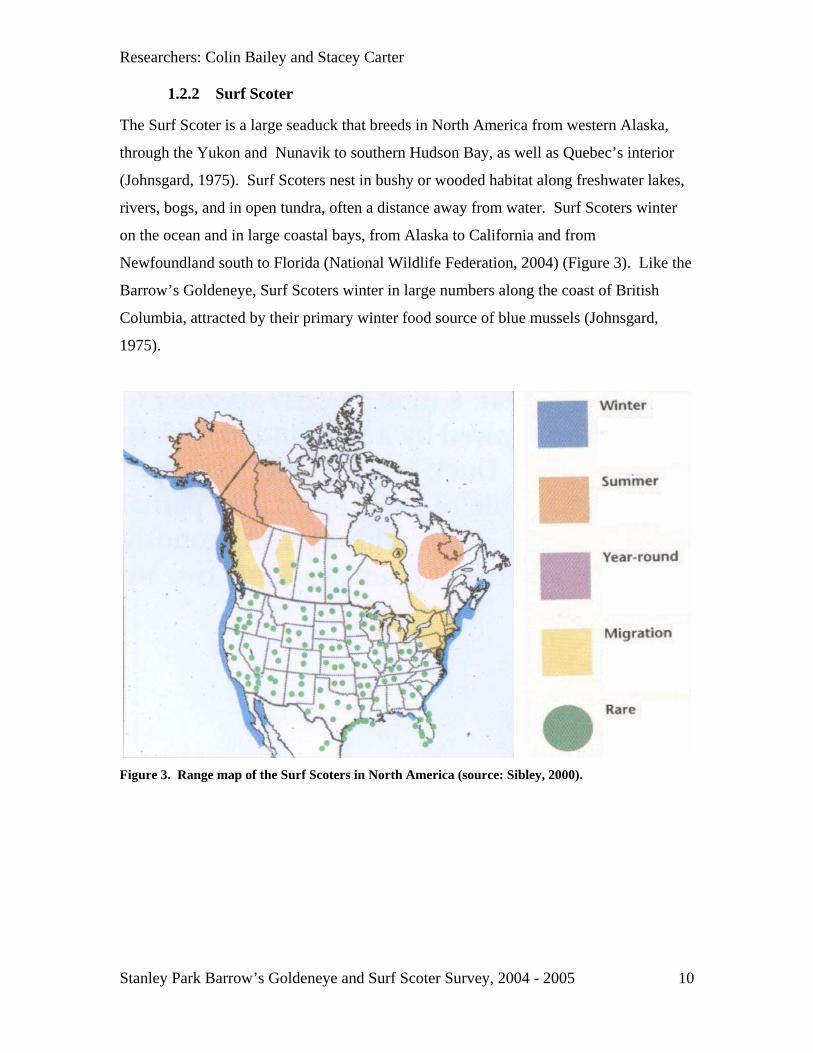
1.2.2 Surf Scoter
The Surf Scoter is a large seaduck that breeds in North America from western Alaska,
through the Yukon and Nunavik to southern Hudson Bay, as well as Quebec’s interior
(Johnsgard, 1975). Surf Scoters nest in bushy or wooded habitat along freshwater lakes,
rivers, bogs, and in open tundra, often a distance away from water. Surf Scoters winter
on the ocean and in large coastal bays, from Alaska to California and from
Newfoundland south to Florida (National Wildlife Federation, 2004) (Figure 3). Like the
Barrow’s Goldeneye, Surf Scoters winter in large numbers along the coast of British
Columbia, attracted by their primary winter food source of blue mussels (Johnsgard,
1975).
Figure 3. Range map of the Surf Scoters in North America (source: Sibley, 2000).
Stanley Park Barrow’s Goldeneye and Surf Scoter Survey, 2004 - 2005
10
Researchers: Colin Bailey and Stacey Carter
2.0 Study Area
2.1 Site Description
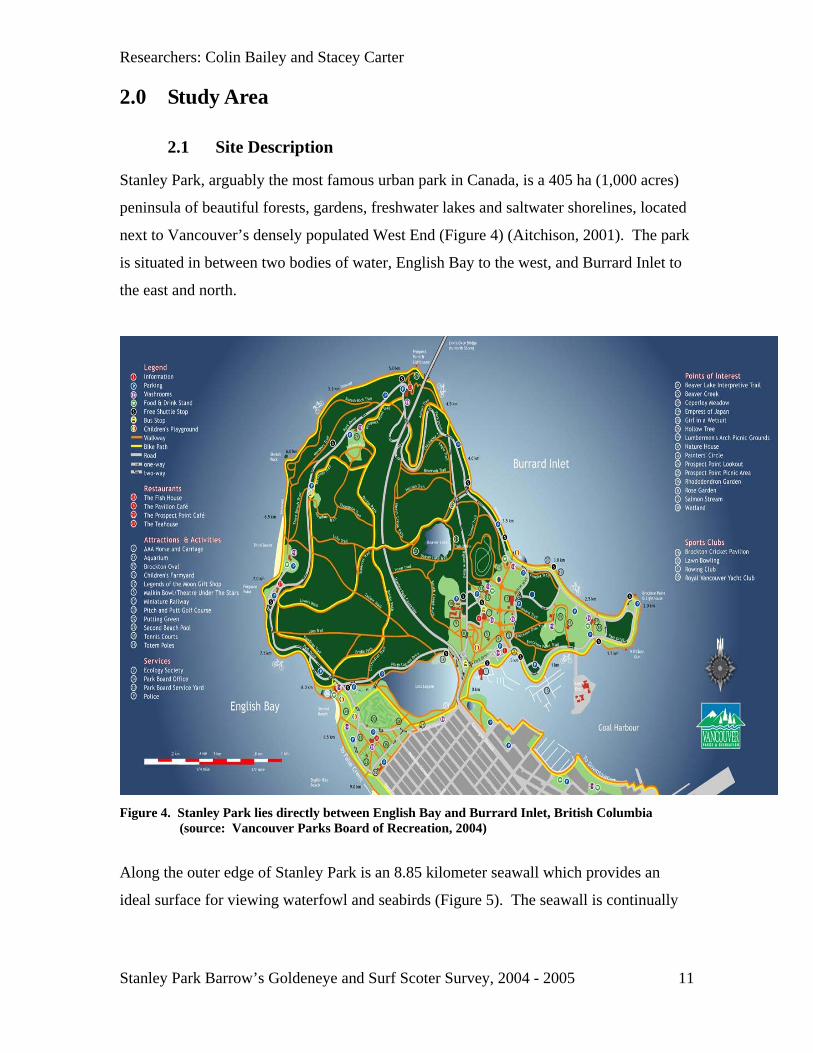
Stanley Park, arguably the most famous urban park in Canada, is a 405 ha (1,000 acres)
peninsula of beautiful forests, gardens, freshwater lakes and saltwater shorelines, located
next to Vancouver’s densely populated West End (Figure 4) (Aitchison, 2001). The park
is situated in between two bodies of water, English Bay to the west, and Burrard Inlet to
the east and north.
Figure 4. Stanley Park lies directly between English Bay and Burrard Inlet, British Columbia
(source: Vancouver Parks Board of Recreation, 2004)
Along the outer edge of Stanley Park is an 8.85 kilometer seawall which provides an
ideal surface for viewing waterfowl and seabirds (Figure 5). The seawall is continually
Stanley Park Barrow’s Goldeneye and Surf Scoter Survey, 2004 - 2005
11
Researchers: Colin Bailey and Stacey Carter
expanding and it is now possible to walk from the downtown harbour side all the way
around the Park, and on around English Bay and False Creek.
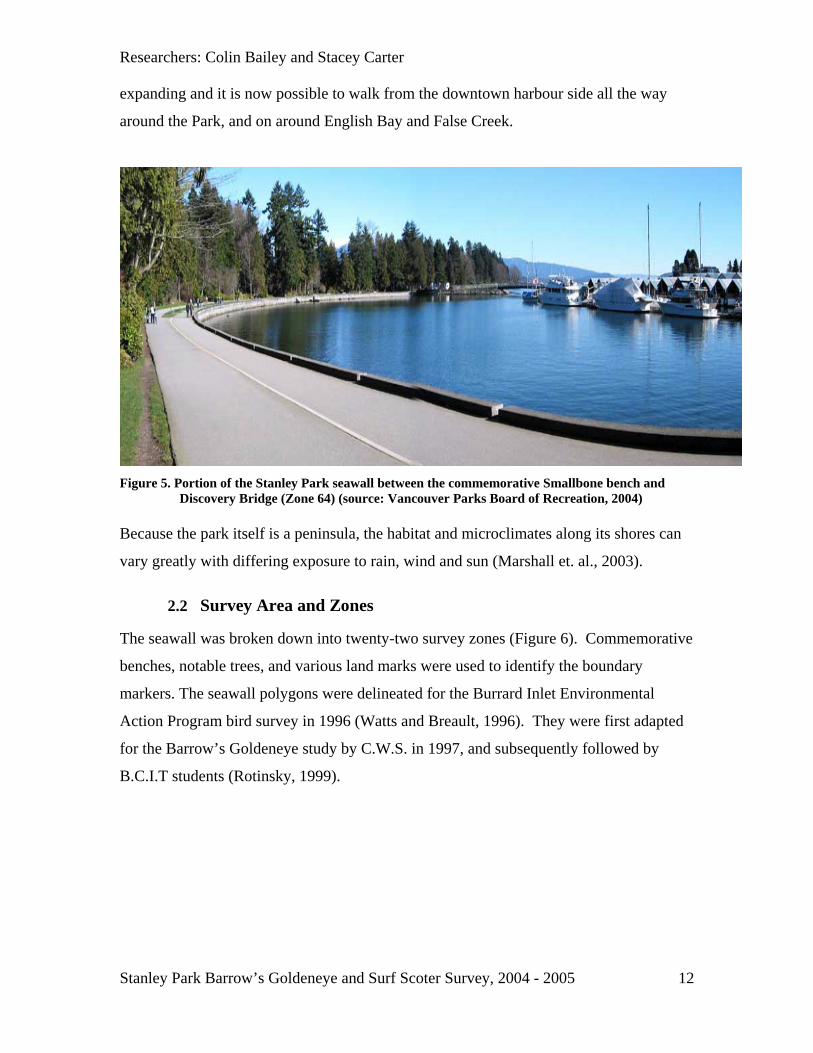
Figure 5. Portion of the Stanley Park seawall between the commemorative Smallbone bench and
Discovery Bridge (Zone 64) (source: Vancouver Parks Board of Recreation, 2004) Because the park itself is a peninsula, the habitat and microclimates along its shores can
vary greatly with differing exposure to rain, wind and sun (Marshall et. al., 2003).
2.2 Survey Area and Zones
The seawall was broken down into twenty-two survey zones (Figure 6). Commemorative
benches, notable trees, and various land marks were used to identify the boundary
markers. The seawall polygons were delineated for the Burrard Inlet Environmental
Action Program bird survey in 1996 (Watts and Breault, 1996). They were first adapted
for the Barrow’s Goldeneye study by C.W.S. in 1997, and subsequently followed by
B.C.I.T students (Rotinsky, 1999).
Stanley Park Barrow’s Goldeneye and Surf Scoter Survey, 2004 - 2005
12
Researchers: Colin Bailey and Stacey Carter
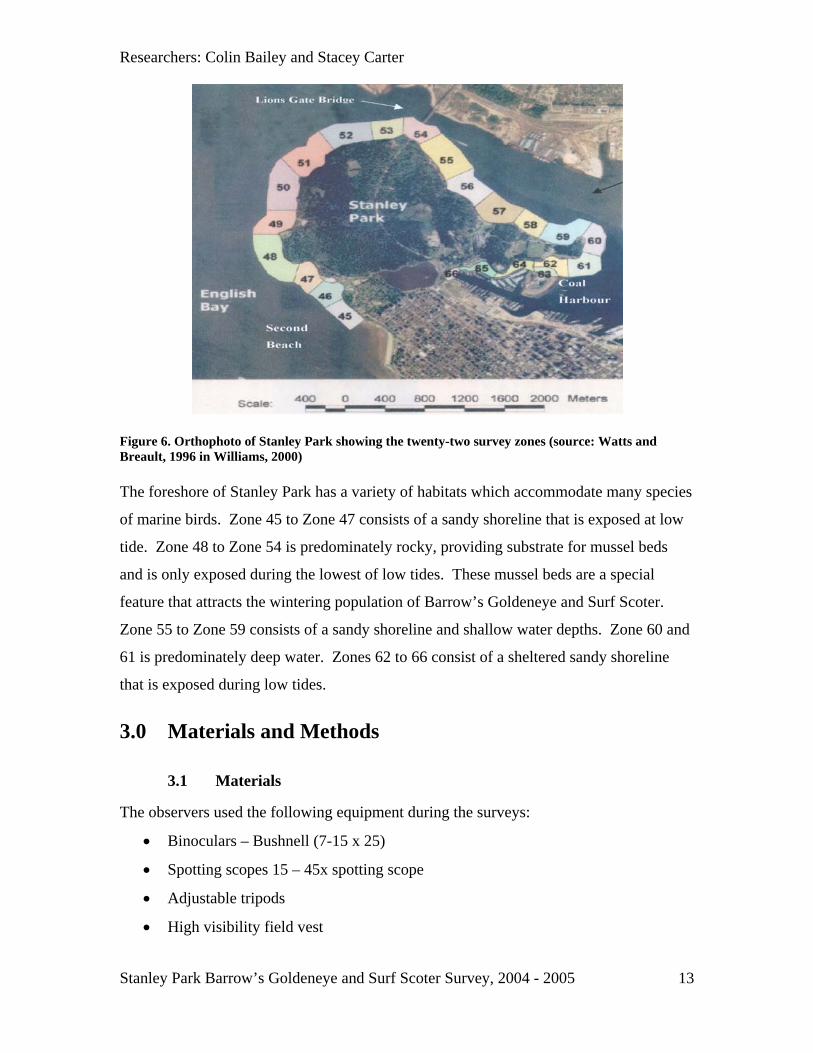
Figure 6. Orthophoto of Stanley Park showing the twenty-two survey zones (source: Watts and Breault, 1996 in Williams, 2000) The foreshore of Stanley Park has a variety of habitats which accommodate many species
of marine birds. Zone 45 to Zone 47 consists of a sandy shoreline that is exposed at low
tide. Zone 48 to Zone 54 is predominately rocky, providing substrate for mussel beds
and is only exposed during the lowest of low tides. These mussel beds are a special
feature that attracts the wintering population of Barrow’s Goldeneye and Surf Scoter.
Zone 55 to Zone 59 consists of a sandy shoreline and shallow water depths. Zone 60 and
61 is predominately deep water. Zones 62 to 66 consist of a sheltered sandy shoreline
that is exposed during low tides.
3.0 Materials and Methods
3.1 Materials
The observers used the following equipment during the surveys:
• Binoculars – Bushnell (7-15 x 25)
• Spotting scopes 15 – 45x spotting scope
• Adjustable tripods
• High visibility field vest
Stanley Park Barrow’s Goldeneye and Surf Scoter Survey, 2004 - 2005
13
Researchers: Colin Bailey and Stacey Carter
• Sibley Field Guide to Birds (2000)
• Field data book
• Waterproof paper
• Pencil
3.2 Bird Survey Procedures
Once a week, two observers conducted the survey. Every Wednesday, from October 13,
2004 to April 16, 2005 the observers either walked, or cycled the survey route. The start
time was approximately 0900 hrs. This start time of 0900 hrs was selected to remain
consistent with previous year surveys for comparable data. Additionally, a morning
survey was originally selected because it was shown to be the best time to see Barrow’s
Goldeneyes along the Stanley Park foreshore (Rotinsky, 1999).
To avoid bias the starting point and direction of the route was alternated every survey
week. The starting point was either Zone 66 (Coal Harbor) or Zone 45 (English Bay)
(Figure 6).
At the beginning of each survey, the date, time, and weather were recorded. Vantage
points were used within each zone to set up spotting scopes and scan for birds. The
survey zone boundaries extended 250 meters perpendicular to the seawall. Birds at short
range were identified using binoculars.
Within each zone, the total number of male, female, and juvenile Barrow’s Goldeneye
and Surf Scoter was recorded. Pairing data was collected for both species. To be classed
as “pairs” birds had to exhibit pairing behavior. One example is when two birds traveled
in the same direction in close proximity to each other. If a pair of birds were observed
diving for mussels at the same general location (within an estimated five meters of each
other), they were also recorded as a pair. Abundance of all other seabirds species
observed in the survey zone was also recorded.
Species identification and abundance estimations were carried out by both observers. If
there was a discrepancy in bird identification, both observers referred to Sibley’s Field
Stanley Park Barrow’s Goldeneye and Surf Scoter Survey, 2004 - 2005
14
Researchers: Colin Bailey and Stacey Carter
Guide (2000). Once observers agreed on the species the birds were counted (or
estimated) by each observer the two totals were then averaged and recorded. Sex ratios
were estimated using this same method. There were challenges estimating large flocks
that included the behaviour of synchronous diving, milling and large scale dispersal.
3.2.1 Synchronous Diving Behavior
Barrow’s Goldeneye and the Surf Scoter displayed synchronous diving behavior. When
in a group, these birds will dive in search of food, one after another, in short succession.
To achieve accurate estimations of birds displaying this behavior, a factor representing
the portion of birds that were underwater was multiplied by the total number of birds.
For example, if there were one-hundred birds on top of the water and an estimated twenty
percent was underwater, we would multiply .20 x 100 to get the number of birds that
were underwater to add to the number of birds that were above water. This approach was
used throughout the survey to ensure an accurate estimate of abundance.
3.2.2 Milling
Within large groups of Barrow’s Goldeneye and Surf Scoter both species displayed great
deal of motion, milling behavior. It is our belief that the early stages of pairing, in
particular, produced the greatest amount of milling. When counting large groups, there
was a chance of counting the same bird twice, or to miss the bird entirely. To account for
this, we multiplied a factor (that was representative of the portion of birds that would be
counted twice) by the total number of birds. We would then subtract the achieved figure
from the total number of birds counted. For example, if ten percent of the birds doubled
back and would normally be counted twice in a group of one hundred birds, we would
multiply .10 x 100. Finally we would subtract ten birds from one hundred birds to get
ninety birds.
3.2.3 Large Scale Dispersal
Bird distribution was occasionally affected during the survey due to disturbance by
motorboats and kayakers. Several times during the survey, we witnessed motorboats and
kayakers encroaching on dormant flocks of birds. Based on our personal observation
these birds would disperse relocating to a nearby area. We tried our best to complete our
Stanley Park Barrow’s Goldeneye and Surf Scoter Survey, 2004 - 2005
15
Researchers: Colin Bailey and Stacey Carter
count before dispersal. If an exact count was not possible we would estimate the number
of birds. Birds dispersing in the opposite direction of the survey would be estimated.
Birds dispersing in the direction the survey was being conducted were not estimated to
avoid a double count if they relocated in an upcoming survey zone.
3.2.4 Large Scale Counts
Determining the total number of individuals in large flocks was challenging. The number
of individuals in large flocks of birds was estimated by counting the number of birds in a
given space. The number of birds in this given space was noted. The number of times
this given space fit into the overall area of the flock was counted and multiplied by the
numbers of birds counted in the original given space. This method was conducted a
second and sometimes a third time to calculate the amount of birds in groups with
ranging densities. By using this method, we were able to estimate the total flock. This
method was used throughout the entire survey.
3.3 Bird Species Identification
3.3.1 Barrow’s Goldeneye
This extremely distinctive species bears no resemblance to any other duck, except the
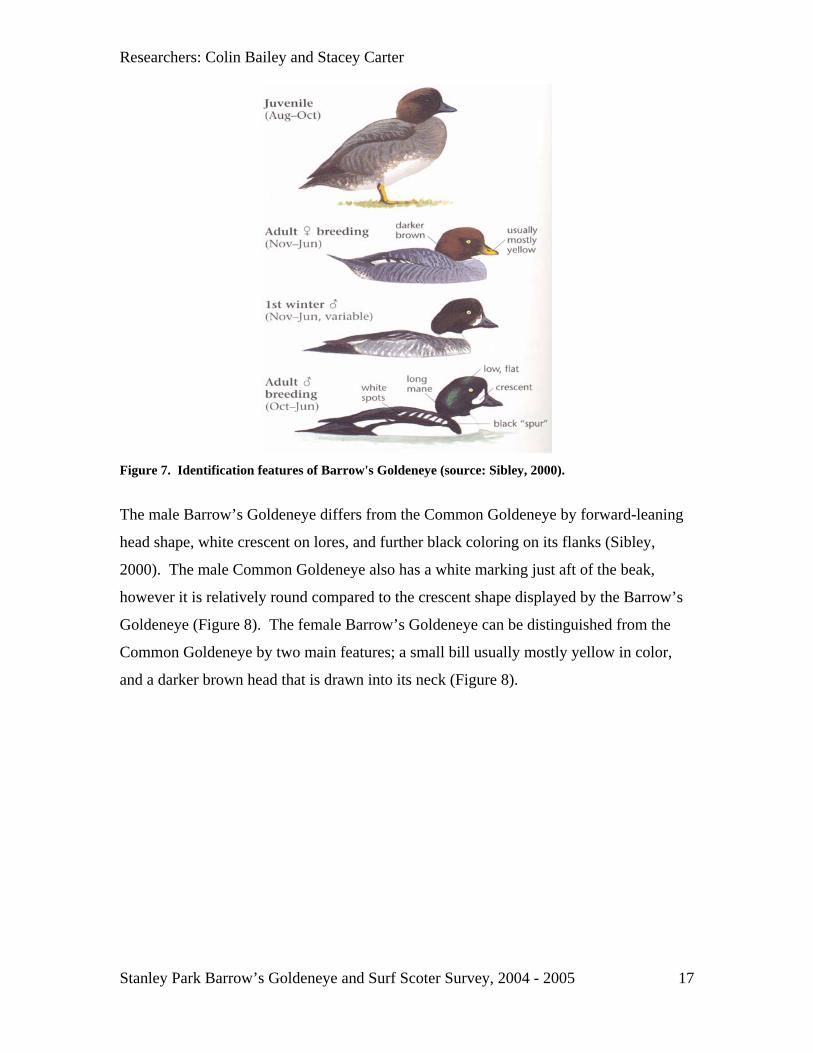
Common Goldeneye. The three most distinguishing features of the adult male are the
white spots on its upper sides, its low, flat crown, and the crescent shaped white patch
located just aft of the beak (Figure 7). The adult female Barrow’s Goldeneye has a
chocolate brown head, a grey body, and a yellow-orange beak (Figure 7).
Stanley Park Barrow’s Goldeneye and Surf Scoter Survey, 2004 - 2005
16
Researchers: Colin Bailey and Stacey Carter
Figure 7. Identification features of Barrow's Goldeneye (source: Sibley, 2000).
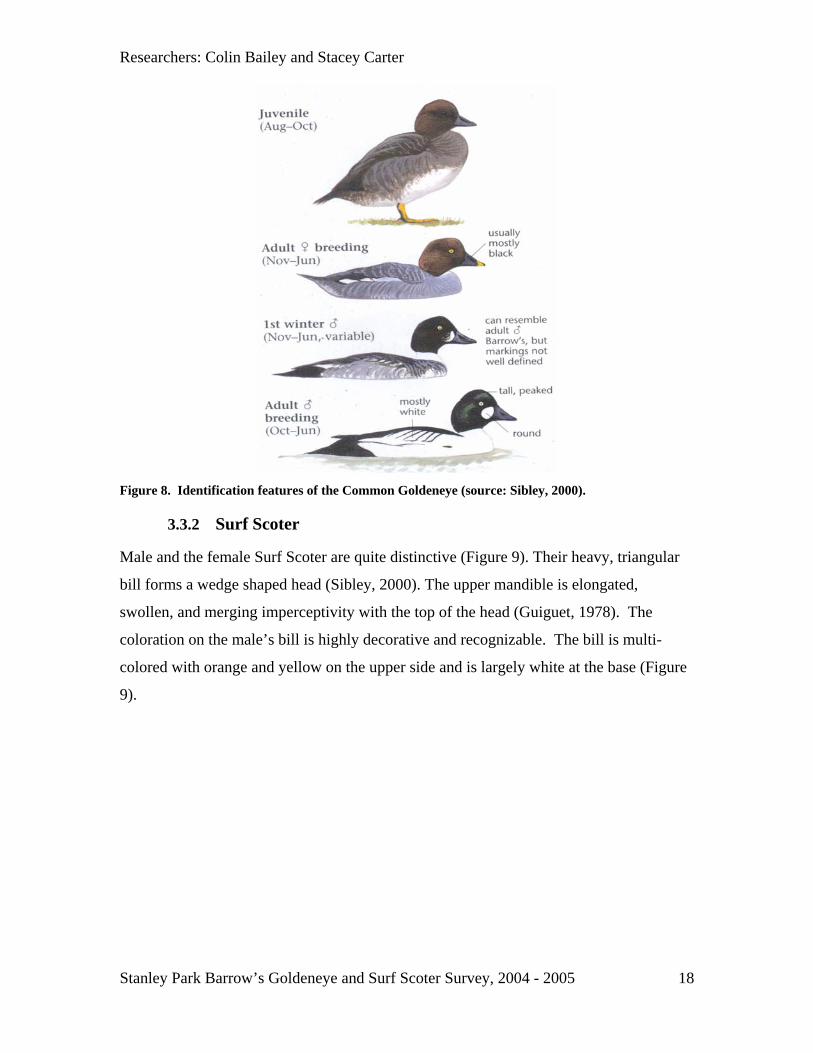
The male Barrow’s Goldeneye differs from the Common Goldeneye by forward-leaning
head shape, white crescent on lores, and further black coloring on its flanks (Sibley,
2000). The male Common Goldeneye also has a white marking just aft of the beak,
however it is relatively round compared to the crescent shape displayed by the Barrow’s
Goldeneye (Figure 8). The female Barrow’s Goldeneye can be distinguished from the
Common Goldeneye by two main features; a small bill usually mostly yellow in color,
and a darker brown head that is drawn into its neck (Figure 8).
Stanley Park Barrow’s Goldeneye and Surf Scoter Survey, 2004 - 2005
17
Researchers: Colin Bailey and Stacey Carter
Figure 8. Identification features of the Common Goldeneye (source: Sibley, 2000).
3.3.2 Surf Scoter
Male and the female Surf Scoter are quite distinctive (Figure 9). Their heavy, triangular
bill forms a wedge shaped head (Sibley, 2000). The upper mandible is elongated,
swollen, and merging imperceptivity with the top of the head (Guiguet, 1978). The
coloration on the male’s bill is highly decorative and recognizable. The bill is multi-
colored with orange and yellow on the upper side and is largely white at the base (Figure
9).
Stanley Park Barrow’s Goldeneye and Surf Scoter Survey, 2004 - 2005
18

Researchers: Colin Bailey and Stacey Carter
Figure 9. Identification features of the Surf Scoter (source: Sibley, 2000).
The male body is dominated by black plumage and displays white head patches. The
female is mostly grey to black in color. The female has two distinct markings, the pale
patch on its cheeks and the vertical white loral patch (Sibley, 2000). The adult female is
light below, dull brownish to slate on the sides and back. The female bill is swollen to a
lesser extent than is that of the male and is without bright coloring (Figure 9) (Guiguet,
1978).
3.4 Bird Data Analysis
The data were recorded initially in the field notebook, and then transferred over to a
Microsoft Excel database. Data were analyzed to determine trends in abundance and
distribution of Barrow’s Goldeneye and Surf Scoters in the overall study area from
October 13, 2004 – April 13, 2005. Data were also analyzed to identify trends in sex
ratios as well as juvenile, and pair abundance in both species. Data collected on all other
marine species were analyzed to identify trends in abundance and distribution. Excel was
used to create histograms.
Stanley Park Barrow’s Goldeneye and Surf Scoter Survey, 2004 - 2005
19
Researchers: Colin Bailey and Stacey Carter
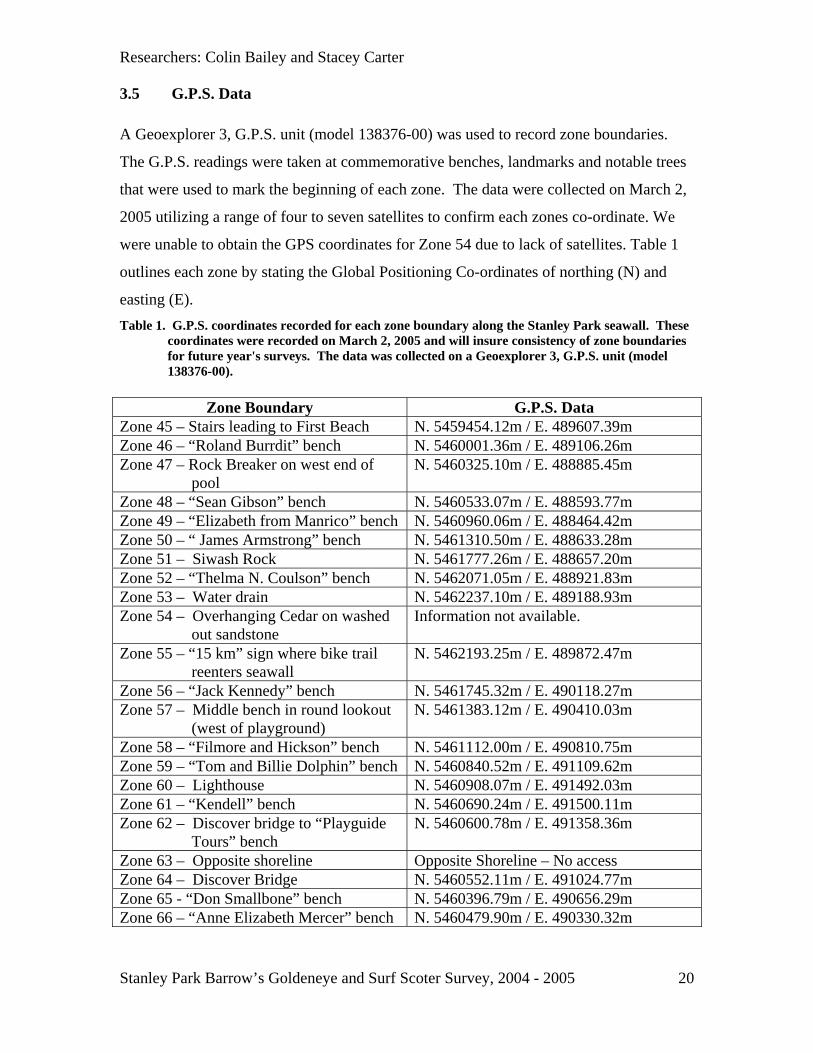
3.5 G.P.S. Data A Geoexplorer 3, G.P.S. unit (model 138376-00) was used to record zone boundaries.
The G.P.S. readings were taken at commemorative benches, landmarks and notable trees
that were used to mark the beginning of each zone. The data were collected on March 2,
2005 utilizing a range of four to seven satellites to confirm each zones co-ordinate. We
were unable to obtain the GPS coordinates for Zone 54 due to lack of satellites. Table 1
outlines each zone by stating the Global Positioning Co-ordinates of northing (N) and
easting (E). Table 1. G.P.S. coordinates recorded for each zone boundary along the Stanley Park seawall. These
coordinates were recorded on March 2, 2005 and will insure consistency of zone boundaries for future year's surveys. The data was collected on a Geoexplorer 3, G.P.S. unit (model 138376-00).
Zone Boundary G.P.S. Data Zone 45 – Stairs leading to First Beach N. 5459454.12m / E. 489607.39m Zone 46 – “Roland Burrdit” bench N. 5460001.36m / E. 489106.26m Zone 47 – Rock Breaker on west end of
pool N. 5460325.10m / E. 488885.45m
Zone 48 – “Sean Gibson” bench N. 5460533.07m / E. 488593.77m Zone 49 – “Elizabeth from Manrico” bench N. 5460960.06m / E. 488464.42m Zone 50 – “ James Armstrong” bench N. 5461310.50m / E. 488633.28m Zone 51 – Siwash Rock N. 5461777.26m / E. 488657.20m Zone 52 – “Thelma N. Coulson” bench N. 5462071.05m / E. 488921.83m Zone 53 – Water drain N. 5462237.10m / E. 489188.93m Zone 54 – Overhanging Cedar on washed
out sandstone Information not available.
Zone 55 – “15 km” sign where bike trail reenters seawall
N. 5462193.25m / E. 489872.47m
Zone 56 – “Jack Kennedy” bench N. 5461745.32m / E. 490118.27m Zone 57 – Middle bench in round lookout
(west of playground) N. 5461383.12m / E. 490410.03m
Zone 58 – “Filmore and Hickson” bench N. 5461112.00m / E. 490810.75m Zone 59 – “Tom and Billie Dolphin” bench N. 5460840.52m / E. 491109.62m Zone 60 – Lighthouse N. 5460908.07m / E. 491492.03m Zone 61 – “Kendell” bench N. 5460690.24m / E. 491500.11m Zone 62 – Discover bridge to “Playguide
Tours” bench N. 5460600.78m / E. 491358.36m
Zone 63 – Opposite shoreline Opposite Shoreline – No access Zone 64 – Discover Bridge N. 5460552.11m / E. 491024.77m Zone 65 - “Don Smallbone” bench N. 5460396.79m / E. 490656.29m Zone 66 – “Anne Elizabeth Mercer” bench N. 5460479.90m / E. 490330.32m
Stanley Park Barrow’s Goldeneye and Surf Scoter Survey, 2004 - 2005
20
Researchers: Colin Bailey and Stacey Carter
4.0 Results and Discussion
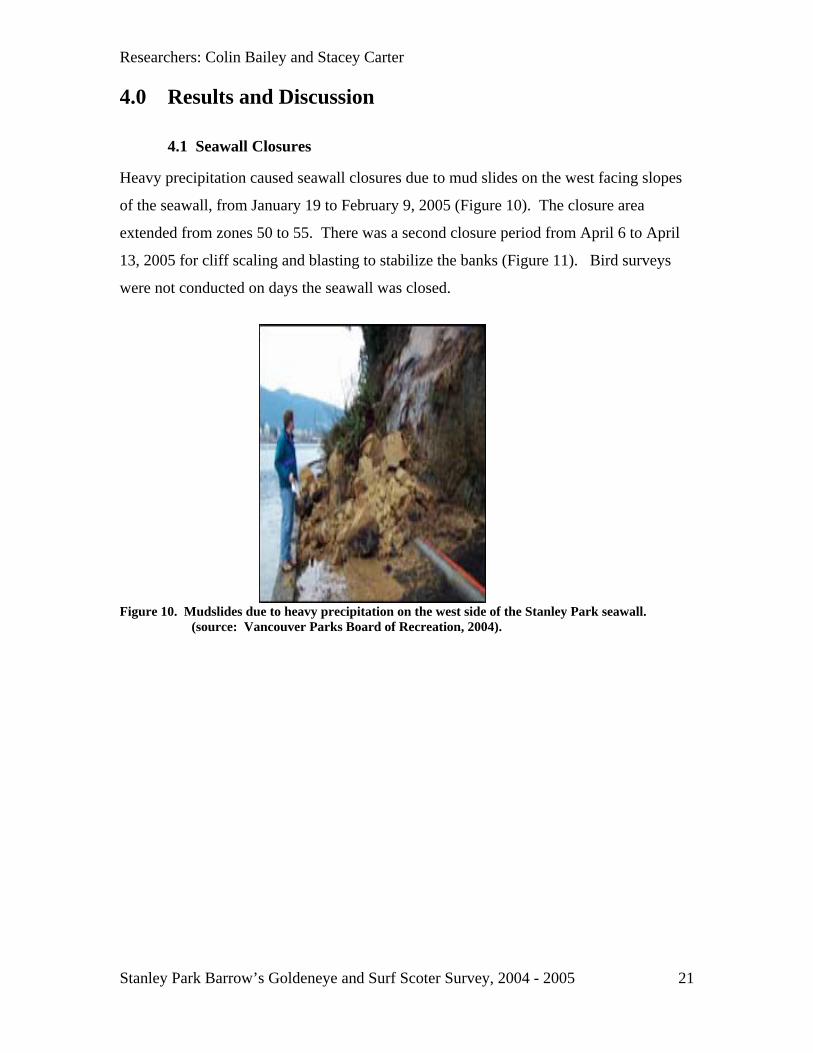
4.1 Seawall Closures
Heavy precipitation caused seawall closures due to mud slides on the west facing slopes
of the seawall, from January 19 to February 9, 2005 (Figure 10). The closure area
extended from zones 50 to 55. There was a second closure period from April 6 to April
13, 2005 for cliff scaling and blasting to stabilize the banks (Figure 11). Bird surveys
were not conducted on days the seawall was closed.
Figure 10. Mudslides due to heavy precipitation on the west side of the Stanley Park seawall.
(source: Vancouver Parks Board of Recreation, 2004).
Stanley Park Barrow’s Goldeneye and Surf Scoter Survey, 2004 - 2005
21
Researchers: Colin Bailey and Stacey Carter
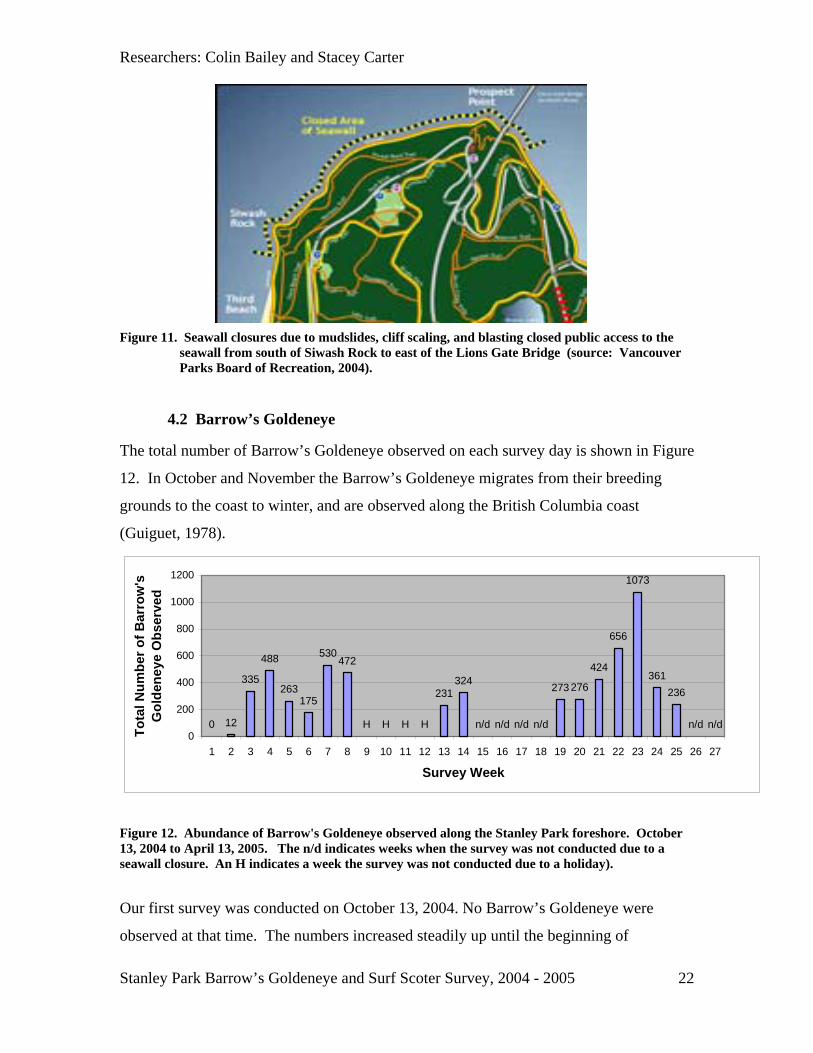
Figure 11. Seawall closures due to mudslides, cliff scaling, and blasting closed public access to the
seawall from south of Siwash Rock to east of the Lions Gate Bridge (source: Vancouver Parks Board of Recreation, 2004).
4.2 Barrow’s Goldeneye
The total number of Barrow’s Goldeneye observed on each survey day is shown in Figure
12. In October and November the Barrow’s Goldeneye migrates from their breeding
grounds to the coast to winter, and are observed along the British Columbia coast
(Guiguet, 1978).
0 12
335
488
263175
530472
231324 273 276
424
656
1073
361236
n/d n/d n/d n/d n/d n/dH H HH0
200
400
600
800
1000
1200
1 2 3 4 5 6 7 8 9 10 11 12 13 14 15 16 17 18 19 20 21 22 23 24 25 26 27
Survey Week
Tota
l Num
ber o
f Bar
row
's
Gol
dene
ye O
bser
ved
Figure 12. Abundance of Barrow's Goldeneye observed along the Stanley Park foreshore. October 13, 2004 to April 13, 2005. The n/d indicates weeks when the survey was not conducted due to a seawall closure. An H indicates a week the survey was not conducted due to a holiday).
Our first survey was conducted on October 13, 2004. No Barrow’s Goldeneye were
observed at that time. The numbers increased steadily up until the beginning of
Stanley Park Barrow’s Goldeneye and Surf Scoter Survey, 2004 - 2005
22
Researchers: Colin Bailey and Stacey Carter
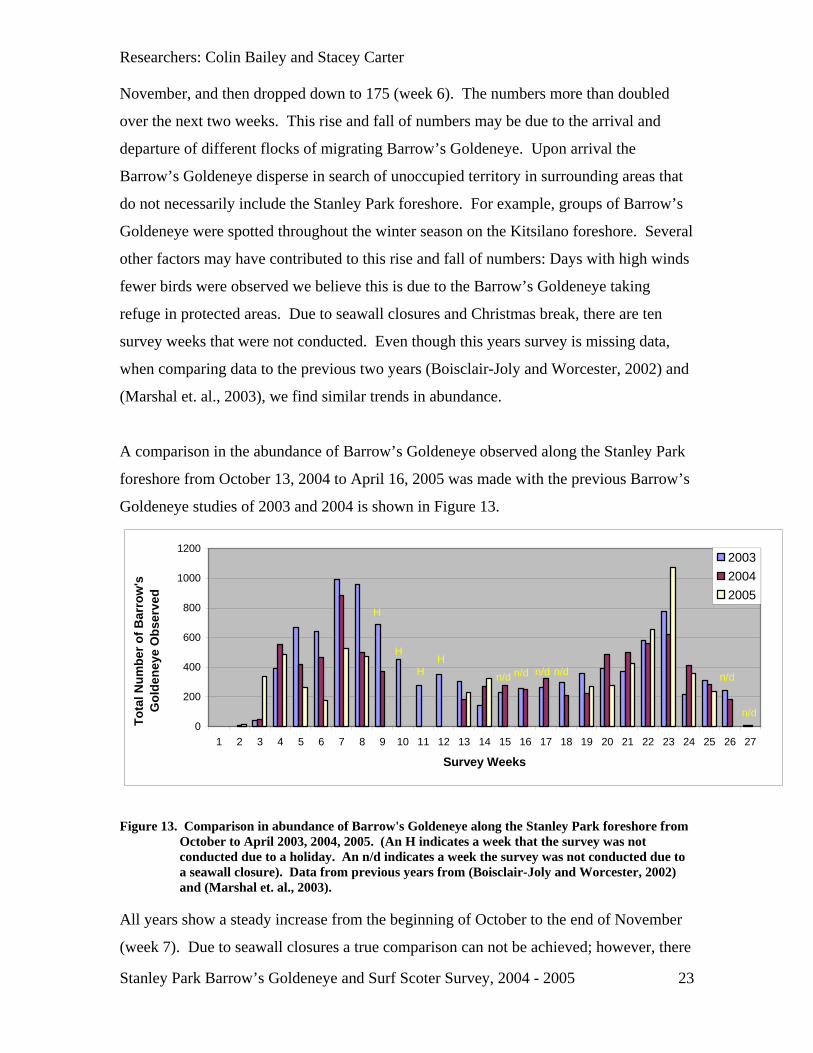
November, and then dropped down to 175 (week 6). The numbers more than doubled
over the next two weeks. This rise and fall of numbers may be due to the arrival and
departure of different flocks of migrating Barrow’s Goldeneye. Upon arrival the
Barrow’s Goldeneye disperse in search of unoccupied territory in surrounding areas that
do not necessarily include the Stanley Park foreshore. For example, groups of Barrow’s
Goldeneye were spotted throughout the winter season on the Kitsilano foreshore. Several
other factors may have contributed to this rise and fall of numbers: Days with high winds
fewer birds were observed we believe this is due to the Barrow’s Goldeneye taking
refuge in protected areas. Due to seawall closures and Christmas break, there are ten
survey weeks that were not conducted. Even though this years survey is missing data,
when comparing data to the previous two years (Boisclair-Joly and Worcester, 2002) and
(Marshal et. al., 2003), we find similar trends in abundance.
A comparison in the abundance of Barrow’s Goldeneye observed along the Stanley Park
foreshore from October 13, 2004 to April 16, 2005 was made with the previous Barrow’s
Goldeneye studies of 2003 and 2004 is shown in Figure 13.
0
200
400
600
800
1000
1200
1 2 3 4 5 6 7 8 9 10 11 12 13 14 15 16 17 18 19 20 21 22 23 24 25 26 27
Survey Weeks
Tota
l Num
ber o
f Bar
row
's
Gol
dene
ye O
bser
ved
200320042005
n/d
n/d
n/dn/dn/d n/dH
H
H
H
Figure 13. Comparison in abundance of Barrow's Goldeneye along the Stanley Park foreshore from
October to April 2003, 2004, 2005. (An H indicates a week that the survey was not conducted due to a holiday. An n/d indicates a week the survey was not conducted due to a seawall closure). Data from previous years from (Boisclair-Joly and Worcester, 2002) and (Marshal et. al., 2003).
All years show a steady increase from the beginning of October to the end of November
(week 7). Due to seawall closures a true comparison can not be achieved; however, there
Stanley Park Barrow’s Goldeneye and Surf Scoter Survey, 2004 - 2005
23
Researchers: Colin Bailey and Stacey Carter
is enough data to identify a relatively similar set of trends from year to year. The number
of Barrow’s Goldeneye observed started to decrease in November yet increase in
February to peak at 1,073 Barrow’s Goldeneye observed on March 16, 2005. This peak
in the twenty-third survey week is consistent with the 2003 and 2004 previous Barrow’s
Goldeneye surveys. Our personal opinion is this peak is due to flocks of Barrow’s
Goldeneye arriving from farther south wintering grounds (e.g. Washington, Oregon,
California) and using the Stanley Park foreshore for staging on route to their breeding
grounds.
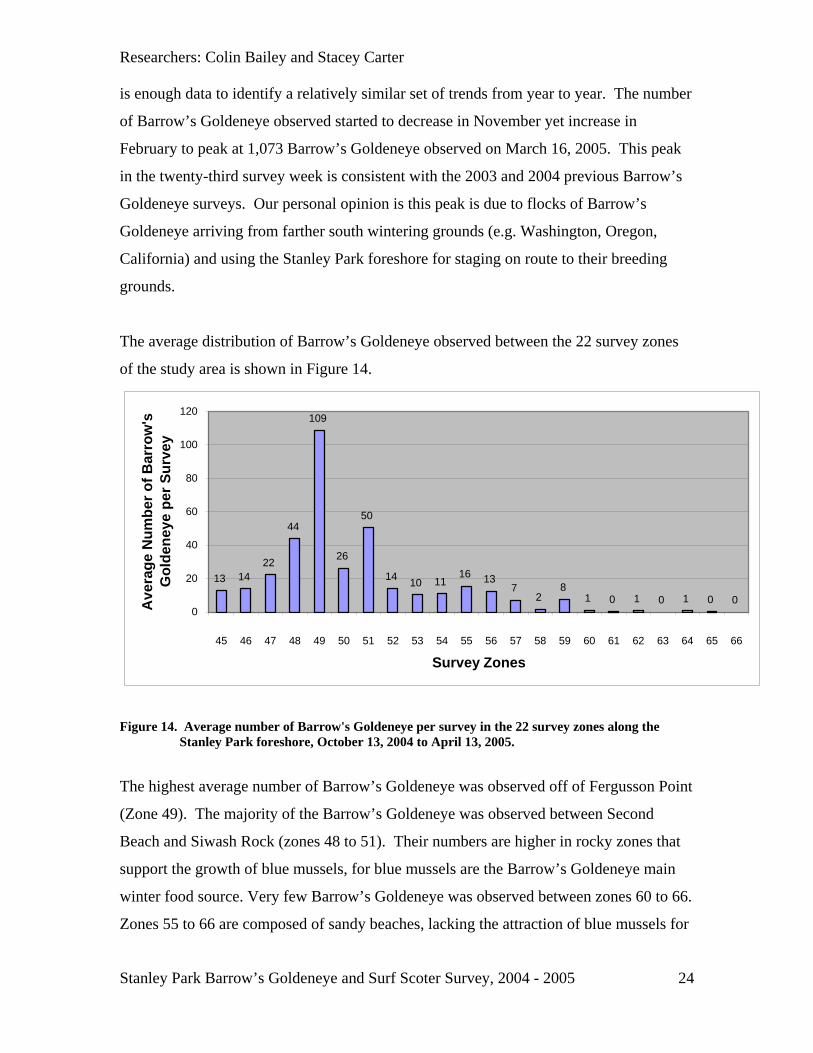
The average distribution of Barrow’s Goldeneye observed between the 22 survey zones
of the study area is shown in Figure 14.
13 1422
44
109
26
50
14 10 1116 13
72
81 0 1 0 1 0 0
0
20
40
60
80
100
120
45 46 47 48 49 50 51 52 53 54 55 56 57 58 59 60 61 62 63 64 65 66
Survey Zones
Ave
rage
Num
ber o
f Bar
row
's
Gol
dene
ye p
er S
urve
y
Figure 14. Average number of Barrow's Goldeneye per survey in the 22 survey zones along the
Stanley Park foreshore, October 13, 2004 to April 13, 2005.
The highest average number of Barrow’s Goldeneye was observed off of Fergusson Point
(Zone 49). The majority of the Barrow’s Goldeneye was observed between Second
Beach and Siwash Rock (zones 48 to 51). Their numbers are higher in rocky zones that
support the growth of blue mussels, for blue mussels are the Barrow’s Goldeneye main
winter food source. Very few Barrow’s Goldeneye was observed between zones 60 to 66.
Zones 55 to 66 are composed of sandy beaches, lacking the attraction of blue mussels for
Stanley Park Barrow’s Goldeneye and Surf Scoter Survey, 2004 - 2005
24
Researchers: Colin Bailey and Stacey Carter
the Barrow’s Goldeneye. It is important to note that the numbers in Figure 14 are under
estimated due to ten weeks of survey data that was not conducted due to holidays and
seawall closures.
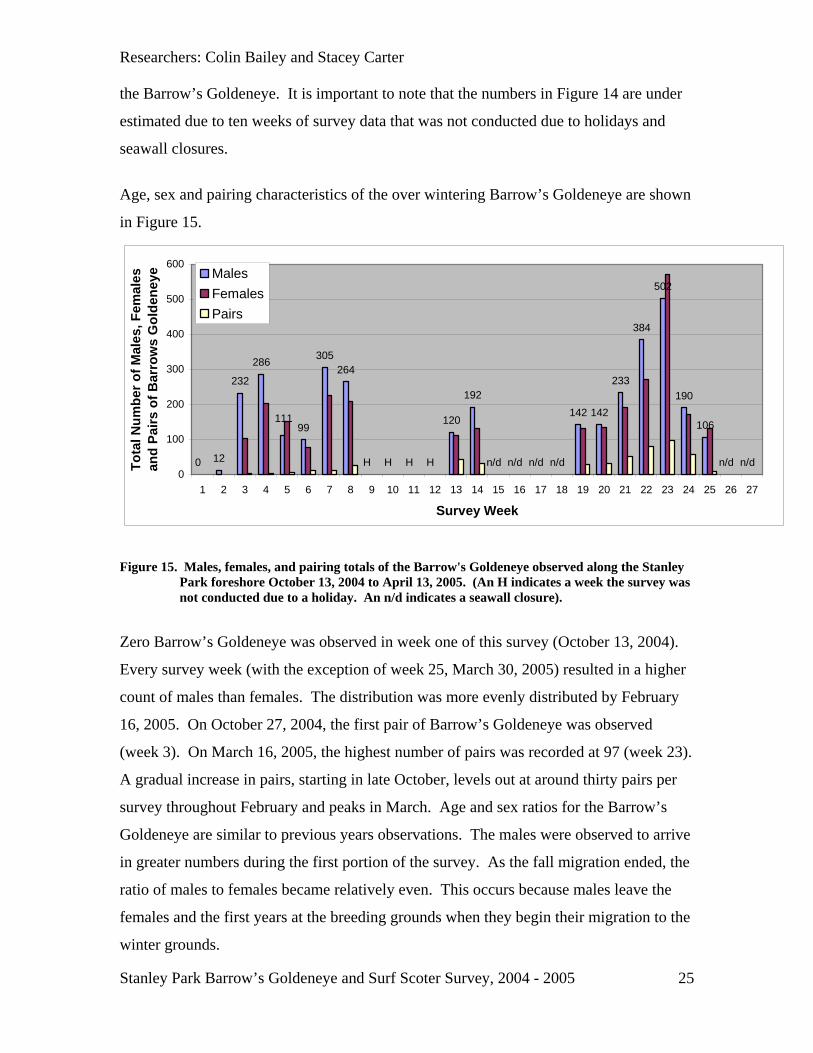
Age, sex and pairing characteristics of the over wintering Barrow’s Goldeneye are shown
in Figure 15.
0 12
232
286
99
305264
120
192142 142
233
384
502
190
106111
n/dn/dn/dn/dn/dn/dHHHH0
100
200
300
400
500
600
1 2 3 4 5 6 7 8 9 10 11 12 13 14 15 16 17 18 19 20 21 22 23 24 25 26 27
Survey Week
Tota
l Num
ber o
f Mal
es, F
emal
es
and
Pairs
of B
arro
ws
Gol
dene
ye MalesFemalesPairs
Figure 15. Males, females, and pairing totals of the Barrow's Goldeneye observed along the Stanley
Park foreshore October 13, 2004 to April 13, 2005. (An H indicates a week the survey was not conducted due to a holiday. An n/d indicates a seawall closure).
Zero Barrow’s Goldeneye was observed in week one of this survey (October 13, 2004).
Every survey week (with the exception of week 25, March 30, 2005) resulted in a higher
count of males than females. The distribution was more evenly distributed by February
16, 2005. On October 27, 2004, the first pair of Barrow’s Goldeneye was observed
(week 3). On March 16, 2005, the highest number of pairs was recorded at 97 (week 23).
A gradual increase in pairs, starting in late October, levels out at around thirty pairs per
survey throughout February and peaks in March. Age and sex ratios for the Barrow’s
Goldeneye are similar to previous years observations. The males were observed to arrive
in greater numbers during the first portion of the survey. As the fall migration ended, the
ratio of males to females became relatively even. This occurs because males leave the
females and the first years at the breeding grounds when they begin their migration to the
winter grounds.
Stanley Park Barrow’s Goldeneye and Surf Scoter Survey, 2004 - 2005
25
Researchers: Colin Bailey and Stacey Carter
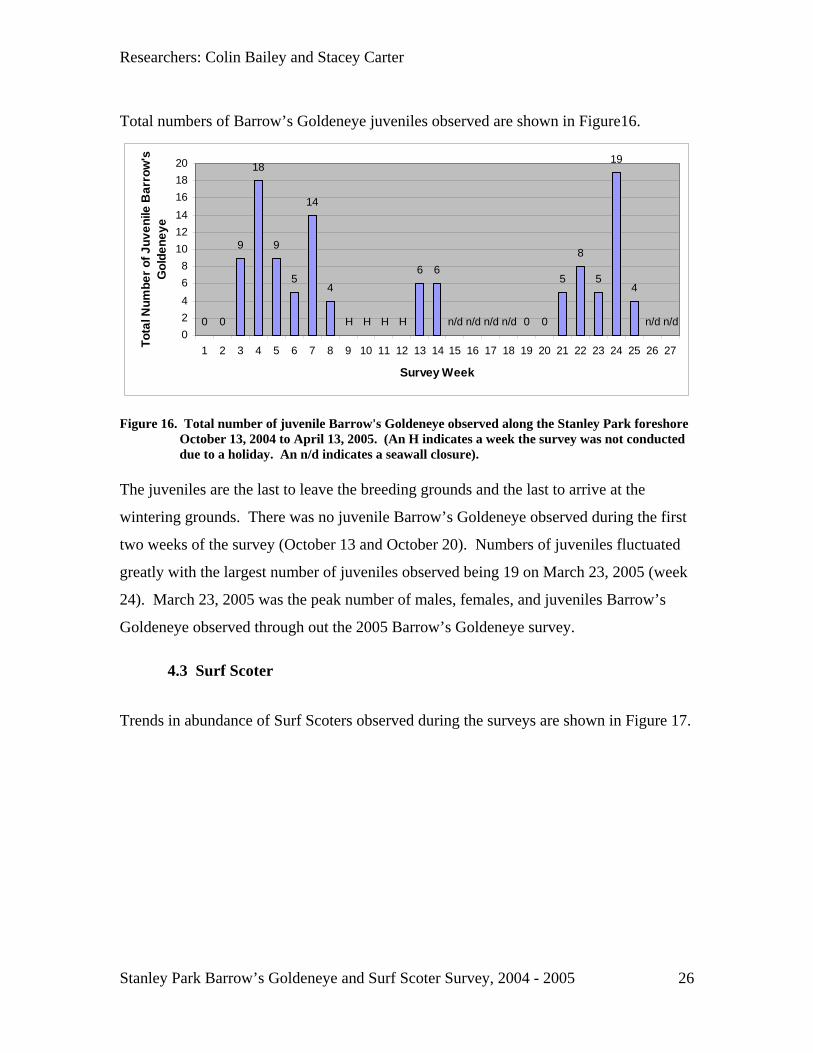
Total numbers of Barrow’s Goldeneye juveniles observed are shown in Figure16.
0 0
9
18
9
5
14
46 6
5
8
5
19
4
n/dn/dHHHH 00n/dn/dn/dn/d02468
101214161820
1 2 3 4 5 6 7 8 9 10 11 12 13 14 15 16 17 18 19 20 21 22 23 24 25 26 27
Survey Week
Tota
l Num
ber o
f Juv
enile
Bar
row
'sG
olde
neye
Figure 16. Total number of juvenile Barrow's Goldeneye observed along the Stanley Park foreshore
October 13, 2004 to April 13, 2005. (An H indicates a week the survey was not conducted due to a holiday. An n/d indicates a seawall closure).
The juveniles are the last to leave the breeding grounds and the last to arrive at the
wintering grounds. There was no juvenile Barrow’s Goldeneye observed during the first
two weeks of the survey (October 13 and October 20). Numbers of juveniles fluctuated
greatly with the largest number of juveniles observed being 19 on March 23, 2005 (week
24). March 23, 2005 was the peak number of males, females, and juveniles Barrow’s
Goldeneye observed through out the 2005 Barrow’s Goldeneye survey.
4.3 Surf Scoter
Trends in abundance of Surf Scoters observed during the surveys are shown in Figure 17.
Stanley Park Barrow’s Goldeneye and Surf Scoter Survey, 2004 - 2005
26
Researchers: Colin Bailey and Stacey Carter
973
211 1640 2 35 61 26 21 14 5
110232
1147
170HHHH n/d n/d n/d n/d n/d n/d
2675
1270
0
500
1000
1500
2000
2500
3000
1 2 3 4 5 6 7 8 9 10 11 12 13 14 15 16 17 18 19 20 21 22 23 24 25 26 27Survey week
Tota
l num
ber o
f Sur
f Sco
ters
Obs
erve
d 2005
Figure 17. Total number of Surf Scoters observed along the Stanley Park foreshore from October
13, 2004 to April 13, 2005. (An H indicates a week the survey was not conducted due to a holiday. An n/d indicates a seawall closure).
In April and May Surf Scoters migrate from the southern wintering grounds to the
breeding-grounds, moving north again in late September and October, (Guiguet, 1978).
This corresponds with our survey observations, which found a population of Surf Scoters
to already be present in early October. Surf Scoter numbers grew to a maximum in the
beginning of November reaching 2,675, and than declined in December to 1,147.
Christmas break and seawall closures create a four week gap in data. On January 5,
2005, there were zero surf scoters observed (week 13). The following week there were
only two Surf scoters observed (week 14). The peak abundance in early fall may be
accounted for by the Surf Scoters using the Stanley Park foreshore as a staging area
before continuing south on their migration towards other southern wintering grounds. An
increase in Surf Scoters in February and March may be explained by these birds staging
on the northward migration to their breeding grounds. These trends are similar, when
comparing this year’s data with 2003, and 2004 data (Boisclair-Joly and Worcester,
2002) and (Marshal et. al., 2003).
Stanley Park Barrow’s Goldeneye and Surf Scoter Survey, 2004 - 2005
27
Researchers: Colin Bailey and Stacey Carter
A comparison in the abundance of Surf Scoters observed along the Stanley Park
foreshore from October 13, 2004 to April 13, 2005 was made with those observed during
the studies over the same time period in 2003 and 2004. This is shown in Figure 18.
0
500
1000
1500
2000
2500
3000
3500
1 2 3 4 5 6 7 8 9 10 11 12 13 14 15 16 17 18 19 20 21 22 23 24 25 26 27
Survey Week
Tota
l Num
ber o
f Sur
f Sco
ters
Obs
erve
d 20032004
2005
H HH
H
n/d n/d
n/d n/d
n/d
n/d
Figure 18. Comparison of Surf Scoter abundance along the Stanley Park foreshore from October to
mid April 2003, 2004, 2005. Previous years data from (Boisclair-Joly and Worcester, 2002) and (Marshal et. al., 2003). (An H indicates a week the survey was not conducted due to a holiday. An n/d indicates a seawall closure).
There is a great deal of variability between the numbers observed during the three years
of the survey, however there is an identifiable trend throughout most of the data. For all
three years, Surf Scoter abundance is at its highest between mid October, and the end of
November (weeks 2 to 7). The maximum amount of Surf Scoters ranges from 2,675 in
2005 to 3,167 Surf Scoters in 2003. Although the gaps in this years data clouds the trend,
it is still evident that the numbers decline steadily between the end of November to the
end of December (weeks 7 to 10). The total number of surf Scoters levels out at
relatively low numbers during the following 12 weeks.
The distribution of Surf Scoters observed within the 22 survey zones of the study area is
shown in Figure 19.
Stanley Park Barrow’s Goldeneye and Surf Scoter Survey, 2004 - 2005
28
Researchers: Colin Bailey and Stacey Carter
1 1 2
159
110
11
125
720
51
2814
1 0 0 0 0 0 0 0 0 00
20406080
100120140160180
45 46 47 48 49 50 51 52 53 54 55 56 57 58 59 60 61 62 63 64 65 66
Survey Zone
Ave
rage
Num
ber o
f Sur
f Sc
oter
s pe
r Sur
vey
Figure 19. Distribution of Surf Scoter along the 22 survey zones of the Stanley Park foreshore from
October 13, 2004 to April 13, 2005.
The majority of Surf Scoters were observed between Second Beach and Siwash Rock
(zones 48 to 51). The remainder Surf Scoters was observed in zones 52 to 57. An
average of four Surf Scoters was observed between zones 45 and 47. Surf Scoters are
attracted to rocky locations and remain in these areas feeding on the blue mussel beds
that grow on the rocks and on the seawall itself. Zones 55 to 66 mainly composed of
sandy beaches, lacking an abundant supply of blue mussels for the Surf Scoters to feed
on. It is important to note that the numbers in Figure 19 are under estimated due to ten
weeks of survey data that was not conducted due to holidays and seawall closures.
Observations regarding the age, sex, and pair characteristics of the Surf Scoter are shown
in Figure 20.
Stanley Park Barrow’s Goldeneye and Surf Scoter Survey, 2004 - 2005
29
Researchers: Colin Bailey and Stacey Carter
0
200
400
600
800
1000
1200
1400
1600
1800
1 2 3 4 5 6 7 8 9 10 11 12 13 14 15 16 17 18 19 20 21 22 23 24 25 26 27
Survey Week
Tota
l Num
ber o
f Mal
e, F
emal
e, a
nd P
aire
d Su
rf S
cote
rs O
bser
ved
MaleFemalePairs
HH H H n/d n/d n/d n/d n/d n/d
Figure 20. Abundance of male, female and paired Surf Scoters along the Stanley Park foreshore
from October 13, 2004 to April 13, 2005. (An H indicates a week the survey was not conducted due to a holiday. An n/d indicated a week the survey was not conducted due to a seawall closure)
Throughout the survey, there were far more males observed than females. Due to a lack
of data, it is difficult to identify clear trends, however it appears that the ratio becomes
relatively even by February (week 19). Five pairs (this number is to small to show on the
above histogram) of Surf Scoters were observed between November 24 and December 4,
2004 (weeks 7 to 8). From February 16th (week 19) to March 30th (week 27) only 10 pairs
of Surf Scoters were observed. Zero Surf Scoters were found in week 13, and only two
male Surf Scoters were observed in week 14. Age and sex ratios for the Surf Scoter are
similar to previous year’s observations (Boisclair-Joly and Worcester, 2002) and
(Marshal et. al., 2003). The males arrived first followed by the females. This is a result
of the males leaving the breeding grounds first. As the fall migration ended, the ratio
became relatively even.
Stanley Park Barrow’s Goldeneye and Surf Scoter Survey, 2004 - 2005
30
Researchers: Colin Bailey and Stacey Carter
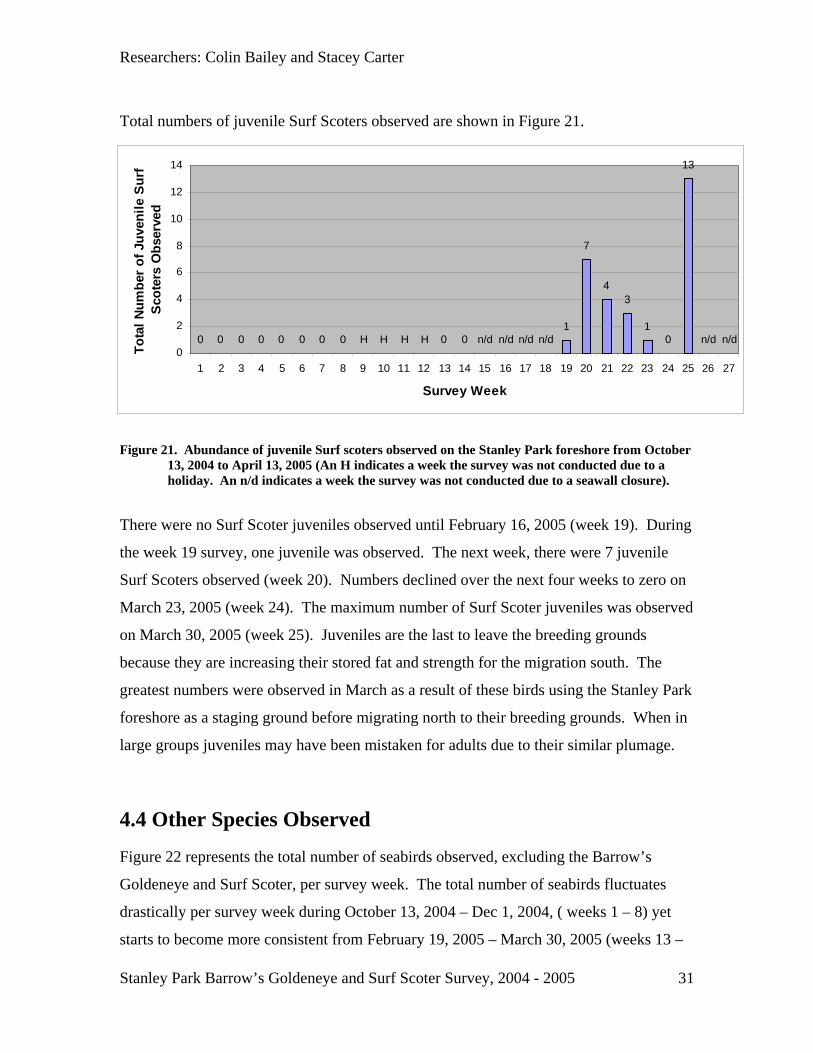
Total numbers of juvenile Surf Scoters observed are shown in Figure 21.
n/dn/dH H H H n/d n/d n/d0 0 0 0 0 0 0 0 0 0 01
34
13
7
1n/d
0
2
4
6
8
10
12
14
1 2 3 4 5 6 7 8 9 10 11 12 13 14 15 16 17 18 19 20 21 22 23 24 25 26 27
Survey Week
Tota
l Num
ber
of J
uven
ile S
urf
Scot
ers
Obs
erve
d
Figure 21. Abundance of juvenile Surf scoters observed on the Stanley Park foreshore from October
13, 2004 to April 13, 2005 (An H indicates a week the survey was not conducted due to a holiday. An n/d indicates a week the survey was not conducted due to a seawall closure).
There were no Surf Scoter juveniles observed until February 16, 2005 (week 19). During
the week 19 survey, one juvenile was observed. The next week, there were 7 juvenile
Surf Scoters observed (week 20). Numbers declined over the next four weeks to zero on
March 23, 2005 (week 24). The maximum number of Surf Scoter juveniles was observed
on March 30, 2005 (week 25). Juveniles are the last to leave the breeding grounds
because they are increasing their stored fat and strength for the migration south. The
greatest numbers were observed in March as a result of these birds using the Stanley Park
foreshore as a staging ground before migrating north to their breeding grounds. When in
large groups juveniles may have been mistaken for adults due to their similar plumage.
4.4 Other Species Observed
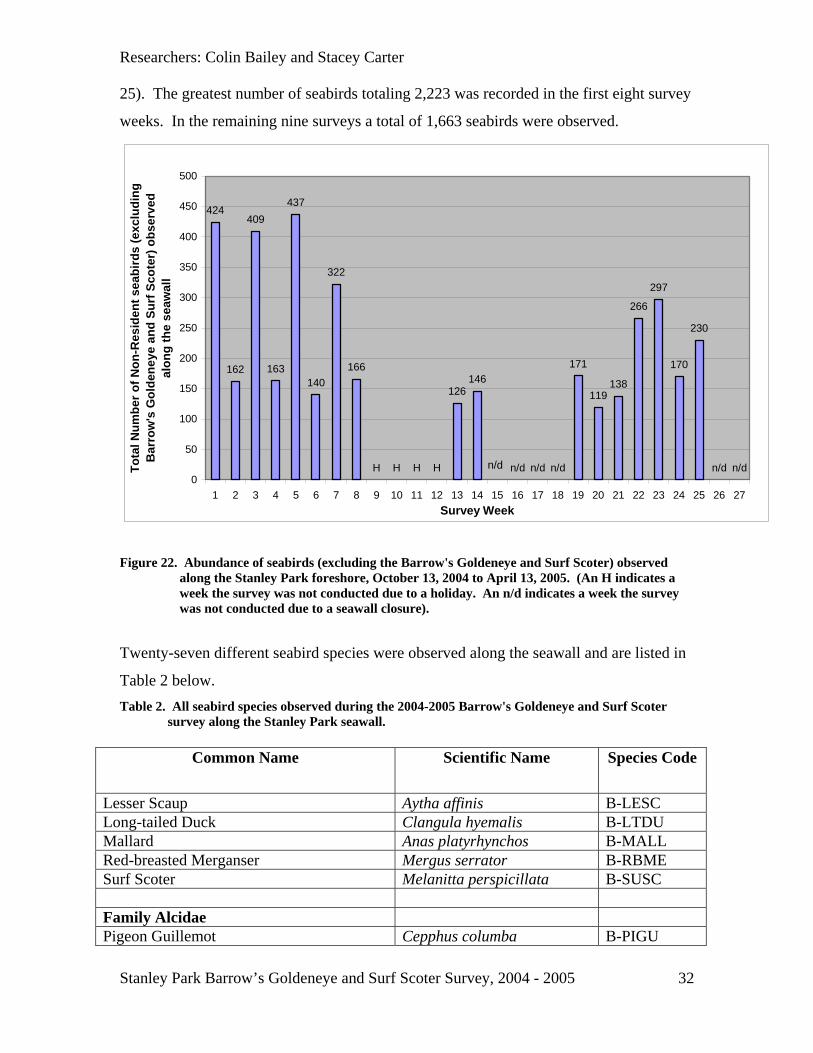
Figure 22 represents the total number of seabirds observed, excluding the Barrow’s
Goldeneye and Surf Scoter, per survey week. The total number of seabirds fluctuates
drastically per survey week during October 13, 2004 – Dec 1, 2004, ( weeks 1 – 8) yet
starts to become more consistent from February 19, 2005 – March 30, 2005 (weeks 13 –
Stanley Park Barrow’s Goldeneye and Surf Scoter Survey, 2004 - 2005
31
Researchers: Colin Bailey and Stacey Carter
25). The greatest number of seabirds totaling 2,223 was recorded in the first eight survey
weeks. In the remaining nine surveys a total of 1,663 seabirds were observed.
424
162
409
163
437
140
322
166
126146
171
119138
266
297
170
230
n/dn/dH H H H n/dn/dn/d0
50
100
150
200
250
300
350
400
450
500
1 2 3 4 5 6 7 8 9 10 11 12 13 14 15 16 17 18 19 20 21 22 23 24 25 26 27Survey Week
Tota
l Num
ber o
f Non
-Res
iden
t sea
bird
s (e
xclu
ding
B
arro
w's
Gol
dene
ye a
nd S
urf S
cote
r) o
bser
ved
alon
g th
e se
awal
l
n/d
Figure 22. Abundance of seabirds (excluding the Barrow's Goldeneye and Surf Scoter) observed
along the Stanley Park foreshore, October 13, 2004 to April 13, 2005. (An H indicates a week the survey was not conducted due to a holiday. An n/d indicates a week the survey was not conducted due to a seawall closure).
Twenty-seven different seabird species were observed along the seawall and are listed in
Table 2 below. Table 2. All seabird species observed during the 2004-2005 Barrow's Goldeneye and Surf Scoter
survey along the Stanley Park seawall.
Common Name Scientific Name Species Code
Lesser Scaup Aytha affinis B-LESC Long-tailed Duck Clangula hyemalis B-LTDU Mallard Anas platyrhynchos B-MALL Red-breasted Merganser Mergus serrator B-RBME Surf Scoter Melanitta perspicillata B-SUSC Family Alcidae Pigeon Guillemot Cepphus columba B-PIGU
Stanley Park Barrow’s Goldeneye and Surf Scoter Survey, 2004 - 2005
32
Researchers: Colin Bailey and Stacey Carter
Family Charadriidae – Plovers Killdeer Charadrius vociferus B-KILL Family Haematopodidae - Oystercatchers Black Oystercatcher Haematopus bachmani B-BLOY Family Gaviidae – Loons Common Loon Gavia immer B-COLO Red – throated Loon Gavia stellata Family Podicipedidae – Grebes Horned Grebe Podiceps auritus B-HOGR Western Grebe Aechmophorus occidentalis B-WEGR Family Phalacrocoracidae - Cormorants Double-crested Cormorant Phalacrocorax auritus B-DCCO Pelagic Cormorant Phalacrocorax pelagicus B-PECO Red-faced Cormorant Phalacrocorax urile Family Ardeidae – Herons Great Blue Heron Ardea herodias B-GBHE Family – Anatidae – Geese and Ducks American Wigeon Anas Americana B-AMWI Barrow’s Goldeneye Bucephala islandica B-BAGO Bufflehead Bucephala albeola B-BUFF Canada Goose Branta Canadensis B-CAGO Common Goldeneye Bucephala clangula B-COGO Common Merganser Mergus merganser B-COME Eurasian Wigeon Anas penelope Greater Scaup Aythya marila B-GRSC Harlequin Duck Histronicus histronicus B-HADU Hooded Merganser Lophodytes cucullatus B-HOME Family Scolopacidae – Sandpipers Dunlin Calidris alpina B-DUNL Sanderling Calidris alba B-SAND
Stanley Park Barrow’s Goldeneye and Surf Scoter Survey, 2004 - 2005
33
Researchers: Colin Bailey and Stacey Carter
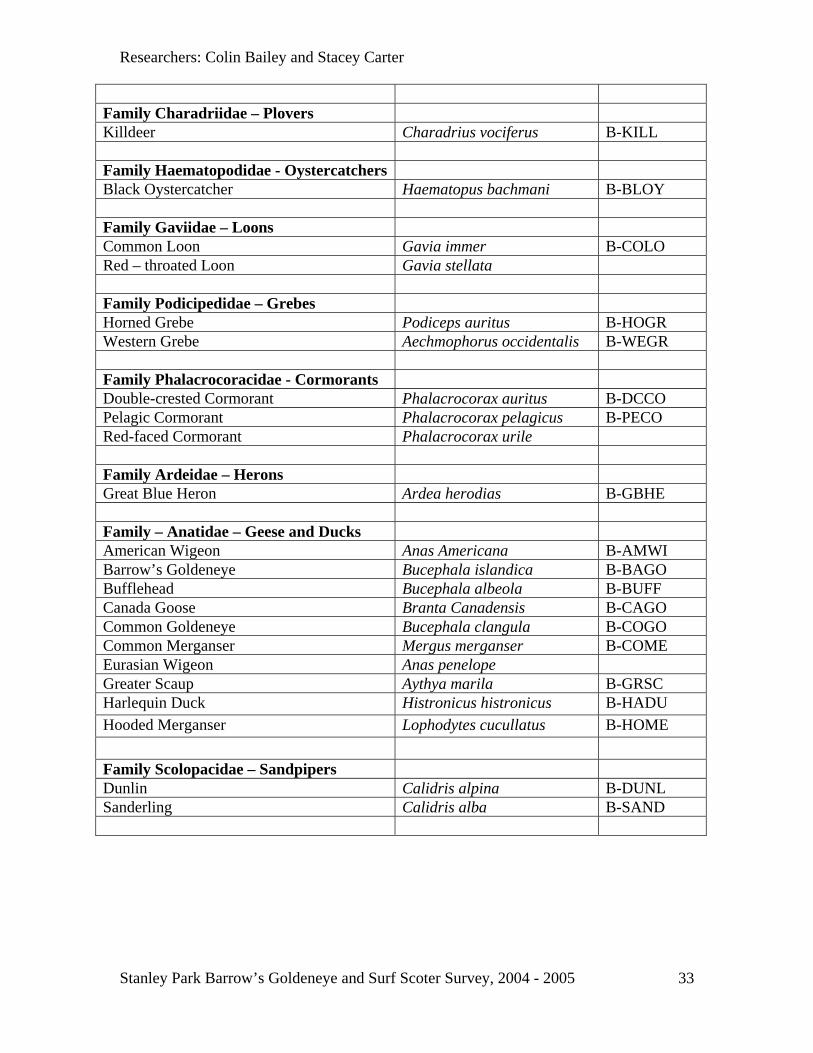
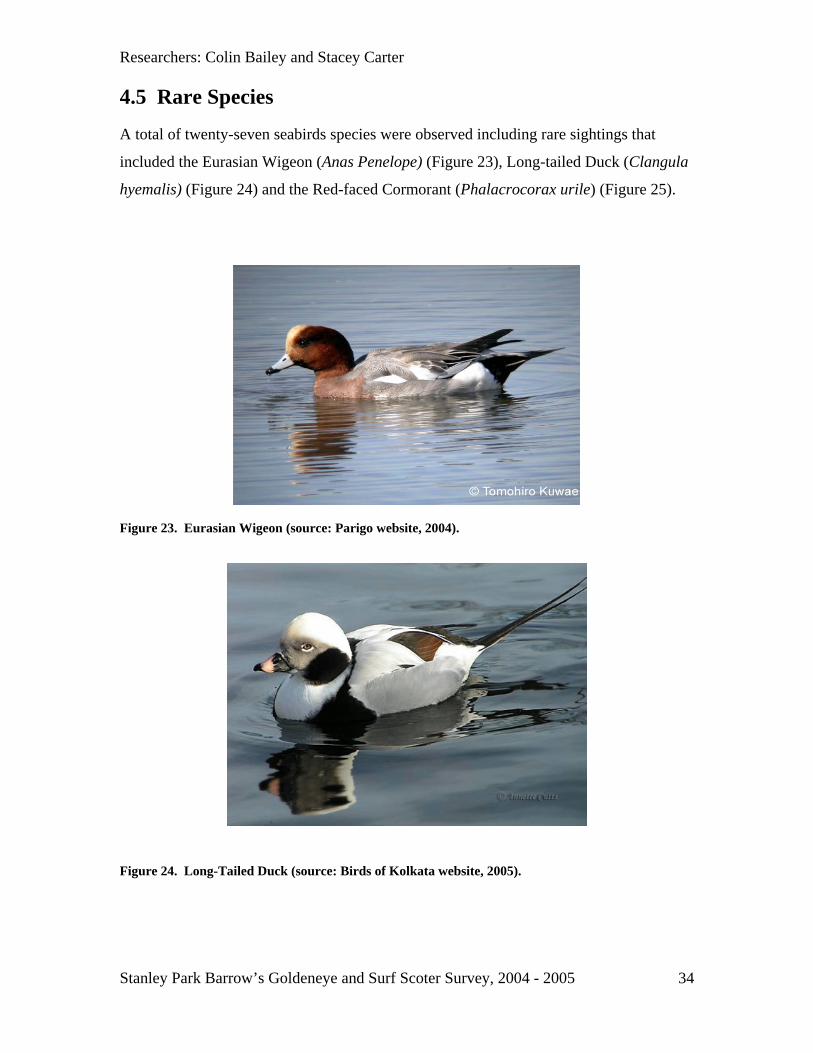
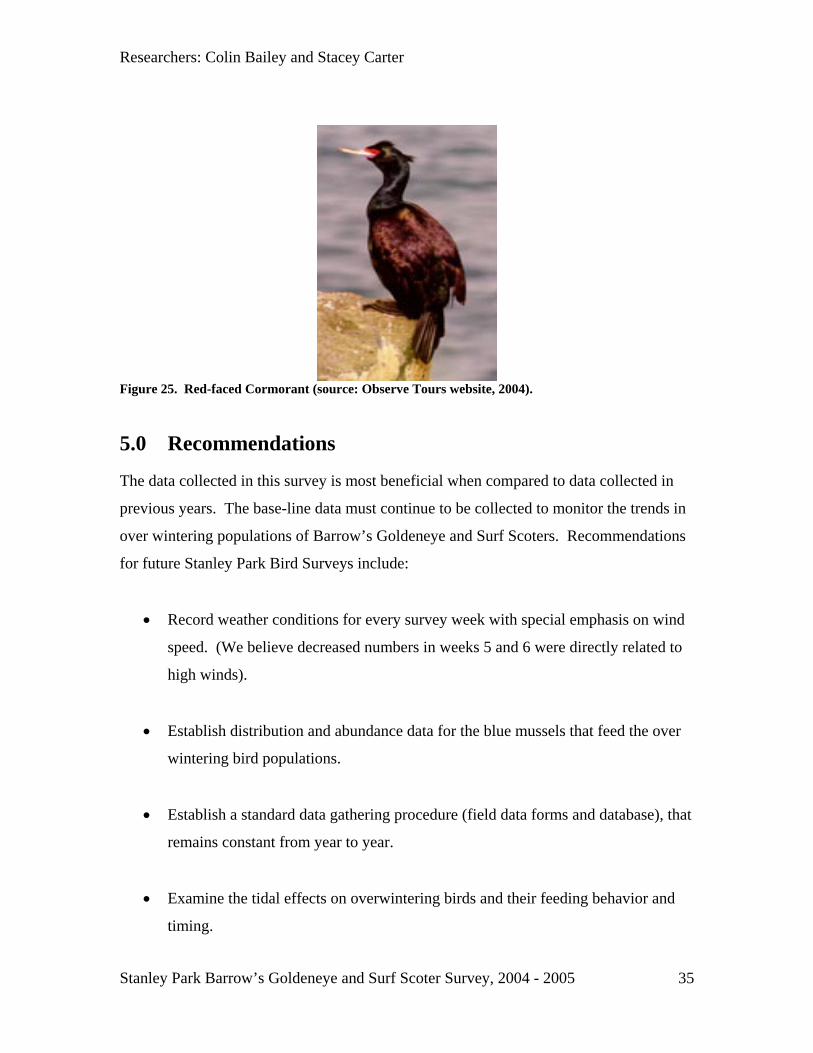
4.5 Rare Species
A total of twenty-seven seabirds species were observed including rare sightings that
included the Eurasian Wigeon (Anas Penelope) (Figure 23), Long-tailed Duck (Clangula
hyemalis) (Figure 24) and the Red-faced Cormorant (Phalacrocorax urile) (Figure 25).
Figure 23. Eurasian Wigeon (source: Parigo website, 2004).
Figure 24. Long-Tailed Duck (source: Birds of Kolkata website, 2005).
Stanley Park Barrow’s Goldeneye and Surf Scoter Survey, 2004 - 2005
34
Researchers: Colin Bailey and Stacey Carter
Figure 25. Red-faced Cormorant (source: Observe Tours website, 2004).
5.0 Recommendations
The data collected in this survey is most beneficial when compared to data collected in
previous years. The base-line data must continue to be collected to monitor the trends in
over wintering populations of Barrow’s Goldeneye and Surf Scoters. Recommendations
for future Stanley Park Bird Surveys include:
• Record weather conditions for every survey week with special emphasis on wind
speed. (We believe decreased numbers in weeks 5 and 6 were directly related to
high winds).
• Establish distribution and abundance data for the blue mussels that feed the over
wintering bird populations.
• Establish a standard data gathering procedure (field data forms and database), that
remains constant from year to year.
• Examine the tidal effects on overwintering birds and their feeding behavior and
timing.
Stanley Park Barrow’s Goldeneye and Surf Scoter Survey, 2004 - 2005
35

Researchers: Colin Bailey and Stacey Carter
6.0 References Cited
Aitchison, J. 2001. The Birder’s Guide to Vancouver and the Lower Mainland.
Vancouver: Whitecap Books. 208 p. Birds of Kolkata, 2005. www.kolkatabirds.com. Updated April, 2005. Accessed March
13, 2005. Boisclair-Joy and Worcester, 2002. Final Report: Stanley Park Barrow’s Goldeneye
Survey, 2001-2002. Projects course final report. Fish, Wildlife and Recreation Program. British Columbia Institute of Technology. Burnaby, B.C.
Environment Canada. 2004.
www.qc.ec.gc.ca/fauna/sauvagine/htnm/information_bg.html The Barrow’s Goldeneye: a vulnerable bird. Last update 2004-08-13. Accessed November 11. 2004
Guiguet, C.J. 1978. The Birds of British Columbia: (6) Waterfowl of British Columbia
Provincial Museum, Victoria. Johnsgard, P. 1975. A Guide to North American Waterfowl. Indiana University Press.
Bloomington, London. 274 pp. Learn for Life website. 2003. www.wwtlearn.org.uk/indeo.html. Accessed November
11th. 2004 Marshall S., Maerov G., and Lok E. 2003. Stanley Park Barrow’s Goldeneye Survey
2002 – 2003. Projects course final report. Fish, Wildlife and Recreation Program. British Columbia Institute of Technology. Burnaby, B.C.
National Wildlife Federation, 2004.
http://www.enature.com/fieldguide/showSpeciesAG.asp?agencyID=44&curPageNum=2&recnum=BD0409. Accessed November 11, 2004.
Observe Tours Inc., 2004. www.observtours.com/details.cfm. Updated September, 2004. Accessed March 13, 2005.
Parigo, 2004. www.parigo.jp/.../tori/hidorigamo_l.jpg. Updated June, 2004. Accessed March 13, 2005.
Rotinsky, B. 1999. Final Report: Stanley Park Barrow’s Goldeneye Survey, 1998-1999. Projects course final report. Fish, Wildlife and Recreation Program. British Columbia Institute of Technology. Burnaby, B.C.
Sibley, D. A. 2000. National Audubon Society: The Sibley Guide to Birds of North
America. Alfred A. Knopf Inc., New York. 88-93.
Stanley Park Barrow’s Goldeneye and Surf Scoter Survey, 2004 - 2005
36

Researchers: Colin Bailey and Stacey Carter
Todd, F. 1979. Waterfowl, Ducks, Geese and Swans of the World. San Diego: Sea
World Press engaged Constellation Phoenix, Inc. Vancouver Board of Parks and Recreation. 2004.
www.city.vancouver.bc.ca/parksandgardens/stanley1htm. Accessed November 11th. 2004
Watts, P. and A. Breault. 1996. Burrard Inlet Environmental Action Program (BIEAP)
Bird Survey Project: Seasonal and Spatial Trends in the Distribution and Abundance of Water Birds in Burrard Inlet. Burrard Inlet Environmental Action Program Technical Report.
Williams, C. 2000. Surf Scoter Survey: Stanley Park 1999-2000. Projects course final
Report. Fish, Wildlife and Recreation Program. British Columbia Institute of Technology, Burnaby, B.C.
Stanley Park Barrow’s Goldeneye and Surf Scoter Survey, 2004 - 2005
37
Researchers: Colin Bailey and Stacey Carter
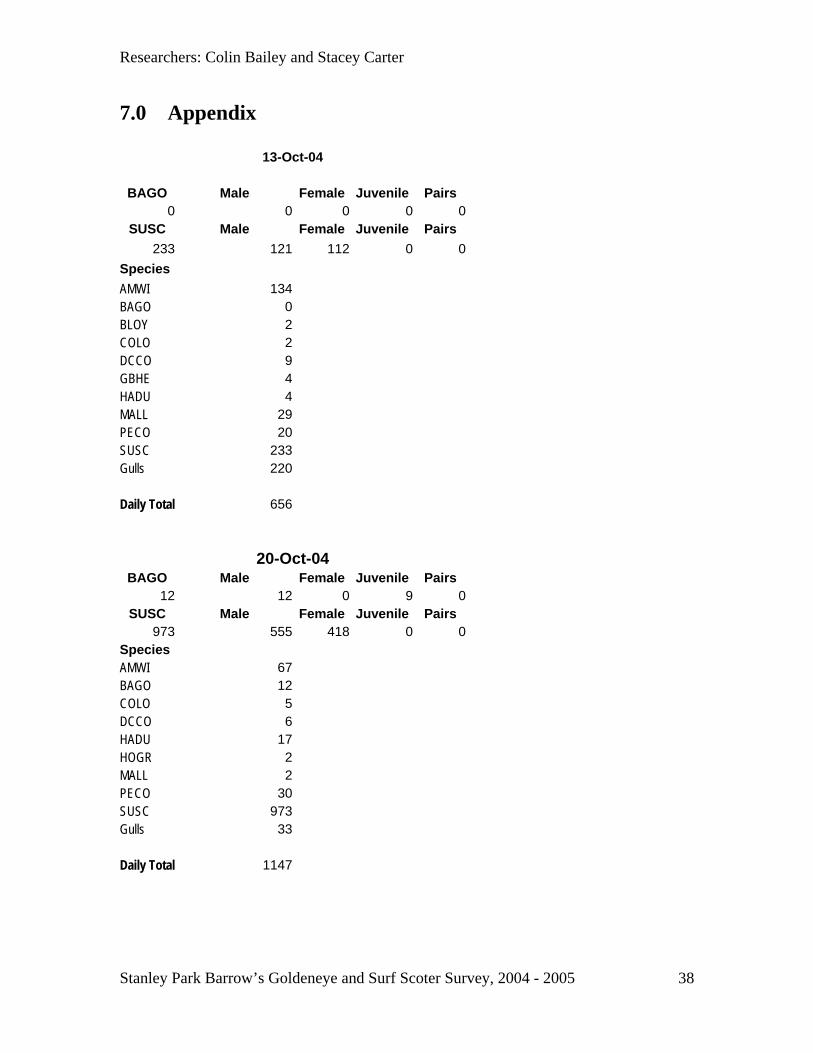
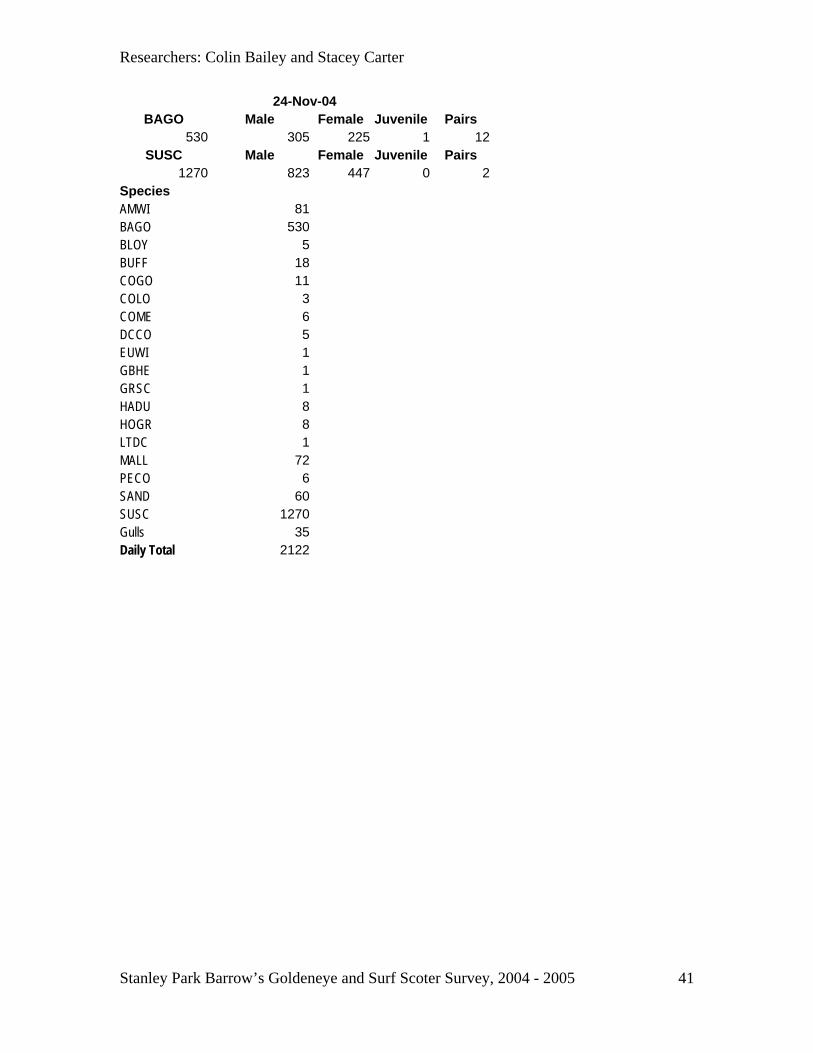
7.0 Appendix
13-Oct-04
BAGO Male Female Juvenile Pairs 0 0 0 0 0
SUSC Male Female Juvenile Pairs 233 121 112 0 0
Species AMWI 134 BAGO 0 BLOY 2 COLO 2 DCCO 9 GBHE 4 HADU 4 MALL 29 PECO 20 SUSC 233 Gulls 220 Daily Total 656
20-Oct-04
BAGO Male Female Juvenile Pairs 12 12 0 9 0
SUSC Male Female Juvenile Pairs 973 555 418 0 0
Species AMWI 67 BAGO 12 COLO 5 DCCO 6 HADU 17 HOGR 2 MALL 2 PECO 30 SUSC 973 Gulls 33 Daily Total 1147
Stanley Park Barrow’s Goldeneye and Surf Scoter Survey, 2004 - 2005
38
Researchers: Colin Bailey and Stacey Carter
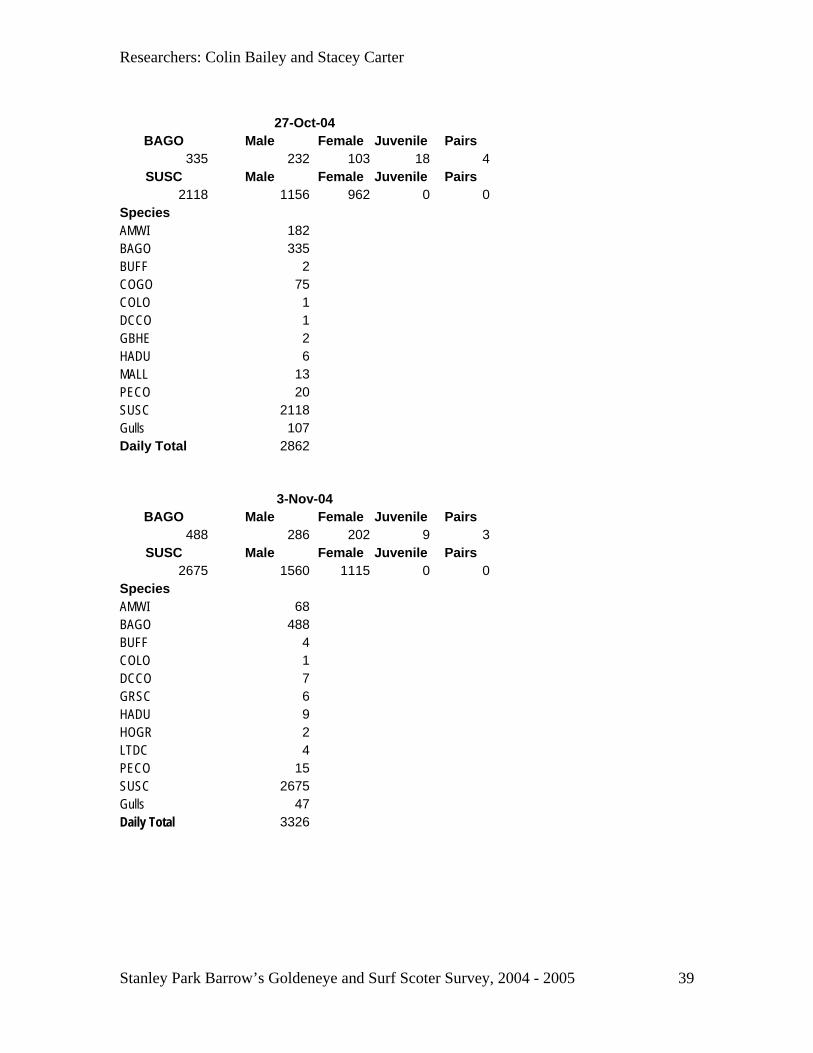
27-Oct-04 BAGO Male Female Juvenile Pairs
335 232 103 18 4SUSC Male Female Juvenile Pairs
2118 1156 962 0 0Species AMWI 182 BAGO 335 BUFF 2 COGO 75 COLO 1 DCCO 1 GBHE 2 HADU 6 MALL 13 PECO 20 SUSC 2118 Gulls 107 Daily Total 2862
3-Nov-04 BAGO Male Female Juvenile Pairs
488 286 202 9 3SUSC Male Female Juvenile Pairs
2675 1560 1115 0 0Species AMWI 68 BAGO 488 BUFF 4 COLO 1 DCCO 7 GRSC 6 HADU 9 HOGR 2 LTDC 4 PECO 15 SUSC 2675 Gulls 47 Daily Total 3326
Stanley Park Barrow’s Goldeneye and Surf Scoter Survey, 2004 - 2005
39
Researchers: Colin Bailey and Stacey Carter
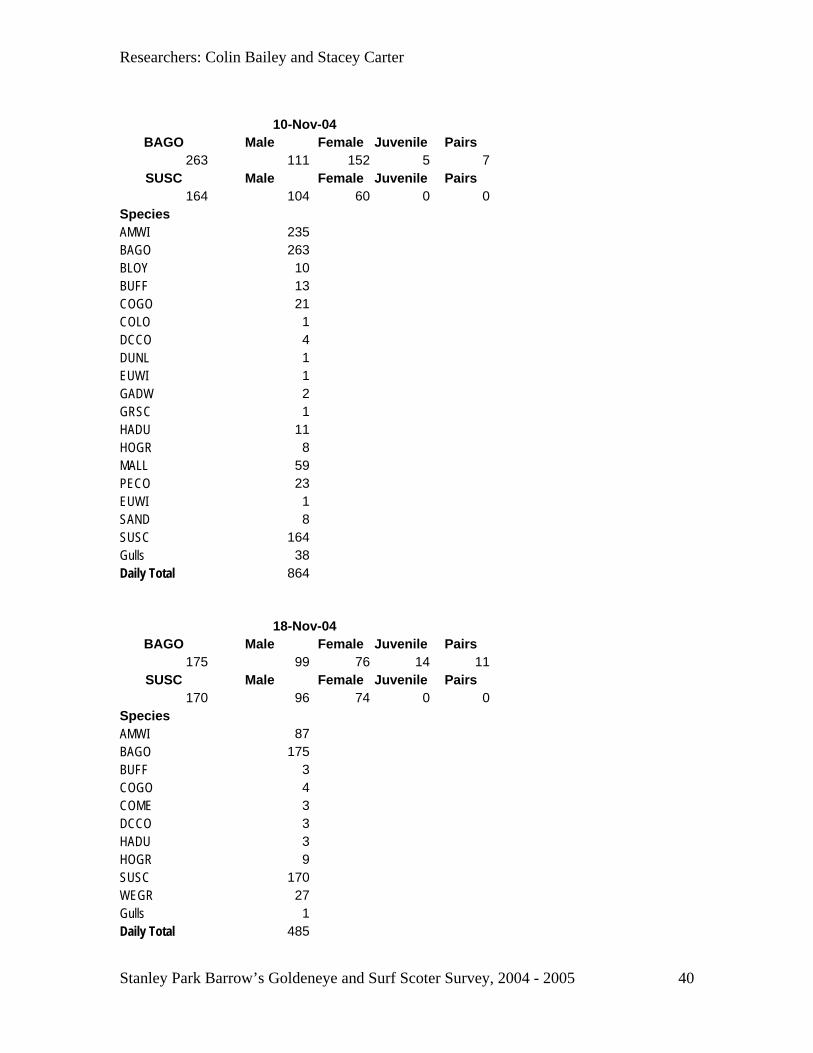
10-Nov-04 BAGO Male Female Juvenile Pairs
263 111 152 5 7SUSC Male Female Juvenile Pairs
164 104 60 0 0Species AMWI 235 BAGO 263 BLOY 10 BUFF 13 COGO 21 COLO 1 DCCO 4 DUNL 1 EUWI 1 GADW 2 GRSC 1 HADU 11 HOGR 8 MALL 59 PECO 23 EUWI 1 SAND 8 SUSC 164 Gulls 38 Daily Total 864
18-Nov-04 BAGO Male Female Juvenile Pairs
175 99 76 14 11SUSC Male Female Juvenile Pairs
170 96 74 0 0Species AMWI 87 BAGO 175 BUFF 3 COGO 4 COME 3 DCCO 3 HADU 3 HOGR 9 SUSC 170 WEGR 27 Gulls 1 Daily Total 485
Stanley Park Barrow’s Goldeneye and Surf Scoter Survey, 2004 - 2005
40
Researchers: Colin Bailey and Stacey Carter
24-Nov-04 BAGO Male Female Juvenile Pairs
530 305 225 1 12SUSC Male Female Juvenile Pairs
1270 823 447 0 2Species AMWI 81 BAGO 530 BLOY 5 BUFF 18 COGO 11 COLO 3 COME 6 DCCO 5 EUWI 1 GBHE 1 GRSC 1 HADU 8 HOGR 8 LTDC 1 MALL 72 PECO 6 SAND 60 SUSC 1270 Gulls 35 Daily Total 2122
Stanley Park Barrow’s Goldeneye and Surf Scoter Survey, 2004 - 2005
41
Researchers: Colin Bailey and Stacey Carter
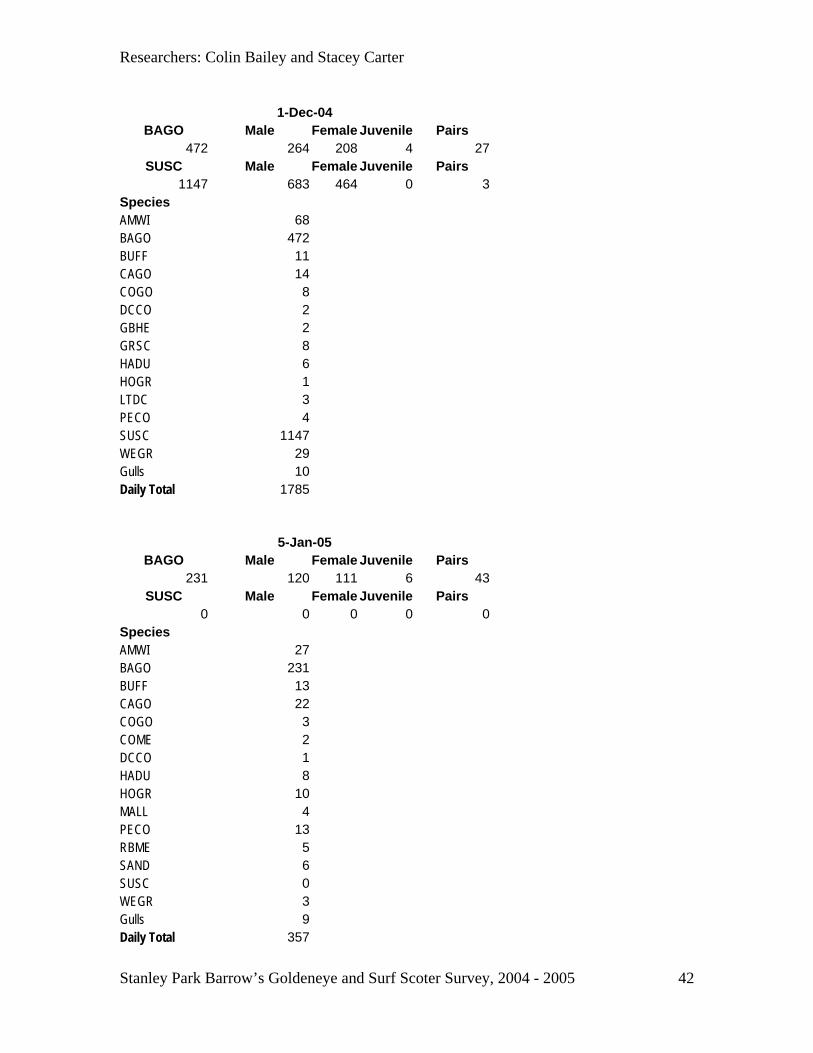
1-Dec-04
BAGO Male Female Juvenile Pairs 472 264 208 4 27
SUSC Male Female Juvenile Pairs 1147 683 464 0 3
Species AMWI 68 BAGO 472 BUFF 11 CAGO 14 COGO 8 DCCO 2 GBHE 2 GRSC 8 HADU 6 HOGR 1 LTDC 3 PECO 4 SUSC 1147 WEGR 29 Gulls 10 Daily Total 1785
5-Jan-05 BAGO Male Female Juvenile Pairs
231 120 111 6 43SUSC Male Female Juvenile Pairs
0 0 0 0 0Species AMWI 27 BAGO 231 BUFF 13 CAGO 22 COGO 3 COME 2 DCCO 1 HADU 8 HOGR 10 MALL 4 PECO 13 RBME 5 SAND 6 SUSC 0 WEGR 3 Gulls 9 Daily Total 357
Stanley Park Barrow’s Goldeneye and Surf Scoter Survey, 2004 - 2005
42
Researchers: Colin Bailey and Stacey Carter
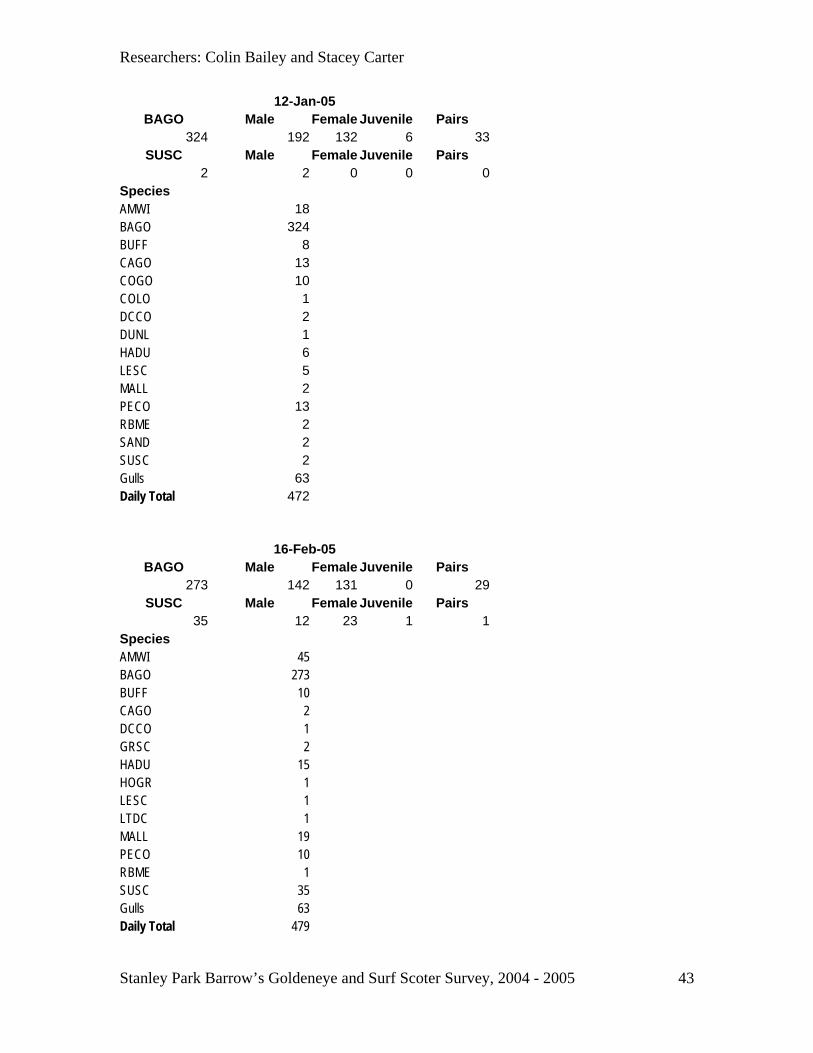
12-Jan-05 BAGO Male Female Juvenile Pairs
324 192 132 6 33SUSC Male Female Juvenile Pairs
2 2 0 0 0Species AMWI 18 BAGO 324 BUFF 8 CAGO 13 COGO 10 COLO 1 DCCO 2 DUNL 1 HADU 6 LESC 5 MALL 2 PECO 13 RBME 2 SAND 2 SUSC 2 Gulls 63 Daily Total 472
16-Feb-05 BAGO Male Female Juvenile Pairs
273 142 131 0 29SUSC Male Female Juvenile Pairs
35 12 23 1 1Species AMWI 45 BAGO 273 BUFF 10 CAGO 2 DCCO 1 GRSC 2 HADU 15 HOGR 1 LESC 1 LTDC 1 MALL 19 PECO 10 RBME 1 SUSC 35 Gulls 63 Daily Total 479
Stanley Park Barrow’s Goldeneye and Surf Scoter Survey, 2004 - 2005
43
Researchers: Colin Bailey and Stacey Carter
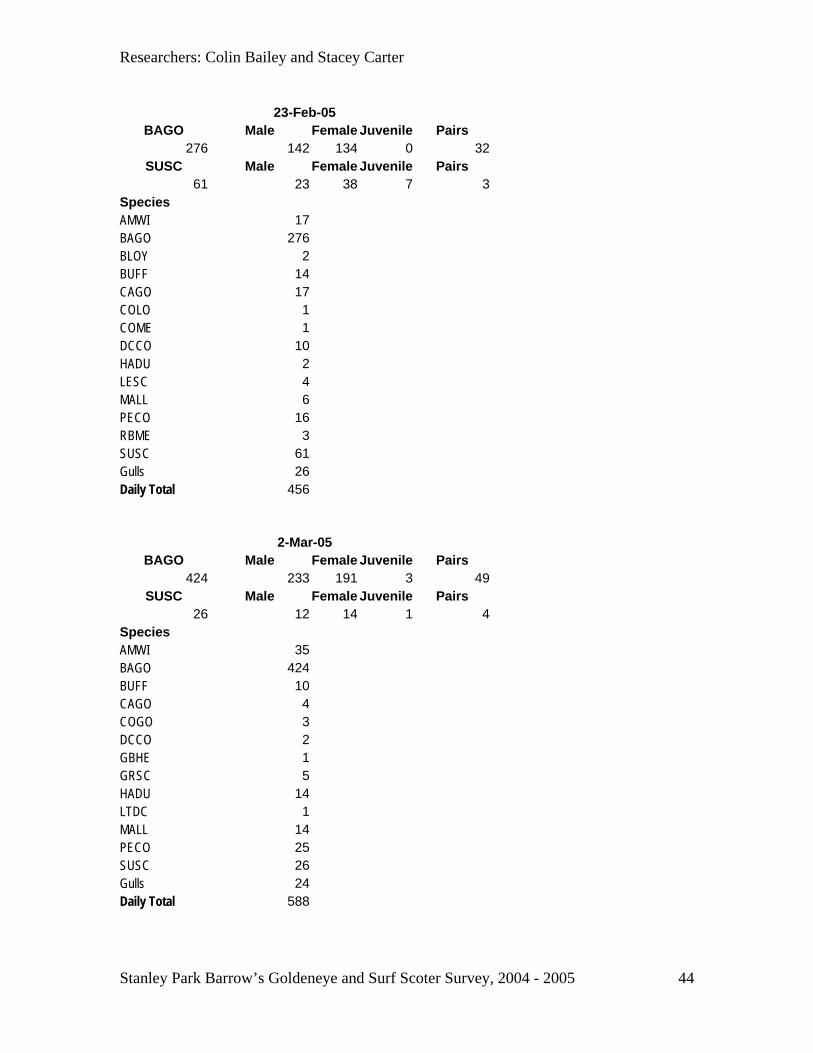
23-Feb-05
BAGO Male Female Juvenile Pairs 276 142 134 0 32
SUSC Male Female Juvenile Pairs 61 23 38 7 3
Species AMWI 17 BAGO 276 BLOY 2 BUFF 14 CAGO 17 COLO 1 COME 1 DCCO 10 HADU 2 LESC 4 MALL 6 PECO 16 RBME 3 SUSC 61 Gulls 26 Daily Total 456
2-Mar-05 BAGO Male Female Juvenile Pairs
424 233 191 3 49SUSC Male Female Juvenile Pairs
26 12 14 1 4Species AMWI 35 BAGO 424 BUFF 10 CAGO 4 COGO 3 DCCO 2 GBHE 1 GRSC 5 HADU 14 LTDC 1 MALL 14 PECO 25 SUSC 26 Gulls 24 Daily Total 588
Stanley Park Barrow’s Goldeneye and Surf Scoter Survey, 2004 - 2005
44
Researchers: Colin Bailey and Stacey Carter
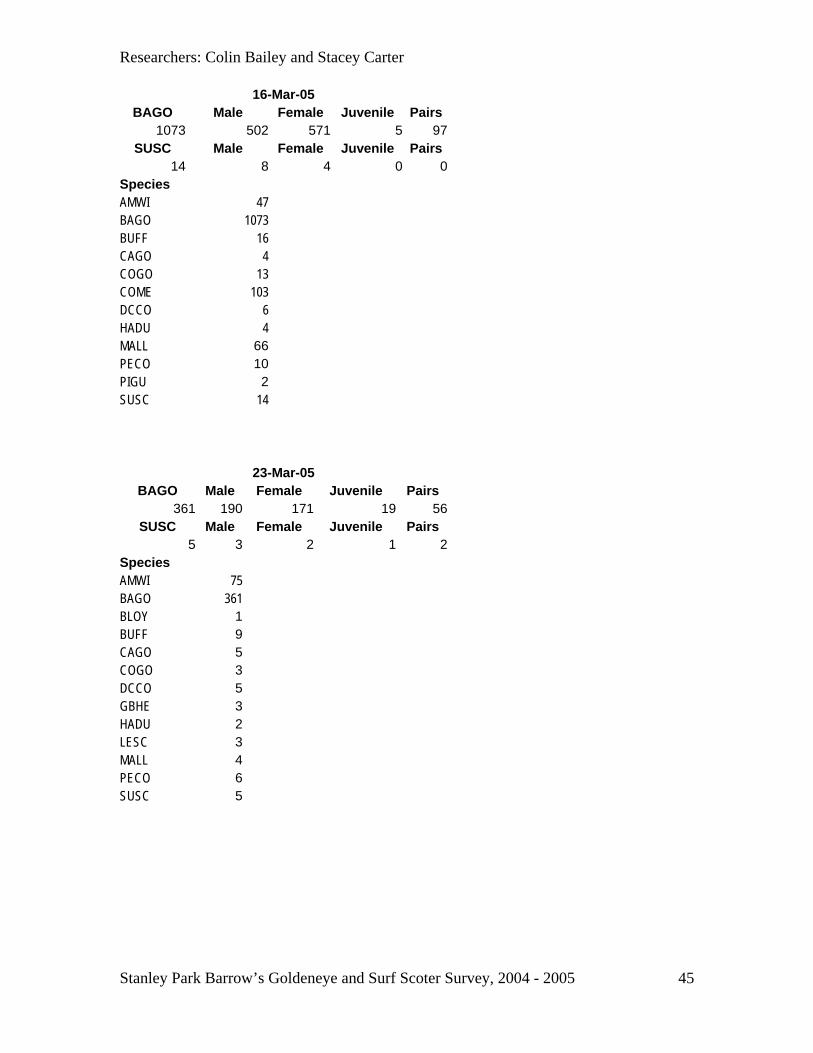
16-Mar-05 BAGO Male Female Juvenile Pairs
1073 502 571 5 97SUSC Male Female Juvenile Pairs
14 8 4 0 0Species AMWI 47 BAGO 1073 BUFF 16 CAGO 4 COGO 13 COME 103 DCCO 6 HADU 4 MALL 66 PECO 10 PIGU 2 SUSC 14
23-Mar-05 BAGO Male Female Juvenile Pairs
361 190 171 19 56SUSC Male Female Juvenile Pairs
5 3 2 1 2Species AMWI 75 BAGO 361 BLOY 1 BUFF 9 CAGO 5 COGO 3 DCCO 5 GBHE 3 HADU 2 LESC 3 MALL 4 PECO 6 SUSC 5
Stanley Park Barrow’s Goldeneye and Surf Scoter Survey, 2004 - 2005
45
Researchers: Colin Bailey and Stacey Carter
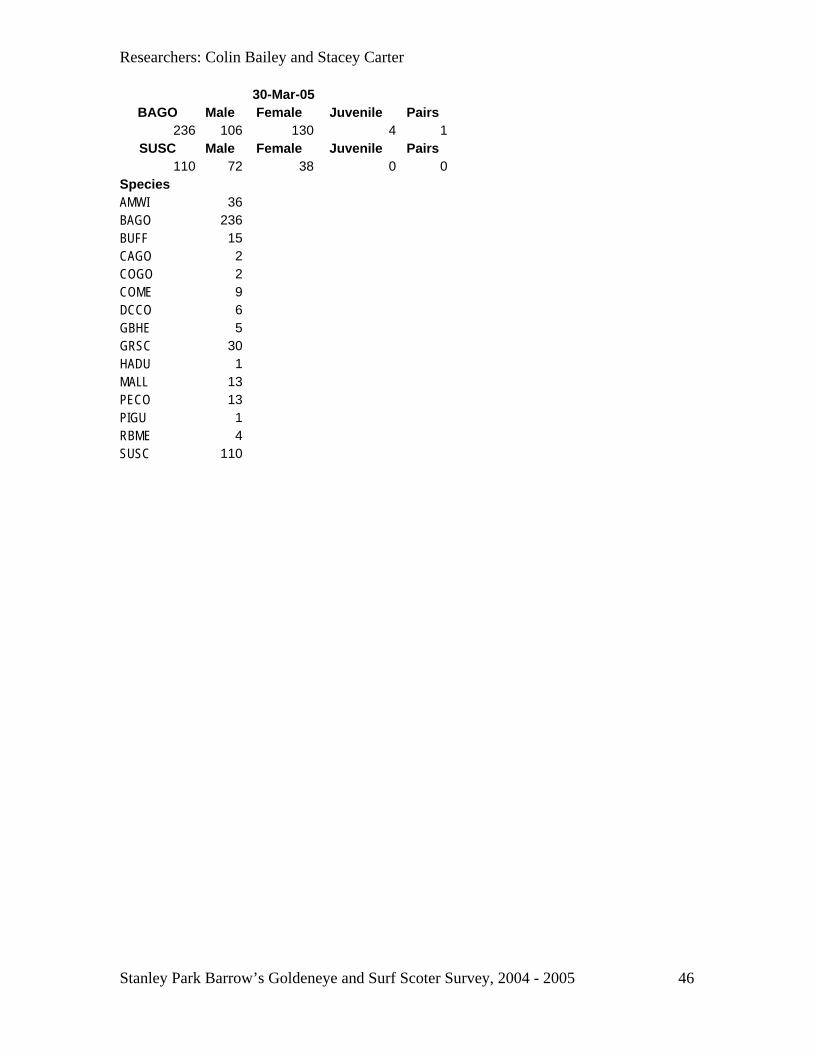
30-Mar-05 BAGO Male Female Juvenile Pairs
236 106 130 4 1SUSC Male Female Juvenile Pairs
110 72 38 0 0Species AMWI 36 BAGO 236 BUFF 15 CAGO 2 COGO 2 COME 9 DCCO 6 GBHE 5 GRSC 30 HADU 1 MALL 13 PECO 13 PIGU 1 RBME 4 SUSC 110
Stanley Park Barrow’s Goldeneye and Surf Scoter Survey, 2004 - 2005
46