Embed Size (px)
Citation preview
Star Assessments™ for Reading Technical Manual
Copyright NoticeCopyright © 2018 Renaissance Learning, Inc. All Rights Reserved.
This publication is protected by US and international copyright laws. It is unlawful to duplicate or reproduce any copyrighted material without authorisation from the copyright holder. This document may be reproduced only by staff members in schools that have a license for Star Reading software. For more information, contact Renaissance Learning, Inc., at the address above.
All logos, designs and brand names for Renaissance’s products and services, including, but not limited to, Accelerated Maths, Accelerated Reader, English in a Flash, MathsFacts in a Flash, myON, myON Reader, myON News, Renaissance, Renaissance Learning, Renaissance Place, Star Maths, Star Assessments, Star Early Literacy and Star Reading are trademarks of Renaissance. All other product and company names should be considered as the property of their respective companies and organisations.
METAMETRICS®, LEXILE® and LEXILE® FRAMEWORK are trademarks of MetaMetrics, Inc., and are registered in the United States and abroad. Copyright © 2015 MetaMetrics, Inc. All rights reserved.
Star Reading has been reviewed for scientific rigor by the US National Center on Student Progress Monitoring. It was found to meet the Center’s criteria for scientifically based progress monitoring tools, including its reliability and validity as an assessment. For more details, visit www.studentprogress.org.
Please Note: This manual presents technical data accumulated over the course of the development of the US version of Star Reading. All of the calibration, reliability, validity and normative data are based on US children, and these may not apply to UK children. The US norm-referenced scores and reliability and validity data presented in this manual are for informational purposes only.
8/2018 SRRPUK
United Kingdom
Renaissance14th FloorSouth Quay Building189 Marsh WallLondon E14 9SH
Tel: +44 (0)20 7184 4000Fax: +44 (0)20 7538 2625Email: [email protected]: www.renlearn.co.uk
Australia
Renaissance Learning AustraliaPO Box 329Toowong DC QLD 4066
Phone: 1800 467 870
Email: [email protected]: www.renaissance.com.au
Contents
Introduction . . . . . . . . . . . . . . . . . . . . . . . . . . . . . . . . . . . . . . . . .1Star Reading: Progress Monitoring Assessment . . . . . . . . . . . . . . . . . . . . . . . . . . . . . .1
Tier 1: Formative Class Assessments . . . . . . . . . . . . . . . . . . . . . . . . . . . . . . . . . . . . . . . . . . . 1Tier 2: Interim Periodic Assessments . . . . . . . . . . . . . . . . . . . . . . . . . . . . . . . . . . . . . . . . . . . . 1Tier 3: Summative Assessments . . . . . . . . . . . . . . . . . . . . . . . . . . . . . . . . . . . . . . . . . . . . . . . . 2
Star Reading Purpose. . . . . . . . . . . . . . . . . . . . . . . . . . . . . . . . . . . . . . . . . . . . . . . . . . . . . .2Design of Star Reading . . . . . . . . . . . . . . . . . . . . . . . . . . . . . . . . . . . . . . . . . . . . . . . . . . . .3
Improvements to the Star Reading Test in Versions 2.x and Higher . . . . . . . . . . . . . . . . . 5Improvements Specific to Star Reading Versions 3.x RP and Higher . . . . . . . . . . . . . . . . 5Improvements Specific to Star Reading Version 4.3 RP . . . . . . . . . . . . . . . . . . . . . . . . . . . . 6
Test Security . . . . . . . . . . . . . . . . . . . . . . . . . . . . . . . . . . . . . . . . . . . . . . . . . . . . . . . . . . . . .7Split-Application Model . . . . . . . . . . . . . . . . . . . . . . . . . . . . . . . . . . . . . . . . . . . . . . . . . . . . . . . . 7Individualised Tests . . . . . . . . . . . . . . . . . . . . . . . . . . . . . . . . . . . . . . . . . . . . . . . . . . . . . . . . . . . 7Data Encryption. . . . . . . . . . . . . . . . . . . . . . . . . . . . . . . . . . . . . . . . . . . . . . . . . . . . . . . . . . . . . . . 7Access Levels and Capabilities . . . . . . . . . . . . . . . . . . . . . . . . . . . . . . . . . . . . . . . . . . . . . . . . . 7Test Monitoring/Password Entry. . . . . . . . . . . . . . . . . . . . . . . . . . . . . . . . . . . . . . . . . . . . . . . . 8Final Caveat . . . . . . . . . . . . . . . . . . . . . . . . . . . . . . . . . . . . . . . . . . . . . . . . . . . . . . . . . . . . . . . . . . 8
Test Administration Procedures . . . . . . . . . . . . . . . . . . . . . . . . . . . . . . . . . . . . . . . . . . . .8Test Interface. . . . . . . . . . . . . . . . . . . . . . . . . . . . . . . . . . . . . . . . . . . . . . . . . . . . . . . . . . . . .9Practice Session . . . . . . . . . . . . . . . . . . . . . . . . . . . . . . . . . . . . . . . . . . . . . . . . . . . . . . . . . .9Adaptive Branching/Test Length . . . . . . . . . . . . . . . . . . . . . . . . . . . . . . . . . . . . . . . . . . . .9Test Repetition. . . . . . . . . . . . . . . . . . . . . . . . . . . . . . . . . . . . . . . . . . . . . . . . . . . . . . . . . . .10Item Time Limits . . . . . . . . . . . . . . . . . . . . . . . . . . . . . . . . . . . . . . . . . . . . . . . . . . . . . . . . .10
Content and Item Development. . . . . . . . . . . . . . . . . . . . . . 12Content Development. . . . . . . . . . . . . . . . . . . . . . . . . . . . . . . . . . . . . . . . . . . . . . . . . . . . .12
The Educational Development Laboratory’s Core Vocabulary List: ATOSGraded Vocabulary List . . . . . . . . . . . . . . . . . . . . . . . . . . . . . . . . . . . . . . . . . . . . . . . . . . . 12
Item Development. . . . . . . . . . . . . . . . . . . . . . . . . . . . . . . . . . . . . . . . . . . . . . . . . . . . . . . .13Vocabulary-in-Context Item Specifications . . . . . . . . . . . . . . . . . . . . . . . . . . . . . . . . . . . . . . 13
Item and Scale Calibration . . . . . . . . . . . . . . . . . . . . . . . . . . .15Calibration of Star Reading Items for Use in Version 2.0 . . . . . . . . . . . . . . . . . . . . . .15Sample Description. . . . . . . . . . . . . . . . . . . . . . . . . . . . . . . . . . . . . . . . . . . . . . . . . . . . . . .16
Item Presentation . . . . . . . . . . . . . . . . . . . . . . . . . . . . . . . . . . . . . . . . . . . . . . . . . . . . . . . . . . . . 17Item Difficulty. . . . . . . . . . . . . . . . . . . . . . . . . . . . . . . . . . . . . . . . . . . . . . . . . . . . . . . . . . . . . . . . 19Item Discrimination . . . . . . . . . . . . . . . . . . . . . . . . . . . . . . . . . . . . . . . . . . . . . . . . . . . . . . . . . . 19Item Response Function . . . . . . . . . . . . . . . . . . . . . . . . . . . . . . . . . . . . . . . . . . . . . . . . . . . . . . 20
iStar Assessments™ for ReadingTechnical Manual
Contents
Rules for Item Retention . . . . . . . . . . . . . . . . . . . . . . . . . . . . . . . . . . . . . . . . . . . . . . . . . .21Computer-Adaptive Test Design . . . . . . . . . . . . . . . . . . . . . . . . . . . . . . . . . . . . . . . . . . .23Scoring in the Star Reading Tests . . . . . . . . . . . . . . . . . . . . . . . . . . . . . . . . . . . . . . . . . .24Scale Calibration . . . . . . . . . . . . . . . . . . . . . . . . . . . . . . . . . . . . . . . . . . . . . . . . . . . . . . . . .25
The Linking Study . . . . . . . . . . . . . . . . . . . . . . . . . . . . . . . . . . . . . . . . . . . . . . . . . . . . . . . . . . . . 25Dynamic Calibration . . . . . . . . . . . . . . . . . . . . . . . . . . . . . . . . . . . . . . . . . . . . . . . . . . . . . .27
Score Definitions. . . . . . . . . . . . . . . . . . . . . . . . . . . . . . . . . . . 28Types of Test Scores . . . . . . . . . . . . . . . . . . . . . . . . . . . . . . . . . . . . . . . . . . . . . . . . . . . . .28
Estimated Oral Reading Fluency (Est. ORF) . . . . . . . . . . . . . . . . . . . . . . . . . . . . . . . . . . . . . 28Lexile® Measures . . . . . . . . . . . . . . . . . . . . . . . . . . . . . . . . . . . . . . . . . . . . . . . . . . . . . . . . . . . . 29Lexile ZPD Ranges . . . . . . . . . . . . . . . . . . . . . . . . . . . . . . . . . . . . . . . . . . . . . . . . . . . . . . . . . . . 29
Lexile Measures of Students and Books: Measures of Student Reading Achievement and Text Readability . . . . . . . . . . . . . . . . . . . . . . . . . . . . . . . . . 29
National Curriculum Level–Reading (NCL–R) . . . . . . . . . . . . . . . . . . . . . . . . . . . . . . . . . . . 31Normed Referenced Standardised Score (NRSS) . . . . . . . . . . . . . . . . . . . . . . . . . . . . . . . . 32Percentile Rank (PR) and Percentile Rank Range. . . . . . . . . . . . . . . . . . . . . . . . . . . . . . . . . 32Reading Age (RA) . . . . . . . . . . . . . . . . . . . . . . . . . . . . . . . . . . . . . . . . . . . . . . . . . . . . . . . . . . . . 32Scaled Score (SS) . . . . . . . . . . . . . . . . . . . . . . . . . . . . . . . . . . . . . . . . . . . . . . . . . . . . . . . . . . . . 33Zone of Proximal Development (ZPD) . . . . . . . . . . . . . . . . . . . . . . . . . . . . . . . . . . . . . . . . . . 34Diagnostic Codes . . . . . . . . . . . . . . . . . . . . . . . . . . . . . . . . . . . . . . . . . . . . . . . . . . . . . . . . . . . . 34Comparing the Star Reading US Test with Classical Tests . . . . . . . . . . . . . . . . . . . . . . . . 35
Reliability and Validity . . . . . . . . . . . . . . . . . . . . . . . . . . . . . 37Split-Half Reliability . . . . . . . . . . . . . . . . . . . . . . . . . . . . . . . . . . . . . . . . . . . . . . . . . . . . . . .37Test-Retest Reliability. . . . . . . . . . . . . . . . . . . . . . . . . . . . . . . . . . . . . . . . . . . . . . . . . . . . .37UK Reliability Study. . . . . . . . . . . . . . . . . . . . . . . . . . . . . . . . . . . . . . . . . . . . . . . . . . . . . . .39Validity. . . . . . . . . . . . . . . . . . . . . . . . . . . . . . . . . . . . . . . . . . . . . . . . . . . . . . . . . . . . . . . . . .40External Validity . . . . . . . . . . . . . . . . . . . . . . . . . . . . . . . . . . . . . . . . . . . . . . . . . . . . . . . . . .41Meta-Analysis of the Star Reading Validity Data . . . . . . . . . . . . . . . . . . . . . . . . . . . . .54Post-Publication Study Data . . . . . . . . . . . . . . . . . . . . . . . . . . . . . . . . . . . . . . . . . . . . . . .55
Predictive Validity: Correlations with SAT9 and the California Standards Tests . . . . . . 56A Longitudinal Study: Correlations with the Stanford Achievement Test
in Reading . . . . . . . . . . . . . . . . . . . . . . . . . . . . . . . . . . . . . . . . . . . . . . . . . . . . . . . . . . . . . . 57Concurrent Validity: An International Study of Correlations with Reading
Tests in England . . . . . . . . . . . . . . . . . . . . . . . . . . . . . . . . . . . . . . . . . . . . . . . . . . . . . . . . . 58Construct Validity: Correlations with a Measure of Reading Comprehension . . . . . . . . 59Investigating Oral Reading Fluency and Developing the Estimated Oral Reading
Fluency Scale . . . . . . . . . . . . . . . . . . . . . . . . . . . . . . . . . . . . . . . . . . . . . . . . . . . . . . . . . . . 61Cross-Validation Study Results . . . . . . . . . . . . . . . . . . . . . . . . . . . . . . . . . . . . . . . . . . . . . . . . 63
UK Study Results . . . . . . . . . . . . . . . . . . . . . . . . . . . . . . . . . . . . . . . . . . . . . . . . . . . . . . . .64Concurrent Validity . . . . . . . . . . . . . . . . . . . . . . . . . . . . . . . . . . . . . . . . . . . . . . . . . . . . . . . . . . . 65
Summary of Star Reading Validity Data . . . . . . . . . . . . . . . . . . . . . . . . . . . . . . . . . . . . .68
iiStar Assessments™ for ReadingTechnical Manual
Contents
Norming. . . . . . . . . . . . . . . . . . . . . . . . . . . . . . . . . . . . . . . . . . . 69Sample Characteristics . . . . . . . . . . . . . . . . . . . . . . . . . . . . . . . . . . . . . . . . . . . . . . . . . . .69
Regional Distribution . . . . . . . . . . . . . . . . . . . . . . . . . . . . . . . . . . . . . . . . . . . . . . . . . . . . . . . . . 69Standardised Scores . . . . . . . . . . . . . . . . . . . . . . . . . . . . . . . . . . . . . . . . . . . . . . . . . . . . . . . . . 70Percentile Ranks . . . . . . . . . . . . . . . . . . . . . . . . . . . . . . . . . . . . . . . . . . . . . . . . . . . . . . . . . . . . . 72Gender. . . . . . . . . . . . . . . . . . . . . . . . . . . . . . . . . . . . . . . . . . . . . . . . . . . . . . . . . . . . . . . . . . . . . . 73Regional Differences in Outcome . . . . . . . . . . . . . . . . . . . . . . . . . . . . . . . . . . . . . . . . . . . . . . 74
Other Issues . . . . . . . . . . . . . . . . . . . . . . . . . . . . . . . . . . . . . . . . . . . . . . . . . . . . . . . . . . . . .75Reference . . . . . . . . . . . . . . . . . . . . . . . . . . . . . . . . . . . . . . . . . . . . . . . . . . . . . . . . . . . . . . .75
Frequently Asked Questions . . . . . . . . . . . . . . . . . . . . . . . . 76Does Star Reading Assess Comprehension, Vocabulary or Reading
Achievement? . . . . . . . . . . . . . . . . . . . . . . . . . . . . . . . . . . . . . . . . . . . . . . . . . . . . . . . . . . . 76How Do Zone of Proximal Development (ZPD) Ranges Fit In? . . . . . . . . . . . . . . . . . . . . . 76How Can the Star Reading Test Determine a Child’s Reading Level in Less
Than Twenty Minutes? . . . . . . . . . . . . . . . . . . . . . . . . . . . . . . . . . . . . . . . . . . . . . . . . . . . 76How Does the Star Reading Test Compare with Other Standardised/National
Tests? . . . . . . . . . . . . . . . . . . . . . . . . . . . . . . . . . . . . . . . . . . . . . . . . . . . . . . . . . . . . . . . . . . 77What Are Some of the Other US Standardised Tests That Might Be Compared
to the Star Reading Test? . . . . . . . . . . . . . . . . . . . . . . . . . . . . . . . . . . . . . . . . . . . . . . . . . 77Why Do Some of My Students Who Took Star Reading Tests Have Scores
That Are Widely Varying from the Results of Our Other US-Standardised Test Program?. . . . . . . . . . . . . . . . . . . . . . . . . . . . . . . . . . . . . . . . . . . . . . . . . . . . . . . . . . . 78
Why Do We See a Significant Number of Our Students Performing at a Lower Level Now Than They Were Nine Weeks Ago? . . . . . . . . . . . . . . . . . . . . . . . . . . . . . . . 79
How Many Items Will a Student Be Presented With When Taking a Star Reading Test? . . . . . . . . . . . . . . . . . . . . . . . . . . . . . . . . . . . . . . . . . . . . . . . . . . . . . . . . . . . 79
How Many Items Does the Star Reading Test Have at Each Year? . . . . . . . . . . . . . . . . . 79What Guidelines Are Offered as to Whether a Student Can Be Tested Using
Star Reading Software?. . . . . . . . . . . . . . . . . . . . . . . . . . . . . . . . . . . . . . . . . . . . . . . . . . . 80How Will Students With a Fear of Taking Tests Do With Star Reading Tests?. . . . . . . . 80Is There Any Way for a Teacher to See Exactly Which Items a Student
Answered Correctly and Which He or She Answered Incorrectly? . . . . . . . . . . . . . . 80What Evidence Do We Have That Star Reading Software Will Perform
as Claimed? . . . . . . . . . . . . . . . . . . . . . . . . . . . . . . . . . . . . . . . . . . . . . . . . . . . . . . . . . . . . . 80Can or Should the Star Reading Test Replace a School’s Current
National Tests? . . . . . . . . . . . . . . . . . . . . . . . . . . . . . . . . . . . . . . . . . . . . . . . . . . . . . . . . . . 81What Is Item Response Theory? . . . . . . . . . . . . . . . . . . . . . . . . . . . . . . . . . . . . . . . . . . . . . . . 81What Are the Cloze and Maze Procedures?. . . . . . . . . . . . . . . . . . . . . . . . . . . . . . . . . . . . . . 81
Appendix A . . . . . . . . . . . . . . . . . . . . . . . . . . . . . . . . . . . . . . . . 82US Norming . . . . . . . . . . . . . . . . . . . . . . . . . . . . . . . . . . . . . . . . . . . . . . . . . . . . . . . . . . . . .82Sample Characteristics . . . . . . . . . . . . . . . . . . . . . . . . . . . . . . . . . . . . . . . . . . . . . . . . . . .82Test Administration . . . . . . . . . . . . . . . . . . . . . . . . . . . . . . . . . . . . . . . . . . . . . . . . . . . . . .85Data Analysis . . . . . . . . . . . . . . . . . . . . . . . . . . . . . . . . . . . . . . . . . . . . . . . . . . . . . . . . . . . .85
iiiStar Assessments™ for ReadingTechnical Manual
Contents
US Norm-Referenced Score Definitions . . . . . . . . . . . . . . . . . . . . . . . . . . . . . . . . . . . . .87Types of Test Scores . . . . . . . . . . . . . . . . . . . . . . . . . . . . . . . . . . . . . . . . . . . . . . . . . . . . . . . . . 87Grade Equivalent (GE) . . . . . . . . . . . . . . . . . . . . . . . . . . . . . . . . . . . . . . . . . . . . . . . . . . . . . . . . 87Estimated Oral Reading Fluency (Est. ORF) . . . . . . . . . . . . . . . . . . . . . . . . . . . . . . . . . . . . . 88Comparing the Star Reading Test with Classical Tests . . . . . . . . . . . . . . . . . . . . . . . . . . . 89Understanding IRL and GE scores. . . . . . . . . . . . . . . . . . . . . . . . . . . . . . . . . . . . . . . . . . . . . . 89Percentile Rank (PR). . . . . . . . . . . . . . . . . . . . . . . . . . . . . . . . . . . . . . . . . . . . . . . . . . . . . . . . . . 90Normal Curve Equivalent (NCE) . . . . . . . . . . . . . . . . . . . . . . . . . . . . . . . . . . . . . . . . . . . . . . . . 91
US Norm-Referenced Conversion Tables. . . . . . . . . . . . . . . . . . . . . . . . . . . . . . . . . . . .91
References . . . . . . . . . . . . . . . . . . . . . . . . . . . . . . . . . . . . . . . 108
Index. . . . . . . . . . . . . . . . . . . . . . . . . . . . . . . . . . . . . . . . . . . . . .110
ivStar Assessments™ for ReadingTechnical Manual
Introduction
Star Reading: Progress Monitoring AssessmentThe Renaissance Place Edition of the Star Reading computer-adaptive test and database allows teachers to assess students’ reading comprehension and overall reading achievement in ten minutes or less. This computer-based progress-monitoring assessment provides immediate feedback to teachers and administrators on each student’s reading development.
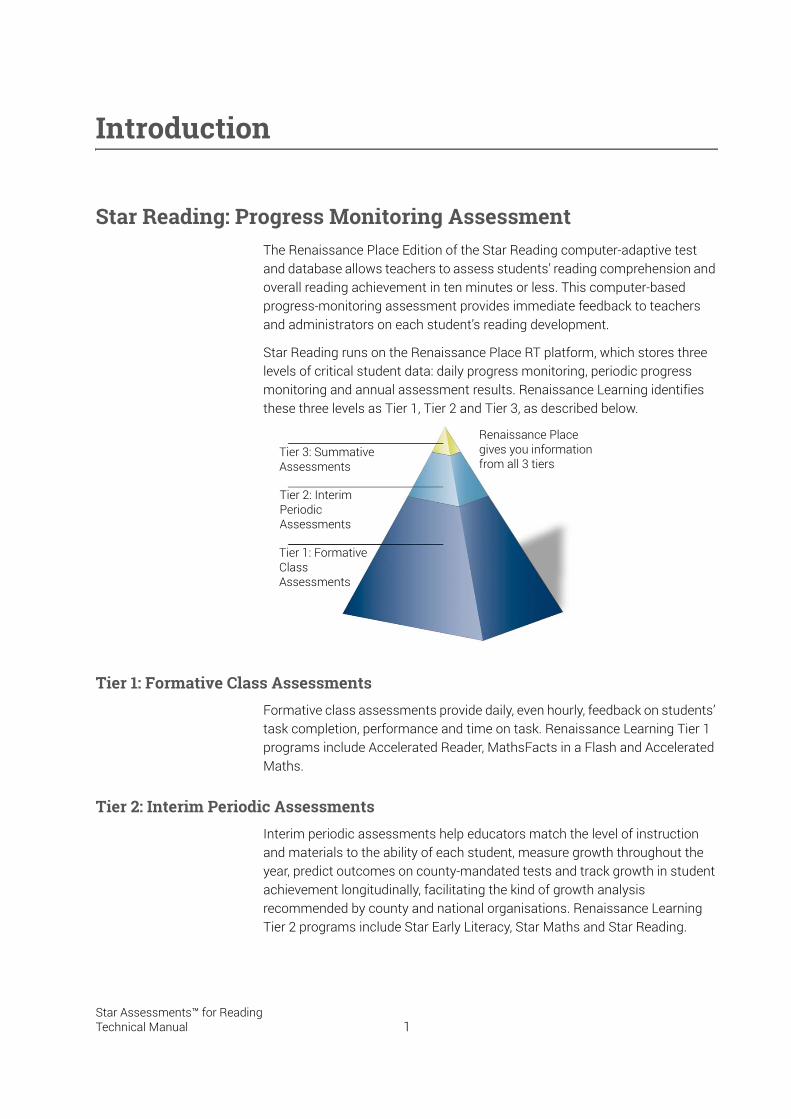
Star Reading runs on the Renaissance Place RT platform, which stores three levels of critical student data: daily progress monitoring, periodic progress monitoring and annual assessment results. Renaissance Learning identifies these three levels as Tier 1, Tier 2 and Tier 3, as described below.
Tier 1: Formative Class AssessmentsFormative class assessments provide daily, even hourly, feedback on students’ task completion, performance and time on task. Renaissance Learning Tier 1 programs include Accelerated Reader, MathsFacts in a Flash and Accelerated Maths.
Tier 2: Interim Periodic AssessmentsInterim periodic assessments help educators match the level of instruction and materials to the ability of each student, measure growth throughout the year, predict outcomes on county-mandated tests and track growth in student achievement longitudinally, facilitating the kind of growth analysis recommended by county and national organisations. Renaissance Learning Tier 2 programs include Star Early Literacy, Star Maths and Star Reading.
Renaissance Placegives you informationfrom all 3 tiers
Tier 2: InterimPeriodicAssessments
Tier 1: FormativeClassAssessments
Tier 3: SummativeAssessments
1Star Assessments™ for ReadingTechnical Manual
IntroductionStar Reading Purpose
Tier 3: Summative AssessmentsSummative assessments provide quantitative and qualitative data in the form of high-stakes tests. The best way to ensure success on Tier 3 assessments is to monitor progress and adjust instructional methods and practice activities throughout the year using Tier 1 and Tier 2 assessments.
Star Reading PurposeAs a periodic progress monitoring assessment, Star Reading serves three purposes for students with at least 100-word sight vocabulary. First, it provides educators with quick and accurate estimates of reading comprehension using students’ teaching and learning reading levels. Second, it assesses reading achievement on a continuous scale over the range of school Years 1–13. Third, it provides the means for tracking growth in a consistent manner longitudinally for all students. This is especially helpful to school- and school network-level administrators.
The Star Reading test is not intended to be used as a “high-stakes” or “national” test whose main function is to report end-of-period performance to parents and educationists. Although that is not its purpose, Star Reading scores are highly correlated with large-scale survey achievement tests, as attested to by the data in “Reliability and Validity” on page 37. The high correlations of Star Reading scores with such national instruments make it easier to fine-tune instruction while there is still time to improve performance before the regular testing cycle. The Star Reading test’s repeatability and flexible administration provide specific advantages for everyone responsible for the education process:
For students, Star Reading software provides a challenging, interactive and brief test that builds confidence in their reading ability.
For teachers, the Star Reading test facilitates individualised instruction by identifying children who need remediation or enrichment most.
For head teachers, the Star Reading 3.x and higher RP browser-based management program provides regular, accurate reports on performance at the class, year, school and school network level, as well as year-to-year comparisons.
For administrators and assessment specialists, the Management program provides a wealth of reliable and timely data on reading growth at each school and throughout the school network. It also provides a valid basis for comparing data across schools, years and special student populations.
This manual documents the suitability of Star Reading computer-adaptive testing for these purposes and demonstrates quantitatively how well this innovative instrument in reading assessment performs.
2Star Assessments™ for ReadingTechnical Manual
IntroductionDesign of Star Reading
Design of Star ReadingOne of the fundamental Star Reading design decisions involved the choice of how to administer the test. The primary advantage of using computer software to administer Star Reading tests is the ability to tailor students’ tests based on their responses to previous items. Paper-and-pencil tests are obviously far different from this; every student must respond to the same items in the same sequence. Using computer-adaptive procedures, it is possible for students to test on items that appropriately match their current level of proficiency. The item selection procedures, termed Adaptive Branching, effectively customise the test for each student’s achievement level.
Adaptive Branching offers significant advantages in terms of test reliability, testing time and student motivation. Reliability improves over paper-and-pencil tests because the test difficulty matches each individual’s performance level; students do not have to fit a “one test fits all” model. Most of the test items that students respond to are at difficulty levels that closely match their achievement level. Testing time decreases because, unlike in paper-and-pencil tests, there is no need to expose every student to a broad range of material, portions of which are inappropriate because they are either too easy for high achievers or too difficult for those with low current levels of performance. Finally, student motivation improves simply because of these issues—test time is minimised and test content is neither too difficult nor too easy.
Another fundamental Star Reading design decision involved the choice of the content and format of items for the test. Many types of stimulus and response procedures were explored, researched, discussed and prototyped. These procedures included the traditional reading passage followed by sets of literal or inferential questions, previously published extended selections of text followed by open-ended questions requiring student-constructed answers and several cloze-type procedures for passage presentation. While all of these procedures can be used to measure reading comprehension and overall reading achievement, the vocabulary-in-context format was finally selected as the primary item format. This decision was made for interrelated reasons of efficiency, breadth of construct coverage objectivity and simplicity of scoring. For students at US grade levels 1 and 2 (Years 2 and 3), the Star Reading 3.x and higher test administers 25 vocabulary-in-context items. For students at US grade levels 3 and above (Years 4 and above), the test administers 20 vocabulary-in-context items in the first section of the test and five authentic text passages with multiple-choice literal or inferential questions in the second section of the test.
Four fundamental arguments support the use of the Star Reading design for obtaining quick and reliable estimates of reading comprehension and reading achievement:
3Star Assessments™ for ReadingTechnical Manual
IntroductionDesign of Star Reading
1. The vocabulary-in-context test items, while using a common format for assessing reading, require reading comprehension. Each test item is a complete, contextual sentence with a tightly controlled vocabulary level. The semantics and syntax of each context sentence are arranged to provide clues as to the correct cloze word. The student must actually interpret the meaning of (in other words, comprehend) the sentence in order to choose the correct answer because all of the answer choices “fit” the context sentence either semantically or syntactically. In effect, each sentence provides a mini-selection on which the student demonstrates the ability to interpret the correct meaning. This is, after all, what most reading theorists believe reading comprehension to be—the ability to draw meaning from text.
2. In the course of taking the Star Reading tests, students read and respond to a significant amount of text in the form of vocabulary-in-context test items. The Star Reading test typically asks the student to demonstrate comprehension of material that ranges over several US grade levels (UK years). Students will read, use context clues from, interpret the meaning of and attempt to answer 25 cloze sentences across these levels, generally totaling more than 300 words. The student must select the correct word from sets of words that are all at the same reading level, and that at least partially fit the sentence context. Students clearly must demonstrate reading comprehension to correctly respond to these 25 questions.
3. A child’s level of vocabulary development is a major—perhaps the major—factor in determining the child’s ability to comprehend written material. Decades of reading research have consistently demonstrated that a student’s level of vocabulary knowledge is the most important single element in determining the child’s ability to read with comprehension. Tests of vocabulary knowledge typically correlate better than do any other components of reading with valid assessments of reading comprehension.
4. The student’s performance on the vocabulary-in-context section is used to determine the initial difficulty level of the subsequent authentic text passage items. Although this section consists of just five items, the accurate entry level and the continuing adaptive selection process mean that all of the authentic text passage items are closely matched to the student’s reading ability level. This results in unusually high measurement efficiency.
For these reasons, the Star Reading test design and item format provide a valid procedure for assessing a student’s reading comprehension. Data and information presented in this manual reinforce this.
4Star Assessments™ for ReadingTechnical Manual
IntroductionDesign of Star Reading
Improvements to the Star Reading Test in Versions 2.x and HigherSince the introduction of Star Reading version 1.0 in 1996, Star Reading has undergone a process of continuous research and improvement. Version 2.0 was an entirely new test, with new content and several technical innovations.
The item bank was expanded from 838 test items distributed among 14 difficulty levels. For the UK, there are 1,000 items distributed among 54 difficulty levels.
The technical psychometric foundation for the test was improved. Versions 2.x and higher are now based on Item Response Theory (IRT). The use of IRT permits more accurate calibration of item difficulty and more accurate measurement of students’ reading ability.
The Adaptive Branching process was likewise improved. By using IRT, the Star Reading tests effect an improvement in measurement efficiency.
The length of the Star Reading test was shortened and standardised. Taking advantage of improved measurement efficiency, the Star Reading 2.x and higher tests administer just 25 vocabulary-in-context items questions to every student. The average length of version 1.x tests was 30 items per student.
The Star Reading test was nationally standardised in the UK prior to release.
Improvements Specific to Star Reading Versions 3.x RP and HigherVersions 3.x RP and 4.x RP are adaptations of version 2.x designed specifically for use on a computer with web access. In versions 3.x RP and higher, all management and test administration functions are controlled using a management system which is accessed by means of a computer with web access.
This makes a number of new features possible:
Multiple schools can share a central database, such as a school network-level database. Records of students transferring between schools within the school network will be maintained in the database; the only information that needs revision following a transfer is the student’s updated school and class assignments.
The same database that contains Star Reading data can contain data on other Star tests, including Star Early Literacy and Star Maths. The Renaissance Place RT program is a powerful information-management program that allows you to manage all your school network, school, personnel and student data in one place. Changes made to school network, school, teacher and student data for any of these products, as well as other Renaissance Place software, are reflected in every other Renaissance Place program sharing the central database.
5Star Assessments™ for ReadingTechnical Manual
IntroductionDesign of Star Reading
Multiple levels of access are available, from the test administrator within a school or class, to teachers, head teachers and school network administrators.
Renaissance Place RT takes reporting to a new level. Not only can you generate reports from the student level all the way up to the school level, but you can also limit reports to specific groups, subgroups and combinations of subgroups. This supports “disaggregated” reporting; for example, a report might be specific to students eligible for Free School Meals, to English language learners or to students who fit both categories. It also supports compiling reports by teacher, class, school, year within a school and many other criteria such as a specific date range. In addition, the Renaissance Place consolidated reports allow you to gather data from more than one program (such as Star Reading and Accelerated Reader) at the teacher, class, school and school network level and display the information in one report.
Since the Renaissance Place RT software is accessed through a web browser, teachers (and administrators) will be able to access the program from home—provided the school gives them that access.
When you upgrade from Star Reading version 3.x to version 4.x or higher, all shortcuts to the student program will automatically redirect to the browser-based program (the Renaissance Place Welcome page) each time they are used.
Improvements Specific to Star Reading Version 4.3 RPStar Reading versions 3.x RP to 4.2 RP were identical in content to Star Reading version 2.x. With the development of version 4.3 RP, changes in content have been made, along with other changes, all described below.
The Adaptive Branching process been further improved, by changing the difficulty target used to select each item. The new difficulty target further improves the measurement efficiency of Star Reading, and is expected to increase measurement precision, score reliability and test validity.
A new feature, Dynamic Calibration, has been added. Dynamic Calibration makes it possible to include small numbers of unscored items in selected students’ tests, for the purpose of collecting item response data for research and development use.
Star Reading can now be used to test Year 1 students, at the teacher’s discretion. Score reports for Year 1 students will include Scale Scores, estimated Reading Ages and Estimated National Curriculum Levels.
6Star Assessments™ for ReadingTechnical Manual
IntroductionTest Security
Test SecurityStar Reading software includes a number of features intended to provide adequate security to protect the content of the test and to maintain the confidentiality of the test results.
Split-Application ModelIn the Star Reading RP software, when students log in, they do not have access to the same functions that teachers, administrators and other personnel can access. Students are allowed to test, but they have no other tasks available in Star Reading RP; therefore, they have no access to confidential information. When teachers and administrators log in, they can manage student and class information, set preferences, register students for testing and create informative reports about student test performance.
Individualised TestsUsing Adaptive Branching, every Star Reading test consists of items chosen from a large number of items of similar difficulty based on the student’s estimated ability. Because each test is individually assembled based on the student’s past and present performance, identical sequences of items are rare. This feature, while motivated chiefly by psychometric considerations, contributes to test security by limiting the impact of item exposure.
Data EncryptionA major defence against unauthorised access to test content and student test scores is data encryption. All of the items and export files are encrypted. Without the appropriate decryption code, it is practically impossible to read the Star Reading data or access or change it with other software.
Access Levels and CapabilitiesEach user’s level of access to a Renaissance Place program depends on the primary position assigned to that user and the capabilities the user has been granted in the Renaissance Place program. Each primary position is part of a user group. There are six user groups: school network administrator, school network staff, school administrator, school staff, teacher and student. By default, each user group is granted a specific set of capabilities. Each capability corresponds to one or more tasks that can be performed in the program. The capabilities in these sets can be changed; capabilities can also be granted or removed on an individual level. Since users can be assigned to the school network and/or one or more schools (and be assigned different primary positions at the different locations), and since the capabilities granted to a user can be customised, there are many, varied levels of access an individual user can have.
7Star Assessments™ for ReadingTechnical Manual
IntroductionTest Administration Procedures
Renaissance Place RT also allows you to restrict students’ access to certain computers. This prevents students from taking Star Reading RP tests from unauthorised computers (such as a home computer). For more information on student access security, see https://help.renlearn.co.uk/RP/SettingSecurityOptions.
The security of the Star Reading RP data is also protected by each person’s user name (which must be unique) and password. User names and passwords identify users, and the program only allows them access to the data and features that they are allowed based on their primary position and the capabilities that they have been granted. Personnel who log in to Renaissance Place RT (teacher, administrators or staff) must enter a user name and password before they can access the data and create reports. Without an appropriate user name and password, personnel cannot use the Star Reading RP software.
Test Monitoring/Password EntryTest monitoring is another useful Star Reading security feature. Test monitoring is implemented using the Testing Password preference, which specifies whether teaching assistants must enter their passwords at the start of a test. Students are required to enter a user name and password to log in before taking a test. This ensures that students cannot take tests using other students’ names.
Final CaveatWhile Star Reading software can do much to provide specific measures of test security, the most important line of defence against unauthorised access or misuse of the program is the user’s responsibility. Teachers and teaching assistants need to be careful not to leave the program running unattended and to monitor all testing to prevent students from cheating, copying down questions and answers or performing “print screens” during a test session. Taking these simple precautionary steps will help maintain Star Reading’s security and the quality and validity of its scores.
Test Administration ProceduresIn order to ensure consistency and comparability of results to the Star Reading norms, students taking Star Reading tests should follow the same administration procedures used by the norming participants. It is also a good idea to make sure that the testing environment is as free from distractions for the student as possible.
During the norming, all of the participants received the same set of test instructions and corresponding graphics contained in the Pretest Instructions included with the Star Reading product. These instructions describe the standard test orientation procedures that teachers should follow to prepare
8Star Assessments™ for ReadingTechnical Manual
IntroductionTest Interface
their students for the Star Reading test. These instructions are intended for use with students of all ages; however, the Star Reading test should only be administered to students who have a reading vocabulary of at least 100 words. The instructions were successfully field-tested with students ranging from the first US grade (Year 2) through the eighth US grade (Year 9). It is important to use these same instructions with all students before they take the Star Reading test.
Test InterfaceThe Star Reading test interface was designed to be both simple and effective. Students can use either the mouse or the keyboard to answer questions.
If using the keyboard, students press one of the four letter keys (A, B, C and D) and then press the Enter key (or the return key on Macintosh computers).
If using the mouse, students click the answer of choice and then click Next to enter the answer.
Practice SessionThe practice session before the test allows students to get comfortable with the test interface and to make sure that they know how to operate it properly. As soon as a student has answered three practice questions correctly, the program takes the student into the actual Star Reading test. Even the lowest-level readers should be able to answer the sample questions correctly. If the student has not successfully answered three items by the end of the practice session, Star Reading will halt the testing session and tell the student to ask the teacher for help. It may be that the student cannot read at even the most basic level, or it may be that the student needs help operating the interface, in which case the teacher should help the student through the practice session the next time. Before beginning the next test session with the student, the program will recommend that the teacher assist the student during the practice.
Adaptive Branching/Test LengthStar Reading’s branching control uses a proprietary approach somewhat more complex than the simple Rasch maximum information IRT model. The Star Reading approach was designed to yield reliable test results for both the criterion-referenced and norm-referenced scores by adjusting item difficulty to the responses of the individual being tested while striving to minimise test length and student frustration.
9Star Assessments™ for ReadingTechnical Manual
IntroductionTest Repetition
In order to minimise student frustration, the first administration of the Star Reading 4.4 test begins with items that have a difficulty level that is substantially below what a typical student at a given UK year can handle—usually one or two years below year placement. On the average, about 86 per cent of students will be able to answer the first item correctly. Teachers can override this typical value by entering an even lower Estimated Instructional Reading Level for the student. On the second and subsequent administrations, the Star Reading test begins with items that have a difficulty level lower than the previously demonstrated reading ability. Students generally have an 85 per cent chance of answering the first item correctly on second and subsequent tests.
Once the testing session is underway, the test administers 25 items of varying difficulty based on the student’s responses; this is sufficient information to obtain a reliable Scaled Score.
Test RepetitionStar Reading data can be used for multiple purposes such as screening, placement, planning teaching, benchmarking and outcomes measurement. The frequency with which the assessment is administered depends on the purpose for assessment and how the data will be used. Renaissance Learning recommends assessing students only as frequently as necessary to get the data needed. Schools that use Star for screening purposes typically administer it two to five times per year. Teachers who want to monitor student progress more closely or use the data for instructional planning may use it more frequently. Star may be administered as frequently as weekly for progress monitoring purposes.
Star Reading keeps track of the questions presented to each student from test session to test session and will not ask the same question more than once in any 90-day period.
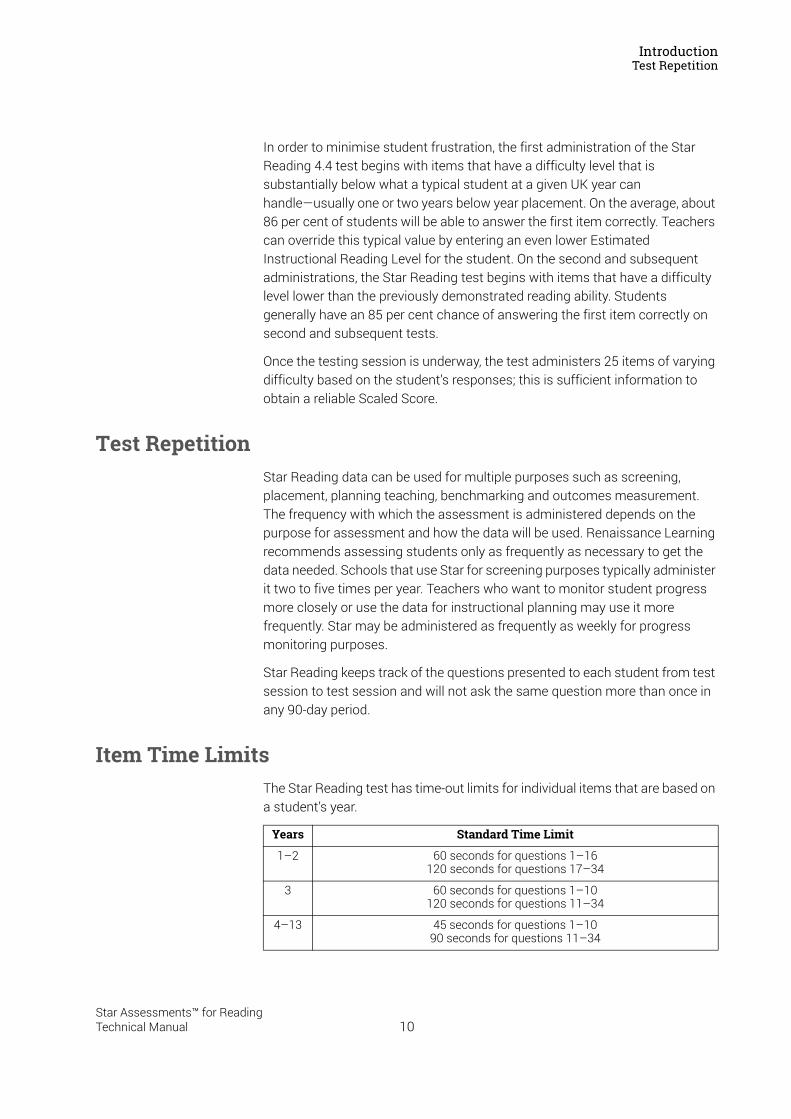
Item Time LimitsThe Star Reading test has time-out limits for individual items that are based on a student’s year.
Years Standard Time Limit
1–2 60 seconds for questions 1–16120 seconds for questions 17–34
3 60 seconds for questions 1–10120 seconds for questions 11–34
4–13 45 seconds for questions 1–1090 seconds for questions 11–34
10Star Assessments™ for ReadingTechnical Manual
IntroductionItem Time Limits
Students in all years have 60 seconds to answer each practice question. These time-out values are based on latency data obtained during item validation. Very few vocabulary-in-context items at any year had latencies longer than 30 seconds, and almost none (fewer than 0.3%) had latencies of more than 45 seconds. Thus, the time-out limit was set to 45 seconds for most students and increased to 60 seconds for the very young students.
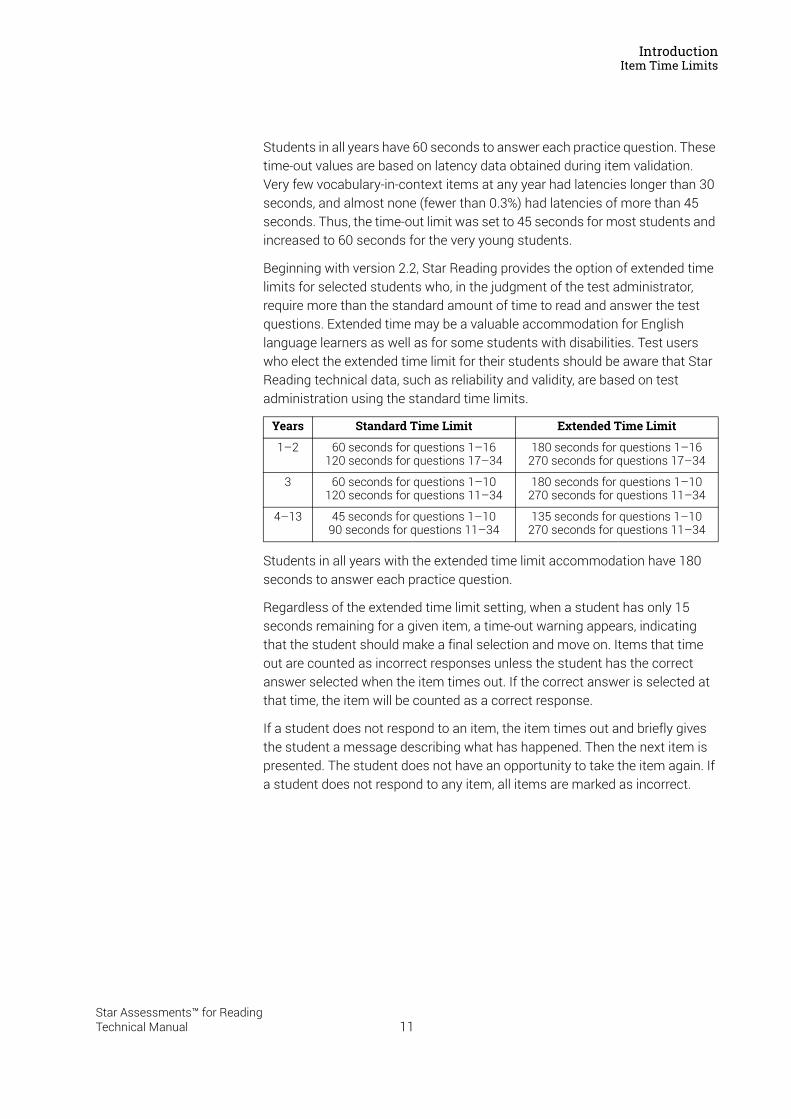
Beginning with version 2.2, Star Reading provides the option of extended time limits for selected students who, in the judgment of the test administrator, require more than the standard amount of time to read and answer the test questions. Extended time may be a valuable accommodation for English language learners as well as for some students with disabilities. Test users who elect the extended time limit for their students should be aware that Star Reading technical data, such as reliability and validity, are based on test administration using the standard time limits.
Students in all years with the extended time limit accommodation have 180 seconds to answer each practice question.
Regardless of the extended time limit setting, when a student has only 15 seconds remaining for a given item, a time-out warning appears, indicating that the student should make a final selection and move on. Items that time out are counted as incorrect responses unless the student has the correct answer selected when the item times out. If the correct answer is selected at that time, the item will be counted as a correct response.
If a student does not respond to an item, the item times out and briefly gives the student a message describing what has happened. Then the next item is presented. The student does not have an opportunity to take the item again. If a student does not respond to any item, all items are marked as incorrect.
Years Standard Time Limit Extended Time Limit
1–2 60 seconds for questions 1–16120 seconds for questions 17–34
180 seconds for questions 1–16270 seconds for questions 17–34
3 60 seconds for questions 1–10120 seconds for questions 11–34
180 seconds for questions 1–10270 seconds for questions 11–34
4–13 45 seconds for questions 1–1090 seconds for questions 11–34
135 seconds for questions 1–10270 seconds for questions 11–34
11Star Assessments™ for ReadingTechnical Manual
Content and Item Development
Content DevelopmentThe content of UK Star Reading version 4.3 RP is identical to the content in versions 2 and 3. Content development was driven by the test design and test purposes, which are to measure comprehension and general reading achievement. Based on test purpose, the desired content had to meet certain criteria. First, it had to cover a range broad enough to test students from Years 1–13. Thus, items had to represent reading levels ranging all the way from Year 1 to post-upper years. Second, the final collection of test items had to be large enough so that students could test up to five times per year without being given the same items twice.
To adapt the Star Reading Renaissance Place US item content for Star Reading Renaissance Place UK, the Renaissance Learning UL Ltd. content development staff reviewed all US items and made recommendations for deletions and modifications. Given that all Star Reading US authentic-text passage items contain passages from popular US children’s books, all 262 of these items were removed for Star Reading UK. The remaining vocabulary-in-context items underwent review by Renaissance Learning UK. Out of a total of 1,159 items in version 2.0, 159 (13.7%) were deleted and 306 (26.4%) underwent slight modifications. The majority of the modifications pertained to language differences. For example, all references to “faucet” became “tap”. Other changes involved spelling (e.g. “airplane” to “aeroplane”) and grammar (“can not” to “cannot”) modifications. The resulting Star Reading UK test contains 1,000 items.
The Educational Development Laboratory’s Core Vocabulary List: ATOS Graded Vocabulary List
The original point of reference for the development of US Star Reading items was the 1995 updated vocabulary lists that are based on the Educational Development Laboratory’s (EDL) A Revised Core Vocabulary (1969) of 7,200 words. The EDL vocabulary list is a soundly developed, validated list that is often used by developers of educational instruments to create all types of educational materials and assessments. It categorises hundreds of vocabulary words according to year placement, from reception through post-upper years. This was exactly the span desired for the Star Reading test.
Beginning with new test items introduced in version 4.3, Star Reading item developers used ATOS instead of the EDL word list. ATOS is a system for evaluating the reading level of continuous text; it contains 23,000 words in its graded vocabulary list. This readability formula was developed by Renaissance Learning, Inc. and designed by leading readability experts. ATOS is the first
12Star Assessments™ for ReadingTechnical Manual
Content and Item DevelopmentItem Development
formula to include statistics from actual student book reading (over 30,000 US students, reading almost 1,000,000 books).
Item DevelopmentDuring item development, every effort was made to avoid the use of stereotypes, potentially offensive language or characterisations and descriptions of people or events that could be construed as being offensive, demeaning, patronising or otherwise insensitive. The editing process also included a strict sensitivity review of all items to attend to issues of gender and ethnic-group balance and fairness.
Vocabulary-in-Context Item SpecificationsOnce the test design was determined, individual test items were assembled for try-out and calibration. For the Star Reading US 2.x test, the item try-out and calibration included all 838 vocabulary items from the Star Reading US 1.x test, plus 836 new vocabulary items created for the Star Reading US 2.x test. It was necessary to write and test about 100 new questions at each US grade level (year) to ensure that approximately 60 new items per level would be acceptable for the final item collection. (Due to the limited number of primer words available for Year 1, the starting set for this level contained only 30 items.) Having a pool of almost 1,700 vocabulary items allowed significant flexibility in selecting only the best items from each group for the final product.
Each of the vocabulary items was written to the following specifications:
1. Each vocabulary-in-context test item consists of a single-context sentence. This sentence contains a blank indicating a missing word. Three or four possible answers are shown beneath the sentence. For questions developed at a Year 1 reading level, three possible answers are given. Questions at a Year 3 reading level and higher offer four possible answers.
2. To answer the question, the student selects the word from the answer choices that best completes the sentence. The correct answer option is the word that appropriately fits both the semantics and the syntax of the sentence. All of the incorrect answer options either fit the syntax of the sentence or relate to the meaning of something in the sentence. They do not, however, meet both conditions.
3. The answer blanks are generally located near the end of the context sentence to minimise the amount of rereading required.
13Star Assessments™ for ReadingTechnical Manual
Content and Item DevelopmentItem Development
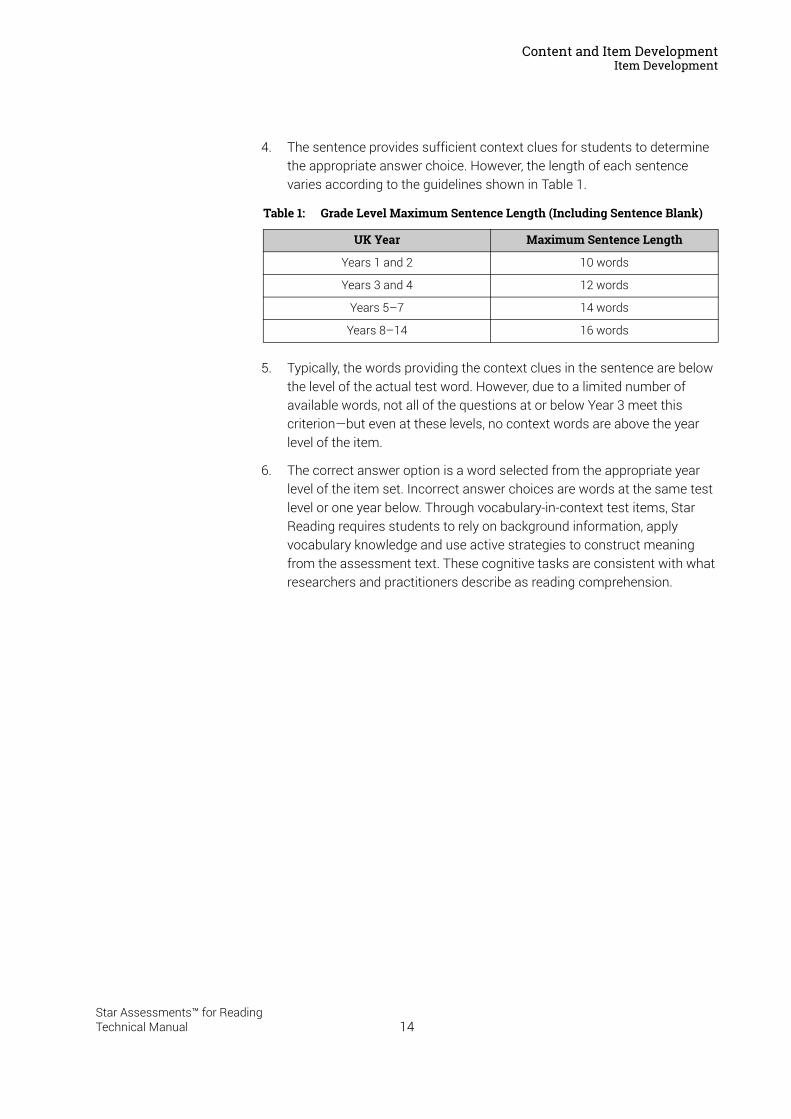
4. The sentence provides sufficient context clues for students to determine the appropriate answer choice. However, the length of each sentence varies according to the guidelines shown in Table 1.
5. Typically, the words providing the context clues in the sentence are below the level of the actual test word. However, due to a limited number of available words, not all of the questions at or below Year 3 meet this criterion—but even at these levels, no context words are above the year level of the item.
6. The correct answer option is a word selected from the appropriate year level of the item set. Incorrect answer choices are words at the same test level or one year below. Through vocabulary-in-context test items, Star Reading requires students to rely on background information, apply vocabulary knowledge and use active strategies to construct meaning from the assessment text. These cognitive tasks are consistent with what researchers and practitioners describe as reading comprehension.
Table 1: Grade Level Maximum Sentence Length (Including Sentence Blank)
UK Year Maximum Sentence Length
Years 1 and 2 10 words
Years 3 and 4 12 words
Years 5–7 14 words
Years 8–14 16 words
14Star Assessments™ for ReadingTechnical Manual
Item and Scale Calibration
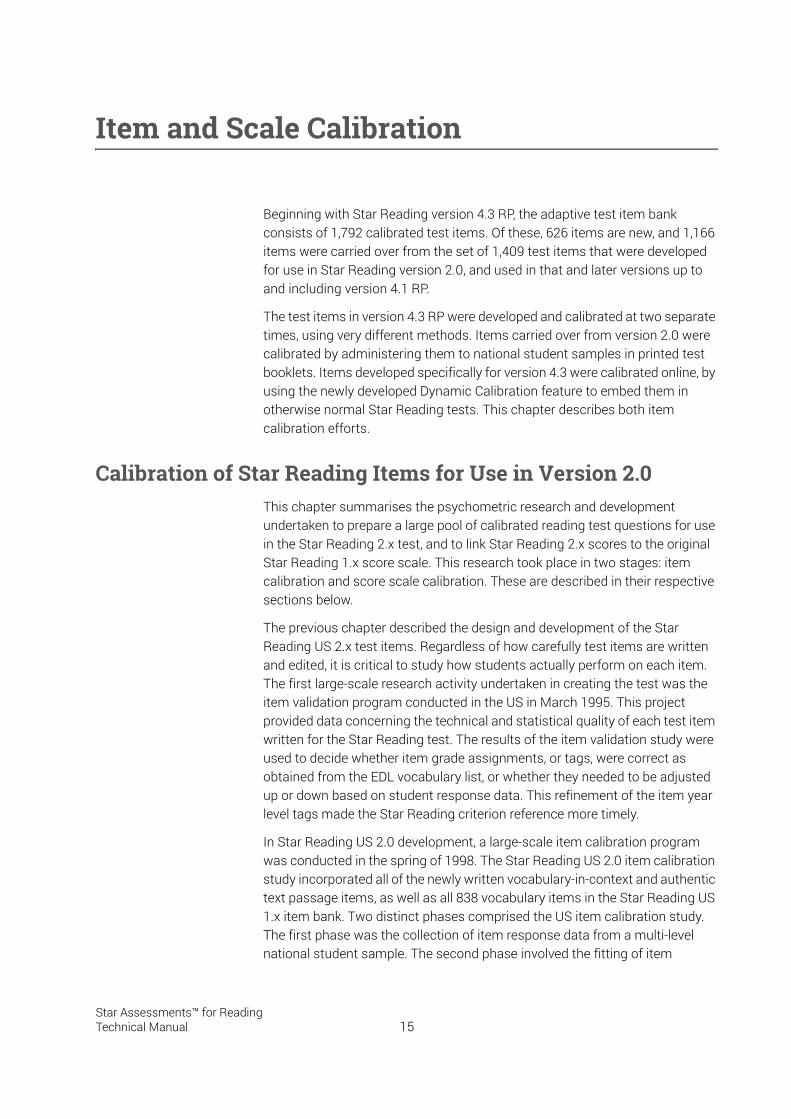
Beginning with Star Reading version 4.3 RP, the adaptive test item bank consists of 1,792 calibrated test items. Of these, 626 items are new, and 1,166 items were carried over from the set of 1,409 test items that were developed for use in Star Reading version 2.0, and used in that and later versions up to and including version 4.1 RP.
The test items in version 4.3 RP were developed and calibrated at two separate times, using very different methods. Items carried over from version 2.0 were calibrated by administering them to national student samples in printed test booklets. Items developed specifically for version 4.3 were calibrated online, by using the newly developed Dynamic Calibration feature to embed them in otherwise normal Star Reading tests. This chapter describes both item calibration efforts.
Calibration of Star Reading Items for Use in Version 2.0This chapter summarises the psychometric research and development undertaken to prepare a large pool of calibrated reading test questions for use in the Star Reading 2.x test, and to link Star Reading 2.x scores to the original Star Reading 1.x score scale. This research took place in two stages: item calibration and score scale calibration. These are described in their respective sections below.
The previous chapter described the design and development of the Star Reading US 2.x test items. Regardless of how carefully test items are written and edited, it is critical to study how students actually perform on each item. The first large-scale research activity undertaken in creating the test was the item validation program conducted in the US in March 1995. This project provided data concerning the technical and statistical quality of each test item written for the Star Reading test. The results of the item validation study were used to decide whether item grade assignments, or tags, were correct as obtained from the EDL vocabulary list, or whether they needed to be adjusted up or down based on student response data. This refinement of the item year level tags made the Star Reading criterion reference more timely.
In Star Reading US 2.0 development, a large-scale item calibration program was conducted in the spring of 1998. The Star Reading US 2.0 item calibration study incorporated all of the newly written vocabulary-in-context and authentic text passage items, as well as all 838 vocabulary items in the Star Reading US 1.x item bank. Two distinct phases comprised the US item calibration study. The first phase was the collection of item response data from a multi-level national student sample. The second phase involved the fitting of item
15Star Assessments™ for ReadingTechnical Manual
Item and Scale CalibrationSample Description
response models to the data, and developing a single IRT difficulty scale spanning all levels from US grades 1–12 (equivalent to Years 2–13).
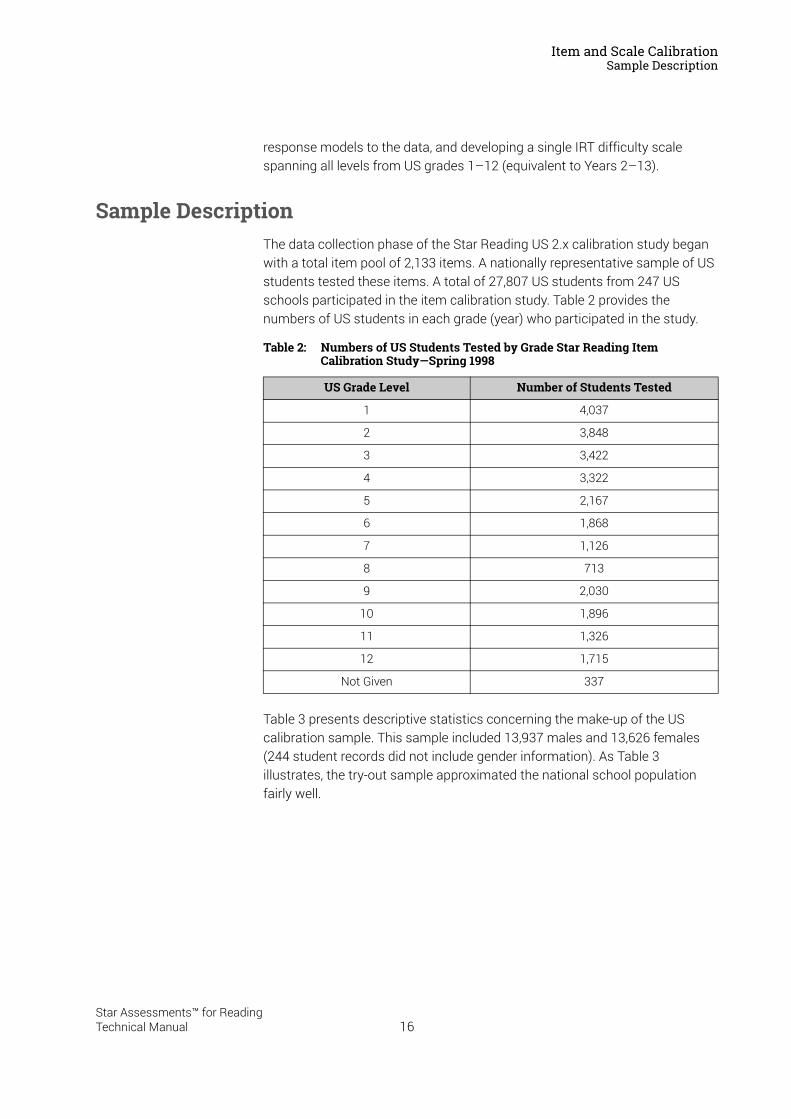
Sample DescriptionThe data collection phase of the Star Reading US 2.x calibration study began with a total item pool of 2,133 items. A nationally representative sample of US students tested these items. A total of 27,807 US students from 247 US schools participated in the item calibration study. Table 2 provides the numbers of US students in each grade (year) who participated in the study.
Table 3 presents descriptive statistics concerning the make-up of the US calibration sample. This sample included 13,937 males and 13,626 females (244 student records did not include gender information). As Table 3 illustrates, the try-out sample approximated the national school population fairly well.
Table 2: Numbers of US Students Tested by Grade Star Reading Item Calibration Study—Spring 1998
US Grade Level Number of Students Tested
1 4,037
2 3,848
3 3,422
4 3,322
5 2,167
6 1,868
7 1,126
8 713
9 2,030
10 1,896
11 1,326
12 1,715
Not Given 337
16Star Assessments™ for ReadingTechnical Manual
Item and Scale CalibrationSample Description
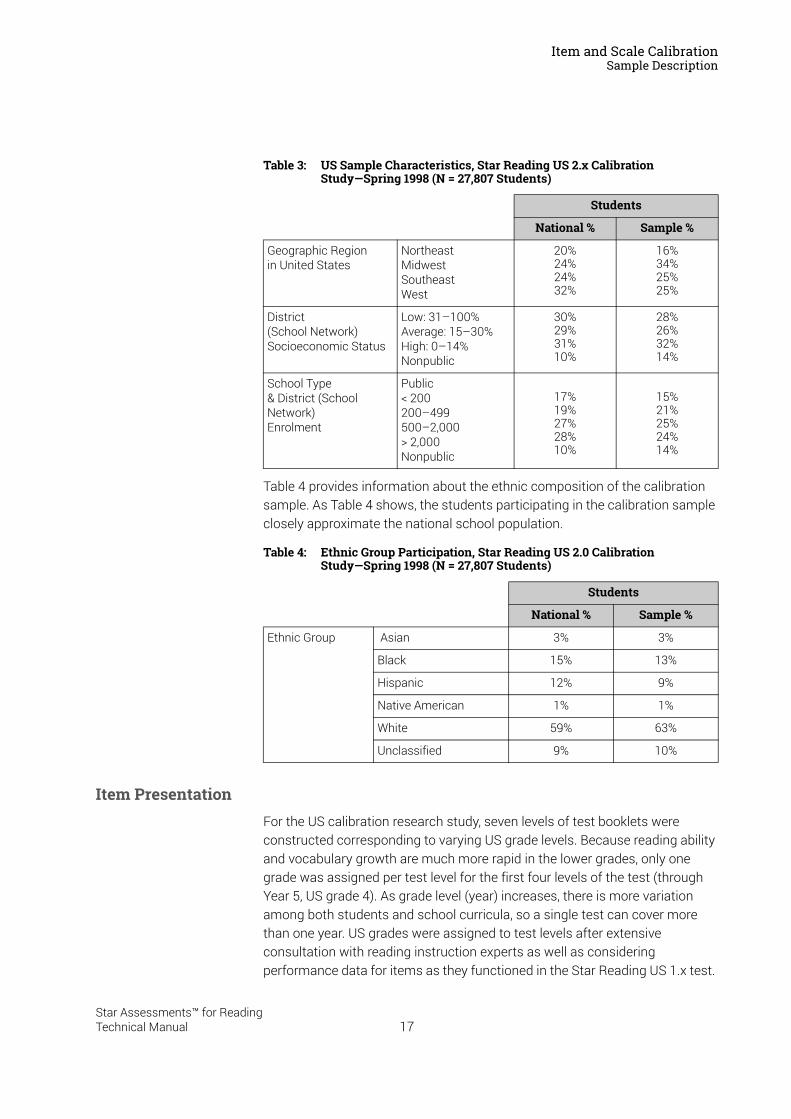
Table 4 provides information about the ethnic composition of the calibration sample. As Table 4 shows, the students participating in the calibration sample closely approximate the national school population.
Item PresentationFor the US calibration research study, seven levels of test booklets were constructed corresponding to varying US grade levels. Because reading ability and vocabulary growth are much more rapid in the lower grades, only one grade was assigned per test level for the first four levels of the test (through Year 5, US grade 4). As grade level (year) increases, there is more variation among both students and school curricula, so a single test can cover more than one year. US grades were assigned to test levels after extensive consultation with reading instruction experts as well as considering performance data for items as they functioned in the Star Reading US 1.x test.
Table 3: US Sample Characteristics, Star Reading US 2.x Calibration Study—Spring 1998 (N = 27,807 Students)
Students
National % Sample %
Geographic Region in United States
NortheastMidwestSoutheastWest
20%24%24%32%
16%34%25%25%
District (School Network) Socioeconomic Status
Low: 31–100%Average: 15–30%High: 0–14%Nonpublic
30%29%31%10%
28%26%32%14%
School Type& District (School Network)Enrolment
Public< 200200–499500–2,000> 2,000Nonpublic
17%19%27%28%10%
15%21%25%24%14%
Table 4: Ethnic Group Participation, Star Reading US 2.0 Calibration Study—Spring 1998 (N = 27,807 Students)
Students
National % Sample %
Ethnic Group Asian 3% 3%
Black 15% 13%
Hispanic 12% 9%
Native American 1% 1%
White 59% 63%
Unclassified 9% 10%
17Star Assessments™ for ReadingTechnical Manual
Item and Scale CalibrationSample Description
Items were assigned to years such that the resulting test forms sampled an appropriate range of reading ability typically represented at or near the targeted US grade levels.
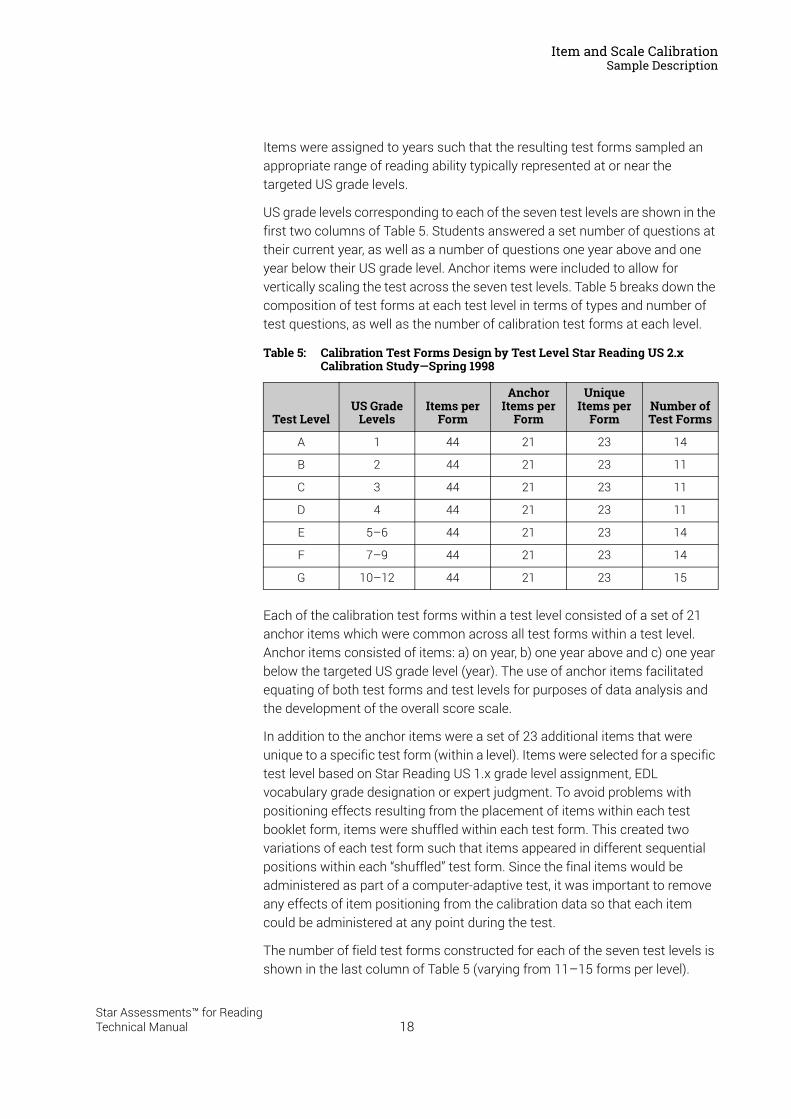
US grade levels corresponding to each of the seven test levels are shown in the first two columns of Table 5. Students answered a set number of questions at their current year, as well as a number of questions one year above and one year below their US grade level. Anchor items were included to allow for vertically scaling the test across the seven test levels. Table 5 breaks down the composition of test forms at each test level in terms of types and number of test questions, as well as the number of calibration test forms at each level.
Each of the calibration test forms within a test level consisted of a set of 21 anchor items which were common across all test forms within a test level. Anchor items consisted of items: a) on year, b) one year above and c) one year below the targeted US grade level (year). The use of anchor items facilitated equating of both test forms and test levels for purposes of data analysis and the development of the overall score scale.
In addition to the anchor items were a set of 23 additional items that were unique to a specific test form (within a level). Items were selected for a specific test level based on Star Reading US 1.x grade level assignment, EDL vocabulary grade designation or expert judgment. To avoid problems with positioning effects resulting from the placement of items within each test booklet form, items were shuffled within each test form. This created two variations of each test form such that items appeared in different sequential positions within each “shuffled” test form. Since the final items would be administered as part of a computer-adaptive test, it was important to remove any effects of item positioning from the calibration data so that each item could be administered at any point during the test.
The number of field test forms constructed for each of the seven test levels is shown in the last column of Table 5 (varying from 11–15 forms per level).
Table 5: Calibration Test Forms Design by Test Level Star Reading US 2.x Calibration Study—Spring 1998
Test LevelUS Grade
LevelsItems per
Form
Anchor Items per
Form
Unique Items per
FormNumber of Test Forms
A 1 44 21 23 14
B 2 44 21 23 11
C 3 44 21 23 11
D 4 44 21 23 11
E 5–6 44 21 23 14
F 7–9 44 21 23 14
G 10–12 44 21 23 15
18Star Assessments™ for ReadingTechnical Manual
Item and Scale CalibrationSample Description
Calibration test forms were spiralled within a class such that each student received a test form essentially at random. This design ensured that no more than two or three students in any class attempted any particular try-out item. Additionally, it ensured a balance of student ability across the various try-out forms. Typically, 250–300 students at the designated US grade level of the test item received a given question on their test.
It is important to note that the majority of questions in the Star Reading US 2.x calibration study already had some performance data on them. All of the questions from the Star Reading US 1.x item bank were included, as were many items that were previously field tested, but were not included in the Star Reading US 1.x test.
Following extensive quality control checks, the Star Reading US 2.x calibration research item response data were analysed, by level, using both traditional item analysis techniques and IRT methods. For each test item, the following information was derived using traditional psychometric item analysis techniques:
The number of students who attempted to answer the item
The number of students who did not attempt to answer the item
The percentage of students who answered the item correctly (a traditional measure of difficulty)
The percentage of students who selected each answer choice
The correlation between answering the item correctly and the total score (a traditional measure of item discrimination)
The correlation between the endorsement of an alternative answer and the total score
Item DifficultyThe difficulty of an item, in traditional item analysis, is the percentage of students who answer the item correctly. This is typically referred to as the “p-value” of the item. Low p-values (such as 15%) indicate that the item is difficult since only a small percentage of students answered it correctly. High p-values (such as 90%) indicate that the majority of students answered the item correctly, and thus the item is easy. It should be noted that the p-value only has meaning for a particular item relative to the characteristics of the sample of students who responded to it.
Item DiscriminationThe traditional measure of the discrimination of an item is the correlation between the mark on the item (correct or incorrect) and the total test score. Items that correlate well with total test score also tend to correlate well with one another and produce a test that is more reliable (more internally
19Star Assessments™ for ReadingTechnical Manual
Item and Scale CalibrationSample Description
consistent). For the correct answer, the higher the correlation between item mark and total score, the better the item is at discriminating between low scoring and high scoring students. Such items generally will produce optimal test performance. When the correlation between the correct answer and total test score is low (or negative), it typically indicates that the item is not performing as intended. The correlation between endorsing incorrect answers and total score should generally be low since there should not be a positive relationship between selecting an incorrect answer and scoring higher on the overall test.
Item Response FunctionIn addition to traditional item analyses, the Star Reading calibration data were analysed using Item Response Theory (IRT) methods. Although IRT encompasses a family of mathematical models, the one-parameter (or Rasch) IRT model was selected for the Star Reading 2.x data both for its simplicity and its ability to accurately model the performance of the Star Reading 2.x items.
IRT attempts to model quantitatively what happens when a student with a specific level of ability attempts to answer a specific question. IRT calibration places the item difficulty and student ability on the same scale; the relationship between them can be represented graphically in the form of an item response function (IRF), which describes the probability of answering an item correctly as a function of the student’s ability and the difficulty of the item.
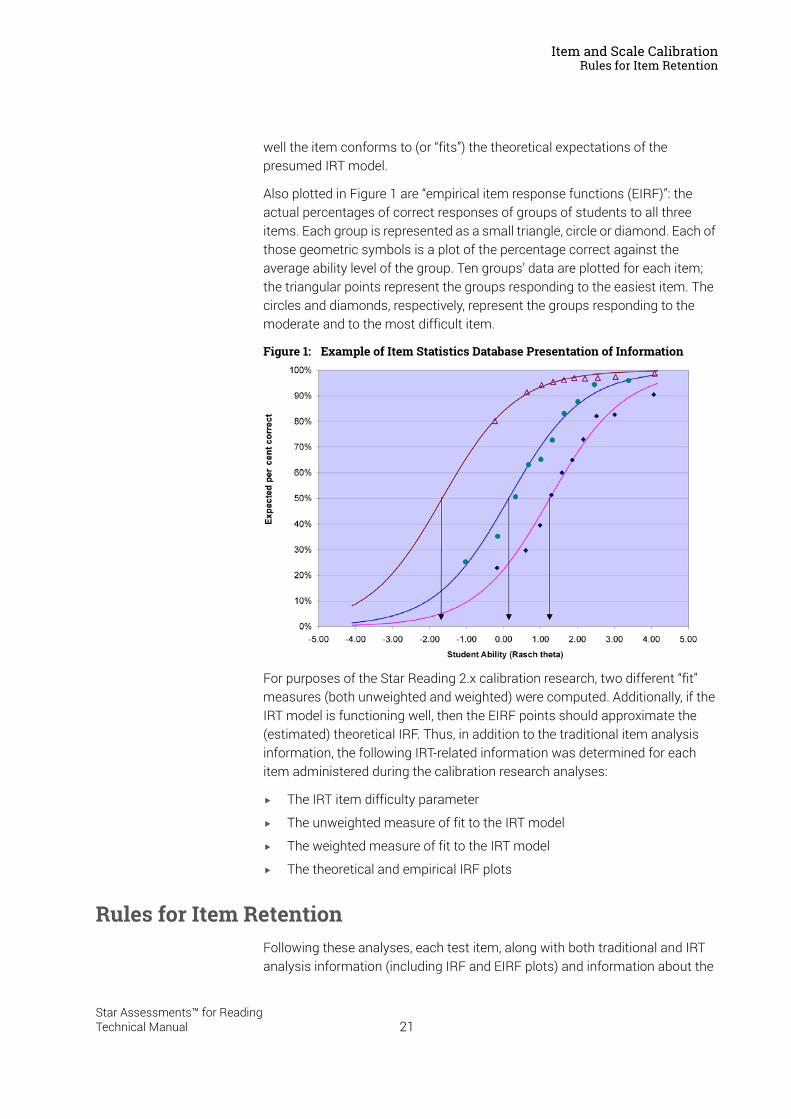
Figure 1 is a plot of three item response functions: one for an easy item, one for a more difficult one and one for a very difficult item. Each plot is a continuous S-shaped (ogive) curve. The horizontal axis is the scale of student ability, ranging from very low ability (–5.0 on the scale) to very high ability (+5.0 on the scale). The vertical axis is the percentage of students expected to answer each of the three items correctly at any given point on the ability scale. Notice that the expected percentage correct increases as student ability increases, but varies from one item to another.
In Figure 1, each item’s difficulty is the scale point where the expected percentage correct is exactly 50. These points are depicted by vertical lines going from the 50% point to the corresponding locations on the ability scale. The easiest item has a difficulty scale value of about –1.67; this means that students located at –1.67 on the ability scale have a 50-50 chance of answering that item right. The scale values of the other two items are approximately +0.20 and +1.25, respectively.
Calibration of test items estimates the IRT difficulty parameter for each test item and places all of the item parameters onto a common scale. The difficulty parameter for each item is estimated, along with measures to indicate how
20Star Assessments™ for ReadingTechnical Manual
Item and Scale CalibrationRules for Item Retention
well the item conforms to (or “fits”) the theoretical expectations of the presumed IRT model.
Also plotted in Figure 1 are “empirical item response functions (EIRF)”: the actual percentages of correct responses of groups of students to all three items. Each group is represented as a small triangle, circle or diamond. Each of those geometric symbols is a plot of the percentage correct against the average ability level of the group. Ten groups’ data are plotted for each item; the triangular points represent the groups responding to the easiest item. The circles and diamonds, respectively, represent the groups responding to the moderate and to the most difficult item.
Figure 1: Example of Item Statistics Database Presentation of Information
For purposes of the Star Reading 2.x calibration research, two different “fit” measures (both unweighted and weighted) were computed. Additionally, if the IRT model is functioning well, then the EIRF points should approximate the (estimated) theoretical IRF. Thus, in addition to the traditional item analysis information, the following IRT-related information was determined for each item administered during the calibration research analyses:
The IRT item difficulty parameter
The unweighted measure of fit to the IRT model
The weighted measure of fit to the IRT model
The theoretical and empirical IRF plots
Rules for Item RetentionFollowing these analyses, each test item, along with both traditional and IRT analysis information (including IRF and EIRF plots) and information about the
21Star Assessments™ for ReadingTechnical Manual
Item and Scale CalibrationRules for Item Retention
test level, form and item identifier, were stored in an item statistics database. A panel of US content reviewers then examined each item, within content strands, to determine whether the item met all criteria for inclusion into the bank of items that would be used in the US norming version of the Star Reading US 2.x test. The item statistics database allowed experts easy access to all available information about an item in order to interactively designate items that, in their opinion, did not meet acceptable standards for inclusion in the Star Reading US 2.x item bank.
US item selection was completed based on the following criteria. Items were eliminated when:
Item-total correlation (item discrimination) was less than 0.30
Some other answer option had an item discrimination that was high
Sample size of students attempting the item was less than 300
The traditional item difficulty indicated that the item was too difficult or too easy
The item did not appear to fit the Rasch IRT model
After each US content reviewer had designated certain items for elimination, their recommendations were combined and a second review was conducted to resolve issues where there was not uniform agreement among all reviewers.
Of the initial 2,133 items administered in the US Star reading 2.0 calibration research study, 1,409 were deemed of sufficient quality to be retained for further analyses. Traditional item-level analyses were conducted again on the reduced data set that excluded the eliminated items. IRT calibration was also performed on the reduced data set and all test forms and levels were equated based on the information provided by the embedded anchor items within each test form. This resulted in placing the IRT item difficulty parameters for all items onto a single scale spanning US grades 1–12 (Years 2–13).
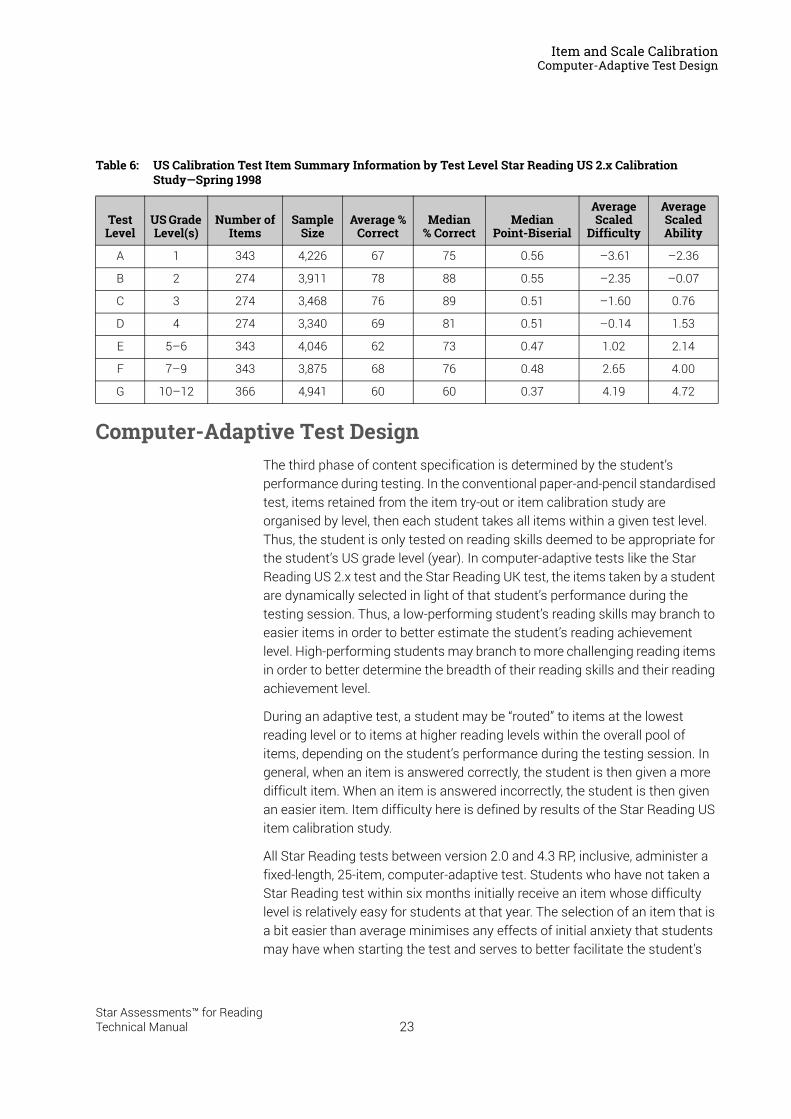
Table 6 summarises the final analysis information for the test items included in the US calibration test forms by test level (A–G). As shown in the table, the item placements in test forms were appropriate: the average percentage of students correctly answering items is relatively constant across test levels. Note, however, that the average scaled difficulty of the items increases across successive levels of the calibration tests, as does the average scaled ability of the students who answered questions at each test level. The median point-biserial correlation, as shown in the table, indicates that the test items were performing well.
22Star Assessments™ for ReadingTechnical Manual
Item and Scale CalibrationComputer-Adaptive Test Design
Computer-Adaptive Test DesignThe third phase of content specification is determined by the student’s performance during testing. In the conventional paper-and-pencil standardised test, items retained from the item try-out or item calibration study are organised by level, then each student takes all items within a given test level. Thus, the student is only tested on reading skills deemed to be appropriate for the student’s US grade level (year). In computer-adaptive tests like the Star Reading US 2.x test and the Star Reading UK test, the items taken by a student are dynamically selected in light of that student’s performance during the testing session. Thus, a low-performing student’s reading skills may branch to easier items in order to better estimate the student’s reading achievement level. High-performing students may branch to more challenging reading items in order to better determine the breadth of their reading skills and their reading achievement level.
During an adaptive test, a student may be “routed” to items at the lowest reading level or to items at higher reading levels within the overall pool of items, depending on the student’s performance during the testing session. In general, when an item is answered correctly, the student is then given a more difficult item. When an item is answered incorrectly, the student is then given an easier item. Item difficulty here is defined by results of the Star Reading US item calibration study.
All Star Reading tests between version 2.0 and 4.3 RP, inclusive, administer a fixed-length, 25-item, computer-adaptive test. Students who have not taken a Star Reading test within six months initially receive an item whose difficulty level is relatively easy for students at that year. The selection of an item that is a bit easier than average minimises any effects of initial anxiety that students may have when starting the test and serves to better facilitate the student’s
Table 6: US Calibration Test Item Summary Information by Test Level Star Reading US 2.x Calibration Study—Spring 1998
Test Level
US Grade Level(s)
Number of Items
Sample Size
Average % Correct
Median % Correct
Median Point-Biserial
Average Scaled
Difficulty
Average Scaled Ability
A 1 343 4,226 67 75 0.56 –3.61 –2.36
B 2 274 3,911 78 88 0.55 –2.35 –0.07
C 3 274 3,468 76 89 0.51 –1.60 0.76
D 4 274 3,340 69 81 0.51 –0.14 1.53
E 5–6 343 4,046 62 73 0.47 1.02 2.14
F 7–9 343 3,875 68 76 0.48 2.65 4.00
G 10–12 366 4,941 60 60 0.37 4.19 4.72
23Star Assessments™ for ReadingTechnical Manual
Item and Scale CalibrationScoring in the Star Reading Tests
initial reactions to the test. These starting points vary by year and were based on research conducted as part of the US national item calibration study.
When a student has taken a Star Reading test within the last six months, the difficulty of the first item depends on that student’s previous Star Reading test score information. After the administration of the initial item, and after the student has entered an answer, Star Reading software estimates the student’s reading ability. The software then selects the next item randomly from among all of the items available that closely match the student’s estimated reading ability. (See Table 1 on page 14 for converting US grade levels to UK years.)
Randomisation of items with difficulty values near the student’s adjusted reading ability allows the program to avoid overexposure of test items. All items are dynamically selected from an item bank consisting of all the retained vocabulary-in-context items. Items that have been administered to the same student within the past six-month time period are not available for administration. The large number of items available in the item pools, however, ensure that this minor constraint has negligible impact on the quality of each Star Reading computer-adaptive test.
Scoring in the Star Reading TestsFollowing the administration of each Star Reading item, and after the student has selected an answer, an updated estimate of the student’s reading ability is computed based on the student’s responses to all items that have been administered up to that point. A proprietary Bayesian-modal Item Response Theory (IRT) estimation method is used for scoring until the student has answered at least one item correctly and one item incorrectly. Once the student has met the 1-correct/1-incorrect criterion, Star Reading software uses a proprietary Maximum-Likelihood IRT estimation procedure to avoid any potential of bias in the Scaled Scores.
This approach to scoring enables the Star Reading 3.x RP and higher test to provide Scaled Scores that are statistically consistent and efficient. Accompanying each Scaled Score is an associated measure of the degree of uncertainty, called the standard error of measurement (SEM). Unlike a conventional paper-and-pencil test, the SEM values for the Star Reading test are unique for each student. SEM values are dependent on the particular items the student received and on their performance on those items.
Scaled Scores are expressed on a common scale that spans all UK years covered by Star Reading 3.x RP and higher (Years 1–13). Because of this common scale, Scaled Scores are directly comparable with each other, regardless of year.
24Star Assessments™ for ReadingTechnical Manual
Item and Scale CalibrationScale Calibration
Scale CalibrationThe outcome of the US item calibration study described above was a sizeable bank of test items suitable for use in the Star Reading test, with an IRT difficulty scale parameter for each item. The difficulty scale itself was devised such that it spanned a range of item difficulty from US kindergarten level through US grade level 12 (Years 2–13). An important feature of Item Response Theory is that the same scale used to characterise the difficulty of the test items is also used to characterise examinees’ ability; in fact, IRT models express the probability of a correct response as a function of the difference between the scale values of an item’s difficulty and an examinee’s ability. The IRT ability/difficulty scale is continuous; in the Star Reading US 2.x norming, described in “Score Definitions” on page 28, the values of observed ability ranged from about –7.3 to +9.2, with the zero value occurring at about the US sixth-grade level (Year 7).
The Linking Study4,589 US students from around the country, spanning all 12 US grades, participated in the linking study. Linking study participants took both Star Reading US 1.x and Star Reading US 2.x tests within a few days of each other. The order in which they took the two test versions was counterbalanced to account for the effects of practice and fatigue. Test score data collected were edited for quality assurance purposes, and 38 cases with anomalous data were eliminated from the linking analyses; the linking was accomplished using data from 4,551 cases. The linking of the two score scales was accomplished by means of an equipercentile equating involving all 4,551 cases, weighted to account for differences in sample sizes across US grades. The resulting table of 99 sets of equipercentile equivalent scores was then smoothed using a monotonic spline function, and that function was used to derive a table of Scaled Score equivalents corresponding to the entire range of IRT ability scores observed in the norming study. These Star Reading US 2.x Scaled Score equivalents range from 0 to 1400. Star Reading UK uses the same Scaled Score that was developed for Star Reading US 3.x RP and higher.1
Summary statistics of the test scores of the 4,551 cases included in the US linking analysis are listed in Table 7. The table lists actual Star Reading US 1.x Scaled Score means and standard deviations, as well as the same statistics for Star Reading US 2.x IRT ability estimates and equivalent Scaled Scores calculated using the conversion table from the linking study. Comparing the Star Reading US 1.x Scaled Score means to the IRT ability score means
1. Data from the linking study made it clear that Star Reading US 2.x software measures ability levels extending beyond the minimum and maximum Star Reading US 1.x Scaled Scores. In order to retain the superior bandwidth of Star Reading US 2.x software, extrapolation procedures were used to extend the Scaled Score range below 50 and above 1,350.
25Star Assessments™ for ReadingTechnical Manual
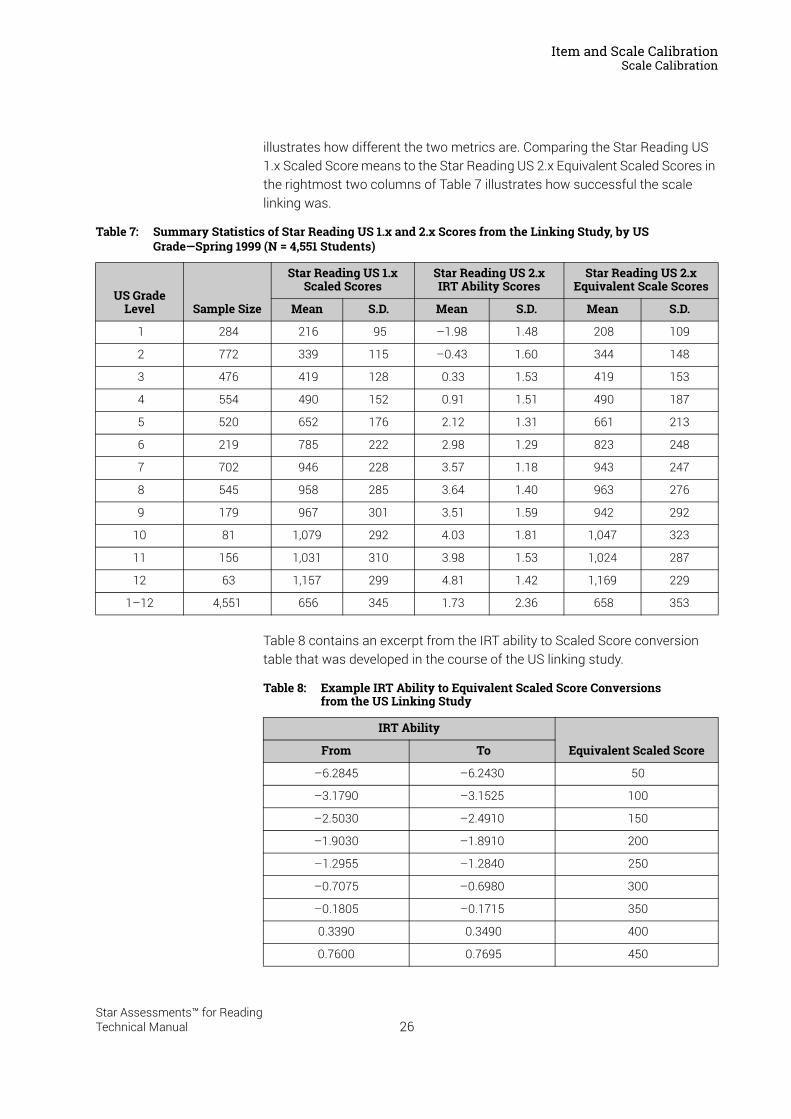
Item and Scale CalibrationScale Calibration
illustrates how different the two metrics are. Comparing the Star Reading US 1.x Scaled Score means to the Star Reading US 2.x Equivalent Scaled Scores in the rightmost two columns of Table 7 illustrates how successful the scale linking was.
Table 8 contains an excerpt from the IRT ability to Scaled Score conversion table that was developed in the course of the US linking study.
Table 7: Summary Statistics of Star Reading US 1.x and 2.x Scores from the Linking Study, by US Grade—Spring 1999 (N = 4,551 Students)
US Grade Level Sample Size
Star Reading US 1.x Scaled Scores
Star Reading US 2.xIRT Ability Scores
Star Reading US 2.xEquivalent Scale Scores
Mean S.D. Mean S.D. Mean S.D.
1 284 216 95 –1.98 1.48 208 109
2 772 339 115 –0.43 1.60 344 148
3 476 419 128 0.33 1.53 419 153
4 554 490 152 0.91 1.51 490 187
5 520 652 176 2.12 1.31 661 213
6 219 785 222 2.98 1.29 823 248
7 702 946 228 3.57 1.18 943 247
8 545 958 285 3.64 1.40 963 276
9 179 967 301 3.51 1.59 942 292
10 81 1,079 292 4.03 1.81 1,047 323
11 156 1,031 310 3.98 1.53 1,024 287
12 63 1,157 299 4.81 1.42 1,169 229
1–12 4,551 656 345 1.73 2.36 658 353
Table 8: Example IRT Ability to Equivalent Scaled Score Conversions from the US Linking Study
IRT Ability
Equivalent Scaled ScoreFrom To
–6.2845 –6.2430 50
–3.1790 –3.1525 100
–2.5030 –2.4910 150
–1.9030 –1.8910 200
–1.2955 –1.2840 250
–0.7075 –0.6980 300
–0.1805 –0.1715 350
0.3390 0.3490 400
0.7600 0.7695 450
26Star Assessments™ for ReadingTechnical Manual
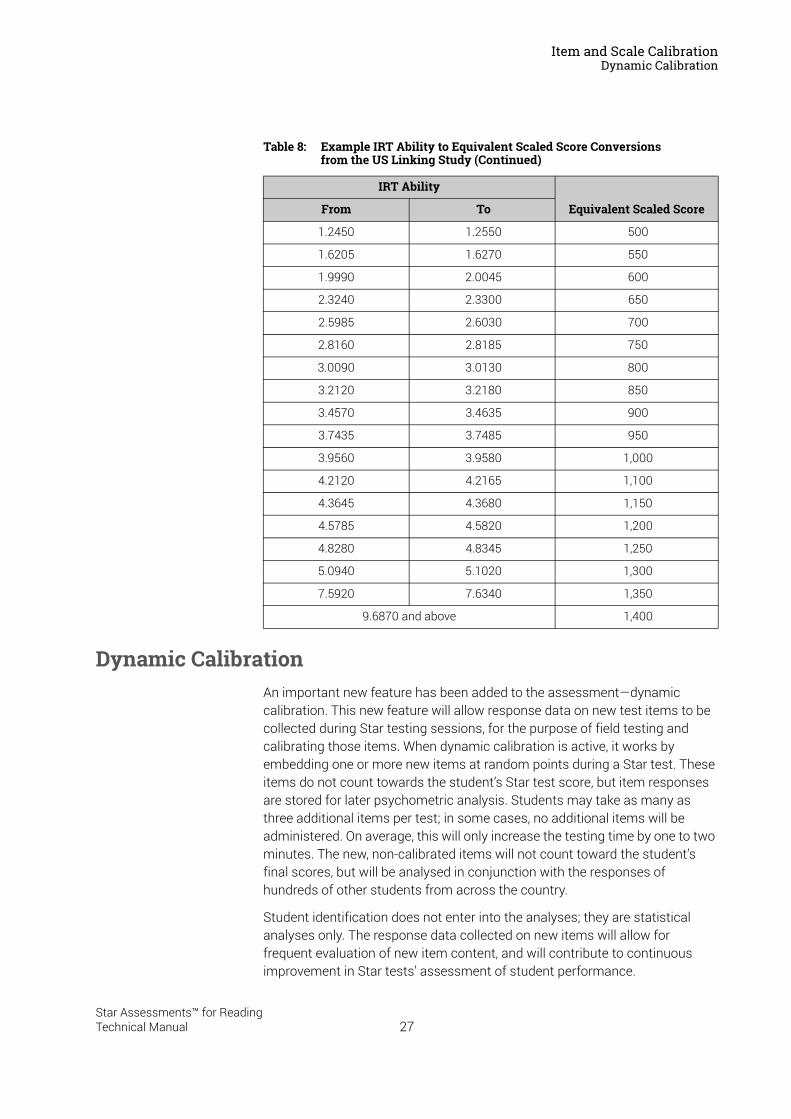
Item and Scale CalibrationDynamic Calibration
Dynamic CalibrationAn important new feature has been added to the assessment—dynamic calibration. This new feature will allow response data on new test items to be collected during Star testing sessions, for the purpose of field testing and calibrating those items. When dynamic calibration is active, it works by embedding one or more new items at random points during a Star test. These items do not count towards the student’s Star test score, but item responses are stored for later psychometric analysis. Students may take as many as three additional items per test; in some cases, no additional items will be administered. On average, this will only increase the testing time by one to two minutes. The new, non-calibrated items will not count toward the student’s final scores, but will be analysed in conjunction with the responses of hundreds of other students from across the country.
Student identification does not enter into the analyses; they are statistical analyses only. The response data collected on new items will allow for frequent evaluation of new item content, and will contribute to continuous improvement in Star tests’ assessment of student performance.
1.2450 1.2550 500
1.6205 1.6270 550
1.9990 2.0045 600
2.3240 2.3300 650
2.5985 2.6030 700
2.8160 2.8185 750
3.0090 3.0130 800
3.2120 3.2180 850
3.4570 3.4635 900
3.7435 3.7485 950
3.9560 3.9580 1,000
4.2120 4.2165 1,100
4.3645 4.3680 1,150
4.5785 4.5820 1,200
4.8280 4.8345 1,250
5.0940 5.1020 1,300
7.5920 7.6340 1,350
9.6870 and above 1,400
Table 8: Example IRT Ability to Equivalent Scaled Score Conversions from the US Linking Study (Continued)
IRT Ability
Equivalent Scaled ScoreFrom To
27Star Assessments™ for ReadingTechnical Manual
Score Definitions
Star Reading software provides two broad types of scores: criterion-referenced scores and norm-referenced scores. For informative purposes, the full range of Star Reading criterion-referenced and norm-referenced scores is described in this chapter.
Types of Test ScoresIn a broad sense, Star Reading software provides two different types of test scores that measure student performance in different ways:
Criterion-referenced scores measure student performance by comparing it to a standard criterion. This criterion can come in any number of forms; common criterion foundations include material covered in a specific text, lecture or course. It could also take the form of curriculum or district educational standards. These scores provide a measure of student achievement compared with a fixed criterion; they do not provide any measure of comparability to other students. The criterion-referenced score reported by Star Reading US software is the Instructional Reading Level, which compares a student’s test performance to 1995 updated vocabulary lists that were based on the EDL Core Vocabulary.
Norm-referenced scores compare a student’s test results with the results of other students who have taken the same test. In this case, scores provide a relative measure of student achievement compared to the performance of a group of students at a given time. Normed Referenced Standardised Score, Percentile Ranks and Year Equivalents are the primary norm-referenced scores available in Star Reading software.
Estimated Oral Reading Fluency (Est. ORF)Estimated Oral Reading Fluency is an estimate of a student’s ability to read words quickly and accurately in order to comprehend text efficiently. Students with oral reading fluency demonstrate accurate decoding, automatic word recognition and appropriate use of the rhythmic aspects of language (e.g., intonation, phrasing, pitch and emphasis).
Estimated ORF is reported in correct words per minute, and is based on the correlation between Star Reading performance and a recent study that measured student oral reading using a popular assessment. Estimated ORF is only reported for students in Years 2–5.
28Star Assessments™ for ReadingTechnical Manual
Score DefinitionsTypes of Test Scores
Lexile® MeasuresIn cooperation with MetaMetrics®, beginning in August 2014, users of Star Reading will have the option of including Lexile measures and Lexile ZPD ranges on certain Star Reading score reports. Reported Lexile measures will range from BR400L to 1825L. (The “L” suffix identified the score as a Lexile measure. Where it appears, the “BR” prefix indicates a score that is below 0 on the Lexile scale; such scores are typical of beginning readers.)
Lexile ZPD RangesA Lexile ZPD range is a student’s ZPD Range converted to MetaMetrics’ Lexile scale of the readability of text. When a Star Reading user opts to report student reading abilities in the Lexile metric, the ZPD range will also be reported in that same metric. The reported Lexile ZPD ranges are equivalent to the grade level ZPD ranges used in Star Reading and Accelerated Reader, expressed on the Lexile scale instead of as ATOS reading grade levels.
Lexile Measures of Students and Books: Measures of Student Reading Achievement and Text Readability
The ability to read and comprehend written text is important for academic success. Students may, however, benefit most from reading materials that match their reading ability/achievement: reading materials that are neither too easy nor too hard so as to maximize learning. To facilitate students’ choices of appropriate reading materials, measures commonly referred to as readability measures are used in conjunction with students’ reading achievement measures.
A text readability measure can be defined as a numeric scale, often derived analytically, that takes into account text characteristics that influence text comprehension or readability. An example of a readability measure is an age-level estimate of text difficulty. Among text characteristics that can affect text comprehension are sentence length and word difficulty.
A person’s reading measure is a numeric score obtained from a reading achievement test, usually a standardized test such as Star Reading. A person’s reading score quantifies his/her reading achievement level at a particular point in time.
Matching a student with text/books that target a student’s interest and level of reading achievement is a two-step process: first, a student’s reading achievement score is obtained by administering a standardized reading achievement test; second, the reading achievement score serves as an entry point into the readability measure to determine the difficulty level of text/books that would best support independent reading for the student. Optimally, a readability measure should match students with books that they are able to read and comprehend independently without boredom or frustration: books
29Star Assessments™ for ReadingTechnical Manual
Score DefinitionsTypes of Test Scores
that are engaging yet slightly challenging to students based on the students’ reading achievement and grade level.
Renaissance Learning’s (RLI) readability measure is known as the Advantage/TASA Open Standard for Readability (ATOS). The ATOS for Text readability formula was developed through extensive research by RLI in conjunction with Touchstone Applied Science Associates, Inc. (TASA), now called Questar Assessment, Inc. A great many school libraries use ATOS book levels to index readability of their books. ATOS book levels, which are derived from ATOS for Books measures, express readability as year levels; for example, an ATOS readability measure of 4.2 means that the book is at a difficulty level appropriate for students reading at a typical level of students in year 5, month 2. To match students to books at an appropriate level, the widely used Accelerated Reader system uses ATOS measures of readability and student’s Grade Equivalent (GE) scores on standardized reading tests such as Star Reading.
Another widely-used system for matching readers to books at appropriate difficulty levels is The Lexile® Framework® for Reading, developed by MetaMetrics, Inc. The Lexile scale is a common scale for both text measure (readability or text difficulty) and reader measure (reading achievement scores); in the Lexile Framework, both text difficulty and person reading ability are measured on the same scale. Unlike ATOS for Books, the Lexile Framework expresses a book’s reading difficulty level (and students’ reading ability levels) on a continuous scale ranging from below 0 to 1825 or more. Because some schools and school libraries use the Lexile Framework to index the reading difficulty levels of their books, there was a need to provide users of Star Reading with a student reading ability score compatible with the Lexile Framework.
In 2014, Metametrics, Inc., developed a means to translate Star Reading scale scores into equivalent Lexile measures of student reading ability. To do so, more than 200 MetaMetrics reading test items that had already been calibrated on the Lexile scale were administered in small numbers as unscored scale anchor items at the end of Star Reading tests. More than 250,000 students in grades 1 through 12 took up to 6 of those items as part of their Star Reading tests in April 2014. MetaMetrics’ analysis of the Star Reading and Lexile anchor item response data yielded a means of transforming Star Reading’s underlying Rasch scores into equivalent Lexile scores. That transformation, in turn, was used to develop a concordance table listing the Lexile equivalent of each unique Star Reading scale score.
In some cases, a range of text/book reading difficulty in which a student can read independently or with minimal guidance is desired. At RLI, we define the range of reading difficulty level that is neither too hard nor too easy as the Zone of Proximal Development (ZPD). The ZPD range allows, potentially, optimal learning to occur because students are engaged and appropriately challenged by reading materials that match their reading achievement and interest. The ZPD range is simply an approximation of the range of reading
30Star Assessments™ for ReadingTechnical Manual
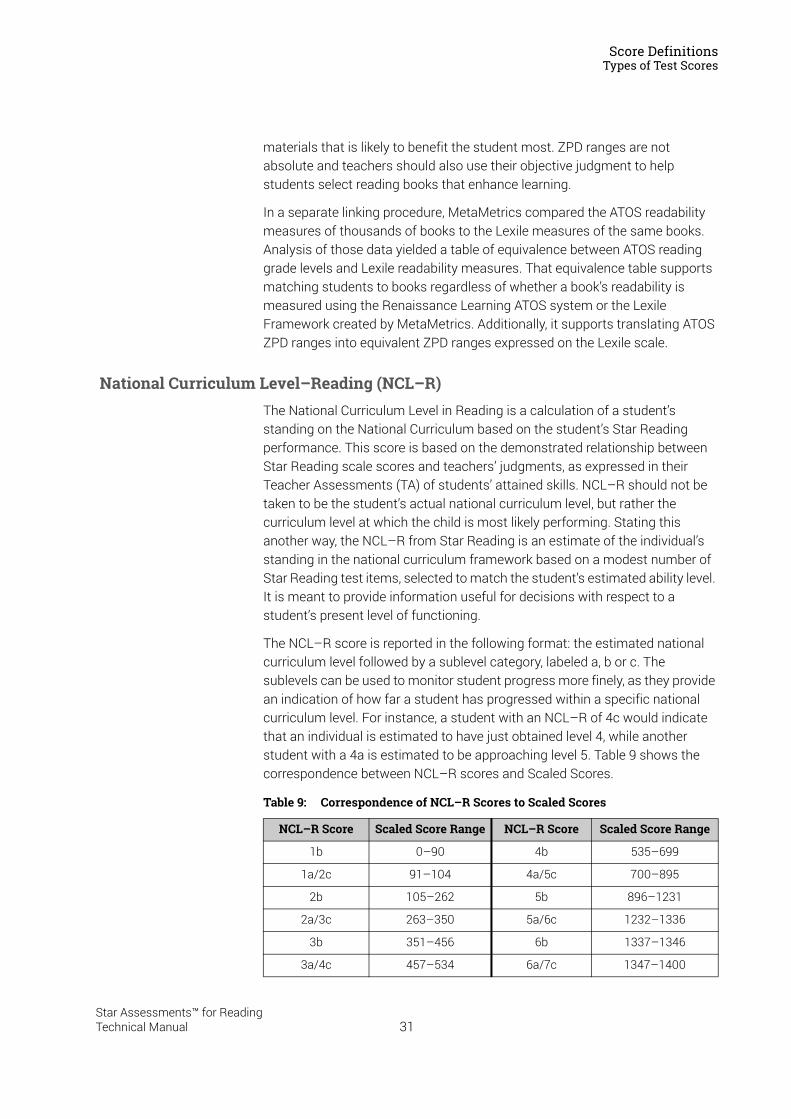
Score DefinitionsTypes of Test Scores
materials that is likely to benefit the student most. ZPD ranges are not absolute and teachers should also use their objective judgment to help students select reading books that enhance learning.
In a separate linking procedure, MetaMetrics compared the ATOS readability measures of thousands of books to the Lexile measures of the same books. Analysis of those data yielded a table of equivalence between ATOS reading grade levels and Lexile readability measures. That equivalence table supports matching students to books regardless of whether a book’s readability is measured using the Renaissance Learning ATOS system or the Lexile Framework created by MetaMetrics. Additionally, it supports translating ATOS ZPD ranges into equivalent ZPD ranges expressed on the Lexile scale.
National Curriculum Level–Reading (NCL–R)The National Curriculum Level in Reading is a calculation of a student’s standing on the National Curriculum based on the student’s Star Reading performance. This score is based on the demonstrated relationship between Star Reading scale scores and teachers’ judgments, as expressed in their Teacher Assessments (TA) of students’ attained skills. NCL–R should not be taken to be the student’s actual national curriculum level, but rather the curriculum level at which the child is most likely performing. Stating this another way, the NCL–R from Star Reading is an estimate of the individual’s standing in the national curriculum framework based on a modest number of Star Reading test items, selected to match the student’s estimated ability level. It is meant to provide information useful for decisions with respect to a student’s present level of functioning.
The NCL–R score is reported in the following format: the estimated national curriculum level followed by a sublevel category, labeled a, b or c. The sublevels can be used to monitor student progress more finely, as they provide an indication of how far a student has progressed within a specific national curriculum level. For instance, a student with an NCL–R of 4c would indicate that an individual is estimated to have just obtained level 4, while another student with a 4a is estimated to be approaching level 5. Table 9 shows the correspondence between NCL–R scores and Scaled Scores.
Table 9: Correspondence of NCL–R Scores to Scaled Scores
NCL–R Score Scaled Score Range NCL–R Score Scaled Score Range
1b 0–90 4b 535–699
1a/2c 91–104 4a/5c 700–895
2b 105–262 5b 896–1231
2a/3c 263–350 5a/6c 1232–1336
3b 351–456 6b 1337–1346
3a/4c 457–534 6a/7c 1347–1400
31Star Assessments™ for ReadingTechnical Manual
Score DefinitionsTypes of Test Scores
It is sometimes difficult to identify whether or not a student is in the top of one level (for instance, 4a) or just beginning the next highest level (for instance, 5c). Therefore, a transition category is used to indicate that a student is performing around the cusp of two adjacent levels. These transition categories are identified by a concatenation of the contiguous levels and sublevel categories. For instance, a student whose skills appear to range between levels 4 and 5, indicating they are probably starting to transition from one level to the next, would obtain an NCL of 4a/5c. These transition scores are provided only at the junction of one level and the next highest. A student’s actual NCL is obtained through national testing and assessment protocols. The estimated score is meant to provide information useful for decisions with respect to a student’s present level of functioning when no current value of the actual NCL is available.
Normed Referenced Standardised Score (NRSS)The Norm Referenced Standardised Score is an age standardised score that converts a student’s “raw score” to a standardised score which takes into account the student’s age in years and months and gives an indication of how the student is performing relative to a national sample of students of the same age. The average score is 100. A higher score is above average and a lower score is below average.
Percentile Rank (PR) and Percentile Rank RangePercentile Ranks range from 1–99 and express student ability relative to the scores of other students of a similar age. For a particular student, this score indicates the percentage of students in the norms group who obtained lower scores. For example, if a student has a PR of 85, the student’s reading skills are greater than 85% of other students of a similar age.
The PR Range reflects the amount of statistical variability in a student’s PR score. If the student were to take the Star Reading test many times in a short period of time, the score would likely fall in this range.
Reading Age (RA)The Reading Age (RA) indicates the typical reading age for an individual with a given value of the Star Reading Scaled Score. This provides an estimate of the chronological age at which students typically obtain that score. The RA score is an approximation based on the demonstrated relationship between Star Reading and other tests of student reading ability, which were normed in the UK. RA scores are transformations of the Star Reading Scaled Score.
The scale is expressed in the following form: YY:MM, where YY indicates the reading age in years and MM the months (see Table 10). For example, an individual who has obtained a reading age of 7:10 would be estimated to be
32Star Assessments™ for ReadingTechnical Manual
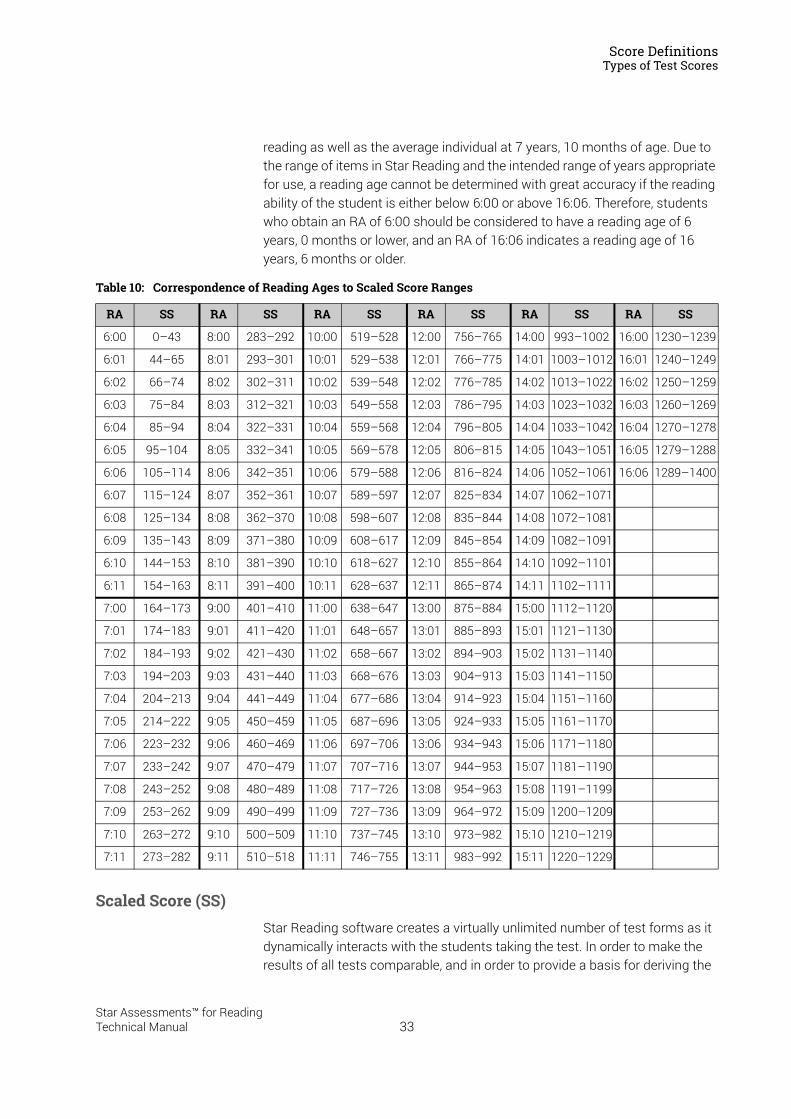
Score DefinitionsTypes of Test Scores
reading as well as the average individual at 7 years, 10 months of age. Due to the range of items in Star Reading and the intended range of years appropriate for use, a reading age cannot be determined with great accuracy if the reading ability of the student is either below 6:00 or above 16:06. Therefore, students who obtain an RA of 6:00 should be considered to have a reading age of 6 years, 0 months or lower, and an RA of 16:06 indicates a reading age of 16 years, 6 months or older.
Scaled Score (SS)Star Reading software creates a virtually unlimited number of test forms as it dynamically interacts with the students taking the test. In order to make the results of all tests comparable, and in order to provide a basis for deriving the
Table 10: Correspondence of Reading Ages to Scaled Score Ranges
RA SS RA SS RA SS RA SS RA SS RA SS
6:00 0–43 8:00 283–292 10:00 519–528 12:00 756–765 14:00 993–1002 16:00 1230–1239
6:01 44–65 8:01 293–301 10:01 529–538 12:01 766–775 14:01 1003–1012 16:01 1240–1249
6:02 66–74 8:02 302–311 10:02 539–548 12:02 776–785 14:02 1013–1022 16:02 1250–1259
6:03 75–84 8:03 312–321 10:03 549–558 12:03 786–795 14:03 1023–1032 16:03 1260–1269
6:04 85–94 8:04 322–331 10:04 559–568 12:04 796–805 14:04 1033–1042 16:04 1270–1278
6:05 95–104 8:05 332–341 10:05 569–578 12:05 806–815 14:05 1043–1051 16:05 1279–1288
6:06 105–114 8:06 342–351 10:06 579–588 12:06 816–824 14:06 1052–1061 16:06 1289–1400
6:07 115–124 8:07 352–361 10:07 589–597 12:07 825–834 14:07 1062–1071
6:08 125–134 8:08 362–370 10:08 598–607 12:08 835–844 14:08 1072–1081
6:09 135–143 8:09 371–380 10:09 608–617 12:09 845–854 14:09 1082–1091
6:10 144–153 8:10 381–390 10:10 618–627 12:10 855–864 14:10 1092–1101
6:11 154–163 8:11 391–400 10:11 628–637 12:11 865–874 14:11 1102–1111
7:00 164–173 9:00 401–410 11:00 638–647 13:00 875–884 15:00 1112–1120
7:01 174–183 9:01 411–420 11:01 648–657 13:01 885–893 15:01 1121–1130
7:02 184–193 9:02 421–430 11:02 658–667 13:02 894–903 15:02 1131–1140
7:03 194–203 9:03 431–440 11:03 668–676 13:03 904–913 15:03 1141–1150
7:04 204–213 9:04 441–449 11:04 677–686 13:04 914–923 15:04 1151–1160
7:05 214–222 9:05 450–459 11:05 687–696 13:05 924–933 15:05 1161–1170
7:06 223–232 9:06 460–469 11:06 697–706 13:06 934–943 15:06 1171–1180
7:07 233–242 9:07 470–479 11:07 707–716 13:07 944–953 15:07 1181–1190
7:08 243–252 9:08 480–489 11:08 717–726 13:08 954–963 15:08 1191–1199
7:09 253–262 9:09 490–499 11:09 727–736 13:09 964–972 15:09 1200–1209
7:10 263–272 9:10 500–509 11:10 737–745 13:10 973–982 15:10 1210–1219
7:11 273–282 9:11 510–518 11:11 746–755 13:11 983–992 15:11 1220–1229
33Star Assessments™ for ReadingTechnical Manual
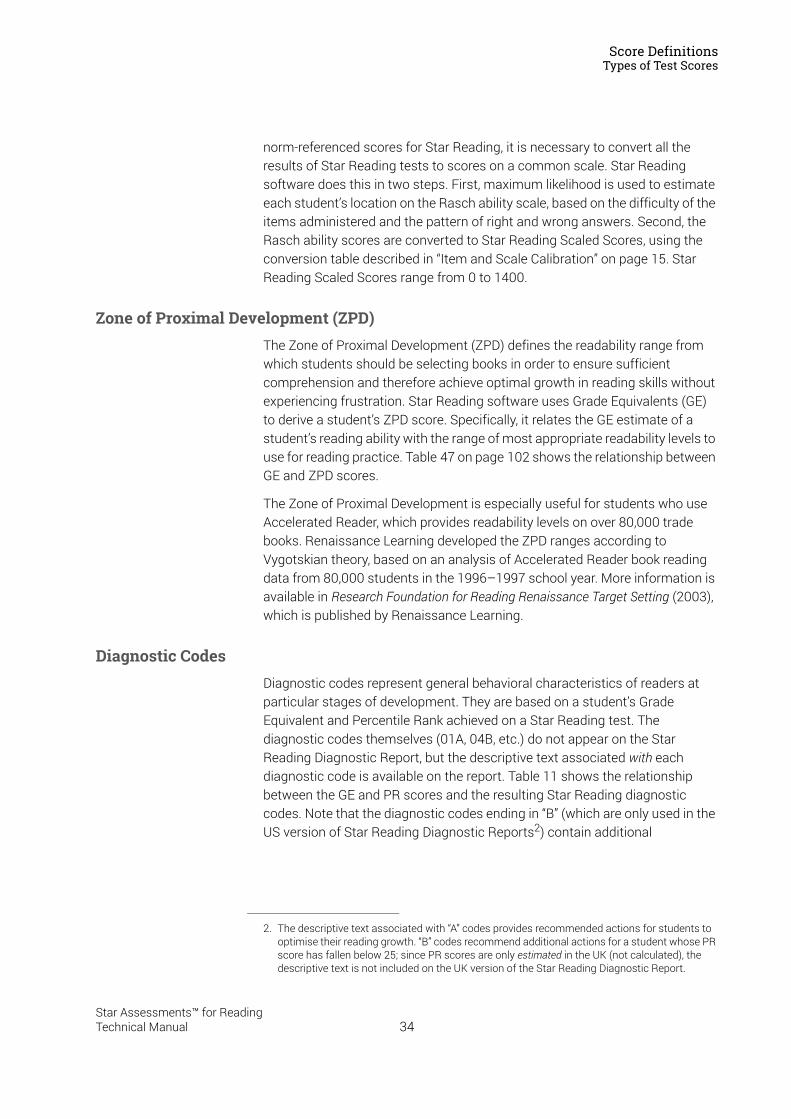
Score DefinitionsTypes of Test Scores
norm-referenced scores for Star Reading, it is necessary to convert all the results of Star Reading tests to scores on a common scale. Star Reading software does this in two steps. First, maximum likelihood is used to estimate each student’s location on the Rasch ability scale, based on the difficulty of the items administered and the pattern of right and wrong answers. Second, the Rasch ability scores are converted to Star Reading Scaled Scores, using the conversion table described in “Item and Scale Calibration” on page 15. Star Reading Scaled Scores range from 0 to 1400.
Zone of Proximal Development (ZPD)The Zone of Proximal Development (ZPD) defines the readability range from which students should be selecting books in order to ensure sufficient comprehension and therefore achieve optimal growth in reading skills without experiencing frustration. Star Reading software uses Grade Equivalents (GE) to derive a student’s ZPD score. Specifically, it relates the GE estimate of a student’s reading ability with the range of most appropriate readability levels to use for reading practice. Table 47 on page 102 shows the relationship between GE and ZPD scores.
The Zone of Proximal Development is especially useful for students who use Accelerated Reader, which provides readability levels on over 80,000 trade books. Renaissance Learning developed the ZPD ranges according to Vygotskian theory, based on an analysis of Accelerated Reader book reading data from 80,000 students in the 1996–1997 school year. More information is available in Research Foundation for Reading Renaissance Target Setting (2003), which is published by Renaissance Learning.
Diagnostic CodesDiagnostic codes represent general behavioral characteristics of readers at particular stages of development. They are based on a student’s Grade Equivalent and Percentile Rank achieved on a Star Reading test. The diagnostic codes themselves (01A, 04B, etc.) do not appear on the Star Reading Diagnostic Report, but the descriptive text associated with each diagnostic code is available on the report. Table 11 shows the relationship between the GE and PR scores and the resulting Star Reading diagnostic codes. Note that the diagnostic codes ending in “B” (which are only used in the US version of Star Reading Diagnostic Reports2) contain additional
2. The descriptive text associated with “A” codes provides recommended actions for students to optimise their reading growth. “B” codes recommend additional actions for a student whose PR score has fallen below 25; since PR scores are only estimated in the UK (not calculated), the descriptive text is not included on the UK version of the Star Reading Diagnostic Report.
34Star Assessments™ for ReadingTechnical Manual
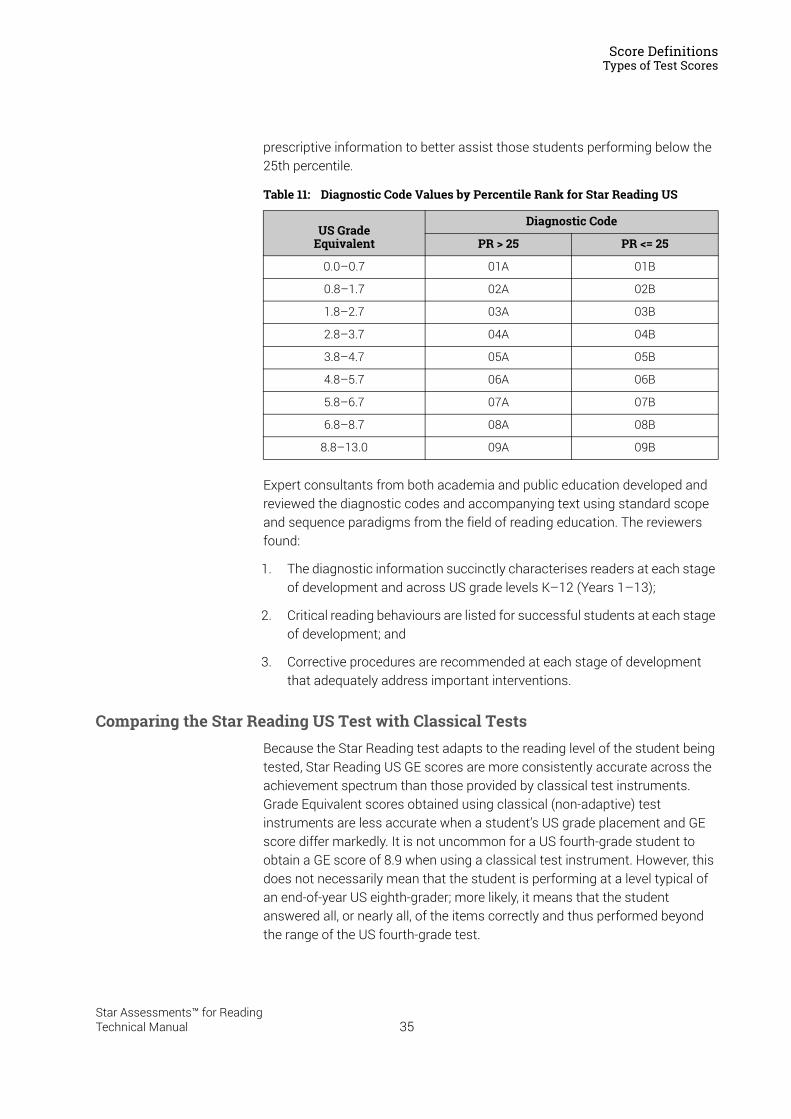
Score DefinitionsTypes of Test Scores
prescriptive information to better assist those students performing below the 25th percentile.
Expert consultants from both academia and public education developed and reviewed the diagnostic codes and accompanying text using standard scope and sequence paradigms from the field of reading education. The reviewers found:
1. The diagnostic information succinctly characterises readers at each stage of development and across US grade levels K–12 (Years 1–13);
2. Critical reading behaviours are listed for successful students at each stage of development; and
3. Corrective procedures are recommended at each stage of development that adequately address important interventions.
Comparing the Star Reading US Test with Classical TestsBecause the Star Reading test adapts to the reading level of the student being tested, Star Reading US GE scores are more consistently accurate across the achievement spectrum than those provided by classical test instruments. Grade Equivalent scores obtained using classical (non-adaptive) test instruments are less accurate when a student’s US grade placement and GE score differ markedly. It is not uncommon for a US fourth-grade student to obtain a GE score of 8.9 when using a classical test instrument. However, this does not necessarily mean that the student is performing at a level typical of an end-of-year US eighth-grader; more likely, it means that the student answered all, or nearly all, of the items correctly and thus performed beyond the range of the US fourth-grade test.
Table 11: Diagnostic Code Values by Percentile Rank for Star Reading US
US GradeEquivalent
Diagnostic Code
PR > 25 PR <= 25
0.0–0.7 01A 01B
0.8–1.7 02A 02B
1.8–2.7 03A 03B
2.8–3.7 04A 04B
3.8–4.7 05A 05B
4.8–5.7 06A 06B
5.8–6.7 07A 07B
6.8–8.7 08A 08B
8.8–13.0 09A 09B
35Star Assessments™ for ReadingTechnical Manual
Score DefinitionsTypes of Test Scores
Star Reading US Grade Equivalent scores are more consistently accurate—even as a student’s achievement level deviates from the level of US grade placement. A student may be tested on any level of material, depending upon the student’s actual performance on the test; students are tested on items of an appropriate level of difficulty, based on their individual level of achievement. Thus, a GE score of 7.6 indicates that the student’s performance can be appropriately compared to that of a typical US seventh-grader in the sixth month of the school year.
36Star Assessments™ for ReadingTechnical Manual
Reliability and Validity
Reliability is the extent to which a test yields consistent results from one administration to another and from one test form to another. Tests must yield consistent results in order to be useful. Because Star Reading is a computer-adaptive test, many of the typical methods used to assess reliability using internal consistency methods (such as KR-20 and coefficient alpha) are not appropriate. The question of the reliability of the test was approached in two ways: by calculating split-half reliability and by calculating test-retest reliability, in both cases for both Scaled Scores and Standardised Scores.
Split-Half ReliabilitySplit-half reliability for Scaled Score showed an overall mean of 590.47, standard deviation of 281.42, n = 818,064. The Spearman-Brown Coefficient was 0.918. This indicates a good level of reliability.
Split-half reliability for Standardised Score showed an overall mean of 100.03, standard deviation of 15.25, n = 818,064. The Spearman-Brown Coefficient was 0.918. This indicates a good level of reliability.
Note that reliability for Reading is somewhat higher than that for Maths. However, the Scaled Score standard deviation for Reading was much higher than that for Maths, indicating greater variance.
Test-Retest ReliabilityCalculating Test-Retest Reliability was more complex, since it required obtaining a sample of cases from the most recent full year of testing (August 1, 2009–July 31, 2010) and comparing their scores to those of the same cases in the previous year (August 1st, 2008–July 31, 2009). Ensuring that only scores for the same students on both occasions were entered in this analysis took a great deal of time. All cases with more than one testing in each of these periods were deleted. In the current year, 64,472 cases were listed; in the previous year 39,993 cases were listed, but only 8,849 of these were the same students.
A histogram of Current Scaled Score × Previous Scaled Score was then constructed to determine whether the distribution was relatively normal and to establish the presence of outlier or rogue results (see Figure 2). Figure 3 shows this as a histogram.
37Star Assessments™ for ReadingTechnical Manual
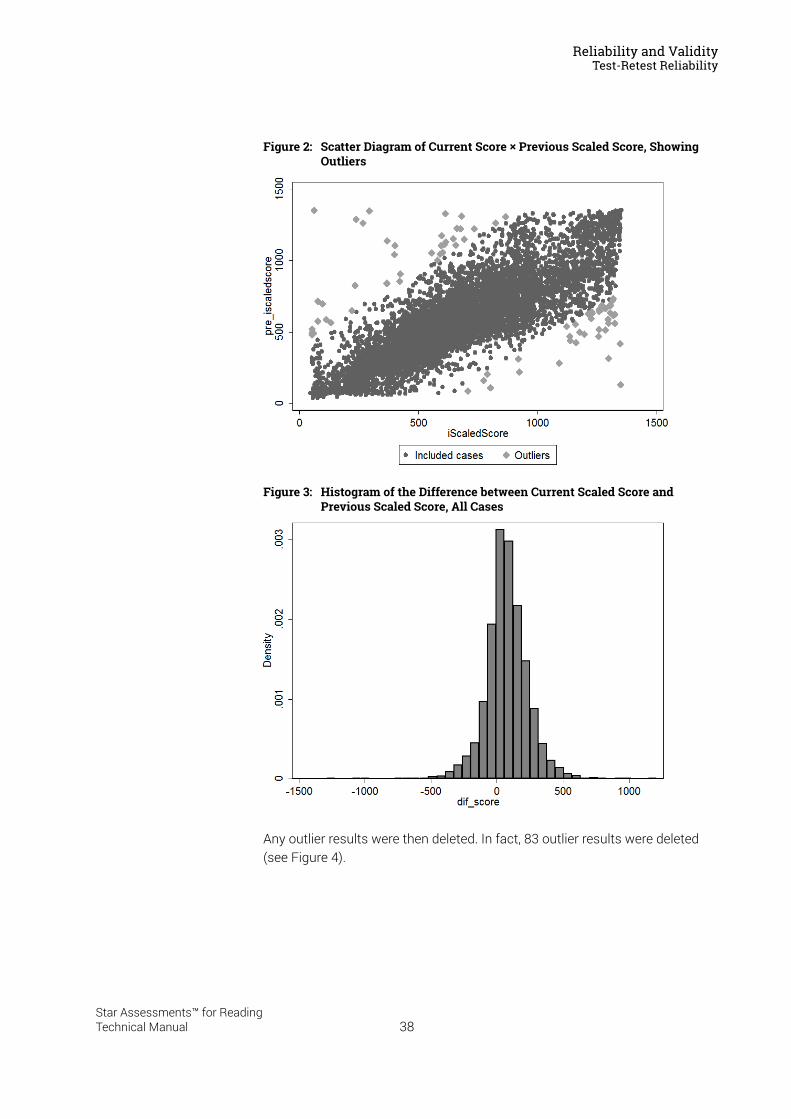
Reliability and ValidityTest-Retest Reliability
Figure 2: Scatter Diagram of Current Score × Previous Scaled Score, Showing Outliers
Figure 3: Histogram of the Difference between Current Scaled Score and Previous Scaled Score, All Cases
Any outlier results were then deleted. In fact, 83 outlier results were deleted (see Figure 4).
38Star Assessments™ for ReadingTechnical Manual
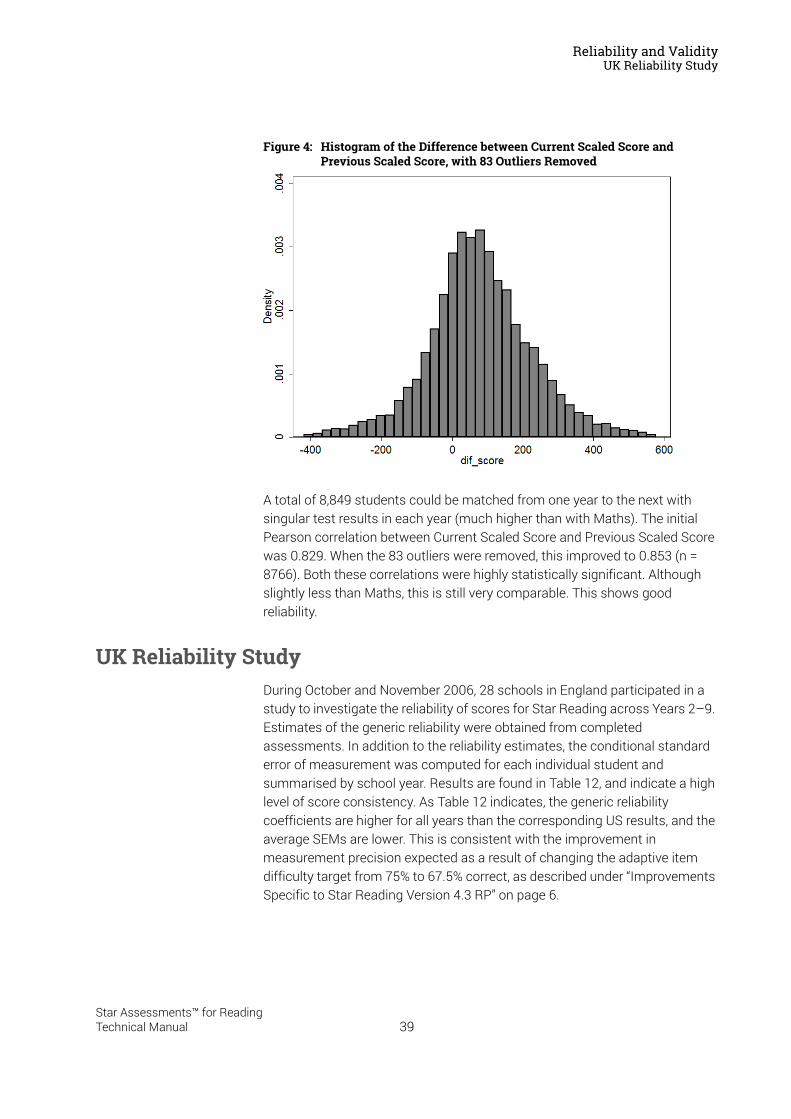
Reliability and ValidityUK Reliability Study
Figure 4: Histogram of the Difference between Current Scaled Score and Previous Scaled Score, with 83 Outliers Removed
A total of 8,849 students could be matched from one year to the next with singular test results in each year (much higher than with Maths). The initial Pearson correlation between Current Scaled Score and Previous Scaled Score was 0.829. When the 83 outliers were removed, this improved to 0.853 (n = 8766). Both these correlations were highly statistically significant. Although slightly less than Maths, this is still very comparable. This shows good reliability.
UK Reliability StudyDuring October and November 2006, 28 schools in England participated in a study to investigate the reliability of scores for Star Reading across Years 2–9. Estimates of the generic reliability were obtained from completed assessments. In addition to the reliability estimates, the conditional standard error of measurement was computed for each individual student and summarised by school year. Results are found in Table 12, and indicate a high level of score consistency. As Table 12 indicates, the generic reliability coefficients are higher for all years than the corresponding US results, and the average SEMs are lower. This is consistent with the improvement in measurement precision expected as a result of changing the adaptive item difficulty target from 75% to 67.5% correct, as described under “Improvements Specific to Star Reading Version 4.3 RP” on page 6.
39Star Assessments™ for ReadingTechnical Manual
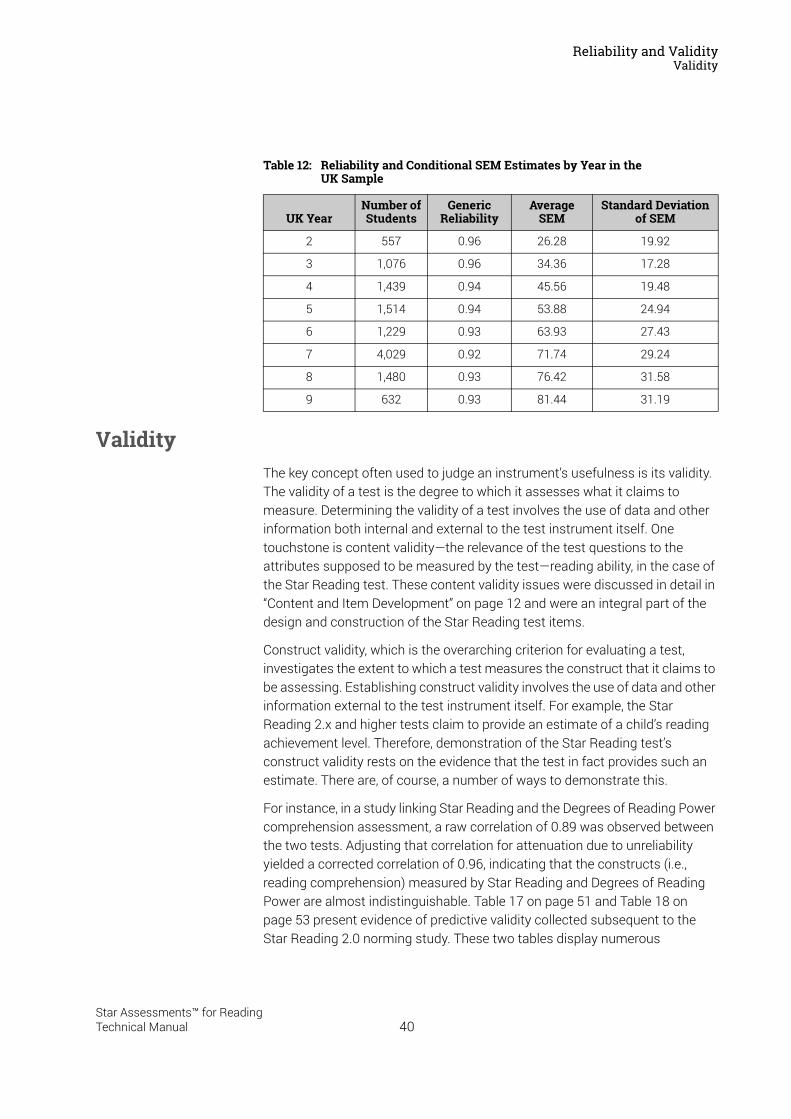
Reliability and ValidityValidity
ValidityThe key concept often used to judge an instrument’s usefulness is its validity. The validity of a test is the degree to which it assesses what it claims to measure. Determining the validity of a test involves the use of data and other information both internal and external to the test instrument itself. One touchstone is content validity—the relevance of the test questions to the attributes supposed to be measured by the test—reading ability, in the case of the Star Reading test. These content validity issues were discussed in detail in “Content and Item Development” on page 12 and were an integral part of the design and construction of the Star Reading test items.
Construct validity, which is the overarching criterion for evaluating a test, investigates the extent to which a test measures the construct that it claims to be assessing. Establishing construct validity involves the use of data and other information external to the test instrument itself. For example, the Star Reading 2.x and higher tests claim to provide an estimate of a child’s reading achievement level. Therefore, demonstration of the Star Reading test’s construct validity rests on the evidence that the test in fact provides such an estimate. There are, of course, a number of ways to demonstrate this.
For instance, in a study linking Star Reading and the Degrees of Reading Power comprehension assessment, a raw correlation of 0.89 was observed between the two tests. Adjusting that correlation for attenuation due to unreliability yielded a corrected correlation of 0.96, indicating that the constructs (i.e., reading comprehension) measured by Star Reading and Degrees of Reading Power are almost indistinguishable. Table 17 on page 51 and Table 18 on page 53 present evidence of predictive validity collected subsequent to the Star Reading 2.0 norming study. These two tables display numerous
Table 12: Reliability and Conditional SEM Estimates by Year in the UK Sample
UK YearNumber of Students
Generic Reliability
Average SEM
Standard Deviation of SEM
2 557 0.96 26.28 19.92
3 1,076 0.96 34.36 17.28
4 1,439 0.94 45.56 19.48
5 1,514 0.94 53.88 24.94
6 1,229 0.93 63.93 27.43
7 4,029 0.92 71.74 29.24
8 1,480 0.93 76.42 31.58
9 632 0.93 81.44 31.19
40Star Assessments™ for ReadingTechnical Manual
Reliability and ValidityExternal Validity
correlations between Star Reading and other measures administered at points in time at least two months later than Star Reading.
Since reading ability varies significantly within and across years (US grade levels) and improves with students’ age and number of years in school, Star Reading 2.x and higher scores should demonstrate these anticipated internal relationships; in fact, they do. Additionally, Star Reading scores should correlate highly with other accepted procedures and measures that are used to determine reading achievement level; this is external validity.
External ValidityDuring the Star Reading US 2.x norming study, schools submitted data on how their students performed on several other popular standardised test instruments along with their students’ Star Reading results. This data included more than 12,000 student test results from such tests as the California Achievement Test (CAT), the Comprehensive Test of Basic Skills (CTBS), the Iowa Test of Basic Skills (ITBS), the Metropolitan Achievement Test (MAT), the Stanford Achievement Test (SAT-9) and several state tests.
Computing the correlation coefficients was a two-step process. First, where necessary, data were placed onto a common scale. If Scaled Scores were available, they could be correlated with Star Reading scale scores. However, since Percentile Ranks (PRs) are not on an equal interval scale, when PRs were reported for the other tests, they were converted into Normal Curve Equivalents (NCEs). Scaled Scores or NCE scores were then used to compute the Pearson product-moment correlation coefficients.
In an ongoing effort to gather evidence for the validity of Star Reading scores, continual research on score validity has been undertaken. In addition to original validity data gathered at the time of initial development, numerous other studies have investigated the correlations between Star Reading tests and other external measures. In addition to gathering concurrent validity estimates, predictive validity estimates have also been investigated. Concurrent validity was defined for students taking a Star Reading test and external measures within a two-month time period. Predictive validity provided an estimate of the extent to which scores on the Star Reading test predicted scores on criterion measures given at a later point in time, operationally defined as more than 2 months between the Star test (predictor) and the criterion test. It provided an estimate of the linear relationship between Star scores and scores on measures covering a similar academic domain. Predictive correlations are attenuated by time due to the fact that students are gaining skills in the interim between testing occasions, and also by differences between the tests’ content specifications.
Tables 13–18 present the correlation coefficients between the Star Reading US test and each of the other test instruments for which data were received.
41Star Assessments™ for ReadingTechnical Manual
Reliability and ValidityExternal Validity
Tables 13 and 14 display “concurrent validity” data, that is, correlations between Star Reading 2.0 and later versions’ test scores and other tests administered at close to the same time. Tables 15 and 16 display all other correlations of Star Reading 2.0 and later versions and external tests; the external test scores were administered at various times, and were obtained from student records. Tables 17 and 18 provide the predictive validity estimates of Star Reading predicting numerous external criterion measures given at least two months after the initial Star test.
Tables 13, 15 and 17 present validity coefficients for US grades 1–6, and Tables 14, 16 and 18 present the validity coefficients for US grades 7–12. The bottom of each table presents a grade-by-grade summary, including the total number of students for whom test data were available, the number of validity coefficients for that grade and the average value of the validity coefficients. The within-grade average concurrent validity coefficients varied from 0.71–0.81 for grades 1–6, and from 0.64–0.75 for grades 7–12. Overall concurrent validity coefficients for grades 1–6 was 0.73 and 0.72 for grades 7–12. The other validity coefficient within-grade averages varied from 0.60–0.77; the overall average was 0.73 for grades 1–6, and 0.71 for grades 7–12. The predictive validity coefficients ranged from 0.68–0.82 in grades 1–6, with an overall average of 0.79. For grades 7–12, the predictive validity coefficients ranged from 0.81–0.86, with an overall average of 0.82.
The extent that the Star Reading US 2.x test correlates with these tests provides support for Star Reading construct validity. The process of establishing the validity of a test is an involved one, and one that usually takes a significant amount of time. Thus, the data collection process and the validation of the US and UK versions of the Star Reading test is really an ongoing activity seeking to establish evidence of Star Reading’s validity for a variety of settings. Star Reading UK users who collect relevant data are encouraged to contact Renaissance Learning UK Ltd.
Since correlation coefficients are available for different editions, forms and dates of administration, many of the tests have several correlation coefficients associated with them. Where test data quality could not be verified, and when sample size was limited, those data were eliminated. Correlations were computed separately on tests according to the unique combination of test edition/form and time when testing occurred. Testing data for other standardised tests administered more than two years prior to the spring of 1999 were excluded from the analyses since those test results represent very dated information about the current reading ability of students.
In general, these correlation coefficients reflect very well on the validity of the Star Reading US 2.x and higher tests as tools for assessing reading performance. These results, combined with the reliability and SEM estimates, demonstrate quantitatively how well this innovative instrument in reading assessment performs.
42Star Assessments™ for ReadingTechnical Manual
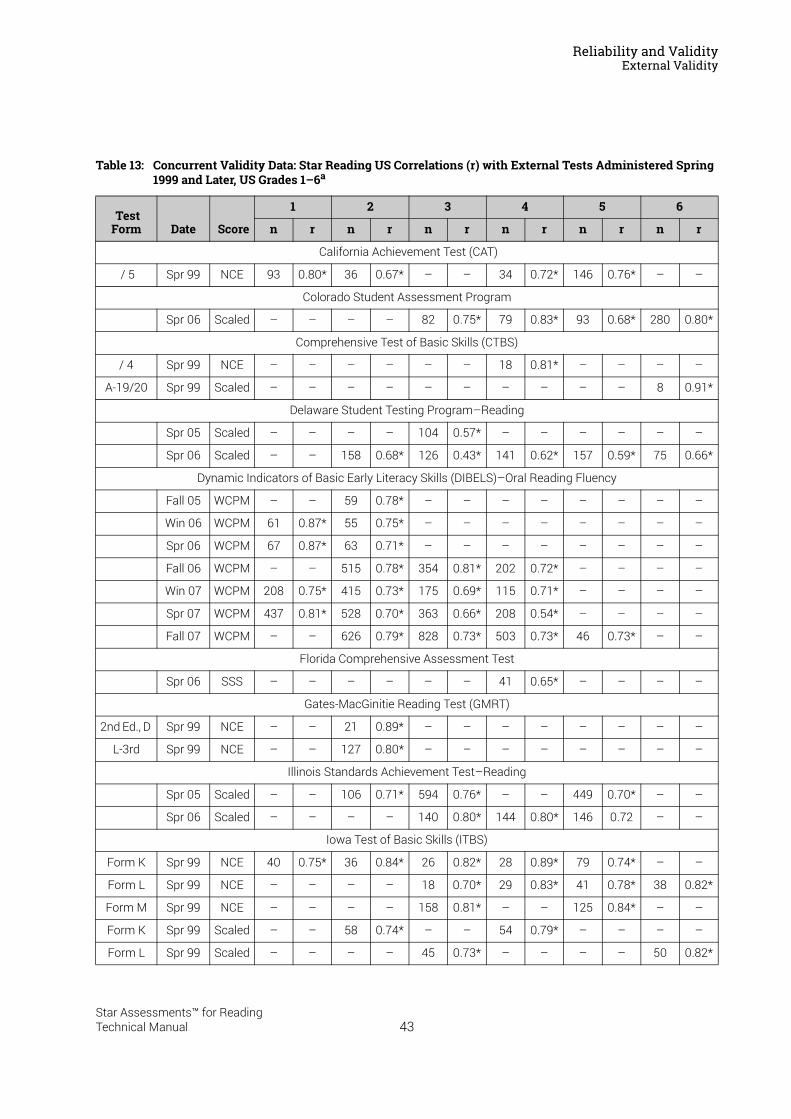
Reliability and ValidityExternal Validity
Table 13: Concurrent Validity Data: Star Reading US Correlations (r) with External Tests Administered Spring 1999 and Later, US Grades 1–6a
Test Form Date Score
1 2 3 4 5 6
n r n r n r n r n r n r
California Achievement Test (CAT)
/ 5 Spr 99 NCE 93 0.80* 36 0.67* – – 34 0.72* 146 0.76* – –
Colorado Student Assessment Program
Spr 06 Scaled – – – – 82 0.75* 79 0.83* 93 0.68* 280 0.80*
Comprehensive Test of Basic Skills (CTBS)
/ 4 Spr 99 NCE – – – – – – 18 0.81* – – – –
A-19/20 Spr 99 Scaled – – – – – – – – – – 8 0.91*
Delaware Student Testing Program–Reading
Spr 05 Scaled – – – – 104 0.57* – – – – – –
Spr 06 Scaled – – 158 0.68* 126 0.43* 141 0.62* 157 0.59* 75 0.66*
Dynamic Indicators of Basic Early Literacy Skills (DIBELS)–Oral Reading Fluency
Fall 05 WCPM – – 59 0.78* – – – – – – – –
Win 06 WCPM 61 0.87* 55 0.75* – – – – – – – –
Spr 06 WCPM 67 0.87* 63 0.71* – – – – – – – –
Fall 06 WCPM – – 515 0.78* 354 0.81* 202 0.72* – – – –
Win 07 WCPM 208 0.75* 415 0.73* 175 0.69* 115 0.71* – – – –
Spr 07 WCPM 437 0.81* 528 0.70* 363 0.66* 208 0.54* – – – –
Fall 07 WCPM – – 626 0.79* 828 0.73* 503 0.73* 46 0.73* – –
Florida Comprehensive Assessment Test
Spr 06 SSS – – – – – – 41 0.65* – – – –
Gates-MacGinitie Reading Test (GMRT)
2nd Ed., D Spr 99 NCE – – 21 0.89* – – – – – – – –
L-3rd Spr 99 NCE – – 127 0.80* – – – – – – – –
Illinois Standards Achievement Test–Reading
Spr 05 Scaled – – 106 0.71* 594 0.76* – – 449 0.70* – –
Spr 06 Scaled – – – – 140 0.80* 144 0.80* 146 0.72 – –
Iowa Test of Basic Skills (ITBS)
Form K Spr 99 NCE 40 0.75* 36 0.84* 26 0.82* 28 0.89* 79 0.74* – –
Form L Spr 99 NCE – – – – 18 0.70* 29 0.83* 41 0.78* 38 0.82*
Form M Spr 99 NCE – – – – 158 0.81* – – 125 0.84* – –
Form K Spr 99 Scaled – – 58 0.74* – – 54 0.79* – – – –
Form L Spr 99 Scaled – – – – 45 0.73* – – – – 50 0.82*
43Star Assessments™ for ReadingTechnical Manual
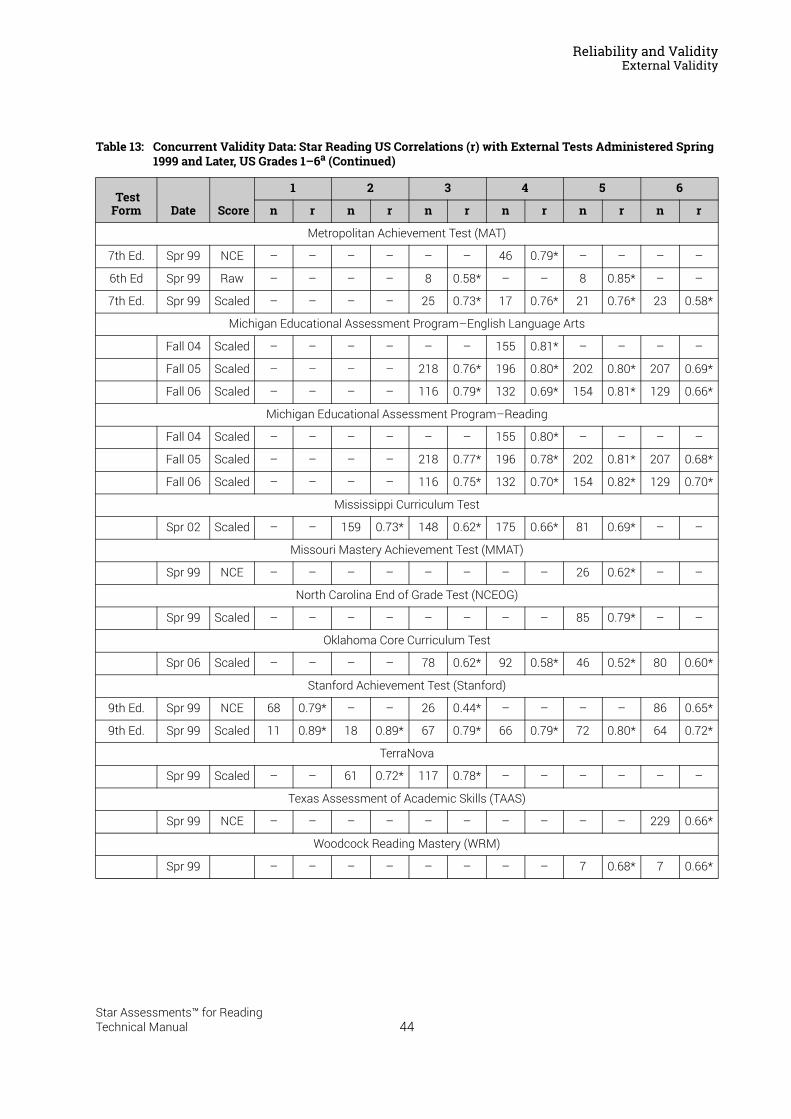
Reliability and ValidityExternal Validity
Metropolitan Achievement Test (MAT)
7th Ed. Spr 99 NCE – – – – – – 46 0.79* – – – –
6th Ed Spr 99 Raw – – – – 8 0.58* – – 8 0.85* – –
7th Ed. Spr 99 Scaled – – – – 25 0.73* 17 0.76* 21 0.76* 23 0.58*
Michigan Educational Assessment Program–English Language Arts
Fall 04 Scaled – – – – – – 155 0.81* – – – –
Fall 05 Scaled – – – – 218 0.76* 196 0.80* 202 0.80* 207 0.69*
Fall 06 Scaled – – – – 116 0.79* 132 0.69* 154 0.81* 129 0.66*
Michigan Educational Assessment Program–Reading
Fall 04 Scaled – – – – – – 155 0.80* – – – –
Fall 05 Scaled – – – – 218 0.77* 196 0.78* 202 0.81* 207 0.68*
Fall 06 Scaled – – – – 116 0.75* 132 0.70* 154 0.82* 129 0.70*
Mississippi Curriculum Test
Spr 02 Scaled – – 159 0.73* 148 0.62* 175 0.66* 81 0.69* – –
Missouri Mastery Achievement Test (MMAT)
Spr 99 NCE – – – – – – – – 26 0.62* – –
North Carolina End of Grade Test (NCEOG)
Spr 99 Scaled – – – – – – – – 85 0.79* – –
Oklahoma Core Curriculum Test
Spr 06 Scaled – – – – 78 0.62* 92 0.58* 46 0.52* 80 0.60*
Stanford Achievement Test (Stanford)
9th Ed. Spr 99 NCE 68 0.79* – – 26 0.44* – – – – 86 0.65*
9th Ed. Spr 99 Scaled 11 0.89* 18 0.89* 67 0.79* 66 0.79* 72 0.80* 64 0.72*
TerraNova
Spr 99 Scaled – – 61 0.72* 117 0.78* – – – – – –
Texas Assessment of Academic Skills (TAAS)
Spr 99 NCE – – – – – – – – – – 229 0.66*
Woodcock Reading Mastery (WRM)
Spr 99 – – – – – – – – 7 0.68* 7 0.66*
Table 13: Concurrent Validity Data: Star Reading US Correlations (r) with External Tests Administered Spring 1999 and Later, US Grades 1–6a (Continued)
Test Form Date Score
1 2 3 4 5 6
n r n r n r n r n r n r
44Star Assessments™ for ReadingTechnical Manual
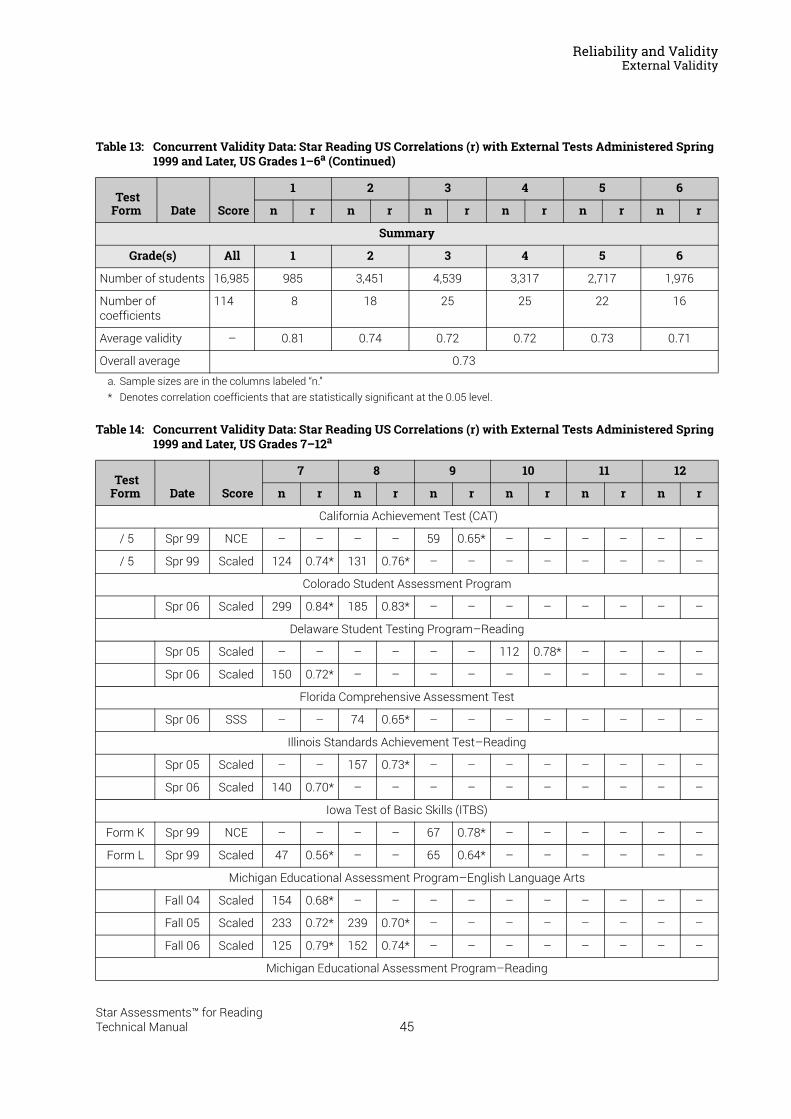
Reliability and ValidityExternal Validity
Summary
Grade(s) All 1 2 3 4 5 6
Number of students 16,985 985 3,451 4,539 3,317 2,717 1,976
Number ofcoefficients
114 8 18 25 25 22 16
Average validity – 0.81 0.74 0.72 0.72 0.73 0.71
Overall average 0.73
a. Sample sizes are in the columns labeled “n.”* Denotes correlation coefficients that are statistically significant at the 0.05 level.
Table 14: Concurrent Validity Data: Star Reading US Correlations (r) with External Tests Administered Spring 1999 and Later, US Grades 7–12a
Test Form Date Score
7 8 9 10 11 12
n r n r n r n r n r n r
California Achievement Test (CAT)
/ 5 Spr 99 NCE – – – – 59 0.65* – – – – – –
/ 5 Spr 99 Scaled 124 0.74* 131 0.76* – – – – – – – –
Colorado Student Assessment Program
Spr 06 Scaled 299 0.84* 185 0.83* – – – – – – – –
Delaware Student Testing Program–Reading
Spr 05 Scaled – – – – – – 112 0.78* – – – –
Spr 06 Scaled 150 0.72* – – – – – – – – – –
Florida Comprehensive Assessment Test
Spr 06 SSS – – 74 0.65* – – – – – – – –
Illinois Standards Achievement Test–Reading
Spr 05 Scaled – – 157 0.73* – – – – – – – –
Spr 06 Scaled 140 0.70* – – – – – – – – – –
Iowa Test of Basic Skills (ITBS)
Form K Spr 99 NCE – – – – 67 0.78* – – – – – –
Form L Spr 99 Scaled 47 0.56* – – 65 0.64* – – – – – –
Michigan Educational Assessment Program–English Language Arts
Fall 04 Scaled 154 0.68* – – – – – – – – – –
Fall 05 Scaled 233 0.72* 239 0.70* – – – – – – – –
Fall 06 Scaled 125 0.79* 152 0.74* – – – – – – – –
Michigan Educational Assessment Program–Reading
Table 13: Concurrent Validity Data: Star Reading US Correlations (r) with External Tests Administered Spring 1999 and Later, US Grades 1–6a (Continued)
Test Form Date Score
1 2 3 4 5 6
n r n r n r n r n r n r
45Star Assessments™ for ReadingTechnical Manual
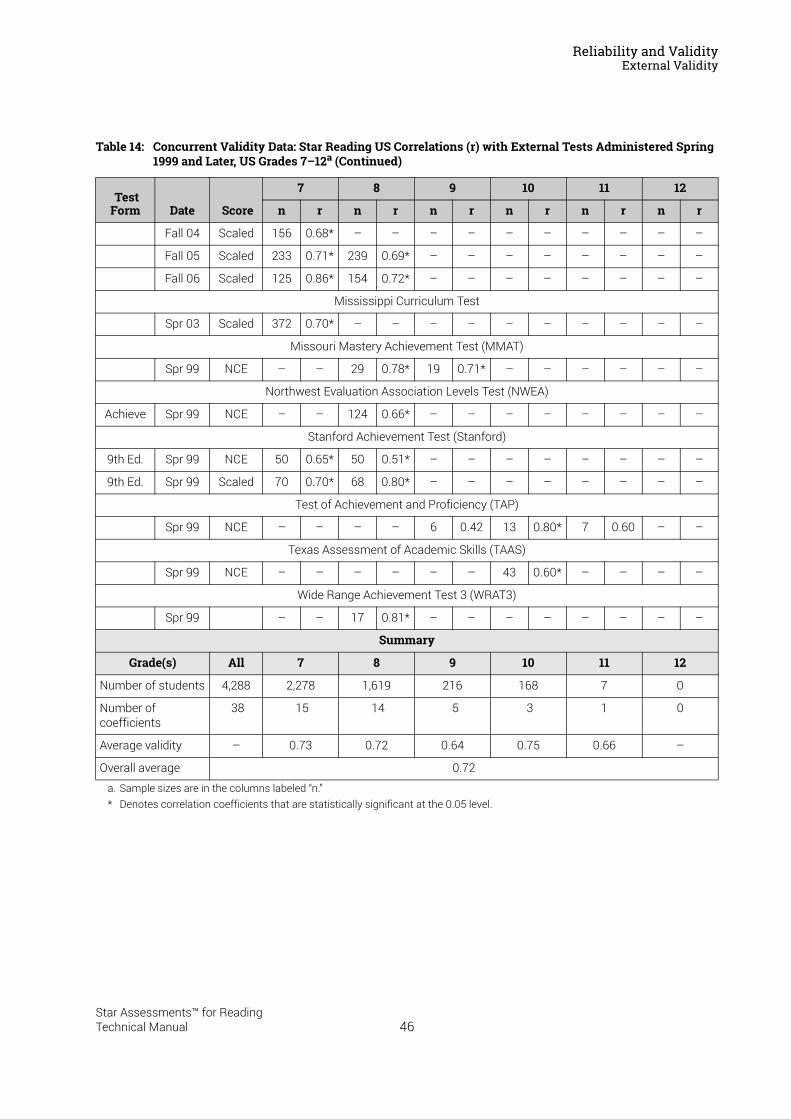
Reliability and ValidityExternal Validity
Fall 04 Scaled 156 0.68* – – – – – – – – – –
Fall 05 Scaled 233 0.71* 239 0.69* – – – – – – – –
Fall 06 Scaled 125 0.86* 154 0.72* – – – – – – – –
Mississippi Curriculum Test
Spr 03 Scaled 372 0.70* – – – – – – – – – –
Missouri Mastery Achievement Test (MMAT)
Spr 99 NCE – – 29 0.78* 19 0.71* – – – – – –
Northwest Evaluation Association Levels Test (NWEA)
Achieve Spr 99 NCE – – 124 0.66* – – – – – – – –
Stanford Achievement Test (Stanford)
9th Ed. Spr 99 NCE 50 0.65* 50 0.51* – – – – – – – –
9th Ed. Spr 99 Scaled 70 0.70* 68 0.80* – – – – – – – –
Test of Achievement and Proficiency (TAP)
Spr 99 NCE – – – – 6 0.42 13 0.80* 7 0.60 – –
Texas Assessment of Academic Skills (TAAS)
Spr 99 NCE – – – – – – 43 0.60* – – – –
Wide Range Achievement Test 3 (WRAT3)
Spr 99 – – 17 0.81* – – – – – – – –
Summary
Grade(s) All 7 8 9 10 11 12
Number of students 4,288 2,278 1,619 216 168 7 0
Number ofcoefficients
38 15 14 5 3 1 0
Average validity – 0.73 0.72 0.64 0.75 0.66 –
Overall average 0.72
a. Sample sizes are in the columns labeled “n.”* Denotes correlation coefficients that are statistically significant at the 0.05 level.
Table 14: Concurrent Validity Data: Star Reading US Correlations (r) with External Tests Administered Spring 1999 and Later, US Grades 7–12a (Continued)
Test Form Date Score
7 8 9 10 11 12
n r n r n r n r n r n r
46Star Assessments™ for ReadingTechnical Manual
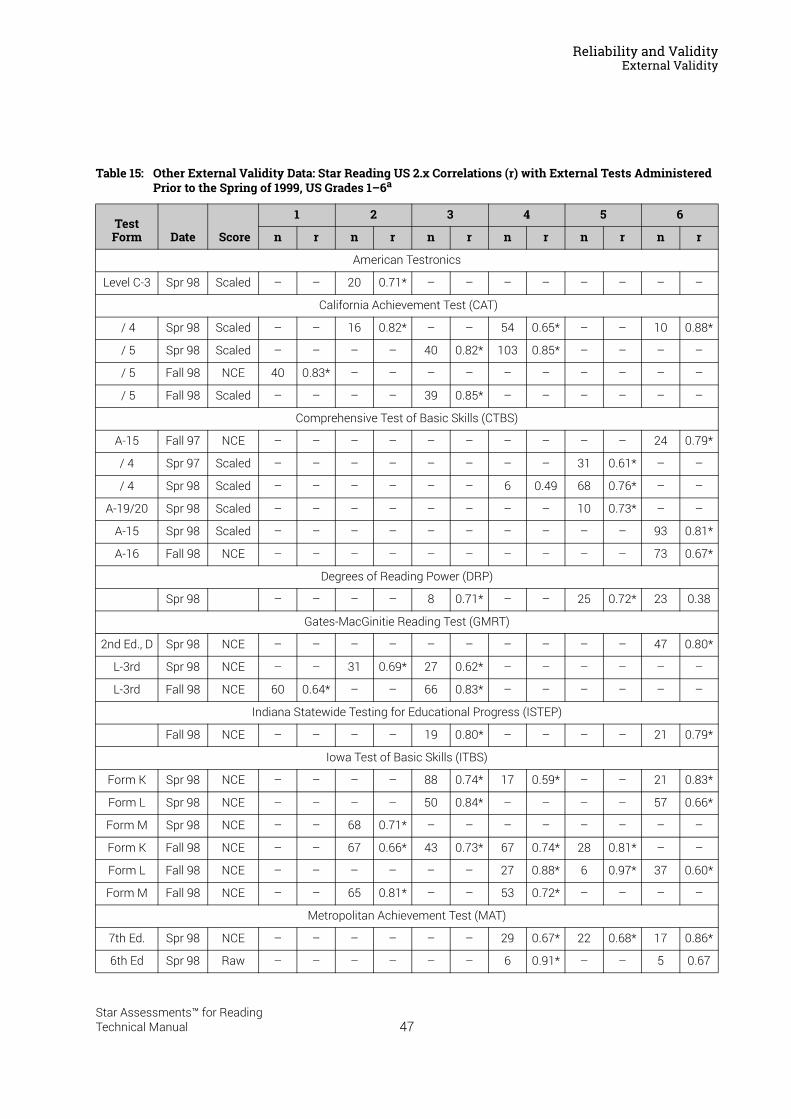
Reliability and ValidityExternal Validity
Table 15: Other External Validity Data: Star Reading US 2.x Correlations (r) with External Tests Administered Prior to the Spring of 1999, US Grades 1–6a
Test Form Date Score
1 2 3 4 5 6
n r n r n r n r n r n r
American Testronics
Level C-3 Spr 98 Scaled – – 20 0.71* – – – – – – – –
California Achievement Test (CAT)
/ 4 Spr 98 Scaled – – 16 0.82* – – 54 0.65* – – 10 0.88*
/ 5 Spr 98 Scaled – – – – 40 0.82* 103 0.85* – – – –
/ 5 Fall 98 NCE 40 0.83* – – – – – – – – – –
/ 5 Fall 98 Scaled – – – – 39 0.85* – – – – – –
Comprehensive Test of Basic Skills (CTBS)
A-15 Fall 97 NCE – – – – – – – – – – 24 0.79*
/ 4 Spr 97 Scaled – – – – – – – – 31 0.61* – –
/ 4 Spr 98 Scaled – – – – – – 6 0.49 68 0.76* – –
A-19/20 Spr 98 Scaled – – – – – – – – 10 0.73* – –
A-15 Spr 98 Scaled – – – – – – – – – – 93 0.81*
A-16 Fall 98 NCE – – – – – – – – – – 73 0.67*
Degrees of Reading Power (DRP)
Spr 98 – – – – 8 0.71* – – 25 0.72* 23 0.38
Gates-MacGinitie Reading Test (GMRT)
2nd Ed., D Spr 98 NCE – – – – – – – – – – 47 0.80*
L-3rd Spr 98 NCE – – 31 0.69* 27 0.62* – – – – – –
L-3rd Fall 98 NCE 60 0.64* – – 66 0.83* – – – – – –
Indiana Statewide Testing for Educational Progress (ISTEP)
Fall 98 NCE – – – – 19 0.80* – – – – 21 0.79*
Iowa Test of Basic Skills (ITBS)
Form K Spr 98 NCE – – – – 88 0.74* 17 0.59* – – 21 0.83*
Form L Spr 98 NCE – – – – 50 0.84* – – – – 57 0.66*
Form M Spr 98 NCE – – 68 0.71* – – – – – – – –
Form K Fall 98 NCE – – 67 0.66* 43 0.73* 67 0.74* 28 0.81* – –
Form L Fall 98 NCE – – – – – – 27 0.88* 6 0.97* 37 0.60*
Form M Fall 98 NCE – – 65 0.81* – – 53 0.72* – – – –
Metropolitan Achievement Test (MAT)
7th Ed. Spr 98 NCE – – – – – – 29 0.67* 22 0.68* 17 0.86*
6th Ed Spr 98 Raw – – – – – – 6 0.91* – – 5 0.67
47Star Assessments™ for ReadingTechnical Manual
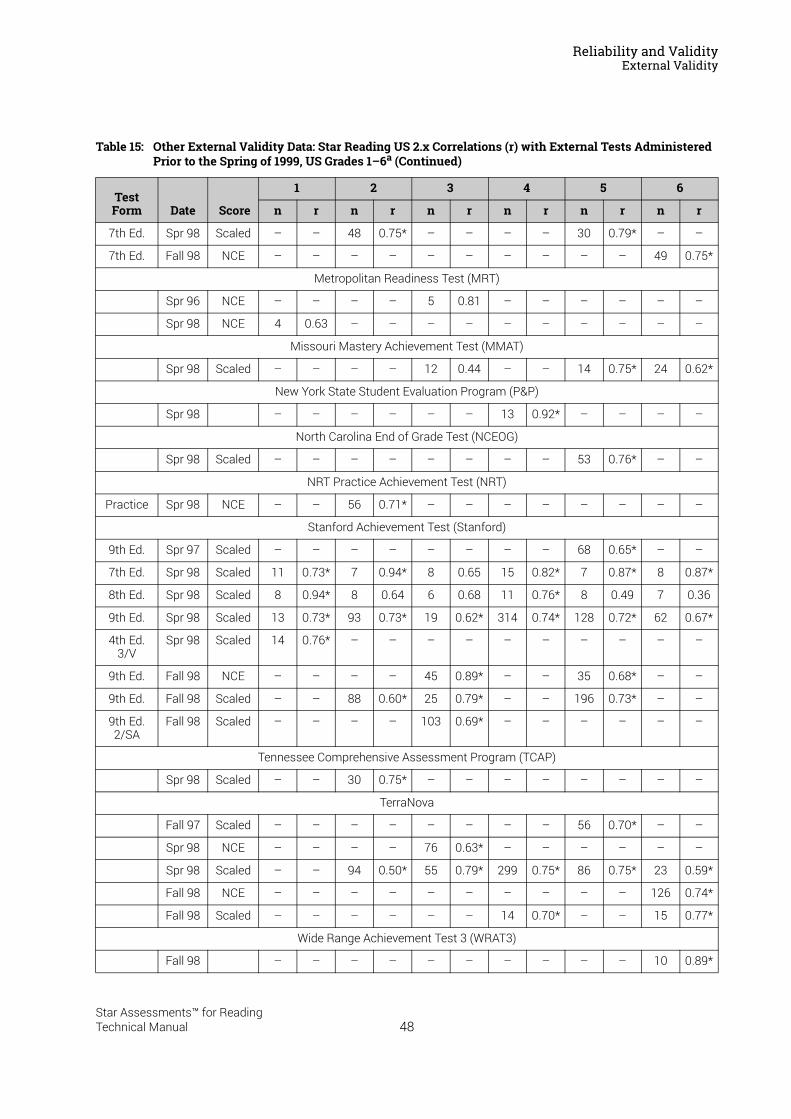
Reliability and ValidityExternal Validity
7th Ed. Spr 98 Scaled – – 48 0.75* – – – – 30 0.79* – –
7th Ed. Fall 98 NCE – – – – – – – – – – 49 0.75*
Metropolitan Readiness Test (MRT)
Spr 96 NCE – – – – 5 0.81 – – – – – –
Spr 98 NCE 4 0.63 – – – – – – – – – –
Missouri Mastery Achievement Test (MMAT)
Spr 98 Scaled – – – – 12 0.44 – – 14 0.75* 24 0.62*
New York State Student Evaluation Program (P&P)
Spr 98 – – – – – – 13 0.92* – – – –
North Carolina End of Grade Test (NCEOG)
Spr 98 Scaled – – – – – – – – 53 0.76* – –
NRT Practice Achievement Test (NRT)
Practice Spr 98 NCE – – 56 0.71* – – – – – – – –
Stanford Achievement Test (Stanford)
9th Ed. Spr 97 Scaled – – – – – – – – 68 0.65* – –
7th Ed. Spr 98 Scaled 11 0.73* 7 0.94* 8 0.65 15 0.82* 7 0.87* 8 0.87*
8th Ed. Spr 98 Scaled 8 0.94* 8 0.64 6 0.68 11 0.76* 8 0.49 7 0.36
9th Ed. Spr 98 Scaled 13 0.73* 93 0.73* 19 0.62* 314 0.74* 128 0.72* 62 0.67*
4th Ed. 3/V
Spr 98 Scaled 14 0.76* – – – – – – – – – –
9th Ed. Fall 98 NCE – – – – 45 0.89* – – 35 0.68* – –
9th Ed. Fall 98 Scaled – – 88 0.60* 25 0.79* – – 196 0.73* – –
9th Ed. 2/SA
Fall 98 Scaled – – – – 103 0.69* – – – – – –
Tennessee Comprehensive Assessment Program (TCAP)
Spr 98 Scaled – – 30 0.75* – – – – – – – –
TerraNova
Fall 97 Scaled – – – – – – – – 56 0.70* – –
Spr 98 NCE – – – – 76 0.63* – – – – – –
Spr 98 Scaled – – 94 0.50* 55 0.79* 299 0.75* 86 0.75* 23 0.59*
Fall 98 NCE – – – – – – – – – – 126 0.74*
Fall 98 Scaled – – – – – – 14 0.70* – – 15 0.77*
Wide Range Achievement Test 3 (WRAT3)
Fall 98 – – – – – – – – – – 10 0.89*
Table 15: Other External Validity Data: Star Reading US 2.x Correlations (r) with External Tests Administered Prior to the Spring of 1999, US Grades 1–6a (Continued)
Test Form Date Score
1 2 3 4 5 6
n r n r n r n r n r n r
48Star Assessments™ for ReadingTechnical Manual
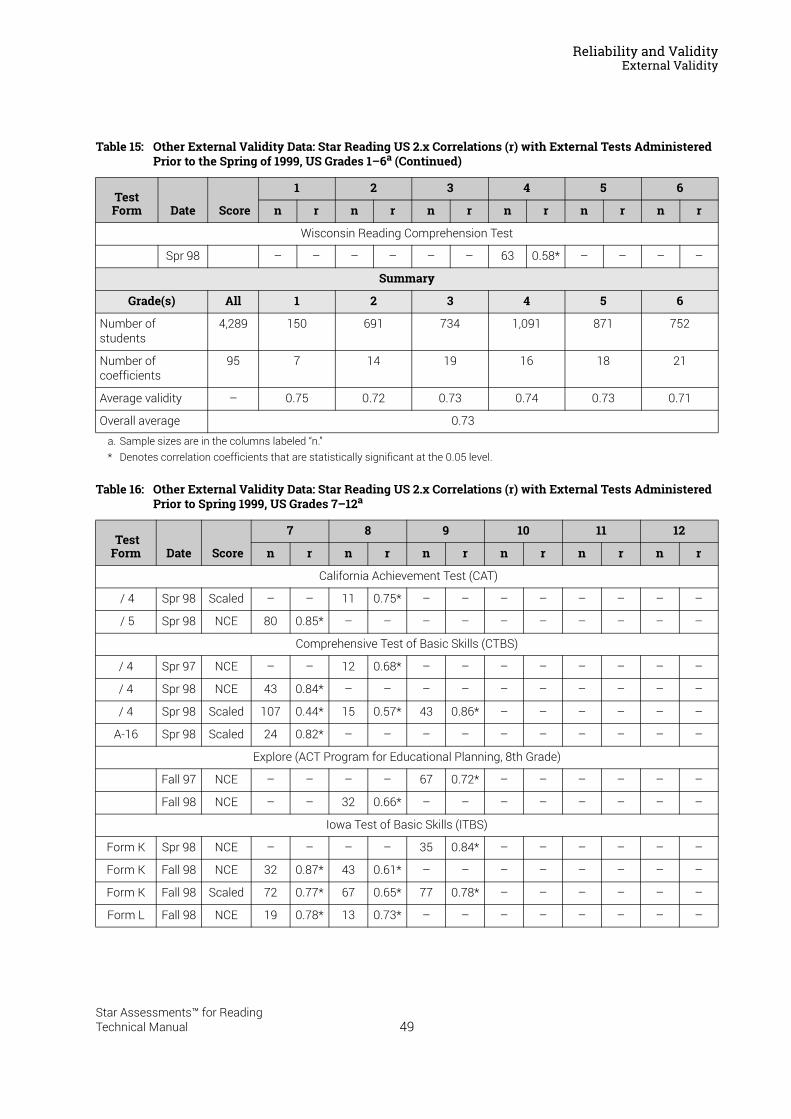
Reliability and ValidityExternal Validity
Wisconsin Reading Comprehension Test
Spr 98 – – – – – – 63 0.58* – – – –
Summary
Grade(s) All 1 2 3 4 5 6
Number of students
4,289 150 691 734 1,091 871 752
Number ofcoefficients
95 7 14 19 16 18 21
Average validity – 0.75 0.72 0.73 0.74 0.73 0.71
Overall average 0.73
a. Sample sizes are in the columns labeled “n.”* Denotes correlation coefficients that are statistically significant at the 0.05 level.
Table 16: Other External Validity Data: Star Reading US 2.x Correlations (r) with External Tests Administered Prior to Spring 1999, US Grades 7–12a
Test Form Date Score
7 8 9 10 11 12
n r n r n r n r n r n r
California Achievement Test (CAT)
/ 4 Spr 98 Scaled – – 11 0.75* – – – – – – – –
/ 5 Spr 98 NCE 80 0.85* – – – – – – – – – –
Comprehensive Test of Basic Skills (CTBS)
/ 4 Spr 97 NCE – – 12 0.68* – – – – – – – –
/ 4 Spr 98 NCE 43 0.84* – – – – – – – – – –
/ 4 Spr 98 Scaled 107 0.44* 15 0.57* 43 0.86* – – – – – –
A-16 Spr 98 Scaled 24 0.82* – – – – – – – – – –
Explore (ACT Program for Educational Planning, 8th Grade)
Fall 97 NCE – – – – 67 0.72* – – – – – –
Fall 98 NCE – – 32 0.66* – – – – – – – –
Iowa Test of Basic Skills (ITBS)
Form K Spr 98 NCE – – – – 35 0.84* – – – – – –
Form K Fall 98 NCE 32 0.87* 43 0.61* – – – – – – – –
Form K Fall 98 Scaled 72 0.77* 67 0.65* 77 0.78* – – – – – –
Form L Fall 98 NCE 19 0.78* 13 0.73* – – – – – – – –
Table 15: Other External Validity Data: Star Reading US 2.x Correlations (r) with External Tests Administered Prior to the Spring of 1999, US Grades 1–6a (Continued)
Test Form Date Score
1 2 3 4 5 6
n r n r n r n r n r n r
49Star Assessments™ for ReadingTechnical Manual
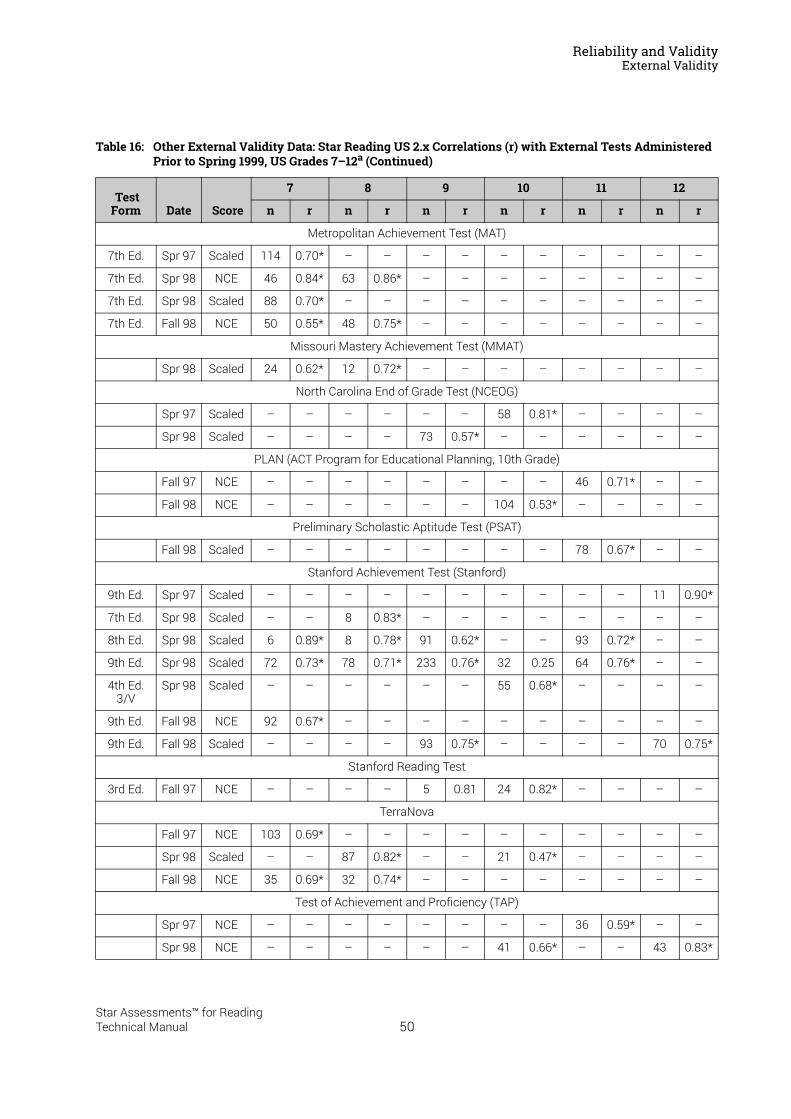
Reliability and ValidityExternal Validity
Metropolitan Achievement Test (MAT)
7th Ed. Spr 97 Scaled 114 0.70* – – – – – – – – – –
7th Ed. Spr 98 NCE 46 0.84* 63 0.86* – – – – – – – –
7th Ed. Spr 98 Scaled 88 0.70* – – – – – – – – – –
7th Ed. Fall 98 NCE 50 0.55* 48 0.75* – – – – – – – –
Missouri Mastery Achievement Test (MMAT)
Spr 98 Scaled 24 0.62* 12 0.72* – – – – – – – –
North Carolina End of Grade Test (NCEOG)
Spr 97 Scaled – – – – – – 58 0.81* – – – –
Spr 98 Scaled – – – – 73 0.57* – – – – – –
PLAN (ACT Program for Educational Planning, 10th Grade)
Fall 97 NCE – – – – – – – – 46 0.71* – –
Fall 98 NCE – – – – – – 104 0.53* – – – –
Preliminary Scholastic Aptitude Test (PSAT)
Fall 98 Scaled – – – – – – – – 78 0.67* – –
Stanford Achievement Test (Stanford)
9th Ed. Spr 97 Scaled – – – – – – – – – – 11 0.90*
7th Ed. Spr 98 Scaled – – 8 0.83* – – – – – – – –
8th Ed. Spr 98 Scaled 6 0.89* 8 0.78* 91 0.62* – – 93 0.72* – –
9th Ed. Spr 98 Scaled 72 0.73* 78 0.71* 233 0.76* 32 0.25 64 0.76* – –
4th Ed. 3/V
Spr 98 Scaled – – – – – – 55 0.68* – – – –
9th Ed. Fall 98 NCE 92 0.67* – – – – – – – – – –
9th Ed. Fall 98 Scaled – – – – 93 0.75* – – – – 70 0.75*
Stanford Reading Test
3rd Ed. Fall 97 NCE – – – – 5 0.81 24 0.82* – – – –
TerraNova
Fall 97 NCE 103 0.69* – – – – – – – – – –
Spr 98 Scaled – – 87 0.82* – – 21 0.47* – – – –
Fall 98 NCE 35 0.69* 32 0.74* – – – – – – – –
Test of Achievement and Proficiency (TAP)
Spr 97 NCE – – – – – – – – 36 0.59* – –
Spr 98 NCE – – – – – – 41 0.66* – – 43 0.83*
Table 16: Other External Validity Data: Star Reading US 2.x Correlations (r) with External Tests Administered Prior to Spring 1999, US Grades 7–12a (Continued)
Test Form Date Score
7 8 9 10 11 12
n r n r n r n r n r n r
50Star Assessments™ for ReadingTechnical Manual
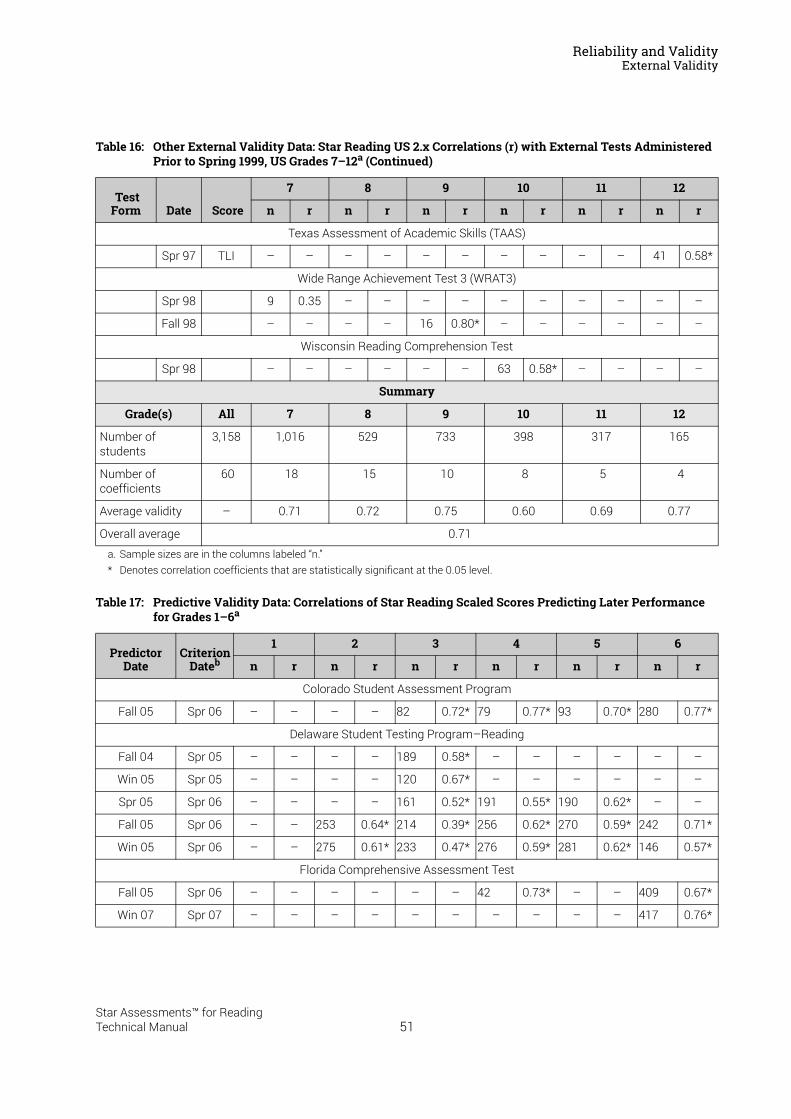
Reliability and ValidityExternal Validity
Texas Assessment of Academic Skills (TAAS)
Spr 97 TLI – – – – – – – – – – 41 0.58*
Wide Range Achievement Test 3 (WRAT3)
Spr 98 9 0.35 – – – – – – – – – –
Fall 98 – – – – 16 0.80* – – – – – –
Wisconsin Reading Comprehension Test
Spr 98 – – – – – – 63 0.58* – – – –
Summary
Grade(s) All 7 8 9 10 11 12
Number of students
3,158 1,016 529 733 398 317 165
Number ofcoefficients
60 18 15 10 8 5 4
Average validity – 0.71 0.72 0.75 0.60 0.69 0.77
Overall average 0.71
a. Sample sizes are in the columns labeled “n.”* Denotes correlation coefficients that are statistically significant at the 0.05 level.
Table 17: Predictive Validity Data: Correlations of Star Reading Scaled Scores Predicting Later Performance for Grades 1–6a
Predictor Date
Criterion Dateb
1 2 3 4 5 6
n r n r n r n r n r n r
Colorado Student Assessment Program
Fall 05 Spr 06 – – – – 82 0.72* 79 0.77* 93 0.70* 280 0.77*
Delaware Student Testing Program–Reading
Fall 04 Spr 05 – – – – 189 0.58* – – – – – –
Win 05 Spr 05 – – – – 120 0.67* – – – – – –
Spr 05 Spr 06 – – – – 161 0.52* 191 0.55* 190 0.62* – –
Fall 05 Spr 06 – – 253 0.64* 214 0.39* 256 0.62* 270 0.59* 242 0.71*
Win 05 Spr 06 – – 275 0.61* 233 0.47* 276 0.59* 281 0.62* 146 0.57*
Florida Comprehensive Assessment Test
Fall 05 Spr 06 – – – – – – 42 0.73* – – 409 0.67*
Win 07 Spr 07 – – – – – – – – – – 417 0.76*
Table 16: Other External Validity Data: Star Reading US 2.x Correlations (r) with External Tests Administered Prior to Spring 1999, US Grades 7–12a (Continued)
Test Form Date Score
7 8 9 10 11 12
n r n r n r n r n r n r
51Star Assessments™ for ReadingTechnical Manual
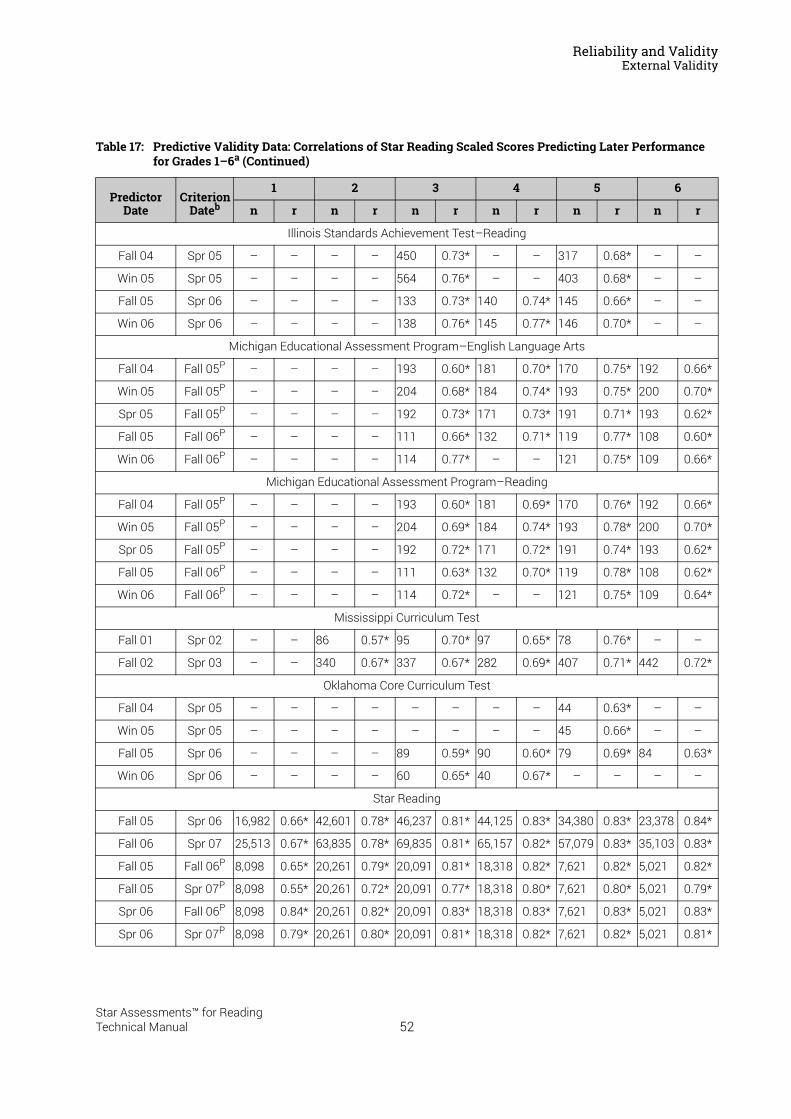
Reliability and ValidityExternal Validity
Illinois Standards Achievement Test–Reading
Fall 04 Spr 05 – – – – 450 0.73* – – 317 0.68* – –
Win 05 Spr 05 – – – – 564 0.76* – – 403 0.68* – –
Fall 05 Spr 06 – – – – 133 0.73* 140 0.74* 145 0.66* – –
Win 06 Spr 06 – – – – 138 0.76* 145 0.77* 146 0.70* – –
Michigan Educational Assessment Program–English Language Arts
Fall 04 Fall 05P – – – – 193 0.60* 181 0.70* 170 0.75* 192 0.66*
Win 05 Fall 05P – – – – 204 0.68* 184 0.74* 193 0.75* 200 0.70*
Spr 05 Fall 05P – – – – 192 0.73* 171 0.73* 191 0.71* 193 0.62*
Fall 05 Fall 06P – – – – 111 0.66* 132 0.71* 119 0.77* 108 0.60*
Win 06 Fall 06P – – – – 114 0.77* – – 121 0.75* 109 0.66*
Michigan Educational Assessment Program–Reading
Fall 04 Fall 05P – – – – 193 0.60* 181 0.69* 170 0.76* 192 0.66*
Win 05 Fall 05P – – – – 204 0.69* 184 0.74* 193 0.78* 200 0.70*
Spr 05 Fall 05P – – – – 192 0.72* 171 0.72* 191 0.74* 193 0.62*
Fall 05 Fall 06P – – – – 111 0.63* 132 0.70* 119 0.78* 108 0.62*
Win 06 Fall 06P – – – – 114 0.72* – – 121 0.75* 109 0.64*
Mississippi Curriculum Test
Fall 01 Spr 02 – – 86 0.57* 95 0.70* 97 0.65* 78 0.76* – –
Fall 02 Spr 03 – – 340 0.67* 337 0.67* 282 0.69* 407 0.71* 442 0.72*
Oklahoma Core Curriculum Test
Fall 04 Spr 05 – – – – – – – – 44 0.63* – –
Win 05 Spr 05 – – – – – – – – 45 0.66* – –
Fall 05 Spr 06 – – – – 89 0.59* 90 0.60* 79 0.69* 84 0.63*
Win 06 Spr 06 – – – – 60 0.65* 40 0.67* – – – –
Star Reading
Fall 05 Spr 06 16,982 0.66* 42,601 0.78* 46,237 0.81* 44,125 0.83* 34,380 0.83* 23,378 0.84*
Fall 06 Spr 07 25,513 0.67* 63,835 0.78* 69,835 0.81* 65,157 0.82* 57,079 0.83* 35,103 0.83*
Fall 05 Fall 06P 8,098 0.65* 20,261 0.79* 20,091 0.81* 18,318 0.82* 7,621 0.82* 5,021 0.82*
Fall 05 Spr 07P 8,098 0.55* 20,261 0.72* 20,091 0.77* 18,318 0.80* 7,621 0.80* 5,021 0.79*
Spr 06 Fall 06P 8,098 0.84* 20,261 0.82* 20,091 0.83* 18,318 0.83* 7,621 0.83* 5,021 0.83*
Spr 06 Spr 07P 8,098 0.79* 20,261 0.80* 20,091 0.81* 18,318 0.82* 7,621 0.82* 5,021 0.81*
Table 17: Predictive Validity Data: Correlations of Star Reading Scaled Scores Predicting Later Performance for Grades 1–6a (Continued)
Predictor Date
Criterion Dateb
1 2 3 4 5 6
n r n r n r n r n r n r
52Star Assessments™ for ReadingTechnical Manual
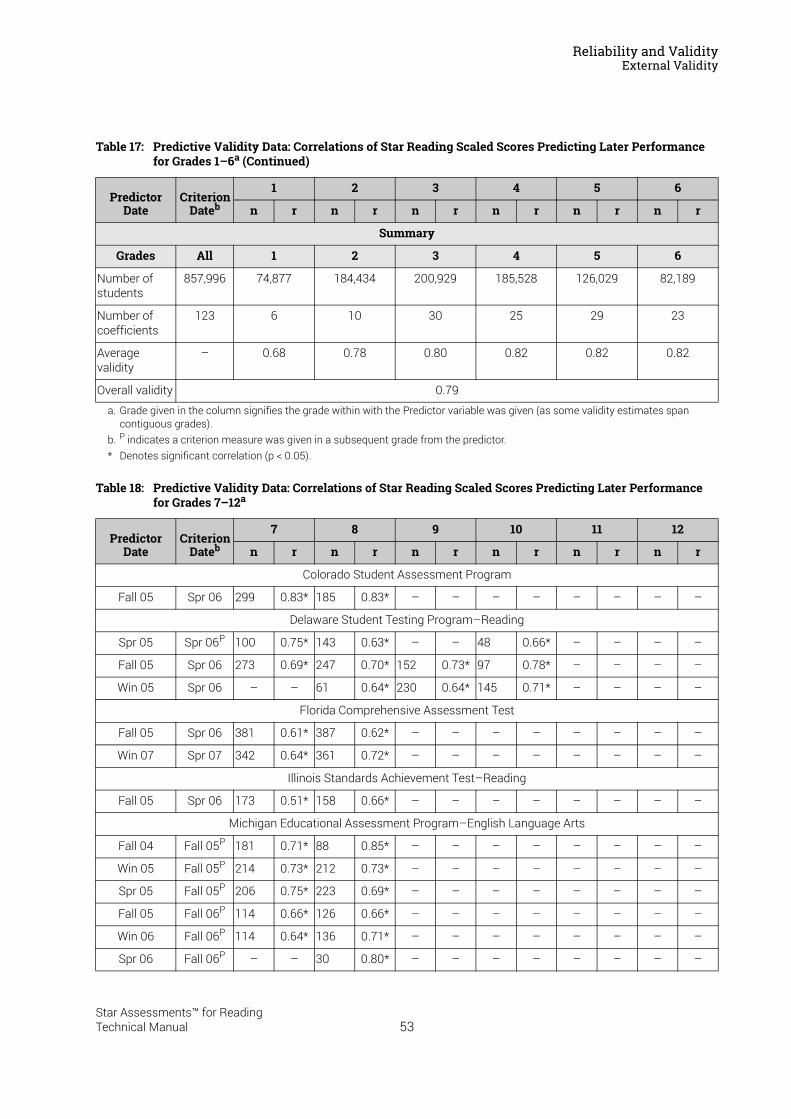
Reliability and ValidityExternal Validity
Summary
Grades All 1 2 3 4 5 6
Number of students
857,996 74,877 184,434 200,929 185,528 126,029 82,189
Number of coefficients
123 6 10 30 25 29 23
Average validity
– 0.68 0.78 0.80 0.82 0.82 0.82
Overall validity 0.79
a. Grade given in the column signifies the grade within with the Predictor variable was given (as some validity estimates span contiguous grades).
b. P indicates a criterion measure was given in a subsequent grade from the predictor.* Denotes significant correlation (p < 0.05).
Table 18: Predictive Validity Data: Correlations of Star Reading Scaled Scores Predicting Later Performance for Grades 7–12a
Predictor Date
Criterion Dateb
7 8 9 10 11 12
n r n r n r n r n r n r
Colorado Student Assessment Program
Fall 05 Spr 06 299 0.83* 185 0.83* – – – – – – – –
Delaware Student Testing Program–Reading
Spr 05 Spr 06P 100 0.75* 143 0.63* – – 48 0.66* – – – –
Fall 05 Spr 06 273 0.69* 247 0.70* 152 0.73* 97 0.78* – – – –
Win 05 Spr 06 – – 61 0.64* 230 0.64* 145 0.71* – – – –
Florida Comprehensive Assessment Test
Fall 05 Spr 06 381 0.61* 387 0.62* – – – – – – – –
Win 07 Spr 07 342 0.64* 361 0.72* – – – – – – – –
Illinois Standards Achievement Test–Reading
Fall 05 Spr 06 173 0.51* 158 0.66* – – – – – – – –
Michigan Educational Assessment Program–English Language Arts
Fall 04 Fall 05P 181 0.71* 88 0.85* – – – – – – – –
Win 05 Fall 05P 214 0.73* 212 0.73* – – – – – – – –
Spr 05 Fall 05P 206 0.75* 223 0.69* – – – – – – – –
Fall 05 Fall 06P 114 0.66* 126 0.66* – – – – – – – –
Win 06 Fall 06P 114 0.64* 136 0.71* – – – – – – – –
Spr 06 Fall 06P – – 30 0.80* – – – – – – – –
Table 17: Predictive Validity Data: Correlations of Star Reading Scaled Scores Predicting Later Performance for Grades 1–6a (Continued)
Predictor Date
Criterion Dateb
1 2 3 4 5 6
n r n r n r n r n r n r
53Star Assessments™ for ReadingTechnical Manual
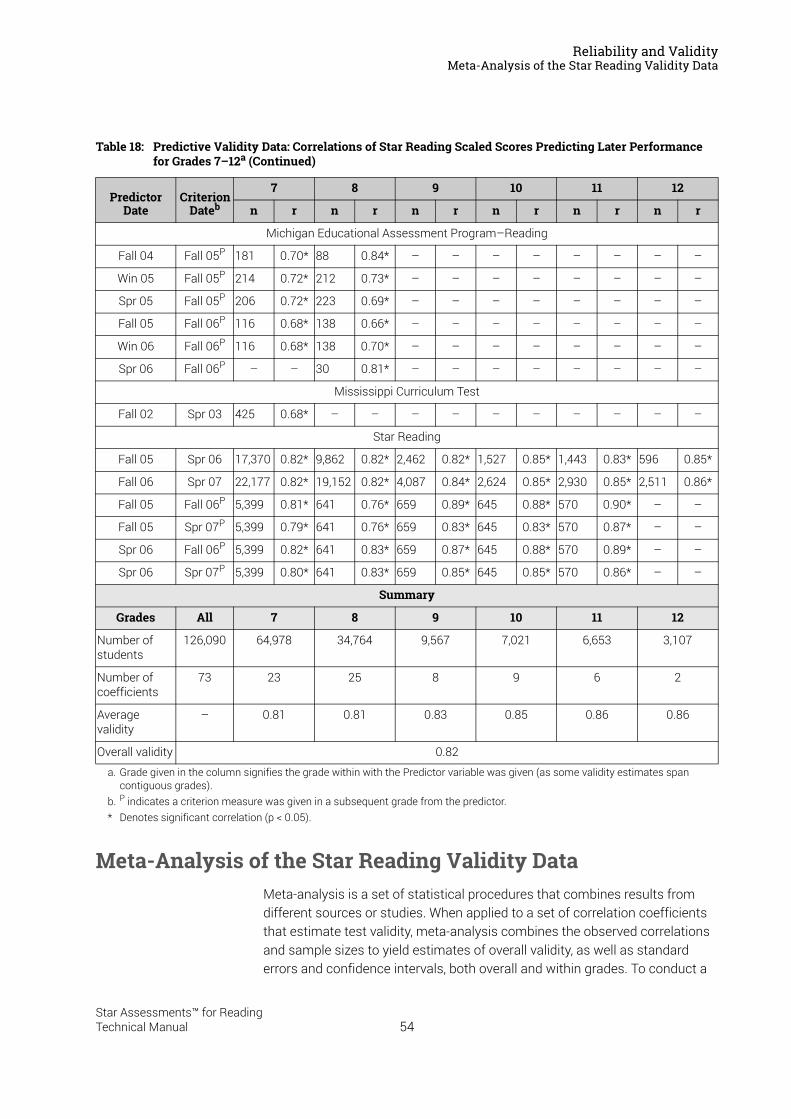
Reliability and ValidityMeta-Analysis of the Star Reading Validity Data
Meta-Analysis of the Star Reading Validity DataMeta-analysis is a set of statistical procedures that combines results from different sources or studies. When applied to a set of correlation coefficients that estimate test validity, meta-analysis combines the observed correlations and sample sizes to yield estimates of overall validity, as well as standard errors and confidence intervals, both overall and within grades. To conduct a
Michigan Educational Assessment Program–Reading
Fall 04 Fall 05P 181 0.70* 88 0.84* – – – – – – – –
Win 05 Fall 05P 214 0.72* 212 0.73* – – – – – – – –
Spr 05 Fall 05P 206 0.72* 223 0.69* – – – – – – – –
Fall 05 Fall 06P 116 0.68* 138 0.66* – – – – – – – –
Win 06 Fall 06P 116 0.68* 138 0.70* – – – – – – – –
Spr 06 Fall 06P – – 30 0.81* – – – – – – – –
Mississippi Curriculum Test
Fall 02 Spr 03 425 0.68* – – – – – – – – – –
Star Reading
Fall 05 Spr 06 17,370 0.82* 9,862 0.82* 2,462 0.82* 1,527 0.85* 1,443 0.83* 596 0.85*
Fall 06 Spr 07 22,177 0.82* 19,152 0.82* 4,087 0.84* 2,624 0.85* 2,930 0.85* 2,511 0.86*
Fall 05 Fall 06P 5,399 0.81* 641 0.76* 659 0.89* 645 0.88* 570 0.90* – –
Fall 05 Spr 07P 5,399 0.79* 641 0.76* 659 0.83* 645 0.83* 570 0.87* – –
Spr 06 Fall 06P 5,399 0.82* 641 0.83* 659 0.87* 645 0.88* 570 0.89* – –
Spr 06 Spr 07P 5,399 0.80* 641 0.83* 659 0.85* 645 0.85* 570 0.86* – –
Summary
Grades All 7 8 9 10 11 12
Number of students
126,090 64,978 34,764 9,567 7,021 6,653 3,107
Number of coefficients
73 23 25 8 9 6 2
Average validity
– 0.81 0.81 0.83 0.85 0.86 0.86
Overall validity 0.82
a. Grade given in the column signifies the grade within with the Predictor variable was given (as some validity estimates span contiguous grades).
b. P indicates a criterion measure was given in a subsequent grade from the predictor.* Denotes significant correlation (p < 0.05).
Table 18: Predictive Validity Data: Correlations of Star Reading Scaled Scores Predicting Later Performance for Grades 7–12a (Continued)
Predictor Date
Criterion Dateb
7 8 9 10 11 12
n r n r n r n r n r n r
54Star Assessments™ for ReadingTechnical Manual
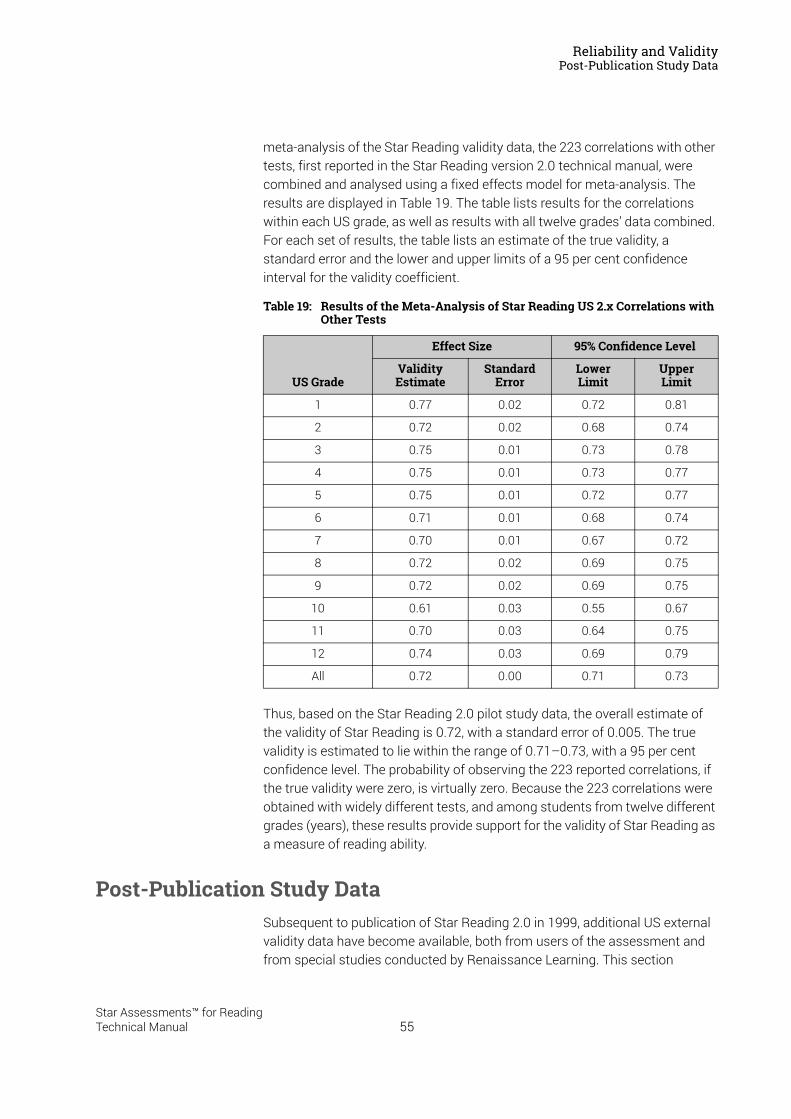
Reliability and ValidityPost-Publication Study Data
meta-analysis of the Star Reading validity data, the 223 correlations with other tests, first reported in the Star Reading version 2.0 technical manual, were combined and analysed using a fixed effects model for meta-analysis. The results are displayed in Table 19. The table lists results for the correlations within each US grade, as well as results with all twelve grades’ data combined. For each set of results, the table lists an estimate of the true validity, a standard error and the lower and upper limits of a 95 per cent confidence interval for the validity coefficient.
Thus, based on the Star Reading 2.0 pilot study data, the overall estimate of the validity of Star Reading is 0.72, with a standard error of 0.005. The true validity is estimated to lie within the range of 0.71–0.73, with a 95 per cent confidence level. The probability of observing the 223 reported correlations, if the true validity were zero, is virtually zero. Because the 223 correlations were obtained with widely different tests, and among students from twelve different grades (years), these results provide support for the validity of Star Reading as a measure of reading ability.
Post-Publication Study DataSubsequent to publication of Star Reading 2.0 in 1999, additional US external validity data have become available, both from users of the assessment and from special studies conducted by Renaissance Learning. This section
Table 19: Results of the Meta-Analysis of Star Reading US 2.x Correlations with Other Tests
US Grade
Effect Size 95% Confidence Level
Validity Estimate
StandardError
LowerLimit
UpperLimit
1 0.77 0.02 0.72 0.81
2 0.72 0.02 0.68 0.74
3 0.75 0.01 0.73 0.78
4 0.75 0.01 0.73 0.77
5 0.75 0.01 0.72 0.77
6 0.71 0.01 0.68 0.74
7 0.70 0.01 0.67 0.72
8 0.72 0.02 0.69 0.75
9 0.72 0.02 0.69 0.75
10 0.61 0.03 0.55 0.67
11 0.70 0.03 0.64 0.75
12 0.74 0.03 0.69 0.79
All 0.72 0.00 0.71 0.73
55Star Assessments™ for ReadingTechnical Manual
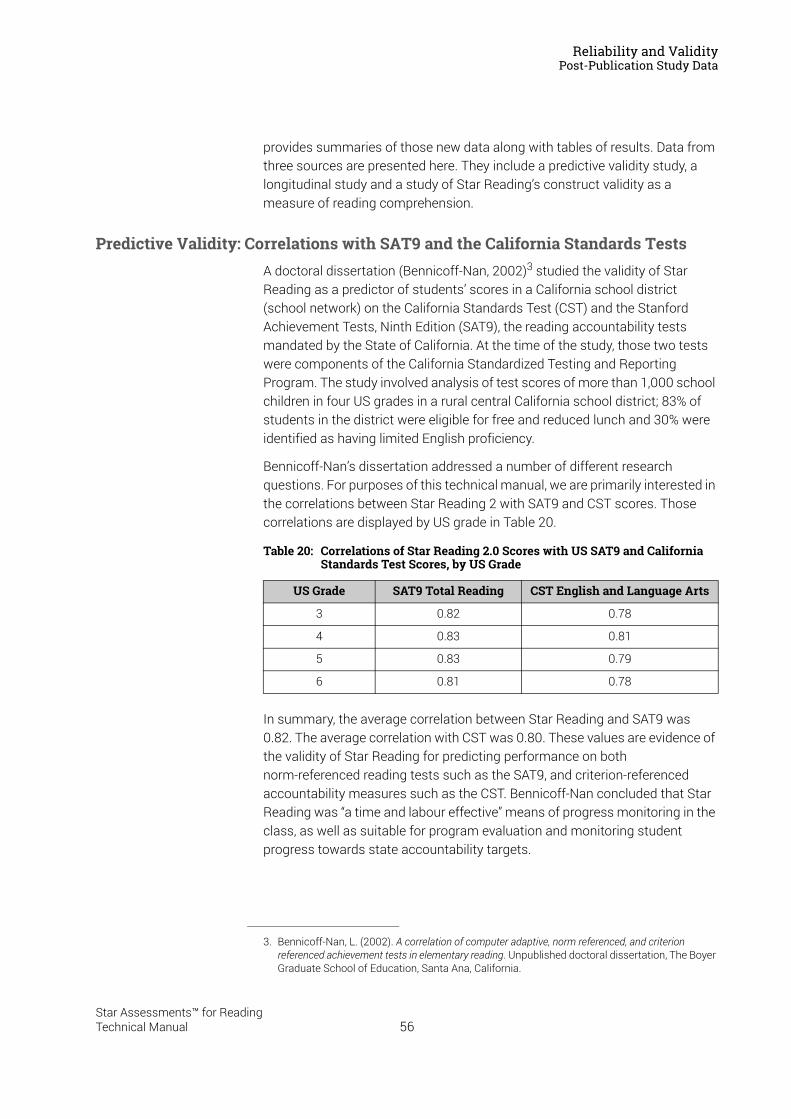
Reliability and ValidityPost-Publication Study Data
provides summaries of those new data along with tables of results. Data from three sources are presented here. They include a predictive validity study, a longitudinal study and a study of Star Reading’s construct validity as a measure of reading comprehension.
Predictive Validity: Correlations with SAT9 and the California Standards TestsA doctoral dissertation (Bennicoff-Nan, 2002)3 studied the validity of Star Reading as a predictor of students’ scores in a California school district (school network) on the California Standards Test (CST) and the Stanford Achievement Tests, Ninth Edition (SAT9), the reading accountability tests mandated by the State of California. At the time of the study, those two tests were components of the California Standardized Testing and Reporting Program. The study involved analysis of test scores of more than 1,000 school children in four US grades in a rural central California school district; 83% of students in the district were eligible for free and reduced lunch and 30% were identified as having limited English proficiency.
Bennicoff-Nan’s dissertation addressed a number of different research questions. For purposes of this technical manual, we are primarily interested in the correlations between Star Reading 2 with SAT9 and CST scores. Those correlations are displayed by US grade in Table 20.
In summary, the average correlation between Star Reading and SAT9 was 0.82. The average correlation with CST was 0.80. These values are evidence of the validity of Star Reading for predicting performance on both norm-referenced reading tests such as the SAT9, and criterion-referenced accountability measures such as the CST. Bennicoff-Nan concluded that Star Reading was “a time and labour effective” means of progress monitoring in the class, as well as suitable for program evaluation and monitoring student progress towards state accountability targets.
3. Bennicoff-Nan, L. (2002). A correlation of computer adaptive, norm referenced, and criterion referenced achievement tests in elementary reading. Unpublished doctoral dissertation, The Boyer Graduate School of Education, Santa Ana, California.
Table 20: Correlations of Star Reading 2.0 Scores with US SAT9 and California Standards Test Scores, by US Grade
US Grade SAT9 Total Reading CST English and Language Arts
3 0.82 0.78
4 0.83 0.81
5 0.83 0.79
6 0.81 0.78
56Star Assessments™ for ReadingTechnical Manual
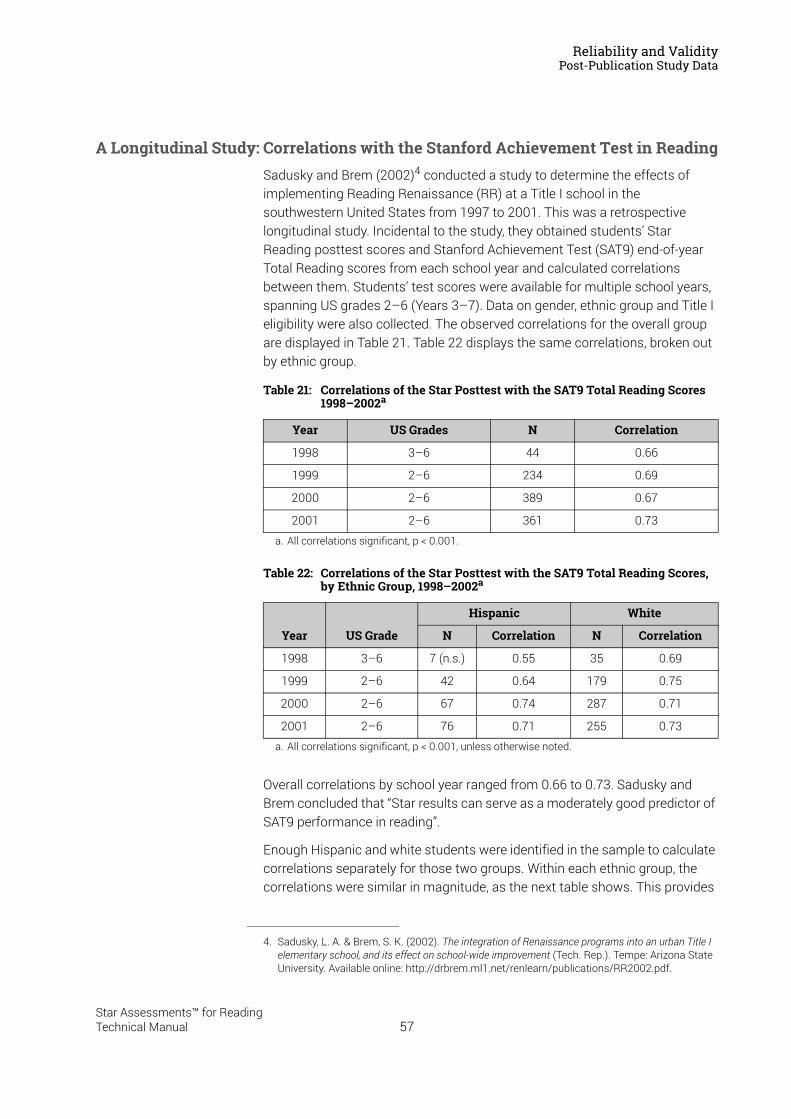
Reliability and ValidityPost-Publication Study Data
A Longitudinal Study: Correlations with the Stanford Achievement Test in ReadingSadusky and Brem (2002)4 conducted a study to determine the effects of implementing Reading Renaissance (RR) at a Title I school in the southwestern United States from 1997 to 2001. This was a retrospective longitudinal study. Incidental to the study, they obtained students’ Star Reading posttest scores and Stanford Achievement Test (SAT9) end-of-year Total Reading scores from each school year and calculated correlations between them. Students’ test scores were available for multiple school years, spanning US grades 2–6 (Years 3–7). Data on gender, ethnic group and Title I eligibility were also collected. The observed correlations for the overall group are displayed in Table 21. Table 22 displays the same correlations, broken out by ethnic group.
Overall correlations by school year ranged from 0.66 to 0.73. Sadusky and Brem concluded that “Star results can serve as a moderately good predictor of SAT9 performance in reading”.
Enough Hispanic and white students were identified in the sample to calculate correlations separately for those two groups. Within each ethnic group, the correlations were similar in magnitude, as the next table shows. This provides
4. Sadusky, L. A. & Brem, S. K. (2002). The integration of Renaissance programs into an urban Title I elementary school, and its effect on school-wide improvement (Tech. Rep.). Tempe: Arizona State University. Available online: http://drbrem.ml1.net/renlearn/publications/RR2002.pdf.
Table 21: Correlations of the Star Posttest with the SAT9 Total Reading Scores 1998–2002a
a. All correlations significant, p < 0.001.
Year US Grades N Correlation
1998 3–6 44 0.66
1999 2–6 234 0.69
2000 2–6 389 0.67
2001 2–6 361 0.73
Table 22: Correlations of the Star Posttest with the SAT9 Total Reading Scores, by Ethnic Group, 1998–2002a
a. All correlations significant, p < 0.001, unless otherwise noted.
Year US Grade
Hispanic White
N Correlation N Correlation
1998 3–6 7 (n.s.) 0.55 35 0.69
1999 2–6 42 0.64 179 0.75
2000 2–6 67 0.74 287 0.71
2001 2–6 76 0.71 255 0.73
57Star Assessments™ for ReadingTechnical Manual
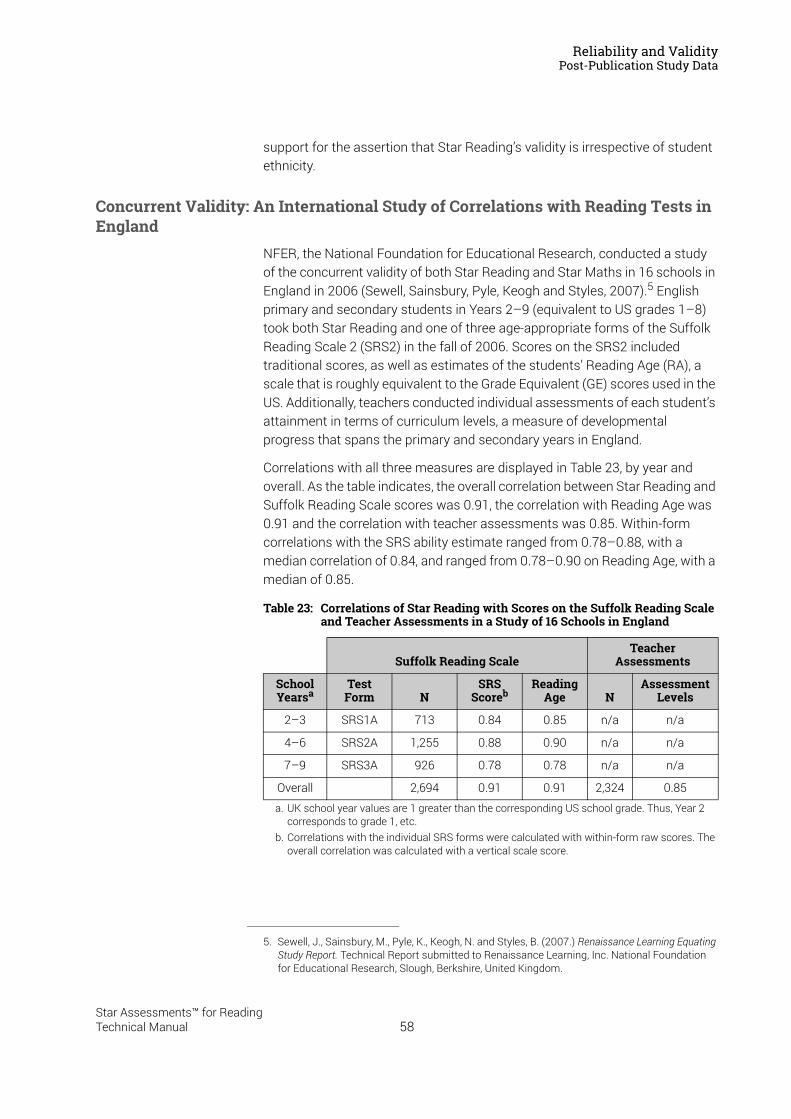
Reliability and ValidityPost-Publication Study Data
support for the assertion that Star Reading’s validity is irrespective of student ethnicity.
Concurrent Validity: An International Study of Correlations with Reading Tests in England
NFER, the National Foundation for Educational Research, conducted a study of the concurrent validity of both Star Reading and Star Maths in 16 schools in England in 2006 (Sewell, Sainsbury, Pyle, Keogh and Styles, 2007).5 English primary and secondary students in Years 2–9 (equivalent to US grades 1–8) took both Star Reading and one of three age-appropriate forms of the Suffolk Reading Scale 2 (SRS2) in the fall of 2006. Scores on the SRS2 included traditional scores, as well as estimates of the students’ Reading Age (RA), a scale that is roughly equivalent to the Grade Equivalent (GE) scores used in the US. Additionally, teachers conducted individual assessments of each student’s attainment in terms of curriculum levels, a measure of developmental progress that spans the primary and secondary years in England.
Correlations with all three measures are displayed in Table 23, by year and overall. As the table indicates, the overall correlation between Star Reading and Suffolk Reading Scale scores was 0.91, the correlation with Reading Age was 0.91 and the correlation with teacher assessments was 0.85. Within-form correlations with the SRS ability estimate ranged from 0.78–0.88, with a median correlation of 0.84, and ranged from 0.78–0.90 on Reading Age, with a median of 0.85.
5. Sewell, J., Sainsbury, M., Pyle, K., Keogh, N. and Styles, B. (2007.) Renaissance Learning Equating Study Report. Technical Report submitted to Renaissance Learning, Inc. National Foundation for Educational Research, Slough, Berkshire, United Kingdom.
Table 23: Correlations of Star Reading with Scores on the Suffolk Reading Scale and Teacher Assessments in a Study of 16 Schools in England
Suffolk Reading ScaleTeacher
Assessments
School Yearsa
a. UK school year values are 1 greater than the corresponding US school grade. Thus, Year 2 corresponds to grade 1, etc.
Test Form N
SRS Scoreb
b. Correlations with the individual SRS forms were calculated with within-form raw scores. The overall correlation was calculated with a vertical scale score.
Reading Age N
Assessment Levels
2–3 SRS1A 713 0.84 0.85 n/a n/a
4–6 SRS2A 1,255 0.88 0.90 n/a n/a
7–9 SRS3A 926 0.78 0.78 n/a n/a
Overall 2,694 0.91 0.91 2,324 0.85
58Star Assessments™ for ReadingTechnical Manual
Reliability and ValidityPost-Publication Study Data
Construct Validity: Correlations with a Measure of Reading ComprehensionThe Degrees of Reading Power (DRP) test is widely recognised in the United States as a measure of reading comprehension. Yoes (1999)6 conducted an analysis to link the Star Reading Rasch item difficulty scale to the item difficulty scale of DRP. As part of the study, nationwide samples of students in the US grades 3, 5, 7 and 10 (Years 4, 6, 8 and 11) took two tests each (levelled forms of both the DRP and of Star Reading calibration tests). The forms administered were appropriate to each student’s US grade level. Both tests were administered in paper-and-pencil format. All Star Reading test forms consisted of 44 items, a mixture of vocabulary-in-context and extended passage comprehension item types. The US grade 3 (Year 4) DRP test form (H-9) contained 42 items and all remaining US grades (5, 7 and 10; Years 6, 8 and 11) consisted of 70 items on the DRP test.
Star Reading and DRP test score data were obtained on 273 students at US grade 3 (Year 4), 424 students at US grade 5 (Year 6), 353 students at US grade 7 (Year 8) and 314 students at US grade 10 (Year 11).
Item-level factor analysis of the combined Star and DRP response data indicated that the tests were essentially measuring the same construct at each of the four years. Latent roots (Eigenvalues) from the factor analysis of the tetrachoric correlation matrices tended to verify the presence of an essentially unidimensional construct. In general, the eigenvalue associated with the first factor was very large in relation to the eigenvalue associated with the second factor. Overall, these results confirmed the essential unidimensionality of the combined Star Reading and DRP data. Since DRP is an acknowledged measure of reading comprehension, the factor analysis data support the assertion that Star Reading likewise measures reading comprehension.
Subsequent to the factor analysis, the Star Reading item difficulty parameters were transformed to the DRP difficulty scale, so that scores on both tests could be expressed on a common scale. Star Reading scores on that scale were then calculated using the methods of item response theory. The correlations between Star Reading and DRP reading comprehension scores
6. Yoes, M. (1999) Linking the Star and DRP Reading Test Scales. Technical Report. Submitted to Touchstone Applied Science Associates and Renaissance Learning.
59Star Assessments™ for ReadingTechnical Manual
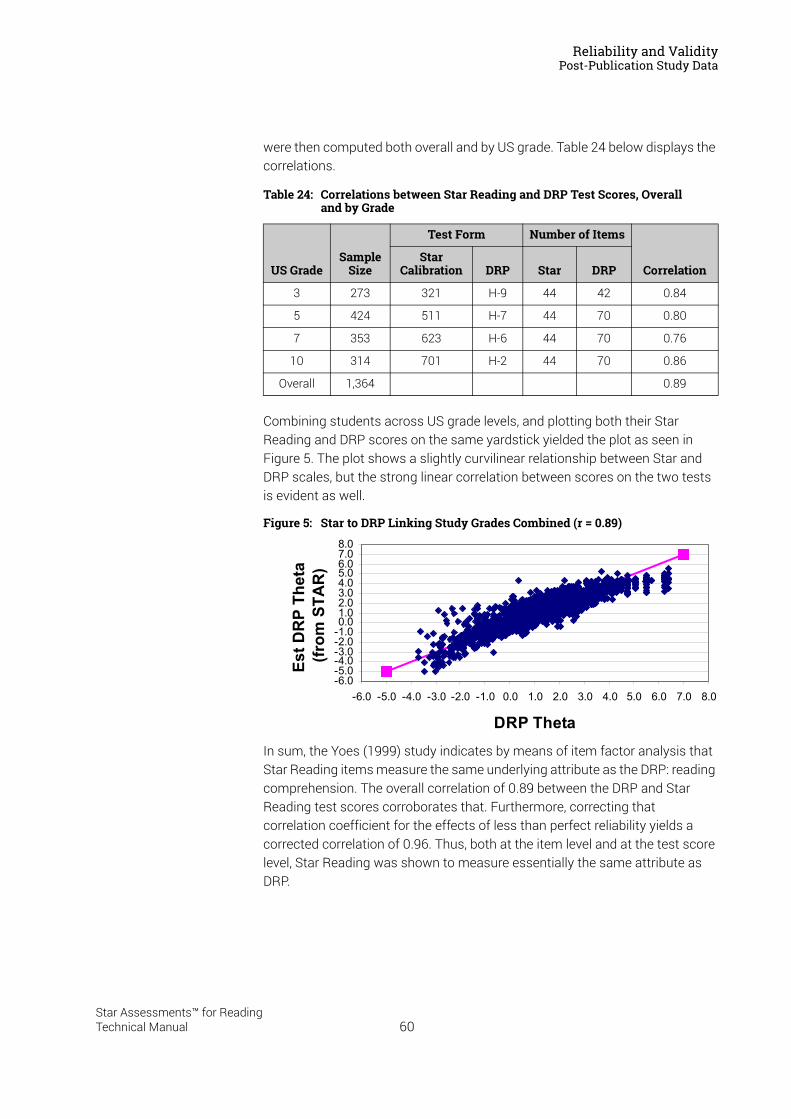
Reliability and ValidityPost-Publication Study Data
were then computed both overall and by US grade. Table 24 below displays the correlations.
Combining students across US grade levels, and plotting both their Star Reading and DRP scores on the same yardstick yielded the plot as seen in Figure 5. The plot shows a slightly curvilinear relationship between Star and DRP scales, but the strong linear correlation between scores on the two tests is evident as well.
Figure 5: Star to DRP Linking Study Grades Combined (r = 0.89)
In sum, the Yoes (1999) study indicates by means of item factor analysis that Star Reading items measure the same underlying attribute as the DRP: reading comprehension. The overall correlation of 0.89 between the DRP and Star Reading test scores corroborates that. Furthermore, correcting that correlation coefficient for the effects of less than perfect reliability yields a corrected correlation of 0.96. Thus, both at the item level and at the test score level, Star Reading was shown to measure essentially the same attribute as DRP.
Table 24: Correlations between Star Reading and DRP Test Scores, Overall and by Grade
US GradeSample
Size
Test Form Number of Items
CorrelationStar
Calibration DRP Star DRP
3 273 321 H-9 44 42 0.84
5 424 511 H-7 44 70 0.80
7 353 623 H-6 44 70 0.76
10 314 701 H-2 44 70 0.86
Overall 1,364 0.89
-6.0-5.0-4.0-3.0-2.0-1.00.01.02.03.04.05.06.07.08.0
-6.0 -5.0 -4.0 -3.0 -2.0 -1.0 0.0 1.0 2.0 3.0 4.0 5.0 6.0 7.0 8.0
DRP Theta
Est D
RP
Thet
a (fr
om S
TAR
)
60Star Assessments™ for ReadingTechnical Manual
Reliability and ValidityPost-Publication Study Data
Investigating Oral Reading Fluency and Developing the Estimated Oral Reading Fluency Scale
During the fall of 2007 and winter of 2008, 32 schools across the United States that were then using both Star Reading and DIBELS oral reading fluency (DORF) for interim assessments were contacted and asked to participate in the research. The schools were asked to ensure that students were tested during the fall and winter interim assessments schedules, usually during September and January, respectively, on both Star Reading and DORF within a 2-week time interval. Schools used the benchmark assessment passages from the year-appropriate DORF passage sets.
In addition, schools were asked to submit data from the previous school year on the interim assessments. Any student that had a valid Star Reading and DORF assessment within a 2-week time span was used in the analysis. Thus, the research involved both a current sample of students who took benchmark assessments during the fall and winter of the 2007–2008 school year, as well as historical data from those same schools for students who took either the fall, winter, or spring benchmark assessments from the 2006–2007 school year.
This single group design provided data for both evaluation of concurrent validity and the linking of the two score scales. For the linking analysis, an equipercentile methodology was used. Analysis was done independently for grades 1–4 (Years 2–5). Grade 1 (Year 2) data did not include any fall data, and all analyses were done using data from winter (both historical data from 2006–2007, and extant data collections during the 2007–2008 school year) and spring (historical data from the 2006–2007 school year). To evaluate the extent to which the linking accurately approximated student performance, 90% of the sample was used to calibrate the linking model and the remaining 10% were used for cross-validating the results. The 10% were chosen by a simple random function.
The 32 schools in the sample came from 9 states: Alabama, Arizona, California, Colorado, Delaware, Illinois, Michigan, Tennessee and Texas. This represented a broad range of geographic areas, and resulted in a large number of students (N = 12,220). The distribution of students by year was as follows:
1st grade (Year 2): 2,001
2nd grade (Year 3): 4,522
3rd grade (Year 4): 3,859
4th grade (Year 5): 1,838
The sample was composed of 61 per cent of students of European ancestry; 21 per cent of African ancestry; 11 per cent of Hispanic ancestry; with the remaining 7 per cent of Native American, Asian or other ancestry. Just over 3
61Star Assessments™ for ReadingTechnical Manual
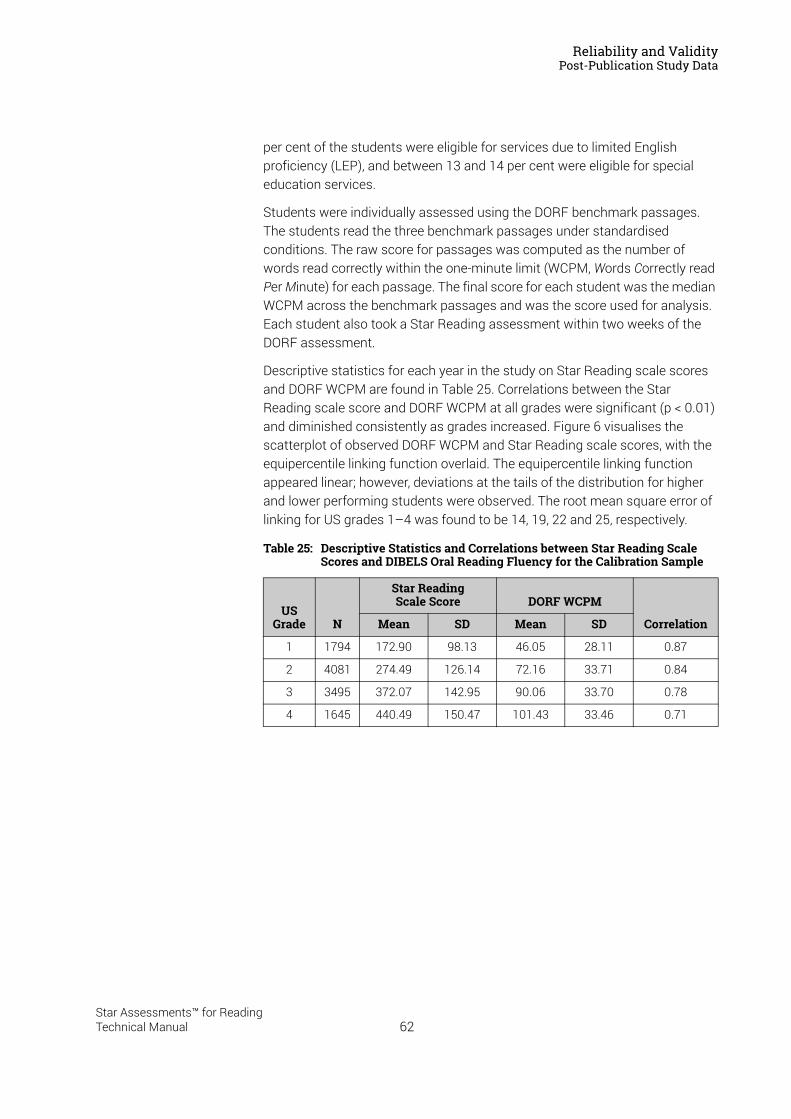
Reliability and ValidityPost-Publication Study Data
per cent of the students were eligible for services due to limited English proficiency (LEP), and between 13 and 14 per cent were eligible for special education services.
Students were individually assessed using the DORF benchmark passages. The students read the three benchmark passages under standardised conditions. The raw score for passages was computed as the number of words read correctly within the one-minute limit (WCPM, Words Correctly read Per Minute) for each passage. The final score for each student was the median WCPM across the benchmark passages and was the score used for analysis. Each student also took a Star Reading assessment within two weeks of the DORF assessment.
Descriptive statistics for each year in the study on Star Reading scale scores and DORF WCPM are found in Table 25. Correlations between the Star Reading scale score and DORF WCPM at all grades were significant (p < 0.01) and diminished consistently as grades increased. Figure 6 visualises the scatterplot of observed DORF WCPM and Star Reading scale scores, with the equipercentile linking function overlaid. The equipercentile linking function appeared linear; however, deviations at the tails of the distribution for higher and lower performing students were observed. The root mean square error of linking for US grades 1–4 was found to be 14, 19, 22 and 25, respectively.
Table 25: Descriptive Statistics and Correlations between Star Reading Scale Scores and DIBELS Oral Reading Fluency for the Calibration Sample
US Grade N
Star ReadingScale Score DORF WCPM
CorrelationMean SD Mean SD
1 1794 172.90 98.13 46.05 28.11 0.87
2 4081 274.49 126.14 72.16 33.71 0.84
3 3495 372.07 142.95 90.06 33.70 0.78
4 1645 440.49 150.47 101.43 33.46 0.71
62Star Assessments™ for ReadingTechnical Manual
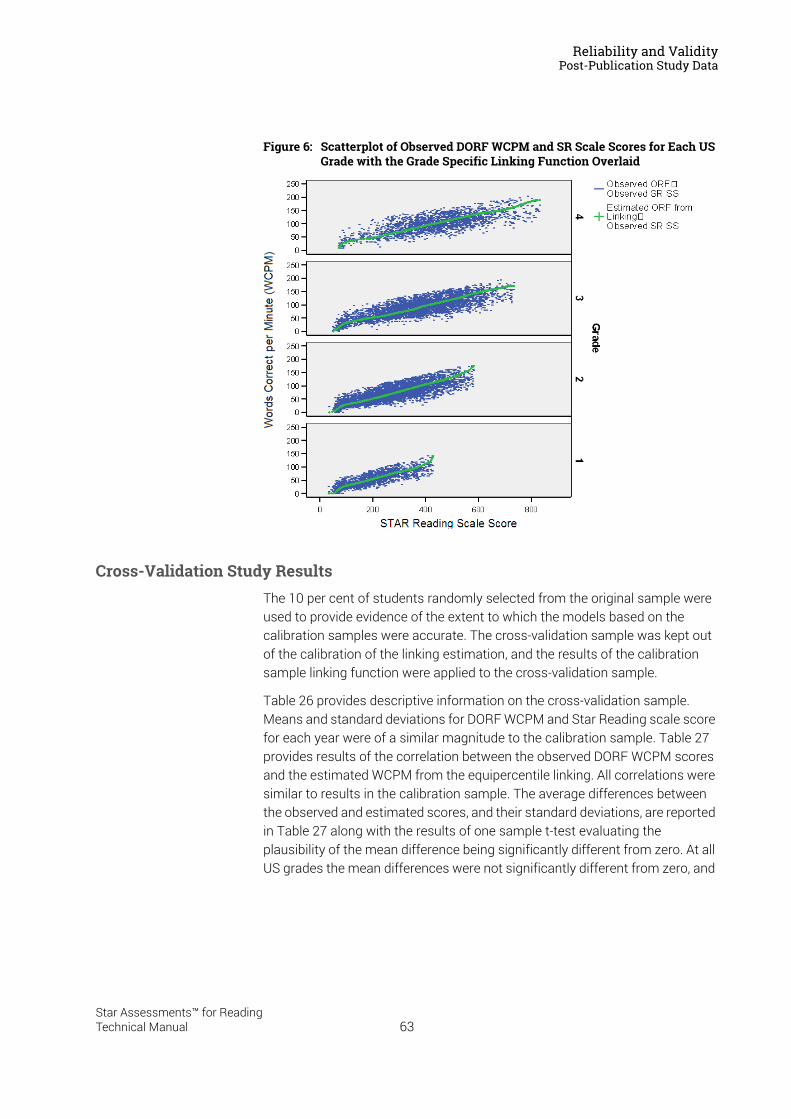
Reliability and ValidityPost-Publication Study Data
Figure 6: Scatterplot of Observed DORF WCPM and SR Scale Scores for Each US Grade with the Grade Specific Linking Function Overlaid
Cross-Validation Study ResultsThe 10 per cent of students randomly selected from the original sample were used to provide evidence of the extent to which the models based on the calibration samples were accurate. The cross-validation sample was kept out of the calibration of the linking estimation, and the results of the calibration sample linking function were applied to the cross-validation sample.
Table 26 provides descriptive information on the cross-validation sample. Means and standard deviations for DORF WCPM and Star Reading scale score for each year were of a similar magnitude to the calibration sample. Table 27 provides results of the correlation between the observed DORF WCPM scores and the estimated WCPM from the equipercentile linking. All correlations were similar to results in the calibration sample. The average differences between the observed and estimated scores, and their standard deviations, are reported in Table 27 along with the results of one sample t-test evaluating the plausibility of the mean difference being significantly different from zero. At all US grades the mean differences were not significantly different from zero, and
63Star Assessments™ for ReadingTechnical Manual
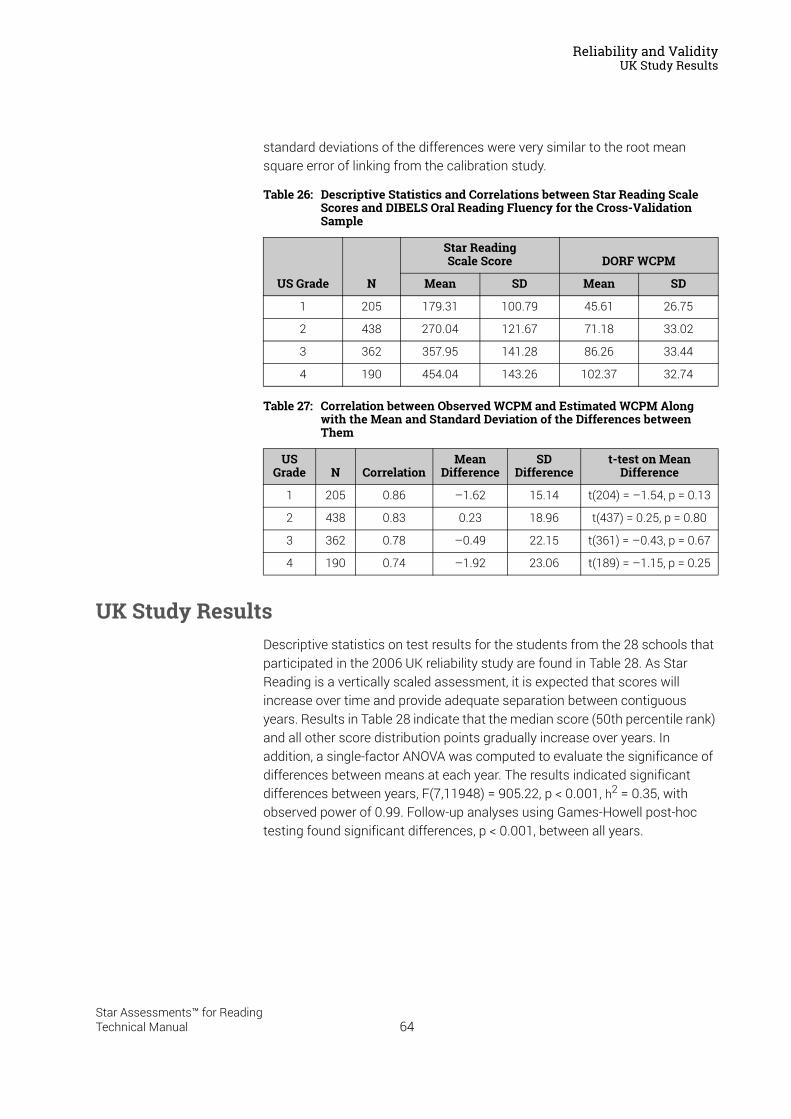
Reliability and ValidityUK Study Results
standard deviations of the differences were very similar to the root mean square error of linking from the calibration study.
UK Study ResultsDescriptive statistics on test results for the students from the 28 schools that participated in the 2006 UK reliability study are found in Table 28. As Star Reading is a vertically scaled assessment, it is expected that scores will increase over time and provide adequate separation between contiguous years. Results in Table 28 indicate that the median score (50th percentile rank) and all other score distribution points gradually increase over years. In addition, a single-factor ANOVA was computed to evaluate the significance of differences between means at each year. The results indicated significant differences between years, F(7,11948) = 905.22, p < 0.001, h2 = 0.35, with observed power of 0.99. Follow-up analyses using Games-Howell post-hoc testing found significant differences, p < 0.001, between all years.
Table 26: Descriptive Statistics and Correlations between Star Reading Scale Scores and DIBELS Oral Reading Fluency for the Cross-Validation Sample
US Grade N
Star Reading Scale Score DORF WCPM
Mean SD Mean SD
1 205 179.31 100.79 45.61 26.75
2 438 270.04 121.67 71.18 33.02
3 362 357.95 141.28 86.26 33.44
4 190 454.04 143.26 102.37 32.74
Table 27: Correlation between Observed WCPM and Estimated WCPM Along with the Mean and Standard Deviation of the Differences between Them
US Grade N Correlation
Mean Difference
SD Difference
t-test on Mean Difference
1 205 0.86 –1.62 15.14 t(204) = –1.54, p = 0.13
2 438 0.83 0.23 18.96 t(437) = 0.25, p = 0.80
3 362 0.78 –0.49 22.15 t(361) = –0.43, p = 0.67
4 190 0.74 –1.92 23.06 t(189) = –1.15, p = 0.25
64Star Assessments™ for ReadingTechnical Manual
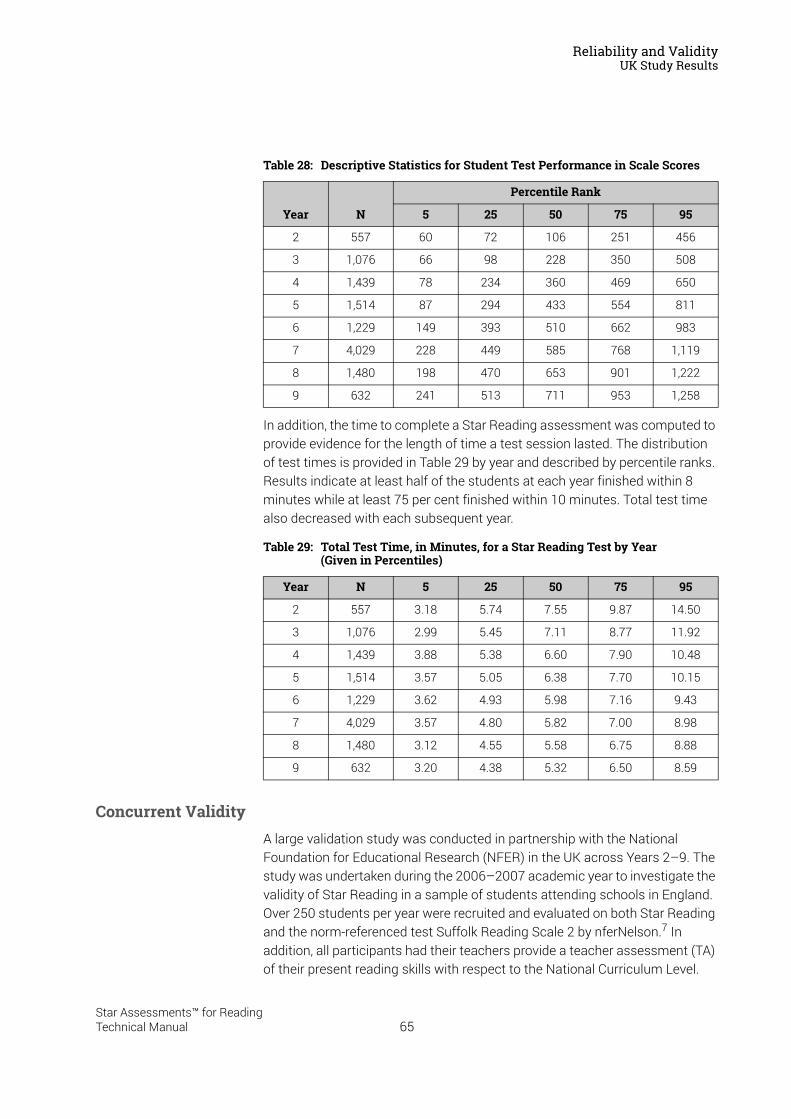
Reliability and ValidityUK Study Results
In addition, the time to complete a Star Reading assessment was computed to provide evidence for the length of time a test session lasted. The distribution of test times is provided in Table 29 by year and described by percentile ranks. Results indicate at least half of the students at each year finished within 8 minutes while at least 75 per cent finished within 10 minutes. Total test time also decreased with each subsequent year.
Concurrent ValidityA large validation study was conducted in partnership with the National Foundation for Educational Research (NFER) in the UK across Years 2–9. The study was undertaken during the 2006–2007 academic year to investigate the validity of Star Reading in a sample of students attending schools in England. Over 250 students per year were recruited and evaluated on both Star Reading and the norm-referenced test Suffolk Reading Scale 2 by nferNelson.7 In addition, all participants had their teachers provide a teacher assessment (TA) of their present reading skills with respect to the National Curriculum Level.
Table 28: Descriptive Statistics for Student Test Performance in Scale Scores
Year N
Percentile Rank
5 25 50 75 95
2 557 60 72 106 251 456
3 1,076 66 98 228 350 508
4 1,439 78 234 360 469 650
5 1,514 87 294 433 554 811
6 1,229 149 393 510 662 983
7 4,029 228 449 585 768 1,119
8 1,480 198 470 653 901 1,222
9 632 241 513 711 953 1,258
Table 29: Total Test Time, in Minutes, for a Star Reading Test by Year (Given in Percentiles)
Year N 5 25 50 75 95
2 557 3.18 5.74 7.55 9.87 14.50
3 1,076 2.99 5.45 7.11 8.77 11.92
4 1,439 3.88 5.38 6.60 7.90 10.48
5 1,514 3.57 5.05 6.38 7.70 10.15
6 1,229 3.62 4.93 5.98 7.16 9.43
7 4,029 3.57 4.80 5.82 7.00 8.98
8 1,480 3.12 4.55 5.58 6.75 8.88
9 632 3.20 4.38 5.32 6.50 8.59
65Star Assessments™ for ReadingTechnical Manual
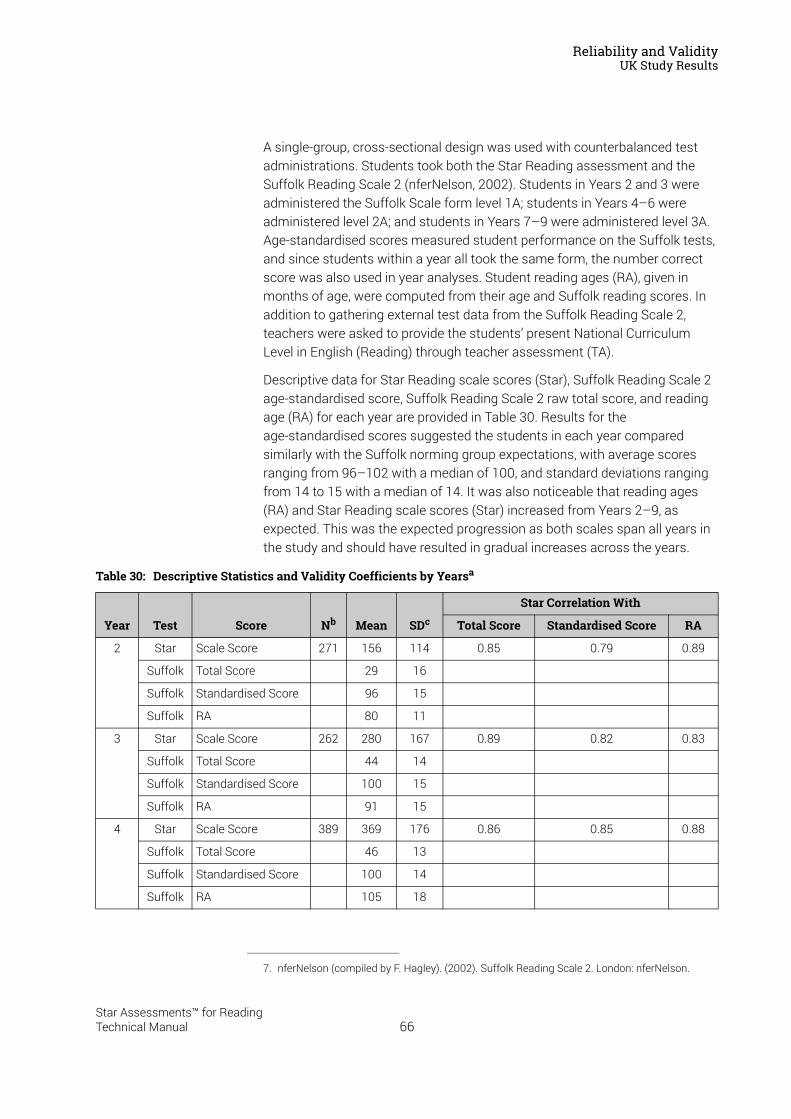
Reliability and ValidityUK Study Results
A single-group, cross-sectional design was used with counterbalanced test administrations. Students took both the Star Reading assessment and the Suffolk Reading Scale 2 (nferNelson, 2002). Students in Years 2 and 3 were administered the Suffolk Scale form level 1A; students in Years 4–6 were administered level 2A; and students in Years 7–9 were administered level 3A. Age-standardised scores measured student performance on the Suffolk tests, and since students within a year all took the same form, the number correct score was also used in year analyses. Student reading ages (RA), given in months of age, were computed from their age and Suffolk reading scores. In addition to gathering external test data from the Suffolk Reading Scale 2, teachers were asked to provide the students’ present National Curriculum Level in English (Reading) through teacher assessment (TA).
Descriptive data for Star Reading scale scores (Star), Suffolk Reading Scale 2 age-standardised score, Suffolk Reading Scale 2 raw total score, and reading age (RA) for each year are provided in Table 30. Results for the age-standardised scores suggested the students in each year compared similarly with the Suffolk norming group expectations, with average scores ranging from 96–102 with a median of 100, and standard deviations ranging from 14 to 15 with a median of 14. It was also noticeable that reading ages (RA) and Star Reading scale scores (Star) increased from Years 2–9, as expected. This was the expected progression as both scales span all years in the study and should have resulted in gradual increases across the years.
7. nferNelson (compiled by F. Hagley). (2002). Suffolk Reading Scale 2. London: nferNelson.
Table 30: Descriptive Statistics and Validity Coefficients by Yearsa
Year Test Score Nb Mean SDc
Star Correlation With
Total Score Standardised Score RA
2 Star Scale Score 271 156 114 0.85 0.79 0.89
Suffolk Total Score 29 16
Suffolk Standardised Score 96 15
Suffolk RA 80 11
3 Star Scale Score 262 280 167 0.89 0.82 0.83
Suffolk Total Score 44 14
Suffolk Standardised Score 100 15
Suffolk RA 91 15
4 Star Scale Score 389 369 176 0.86 0.85 0.88
Suffolk Total Score 46 13
Suffolk Standardised Score 100 14
Suffolk RA 105 18
66Star Assessments™ for ReadingTechnical Manual
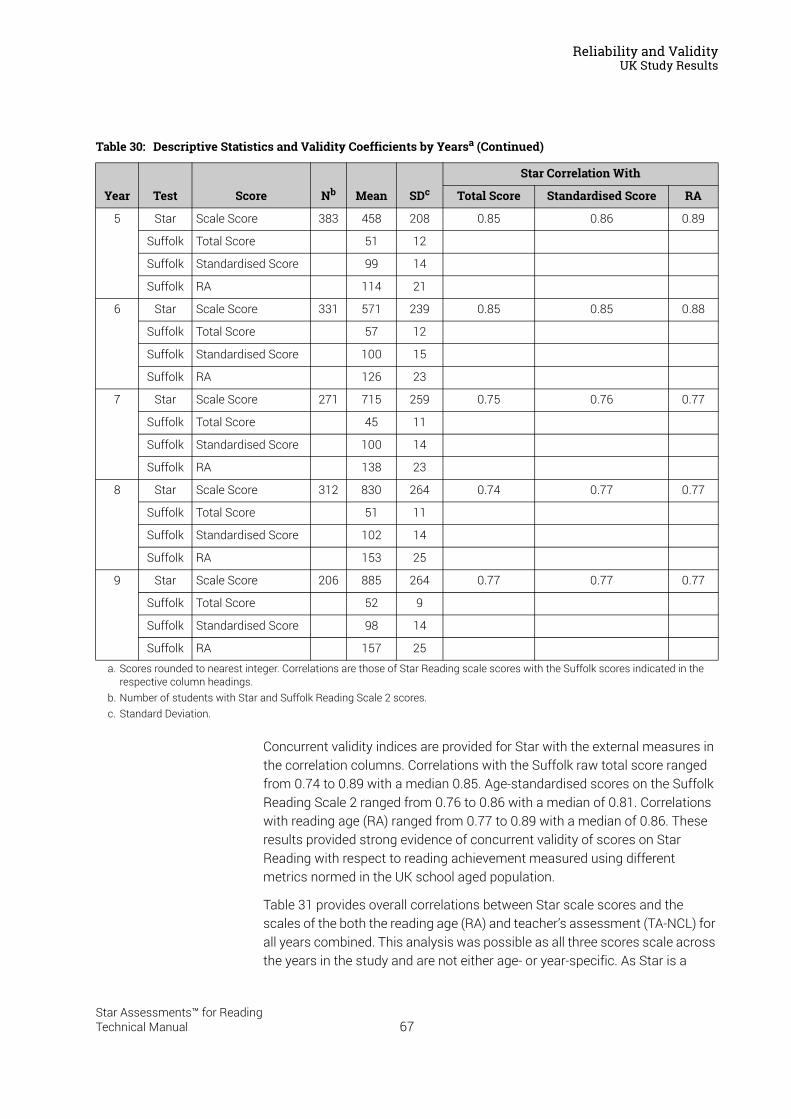
Reliability and ValidityUK Study Results
Concurrent validity indices are provided for Star with the external measures in the correlation columns. Correlations with the Suffolk raw total score ranged from 0.74 to 0.89 with a median 0.85. Age-standardised scores on the Suffolk Reading Scale 2 ranged from 0.76 to 0.86 with a median of 0.81. Correlations with reading age (RA) ranged from 0.77 to 0.89 with a median of 0.86. These results provided strong evidence of concurrent validity of scores on Star Reading with respect to reading achievement measured using different metrics normed in the UK school aged population.
Table 31 provides overall correlations between Star scale scores and the scales of the both the reading age (RA) and teacher’s assessment (TA-NCL) for all years combined. This analysis was possible as all three scores scale across the years in the study and are not either age- or year-specific. As Star is a
5 Star Scale Score 383 458 208 0.85 0.86 0.89
Suffolk Total Score 51 12
Suffolk Standardised Score 99 14
Suffolk RA 114 21
6 Star Scale Score 331 571 239 0.85 0.85 0.88
Suffolk Total Score 57 12
Suffolk Standardised Score 100 15
Suffolk RA 126 23
7 Star Scale Score 271 715 259 0.75 0.76 0.77
Suffolk Total Score 45 11
Suffolk Standardised Score 100 14
Suffolk RA 138 23
8 Star Scale Score 312 830 264 0.74 0.77 0.77
Suffolk Total Score 51 11
Suffolk Standardised Score 102 14
Suffolk RA 153 25
9 Star Scale Score 206 885 264 0.77 0.77 0.77
Suffolk Total Score 52 9
Suffolk Standardised Score 98 14
Suffolk RA 157 25
a. Scores rounded to nearest integer. Correlations are those of Star Reading scale scores with the Suffolk scores indicated in the respective column headings.
b. Number of students with Star and Suffolk Reading Scale 2 scores.c. Standard Deviation.
Table 30: Descriptive Statistics and Validity Coefficients by Yearsa (Continued)
Year Test Score Nb Mean SDc
Star Correlation With
Total Score Standardised Score RA
67Star Assessments™ for ReadingTechnical Manual
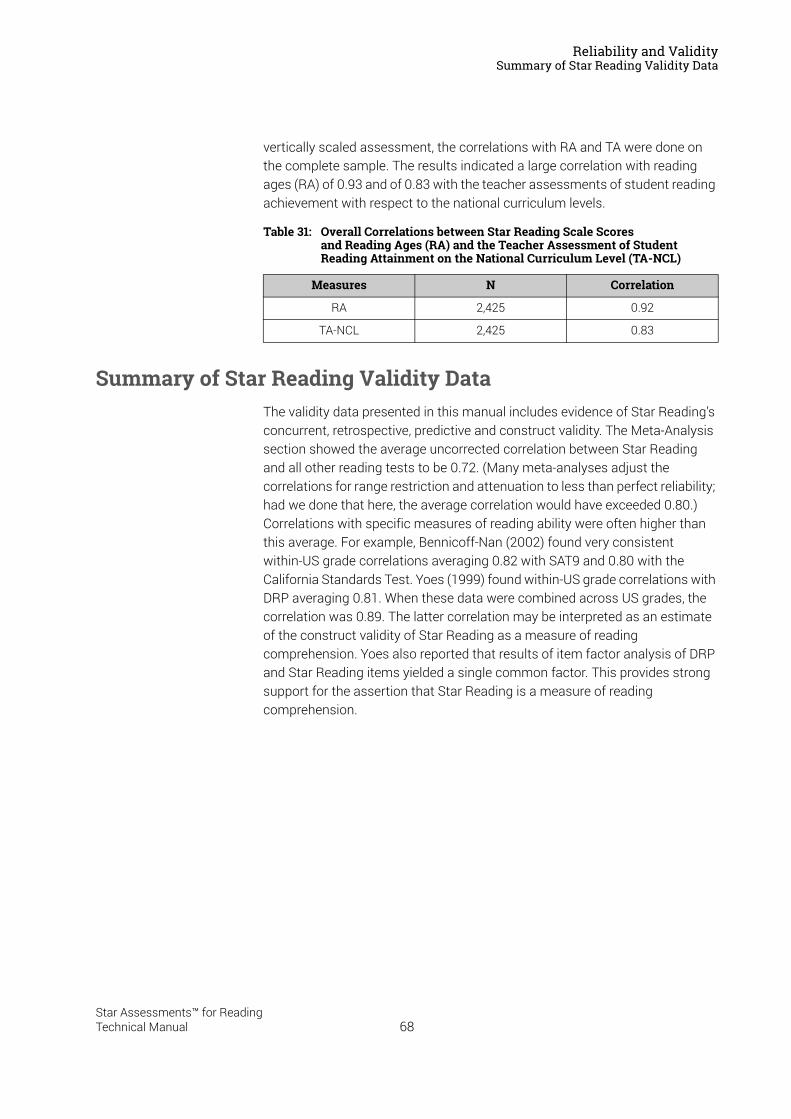
Reliability and ValiditySummary of Star Reading Validity Data
vertically scaled assessment, the correlations with RA and TA were done on the complete sample. The results indicated a large correlation with reading ages (RA) of 0.93 and of 0.83 with the teacher assessments of student reading achievement with respect to the national curriculum levels.
Summary of Star Reading Validity DataThe validity data presented in this manual includes evidence of Star Reading’s concurrent, retrospective, predictive and construct validity. The Meta-Analysis section showed the average uncorrected correlation between Star Reading and all other reading tests to be 0.72. (Many meta-analyses adjust the correlations for range restriction and attenuation to less than perfect reliability; had we done that here, the average correlation would have exceeded 0.80.) Correlations with specific measures of reading ability were often higher than this average. For example, Bennicoff-Nan (2002) found very consistent within-US grade correlations averaging 0.82 with SAT9 and 0.80 with the California Standards Test. Yoes (1999) found within-US grade correlations with DRP averaging 0.81. When these data were combined across US grades, the correlation was 0.89. The latter correlation may be interpreted as an estimate of the construct validity of Star Reading as a measure of reading comprehension. Yoes also reported that results of item factor analysis of DRP and Star Reading items yielded a single common factor. This provides strong support for the assertion that Star Reading is a measure of reading comprehension.
Table 31: Overall Correlations between Star Reading Scale Scores and Reading Ages (RA) and the Teacher Assessment of Student Reading Attainment on the National Curriculum Level (TA-NCL)
Measures N Correlation
RA 2,425 0.92
TA-NCL 2,425 0.83
68Star Assessments™ for ReadingTechnical Manual
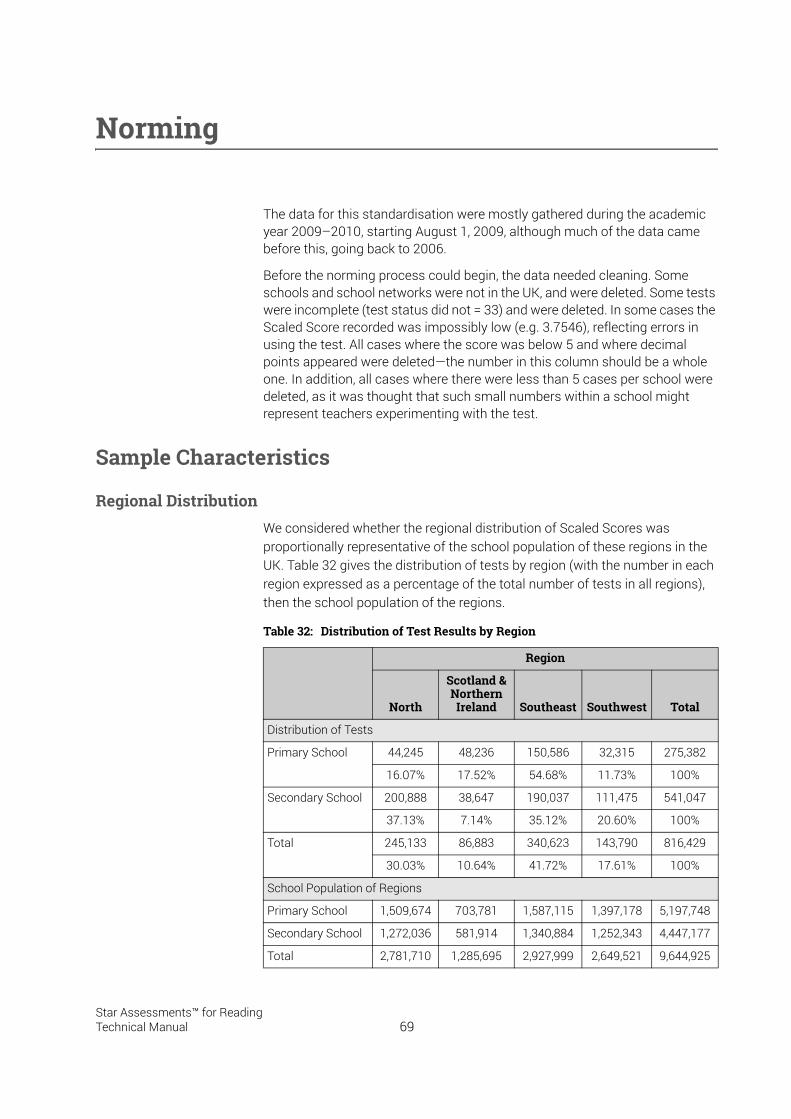
Norming
The data for this standardisation were mostly gathered during the academic year 2009–2010, starting August 1, 2009, although much of the data came before this, going back to 2006.
Before the norming process could begin, the data needed cleaning. Some schools and school networks were not in the UK, and were deleted. Some tests were incomplete (test status did not = 33) and were deleted. In some cases the Scaled Score recorded was impossibly low (e.g. 3.7546), reflecting errors in using the test. All cases where the score was below 5 and where decimal points appeared were deleted—the number in this column should be a whole one. In addition, all cases where there were less than 5 cases per school were deleted, as it was thought that such small numbers within a school might represent teachers experimenting with the test.
Sample Characteristics
Regional DistributionWe considered whether the regional distribution of Scaled Scores was proportionally representative of the school population of these regions in the UK. Table 32 gives the distribution of tests by region (with the number in each region expressed as a percentage of the total number of tests in all regions), then the school population of the regions.
Table 32: Distribution of Test Results by Region
Region
North
Scotland & Northern Ireland Southeast Southwest Total
Distribution of Tests
Primary School 44,245 48,236 150,586 32,315 275,382
16.07% 17.52% 54.68% 11.73% 100%
Secondary School 200,888 38,647 190,037 111,475 541,047
37.13% 7.14% 35.12% 20.60% 100%
Total 245,133 86,883 340,623 143,790 816,429
30.03% 10.64% 41.72% 17.61% 100%
School Population of Regions
Primary School 1,509,674 703,781 1,587,115 1,397,178 5,197,748
Secondary School 1,272,036 581,914 1,340,884 1,252,343 4,447,177
Total 2,781,710 1,285,695 2,927,999 2,649,521 9,644,925
69Star Assessments™ for ReadingTechnical Manual
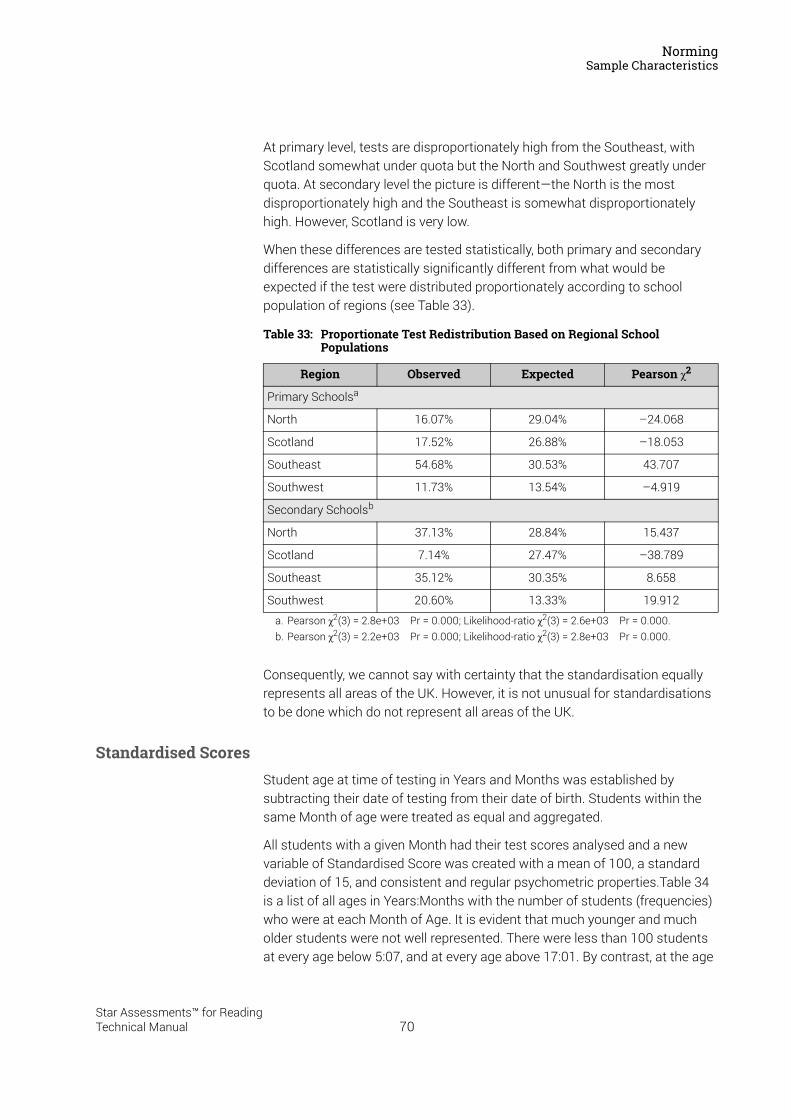
NormingSample Characteristics
At primary level, tests are disproportionately high from the Southeast, with Scotland somewhat under quota but the North and Southwest greatly under quota. At secondary level the picture is different—the North is the most disproportionately high and the Southeast is somewhat disproportionately high. However, Scotland is very low.
When these differences are tested statistically, both primary and secondary differences are statistically significantly different from what would be expected if the test were distributed proportionately according to school population of regions (see Table 33).
Consequently, we cannot say with certainty that the standardisation equally represents all areas of the UK. However, it is not unusual for standardisations to be done which do not represent all areas of the UK.
Standardised ScoresStudent age at time of testing in Years and Months was established by subtracting their date of testing from their date of birth. Students within the same Month of age were treated as equal and aggregated.
All students with a given Month had their test scores analysed and a new variable of Standardised Score was created with a mean of 100, a standard deviation of 15, and consistent and regular psychometric properties.Table 34 is a list of all ages in Years:Months with the number of students (frequencies) who were at each Month of Age. It is evident that much younger and much older students were not well represented. There were less than 100 students at every age below 5:07, and at every age above 17:01. By contrast, at the age
Table 33: Proportionate Test Redistribution Based on Regional School Populations
Region Observed Expected Pearson χ2
Primary Schoolsa
a. Pearson χ2(3) = 2.8e+03 Pr = 0.000; Likelihood-ratio χ2(3) = 2.6e+03 Pr = 0.000.
North 16.07% 29.04% –24.068
Scotland 17.52% 26.88% –18.053
Southeast 54.68% 30.53% 43.707
Southwest 11.73% 13.54% –4.919
Secondary Schoolsb
b. Pearson χ2(3) = 2.2e+03 Pr = 0.000; Likelihood-ratio χ2(3) = 2.8e+03 Pr = 0.000.
North 37.13% 28.84% 15.437
Scotland 7.14% 27.47% –38.789
Southeast 35.12% 30.35% 8.658
Southwest 20.60% 13.33% 19.912
70Star Assessments™ for ReadingTechnical Manual
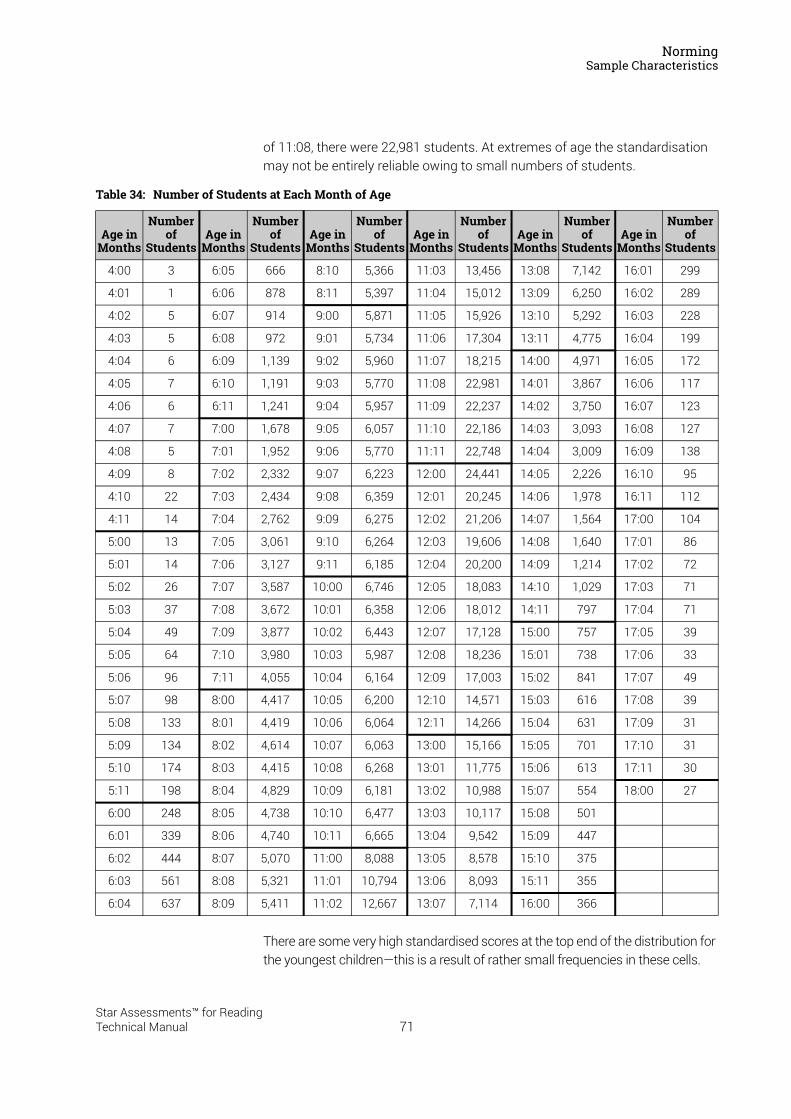
NormingSample Characteristics
of 11:08, there were 22,981 students. At extremes of age the standardisation may not be entirely reliable owing to small numbers of students.
There are some very high standardised scores at the top end of the distribution for the youngest children—this is a result of rather small frequencies in these cells.
Table 34: Number of Students at Each Month of Age
Age in Months
Number of
StudentsAge in
Months
Number of
StudentsAge in
Months
Number of
StudentsAge in
Months
Number of
StudentsAge in
Months
Number of
StudentsAge in
Months
Number of
Students
4:00 3 6:05 666 8:10 5,366 11:03 13,456 13:08 7,142 16:01 299
4:01 1 6:06 878 8:11 5,397 11:04 15,012 13:09 6,250 16:02 289
4:02 5 6:07 914 9:00 5,871 11:05 15,926 13:10 5,292 16:03 228
4:03 5 6:08 972 9:01 5,734 11:06 17,304 13:11 4,775 16:04 199
4:04 6 6:09 1,139 9:02 5,960 11:07 18,215 14:00 4,971 16:05 172
4:05 7 6:10 1,191 9:03 5,770 11:08 22,981 14:01 3,867 16:06 117
4:06 6 6:11 1,241 9:04 5,957 11:09 22,237 14:02 3,750 16:07 123
4:07 7 7:00 1,678 9:05 6,057 11:10 22,186 14:03 3,093 16:08 127
4:08 5 7:01 1,952 9:06 5,770 11:11 22,748 14:04 3,009 16:09 138
4:09 8 7:02 2,332 9:07 6,223 12:00 24,441 14:05 2,226 16:10 95
4:10 22 7:03 2,434 9:08 6,359 12:01 20,245 14:06 1,978 16:11 112
4:11 14 7:04 2,762 9:09 6,275 12:02 21,206 14:07 1,564 17:00 104
5:00 13 7:05 3,061 9:10 6,264 12:03 19,606 14:08 1,640 17:01 86
5:01 14 7:06 3,127 9:11 6,185 12:04 20,200 14:09 1,214 17:02 72
5:02 26 7:07 3,587 10:00 6,746 12:05 18,083 14:10 1,029 17:03 71
5:03 37 7:08 3,672 10:01 6,358 12:06 18,012 14:11 797 17:04 71
5:04 49 7:09 3,877 10:02 6,443 12:07 17,128 15:00 757 17:05 39
5:05 64 7:10 3,980 10:03 5,987 12:08 18,236 15:01 738 17:06 33
5:06 96 7:11 4,055 10:04 6,164 12:09 17,003 15:02 841 17:07 49
5:07 98 8:00 4,417 10:05 6,200 12:10 14,571 15:03 616 17:08 39
5:08 133 8:01 4,419 10:06 6,064 12:11 14,266 15:04 631 17:09 31
5:09 134 8:02 4,614 10:07 6,063 13:00 15,166 15:05 701 17:10 31
5:10 174 8:03 4,415 10:08 6,268 13:01 11,775 15:06 613 17:11 30
5:11 198 8:04 4,829 10:09 6,181 13:02 10,988 15:07 554 18:00 27
6:00 248 8:05 4,738 10:10 6,477 13:03 10,117 15:08 501
6:01 339 8:06 4,740 10:11 6,665 13:04 9,542 15:09 447
6:02 444 8:07 5,070 11:00 8,088 13:05 8,578 15:10 375
6:03 561 8:08 5,321 11:01 10,794 13:06 8,093 15:11 355
6:04 637 8:09 5,411 11:02 12,667 13:07 7,114 16:00 366
71Star Assessments™ for ReadingTechnical Manual
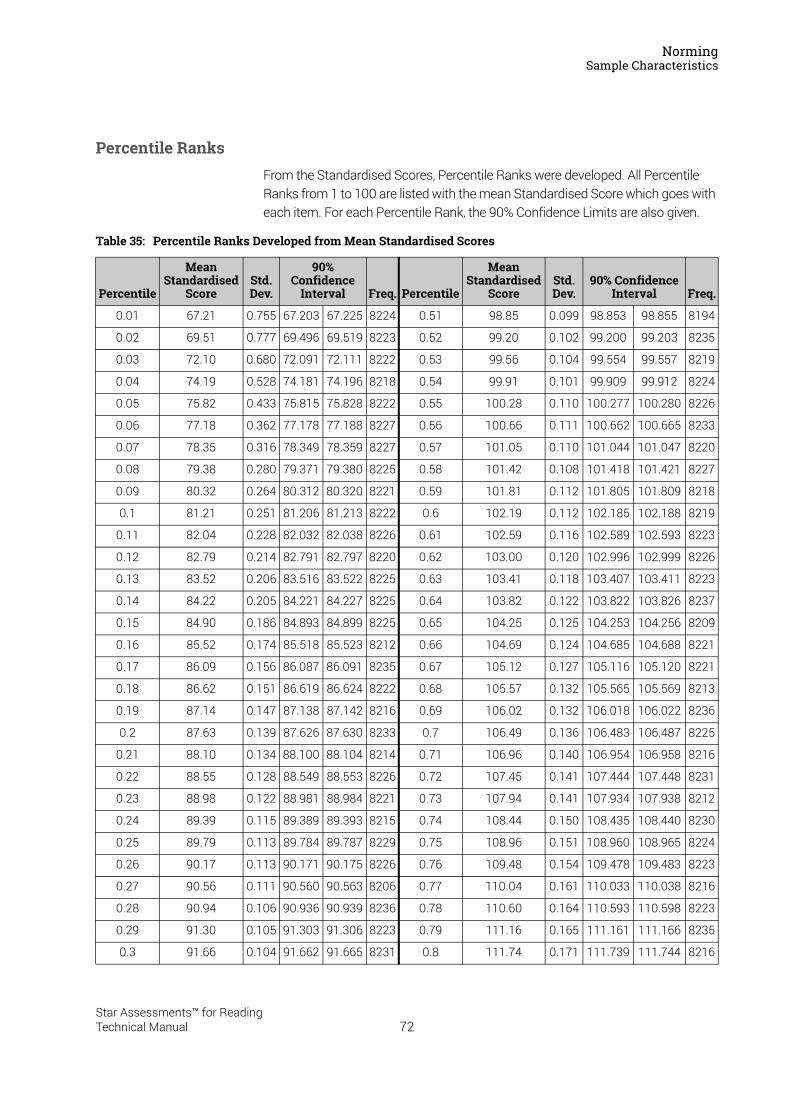
NormingSample Characteristics
Percentile RanksFrom the Standardised Scores, Percentile Ranks were developed. All Percentile Ranks from 1 to 100 are listed with the mean Standardised Score which goes with each item. For each Percentile Rank, the 90% Confidence Limits are also given.
Table 35: Percentile Ranks Developed from Mean Standardised Scores
Percentile
Mean Standardised
ScoreStd. Dev.
90% Confidence
Interval Freq. Percentile
Mean Standardised
ScoreStd. Dev.
90% Confidence Interval Freq.
0.01 67.21 0.755 67.203 67.225 8224 0.51 98.85 0.099 98.853 98.855 8194
0.02 69.51 0.777 69.496 69.519 8223 0.52 99.20 0.102 99.200 99.203 8235
0.03 72.10 0.680 72.091 72.111 8222 0.53 99.56 0.104 99.554 99.557 8219
0.04 74.19 0.528 74.181 74.196 8218 0.54 99.91 0.101 99.909 99.912 8224
0.05 75.82 0.433 75.815 75.828 8222 0.55 100.28 0.110 100.277 100.280 8226
0.06 77.18 0.362 77.178 77.188 8227 0.56 100.66 0.111 100.662 100.665 8233
0.07 78.35 0.316 78.349 78.359 8227 0.57 101.05 0.110 101.044 101.047 8220
0.08 79.38 0.280 79.371 79.380 8225 0.58 101.42 0.108 101.418 101.421 8227
0.09 80.32 0.264 80.312 80.320 8221 0.59 101.81 0.112 101.805 101.809 8218
0.1 81.21 0.251 81.206 81.213 8222 0.6 102.19 0.112 102.185 102.188 8219
0.11 82.04 0.228 82.032 82.038 8226 0.61 102.59 0.116 102.589 102.593 8223
0.12 82.79 0.214 82.791 82.797 8220 0.62 103.00 0.120 102.996 102.999 8226
0.13 83.52 0.206 83.516 83.522 8225 0.63 103.41 0.118 103.407 103.411 8223
0.14 84.22 0.205 84.221 84.227 8225 0.64 103.82 0.122 103.822 103.826 8237
0.15 84.90 0.186 84.893 84.899 8225 0.65 104.25 0.125 104.253 104.256 8209
0.16 85.52 0.174 85.518 85.523 8212 0.66 104.69 0.124 104.685 104.688 8221
0.17 86.09 0.156 86.087 86.091 8235 0.67 105.12 0.127 105.116 105.120 8221
0.18 86.62 0.151 86.619 86.624 8222 0.68 105.57 0.132 105.565 105.569 8213
0.19 87.14 0.147 87.138 87.142 8216 0.69 106.02 0.132 106.018 106.022 8236
0.2 87.63 0.139 87.626 87.630 8233 0.7 106.49 0.136 106.483 106.487 8225
0.21 88.10 0.134 88.100 88.104 8214 0.71 106.96 0.140 106.954 106.958 8216
0.22 88.55 0.128 88.549 88.553 8226 0.72 107.45 0.141 107.444 107.448 8231
0.23 88.98 0.122 88.981 88.984 8221 0.73 107.94 0.141 107.934 107.938 8212
0.24 89.39 0.115 89.389 89.393 8215 0.74 108.44 0.150 108.435 108.440 8230
0.25 89.79 0.113 89.784 89.787 8229 0.75 108.96 0.151 108.960 108.965 8224
0.26 90.17 0.113 90.171 90.175 8226 0.76 109.48 0.154 109.478 109.483 8223
0.27 90.56 0.111 90.560 90.563 8206 0.77 110.04 0.161 110.033 110.038 8216
0.28 90.94 0.106 90.936 90.939 8236 0.78 110.60 0.164 110.593 110.598 8223
0.29 91.30 0.105 91.303 91.306 8223 0.79 111.16 0.165 111.161 111.166 8235
0.3 91.66 0.104 91.662 91.665 8231 0.8 111.74 0.171 111.739 111.744 8216
72Star Assessments™ for ReadingTechnical Manual
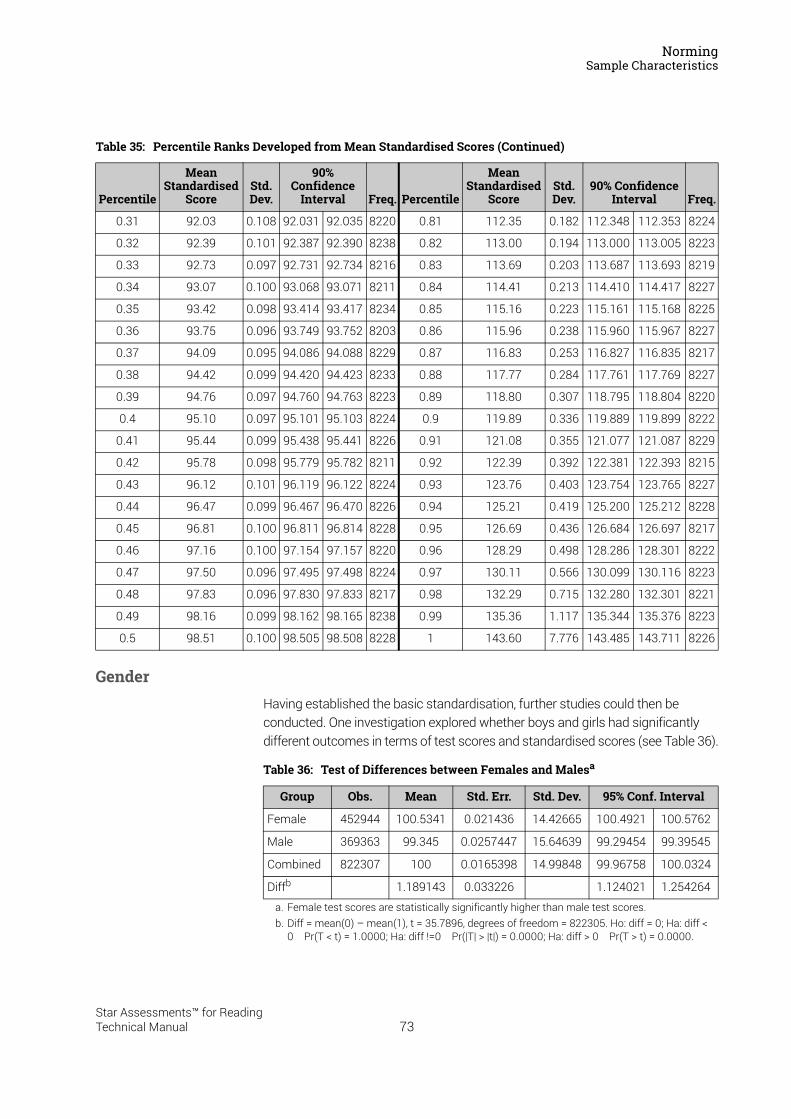
NormingSample Characteristics
GenderHaving established the basic standardisation, further studies could then be conducted. One investigation explored whether boys and girls had significantly different outcomes in terms of test scores and standardised scores (see Table 36).
0.31 92.03 0.108 92.031 92.035 8220 0.81 112.35 0.182 112.348 112.353 8224
0.32 92.39 0.101 92.387 92.390 8238 0.82 113.00 0.194 113.000 113.005 8223
0.33 92.73 0.097 92.731 92.734 8216 0.83 113.69 0.203 113.687 113.693 8219
0.34 93.07 0.100 93.068 93.071 8211 0.84 114.41 0.213 114.410 114.417 8227
0.35 93.42 0.098 93.414 93.417 8234 0.85 115.16 0.223 115.161 115.168 8225
0.36 93.75 0.096 93.749 93.752 8203 0.86 115.96 0.238 115.960 115.967 8227
0.37 94.09 0.095 94.086 94.088 8229 0.87 116.83 0.253 116.827 116.835 8217
0.38 94.42 0.099 94.420 94.423 8233 0.88 117.77 0.284 117.761 117.769 8227
0.39 94.76 0.097 94.760 94.763 8223 0.89 118.80 0.307 118.795 118.804 8220
0.4 95.10 0.097 95.101 95.103 8224 0.9 119.89 0.336 119.889 119.899 8222
0.41 95.44 0.099 95.438 95.441 8226 0.91 121.08 0.355 121.077 121.087 8229
0.42 95.78 0.098 95.779 95.782 8211 0.92 122.39 0.392 122.381 122.393 8215
0.43 96.12 0.101 96.119 96.122 8224 0.93 123.76 0.403 123.754 123.765 8227
0.44 96.47 0.099 96.467 96.470 8226 0.94 125.21 0.419 125.200 125.212 8228
0.45 96.81 0.100 96.811 96.814 8228 0.95 126.69 0.436 126.684 126.697 8217
0.46 97.16 0.100 97.154 97.157 8220 0.96 128.29 0.498 128.286 128.301 8222
0.47 97.50 0.096 97.495 97.498 8224 0.97 130.11 0.566 130.099 130.116 8223
0.48 97.83 0.096 97.830 97.833 8217 0.98 132.29 0.715 132.280 132.301 8221
0.49 98.16 0.099 98.162 98.165 8238 0.99 135.36 1.117 135.344 135.376 8223
0.5 98.51 0.100 98.505 98.508 8228 1 143.60 7.776 143.485 143.711 8226
Table 36: Test of Differences between Females and Malesa
a. Female test scores are statistically significantly higher than male test scores.
Group Obs. Mean Std. Err. Std. Dev. 95% Conf. Interval
Female 452944 100.5341 0.021436 14.42665 100.4921 100.5762
Male 369363 99.345 0.0257447 15.64639 99.29454 99.39545
Combined 822307 100 0.0165398 14.99848 99.96758 100.0324
Diffb
b. Diff = mean(0) – mean(1), t = 35.7896, degrees of freedom = 822305. Ho: diff = 0; Ha: diff < 0 Pr(T < t) = 1.0000; Ha: diff !=0 Pr(|T| > |t|) = 0.0000; Ha: diff > 0 Pr(T > t) = 0.0000.
1.189143 0.033226 1.124021 1.254264
Table 35: Percentile Ranks Developed from Mean Standardised Scores (Continued)
Percentile
Mean Standardised
ScoreStd. Dev.
90% Confidence
Interval Freq. Percentile
Mean Standardised
ScoreStd. Dev.
90% Confidence Interval Freq.
73Star Assessments™ for ReadingTechnical Manual
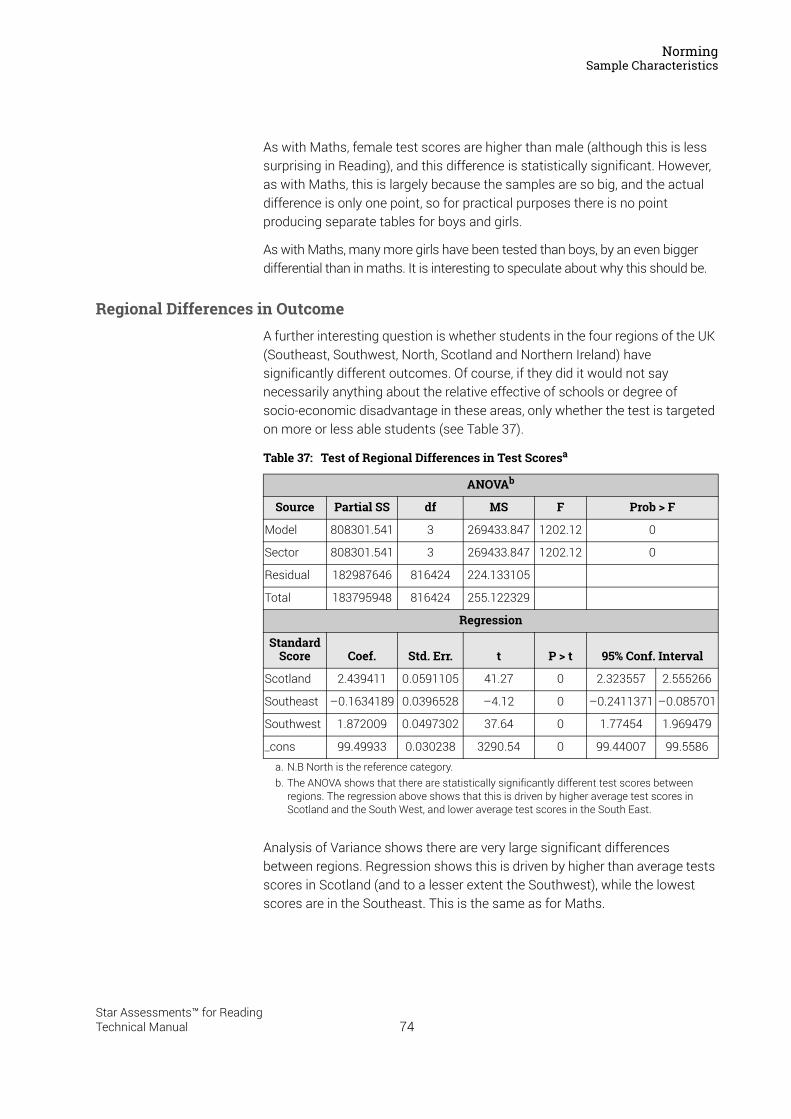
NormingSample Characteristics
As with Maths, female test scores are higher than male (although this is less surprising in Reading), and this difference is statistically significant. However, as with Maths, this is largely because the samples are so big, and the actual difference is only one point, so for practical purposes there is no point producing separate tables for boys and girls.
As with Maths, many more girls have been tested than boys, by an even bigger differential than in maths. It is interesting to speculate about why this should be.
Regional Differences in OutcomeA further interesting question is whether students in the four regions of the UK (Southeast, Southwest, North, Scotland and Northern Ireland) have significantly different outcomes. Of course, if they did it would not say necessarily anything about the relative effective of schools or degree of socio-economic disadvantage in these areas, only whether the test is targeted on more or less able students (see Table 37).
Analysis of Variance shows there are very large significant differences between regions. Regression shows this is driven by higher than average tests scores in Scotland (and to a lesser extent the Southwest), while the lowest scores are in the Southeast. This is the same as for Maths.
Table 37: Test of Regional Differences in Test Scoresa
a. N.B North is the reference category.
ANOVAb
b. The ANOVA shows that there are statistically significantly different test scores between regions. The regression above shows that this is driven by higher average test scores in Scotland and the South West, and lower average test scores in the South East.
Source Partial SS df MS F Prob > F
Model 808301.541 3 269433.847 1202.12 0
Sector 808301.541 3 269433.847 1202.12 0
Residual 182987646 816424 224.133105
Total 183795948 816424 255.122329
Regression
Standard Score Coef. Std. Err. t P > t 95% Conf. Interval
Scotland 2.439411 0.0591105 41.27 0 2.323557 2.555266
Southeast –0.1634189 0.0396528 –4.12 0 –0.2411371 –0.085701
Southwest 1.872009 0.0497302 37.64 0 1.77454 1.969479
_cons 99.49933 0.030238 3290.54 0 99.44007 99.5586
74Star Assessments™ for ReadingTechnical Manual
NormingOther Issues
Other IssuesExamining differences by socio-economic disadvantage of school or ethnic minority of student would have been of interest, but unfortunately data was not available on these factors.
ReferenceNational Foundation for Educational Research (2007). Renaissance Learning
Equating Study: Report. Slough: NFER.
75Star Assessments™ for ReadingTechnical Manual
Frequently Asked Questions
This chapter addresses a number of questions that educators have asked about Star Reading tests and score interpretations.
Does Star Reading Assess Comprehension, Vocabulary or Reading Achievement?Star Reading assesses reading comprehension and overall reading achievement. Through vocabulary-in-context test items, Star Reading requires students to rely on background information, apply vocabulary knowledge and use active strategies to construct meaning from the assessment text. These cognitive tasks are consistent with what researchers and practitioners describe as reading comprehension. Star Reading’s IRL score is a measure of reading comprehension. The Star Reading Scaled Score is a measure of reading achievement.
How Do Zone of Proximal Development (ZPD) Ranges Fit In?The Zone of Proximal Development8 defines the reading level range from which the student should be selecting books for reading practice in order to achieve optimal growth in literacy skills.
The ZPD is derived from a student’s demonstrated Grade Equivalent score. Renaissance Learning developed the ZPD ranges according to Vygotskian theory, based on an analysis of Accelerated Reader book reading data from 80,000 students in the 1996–1997 school year. More information is available in Research Foundation for Reading Renaissance Target Setting Practices (2003), which was published by Renaissance Learning. This information is also distributed by Renaissance Learning. Table 47 on page 102 contains the relationship between GE and ZPD.
How Can the Star Reading Test Determine a Child’s Reading Level in Less Than Twenty Minutes?
Short test times are possible because the Star Reading test is computer-adaptive. It adapts to test students at their level of proficiency. Because the Star Reading test can adapt and adjust to the student with virtually every question, it is more efficient than conventional pencil and paper tests and acquires more information about a student’s reading ability in less time. This means the Star Reading test can achieve measurement precision comparable to a conventional test that takes two or more times as long to administer.
8. Although the score is not displayed on UK reports, it is used in calculations behind the scenes.
76Star Assessments™ for ReadingTechnical Manual
Frequently Asked Questions
How Does the Star Reading Test Compare with Other Standardised/National Tests?Very well. The Star Reading test has a standard error and reliability that are very comparable to other standardised tests. Also, Star Reading test results correlate well with results from these other test instruments. Validity information reported here is drawn from the National Foundation for Educational Research (NFER) (2007). NFER reported that the correlations between the Suffolk Reading Scales and the Star Reading Test were 0.84 for SRS1A, 0.98 for SRS2A and 0.78 for SRS3A (the Suffolk Scale being in three separate sections, each suitable for a different age range). These are all satisfactorily high.
A further analysis of all the Suffolk items taken together (eliminating any duplicated items which could have appeared in more than one of the three separate Suffolk tests) indicated that the correlation between Suffolk and Star Reading was 0.91. This is a very high figure for a validity measure.
When performing the US norming of the Star Reading test, we gathered student performance data from several other commonly used reading tests. These data comprised more than 12,000 student test results from test instruments including CAT, ITBS, MAT, Stanford, TAAS, CTBS and others. We computed correlation coefficients between Star Reading 2.x results and results of each of these test instruments for which we had sufficient data. These correlation coefficients are included in “Reliability and Validity” (pages 41–54). Using IRT computer-adaptive technology, the Star Reading test achieves its results with fewer test items and shorter test times than other standardised tests.
What Are Some of the Other US Standardised Tests That Might Be Compared to the Star Reading Test?
CAT—California Achievement Test US Grades (K–12)
Designed to measure achievement in the basic skills commonly found in state and district (school network) curricula.
CTBS—Comprehensive Test of Basic Skills US Grades (K–12)
Modular testing system that evaluates students’ academic achievement from US grades K–12. It measures the basic content areas—reading, language, spelling, mathematics, study skills, science and social studies.
Gates–MacGinitie Reading Test US Grades (K–12)
Designed to assess student achievement in reading.
ITBS—Iowa Test of Basic Skills US Grades (K–9)
77Star Assessments™ for ReadingTechnical Manual
Frequently Asked Questions
Designed to provide for comprehensive and continuous measurement of growth in the fundamental skills, vocabulary, reading, the mechanics of writing, methods of study and mathematics.
MAT—Metropolitan Achievement Test US Grades (1–12)
Designed to measure the achievement of students in the major skill and content areas of the school curriculum.
Stanford Achievement Test US Grades (1–12)
Designed to measure the important learning outcomes of the school curriculum. Measures student achievement in reading, mathematics, language, spelling, study skills, science, social studies and listening.
TAKS—Texas Assessment of Knowledge and Skills US Grades (3–11)
Texas Education Agency mandated criterion-referenced test used to assess student and school system performance throughout the state. Includes tests in reading, maths, writing, science and social studies. Passage of a US grade 10 exit exam is required for graduation.
Why Do Some of My Students Who Took Star Reading Tests Have Scores That Are Widely Varying from the Results of Our Other US-Standardised Test Program?
The simple answer is that at least three factors work to make scores different on different tests: score scale differences, measurement error in both testing instruments and differences between their norms groups as well. Scale scores obtained on different tests—such as the Suffolk Reading Scale and Star Reading—are not comparable, so we should not expect students to get the same scale scores on both tests, any more than we would expect the same results when measuring weights using one scale calibrated in pounds and another calibrated in kilograms. If norm-referenced scores, such as GE scores or percentile ranks, are being compared, scores will certainly differ to some extent because of sampling differences between the two tests’ respective norms groups. Finally, even if the score scales were made comparable, or the norms groups were identical, measurement error in both tests would cause the scores to be different in most cases.
Although actual scores will differ because of the factors discussed above, the statistical correlation between scores on Star Reading and other standardised tests is generally high. That is, the higher students’ scores are on Star Reading, the higher their scores on another test tend to be. You will find that, on the whole, Star Reading results will agree very well with almost all of the other standardised reading test results.
All standardised test scores have measurement error. The Star Reading measurement error is comparable to most other standardised tests. When one compares the results from different tests taken at different times, it is not
78Star Assessments™ for ReadingTechnical Manual
Frequently Asked Questions
unusual to see differences in test scores ranging from 2–5 grade (year) levels. This is true when comparing results from other test instruments as well. Standardised tests provide approximate measurements. The Star Reading test is no different in this regard, but its adaptive nature makes its scores more reliable than conventional test scores near the minimum and maximum scores on a given form. A common shortcoming of conventional tests involves “floor” and “ceiling” effects at each test level. The Star Reading test is not subject to this shortcoming because of its adaptive branching and large item bank.
Other factors, such as student motivation and the testing environment, are also different for Star Reading and high-stakes tests.
Why Do We See a Significant Number of Our Students Performing at a Lower Level Now Than They Were Nine Weeks Ago?
This is a result of measurement error. As mentioned above, all psychometric instruments, including the Star Reading test, have some level of measurement error associated with them. Measurement error causes students’ scores to fluctuate around their “true scores”. About half of all observed scores are smaller than the students’ true scores; the result is that some students’ capabilities are underestimated to some extent.
If a group of students were to take a test twice on the same day, without repeating any items, about half of their scores would increase on the second test, while the other half would decline; the size of the individual score variations is an indicator of measurement error. Although measurement error affects all scores to some degree, the average scores on the two tests would be very similar to one another.
Scores on a second test taken after a longer time interval will tend to increase as a result of growth; however, if the amount of growth is small relative to the amount of measurement error, an appreciable percentage of students may show score declines, even though the majority of scores increase.
The degree of variation due to measurement error is expressed as the “standard error of measurement” (SEM). The “Reliability and Validity” chapter discusses standard error of measurement (see page 37).
How Many Items Will a Student Be Presented With When Taking a Star Reading Test?
The Star Reading UK RP tests administer the same number of items—25 vocabulary-in-context items—to all students.
How Many Items Does the Star Reading Test Have at Each Year?The Star Reading test has enough items at each year level that students can be tested ten times per year and should not be presented with the same
79Star Assessments™ for ReadingTechnical Manual
Frequently Asked Questions
material they have already been tested on in the same school year. Generally, the Star Reading software will not administer the same item twice to a student within a three-month period.
What Guidelines Are Offered as to Whether a Student Can Be Tested Using Star Reading Software?
In general the student should have a reading vocabulary of at least 100 words. In other words, the student should have at least beginning reading skills. Practically, if the student can work through the practice questions unassisted, that student should be able to be tested using Star Reading software. If the student has a lot of trouble getting through the practice, it is likely that he or she does not possess the basic skills necessary to be measured by Star Reading software.
How Will Students With a Fear of Taking Tests Do With Star Reading Tests?Students who have a fear of tests should be less disadvantaged by the Star Reading test than they are in the case of conventional tests. The Star Reading test purposely starts out at a level that most students will find to be very easy. This was done in order to give almost all students immediate success with the Star Reading test. Once the student has had an opportunity to gain some confidence with the relatively easy material, the Star Reading test moves into more challenging material in order to assess the level of reading proficiency.
In addition, most students find it fun to take Star Reading tests on the computer, which helps relieve some test anxiety.
Is There Any Way for a Teacher to See Exactly Which Items a Student Answered Correctly and Which He or She Answered Incorrectly?
No. This was done for two reasons. First, in computer-adaptive testing, the student’s performance on individual items is not as meaningful as the pattern of responses to the entire test. The student’s pattern of performance on all items taken together forms the basis of the scores Star Reading reports. Second, for purposes of test security, we decided to do everything possible to protect our items from compromise and overexposure.
What Evidence Do We Have That Star Reading Software Will Perform as Claimed?This evidence comes in two forms. First, we have demonstrated test-retest reliability estimates that are very good. Second, the correlation of Star Reading results with those of other standardised tests is also quite impressive. See “Reliability and Validity” on page 37 for reliability and validity data.
80Star Assessments™ for ReadingTechnical Manual
Frequently Asked Questions
Can or Should the Star Reading Test Replace a School’s Current National Tests?This is up to the school system to decide, although this is not what the Star Reading test was primarily designed to do. The primary purpose of the Star Reading test is to provide teachers with a tool to improve the teaching and learning match for each student. Every school system has to consider its needs in the area of reading assessment and make decisions as to what instruments will meet those needs. We are happy to provide as much information as we can to help schools make these decisions, but we cannot make the decision for them.
What Is Item Response Theory?Item Response Theory (IRT) is an approach to psychometric test design and analysis that uses mathematical models that describe what happens when an examinee is administered a particular test question. IRT models give the probability of answering an item correctly as a function of the item’s difficulty and the examinee’s ability. More information can be found in any text on modern test theory.
What Are the Cloze and Maze Procedures?These are terms for different kinds of fill-in-the-blank exercises that test a student’s ability to create meaning from contextual information, which have elements in common with the Star Reading test design.
81Star Assessments™ for ReadingTechnical Manual
Appendix A
Star Reading is a norm-referenced and criterion-referenced test. Star reports norm-referenced scores, including Percentile Ranks (PR) and Normed Referenced Standardised Scores (NRSS). The norm-referenced scores are based on score distributions of nationally representative samples of students who participated in the norming of Star Reading. The information in this chapter pertains to that norming study.
US NormingNational norms for Star Reading version 1 were collected in 1996. Substantial changes introduced in Star Reading version 2 necessitated the development of new norms in 1999. Those norms were used in subsequent versions, from version 2.1 through version 4.3, which was released in March 2008. The following is a description of the development of new norms for version 4.3, collected in April and May 2008.
The spring 2008 norming represents a change in the norms development procedure. Previous norms were developed by means of special-purpose norming studies, in which national samples of schools were cast, and those schools were solicited to participate in the norming by administering a special norming version of the assessment. The spring 2008 norming of Star Reading 4.3 is the first study in which national samples of students were drawn from routine administrations of Star Reading. Details of the procedures employed are given below.
Students participating in the norming study took assessments between April 15 and May 30, 2008. Students took the Star Reading tests under normal test administration conditions. No specific norming test was developed and no deviations were made from the usual test administration. Thus, students in the norming sample took Star Reading tests as they are administered in everyday use.
Sample CharacteristicsDuring the norming period, a total of 1,312,212 US students in grades 1–12 (Years 2–13) took Star Reading version 4.3 tests administered using Renaissance Place RT servers hosted by Renaissance Learning.
To obtain a representative sample of the student populations in US grades 1–12, a stratified random sample of the tested students was drawn, with proportional representation based on geographic region. Geographic region was based on the four broad areas identified by the National Educational
82Star Assessments™ for ReadingTechnical Manual
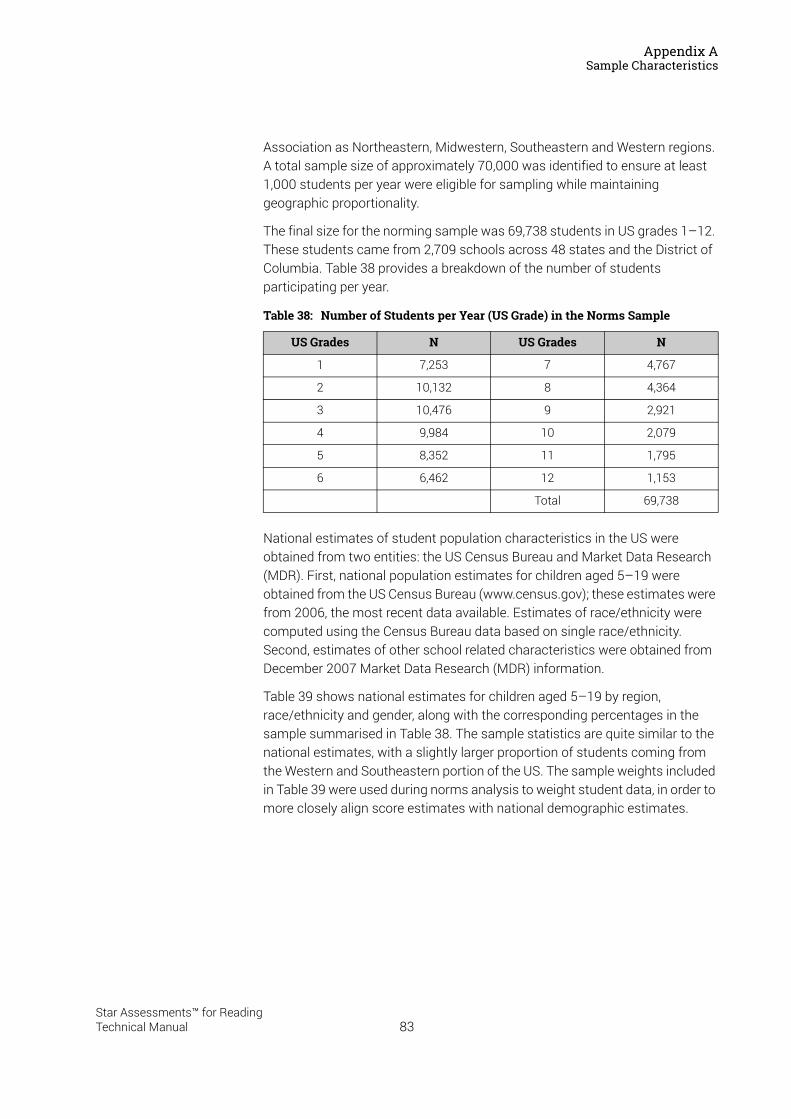
Appendix ASample Characteristics
Association as Northeastern, Midwestern, Southeastern and Western regions. A total sample size of approximately 70,000 was identified to ensure at least 1,000 students per year were eligible for sampling while maintaining geographic proportionality.
The final size for the norming sample was 69,738 students in US grades 1–12. These students came from 2,709 schools across 48 states and the District of Columbia. Table 38 provides a breakdown of the number of students participating per year.
National estimates of student population characteristics in the US were obtained from two entities: the US Census Bureau and Market Data Research (MDR). First, national population estimates for children aged 5–19 were obtained from the US Census Bureau (www.census.gov); these estimates were from 2006, the most recent data available. Estimates of race/ethnicity were computed using the Census Bureau data based on single race/ethnicity. Second, estimates of other school related characteristics were obtained from December 2007 Market Data Research (MDR) information.
Table 39 shows national estimates for children aged 5–19 by region, race/ethnicity and gender, along with the corresponding percentages in the sample summarised in Table 38. The sample statistics are quite similar to the national estimates, with a slightly larger proportion of students coming from the Western and Southeastern portion of the US. The sample weights included in Table 39 were used during norms analysis to weight student data, in order to more closely align score estimates with national demographic estimates.
Table 38: Number of Students per Year (US Grade) in the Norms Sample
US Grades N US Grades N
1 7,253 7 4,767
2 10,132 8 4,364
3 10,476 9 2,921
4 9,984 10 2,079
5 8,352 11 1,795
6 6,462 12 1,153
Total 69,738
83Star Assessments™ for ReadingTechnical Manual
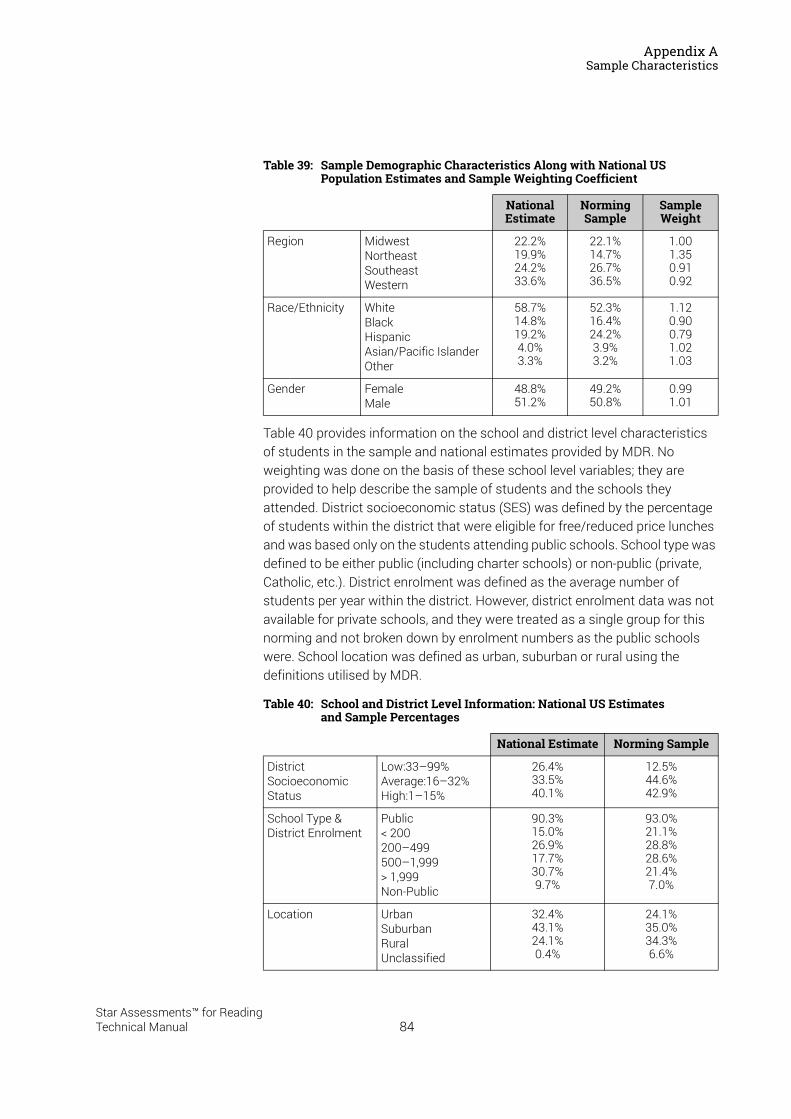
Appendix ASample Characteristics
Table 40 provides information on the school and district level characteristics of students in the sample and national estimates provided by MDR. No weighting was done on the basis of these school level variables; they are provided to help describe the sample of students and the schools they attended. District socioeconomic status (SES) was defined by the percentage of students within the district that were eligible for free/reduced price lunches and was based only on the students attending public schools. School type was defined to be either public (including charter schools) or non-public (private, Catholic, etc.). District enrolment was defined as the average number of students per year within the district. However, district enrolment data was not available for private schools, and they were treated as a single group for this norming and not broken down by enrolment numbers as the public schools were. School location was defined as urban, suburban or rural using the definitions utilised by MDR.
Table 39: Sample Demographic Characteristics Along with National US Population Estimates and Sample Weighting Coefficient
National Estimate
Norming Sample
Sample Weight
Region MidwestNortheastSoutheastWestern
22.2%19.9%24.2%33.6%
22.1%14.7%26.7%36.5%
1.001.350.910.92
Race/Ethnicity WhiteBlackHispanicAsian/Pacific IslanderOther
58.7%14.8%19.2%4.0%3.3%
52.3%16.4%24.2%3.9%3.2%
1.120.900.791.021.03
Gender FemaleMale
48.8%51.2%
49.2%50.8%
0.991.01
Table 40: School and District Level Information: National US Estimates and Sample Percentages
National Estimate Norming Sample
District Socioeconomic Status
Low:33–99%Average:16–32%High:1–15%
26.4%33.5%40.1%
12.5%44.6%42.9%
School Type & District Enrolment
Public< 200200–499500–1,999> 1,999Non-Public
90.3%15.0%26.9%17.7%30.7%9.7%
93.0%21.1%28.8%28.6%21.4%7.0%
Location UrbanSuburbanRuralUnclassified
32.4%43.1%24.1%0.4%
24.1%35.0%34.3%6.6%
84Star Assessments™ for ReadingTechnical Manual
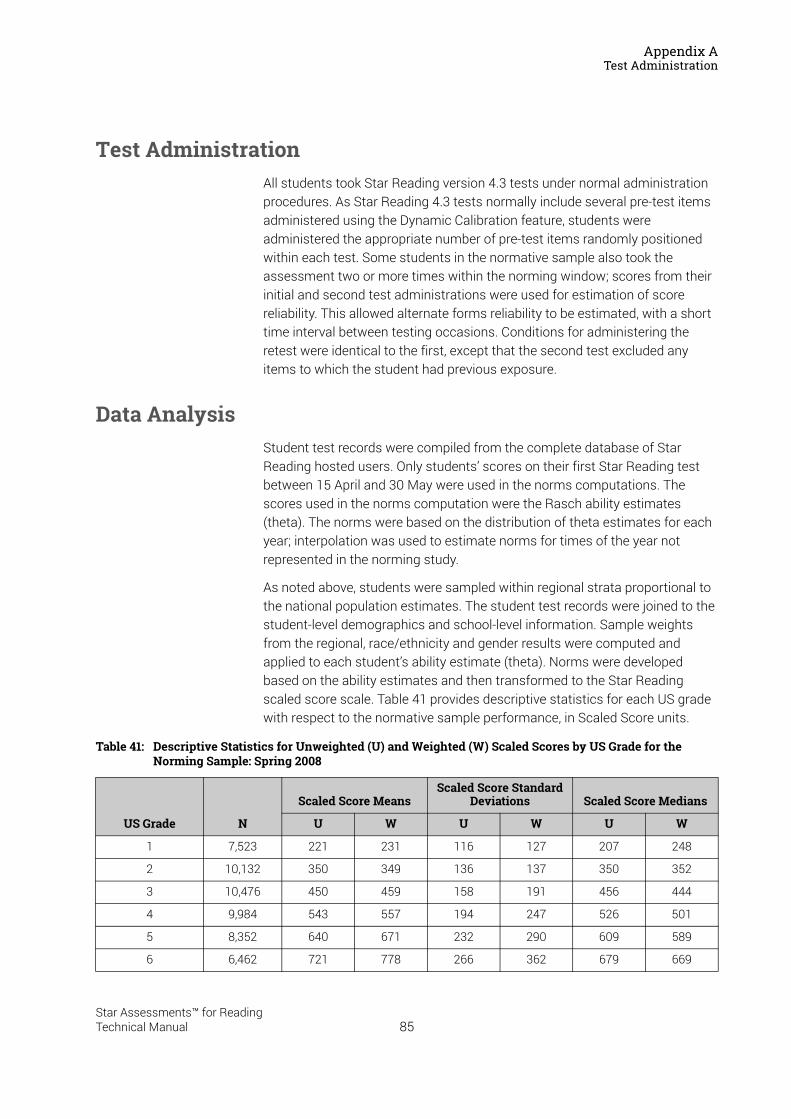
Appendix ATest Administration
Test AdministrationAll students took Star Reading version 4.3 tests under normal administration procedures. As Star Reading 4.3 tests normally include several pre-test items administered using the Dynamic Calibration feature, students were administered the appropriate number of pre-test items randomly positioned within each test. Some students in the normative sample also took the assessment two or more times within the norming window; scores from their initial and second test administrations were used for estimation of score reliability. This allowed alternate forms reliability to be estimated, with a short time interval between testing occasions. Conditions for administering the retest were identical to the first, except that the second test excluded any items to which the student had previous exposure.
Data AnalysisStudent test records were compiled from the complete database of Star Reading hosted users. Only students’ scores on their first Star Reading test between 15 April and 30 May were used in the norms computations. The scores used in the norms computation were the Rasch ability estimates (theta). The norms were based on the distribution of theta estimates for each year; interpolation was used to estimate norms for times of the year not represented in the norming study.
As noted above, students were sampled within regional strata proportional to the national population estimates. The student test records were joined to the student-level demographics and school-level information. Sample weights from the regional, race/ethnicity and gender results were computed and applied to each student’s ability estimate (theta). Norms were developed based on the ability estimates and then transformed to the Star Reading scaled score scale. Table 41 provides descriptive statistics for each US grade with respect to the normative sample performance, in Scaled Score units.
Table 41: Descriptive Statistics for Unweighted (U) and Weighted (W) Scaled Scores by US Grade for the Norming Sample: Spring 2008
US Grade N
Scaled Score MeansScaled Score Standard
Deviations Scaled Score Medians
U W U W U W
1 7,523 221 231 116 127 207 248
2 10,132 350 349 136 137 350 352
3 10,476 450 459 158 191 456 444
4 9,984 543 557 194 247 526 501
5 8,352 640 671 232 290 609 589
6 6,462 721 778 266 362 679 669
85Star Assessments™ for ReadingTechnical Manual
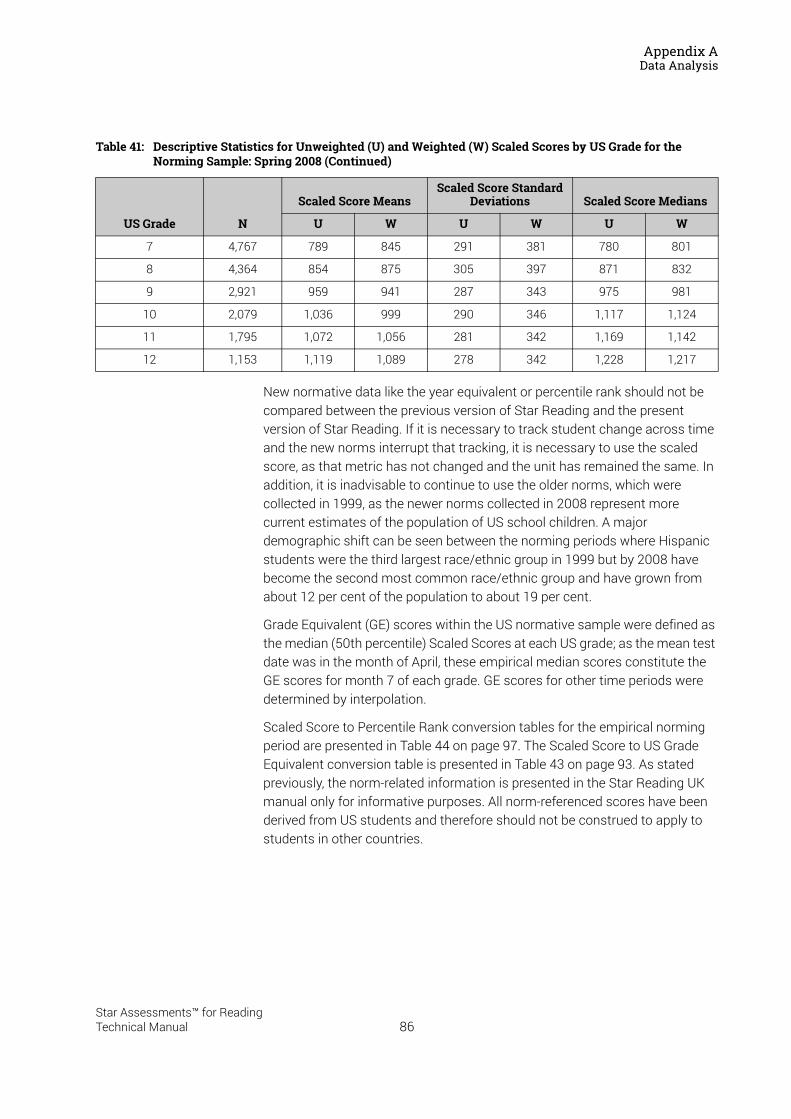
Appendix AData Analysis
New normative data like the year equivalent or percentile rank should not be compared between the previous version of Star Reading and the present version of Star Reading. If it is necessary to track student change across time and the new norms interrupt that tracking, it is necessary to use the scaled score, as that metric has not changed and the unit has remained the same. In addition, it is inadvisable to continue to use the older norms, which were collected in 1999, as the newer norms collected in 2008 represent more current estimates of the population of US school children. A major demographic shift can be seen between the norming periods where Hispanic students were the third largest race/ethnic group in 1999 but by 2008 have become the second most common race/ethnic group and have grown from about 12 per cent of the population to about 19 per cent.
Grade Equivalent (GE) scores within the US normative sample were defined as the median (50th percentile) Scaled Scores at each US grade; as the mean test date was in the month of April, these empirical median scores constitute the GE scores for month 7 of each grade. GE scores for other time periods were determined by interpolation.
Scaled Score to Percentile Rank conversion tables for the empirical norming period are presented in Table 44 on page 97. The Scaled Score to US Grade Equivalent conversion table is presented in Table 43 on page 93. As stated previously, the norm-related information is presented in the Star Reading UK manual only for informative purposes. All norm-referenced scores have been derived from US students and therefore should not be construed to apply to students in other countries.
7 4,767 789 845 291 381 780 801
8 4,364 854 875 305 397 871 832
9 2,921 959 941 287 343 975 981
10 2,079 1,036 999 290 346 1,117 1,124
11 1,795 1,072 1,056 281 342 1,169 1,142
12 1,153 1,119 1,089 278 342 1,228 1,217
Table 41: Descriptive Statistics for Unweighted (U) and Weighted (W) Scaled Scores by US Grade for the Norming Sample: Spring 2008 (Continued)
US Grade N
Scaled Score MeansScaled Score Standard
Deviations Scaled Score Medians
U W U W U W
86Star Assessments™ for ReadingTechnical Manual
Appendix AUS Norm-Referenced Score Definitions
US Norm-Referenced Score Definitions
Types of Test ScoresStar Reading US software provides three broad types of scores: Scaled Scores, Criterion-Referenced Scores and Norm-Referenced Scores. Scaled Scores and Criterion-Referenced Scores are described under “Score Definitions” in the main body of this manual. Norm-referenced scores are described in this appendix section.
US Norm-Referenced scores compare a student’s test results to the results of other US students who have taken the same test. In this case, scores provide a relative measure of student achievement compared to the performance of a group of US students at a given time. Percentile Ranks and Grade Equivalents are the two primary norm-referenced scores provided by Star Reading software. Both of these scores are based on a comparison of a student’s test results to the data collected during the 1999 US norming study.
Grade Equivalent (GE)A Grade Equivalent (GE) indicates the year placement of students for whom a particular score is typical. If a student receives a GE of 10.7, this means that the student scored as well on Star Reading as did the typical student in the seventh month of US grade 10. It does not necessarily mean that the student can read independently at a tenth-grade level, only that he or she obtained a Scaled Score as high as the average tenth-grade, seventh-month student in the norms group.
GE scores are often misinterpreted as though they convey information about what a student knows or can do—that is, as if they were criterion-referenced scores. To the contrary, GE scores are norm-referenced; a student’s GE score indicates the US grade and school month at which the median student would be expected to achieve the same scale score the student achieved.
Star Reading Grade Equivalents range from 0.0–12.9+. The scale divides the academic year into 10 monthly increments, and is expressed as a decimal with the unit denoting the US grade level and the individual “months” in tenths. Table 42 indicates how the GE scale corresponds to the various calendar months. For example, if a student obtained a GE of 4.6 on a Star Reading assessment, this would suggest that the student was performing similarly to the average student in the fourth grade at the sixth month (March) of the academic year. Because the Star Reading 4.x norming took place during the end of the seventh month (September) and the entire eighth month of the school year (May), the GEs ending in .8 are empirically based, and based on the observed data from the normative sample. All other monthly GE scores are derived through interpolation by fitting a curve to the grade-by-grade medians. Table 43 on page 93 contains the Scaled Score to GE conversions.
87Star Assessments™ for ReadingTechnical Manual
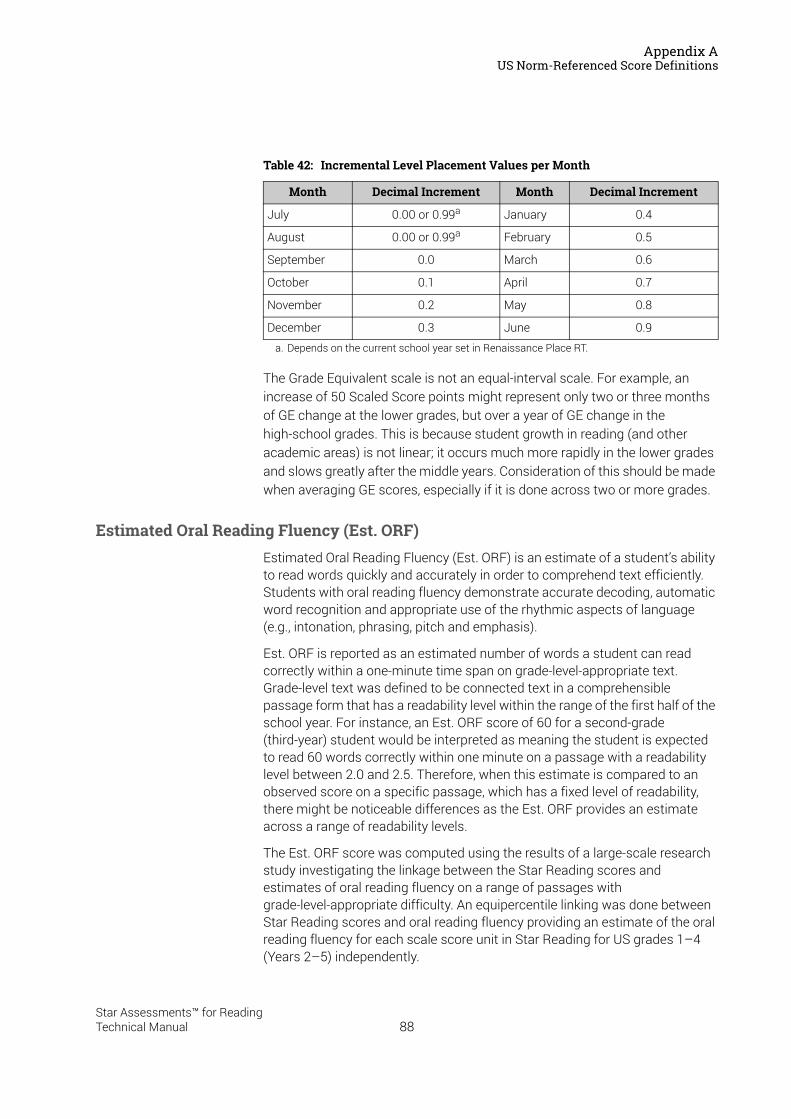
Appendix AUS Norm-Referenced Score Definitions
The Grade Equivalent scale is not an equal-interval scale. For example, an increase of 50 Scaled Score points might represent only two or three months of GE change at the lower grades, but over a year of GE change in the high-school grades. This is because student growth in reading (and other academic areas) is not linear; it occurs much more rapidly in the lower grades and slows greatly after the middle years. Consideration of this should be made when averaging GE scores, especially if it is done across two or more grades.
Estimated Oral Reading Fluency (Est. ORF)Estimated Oral Reading Fluency (Est. ORF) is an estimate of a student’s ability to read words quickly and accurately in order to comprehend text efficiently. Students with oral reading fluency demonstrate accurate decoding, automatic word recognition and appropriate use of the rhythmic aspects of language (e.g., intonation, phrasing, pitch and emphasis).
Est. ORF is reported as an estimated number of words a student can read correctly within a one-minute time span on grade-level-appropriate text. Grade-level text was defined to be connected text in a comprehensible passage form that has a readability level within the range of the first half of the school year. For instance, an Est. ORF score of 60 for a second-grade (third-year) student would be interpreted as meaning the student is expected to read 60 words correctly within one minute on a passage with a readability level between 2.0 and 2.5. Therefore, when this estimate is compared to an observed score on a specific passage, which has a fixed level of readability, there might be noticeable differences as the Est. ORF provides an estimate across a range of readability levels.
The Est. ORF score was computed using the results of a large-scale research study investigating the linkage between the Star Reading scores and estimates of oral reading fluency on a range of passages with grade-level-appropriate difficulty. An equipercentile linking was done between Star Reading scores and oral reading fluency providing an estimate of the oral reading fluency for each scale score unit in Star Reading for US grades 1–4 (Years 2–5) independently.
Table 42: Incremental Level Placement Values per Month
Month Decimal Increment Month Decimal Increment
July 0.00 or 0.99a
a. Depends on the current school year set in Renaissance Place RT.
January 0.4
August 0.00 or 0.99a February 0.5
September 0.0 March 0.6
October 0.1 April 0.7
November 0.2 May 0.8
December 0.3 June 0.9
88Star Assessments™ for ReadingTechnical Manual
Appendix AUS Norm-Referenced Score Definitions
Comparing the Star Reading Test with Classical TestsBecause the Star Reading test adapts to the reading level of the student being tested, Star Reading GE scores are more consistently accurate across the achievement spectrum than those provided by classical test instruments. Grade Equivalent scores obtained using classical (non-adaptive) test instruments are less accurate when a student’s year placement and GE score differ markedly. It is not uncommon for a fourth-grade (fifth-year) student to obtain a GE score of 8.9 when using a classical test instrument. However, this does not necessarily mean that the student is performing at a level typical of an end-of-year eighth-grader; more likely, it means that the student answered all, or nearly all, of the items correctly and thus performed beyond the range of the fourth-grade test.
Star Reading Grade Equivalent scores are more consistently accurate—even as a student’s achievement level deviates from the level of year placement. A student may be tested on any level of material, depending upon the student’s actual performance on the test; students are tested on items of an appropriate level of difficulty, based on their individual level of achievement. Thus, a GE score of 7.6 indicates that the student’s performance can be appropriately compared to that of a typical seventh grader in the sixth month of the school year.
Understanding IRL and GE scoresThe US version of Star Reading software provides both criterion-referenced and norm-referenced scores. As such, it provides more than one frame of reference for describing a student’s current reading performance. The two frames of reference differ significantly, however, so it is important to understand the two estimates and their development when making interpretations of Star Reading results.
The Instructional Reading Level (IRL) is a criterion-referenced score. It provides an estimate of the year of written material with which the student can most effectively be taught. While the IRL, like any test result, is simply an estimate, it provides a useful indication of the level of material on which the student should be receiving instruction. For example, if a student (regardless of current year placement) receives a Star Reading IRL of 4.0, this indicates that the student can most likely learn without experiencing too many difficulties when using materials written to be on a fourth-grade level.
The IRL is estimated based on the student’s pattern of responses to the Star Reading items. A given student’s IRL is the highest year of items at which it is estimated that the student can correctly answer at least 80% of the items.
In effect, the IRL references each student’s Star Reading performance to the difficulty of written material appropriate for instruction. This is a valuable piece of information in planning the instructional program for individuals or groups of students.
89Star Assessments™ for ReadingTechnical Manual
Appendix AUS Norm-Referenced Score Definitions
The Grade Equivalent (GE) is a norm-referenced score. It provides a comparison of a student’s performance with that of other students around the nation. If a student receives a GE of 4.0, this means that the student scored as well on the Star Reading test as did the typical student at the beginning of Grade 4 (Year 5). It does not mean that the student can read books that are written at a fourth-grade level—only that he or she reads as well as fourth-grade students in the norms group.
In general, IRLs and GEs will differ. These differences are caused by the fact that the two score metrics are designed to provide different information. That is, IRLs estimate the level of text that a student can read with some instructional assistance; GEs express a student’s performance in terms of the grade level for which that performance is typical. Usually, a student’s GE score will be higher than the IRL.
The score to be used depends on the information desired. If a teacher or educator wishes to know how a student’s Star Reading score compares with that of other students across the nation, either the GE or the Percentile Rank should be used. If the teacher or educator wants to know what level of instructional materials a student should be using for ongoing class schooling, the IRL is the preferred score. Again, both scores are estimates of a student’s current level of reading achievement. They simply provide two ways of interpreting this performance—relative to a national sample of students (GE) or relative to the level of written material the student can read successfully (IRL).
Percentile Rank (PR)Percentile Rank is a norm-referenced score that indicates the percentage of students in the same year and at the same point of time in the school year who obtained scores lower than the score of a particular student. In other words, Percentile Ranks show how an individual student’s performance compares to that of the student’s same-year peers on the national level. For example, a Percentile Rank of 85 means that the student is performing at a level that exceeds 85% of other students in that year at the same time of the year. Percentile Ranks simply indicate how a student performed compared to the others who took Star Reading tests as a part of the national norming program. The range of Percentile Ranks is 1–99.
The Percentile Rank scale is not an equal-interval scale. For example, for a student with a US grade placement of 7.7, a Scaled Score of 1,119 corresponds to a PR of 80, and a Scaled Score of 1,222 corresponds to a PR of 90. Thus, a difference of 103 Scaled Score points represents a 10-point difference in PR. However, for the same student, a Scaled Score of 843 corresponds to a PR of 50, and a Scaled Score of 917 corresponds to a PR of 60. While there is now only a 74-point difference in Scaled Scores, there is still a 10-point difference in PR. For this reason, PR scores should not be averaged
90Star Assessments™ for ReadingTechnical Manual
Appendix AUS Norm-Referenced Conversion Tables
or otherwise algebraically manipulated. NCE scores are much more appropriate for these activities.
Table 44 on page 97 contains an abridged version of the Scaled Score to Percentile Rank conversion table that the Star Reading software uses. The actual table includes data for all of the monthly US grade placement values from 1.0–12.9. Because Star Reading norming occurred in the seventh month of the school year (May), the values for each year are empirically based. The remaining monthly values were estimated by interpolating between the empirical points. The table also includes a column representing students who are just about to graduate from high school.
Normal Curve Equivalent (NCE)Normal Curve Equivalents (NCEs) are scores that have been scaled in such a way that they have a normal distribution, with a mean of 50 and a standard deviation of 21.06 in the normative sample for a given test. Because they range from 1–99, they appear similar to Percentile Ranks, but they have the advantage of being based on an equal interval scale. That is, the difference between two successive scores on the scale has the same meaning throughout the scale. NCEs are useful for purposes of statistically manipulating norm-referenced test results, such as interpolating test scores, calculating averages and computing correlation coefficients between different tests. For example, in Star Reading score reports, average Percentile Ranks are obtained by first converting the PR values to NCE values, averaging the NCE values and then converting the average NCE back to a PR.
Table 45 on page 100 provides the NCEs corresponding to integer PR values and facilitates the conversion of PRs to NCEs. Table 46 on page 100 provides the conversions from NCE to PR. The NCE values are given as a range of scores that convert to the corresponding PR value.
US Norm-Referenced Conversion TablesConversion tables used in the US version of Star Reading are reproduced below. These have no counterparts in the UK version. They are reproduced here solely as technical reference material. The tables include the following:
Table 43, “Scaled Score to Grade Equivalent Conversions,” on page 93
This table indicates the US GE (Grade Equivalent) scores corresponding to all values of Scaled Scores. US school grades differ from UK school years by 1; to convert a GE score to a UK school year, add 1 to the GE score.
Table 44, “Scaled Score to Percentile Rank Conversions,” on page 97
This table lists the minimum Scaled Scores corresponding to Percentile Ranks 1–99 in the US norming sample, for each of US grades 1–12. US
91Star Assessments™ for ReadingTechnical Manual
Appendix AUS Norm-Referenced Conversion Tables
school grades differ from UK school years by 1; to look up a percentile score, UK users should add 1 to the GE score to determine the equivalent UK school year. Users should also note that these are the empirical norms, and apply only at the 7th month of the US school year. Percentile Ranks for all other months are determined by interpolation within this table.
Table 45, “Percentile Rank to Normal Curve Equivalent Conversions,” on page 100
In the US, program evaluation studies often use NCE (Normal Curve Equivalent) scores in preference to Percentile Rank scores, because the NCE scale is preferred for statistical analysis purposes. This table lists the NCE scores equivalent to each Percentile Rank 1–99. This table is based on the non-linear translation of Percentile Ranks to NCE scores.
Table 46, “Normal Curve Equivalent to Percentile Rank Conversion,” on page 100
This table is the inverse of the percentile-to-NCE transformation documented in Table 45.
Table 47, “US Grade Equivalent to ZPD Conversions,” on page 102
This table lists the ZPD (Zone of Proximal Development) ranges corresponding to each possible GE score.
Table 48: Scaled Score to Instructional Reading Level Conversions
This table lists the IRL scores (Instructional Reading Levels) corresponding to each possible Scaled Score. IRLs are expressed as US school grades; to find the equivalent UK school year, add 1 to each IRL score in this table.
Table 46: Estimated Oral Reading Fluency (Est. ORF) Given in Words Correct per Minute (WCPM) by Grade for Selected Star Reading Scale Score Units (SR SS)
Research in the US has found a strong correlation between Star Reading scale scores, which measure reading comprehension, and measures of students’ oral reading fluency, which is often used as a proxy for reading comprehension. This table lists oral reading fluency measures, expressed as words read aloud correctly per minute from grade-appropriate text, corresponding to Star Reading scale scores, for each of US grades 1–4. (US grades differ from UK years by 1; to convert a US grade in this table to a UK year, add 1 to the US grade.)
92Star Assessments™ for ReadingTechnical Manual
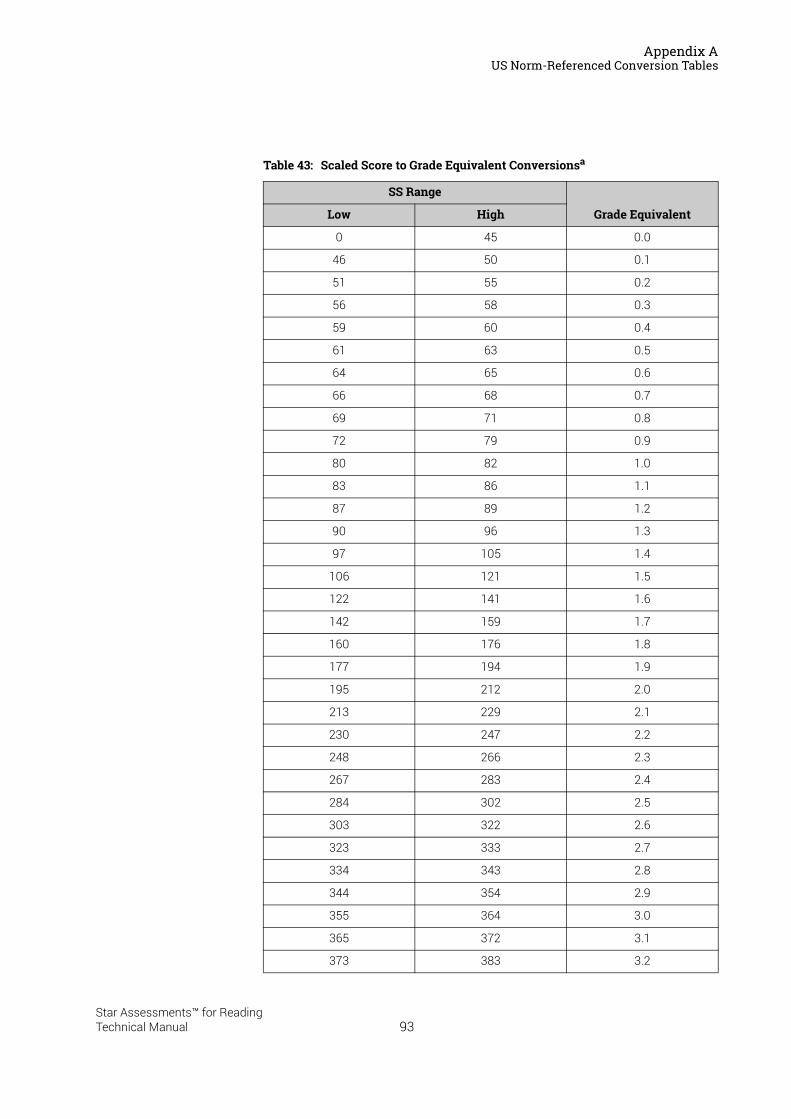
Appendix AUS Norm-Referenced Conversion Tables
Table 43: Scaled Score to Grade Equivalent Conversionsa
SS Range
Grade EquivalentLow High
0 45 0.0
46 50 0.1
51 55 0.2
56 58 0.3
59 60 0.4
61 63 0.5
64 65 0.6
66 68 0.7
69 71 0.8
72 79 0.9
80 82 1.0
83 86 1.1
87 89 1.2
90 96 1.3
97 105 1.4
106 121 1.5
122 141 1.6
142 159 1.7
160 176 1.8
177 194 1.9
195 212 2.0
213 229 2.1
230 247 2.2
248 266 2.3
267 283 2.4
284 302 2.5
303 322 2.6
323 333 2.7
334 343 2.8
344 354 2.9
355 364 3.0
365 372 3.1
373 383 3.2
93Star Assessments™ for ReadingTechnical Manual

Appendix AUS Norm-Referenced Conversion Tables
384 395 3.3
396 407 3.4
408 421 3.5
422 434 3.6
435 442 3.7
443 449 3.8
450 455 3.9
456 461 4.0
462 466 4.1
467 473 4.2
474 481 4.3
482 490 4.4
491 497 4.5
498 505 4.6
506 514 4.7
515 522 4.8
523 531 4.9
532 542 5.0
543 553 5.1
554 560 5.2
561 569 5.3
570 579 5.4
580 588 5.5
589 600 5.6
601 612 5.7
613 624 5.8
625 637 5.9
638 650 6.0
651 664 6.1
665 678 6.2
679 693 6.3
694 710 6.4
711 726 6.5
727 748 6.6
Table 43: Scaled Score to Grade Equivalent Conversionsa (Continued)
SS Range
Grade EquivalentLow High
94Star Assessments™ for ReadingTechnical Manual
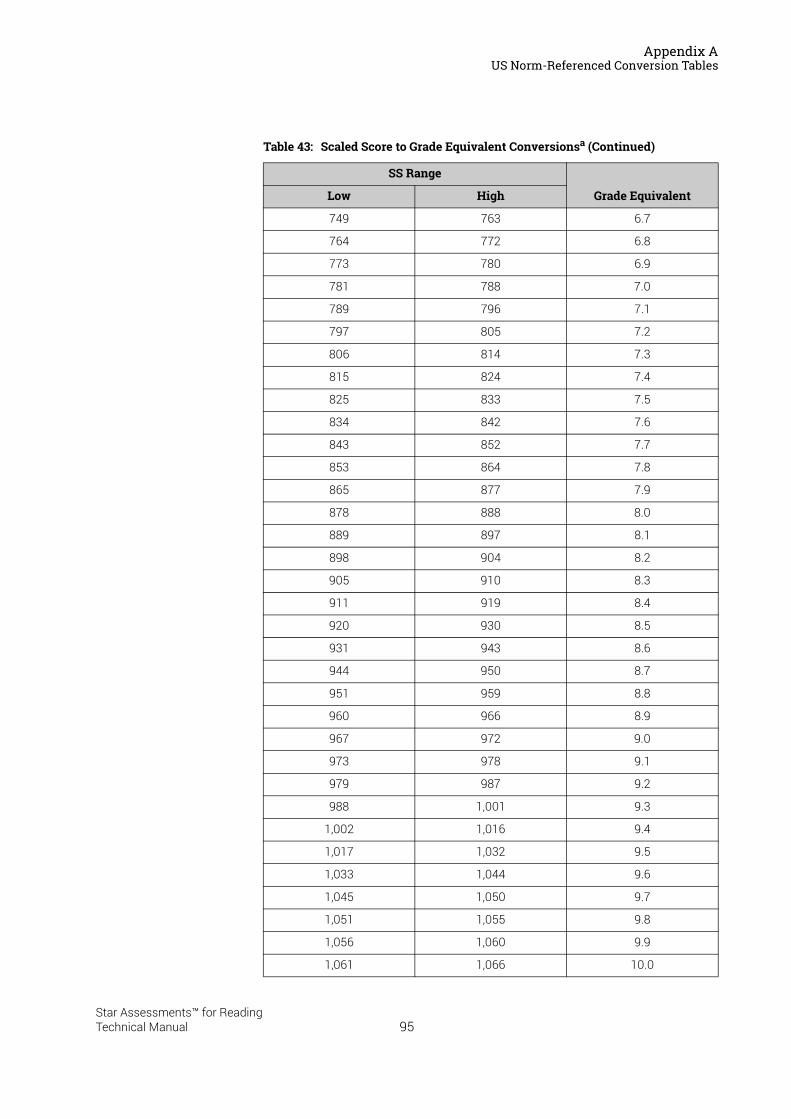
Appendix AUS Norm-Referenced Conversion Tables
749 763 6.7
764 772 6.8
773 780 6.9
781 788 7.0
789 796 7.1
797 805 7.2
806 814 7.3
815 824 7.4
825 833 7.5
834 842 7.6
843 852 7.7
853 864 7.8
865 877 7.9
878 888 8.0
889 897 8.1
898 904 8.2
905 910 8.3
911 919 8.4
920 930 8.5
931 943 8.6
944 950 8.7
951 959 8.8
960 966 8.9
967 972 9.0
973 978 9.1
979 987 9.2
988 1,001 9.3
1,002 1,016 9.4
1,017 1,032 9.5
1,033 1,044 9.6
1,045 1,050 9.7
1,051 1,055 9.8
1,056 1,060 9.9
1,061 1,066 10.0
Table 43: Scaled Score to Grade Equivalent Conversionsa (Continued)
SS Range
Grade EquivalentLow High
95Star Assessments™ for ReadingTechnical Manual
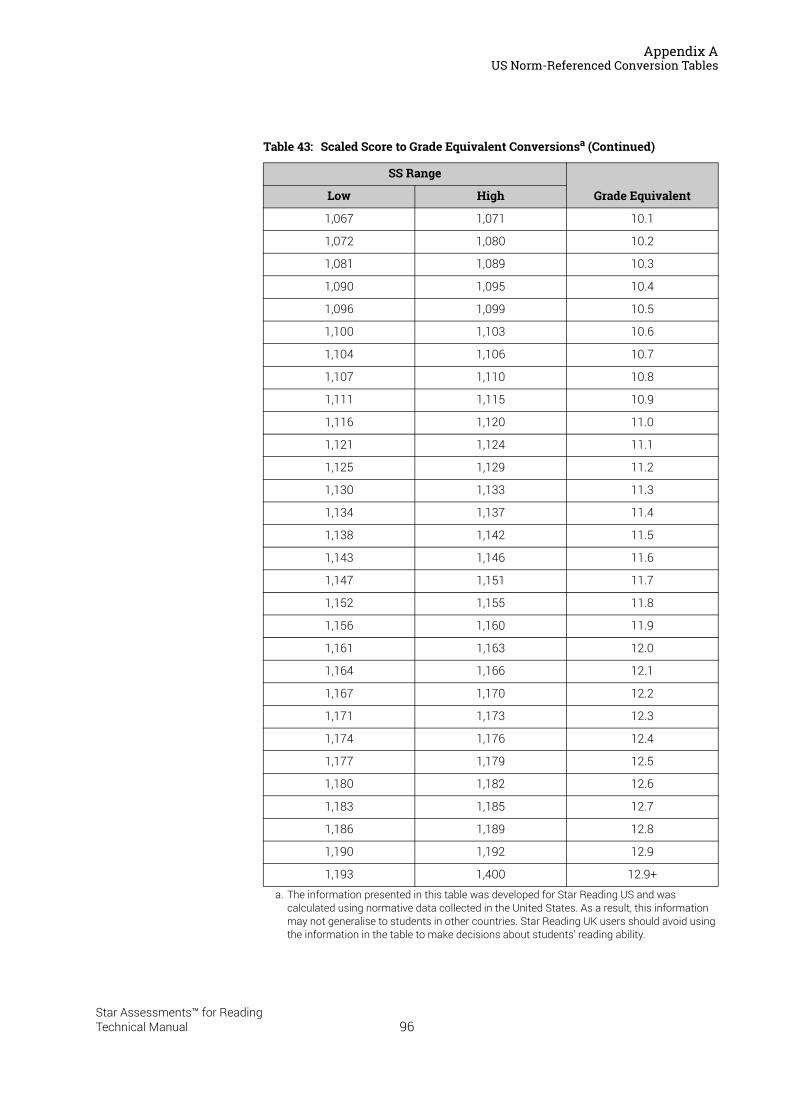
Appendix AUS Norm-Referenced Conversion Tables
1,067 1,071 10.1
1,072 1,080 10.2
1,081 1,089 10.3
1,090 1,095 10.4
1,096 1,099 10.5
1,100 1,103 10.6
1,104 1,106 10.7
1,107 1,110 10.8
1,111 1,115 10.9
1,116 1,120 11.0
1,121 1,124 11.1
1,125 1,129 11.2
1,130 1,133 11.3
1,134 1,137 11.4
1,138 1,142 11.5
1,143 1,146 11.6
1,147 1,151 11.7
1,152 1,155 11.8
1,156 1,160 11.9
1,161 1,163 12.0
1,164 1,166 12.1
1,167 1,170 12.2
1,171 1,173 12.3
1,174 1,176 12.4
1,177 1,179 12.5
1,180 1,182 12.6
1,183 1,185 12.7
1,186 1,189 12.8
1,190 1,192 12.9
1,193 1,400 12.9+
a. The information presented in this table was developed for Star Reading US and was calculated using normative data collected in the United States. As a result, this information may not generalise to students in other countries. Star Reading UK users should avoid using the information in the table to make decisions about students’ reading ability.
Table 43: Scaled Score to Grade Equivalent Conversionsa (Continued)
SS Range
Grade EquivalentLow High
96Star Assessments™ for ReadingTechnical Manual
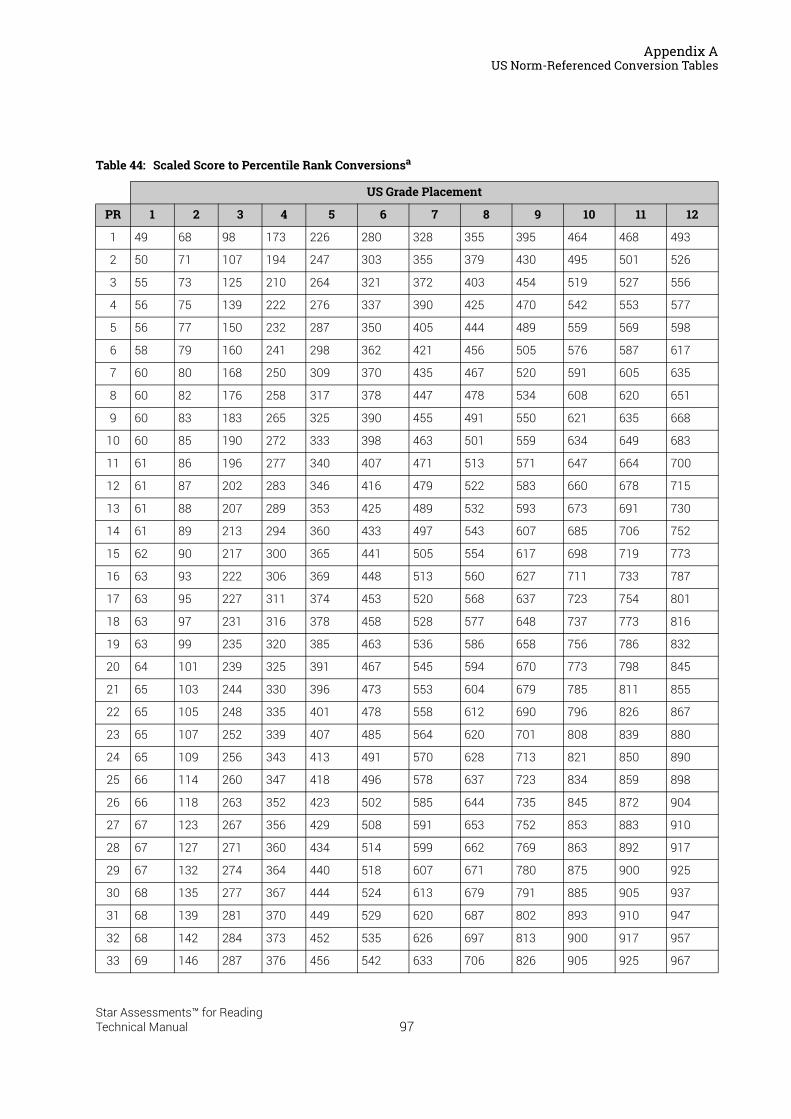
Appendix AUS Norm-Referenced Conversion Tables
Table 44: Scaled Score to Percentile Rank Conversionsa
US Grade Placement
PR 1 2 3 4 5 6 7 8 9 10 11 12
1 49 68 98 173 226 280 328 355 395 464 468 493
2 50 71 107 194 247 303 355 379 430 495 501 526
3 55 73 125 210 264 321 372 403 454 519 527 556
4 56 75 139 222 276 337 390 425 470 542 553 577
5 56 77 150 232 287 350 405 444 489 559 569 598
6 58 79 160 241 298 362 421 456 505 576 587 617
7 60 80 168 250 309 370 435 467 520 591 605 635
8 60 82 176 258 317 378 447 478 534 608 620 651
9 60 83 183 265 325 390 455 491 550 621 635 668
10 60 85 190 272 333 398 463 501 559 634 649 683
11 61 86 196 277 340 407 471 513 571 647 664 700
12 61 87 202 283 346 416 479 522 583 660 678 715
13 61 88 207 289 353 425 489 532 593 673 691 730
14 61 89 213 294 360 433 497 543 607 685 706 752
15 62 90 217 300 365 441 505 554 617 698 719 773
16 63 93 222 306 369 448 513 560 627 711 733 787
17 63 95 227 311 374 453 520 568 637 723 754 801
18 63 97 231 316 378 458 528 577 648 737 773 816
19 63 99 235 320 385 463 536 586 658 756 786 832
20 64 101 239 325 391 467 545 594 670 773 798 845
21 65 103 244 330 396 473 553 604 679 785 811 855
22 65 105 248 335 401 478 558 612 690 796 826 867
23 65 107 252 339 407 485 564 620 701 808 839 880
24 65 109 256 343 413 491 570 628 713 821 850 890
25 66 114 260 347 418 496 578 637 723 834 859 898
26 66 118 263 352 423 502 585 644 735 845 872 904
27 67 123 267 356 429 508 591 653 752 853 883 910
28 67 127 271 360 434 514 599 662 769 863 892 917
29 67 132 274 364 440 518 607 671 780 875 900 925
30 68 135 277 367 444 524 613 679 791 885 905 937
31 68 139 281 370 449 529 620 687 802 893 910 947
32 68 142 284 373 452 535 626 697 813 900 917 957
33 69 146 287 376 456 542 633 706 826 905 925 967
97Star Assessments™ for ReadingTechnical Manual
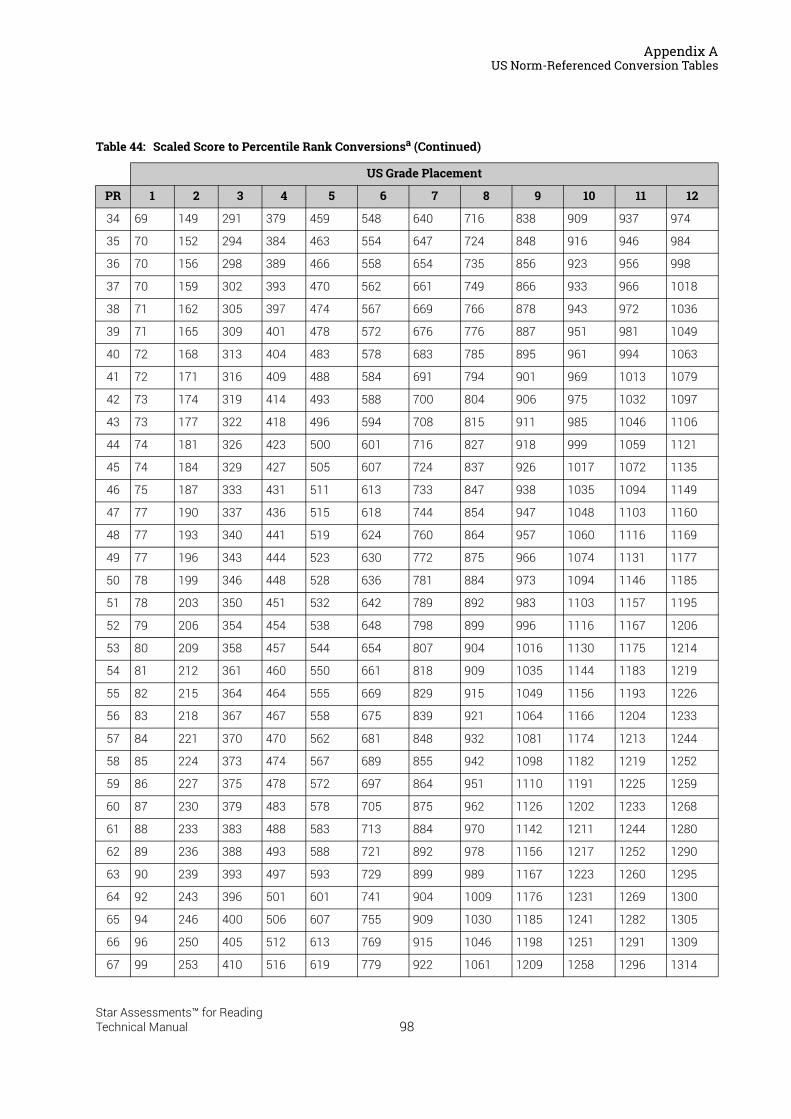
Appendix AUS Norm-Referenced Conversion Tables
34 69 149 291 379 459 548 640 716 838 909 937 974
35 70 152 294 384 463 554 647 724 848 916 946 984
36 70 156 298 389 466 558 654 735 856 923 956 998
37 70 159 302 393 470 562 661 749 866 933 966 1018
38 71 162 305 397 474 567 669 766 878 943 972 1036
39 71 165 309 401 478 572 676 776 887 951 981 1049
40 72 168 313 404 483 578 683 785 895 961 994 1063
41 72 171 316 409 488 584 691 794 901 969 1013 1079
42 73 174 319 414 493 588 700 804 906 975 1032 1097
43 73 177 322 418 496 594 708 815 911 985 1046 1106
44 74 181 326 423 500 601 716 827 918 999 1059 1121
45 74 184 329 427 505 607 724 837 926 1017 1072 1135
46 75 187 333 431 511 613 733 847 938 1035 1094 1149
47 77 190 337 436 515 618 744 854 947 1048 1103 1160
48 77 193 340 441 519 624 760 864 957 1060 1116 1169
49 77 196 343 444 523 630 772 875 966 1074 1131 1177
50 78 199 346 448 528 636 781 884 973 1094 1146 1185
51 78 203 350 451 532 642 789 892 983 1103 1157 1195
52 79 206 354 454 538 648 798 899 996 1116 1167 1206
53 80 209 358 457 544 654 807 904 1016 1130 1175 1214
54 81 212 361 460 550 661 818 909 1035 1144 1183 1219
55 82 215 364 464 555 669 829 915 1049 1156 1193 1226
56 83 218 367 467 558 675 839 921 1064 1166 1204 1233
57 84 221 370 470 562 681 848 932 1081 1174 1213 1244
58 85 224 373 474 567 689 855 942 1098 1182 1219 1252
59 86 227 375 478 572 697 864 951 1110 1191 1225 1259
60 87 230 379 483 578 705 875 962 1126 1202 1233 1268
61 88 233 383 488 583 713 884 970 1142 1211 1244 1280
62 89 236 388 493 588 721 892 978 1156 1217 1252 1290
63 90 239 393 497 593 729 899 989 1167 1223 1260 1295
64 92 243 396 501 601 741 904 1009 1176 1231 1269 1300
65 94 246 400 506 607 755 909 1030 1185 1241 1282 1305
66 96 250 405 512 613 769 915 1046 1198 1251 1291 1309
67 99 253 410 516 619 779 922 1061 1209 1258 1296 1314
Table 44: Scaled Score to Percentile Rank Conversionsa (Continued)
US Grade Placement
PR 1 2 3 4 5 6 7 8 9 10 11 12
98Star Assessments™ for ReadingTechnical Manual
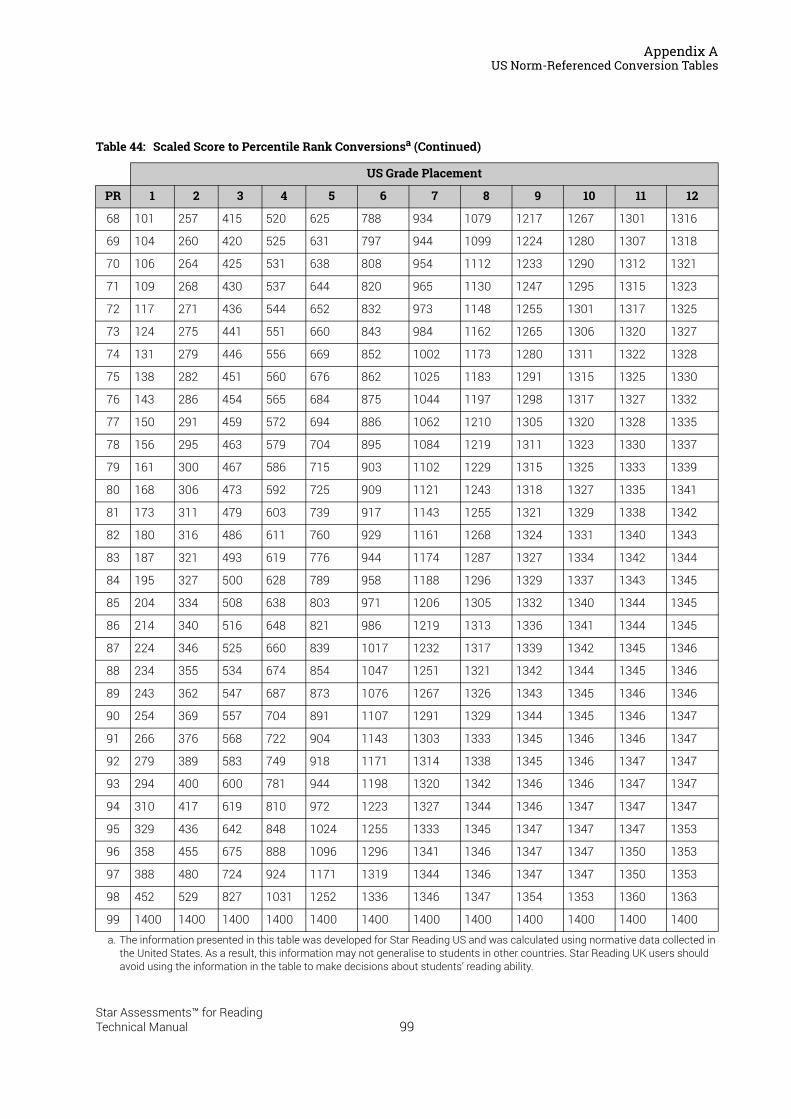
Appendix AUS Norm-Referenced Conversion Tables
68 101 257 415 520 625 788 934 1079 1217 1267 1301 1316
69 104 260 420 525 631 797 944 1099 1224 1280 1307 1318
70 106 264 425 531 638 808 954 1112 1233 1290 1312 1321
71 109 268 430 537 644 820 965 1130 1247 1295 1315 1323
72 117 271 436 544 652 832 973 1148 1255 1301 1317 1325
73 124 275 441 551 660 843 984 1162 1265 1306 1320 1327
74 131 279 446 556 669 852 1002 1173 1280 1311 1322 1328
75 138 282 451 560 676 862 1025 1183 1291 1315 1325 1330
76 143 286 454 565 684 875 1044 1197 1298 1317 1327 1332
77 150 291 459 572 694 886 1062 1210 1305 1320 1328 1335
78 156 295 463 579 704 895 1084 1219 1311 1323 1330 1337
79 161 300 467 586 715 903 1102 1229 1315 1325 1333 1339
80 168 306 473 592 725 909 1121 1243 1318 1327 1335 1341
81 173 311 479 603 739 917 1143 1255 1321 1329 1338 1342
82 180 316 486 611 760 929 1161 1268 1324 1331 1340 1343
83 187 321 493 619 776 944 1174 1287 1327 1334 1342 1344
84 195 327 500 628 789 958 1188 1296 1329 1337 1343 1345
85 204 334 508 638 803 971 1206 1305 1332 1340 1344 1345
86 214 340 516 648 821 986 1219 1313 1336 1341 1344 1345
87 224 346 525 660 839 1017 1232 1317 1339 1342 1345 1346
88 234 355 534 674 854 1047 1251 1321 1342 1344 1345 1346
89 243 362 547 687 873 1076 1267 1326 1343 1345 1346 1346
90 254 369 557 704 891 1107 1291 1329 1344 1345 1346 1347
91 266 376 568 722 904 1143 1303 1333 1345 1346 1346 1347
92 279 389 583 749 918 1171 1314 1338 1345 1346 1347 1347
93 294 400 600 781 944 1198 1320 1342 1346 1346 1347 1347
94 310 417 619 810 972 1223 1327 1344 1346 1347 1347 1347
95 329 436 642 848 1024 1255 1333 1345 1347 1347 1347 1353
96 358 455 675 888 1096 1296 1341 1346 1347 1347 1350 1353
97 388 480 724 924 1171 1319 1344 1346 1347 1347 1350 1353
98 452 529 827 1031 1252 1336 1346 1347 1354 1353 1360 1363
99 1400 1400 1400 1400 1400 1400 1400 1400 1400 1400 1400 1400
a. The information presented in this table was developed for Star Reading US and was calculated using normative data collected in the United States. As a result, this information may not generalise to students in other countries. Star Reading UK users should avoid using the information in the table to make decisions about students’ reading ability.
Table 44: Scaled Score to Percentile Rank Conversionsa (Continued)
US Grade Placement
PR 1 2 3 4 5 6 7 8 9 10 11 12
99Star Assessments™ for ReadingTechnical Manual
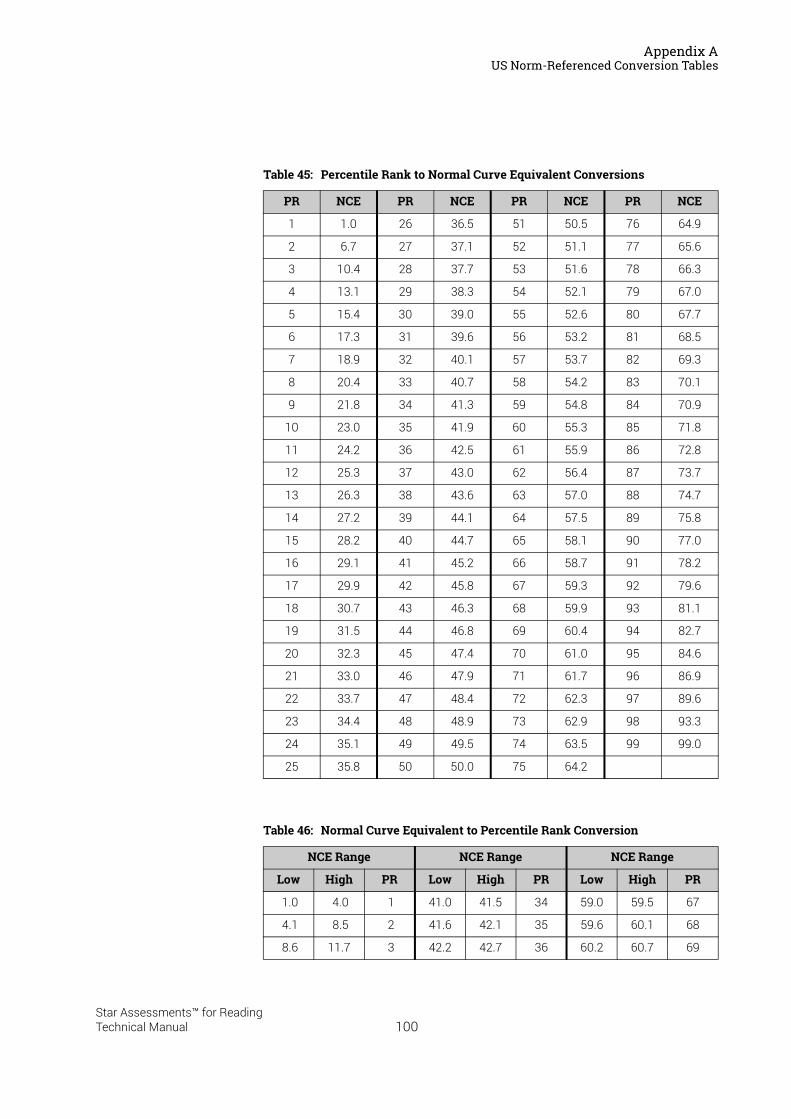
Appendix AUS Norm-Referenced Conversion Tables
Table 45: Percentile Rank to Normal Curve Equivalent Conversions
PR NCE PR NCE PR NCE PR NCE
1 1.0 26 36.5 51 50.5 76 64.9
2 6.7 27 37.1 52 51.1 77 65.6
3 10.4 28 37.7 53 51.6 78 66.3
4 13.1 29 38.3 54 52.1 79 67.0
5 15.4 30 39.0 55 52.6 80 67.7
6 17.3 31 39.6 56 53.2 81 68.5
7 18.9 32 40.1 57 53.7 82 69.3
8 20.4 33 40.7 58 54.2 83 70.1
9 21.8 34 41.3 59 54.8 84 70.9
10 23.0 35 41.9 60 55.3 85 71.8
11 24.2 36 42.5 61 55.9 86 72.8
12 25.3 37 43.0 62 56.4 87 73.7
13 26.3 38 43.6 63 57.0 88 74.7
14 27.2 39 44.1 64 57.5 89 75.8
15 28.2 40 44.7 65 58.1 90 77.0
16 29.1 41 45.2 66 58.7 91 78.2
17 29.9 42 45.8 67 59.3 92 79.6
18 30.7 43 46.3 68 59.9 93 81.1
19 31.5 44 46.8 69 60.4 94 82.7
20 32.3 45 47.4 70 61.0 95 84.6
21 33.0 46 47.9 71 61.7 96 86.9
22 33.7 47 48.4 72 62.3 97 89.6
23 34.4 48 48.9 73 62.9 98 93.3
24 35.1 49 49.5 74 63.5 99 99.0
25 35.8 50 50.0 75 64.2
Table 46: Normal Curve Equivalent to Percentile Rank Conversion
NCE Range NCE Range NCE Range
Low High PR Low High PR Low High PR
1.0 4.0 1 41.0 41.5 34 59.0 59.5 67
4.1 8.5 2 41.6 42.1 35 59.6 60.1 68
8.6 11.7 3 42.2 42.7 36 60.2 60.7 69
100Star Assessments™ for ReadingTechnical Manual
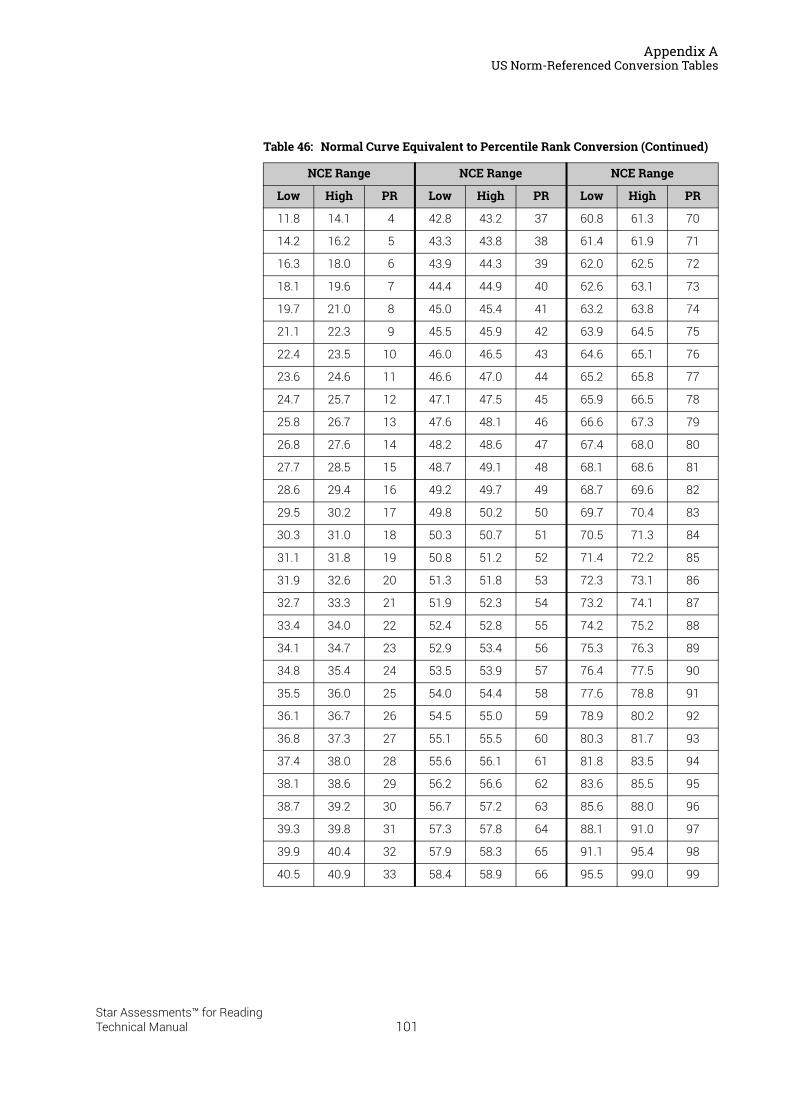
Appendix AUS Norm-Referenced Conversion Tables
11.8 14.1 4 42.8 43.2 37 60.8 61.3 70
14.2 16.2 5 43.3 43.8 38 61.4 61.9 71
16.3 18.0 6 43.9 44.3 39 62.0 62.5 72
18.1 19.6 7 44.4 44.9 40 62.6 63.1 73
19.7 21.0 8 45.0 45.4 41 63.2 63.8 74
21.1 22.3 9 45.5 45.9 42 63.9 64.5 75
22.4 23.5 10 46.0 46.5 43 64.6 65.1 76
23.6 24.6 11 46.6 47.0 44 65.2 65.8 77
24.7 25.7 12 47.1 47.5 45 65.9 66.5 78
25.8 26.7 13 47.6 48.1 46 66.6 67.3 79
26.8 27.6 14 48.2 48.6 47 67.4 68.0 80
27.7 28.5 15 48.7 49.1 48 68.1 68.6 81
28.6 29.4 16 49.2 49.7 49 68.7 69.6 82
29.5 30.2 17 49.8 50.2 50 69.7 70.4 83
30.3 31.0 18 50.3 50.7 51 70.5 71.3 84
31.1 31.8 19 50.8 51.2 52 71.4 72.2 85
31.9 32.6 20 51.3 51.8 53 72.3 73.1 86
32.7 33.3 21 51.9 52.3 54 73.2 74.1 87
33.4 34.0 22 52.4 52.8 55 74.2 75.2 88
34.1 34.7 23 52.9 53.4 56 75.3 76.3 89
34.8 35.4 24 53.5 53.9 57 76.4 77.5 90
35.5 36.0 25 54.0 54.4 58 77.6 78.8 91
36.1 36.7 26 54.5 55.0 59 78.9 80.2 92
36.8 37.3 27 55.1 55.5 60 80.3 81.7 93
37.4 38.0 28 55.6 56.1 61 81.8 83.5 94
38.1 38.6 29 56.2 56.6 62 83.6 85.5 95
38.7 39.2 30 56.7 57.2 63 85.6 88.0 96
39.3 39.8 31 57.3 57.8 64 88.1 91.0 97
39.9 40.4 32 57.9 58.3 65 91.1 95.4 98
40.5 40.9 33 58.4 58.9 66 95.5 99.0 99
Table 46: Normal Curve Equivalent to Percentile Rank Conversion (Continued)
NCE Range NCE Range NCE Range
Low High PR Low High PR Low High PR
101Star Assessments™ for ReadingTechnical Manual
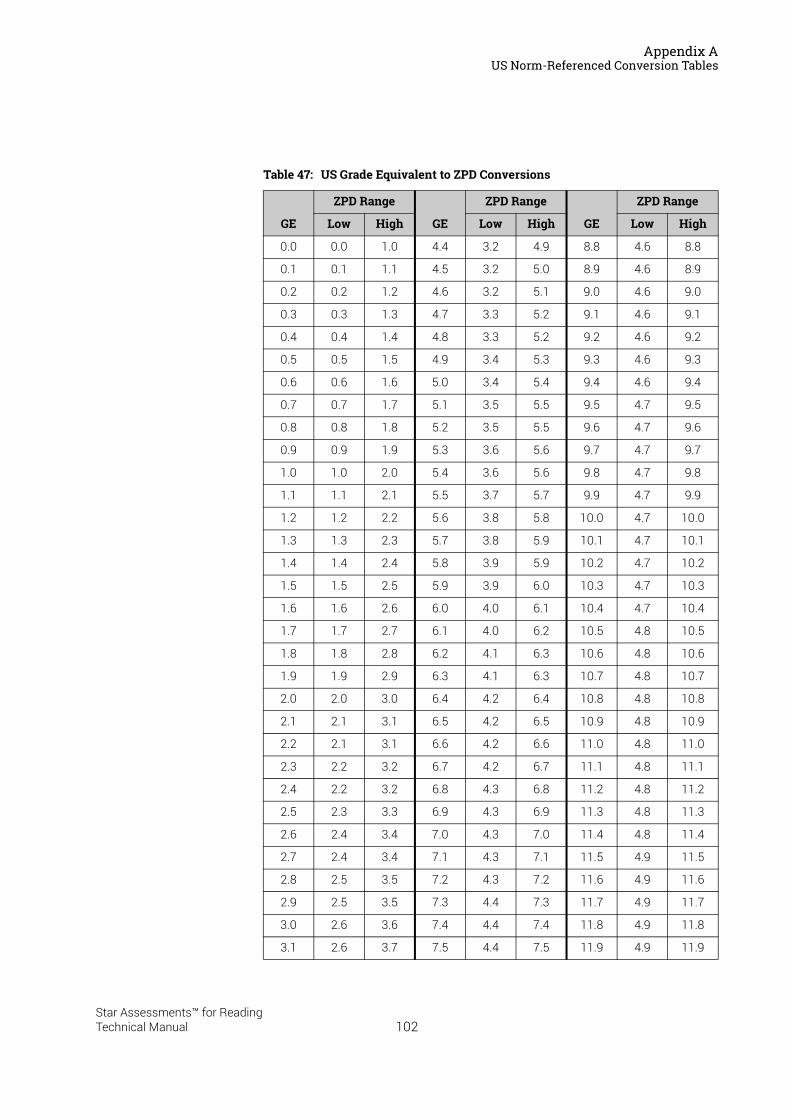
Appendix AUS Norm-Referenced Conversion Tables
Table 47: US Grade Equivalent to ZPD Conversions
GE
ZPD Range
GE
ZPD Range
GE
ZPD Range
Low High Low High Low High
0.0 0.0 1.0 4.4 3.2 4.9 8.8 4.6 8.8
0.1 0.1 1.1 4.5 3.2 5.0 8.9 4.6 8.9
0.2 0.2 1.2 4.6 3.2 5.1 9.0 4.6 9.0
0.3 0.3 1.3 4.7 3.3 5.2 9.1 4.6 9.1
0.4 0.4 1.4 4.8 3.3 5.2 9.2 4.6 9.2
0.5 0.5 1.5 4.9 3.4 5.3 9.3 4.6 9.3
0.6 0.6 1.6 5.0 3.4 5.4 9.4 4.6 9.4
0.7 0.7 1.7 5.1 3.5 5.5 9.5 4.7 9.5
0.8 0.8 1.8 5.2 3.5 5.5 9.6 4.7 9.6
0.9 0.9 1.9 5.3 3.6 5.6 9.7 4.7 9.7
1.0 1.0 2.0 5.4 3.6 5.6 9.8 4.7 9.8
1.1 1.1 2.1 5.5 3.7 5.7 9.9 4.7 9.9
1.2 1.2 2.2 5.6 3.8 5.8 10.0 4.7 10.0
1.3 1.3 2.3 5.7 3.8 5.9 10.1 4.7 10.1
1.4 1.4 2.4 5.8 3.9 5.9 10.2 4.7 10.2
1.5 1.5 2.5 5.9 3.9 6.0 10.3 4.7 10.3
1.6 1.6 2.6 6.0 4.0 6.1 10.4 4.7 10.4
1.7 1.7 2.7 6.1 4.0 6.2 10.5 4.8 10.5
1.8 1.8 2.8 6.2 4.1 6.3 10.6 4.8 10.6
1.9 1.9 2.9 6.3 4.1 6.3 10.7 4.8 10.7
2.0 2.0 3.0 6.4 4.2 6.4 10.8 4.8 10.8
2.1 2.1 3.1 6.5 4.2 6.5 10.9 4.8 10.9
2.2 2.1 3.1 6.6 4.2 6.6 11.0 4.8 11.0
2.3 2.2 3.2 6.7 4.2 6.7 11.1 4.8 11.1
2.4 2.2 3.2 6.8 4.3 6.8 11.2 4.8 11.2
2.5 2.3 3.3 6.9 4.3 6.9 11.3 4.8 11.3
2.6 2.4 3.4 7.0 4.3 7.0 11.4 4.8 11.4
2.7 2.4 3.4 7.1 4.3 7.1 11.5 4.9 11.5
2.8 2.5 3.5 7.2 4.3 7.2 11.6 4.9 11.6
2.9 2.5 3.5 7.3 4.4 7.3 11.7 4.9 11.7
3.0 2.6 3.6 7.4 4.4 7.4 11.8 4.9 11.8
3.1 2.6 3.7 7.5 4.4 7.5 11.9 4.9 11.9
102Star Assessments™ for ReadingTechnical Manual
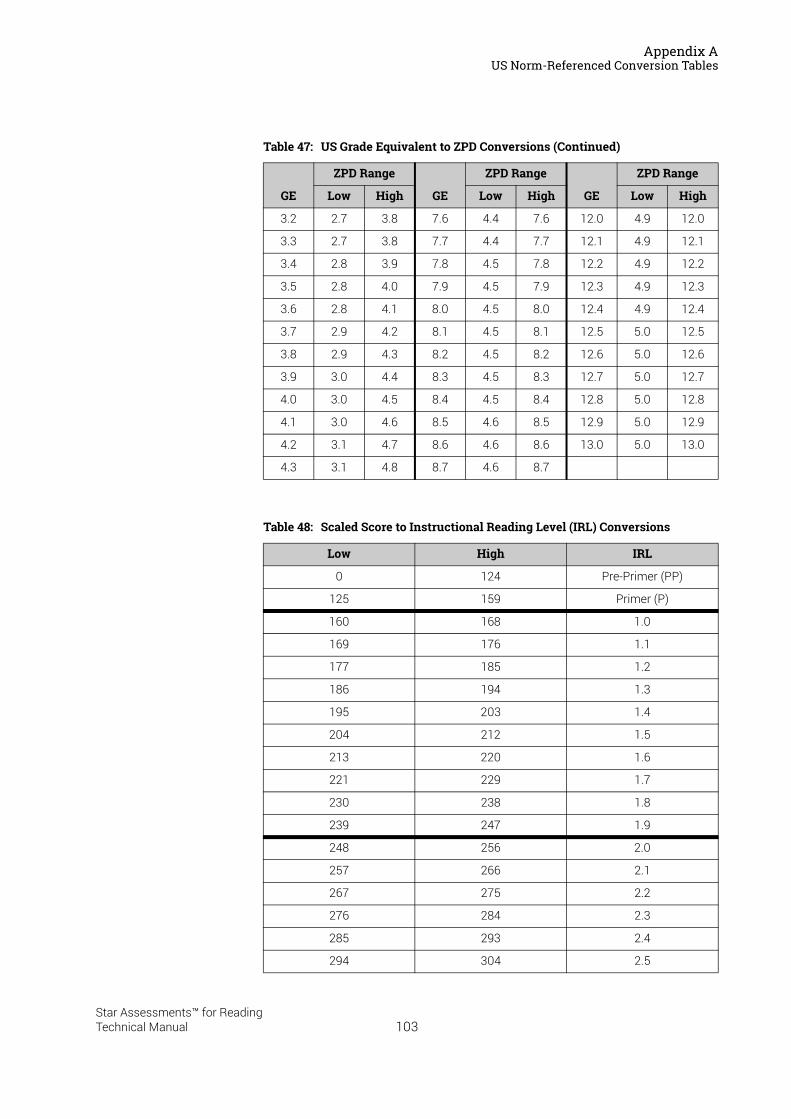
Appendix AUS Norm-Referenced Conversion Tables
3.2 2.7 3.8 7.6 4.4 7.6 12.0 4.9 12.0
3.3 2.7 3.8 7.7 4.4 7.7 12.1 4.9 12.1
3.4 2.8 3.9 7.8 4.5 7.8 12.2 4.9 12.2
3.5 2.8 4.0 7.9 4.5 7.9 12.3 4.9 12.3
3.6 2.8 4.1 8.0 4.5 8.0 12.4 4.9 12.4
3.7 2.9 4.2 8.1 4.5 8.1 12.5 5.0 12.5
3.8 2.9 4.3 8.2 4.5 8.2 12.6 5.0 12.6
3.9 3.0 4.4 8.3 4.5 8.3 12.7 5.0 12.7
4.0 3.0 4.5 8.4 4.5 8.4 12.8 5.0 12.8
4.1 3.0 4.6 8.5 4.6 8.5 12.9 5.0 12.9
4.2 3.1 4.7 8.6 4.6 8.6 13.0 5.0 13.0
4.3 3.1 4.8 8.7 4.6 8.7
Table 48: Scaled Score to Instructional Reading Level (IRL) Conversions
Low High IRL
0 124 Pre-Primer (PP)
125 159 Primer (P)
160 168 1.0
169 176 1.1
177 185 1.2
186 194 1.3
195 203 1.4
204 212 1.5
213 220 1.6
221 229 1.7
230 238 1.8
239 247 1.9
248 256 2.0
257 266 2.1
267 275 2.2
276 284 2.3
285 293 2.4
294 304 2.5
Table 47: US Grade Equivalent to ZPD Conversions (Continued)
GE
ZPD Range
GE
ZPD Range
GE
ZPD Range
Low High Low High Low High
103Star Assessments™ for ReadingTechnical Manual
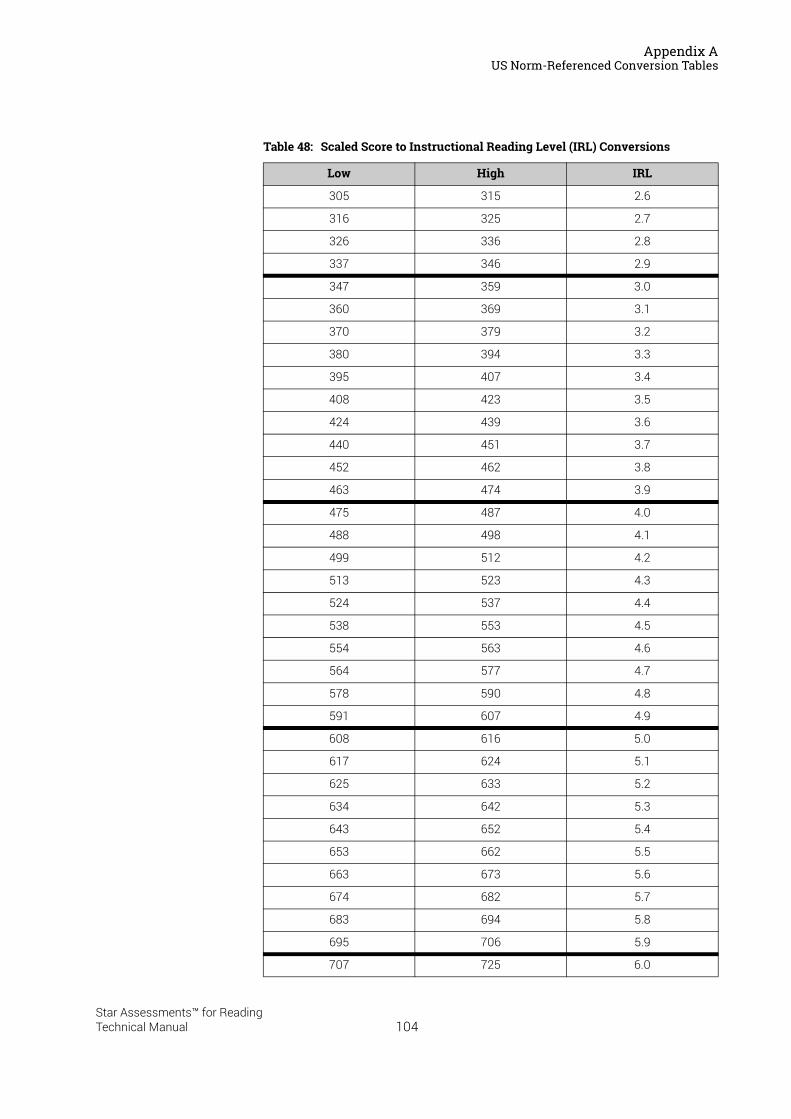
Appendix AUS Norm-Referenced Conversion Tables
305 315 2.6
316 325 2.7
326 336 2.8
337 346 2.9
347 359 3.0
360 369 3.1
370 379 3.2
380 394 3.3
395 407 3.4
408 423 3.5
424 439 3.6
440 451 3.7
452 462 3.8
463 474 3.9
475 487 4.0
488 498 4.1
499 512 4.2
513 523 4.3
524 537 4.4
538 553 4.5
554 563 4.6
564 577 4.7
578 590 4.8
591 607 4.9
608 616 5.0
617 624 5.1
625 633 5.2
634 642 5.3
643 652 5.4
653 662 5.5
663 673 5.6
674 682 5.7
683 694 5.8
695 706 5.9
707 725 6.0
Table 48: Scaled Score to Instructional Reading Level (IRL) Conversions
Low High IRL
104Star Assessments™ for ReadingTechnical Manual
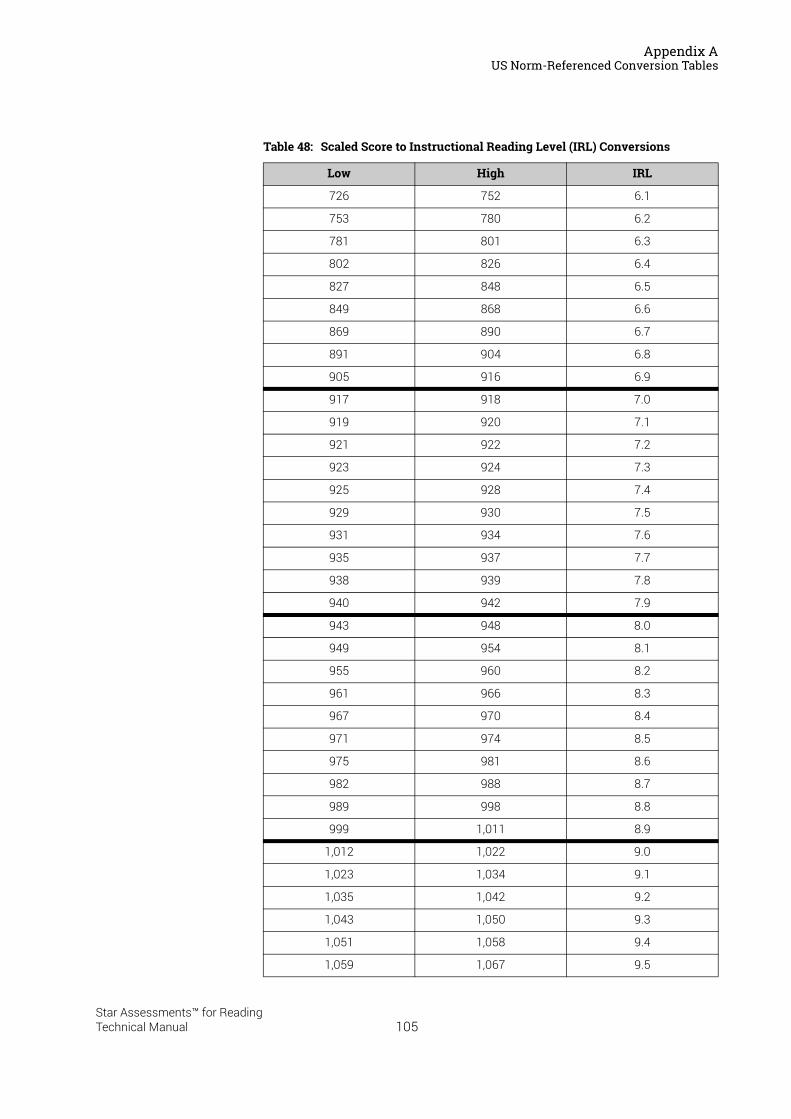
Appendix AUS Norm-Referenced Conversion Tables
726 752 6.1
753 780 6.2
781 801 6.3
802 826 6.4
827 848 6.5
849 868 6.6
869 890 6.7
891 904 6.8
905 916 6.9
917 918 7.0
919 920 7.1
921 922 7.2
923 924 7.3
925 928 7.4
929 930 7.5
931 934 7.6
935 937 7.7
938 939 7.8
940 942 7.9
943 948 8.0
949 954 8.1
955 960 8.2
961 966 8.3
967 970 8.4
971 974 8.5
975 981 8.6
982 988 8.7
989 998 8.8
999 1,011 8.9
1,012 1,022 9.0
1,023 1,034 9.1
1,035 1,042 9.2
1,043 1,050 9.3
1,051 1,058 9.4
1,059 1,067 9.5
Table 48: Scaled Score to Instructional Reading Level (IRL) Conversions
Low High IRL
105Star Assessments™ for ReadingTechnical Manual
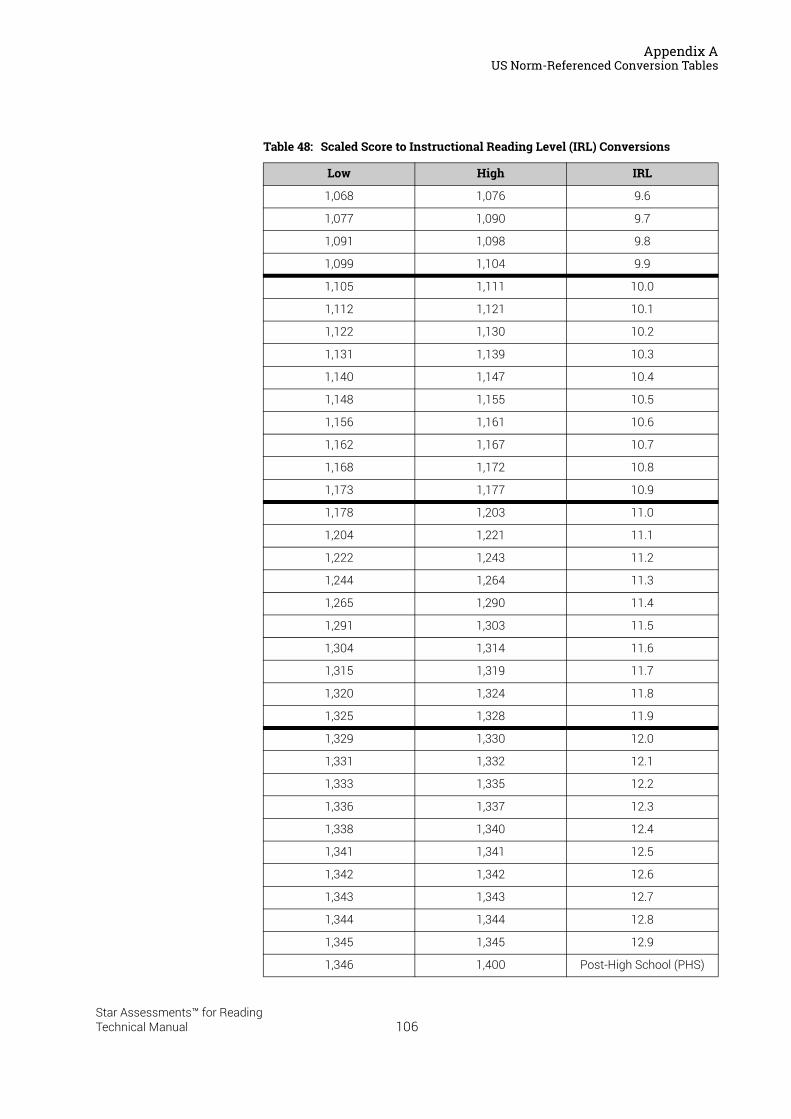
Appendix AUS Norm-Referenced Conversion Tables
1,068 1,076 9.6
1,077 1,090 9.7
1,091 1,098 9.8
1,099 1,104 9.9
1,105 1,111 10.0
1,112 1,121 10.1
1,122 1,130 10.2
1,131 1,139 10.3
1,140 1,147 10.4
1,148 1,155 10.5
1,156 1,161 10.6
1,162 1,167 10.7
1,168 1,172 10.8
1,173 1,177 10.9
1,178 1,203 11.0
1,204 1,221 11.1
1,222 1,243 11.2
1,244 1,264 11.3
1,265 1,290 11.4
1,291 1,303 11.5
1,304 1,314 11.6
1,315 1,319 11.7
1,320 1,324 11.8
1,325 1,328 11.9
1,329 1,330 12.0
1,331 1,332 12.1
1,333 1,335 12.2
1,336 1,337 12.3
1,338 1,340 12.4
1,341 1,341 12.5
1,342 1,342 12.6
1,343 1,343 12.7
1,344 1,344 12.8
1,345 1,345 12.9
1,346 1,400 Post-High School (PHS)
Table 48: Scaled Score to Instructional Reading Level (IRL) Conversions
Low High IRL
106Star Assessments™ for ReadingTechnical Manual
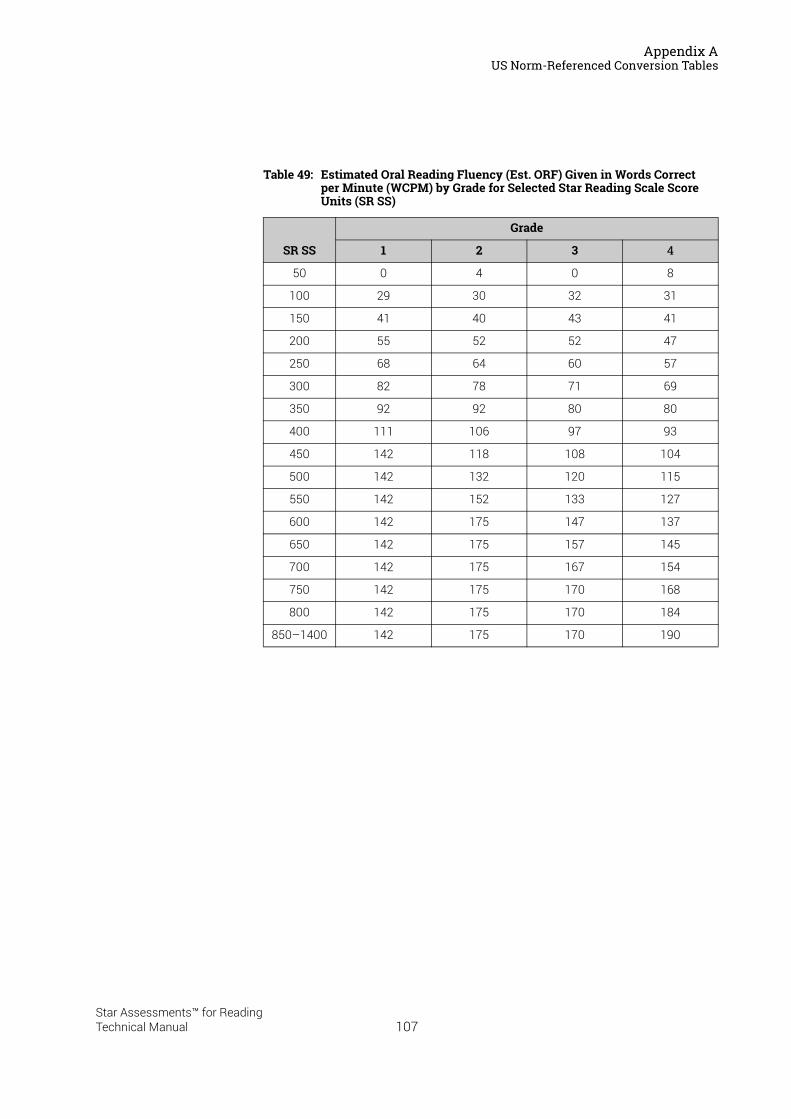
Appendix AUS Norm-Referenced Conversion Tables
Table 49: Estimated Oral Reading Fluency (Est. ORF) Given in Words Correct per Minute (WCPM) by Grade for Selected Star Reading Scale Score Units (SR SS)
SR SS
Grade
1 2 3 4
50 0 4 0 8
100 29 30 32 31
150 41 40 43 41
200 55 52 52 47
250 68 64 60 57
300 82 78 71 69
350 92 92 80 80
400 111 106 97 93
450 142 118 108 104
500 142 132 120 115
550 142 152 133 127
600 142 175 147 137
650 142 175 157 145
700 142 175 167 154
750 142 175 170 168
800 142 175 170 184
850–1400 142 175 170 190
107Star Assessments™ for ReadingTechnical Manual
References
Allington, R., & McGill-Franzen, A. (2003). Use students’ summer-setback months to raise minority achievement. Education Digest, Nov., 19. Allington, R., & McGill-Franzen, A. (2003). Use students’ summer-setback months to raise minority achievement. Education Digest, 69(3), 19–24.
Bennicoff-Nan, L. (2002). A Correlation of Computer Adaptive, Norm Referenced, and Criterion Referenced Achievement Tests in Elementary Reading. Doctoral dissertation, The Boyer Graduate School of Education, Santa Ana, CA.
Borman, G. D. & Dowling, N. M. (2004). Testing the Reading Renaissance Program Theory: A Multilevel Analysis of Student and Classroom Effects on Reading Achievement. University of Wisconsin-Madison.
Bracey, G. (2002). Summer loss: The phenomenon no one wants to deal with. Phi Delta Kappan, Sept., 12. Bracey, G. (2002). Summer loss: The phenomenon no one wants to deal with. Phi Delta Kappan, 84(1), 12–13.
Bryk, A., & Raudenbush, S. (1992). Hierarchical linear models: Applications and data analysis methods. Newbury Park, CA: Sage Publications.
Campbell, D., & Stanley, J. (1966). Experimental and quasi-experimental designs for research. Chicago: Rand McNally & Company.
Cook, T., & Campbell, D. (1979). Quasi-experimentation: Design & analysis issues for field settings. Boston: Houghton Mifflin Company.
Deno, S. (2003). Developments in curriculum-based measurement. Journal of Special Education, 37(3), 184–192.
Diggle, P., Heagerty, P., Liang, K., & Zeger, S. (2002). Analysis of longitudinal data (Second edition). Oxford: Oxford University Press. Diggle, P., Heagerty, P., Liang, K., & Zeger, S. (2002). Analysis of longitudinal data (2nd ed.). Oxford: Oxford University Press.
Duncan, T., Duncan, S., Strycker, L., Li, F., & Alpert, A. (1999). An introduction to latent variable growth curve modeling: Concepts, issues, and applications. Mahwah, NJ: Lawrence Erlbaum Associates.
Fuchs, D. & Fuchs, L. S. (2006). Introduction to Response to Intervention: What, why, and how valid is it? Reading Research Quarterly, 41(1), 93–99.
Holmes, C. T., & Brown, C. L. (2003). A controlled evaluation of a total school improvement process, School Renaissance. University of Georgia. Available online: http://www.coe.uga.edu/leadership/faculty/holmes/articles.html. Holmes, C. T., & Brown, C. L. (2003). A controlled evaluation of a total school improvement process, School Renaissance. University of Georgia. Available online: http://www.eric.ed.gov/PDFS/ED474261.pdf.
108Star Assessments™ for ReadingTechnical Manual
References
Kirk, R. (1995). Experimental Design: Procedures for the behavioral sciences, Third edition. New York: Brooks/Cole Publishing Company. Kirk, R. (1995). Experimental Design: Procedures for the behavioral sciences (3rd ed.). New York: Brooks/Cole Publishing Company.
Kolen, M., & Brennan, R. (2004). Test equating, scaling, and linking (Second edition). New York: Springer. Kolen, M., & Brennan, R. (2004). Test equating, scaling, and linking (2nd ed.). New York: Springer.
Multiple authors. (2002). Modeling intraindividual variability with repeated measures data: Methods and applications. In D. S. Moskowitz & S. L. Hershberger (eds.), Mahwah, NJ: Lawrence Erlbaum Associates.
Neter, J., Kutner, M., Nachtsheim, C., & Wasserman, W. (1996). Applied linear statistical models (Fourth edition). New York: WCB McGraw-Hill. Neter, J., Kutner, M., Nachtsheim, C., & Wasserman, W. (1996). Applied linear statistical models (4th ed.). New York: WCB McGraw-Hill.
Pedhazur, E., & Schmelkin, L. (1991). Measurement, design, and analysis: An integrated approach. Hillsdale, NJ: Lawrence Erlbaum Associates.
Renaissance Learning. (2003). Guide to Reading Renaissance Goal-Setting Changes. Madison, WI: Renaissance Learning, Inc. Available online: (http://doc.renlearn.com/KMNet/R001398009GC0386.pdf).
Ross, S. M. & Nunnery, J. (2005). The effect of School Renaissance on student achievement in two Mississippi school districts. Memphis: University of Memphis, Center for Research in Educational Policy. Available online: http://crep.memphis.edu/web/research/pub/Mississippi_School_Renaissance_FINAL_4.pdf. Ross, S. M. & Nunnery, J. (2005). The effect of School Renaissance on student achievement in two Mississippi school districts. Memphis: University of Memphis, Center for Research in Educational Policy. Available online: http://www.eric.ed.gov/PDFS/ED484275.pdf.
Sadusky, L. A. & Brem, S. K. (2002). The Integration of Renaissance Programs into an Urban Title I Elementary School, and Its Effect on School-wide Improvement. Arizona State University.
Sewell, J., Sainsbury, M., Pyle, K., Keogh, N. and Styles, B. (2007). Renaissance Learning Equating Study Report. Technical Report submitted to Renaissance Learning, Inc. National Foundation for Educational Research, Slough, Berkshire, United Kingdom.
Yoes, M. (1999) Linking the Star and DRP Reading Test Scales. Technical Report. Submitted to Touchstone Applied Science Associates and Renaissance Learning.
109Star Assessments™ for ReadingTechnical Manual
Index
AAccess levels, 7Adaptive Branching, 5, 6, 9Administering the test, 8Analysis of validity data, 55ATOS graded vocabulary list, 12
BBayesian-modal IRT (Item Response Theory), 24
CCalibration of STAR Reading items for use in
version 2.0, 15California Standards Tests, 56Capabilities, 7Comparing the STAR Reading test with classical
tests, 35, 89Computer-adaptive test design, 23Concurrent validity, correlations with reading tests
in England, 58Construct validity, correlations with a measure of
reading comprehension, 59Content development, 12
ATOS graded vocabulary list, 12Educational Development Laboratory’s core
vocabulary list, 12Conversion tables, 91Criterion-referenced scores, 28Cross-validation study results, 63
DData analysis, 85Data encryption, 7Definitions of scores, 28Description of the program, 1Diagnostic codes, 34DIBELS oral reading fluency. See DORFDORF (DIBELS oral reading fluency), 61Dynamic Calibration, 6, 27
11Star Assessments™ for ReadingTechnical Manual
EEducational Development Laboratory, core
vocabulary list, 12EIRF (empirical item response functions), 21England, 58Est. ORF (Estimated Oral Reading Fluency), 28, 88Extended time limits, 11External validity, 41
FFormative class assessments, 1Frequently asked questions, 76
cloze and maze, 81comparison to other standardised/national
tests, 77, 78comprehension, vocabulary and reading
achievement, 76determining reading levels in less than minutes,
76determining which pupils can test, 80evidence of product claims, 80IRT (Item Response Theory), 81lowered test performance, 79number of test items presented, 79pupils reluctant to test, 80replacing national tests, 81total number of test questions, 79viewing student responses, 80ZPD ranges, 76
GGE (Grade Equivalent), 82, 86, 87, 90
IImprovements to the program, 5Individualised tests, 7Interim periodic assessments, 1Investigating Oral Reading Fluency and developing
the Est. ORF (Estimated Oral Reading Fluency) scale, 61
IRF (item response function), 20, 21
0
Index
IRL (Instructional Reading Level), 89IRT (Item Response Theory), 5, 20, 21, 25, 81
Bayesian-modal, 24Maximum-Likelihood estimation procedure, 24
Item calibration, 15sample description, 16sample description, item difficulty, 19sample description, item discrimination, 19sample description, item presentation, 17sample description, item response function, 20of STAR Reading items for use in version 2.0,
15Item development, 12, 13
vocabulary-in-context item specifications, 13Item difficulty, 19Item discrimination, 19Item presentation, 17Item Response Function. See IRFItem Response Theory. See IRTItem retention, rules, 21Item specifications, vocabulary-in-context items, 13
KKeyboard, 9
LLength of test, 5, 9Levels of pupil data
Tier 1, formative class assessments, 1Tier 2, interim periodic assessments, 1Tier 3, summative assessments, 2
Lexile Framework, 30Lexile Measures, 29Lexile Measures of Students and Books, 29Lexile ZPD Ranges, 29Linking study, 25Longitudinal study, correlations with SAT, 57
MMaximum-Likelihood IRT estimation, 24Meta-analysis of the STAR Reading validity data, 55Mouse, 9
NNational Curriculum Level–Reading. See NCL–RNCE (Normal Curve Equivalent), 91NCL–R (National Curriculum Level–Reading), 31
11Star Assessments™ for ReadingTechnical Manual
Normal Curve Equivalent. See NCENorming, 82
data analysis, 85sample characteristics, 82test administration, 85
Norm-referenced scores, 28definitions, 87
NRSS (Normed Referenced Standardised Score), 32
PPassword entry, 8Percentile Rank Range, 32Percentile Rank. See PRPost-publication study data, 56
correlations with a measure of reading comprehension, 59
correlations with reading tests in England, 58correlations with SAT, 57correlations with SAT and the California
Standards Tests, 56cross-validation study results, 63investigating Oral Reading Fluency and
developing the Est. ORF (Estimated Oral Reading Fluency) scale, 61
PR (Percentile Rank), 32, 82, 86, 90Practice session, 9Predictive validity, correlations with SAT and the
California Standards Tests, 56Program description, 1Program design, 3, 5Program improvements, 5Progress monitoring assessment, levels of pupil
information, 1Purpose of the program, 2
RRA (Reading Age), 32Rasch IRT (Item Response Theory) model, 20Reading Age. See RARelationship of STAR Reading scores to state tests,
41Reliability
definition, 37UK reliability study, 39
Repeating a test, 10Rules for item retention, 21
SSample characteristics, norming, 82
1
Index
SAT, 56, 57Scale calibration, 15
Dynamic Calibration, 27linking study, 25
Scaled Score. See SSScore definitions, 28
types of test scores, 28US norm-referenced, 87
Scoresconversion, 91criterion-referenced, 28diagnostic codes, 34Est. ORF (Estimated Oral Reading Fluency), 28,
88GE (Grade Equivalent), 82, 86, 87, 89, 90IRL (Instructional Reading Level), 89Lexile Measures, 29Lexile ZPD Ranges, 29NCE (Normal Curve Equivalent), 91NCL–R (National Curriculum Level–Reading),
31norm-referenced, 28NRSS (Normed Referenced Standardised
Score), 32Percentile Rank Range, 32PR (Percentile Rank), 32, 82, 86, 90RA (Reading Age), 32relationship of STAR Reading scores to state
tests, 41SS (Scaled Score), 24, 34, 86test scores (types), 28ZPD (Zone of Proximal Development), 34, 76
Scoring, 24Security. See Test securitySEM (standard error of measurement), 24Special scores
diagnostic codes, 34ZPD (Zone of Proximal Development), 34, 76
Split-application model, 7SS (Scaled Score), 24, 34, 86Standard Error of Measurement. See SEMSummary of validity data, 68Summative assessments, 2
TTest administration, 85
procedures, 8Test interface, 9Test items, time limits, 10Test length, 5, 9Test monitoring, 8Test repetition, 10
11Star Assessments™ for ReadingTechnical Manual
Test scores, types. See types of test scoresTest scoring, 24Test security, 7
access levels and capabilities, 7data encryption, 7individualised tests, 7split-application model, 7test monitoring and password entry, 8
Time limits, 10extended time limits, 11
Types of test scores, 28, 87Est. ORF (Estimated Oral Reading Fluency), 28,
88GE (Grade Equivalent), 82, 86, 87, 90IRL (Instructional Reading Level), 89NCE (Normal Curve Equivalent), 91NCL–R (National Curriculum Level–Reading),
31NRSS (Normed Referenced Standardised
Score), 32Percentile Rank Range), 32PR (Percentile Rank), 32, 82, 86, 90RA (Reading Age), 32SS (Scaled Score), 34, 86
UUK reliability study, 39UK validity, study results, 64
concurrent validity, 65Understanding GE scores, 89Understanding IRL scores, 89US norm-referenced score definitions, 87
VValidity
concurrent, 58construct, 59cross-validation study results, 63data analysis, 55definition, 40external validity, 41longitudinal study, 57post-publication study, 56predictive, 56relationship of STAR Reading scores to state
tests, 41summary of validity data, 68UK study results, 64
Vocabulary lists, 12Vocabulary-in-context item specifications, 13
2
Index
WWCPM (words correctly read per minute), 62
ZZPD (Zone of Proximal Development), 34, 76
11Star Assessments™ for ReadingTechnical Manual
3
About Renaissance
Renaissance® transforms data about how students learn into instruments of empowerment for classroom teachers, enabling them to guide all students to achieve their full potentials. Through smart, data-driven educational technology solutions that amplify teachers’ effectiveness, Renaissance helps teachers teach better, students learn better and school administrators lead better. By supporting teachers in the classroom but not supplanting them, Renaissance solutions deliver tight learning feedback loops: between teachers and students, between assessment of skills mastery and the resources to spur progress and between each student’s current skills and future academic growth.
R43849.180807
© Copyright 2018 Renaissance Learning, Inc. All rights reserved. +44 (0)20 7184 4000 www.renlearn.co.uk
All logos, designs and brand names for Renaissance’s products and services, including, but not limited to, Accelerated Maths, Accelerated Reader, English in a Flash, MathsFacts in a Flash, myON, myON Reader, myON News, Renaissance, Renaissance Learning, Renaissance Place, Star Maths, Star Assessments, Star Early Literacy and Star Reading are trademarks of Renaissance. All other product and company names should be considered the property of their respective companies and organisations.
Fremont | London | Madison | Minneapolis | New York | Sydney | Toronto | Vancouver | Wisconsin Rapids