Embed Size (px)
Citation preview

Page 1
London, October 3 rd 2007
STAR CONFERENCE 2007 PRESENTATION
Page 2
Business Overview
Strategy
Financial highlights
Dividends
Annexes
CONTENTS
Page 3
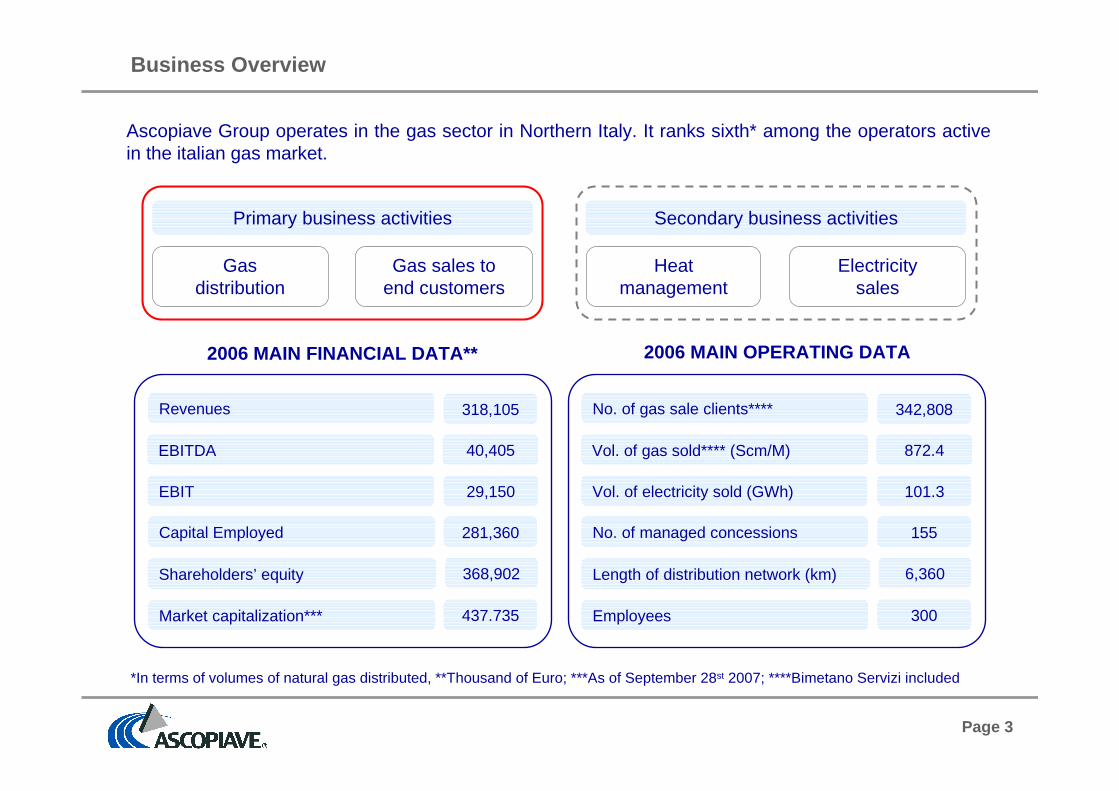
Business Overview
2006 MAIN FINANCIAL DATA** 2006 MAIN OPERATING DATA
Ascopiave Group operates in the gas sector in Northern Italy. It ranks sixth* among the operators activein the italian gas market.
*In terms of volumes of natural gas distributed, **Thousand of Euro; ***As of September 28st 2007; ****Bimetano Servizi included
No. of gas sale clients**** 342,808
Vol. of gas sold**** (Scm/M) 872.4
Vol. of electricity sold (GWh) 101.3
No. of managed concessions 155
Length of distribution network (km) 6,360
Employees 300
Primary business activities
Gas sales toend customers
Gasdistribution
Secondary business activities
Electricitysales
Heatmanagement
Revenues 318,105
EBITDA 40,405
EBIT 29,150
Capital Employed 281,360
Shareholders’ equity 368,902
Market capitalization*** 437.735
Page 4
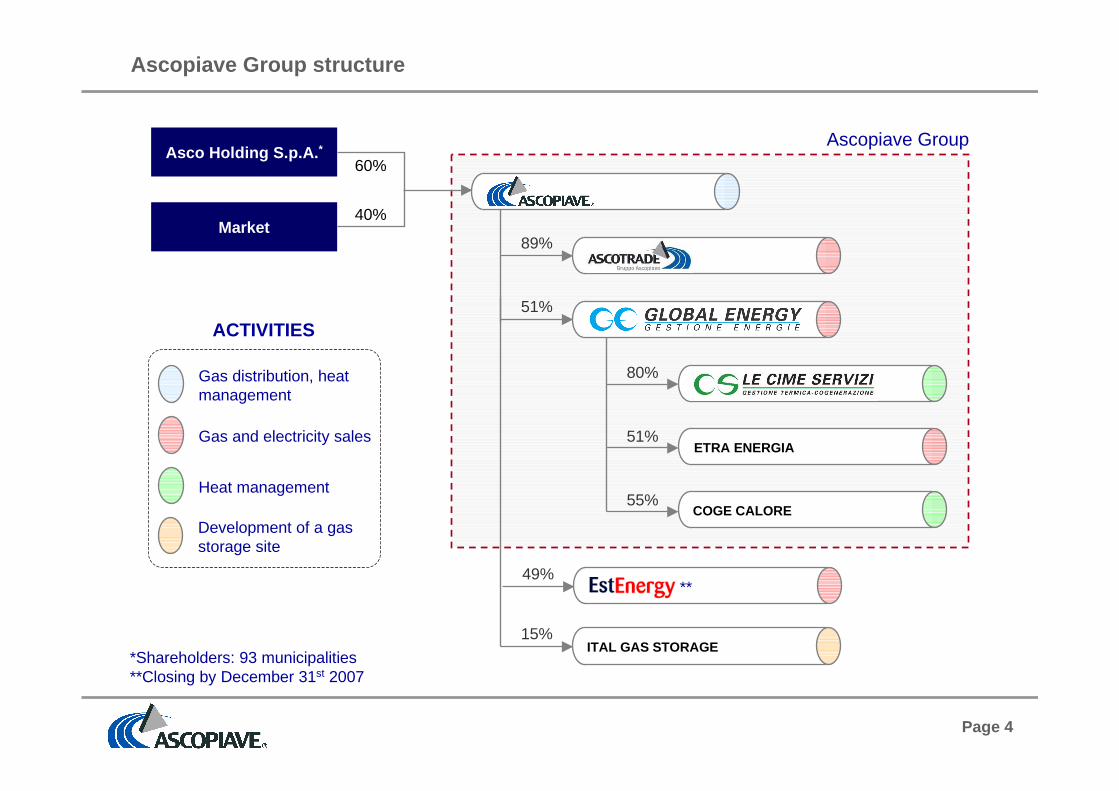
Ascopiave Group
Ascopiave Group structure
60%
40%
Asco Holding S.p.A. *
Market
*Shareholders: 93 municipalities**Closing by December 31st 2007
ACTIVITIES
Development of a gasstorage site
89%
51%
80%
15%ITAL GAS STORAGE
49%
ETRA ENERGIA51%
COGE CALORE55%
Gas distribution, heatmanagement
Heat management
Gas and electricity sales
**
Page 5
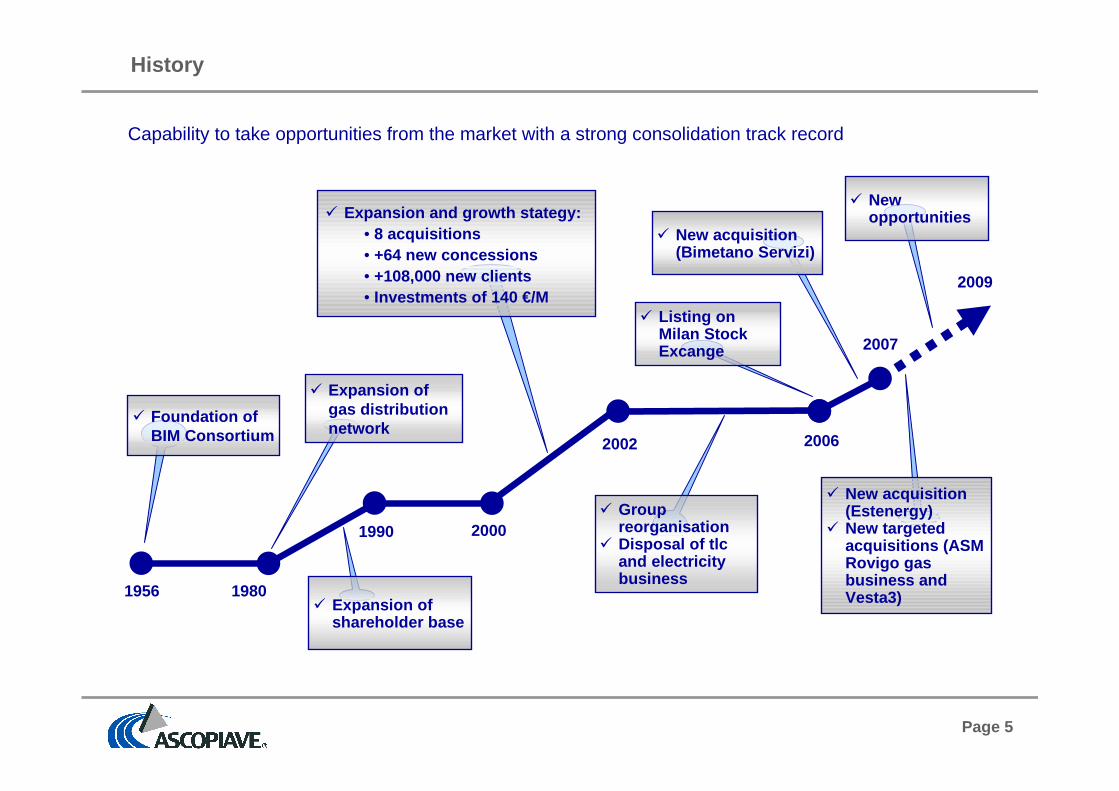
History
1956 1980
2000
2002 2006
2009
1990
� Expansion and growth stategy:• 8 acquisitions• +64 new concessions• +108,000 new clients• Investments of 140 €/M
� Expansion ofshareholder base
� Foundation ofBIM Consortium
� Expansion ofgas distributionnetwork
� Groupreorganisation
� Disposal of tlcand electricitybusiness
� Newopportunities
� Listing onMilan StockExcange 2007
� New acquisition(Bimetano Servizi)
Capability to take opportunities from the market with a strong consolidation track record
� New acquisition(Estenergy)
� New targetedacquisitions (ASMRovigo gasbusiness andVesta3)
Page 6
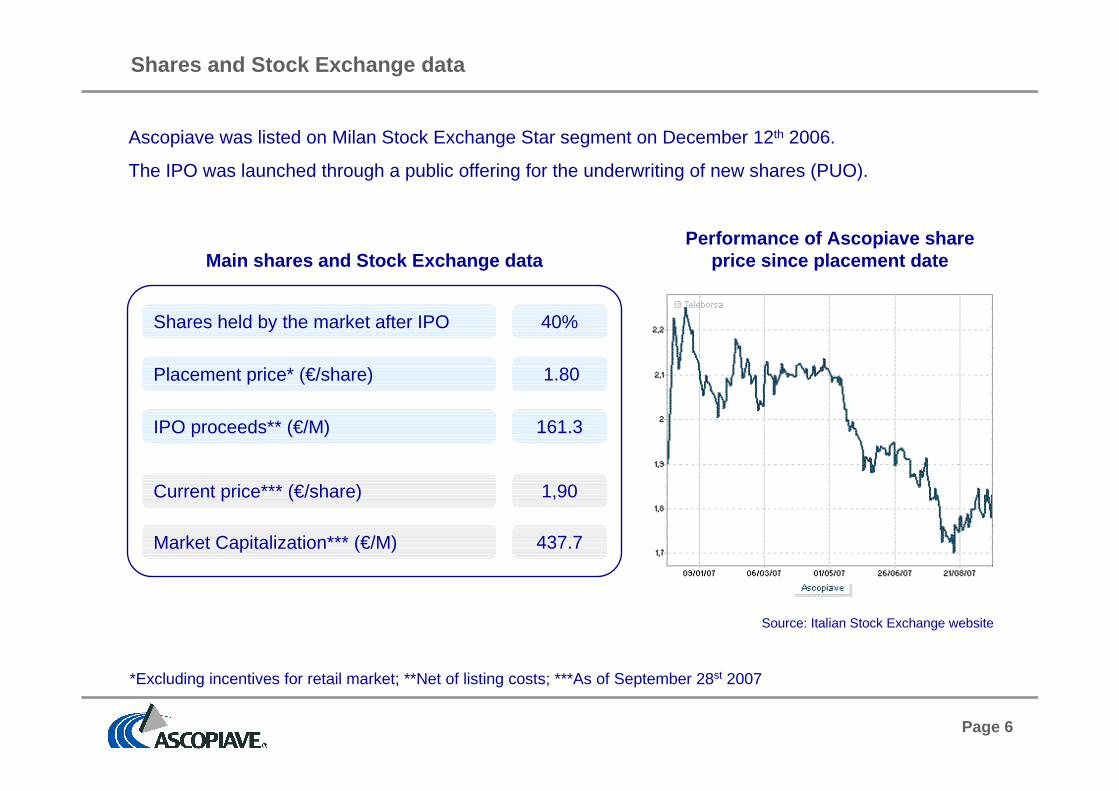
Shares and Stock Exchange data
*Excluding incentives for retail market; **Net of listing costs; ***As of September 28st 2007
Source: Italian Stock Exchange website
Performance of Ascopiave shareprice since placement dateMain shares and Stock Exchange data
Shares held by the market after IPO 40%
Placement price* (€/share) 1.80
IPO proceeds** (€/M) 161.3
Ascopiave was listed on Milan Stock Exchange Star segment on December 12th 2006.
The IPO was launched through a public offering for the underwriting of new shares (PUO).
Current price*** (€/share) 1,90
Market Capitalization*** (€/M) 437.7
Page 7
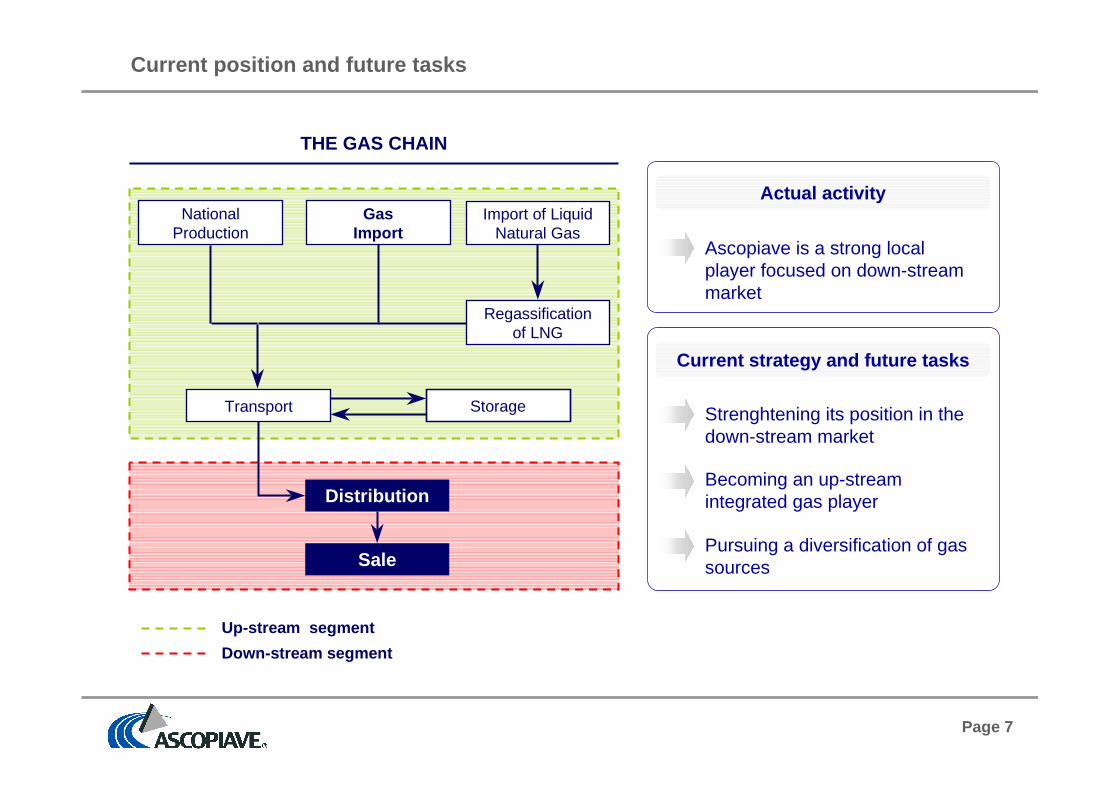
Current position and future tasks
THE GAS CHAIN
Up-stream segment
Down-stream segment
NationalProduction
Import of LiquidNatural Gas
Transport
Regassificationof LNG
Storage
GasImport
Distribution
Sale
Actual activity
Current strategy and future tasks
Ascopiave is a strong localplayer focused on down-streammarket
Strenghtening its position in thedown-stream market
Becoming an up-streamintegrated gas player
Pursuing a diversification of gassources
Page 8
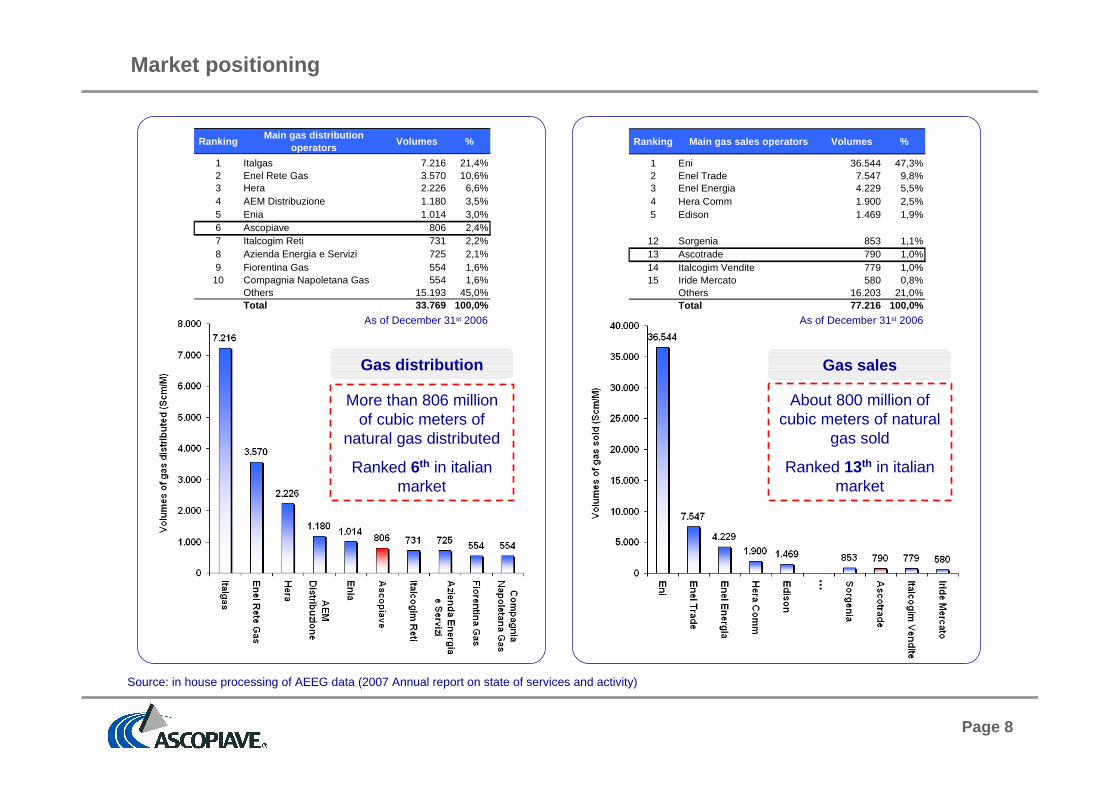
Market positioning
Source: in house processing of AEEG data (2007 Annual report on state of services and activity)
As of December 31st 2006 As of December 31st 2006
More than 806 millionof cubic meters of
natural gas distributed
Ranked 6th in italianmarket
Gas distribution
...
About 800 million ofcubic meters of natural
gas sold
Ranked 13th in italianmarket
Gas sales
RankingMain gas distribution
operatorsVolumes %
1 Italgas 7.216 21,4%2 Enel Rete Gas 3.570 10,6%3 Hera 2.226 6,6%4 AEM Distribuzione 1.180 3,5%5 Enia 1.014 3,0%6 Ascopiave 806 2,4%7 Italcogim Reti 731 2,2%8 Azienda Energia e Servizi 725 2,1%9 Fiorentina Gas 554 1,6%
10 Compagnia Napoletana Gas 554 1,6%Others 15.193 45,0%Total 33.769 100,0%
Ranking Main gas sales operators Volumes %
1 Eni 36.544 47,3%2 Enel Trade 7.547 9,8%3 Enel Energia 4.229 5,5%4 Hera Comm 1.900 2,5%5 Edison 1.469 1,9%
12 Sorgenia 853 1,1%13 Ascotrade 790 1,0%14 Italcogim Vendite 779 1,0%15 Iride Mercato 580 0,8%
Others 16.203 21,0%Total 77.216 100,0%
Page 9
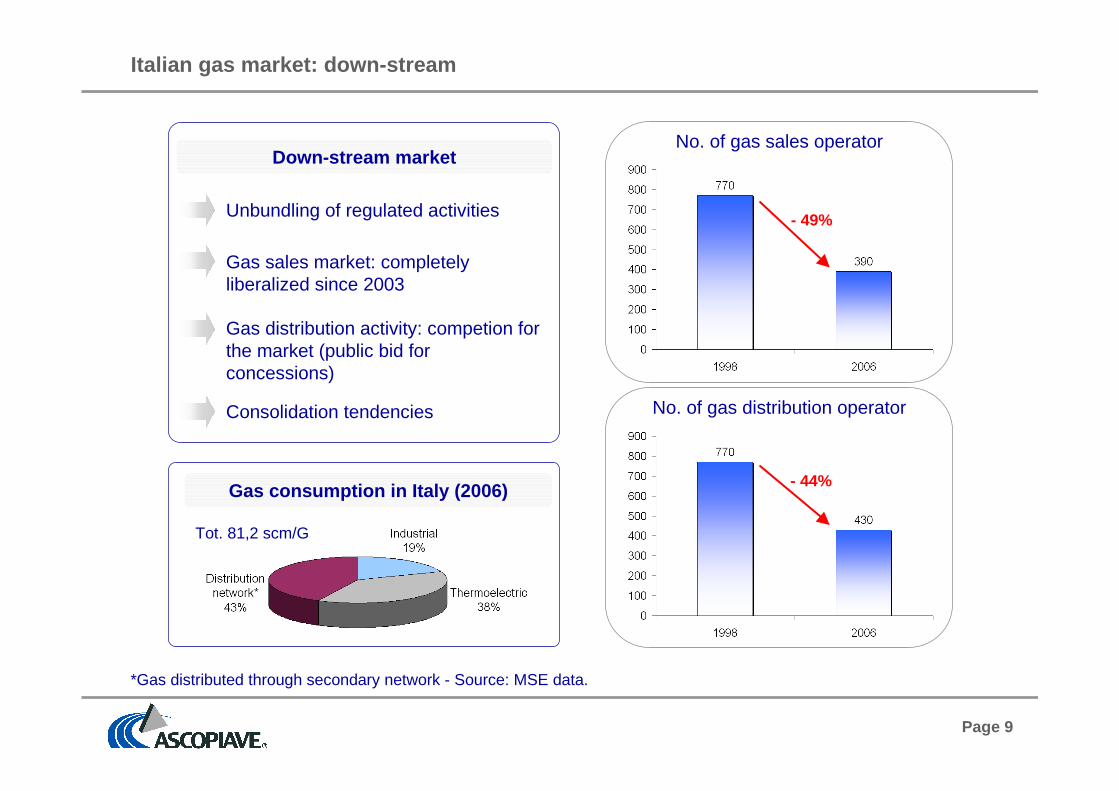
Italian gas market: down-stream
Down-stream market
- 49%
No. of gas sales operator
No. of gas distribution operator
- 44%
Consolidation tendencies
Gas distribution activity: competion forthe market (public bid forconcessions)
Gas sales market: completelyliberalized since 2003
Unbundling of regulated activities
Gas consumption in Italy (2006)
*Gas distributed through secondary network - Source: MSE data.
Tot. 81,2 scm/G

Page 10
Number Populations* Network (km)**
Award from Asco Holding member municipalities 92 631.992 3,710Concessions from other municipalities 62 356.793 2,644
Total 154 988.785 6,354
Gas distribution: Ascopiave concessions as of Septe mber 30 th 2007
*Data as of December 31th 2006, Source: ISTAT; **Data as of June 30th 2007; ***Including a municipality where Ascopiavehas left the concession
60% of concessions from shareholder municipalities
81% of users on concessions expiring beyond 2010
% o
f use
rs
Concessions from Asco Holding Shareholders
Concessions from other municipalities
No. ofconcessions
6*** 2 13 28 92 14
Page 11
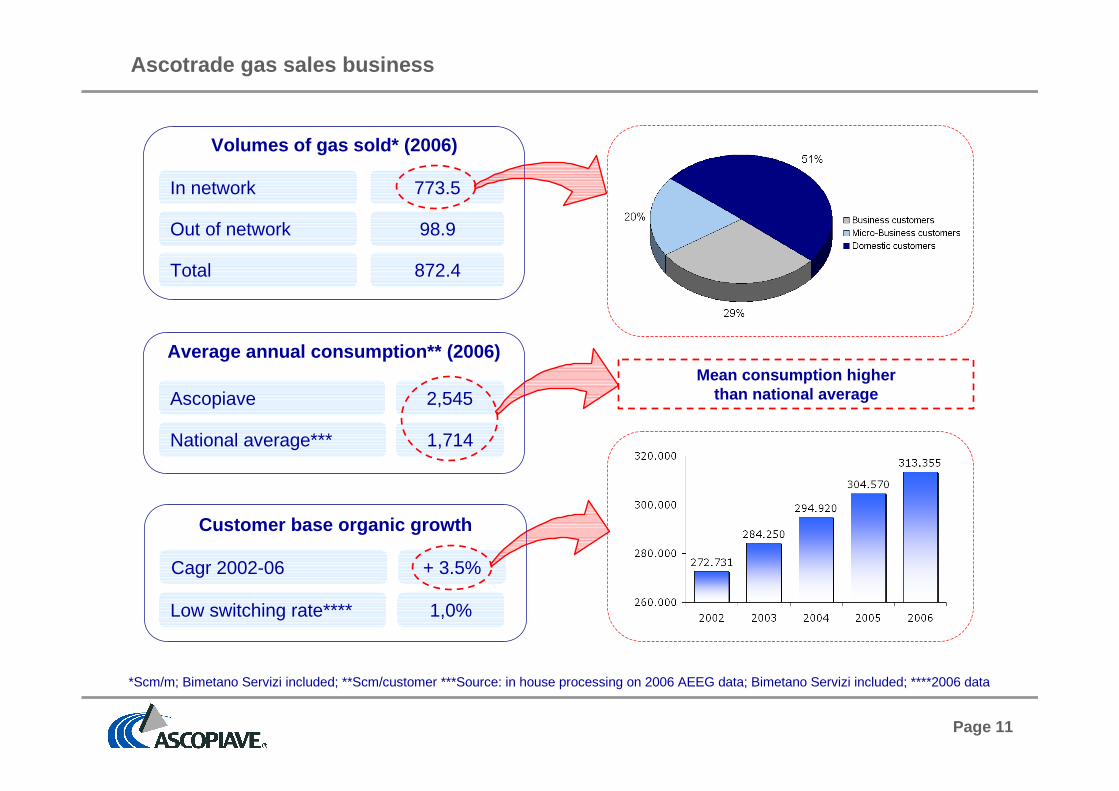
Ascotrade gas sales business
Mean consumption higherthan national average
*Scm/m; Bimetano Servizi included; **Scm/customer ***Source: in house processing on 2006 AEEG data; Bimetano Servizi included; ****2006 data
Volumes of gas sold* (2006)
In network
Out of network
Total
773.5
98.9
872.4
Ascopiave
National average***
2,545
1,714
Average annual consumption** (2006)
Cagr 2002-06
Low switching rate****
+ 3.5%
1,0%
Customer base organic growth
Page 12
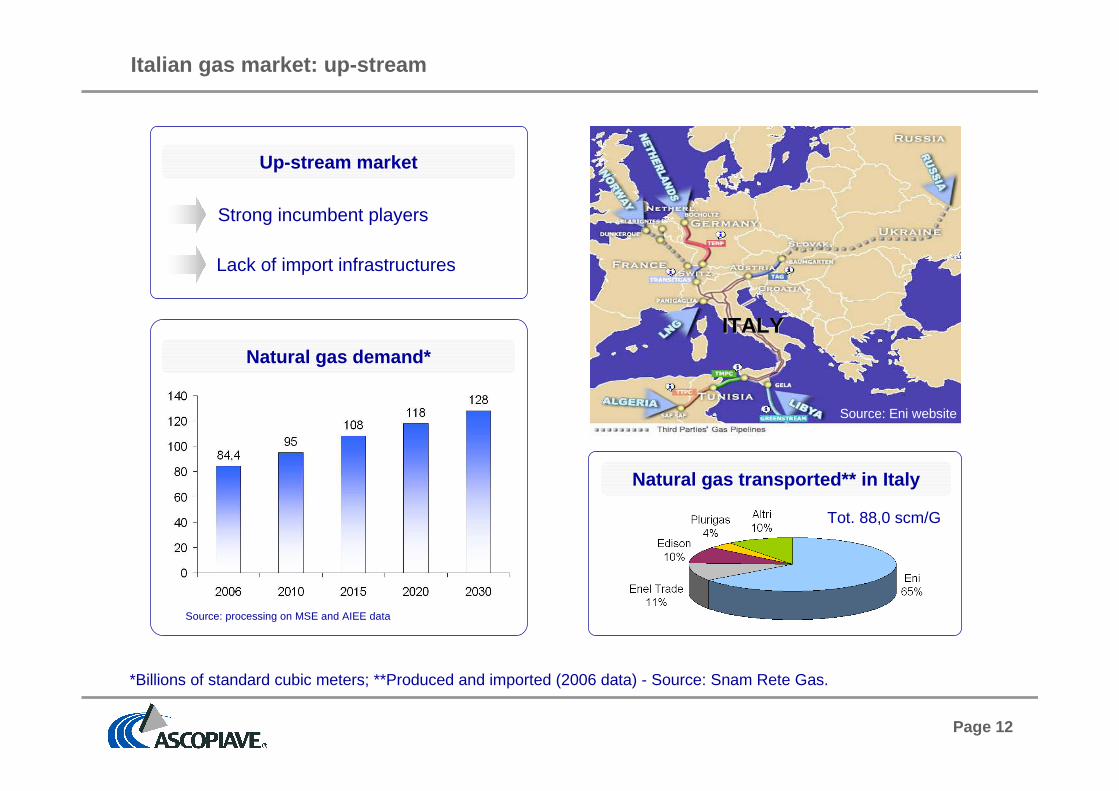
Italian gas market: up-stream
ITALYITALY
Source: Eni website
Up-stream market
Lack of import infrastructures
Strong incumbent players
Natural gas demand*
Source: processing on MSE and AIEE data
*Billions of standard cubic meters; **Produced and imported (2006 data) - Source: Snam Rete Gas.
Natural gas transported** in Italy
Tot. 88,0 scm/G
Page 13
CONTENTS
Business Overview
Strategy
Financial highlights
Dividends
Annexes

Page 14
Strategic guidelines
Strategic guidelines :
taking advantage of opportunities arising from the liberalisation of the gas market, includingopportunities in the national and international gas wholesale, transportation and storage market
consolidating its presence as a utility provider in northern Italy, by rationalising and optimising itsoperating process and increasing its efficiency through economies of scale
Up-stream integration
Participation inthe consolidation
processGrowth
p
p
Page 15
Growth objectives
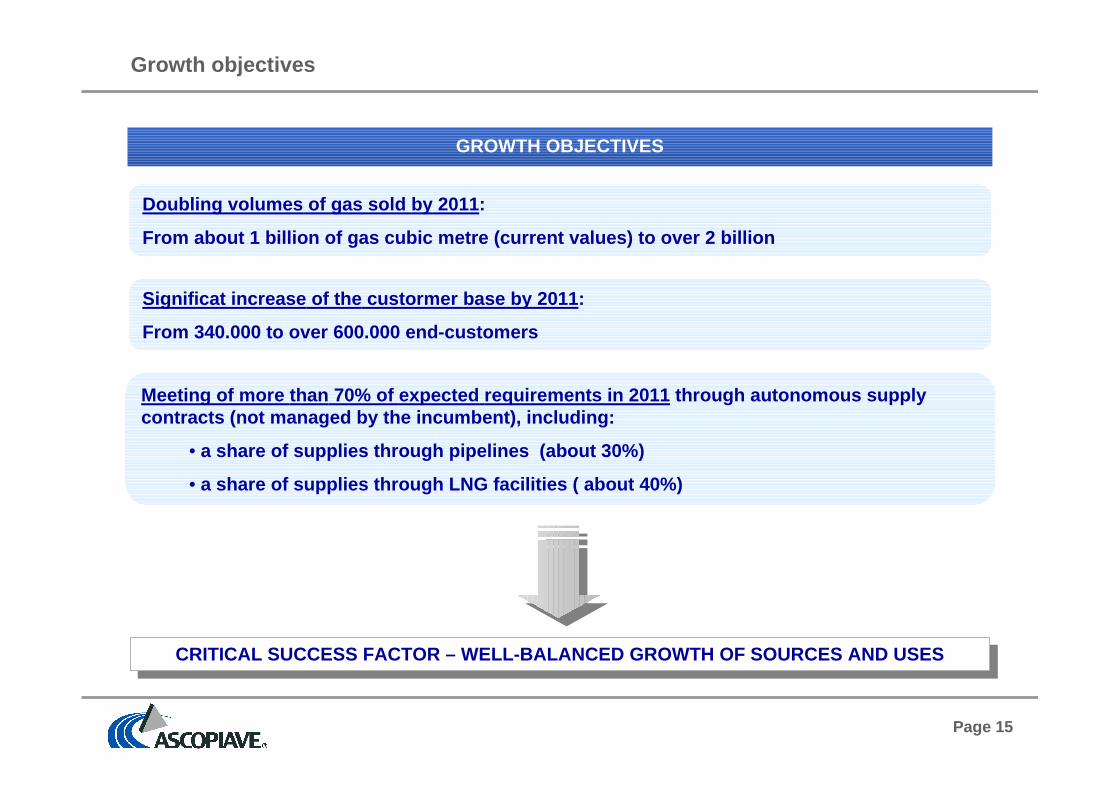
CRITICAL SUCCESS FACTOR – WELL-BALANCED GROWTH OF S OURCES AND USESCRITICAL SUCCESS FACTOR – WELL-BALANCED GROWTH OF S OURCES AND USES
GROWTH OBJECTIVES
Doubling volumes of gas sold by 2011:
From about 1 billion of gas cubic metre (current va lues) to over 2 billion
Meeting of more than 70% of expected requirements in 2011 through autonomous supplycontracts (not managed by the incumbent), including :
• a share of supplies through pipelines (about 30%)
• a share of supplies through LNG facilities ( about 40%)
Significat increase of the custormer base by 2011 :
From 340.000 to over 600.000 end-customers

Page 16
Swot analysis
WeaknessWeakness
� Not present in upstream gas market
� Dependence on incumbent gas imports
� Limited knowledge of the brand outside the regionserviced
� Electric business in start-up phase
� Regulatory uncertainty (e.g. Res. N. 248/04, etc.)
� Conflicts within the gas chain
� Entrance and consolidation of foreign groups and m ajorItalian utilities
� Competitive pressure increase and attacks from newentrants
� Enel’s role in dual-fuel market
� Gas concessions expiring (2009/2010)
� Total market ‘opening’ (also for electricity, as of 1 July2007) – Cross selling on customer base
� Infrastructure development projects likely to incr easethe country’s gas importing capacity and createbusiness opportunities abroad
� Trends towards a liquid market in the medium term(establishment of the Gas Exchange)
� Temporary push towards aggregations of companies –increase in geographical coverage by expanding thecorporate structure
� Tenders for gas distribution concessions
� Strong liquidity and high investment potentials (wi th‘third party access’ exemption right)
� Large end customer base
� Deeply rooted presence in reference geographical a rea
� Strong local brand reputation
� Local Authorities are stakeholders in the Group
� High degree of customer loyalty
StrengthsStrengths
ThreatsThreatsOpportunitiesOpportunities

Page 17
Up-stream integration (1)
� Long-term gas supply contracts with international operators
� Targeted acquisition of capabilities in terms of gas transportation infrastructures into Italy
� Trading operations in Italy (transactions at the border and “PSV”) and abroad
� Investments in new storage sites (i.e. acquisition of shares in viable companies)
� Investments in new LNG plants (i.e. acquisition of shares in viable companies)
� Investments in foreign gas exploitation and production business (i.e. acquisition of shares in viablecompanies)
Integration within the gas chain (both mid-stream a nd up-stream) to ensure gas supply fullautonomy and reliability, alongside with an efficie nt cost structure and a competitive edgeon the market

Page 18
Gas ImportGas Import p Signing an agreement with Sonatrach for 500Scm/M of gas
Up-stream integration (2)
Gas wholesale andtrading
Gas wholesale andtrading
p Wholesales tradingp Foreign tradingp Autonomous structuring of the operations along
the value chain
Acquisition of storagecapacity
Acquisition of storagecapacity
p Ital Gas Storage acquisition completed in may2006
p Ital Gas Storage is active in gas storage inCornegliano
Other upstreamprojects
Other upstreamprojects
p Participation in initiative of other gas pipelines
p Considering acquisition of a qualified stake in re-gasification terminals
1
2
3
4
Page 19
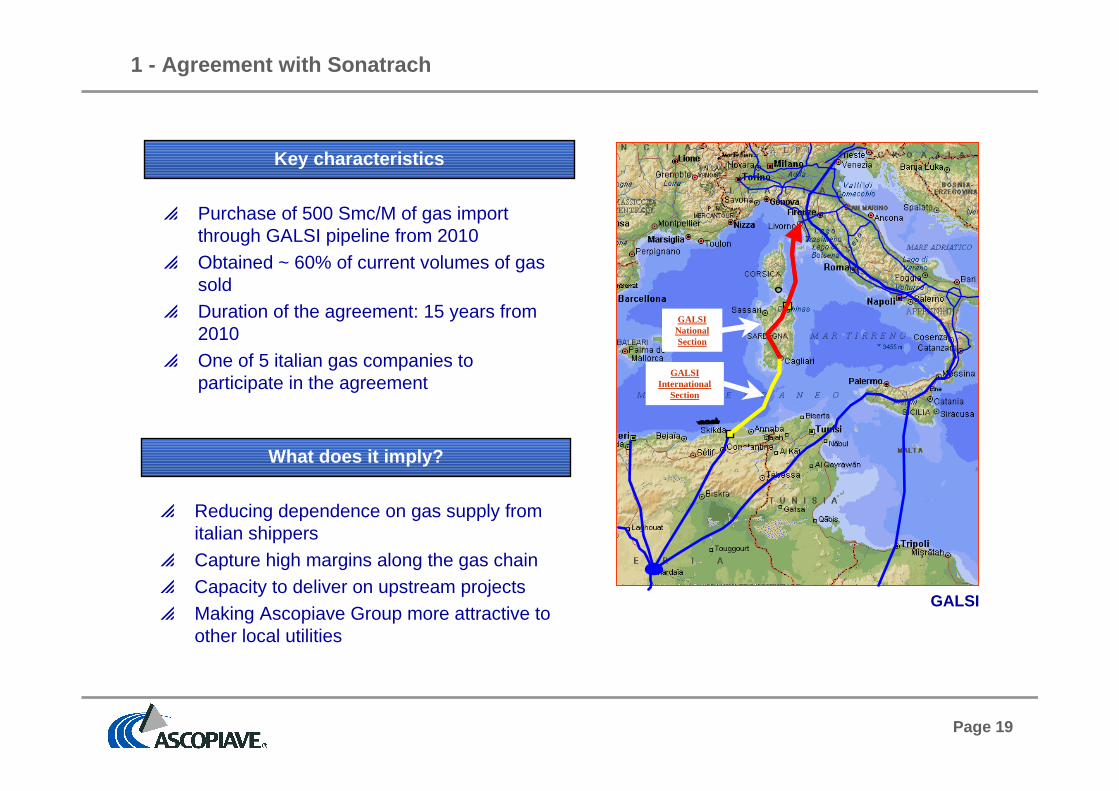
p Purchase of 500 Smc/M of gas importthrough GALSI pipeline from 2010
p Obtained ~ 60% of current volumes of gassold
p Duration of the agreement: 15 years from2010
p One of 5 italian gas companies toparticipate in the agreement
1 - Agreement with Sonatrach
p Reducing dependence on gas supply fromitalian shippers
p Capture high margins along the gas chainp Capacity to deliver on upstream projectsp Making Ascopiave Group more attractive to
other local utilities
Key characteristics
What does it imply?
GALSI
GALSINationalSection
GALSIInternational
Section
Page 20
2 - Gas wholesale and trading (1)
Objectives of the new activities
Entering new segments of the value chain capturing extramargins
Increasing and stabilizing gas sale volumes
Maximizing margin on traditional activities

Page 21
2 - Gas wholesale and trading (2)
~ 50 million of scm – Y 2007Foreign trading
~ 750 million of scm – Y 2007-2008Import spot
120 million of scm – Y 2007-2009Gas release
Autonomous management of logistic operations
~ 150 million of scm – Y 2007-2008Trading at “PSV”
~ 300 million of scm – Y 2007-2008Wholesales
~ 120 million of scm – Y 2008-2029Acquisition of transportation capacity on existinginternational pipelines

Page 22
3 - Gas storage
Storage technical characteristics
Working gas (Scm/M) 590-1,010
Cushion gas (Scm/M) 900
Maximum storage capacity (Scm/M) 1,910
Maximum daily use (Scm/M) 16.5
Investments expected (€/M) 400*
Ital Gas Storage
is active in gas storage in Cornegliano
acquisition completed in May 2006
ITALYLOMBARDY
Cornegliano
*220 €/M of cushion gas.

Page 23
4 - Import infrastructures and new projects
Eni2Greenstream
Endesa8Trieste
Nuove Energie Srl8P.Emped.
Gas Natural
Gas Natural
Erg, Shell
Cross Energy
Edison, BP
OLT, Endesa,AMGA
BG
Edison, QP Exxonl
Eni
Eni
Edison, Depa
Sonatrach, Edison,Enel, Wintershall, Hera
Operator
>110Total
8Zaule
8Taranto
8Priolo Augusta
12Gioia Tauro
8Rosignano
4Livorno
8Brindisi
8Rovigo
3,2 +3,3Rep. TTPC
3,2 +3,3Rep. TAG
8IGI
8/10GALSI
CapacityPlan
National production declining from 10.9Scm/G in 2006 to 4.3 Scm/G in 2012
+6.5 Gmc31 Gmc
+ 6.5 Gmc27 Gmc
TRANSMED/TTPC
BG/Brindisi
8 Gmc
Edison/Rovigo
8 Gmc
Gas NaturalTaranto
8 Gmc
GasNaturalTrieste8 Gmc
CrossEnergy
Gioia Tauro
12 Gmc
Olt Livorno
4 Gmc
GALSI
8/10 Gmc
Edison/BPRosignano
8 Gmc
Erg,Shell/Priolo
8 Gmc
8-12 Gmc
Endesa Trieste
1,5 Gmc
PIPELINESlovenia
GREENSTREAM
8 Gmc+ 2 Gmc
P. Empedocle
8 Gmc
18 Gmc
PIPELINENetherlands/
Norway
4 Gmc
ENI Panigaglia
8 Gmc
IGI
Projected pipelines
Current pipelines Current LNG terminals
Projected LNG Terminals

Page 24
Growth in size through a significant expansion of i ts customer base
Growth in the gas down-stream market (1)
Increase number ofclients and
concessionsmanaged
Increase number ofclients and
concessionsmanaged
p Participation in competitive bidding for the awardof contracts to manage the gas distribution service
p An integrated service offer with a dual fuel salespolicy (a joint commercial proposal for gas andelectricity)
p Make selective acquisitions
Natural gas market (2006)
*Through secondary network; data in Scm/M
Italy "Triveneto"
Number of gas distributors 416 61
Number of gas concessions 5,861 832
Number of gas customers 20,214,000 2,500,000
Volumes of gas distributed* 34,656 5,784
Length of the distribution network (km) 225,792 38,26 0

Page 25
Growth in the gas down-stream market (2)
1. Acquisitions(both gas distributionand sales business)
Gas saleCompany A
Gas saleCompany B
Gas saleCompany N
AscopiaveS.p.A.
EstenergyS.p.A.
AscotradeS.p.A.
…
2. Acquisitions(only gas sales
business)
Model
3. Partnershipon sales activity
AscotradeS.p.A.
Partner A
Partner B
Partner N
BimetanoServizi S.r.l.
AscopiaveS.p.A.
…
> 50%
Model
AscopiaveS.p.A.
…
Model
Gas saleCompany A
Gas distributionCompany A
Gas saleCompany N
Gas distributionCompany N

Page 26
Growth in the gas down-stream market (3)
Concluded deal
Deals Customers Gas sold
Acquisition of Bimetano Servizi gas sale business + 29,453 + 82 scm/M
Acquisition of a 51% stake in Global Energy Start-up n.a.
Establishment of Etra Energia Start-up n.a.
Acquisition of a 49% stake in Estenergy + 243,237 + 512 scm/M
Total concluded deals + 272,690 + 594 scm/M
To be negotiated
Deals Customers Gas sold
Vesta3 + Spim Energia + 18,462 + 49 scm/M
ASM Set + 24,526 + 55 scm/M
Total to be negotiated deals + 42,988 + 104 scm/M
Total + 315,678 + 698 scm/M
Ascopiave before operations + 313,355 + 790 scm/M
Change % + 100.7% + 88.4%
Page 27
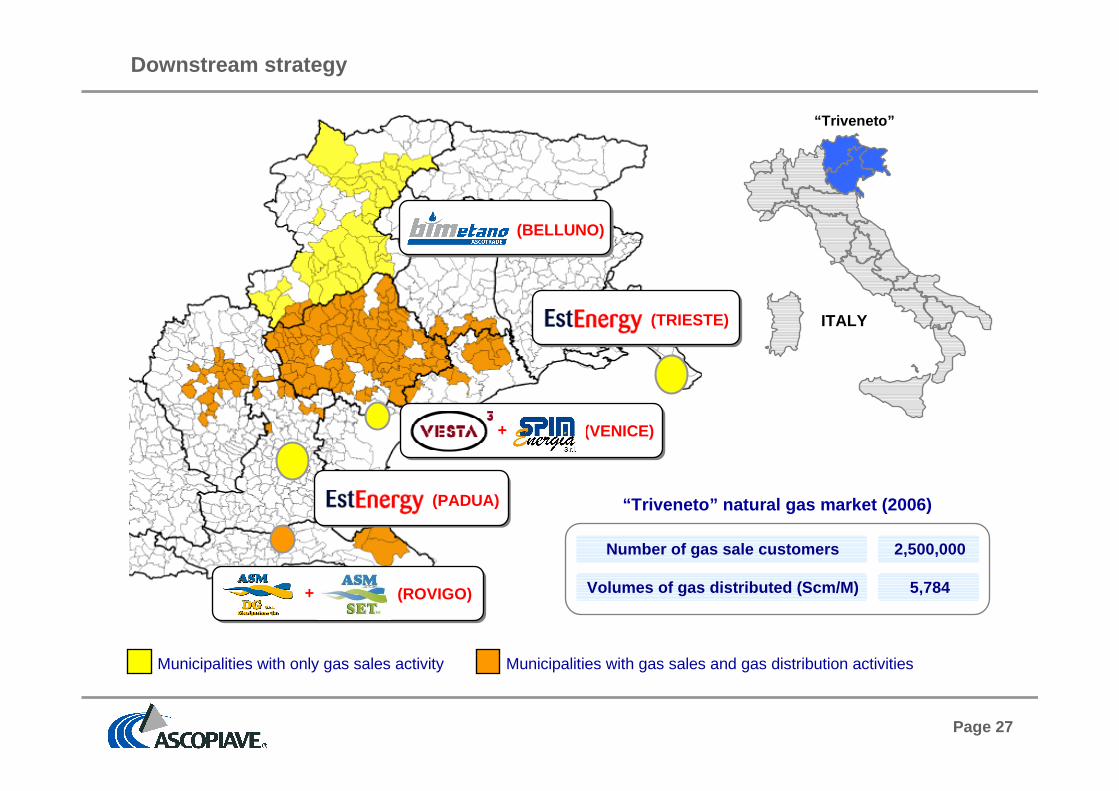
Municipalities with only gas sales activity Municipalities with gas sales and gas distribution activities
(TRIESTE)
(BELLUNO)
Downstream strategy
“Triveneto”
ITALY
“Triveneto” natural gas market (2006)
Number of gas sale customers 2,500,000
Volumes of gas distributed (Scm/M) 5,784
(PADUA)
(VENICE) +
+ (ROVIGO)

Page 28
Operation Estenergy (1)
As of September 13th 2007, Ascopiave has signed an agreement with Acegas-APS S.p.A. for theacquisition of a quota of 49% of Estenergy S.p.A., the gas sale company controlled by Acegas-APS.
100%
89%
BEFORE THE OPERATION...
49%
51%
...AFTER THE OPERATION
Estenergy Ascotrade Aggregated Chg %
No. of gas sale customers 243.237 342.808 586.045 71%
Volumes of gas sales (Mcm) 512 872 1.385 59%
89%
Page 29
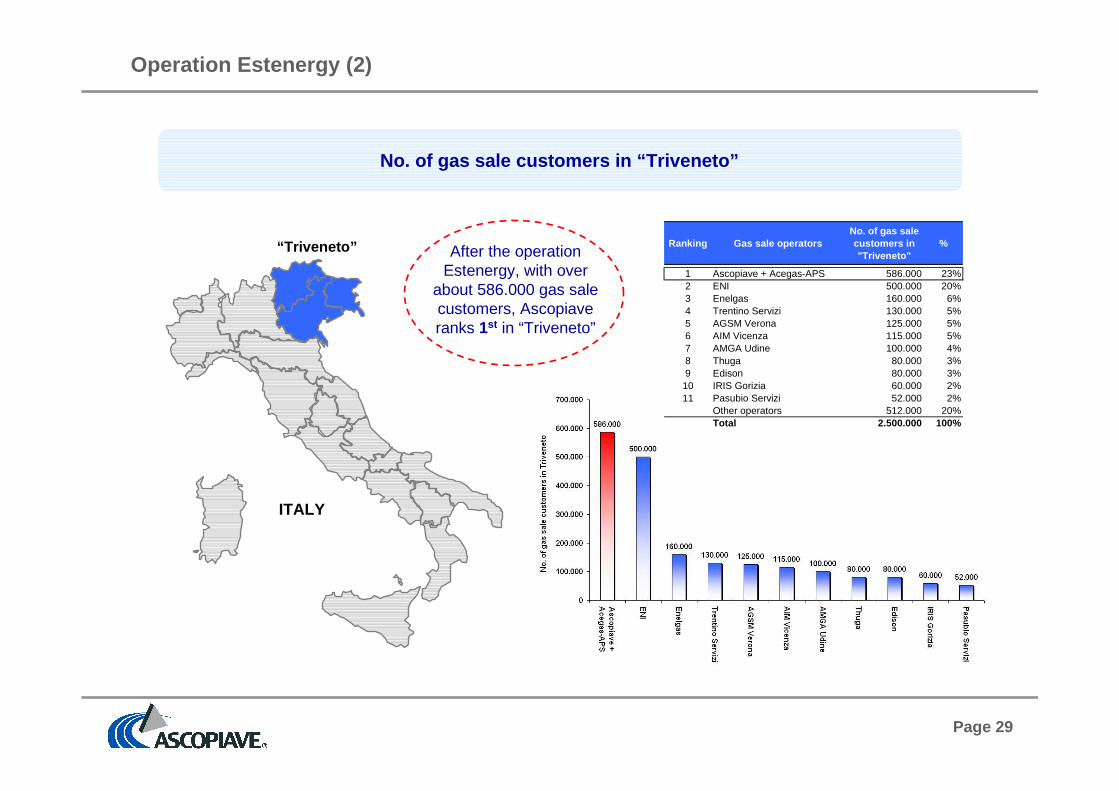
Operation Estenergy (2)
No. of gas sale customers in “Triveneto”
After the operationEstenergy, with over
about 586.000 gas salecustomers, Ascopiaveranks 1st in “Triveneto”
“Triveneto”
ITALY
Ranking Gas sale operatorsNo. of gas sale customers in "Triveneto"
%
1 Ascopiave + Acegas-APS 586.000 23%2 ENI 500.000 20%3 Enelgas 160.000 6%4 Trentino Servizi 130.000 5%5 AGSM Verona 125.000 5%6 AIM Vicenza 115.000 5%7 AMGA Udine 100.000 4%8 Thuga 80.000 3%9 Edison 80.000 3%10 IRIS Gorizia 60.000 2%11 Pasubio Servizi 52.000 2%
Other operators 512.000 20%Total 2.500.000 100%

Page 30
Operation Estenergy (3)
Volumes of natural gas sold in Italy
After the operationEstenergy, with over about1,4 billion of cubic meters
sold, Ascopiave ranks 6th inItaly
ITALY
Ranking Gas sale operatorVolumes of gas sold in
Italy%
1 Eni 36.544 47%2 Enel Trade 7.547 10%3 Enel Energia 4.229 5%4 Hera Comm 1.900 2%5 Edison 1.469 2%6 Ascopiave + Acegas-APS 1.385 2%7 Gaz de France 1.142 1%8 E.ON Vendita 1.117 1%9 Plurigas 1.059 1%
10 AEM Acquisto e Vendita Energia 1.014 1%11 Blumet 1.003 1%12 Toscana Energia Clienti 987 1%
Other 18.415 24%Total 77.811 100%
Page 31
CONTENTS
Business Overview
Strategy
Financial highlights
Dividends
Annexes
Page 32
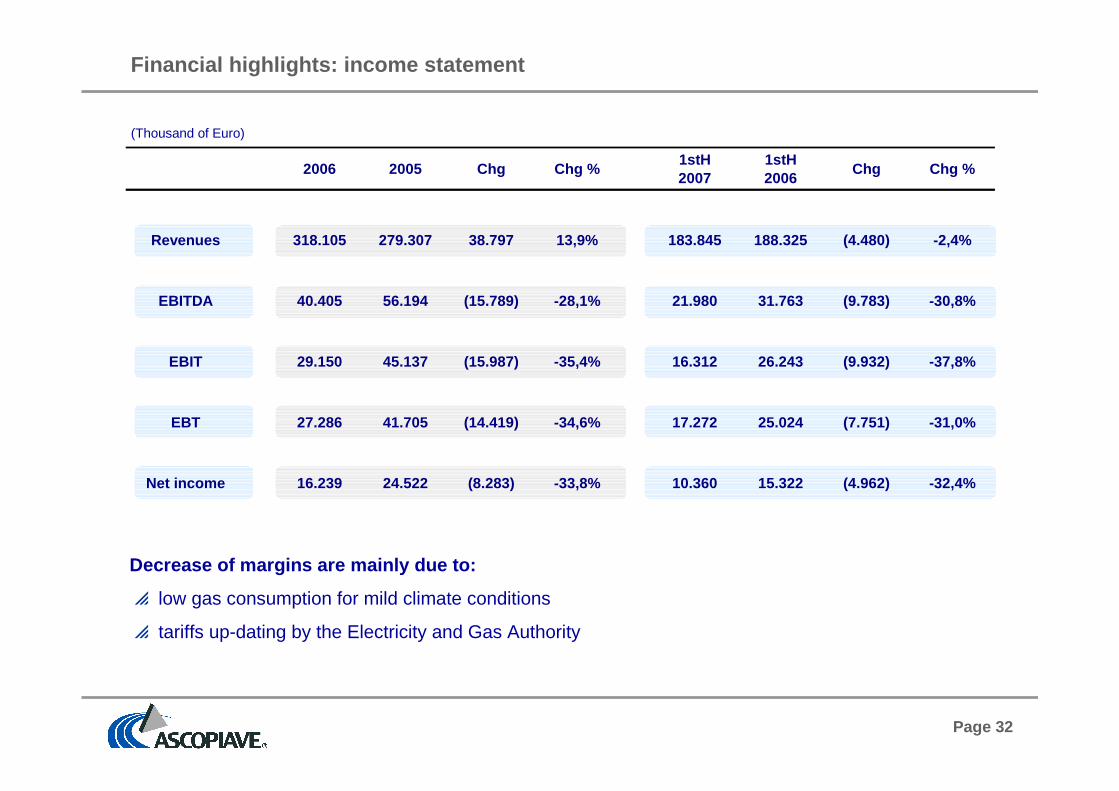
Financial highlights: income statement
(Thousand of Euro)
2006 2005 Chg Chg %1stH2007
1stH2006
Chg Chg %
Revenues 318.105 279.307 38.797 13,9% 183.845 188.325 (4.4 80) -2,4%
EBITDA 40.405 56.194 (15.789) -28,1% 21.980 31.763 (9.783) -30,8%
EBIT 29.150 45.137 (15.987) -35,4% 16.312 26.243 (9.932) -37,8%
EBT 27.286 41.705 (14.419) -34,6% 17.272 25.024 (7.751) -31,0%
Net income 16.239 24.522 (8.283) -33,8% 10.360 15.322 (4.9 62) -32,4%
Decrease of margins are mainly due to:
p low gas consumption for mild climate conditions
p tariffs up-dating by the Electricity and Gas Authority

Page 33
Financial highlights: balance sheet
(Thousand of Euro)
*Negative values of the Net Financial Position indicate that the Group has a positive liquidity balance
31/12/06 31/12/05 Chg Chg % 30/06/07 31/12/06 Chg Chg %
Capital employed 281.361 284.574 (3.213) -1,1% 306.924 281.361 25.563 9,1%
Shareholders equity 368.902 194.586 174.316 89,6% 365.708 368.902 (3.194) -0,9%
Net financial position* (87.541) 89.988 (177.529) -197,3% (58.784) (87.541) 28.757 -32,9%
Page 34
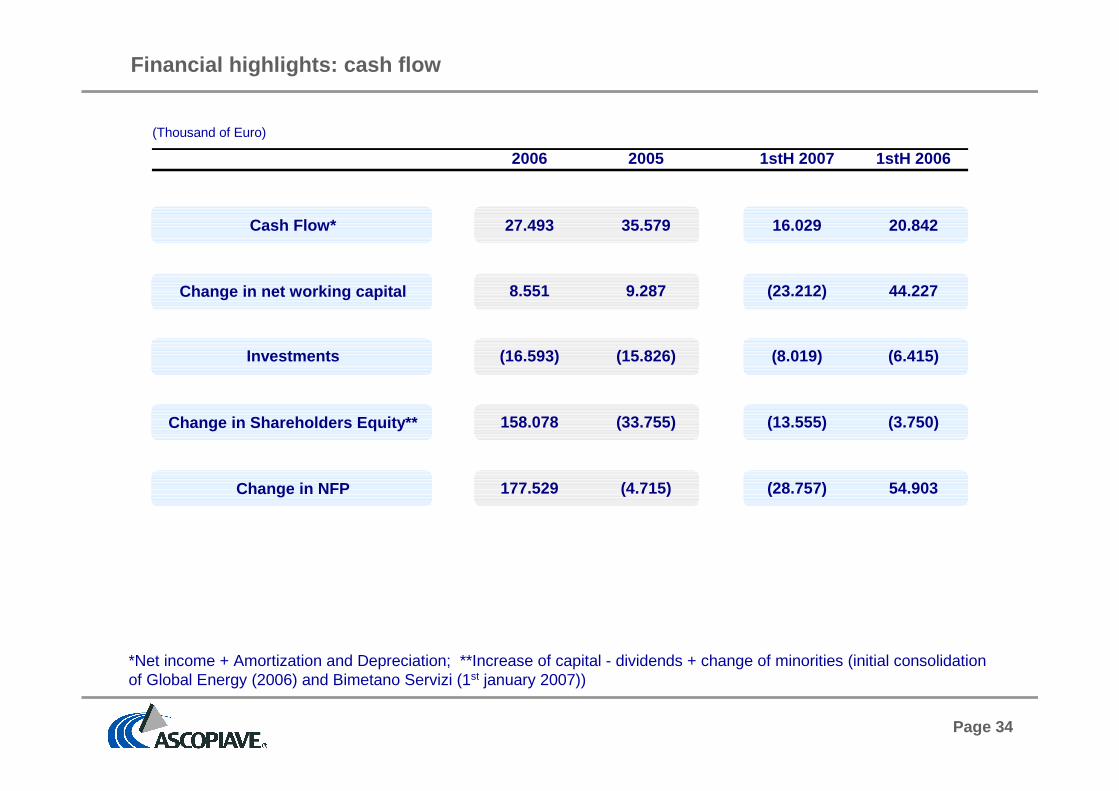
Financial highlights: cash flow
*Net income + Amortization and Depreciation; **Increase of capital - dividends + change of minorities (initial consolidationof Global Energy (2006) and Bimetano Servizi (1st january 2007))
(Thousand of Euro)
2006 2005 1stH 2007 1stH 2006
Cash Flow* 27.493 35.579 16.029 20.842
Change in net working capital 8.551 9.287 (23.212) 44.227
Investments (16.593) (15.826) (8.019) (6.415)
Change in Shareholders Equity** 158.078 (33.755) (13.555) (3.750)
Change in NFP 177.529 (4.715) (28.757) 54.903
Page 35
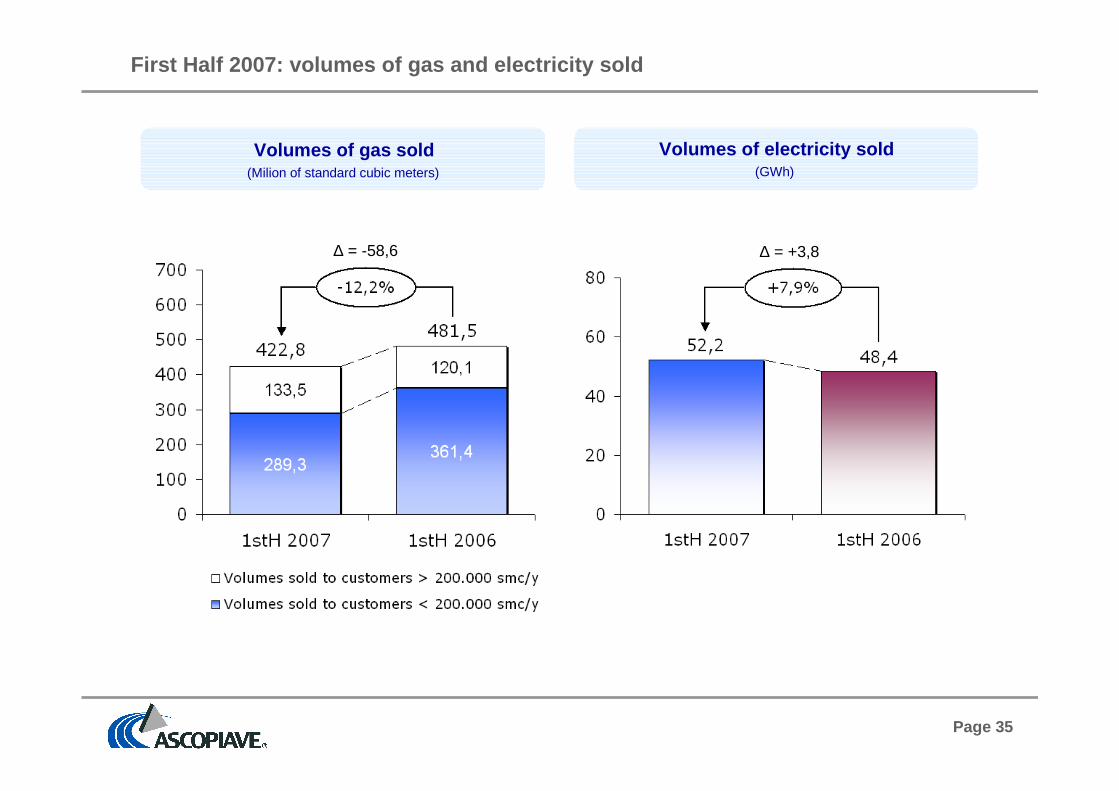
First Half 2007: volumes of gas and electricity sol d
Volumes of gas sold(Milion of standard cubic meters)
Volumes of electricity sold(GWh)
∆ = -58,6 ∆ = +3,8
Page 36
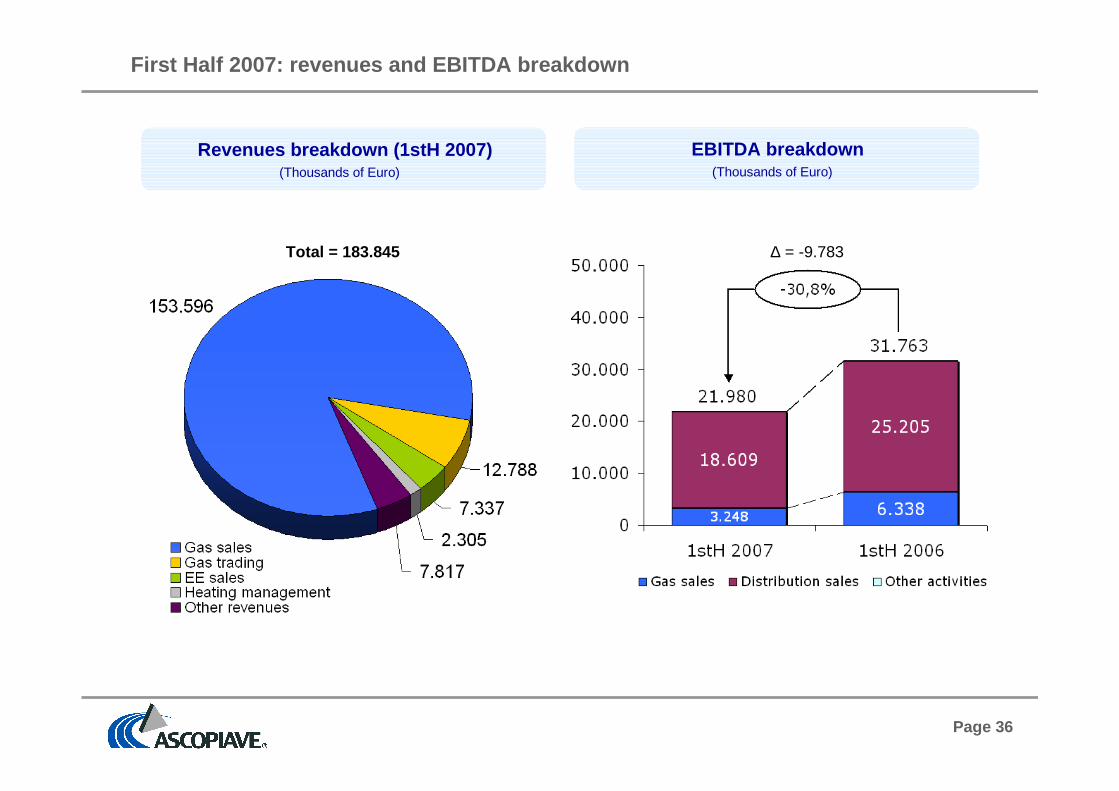
First Half 2007: revenues and EBITDA breakdown
EBITDA breakdown(Thousands of Euro)
Revenues breakdown (1stH 2007)(Thousands of Euro)
Total = 183.845 ∆ = -9.783

Page 37
First Half 2007 EBITDA bridge
∆ = -9.783
EBITDA bridge(Thousands of Euro)
Change in grossmargin on gas sales
and distribution
Page 38
Business Overview
Strategy
Financial highlights
Dividends
Annexes
CONTENTS
Page 39
Dividends
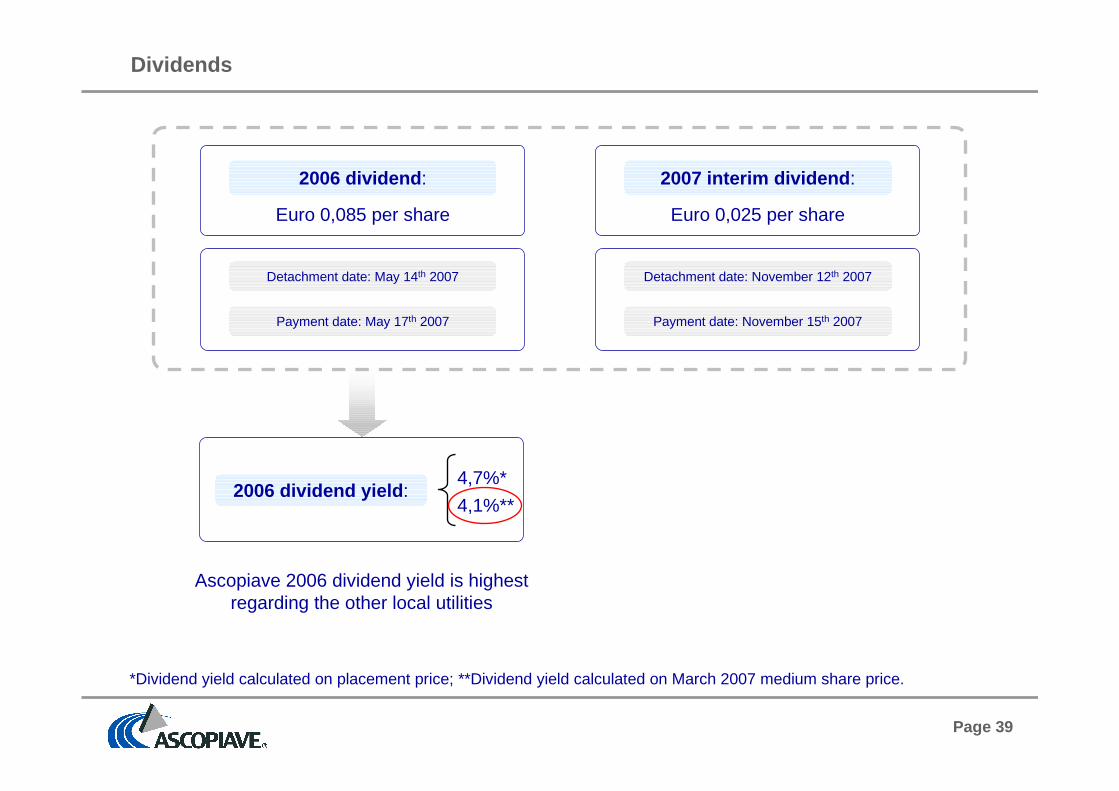
*Dividend yield calculated on placement price; **Dividend yield calculated on March 2007 medium share price.
2006 dividend yield :4,7%*
4,1%**
2006 dividend :
Euro 0,085 per share
Detachment date: May 14th 2007
Payment date: May 17th 2007
2007 interim dividend :
Euro 0,025 per share
Detachment date: November 12th 2007
Payment date: November 15th 2007
Ascopiave 2006 dividend yield is highestregarding the other local utilities
Page 40
Business Overview
Strategy
Financial highlights
Dividends
Annexes
CONTENTS
Page 41
Gas distribution: VRD breakdown
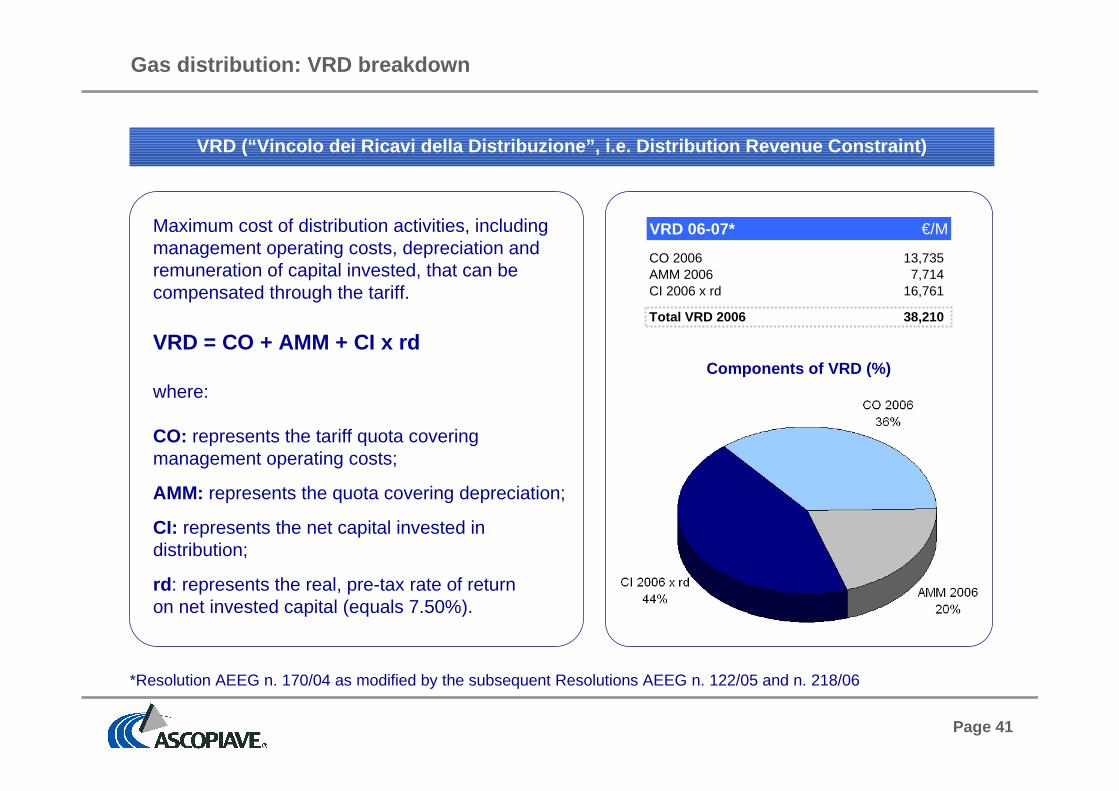
Maximum cost of distribution activities, includingmanagement operating costs, depreciation andremuneration of capital invested, that can becompensated through the tariff.
VRD = CO + AMM + CI x rd
where:
CO: represents the tariff quota coveringmanagement operating costs;
AMM: represents the quota covering depreciation;
CI: represents the net capital invested indistribution;
rd : represents the real, pre-tax rate of returnon net invested capital (equals 7.50%).
*Resolution AEEG n. 170/04 as modified by the subsequent Resolutions AEEG n. 122/05 and n. 218/06
Components of VRD (%)
VRD (“Vincolo dei Ricavi della Distribuzione”, i.e. Distribution Revenue Constraint)
VRD 06-07* €/M
CO 2006 13,735AMM 2006 7,714CI 2006 x rd 16,761
Total VRD 2006 38,210
Page 42
Issues on tariffs
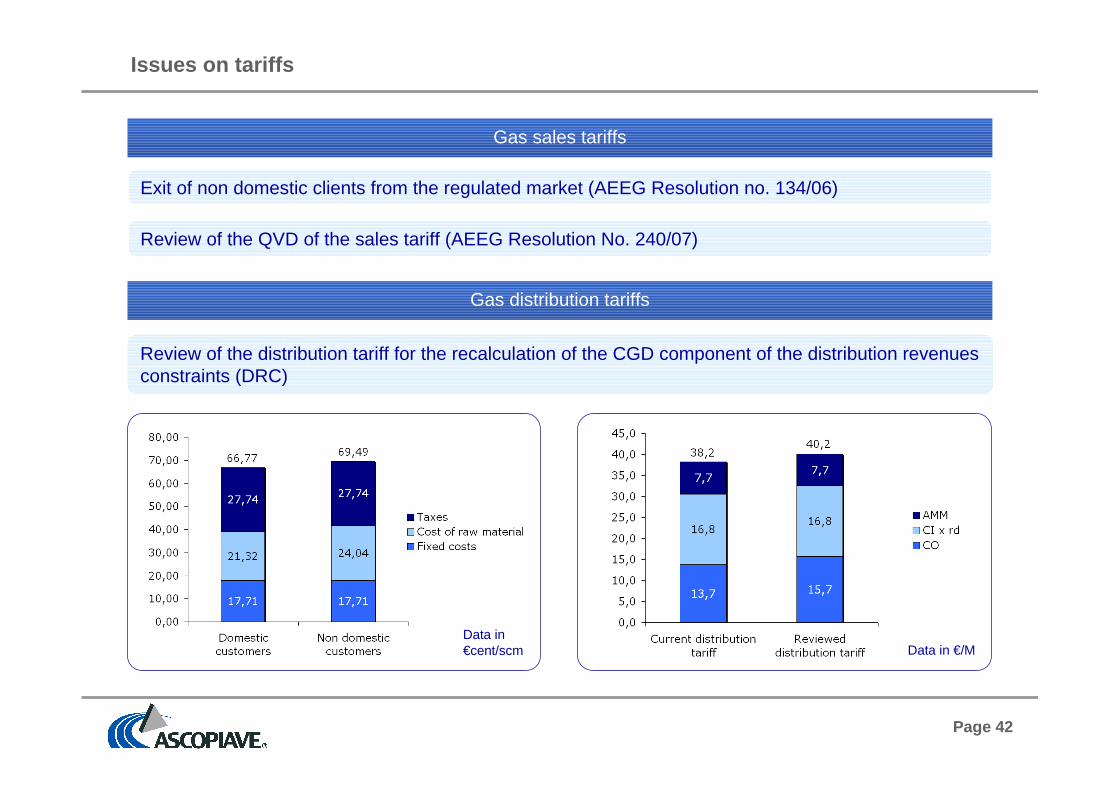
Gas sales tariffs
Exit of non domestic clients from the regulated market (AEEG Resolution no. 134/06)
Review of the QVD of the sales tariff (AEEG Resolution No. 240/07)
Gas distribution tariffs
Review of the distribution tariff for the recalculation of the CGD component of the distribution revenuesconstraints (DRC)
Data in€cent/scm Data in €/M
Page 43
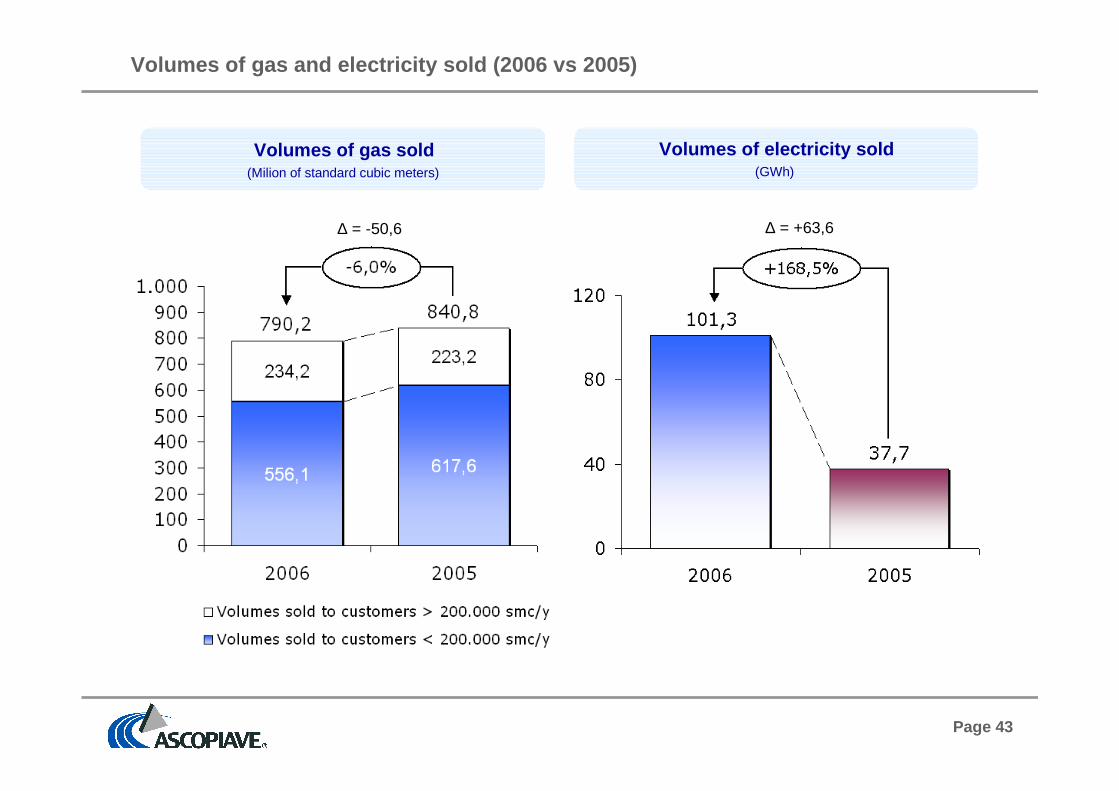
Volumes of gas and electricity sold (2006 vs 2005)
Volumes of gas sold(Milion of standard cubic meters)
∆ = -50,6
Volumes of electricity sold(GWh)
∆ = +63,6
Page 44
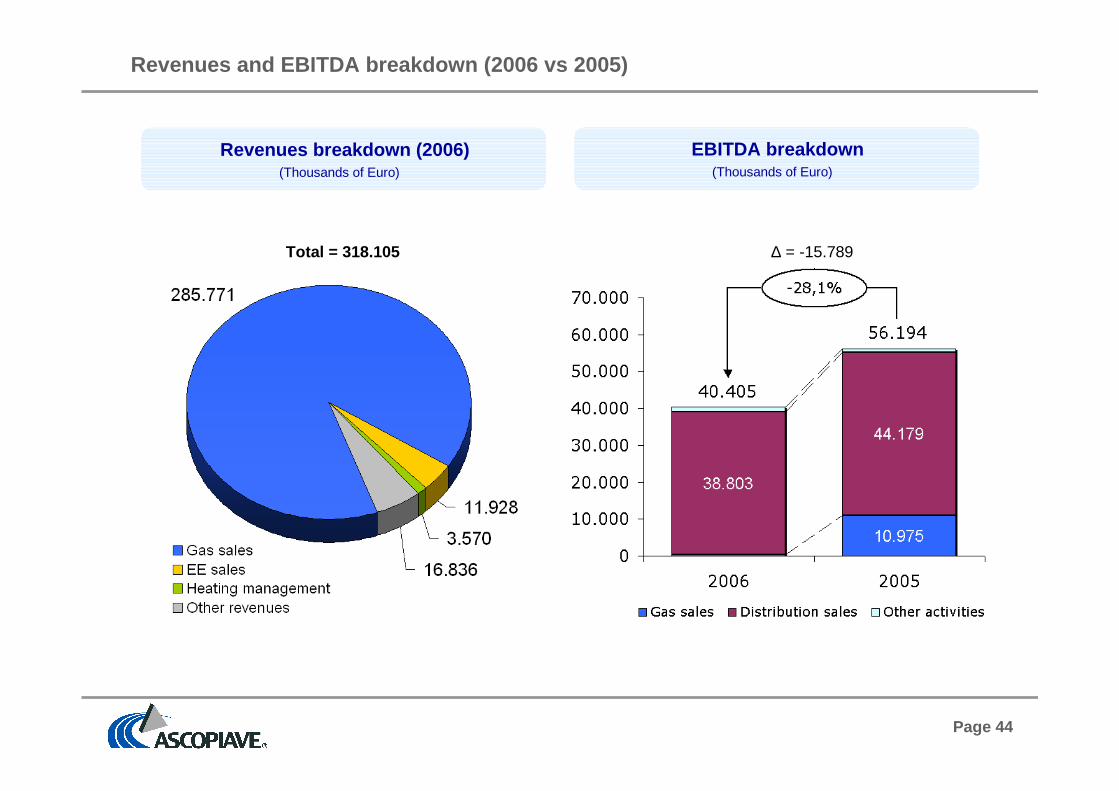
Revenues and EBITDA breakdown (2006 vs 2005)
EBITDA breakdown(Thousands of Euro)
∆ = -15.789
Revenues breakdown (2006)(Thousands of Euro)
Total = 318.105
Page 45
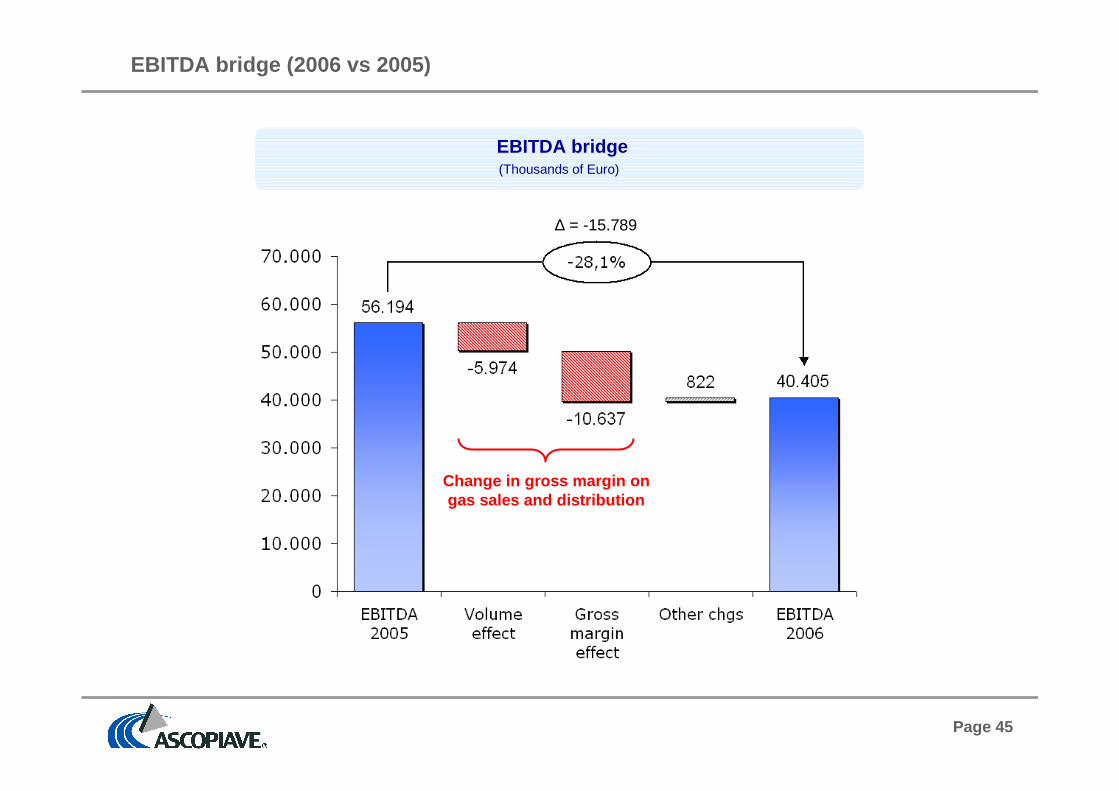
EBITDA bridge (2006 vs 2005)
∆ = -15.789
EBITDA bridge(Thousands of Euro)
Change in gross margin ongas sales and distribution