Embed Size (px)
Citation preview

September 2018
Startup Valuation Guide
September 2018
Adam Augusiak-Boro
Catherine Klinchuch, CFA
Andrew Zhan
Jake Schwartz

September 2018September 2018
I. Valuation 101
II. Challenges of VC Valuation
III. The EquityZen Approach to Valuing Startups
A. Seed & Early Stage
B. Series B to Pre-IPO
C. IPO- / Acquisition-Ready
IV. Other Valuation Considerations
V. Conclusion
Table of Contents
September 2018
Valuation is the cornerstone of the investment process...
Before deciding to pull the trigger on an investment opportunity on EquityZen’s platform or otherwise, an investor typically asks one simple question – what is it worth? Valuation is the process we use to answer that question. In theory, it prescribes a simple framework for evaluating the merits of an investment. If the price of an asset is less than its value, then buy. If not, don’t buy (or, in some cases, you can sell short).
…but analyzing investments is challenging – especially for startups.
In practice, constructing a meaningful valuation analysis can be challenging. Many different frameworks exist, practitioners often disagree on the best ways to develop estimates and most models fail to capture all relevant investment considerations. In addition, valuation requires us to make assumptions about the future, and we never have perfect information to do so. These challenges can be even more acute for startups – EquityZen’s bread-and-butter – where historical data and transparency are often limited and uncertainty over the future is higher.
Enter the EquityZen Startup Valuation Guide.
This primer aims to tackle the key challenges in conducting valuation, with a special focus on startup companies. Our approach provides a straight-forward, practical guide for analyzing companies across various stages of business maturity and industries. In doing so, we hope to provide EquityZen clients with greater insight into both their investments and the value offered through our pre-IPO platform.
Introduction

September 2018
I. Valuation 101
September 2018
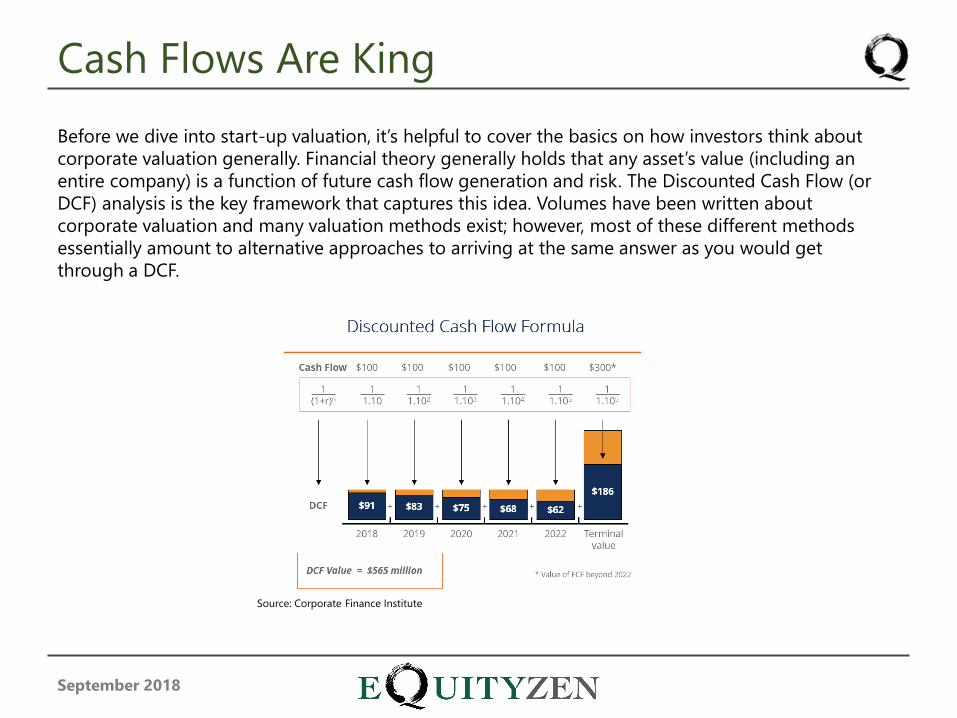
Before we dive into start-up valuation, it’s helpful to cover the basics on how investors think about
corporate valuation generally. Financial theory generally holds that any asset’s value (including an
entire company) is a function of future cash flow generation and risk. The Discounted Cash Flow (or
DCF) analysis is the key framework that captures this idea. Volumes have been written about
corporate valuation and many valuation methods exist; however, most of these different methods
essentially amount to alternative approaches to arriving at the same answer as you would get
through a DCF.
Source: Corporate Finance Institute
Cash Flows Are King
September 2018
How Does the DCF Work?
For simplicity’s sake, we will demonstrate a DCF for an individual asset – the Tech Widget Factory* (TWF). TWF manufactures and sells tech widgets. What are tech widgets? ¯\_(ツ)_/¯ But it doesn’t
matter – all you need to know for our example is that tech widgets generate revenue and have
costs associated with their production.
The DCF framework requires the following steps to estimate TWF’s value:
(1) Estimate cash flows that TWF will generate over an explicit forecast period (usually 5-10 years)
(2) Estimate the terminal value for TWF beyond the explicit forecast period
(3) Derive an appropriate discount rate for TWF
(4) Apply discount rate from step (3) to TWF’s cash projections in steps (1) and (2) to determine
current value
We discuss these steps further over the next several slides.
* To the best of our knowledge, this is not a real factory.
The Discounted Cash Flow Method
September 2018
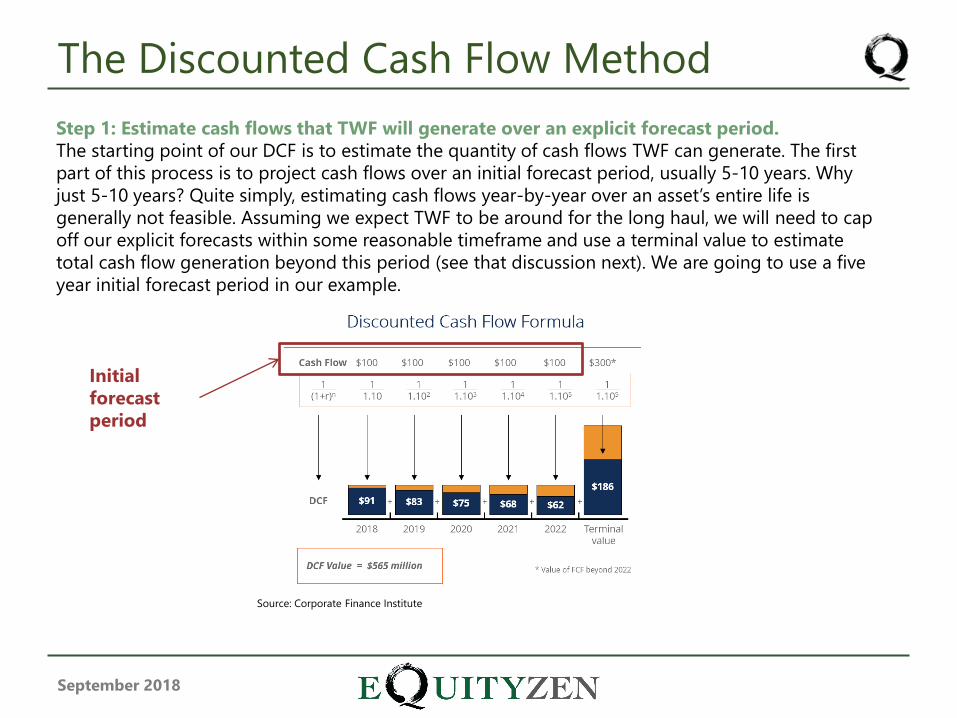
Step 1: Estimate cash flows that TWF will generate over an explicit forecast period.
The starting point of our DCF is to estimate the quantity of cash flows TWF can generate. The first
part of this process is to project cash flows over an initial forecast period, usually 5-10 years. Why
just 5-10 years? Quite simply, estimating cash flows year-by-year over an asset’s entire life is
generally not feasible. Assuming we expect TWF to be around for the long haul, we will need to cap
off our explicit forecasts within some reasonable timeframe and use a terminal value to estimate
total cash flow generation beyond this period (see that discussion next). We are going to use a five
year initial forecast period in our example.
Source: Corporate Finance Institute
Initial
forecast
period
The Discounted Cash Flow Method
September 2018
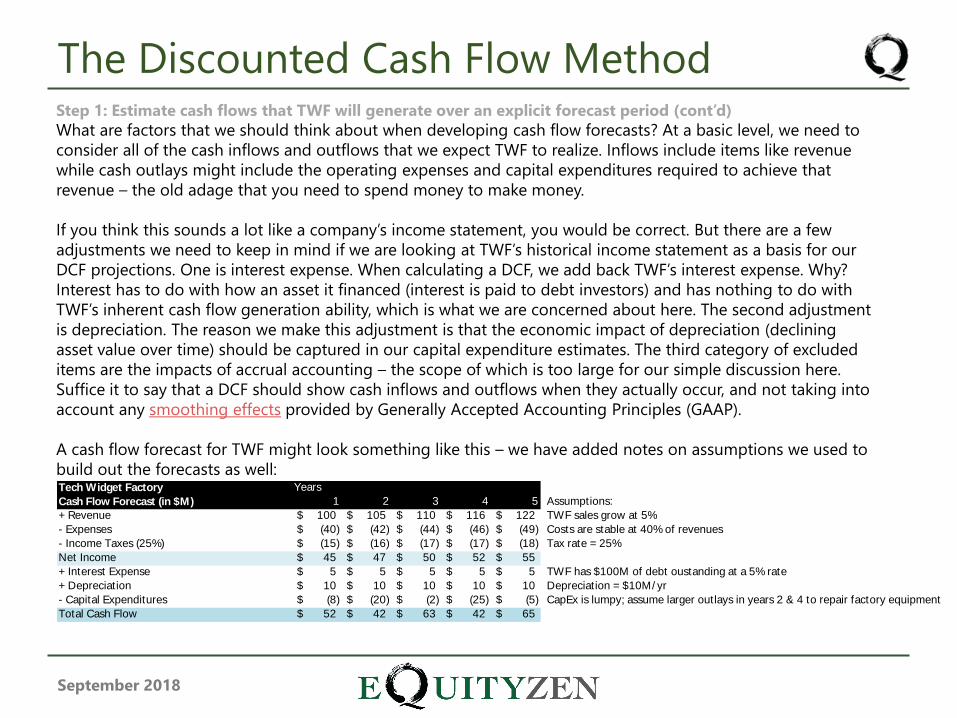
Step 1: Estimate cash flows that TWF will generate over an explicit forecast period (cont’d)
What are factors that we should think about when developing cash flow forecasts? At a basic level, we need to
consider all of the cash inflows and outflows that we expect TWF to realize. Inflows include items like revenue
while cash outlays might include the operating expenses and capital expenditures required to achieve that
revenue – the old adage that you need to spend money to make money.
If you think this sounds a lot like a company’s income statement, you would be correct. But there are a few
adjustments we need to keep in mind if we are looking at TWF’s historical income statement as a basis for our
DCF projections. One is interest expense. When calculating a DCF, we add back TWF’s interest expense. Why?
Interest has to do with how an asset it financed (interest is paid to debt investors) and has nothing to do with
TWF’s inherent cash flow generation ability, which is what we are concerned about here. The second adjustment
is depreciation. The reason we make this adjustment is that the economic impact of depreciation (declining
asset value over time) should be captured in our capital expenditure estimates. The third category of excluded
items are the impacts of accrual accounting – the scope of which is too large for our simple discussion here.
Suffice it to say that a DCF should show cash inflows and outflows when they actually occur, and not taking into
account any smoothing effects provided by Generally Accepted Accounting Principles (GAAP).
A cash flow forecast for TWF might look something like this – we have added notes on assumptions we used to
build out the forecasts as well:Tech Widget Factory Years
Cash Flow Forecast (in $M) 1 2 3 4 5 Assumptions:
+ Revenue 100$ 105$ 110$ 116$ 122$ TWF sales grow at 5%
- Expenses (40)$ (42)$ (44)$ (46)$ (49)$ Costs are stable at 40% of revenues
- Income Taxes (25%) (15)$ (16)$ (17)$ (17)$ (18)$ Tax rate = 25%
Net Income 45$ 47$ 50$ 52$ 55$
+ Interest Expense 5$ 5$ 5$ 5$ 5$ TWF has $100M of debt oustanding at a 5% rate
+ Depreciation 10$ 10$ 10$ 10$ 10$ Depreciation = $10M/ yr
- Capital Expenditures (8)$ (20)$ (2)$ (25)$ (5)$ CapEx is lumpy; assume larger outlays in years 2 & 4 to repair factory equipment
Total Cash Flow 52$ 42$ 63$ 42$ 65$
The Discounted Cash Flow Method
September 2018
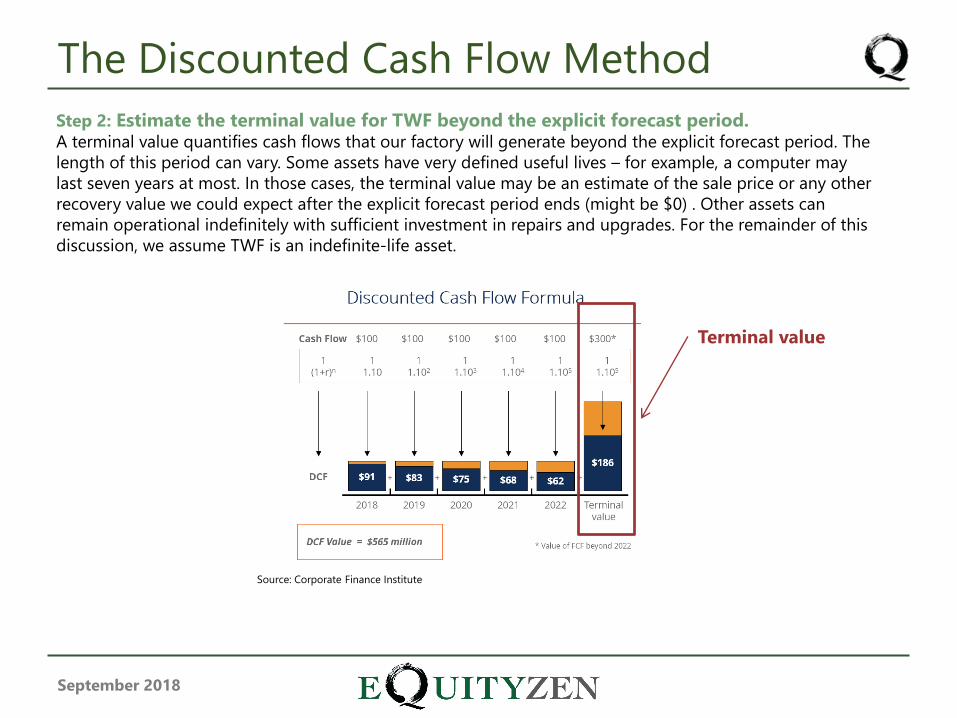
Step 2: Estimate the terminal value for TWF beyond the explicit forecast period.A terminal value quantifies cash flows that our factory will generate beyond the explicit forecast period. The
length of this period can vary. Some assets have very defined useful lives – for example, a computer may
last seven years at most. In those cases, the terminal value may be an estimate of the sale price or any other
recovery value we could expect after the explicit forecast period ends (might be $0) . Other assets can
remain operational indefinitely with sufficient investment in repairs and upgrades. For the remainder of this
discussion, we assume TWF is an indefinite-life asset.
Source: Corporate Finance Institute
Terminal value
The Discounted Cash Flow Method
September 2018
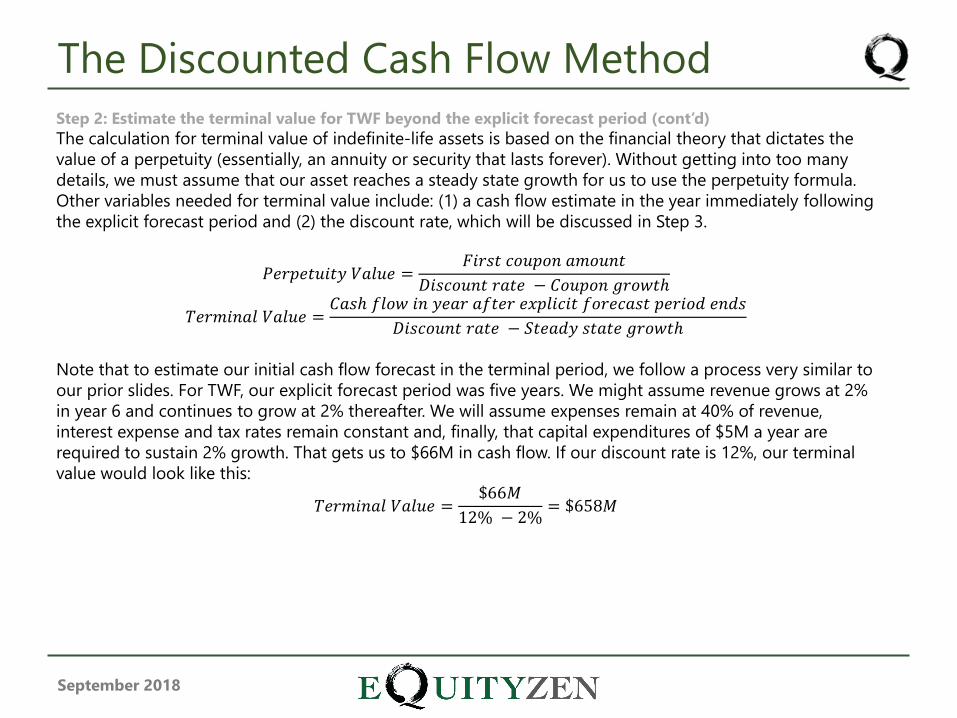
Step 2: Estimate the terminal value for TWF beyond the explicit forecast period (cont’d)
The calculation for terminal value of indefinite-life assets is based on the financial theory that dictates the
value of a perpetuity (essentially, an annuity or security that lasts forever). Without getting into too many
details, we must assume that our asset reaches a steady state growth for us to use the perpetuity formula.
Other variables needed for terminal value include: (1) a cash flow estimate in the year immediately following
the explicit forecast period and (2) the discount rate, which will be discussed in Step 3.
𝑃𝑒𝑟𝑝𝑒𝑡𝑢𝑖𝑡𝑦 𝑉𝑎𝑙𝑢𝑒 =𝐹𝑖𝑟𝑠𝑡 𝑐𝑜𝑢𝑝𝑜𝑛 𝑎𝑚𝑜𝑢𝑛𝑡
𝐷𝑖𝑠𝑐𝑜𝑢𝑛𝑡 𝑟𝑎𝑡𝑒 − 𝐶𝑜𝑢𝑝𝑜𝑛 𝑔𝑟𝑜𝑤𝑡ℎ
𝑇𝑒𝑟𝑚𝑖𝑛𝑎𝑙 𝑉𝑎𝑙𝑢𝑒 =𝐶𝑎𝑠ℎ 𝑓𝑙𝑜𝑤 𝑖𝑛 𝑦𝑒𝑎𝑟 𝑎𝑓𝑡𝑒𝑟 𝑒𝑥𝑝𝑙𝑖𝑐𝑖𝑡 𝑓𝑜𝑟𝑒𝑐𝑎𝑠𝑡 𝑝𝑒𝑟𝑖𝑜𝑑 𝑒𝑛𝑑𝑠
𝐷𝑖𝑠𝑐𝑜𝑢𝑛𝑡 𝑟𝑎𝑡𝑒 − 𝑆𝑡𝑒𝑎𝑑𝑦 𝑠𝑡𝑎𝑡𝑒 𝑔𝑟𝑜𝑤𝑡ℎ
Note that to estimate our initial cash flow forecast in the terminal period, we follow a process very similar to
our prior slides. For TWF, our explicit forecast period was five years. We might assume revenue grows at 2%
in year 6 and continues to grow at 2% thereafter. We will assume expenses remain at 40% of revenue,
interest expense and tax rates remain constant and, finally, that capital expenditures of $5M a year are
required to sustain 2% growth. That gets us to $66M in cash flow. If our discount rate is 12%, our terminal
value would look like this:
𝑇𝑒𝑟𝑚𝑖𝑛𝑎𝑙 𝑉𝑎𝑙𝑢𝑒 =$66𝑀
12% − 2%= $658𝑀
The Discounted Cash Flow Method
September 2018
Step 3: Estimating a discount rate.
A discount rate adjusts cash flows for two key realities of the value of future cash flows to an investor –
interest rates and risk. First, let’s discuss the interest rate adjustment. You wouldn’t invest $1M into a venture
like TWF if you thought it would be worth $1M at the end of 5 years. A better bet would be to put that
money into a safe bank account where you could earn a rate of interest. In finance, this is often called the
time value of money and we account for this by discounting cash flows by a benchmark interest rate
(usually the so-called risk-free rate). The second discount factor – risk – is also straight forward. You aren’t
guaranteed to realize future cash flow estimates. For a relatively safe investment (say a bond backed by a
credit-worthy company like Microsoft or Apple) you might require only a modestly higher rate of return to
induce you to shift money from the safety of a bank account into that investment. For a risky investment
where future cash flows are more uncertain – say, manufacturing and selling tech widgets – you would
probably require a much higher expected rate of return vs. your bank account. The risk adjustment to the
discount rate accounts for this.
In practice, there are several ways to estimate a discount rate. Entire books have been written on this subject
alone and a full discussion is outside of the scope of this introduction. For interested clients, some of the
most prominent methods include the Capital Asset Pricing Model (CAPM), Arbitrage Pricing Theory (APT)
and market-based approaches. For the sake of simplicity, let’s say we have used a market-based approach to
estimate TWF’s discount rate at 12%.
The Discounted Cash Flow Method
September 2018
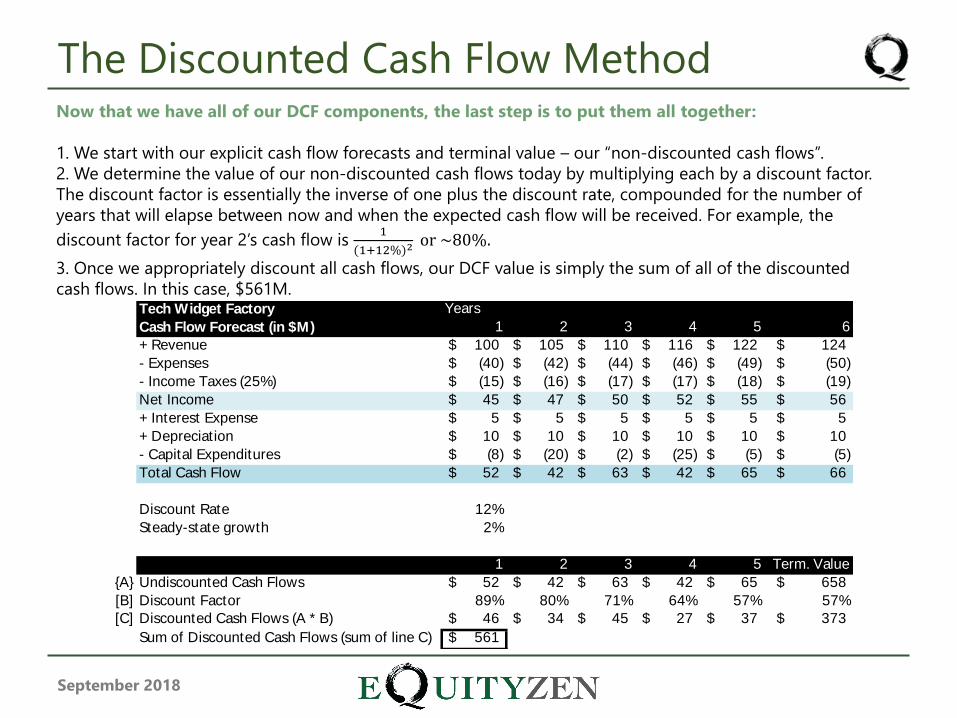
Now that we have all of our DCF components, the last step is to put them all together:
1. We start with our explicit cash flow forecasts and terminal value – our “non-discounted cash flows”.
2. We determine the value of our non-discounted cash flows today by multiplying each by a discount factor.
The discount factor is essentially the inverse of one plus the discount rate, compounded for the number of
years that will elapse between now and when the expected cash flow will be received. For example, the
discount factor for year 2’s cash flow is 1
(1+12%)2or ~80%.
3. Once we appropriately discount all cash flows, our DCF value is simply the sum of all of the discounted
cash flows. In this case, $561M. Tech Widget Factory Years
Cash Flow Forecast (in $M) 1 2 3 4 5 6
+ Revenue 100$ 105$ 110$ 116$ 122$ 124$
- Expenses (40)$ (42)$ (44)$ (46)$ (49)$ (50)$
- Income Taxes (25%) (15)$ (16)$ (17)$ (17)$ (18)$ (19)$
Net Income 45$ 47$ 50$ 52$ 55$ 56$
+ Interest Expense 5$ 5$ 5$ 5$ 5$ 5$
+ Depreciation 10$ 10$ 10$ 10$ 10$ 10$
- Capital Expenditures (8)$ (20)$ (2)$ (25)$ (5)$ (5)$
Total Cash Flow 52$ 42$ 63$ 42$ 65$ 66$
Discount Rate 12%
Steady-state growth 2%
1 2 3 4 5 Term. Value
{A} Undiscounted Cash Flows 52$ 42$ 63$ 42$ 65$ 658$
[B] Discount Factor 89% 80% 71% 64% 57% 57%
[C] Discounted Cash Flows (A * B) 46$ 34$ 45$ 27$ 37$ 373$
Sum of Discounted Cash Flows (sum of line C) 561$
The Discounted Cash Flow Method
September 2018
If nothing else, it should be evident from the previous eight slides that the DCF, while theoretically sound,
can be cumbersome to implement. For this reason, investors have developed numerous alternative
approaches to valuation over the years. These approaches boil down into two broad categories – intrinsic
and relative.
Intrinsic valuation
• Intrinsic valuations are bottom-up frameworks that look to gauge asset value solely on the basis of that
asset’s fundamental properties.
• The DCF is among the most prominent intrinsic value approaches. Net Asset Value and Book
Value/Liquidation Value are other common methods.
Relative valuation
• Relative valuation methods look to estimate an asset value based on the market value of comparable
assets.
• The most prominent example of relative valuation are multiples-based analyses (e.g. price-to-earnings,
EV-to-EBITDA, price-to-sales).
The basic intuition of these valuation methods is the same – in each, asset value is a function of cash flow
and risk. Further, as we mentioned earlier, each method should yield the same value as the DCF if done
properly. Nevertheless, as we will explain in later slides, relative valuation can be much faster to implement
in practice and tends to be more commonly used in the investment community.
Alternative Approaches
September 2018
In our DCF example, we focused on one asset – the Tech Widget Factory. For a collection of assets (i.e., a
company) the process is no different. A company’s value can be thought of as the sum of all of the
individual DCFs (or multiples-based analyses) for each asset or group of assets it owns – factories, stores,
product lines, etc. Many times, a company’s assets are similar enough where one DCF or other valuation
analysis suffices to evaluate its cash flow streams. In other cases, we can achieve a more accurate result by
grouping the company’s assets into different categories based on their growth and risk profiles and doing a
separate valuation for each group.
Two categories we think a lot about at EquityZen are existing assets and growth (or emerging
assets).
• Existing assets: These are generally assets that have established cash flow histories – e.g. a factory that
has been in operation for 10 years. While no forecast is 100% accurate, existing asset cash flow
estimates are generally higher quality. Why? These assets are generally more mature, resulting in more
predictable growth. Existing assets comprise the majority of the asset base for publicly-traded
companies.
• Growth/emerging assets: These are assets with no or limited cash flow histories. Growth rates are likely
higher vs. existing assets. With no operating track record, though, cash flow projections can be subject
to considerable uncertainty and thus quality is often poor. These assets require higher discount rates
than broader industry aggregates given their higher risk profile. Most start-up assets fall into this
category, which presents considerable challenges to traditional valuation frameworks (see Section II for
more details).
Valuing Entire Companies

September 2018
II. Challenges of VC Valuation
September 2018
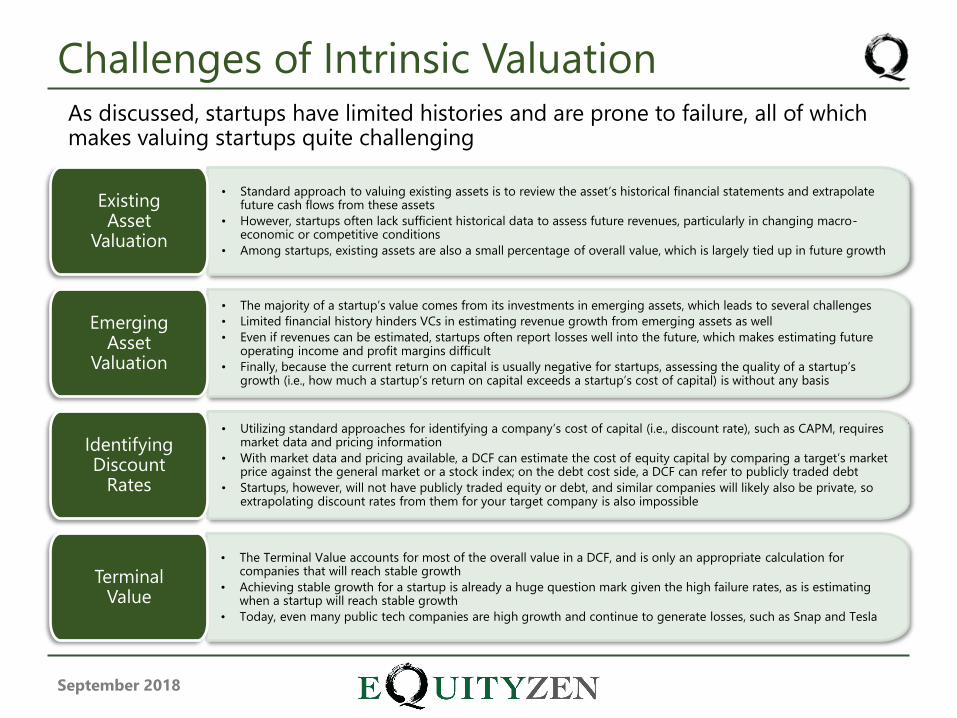
As discussed, startups have limited histories and are prone to failure, all of which makes valuing startups quite challenging
Challenges of Intrinsic Valuation
• Standard approach to valuing existing assets is to review the asset’s historical financial statements and extrapolate future cash flows from these assets
• However, startups often lack sufficient historical data to assess future revenues, particularly in changing macro-economic or competitive conditions
• Among startups, existing assets are also a small percentage of overall value, which is largely tied up in future growth
Existing Asset
Valuation
• The majority of a startup’s value comes from its investments in emerging assets, which leads to several challenges
• Limited financial history hinders VCs in estimating revenue growth from emerging assets as well
• Even if revenues can be estimated, startups often report losses well into the future, which makes estimating future operating income and profit margins difficult
• Finally, because the current return on capital is usually negative for startups, assessing the quality of a startup’s growth (i.e., how much a startup’s return on capital exceeds a startup’s cost of capital) is without any basis
Emerging Asset
Valuation
• Utilizing standard approaches for identifying a company’s cost of capital (i.e., discount rate), such as CAPM, requires market data and pricing information
• With market data and pricing available, a DCF can estimate the cost of equity capital by comparing a target’s market price against the general market or a stock index; on the debt cost side, a DCF can refer to publicly traded debt
• Startups, however, will not have publicly traded equity or debt, and similar companies will likely also be private, so extrapolating discount rates from them for your target company is also impossible
Identifying Discount
Rates
• The Terminal Value accounts for most of the overall value in a DCF, and is only an appropriate calculation for companies that will reach stable growth
• Achieving stable growth for a startup is already a huge question mark given the high failure rates, as is estimating when a startup will reach stable growth
• Today, even many public tech companies are high growth and continue to generate losses, such as Snap and Tesla
Terminal Value

September 2018
• Relative valuations have to be scaled to a common metric
• The most conventional metrics are ratios, such as Price / Earnings, EV / EBITDA and EV / Sales
• However, because startups often have negative operating income, earnings and EBITDA multiples cannot be computed
• Moreover, even if a startup is sales positive, sales multiples are more opaque than EBITDA multiples, as they do not give investors a view into cost structures of comparable companies
Common Relative
Valuation Metrics
• Typically, the company comparables and transaction comparables methodologies (as discussed later on) value a company relative to other publicly listed companies in the same sector
• With private startups, finding the right universe of comparable companies and transactions is difficult due to a lack of publicly available information on financials and valuation
• Using public companies vis-à-vis startups for valuation purposes is also problematic, as public companies will typically be much larger and have lower growth prospects as well as lower risk profiles
Finding Similar
Startups
• As with DCF valuations, the high failure rate of startups makes valuation using relative methodologies challenging
• The relative value of a startup increases with a higher multiple, such as EV / Sales or EV / EBITDA, which investors would also expect to increase the likelihood of survival
• However, startups both grow and fail at such high rates that assigning a multiple to a startup to discern relative value may not have much basis
High Failure Rates
• As with a DCF, differences in investment terms can also greatly impact the value of a startup’s issued equity (we cover this in more detail later on)
• Investment rounds come with different liquidation preferences, dividends, priority schemes and other protective measures that make it more difficult to assign just one equity value among different series of stock
• Finally, the relative illiquidity of startup equity also has to be taken into account, and pricing an illiquidity discount is a challenge of its own
Equity Claims & Illiquidity
Challenges faced by VCs in performing intrinsic valuations carry over to relative valuation methodologies
Challenges of Relative Valuation

September 2018
III. The EquityZen Approach to
Valuing Startups
September 2018
At EquityZen, we believe that the methodologies used to value a particular startup
should be tailored to that startup’s financing cycle
In an ideal world, valuing a startup would be like valuing an established, public company.
Public companies typically have longer operating histories and are also required to make
quarterly and annual financial disclosures to the public. Unsurprisingly, significant historical
financial data greatly helps inform our ability to make more accurate financial forecasts for a
DCF analysis, since we have a much better understanding of historical revenue and cost drivers.
Moreover, public company filings include management’s prospective assessment of the
business, which can also be helpful in forecasting. Finally, public disclosures and trading
histories shed light on a company’s cost of capital, making it easier to hone in on proper
discount rates.
As already discussed, in addition to a lack of publicly available information, startups vary greatly
in terms of operating and financing history, which creates additional valuation complications.
Generally, the closer a startup is to an IPO, with presumably several years of positive revenue
and a business track record, the more easily it can be valued in a DCF analysis like a public
company. Earlier stage companies, which are more likely to have negative free cash flow or may
even be pre-revenue, cannot be valued with a DCF analysis and thus valuations rely on more
“qualitative“ factors.
In the following slides, we cover a startup’s operating and financing cycle and how that
intersects with the various valuation methodologies we mentioned in Section I.
Subsequently, we walk through concrete examples of several valuation methodologies.
The EquityZen Approach
September 2018September 2018
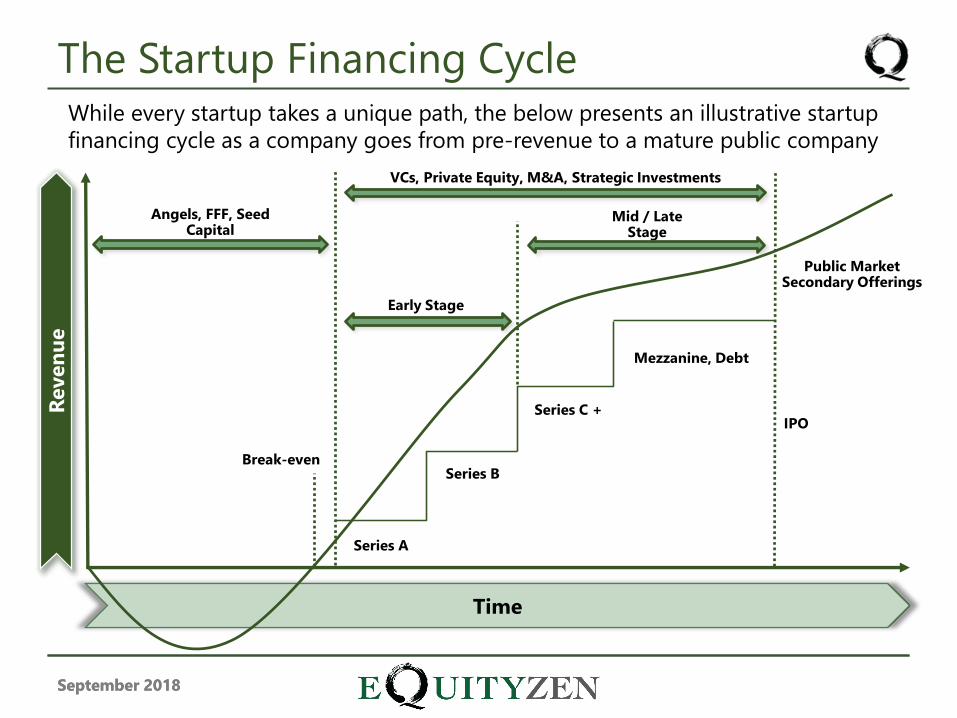
Reven
ue
Public Market Secondary Offerings
Time
Break-even
Angels, FFF, Seed Capital
VCs, Private Equity, M&A, Strategic Investments
Mezzanine, Debt
Early Stage
Mid / Late Stage
IPO
Series B
Series A
Series C +
The Startup Financing CycleWhile every startup takes a unique path, the below presents an illustrative startup
financing cycle as a company goes from pre-revenue to a mature public company
September 2018
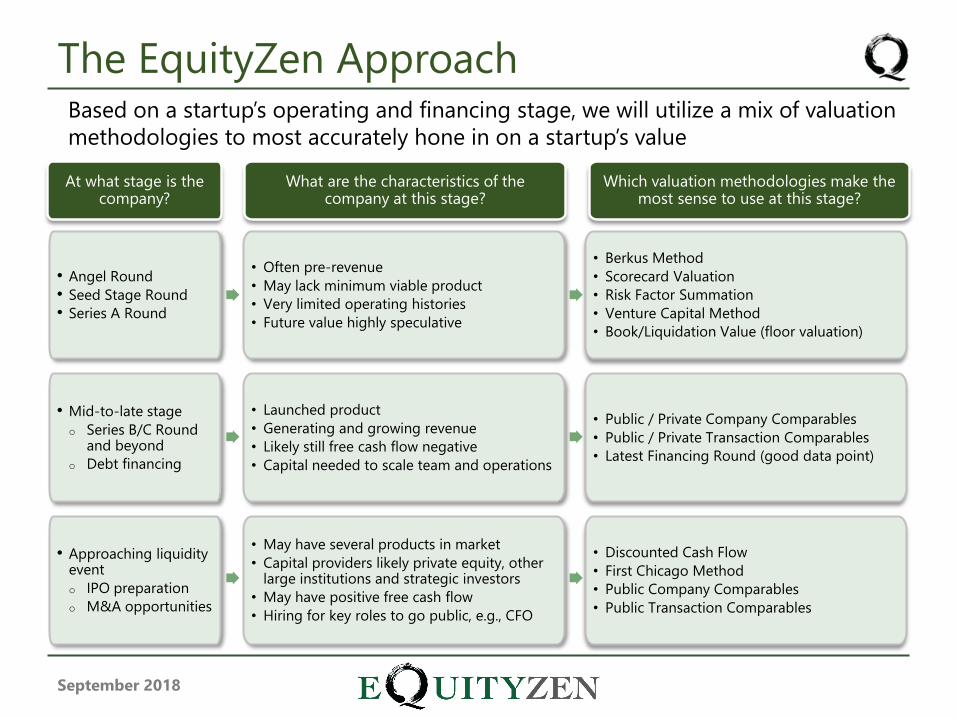
Based on a startup’s operating and financing stage, we will utilize a mix of valuation
methodologies to most accurately hone in on a startup’s value
The EquityZen Approach
At what stage is the company?
• Angel Round
• Seed Stage Round
• Series A Round
What are the characteristics of the company at this stage?
Which valuation methodologies make the most sense to use at this stage?
• Often pre-revenue
• May lack minimum viable product
• Very limited operating histories
• Future value highly speculative
• Berkus Method
• Scorecard Valuation
• Risk Factor Summation
• Venture Capital Method
• Book/Liquidation Value (floor valuation)
• Mid-to-late stage
o Series B/C Round and beyond
o Debt financing
• Approaching liquidity event
o IPO preparation
o M&A opportunities
• Launched product
• Generating and growing revenue
• Likely still free cash flow negative
• Capital needed to scale team and operations
• Public / Private Company Comparables
• Public / Private Transaction Comparables
• Latest Financing Round (good data point)
• May have several products in market
• Capital providers likely private equity, other large institutions and strategic investors
• May have positive free cash flow
• Hiring for key roles to go public, e.g., CFO
• Discounted Cash Flow
• First Chicago Method
• Public Company Comparables
• Public Transaction Comparables
September 2018September 2018
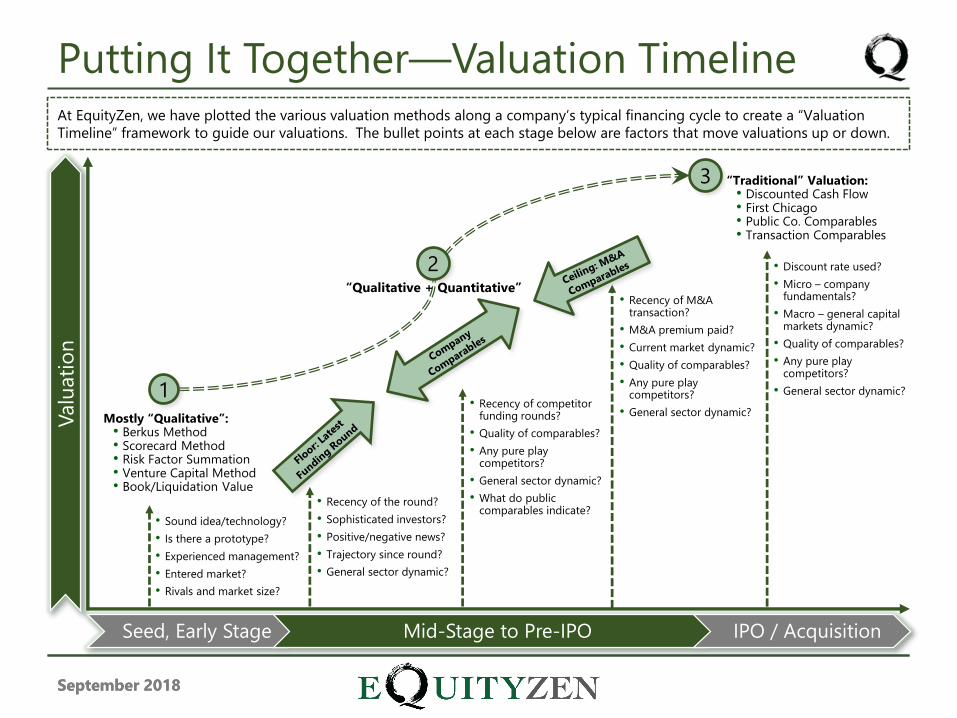
• Recency of the round?
• Sophisticated investors?
• Positive/negative news?
• Trajectory since round?
• General sector dynamic?
• Sound idea/technology?
• Is there a prototype?
• Experienced management?
• Entered market?
• Rivals and market size?
Seed, Early Stage Mid-Stage to Pre-IPO IPO / Acquisition
Valu
ati
on
3
1
Mostly “Qualitative”:• Berkus Method• Scorecard Method• Risk Factor Summation• Venture Capital Method• Book/Liquidation Value
“Qualitative + Quantitative”
“Traditional” Valuation:• Discounted Cash Flow• First Chicago• Public Co. Comparables• Transaction Comparables
• Recency of competitor funding rounds?
• Quality of comparables?
• Any pure play competitors?
• General sector dynamic?
• What do public comparables indicate?
• Recency of M&A transaction?
• M&A premium paid?
• Current market dynamic?
• Quality of comparables?
• Any pure play competitors?
• General sector dynamic?
• Discount rate used?
• Micro – company fundamentals?
• Macro – general capital markets dynamic?
• Quality of comparables?
• Any pure play competitors?
• General sector dynamic?
2
Putting It Together—Valuation TimelineAt EquityZen, we have plotted the various valuation methods along a company’s typical financing cycle to create a “Valuation
Timeline” framework to guide our valuations. The bullet points at each stage below are factors that move valuations up or down.

September 2018
A. Seed & Early Stage: Berkus Method
Scorecard Valuation
Risk Factor Summation
Book & Liquidation Value
Venture Capital Method
September 2018September 2018
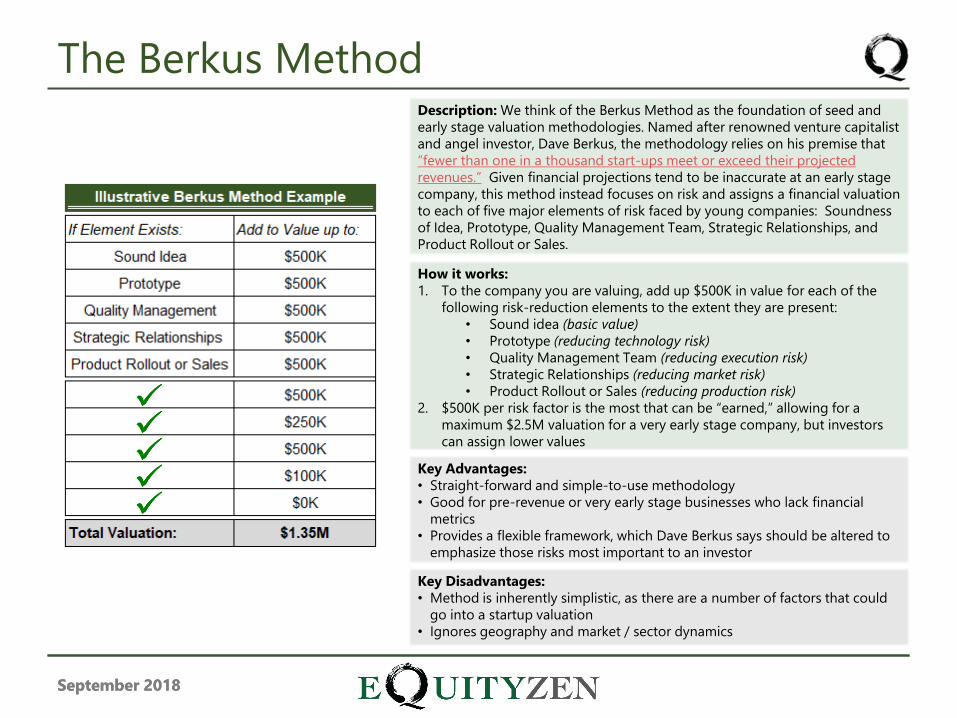
Description: We think of the Berkus Method as the foundation of seed and
early stage valuation methodologies. Named after renowned venture capitalist
and angel investor, Dave Berkus, the methodology relies on his premise that
“fewer than one in a thousand start-ups meet or exceed their projected
revenues.” Given financial projections tend to be inaccurate at an early stage
company, this method instead focuses on risk and assigns a financial valuation
to each of five major elements of risk faced by young companies: Soundness
of Idea, Prototype, Quality Management Team, Strategic Relationships, and
Product Rollout or Sales.
How it works:
1. To the company you are valuing, add up $500K in value for each of the
following risk-reduction elements to the extent they are present:
• Sound idea (basic value)
• Prototype (reducing technology risk)
• Quality Management Team (reducing execution risk)
• Strategic Relationships (reducing market risk)
• Product Rollout or Sales (reducing production risk)
2. $500K per risk factor is the most that can be “earned,” allowing for a
maximum $2.5M valuation for a very early stage company, but investors
can assign lower values
Key Advantages:
• Straight-forward and simple-to-use methodology
• Good for pre-revenue or very early stage businesses who lack financial
metrics
• Provides a flexible framework, which Dave Berkus says should be altered to
emphasize those risks most important to an investor
Key Disadvantages:
• Method is inherently simplistic, as there are a number of factors that could
go into a startup valuation
• Ignores geography and market / sector dynamics
The Berkus Method
September 2018September 2018
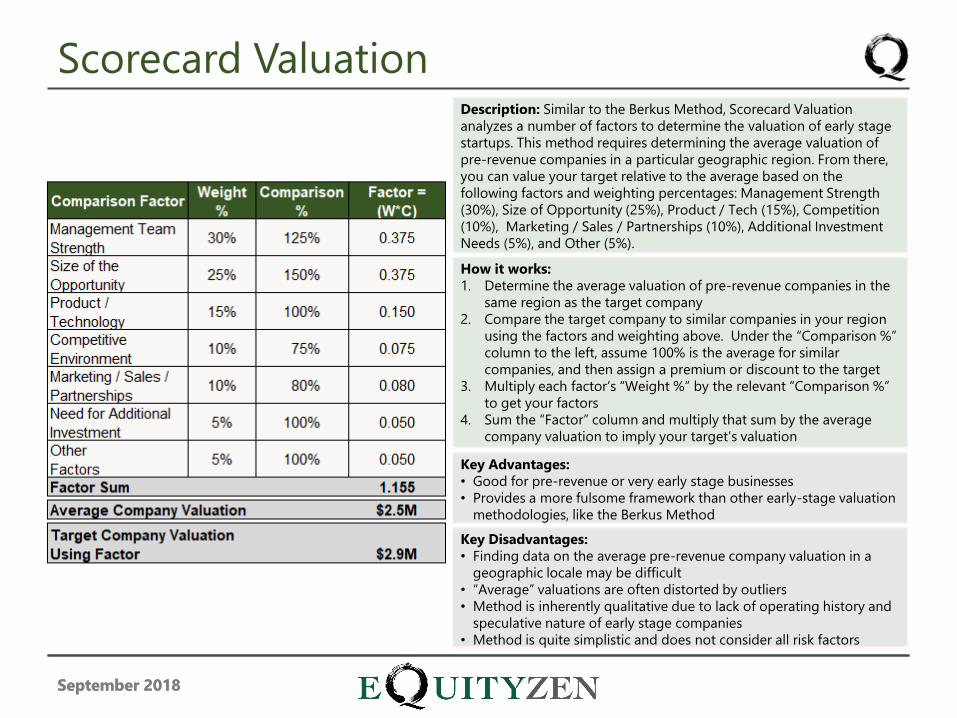
Description: Similar to the Berkus Method, Scorecard Valuation
analyzes a number of factors to determine the valuation of early stage
startups. This method requires determining the average valuation of
pre-revenue companies in a particular geographic region. From there,
you can value your target relative to the average based on the
following factors and weighting percentages: Management Strength
(30%), Size of Opportunity (25%), Product / Tech (15%), Competition
(10%), Marketing / Sales / Partnerships (10%), Additional Investment
Needs (5%), and Other (5%).
How it works:
1. Determine the average valuation of pre-revenue companies in the
same region as the target company
2. Compare the target company to similar companies in your region
using the factors and weighting above. Under the “Comparison %”
column to the left, assume 100% is the average for similar
companies, and then assign a premium or discount to the target
3. Multiply each factor’s “Weight %” by the relevant “Comparison %”
to get your factors
4. Sum the “Factor” column and multiply that sum by the average
company valuation to imply your target’s valuation
Key Advantages:
• Good for pre-revenue or very early stage businesses
• Provides a more fulsome framework than other early-stage valuation
methodologies, like the Berkus Method
Key Disadvantages:
• Finding data on the average pre-revenue company valuation in a
geographic locale may be difficult
• “Average” valuations are often distorted by outliers
• Method is inherently qualitative due to lack of operating history and
speculative nature of early stage companies
• Method is quite simplistic and does not consider all risk factors
Scorecard Valuation

September 2018September 2018
Description: The Risk Factor Summation Method analyzes a broad set of risk
factors relevant to pre-revenue and other early stage startups. This method
reflects the premise that the higher the number of risk factors present, then
the higher the overall risk in achieving a strong exit. “Management Risk” is
most important at the early stages, but this method also seeks to quantify
risks related to: Politics, Manufacturing, Sales/Marketing, Funding,
Competition, Tech, Litigation, International, Reputation and Business Stage.
How it works:
1. Similar to the Scorecard Method, Risk Factor Summation requires you to
start with the average valuation of pre-revenue companies in your
geographic region
2. From there, each risk factor in the Description above is scored as follows:
• +2 is very positive for growing the startup and exiting successfully
• +1 is positive
• 0 is neutral
• -1 is negative for growing the startup and exiting successfully
• -2 is very negative
3. Then adjust the average valuation positively or negatively by $250K for
every 1 point added to or deducted from the target startup
Key Advantages:
• Considers a much broader set of factors than other seed and early stage
valuation methodologies, such as Berkus and Scorecard
• Based in local data concerning average pre-revenue company valuations
Key Disadvantages:
• Finding data on the average pre-revenue company valuation in a
geographic locale may be difficult
• “Average” valuations are often distorted by outliers, positively or negatively
• Method is inherently qualitative due to lack of operating history and
speculative nature of early stage companies
Risk Factor Summation
September 2018September 2018
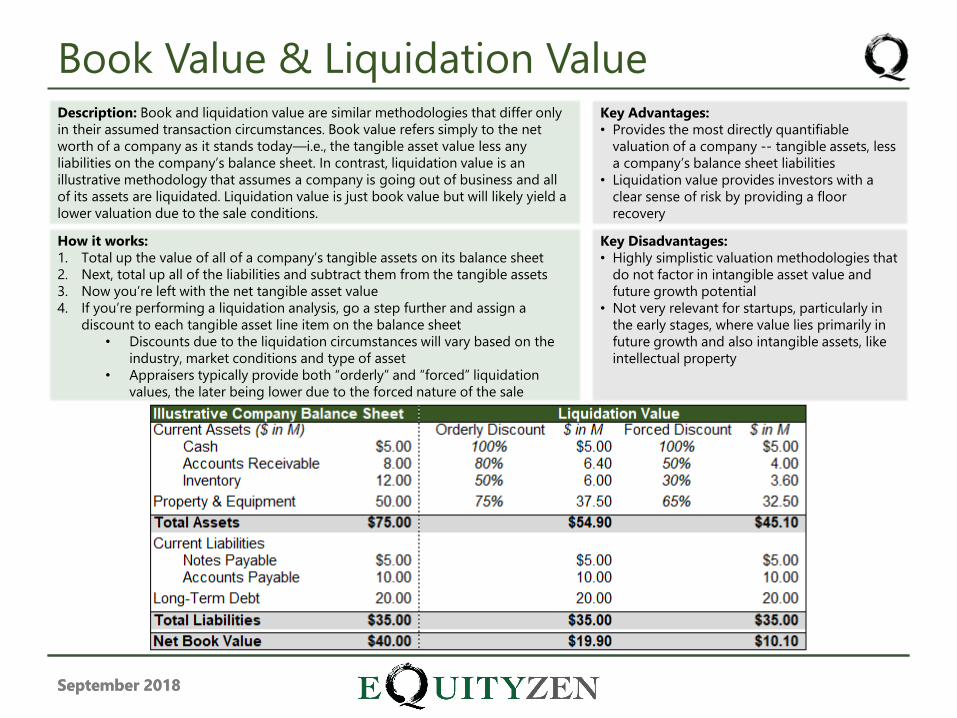
Description: Book and liquidation value are similar methodologies that differ only
in their assumed transaction circumstances. Book value refers simply to the net
worth of a company as it stands today—i.e., the tangible asset value less any
liabilities on the company’s balance sheet. In contrast, liquidation value is an
illustrative methodology that assumes a company is going out of business and all
of its assets are liquidated. Liquidation value is just book value but will likely yield a
lower valuation due to the sale conditions.
How it works:
1. Total up the value of all of a company’s tangible assets on its balance sheet
2. Next, total up all of the liabilities and subtract them from the tangible assets
3. Now you’re left with the net tangible asset value
4. If you’re performing a liquidation analysis, go a step further and assign a
discount to each tangible asset line item on the balance sheet
• Discounts due to the liquidation circumstances will vary based on the
industry, market conditions and type of asset
• Appraisers typically provide both “orderly” and “forced” liquidation
values, the later being lower due to the forced nature of the sale
Key Advantages:
• Provides the most directly quantifiable
valuation of a company -- tangible assets, less
a company’s balance sheet liabilities
• Liquidation value provides investors with a
clear sense of risk by providing a floor
recovery
Key Disadvantages:
• Highly simplistic valuation methodologies that
do not factor in intangible asset value and
future growth potential
• Not very relevant for startups, particularly in
the early stages, where value lies primarily in
future growth and also intangible assets, like
intellectual property
Book Value & Liquidation Value
September 2018September 2018
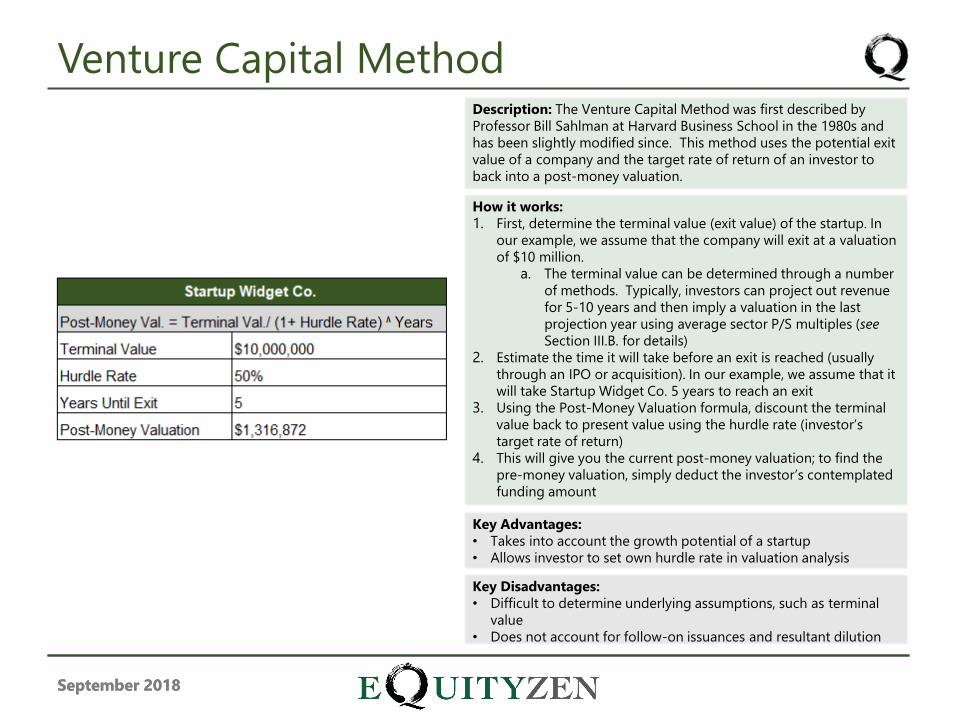
Description: The Venture Capital Method was first described by
Professor Bill Sahlman at Harvard Business School in the 1980s and
has been slightly modified since. This method uses the potential exit
value of a company and the target rate of return of an investor to
back into a post-money valuation.
How it works:
1. First, determine the terminal value (exit value) of the startup. In
our example, we assume that the company will exit at a valuation
of $10 million.
a. The terminal value can be determined through a number
of methods. Typically, investors can project out revenue
for 5-10 years and then imply a valuation in the last
projection year using average sector P/S multiples (see
Section III.B. for details)
2. Estimate the time it will take before an exit is reached (usually
through an IPO or acquisition). In our example, we assume that it
will take Startup Widget Co. 5 years to reach an exit
3. Using the Post-Money Valuation formula, discount the terminal
value back to present value using the hurdle rate (investor’s
target rate of return)
4. This will give you the current post-money valuation; to find the
pre-money valuation, simply deduct the investor’s contemplated
funding amount
Key Advantages:
• Takes into account the growth potential of a startup
• Allows investor to set own hurdle rate in valuation analysis
Key Disadvantages:
• Difficult to determine underlying assumptions, such as terminal
value
• Does not account for follow-on issuances and resultant dilution
Venture Capital Method
September 2018
B. Mid-Stage to Pre-IPO: Public Comparables
Transaction Comparables

September 2018September 2018
Description: A comparables-based analysis (or multiples-based analysis)
expresses the value of an asset relative to some financial or operating metric
(e.g. sales, earnings, users) of other similar assets. The idea here is that similar
assets should be valued at similar prices.
How it works:
1. Determine a set of peer companies similar to the one you are analyzing.
In our example to the left, we look at a fictional set of widget companies
2. Calculate an average multiple for the chosen peer group by taking the
ratio of valuation to a relevant fundamental or operating metric. In
startup land, we often use sales as the relevant operating metric. Looking
at our example again, we calculate how each widget company’s valuation
compares to revenue (also known as price to sales or P/S).
3. Multiply the revenue (or other relevant metric) for the company you are
analyzing by the average sector multiple. The result is the “justified”
valuation for your company
Key Advantages:
• Easy to implement
• Widely-used and easily understood by other market participants
Key Disadvantages:
• Average sector multiples can be impacted by temporary market
conditions or other factors
• Doesn’t always capture all of the factors that drive valuation differentials
(i.e., margins, growth rates, superior management teams, capital
structure). For example, a company with stronger growth prospects might
warrant a higher multiple than the sector average
Public Comparables Analysis

September 2018September 2018
Description: Similar to a company comparables analysis, transaction
comparables express the value of an asset relative to some financial or
operating metric (e.g., sales, earnings, users) of similar assets. The key
difference is that transaction multiples are based on M&A valuations, rather
than public trading valuations. As acquirers often pay premiums for M&A
targets, transaction comparables are often higher than public company
comparables.
How it works:
1. Determine a set of peer companies similar to the one you are analyzing
that were recently acquired
2. Calculate the average multiple for this group by taking the ratio of the
transaction price to a relevant fundamental or operating metric. Again, in
startup land, we often use sales as the relevant operating metric.
3. Multiply the revenue (or other relevant metric) for the company you are
analyzing by the average transaction multiple. The result is the “justified”
valuation for your company.
Key Advantages:
• Easy to implement
• Widely-used and easily understood by other market participants
Key Disadvantages:
• Past transactions may not reflect current valuation conditions
• Transaction prices, and thus transaction multiples, might be impacted by
synergies, intangibles and other factors that are particular to that
transaction and not applicable across the sector broadly
Transaction Comparables Analysis

September 2018
C. IPO- / Acquisition-Ready: Discounted Cash Flow (see Section I)
First Chicago Method
Public Comparables (see Section III.B.)
Transaction Comparables (see Section III.B.)
September 2018September 2018
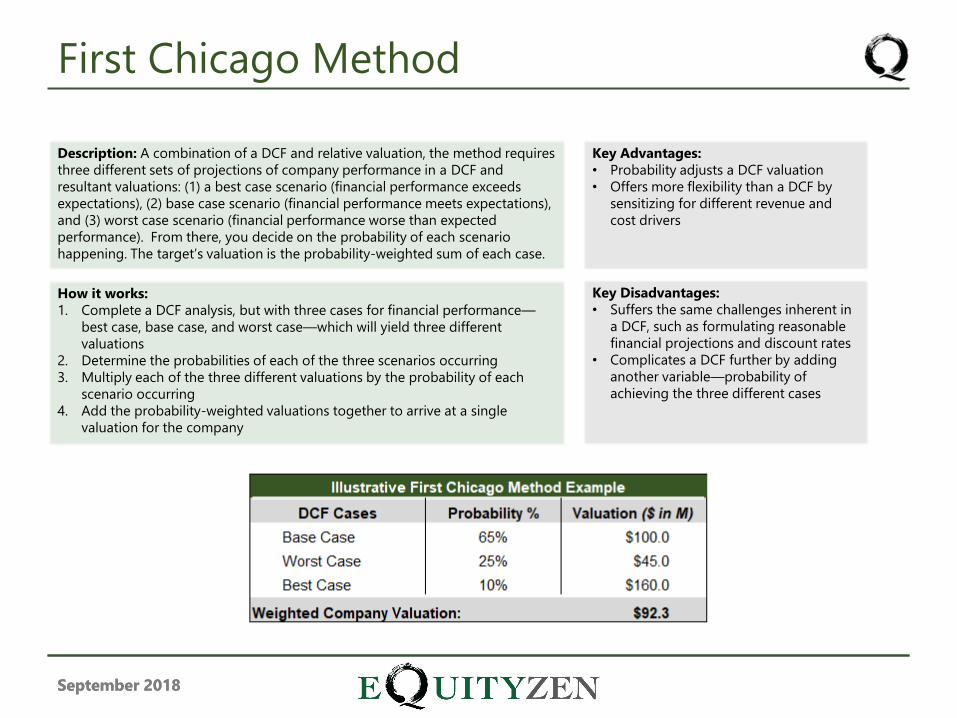
Description: A combination of a DCF and relative valuation, the method requires
three different sets of projections of company performance in a DCF and
resultant valuations: (1) a best case scenario (financial performance exceeds
expectations), (2) base case scenario (financial performance meets expectations),
and (3) worst case scenario (financial performance worse than expected
performance). From there, you decide on the probability of each scenario
happening. The target’s valuation is the probability-weighted sum of each case.
How it works:
1. Complete a DCF analysis, but with three cases for financial performance—
best case, base case, and worst case—which will yield three different
valuations
2. Determine the probabilities of each of the three scenarios occurring
3. Multiply each of the three different valuations by the probability of each
scenario occurring
4. Add the probability-weighted valuations together to arrive at a single
valuation for the company
Key Advantages:
• Probability adjusts a DCF valuation
• Offers more flexibility than a DCF by
sensitizing for different revenue and
cost drivers
Key Disadvantages:
• Suffers the same challenges inherent in
a DCF, such as formulating reasonable
financial projections and discount rates
• Complicates a DCF further by adding
another variable—probability of
achieving the three different cases
First Chicago Method
September 2018
IV. Other Valuation
Considerations
September 2018September 2018
The valuation methodologies covered above unsurprisingly focus on a company’s
financial metrics and assets.
However, there are a number of valuation considerations that VCs factor into an
investment decision that are not readily derived from company financial statements and
projections or a thorough understanding of the business and market. These factors
should theoretically be captured within a company’s valuation as derived using the
methodologies above, but they can be difficult to predict and quantify. We recommend
that clients layer these considerations on top of any quantitative valuation analysis they
perform.
Other key considerations include:
• Dilution: earlier investors should expect that their ownership percentage will
decrease over time as the company raises additional capital from new investors
• Preferred Stock Rights & Onerous Terms: every series of preferred stock may
have distinct terms and privileges compared to earlier series, making it potentially
less advantageous to hold previously-issued stock
• Failure Rates: every startup is unique, but the common rule of thumb is that 90%
eventually fail
• Non-Financial Signals: the human capital factor is extremely important, so
investors should pay attention to management, board and existing investor
composition
Other Valuation Considerations
September 2018September 2018
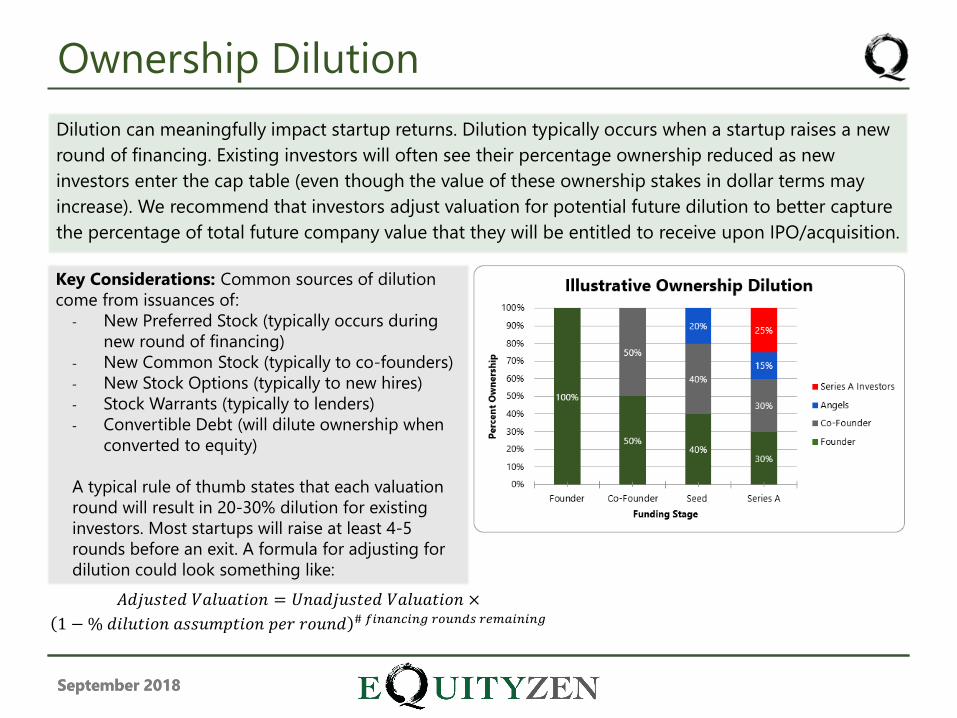
Dilution can meaningfully impact startup returns. Dilution typically occurs when a startup raises a new
round of financing. Existing investors will often see their percentage ownership reduced as new
investors enter the cap table (even though the value of these ownership stakes in dollar terms may
increase). We recommend that investors adjust valuation for potential future dilution to better capture
the percentage of total future company value that they will be entitled to receive upon IPO/acquisition.
Key Considerations: Common sources of dilution
come from issuances of:
- New Preferred Stock (typically occurs during
new round of financing)
- New Common Stock (typically to co-founders)
- New Stock Options (typically to new hires)
- Stock Warrants (typically to lenders)
- Convertible Debt (will dilute ownership when
converted to equity)
A typical rule of thumb states that each valuation
round will result in 20-30% dilution for existing
investors. Most startups will raise at least 4-5
rounds before an exit. A formula for adjusting for
dilution could look something like:
𝐴𝑑𝑗𝑢𝑠𝑡𝑒𝑑 𝑉𝑎𝑙𝑢𝑎𝑡𝑖𝑜𝑛 = 𝑈𝑛𝑎𝑑𝑗𝑢𝑠𝑡𝑒𝑑 𝑉𝑎𝑙𝑢𝑎𝑡𝑖𝑜𝑛 ×
1 −% 𝑑𝑖𝑙𝑢𝑡𝑖𝑜𝑛 𝑎𝑠𝑠𝑢𝑚𝑝𝑡𝑖𝑜𝑛 𝑝𝑒𝑟 𝑟𝑜𝑢𝑛𝑑 # 𝑓𝑖𝑛𝑎𝑛𝑐𝑖𝑛𝑔 𝑟𝑜𝑢𝑛𝑑𝑠 𝑟𝑒𝑚𝑎𝑖𝑛𝑖𝑛𝑔
Ownership Dilution
September 2018September 2018
Not all stock is created equal and different rights and privileges assigned to certain classes of shares
can impact how we value them. We look at a few of the most common rights attached to VC-backed
company shares and note how valuation should be adjusted to account for them.
Liquidation Rank: This refers to the order in which
investors, or debt holders, get paid in the event of
company liquidation or bankruptcy. This is a common
preferred stock protection. All else equal, share classes with
higher liquidation rank will have higher valuations.
Common stock typically has the lowest liquidation rank.
Participating Rights: Preferred shares are generally
entitled to a minimum distribution amount (their
liquidation preference) from acquisition or bankruptcy
proceeds. Participating rights will entitle these
shareholders to additional distributions on top of their
liquidation preference at the expense of common
shareholders. If you are investing in startup common stock,
you may need to adjust your valuation lower to account for
this additional payment to preferred.
Ratchet: Ratchets are provisions that provide certain
share classes with down-round protection (i.e., where
the company raises a subsequent round of financing,
which can include IPO, at a lower price). With a ratchet,
the company is required to issue additional shares to
covered share classes in a subsequent down-round.
Investors should always check if any share classes have
ratchet provisions. All else equal, shares with ratchet
provisions will have higher valuations than shares
without this protection.
Accumulating Dividends: While startups typically do
not pay dividends on preferred stock, certain companies
will declare dividends that accumulate over time and are
payable at a later date. These dividends provide
preferred shareholders additional return potential.
Investors should adjust a startup valuation for any
dividend liabilities owed to other share classes in the
future.
Preferred Stock Rights & Onerous Terms
September 2018September 2018
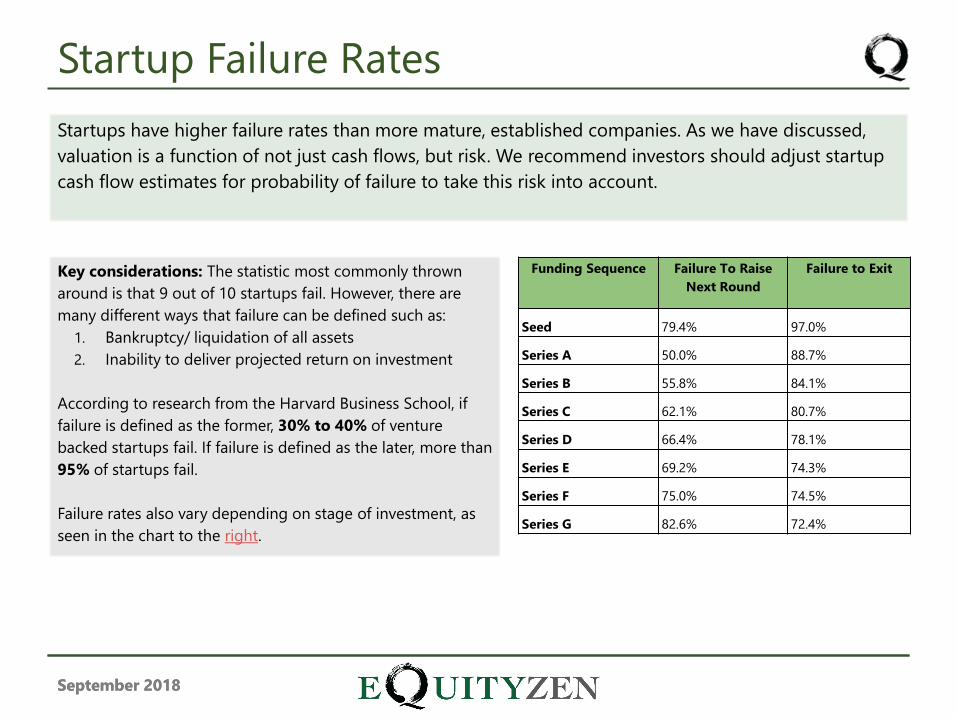
Funding Sequence Failure To Raise
Next Round
Failure to Exit
Seed 79.4% 97.0%
Series A 50.0% 88.7%
Series B 55.8% 84.1%
Series C 62.1% 80.7%
Series D 66.4% 78.1%
Series E 69.2% 74.3%
Series F 75.0% 74.5%
Series G 82.6% 72.4%
Startups have higher failure rates than more mature, established companies. As we have discussed,
valuation is a function of not just cash flows, but risk. We recommend investors should adjust startup
cash flow estimates for probability of failure to take this risk into account.
Key considerations: The statistic most commonly thrown
around is that 9 out of 10 startups fail. However, there are
many different ways that failure can be defined such as:
1. Bankruptcy/ liquidation of all assets
2. Inability to deliver projected return on investment
According to research from the Harvard Business School, if
failure is defined as the former, 30% to 40% of venture
backed startups fail. If failure is defined as the later, more than
95% of startups fail.
Failure rates also vary depending on stage of investment, as
seen in the chart to the right.
Startup Failure Rates
September 2018September 2018
Key decision makers at a startup can have a meaningful impact on company value by providing effective
strategic vision and leadership in execution. All else equal, startups with stronger management teams,
board members and partners are more likely to see favorable outcomes and may command premium
valuations. By contrast, a startup with a weak management team or board should likely be assigned a
discounted valuation.
Financial Backers/Board Members:
Money in the world of VC often does not come
unattached as investors usually carry a board seat
with the company. Each venture capital firm and
partner can bring in unique insights and connections
within the field that the startup operates in.
Strategic Partners: Startups can also raise money from non-
traditional VC firms to form strategic partnerships to leverage
another’s company’s resources. Similar to the connections that
VC partners can bring a startup, it is important to understand
the resources, technology, networks, etc. that a partnership can
bring.
Management Team: Below are several questions to
consider when evaluating a startup’s management
team:
• Does the founding team have a proven track record
behind them?
• Does the team demonstrate expertise in their field?
• Do the skills of the founders complement each
other?
Non-Financial Signals

September 2018
V. Conclusion
September 2018
There is no one-size-fits-all approach to corporate valuation – and startup
valuation is no exception. At EquityZen, we triangulate our valuation using a mix
of methodologies best suited towards a particular startup’s industry, growth
stage and disclosure. On top of that, we layer on other considerations like
dilution, management and failure rates that may not fit neatly into any
established valuation method. This approach may still yield a variety of
conclusions and opinions – that is part of the fun of investing. Nevertheless, we
hope this primer will provide a firmer foundation for practitioners as they join
us on our quest of unlocking value in the pre-IPO markets.
Conclusion
September 2018
About EquityZen
EquityZen Inc. (equityzen.com) is a rapidly-growing marketplace for making investments
in late-stage private technology companies. EquityZen provides accredited investors,
wealth advisors, and institutional money managers access to private markets.
With over 5,000 private placements completed in 100+ premier private companies,
EquityZen is building private markets for the public. Investors in the company include
behemoths from Silicon Valley and Wall Street, like Draper Associates and WorldQuant
Ventures.
Cautionary Note Regarding Forward-Looking Statements
The matters described herein may contain forward-looking statements. These statements
include, but are not limited to, statements about research on late-stage, venture-backed
companies. We caution that these statements are not guarantees of future performance.
Actual results may differ materially from those expressed or implied in the forward-
looking statements. Forward-looking statements involve a number of risks, uncertainties
or other factors beyond EquityZen’s control. We undertake no obligation to release any
revisions to any forward-looking statements, and the forward-looking statements are only
accurate as of the time of this writing.
Conclusion