Embed Size (px)
Citation preview
Stata Introduction, 3 h
Presented by Cecilie Dahl
Presentation, data and programs at:
https://www.med.uio.no/helsam/forskning/aktuelt/arrange
menter/andre/stata-course-uio.html
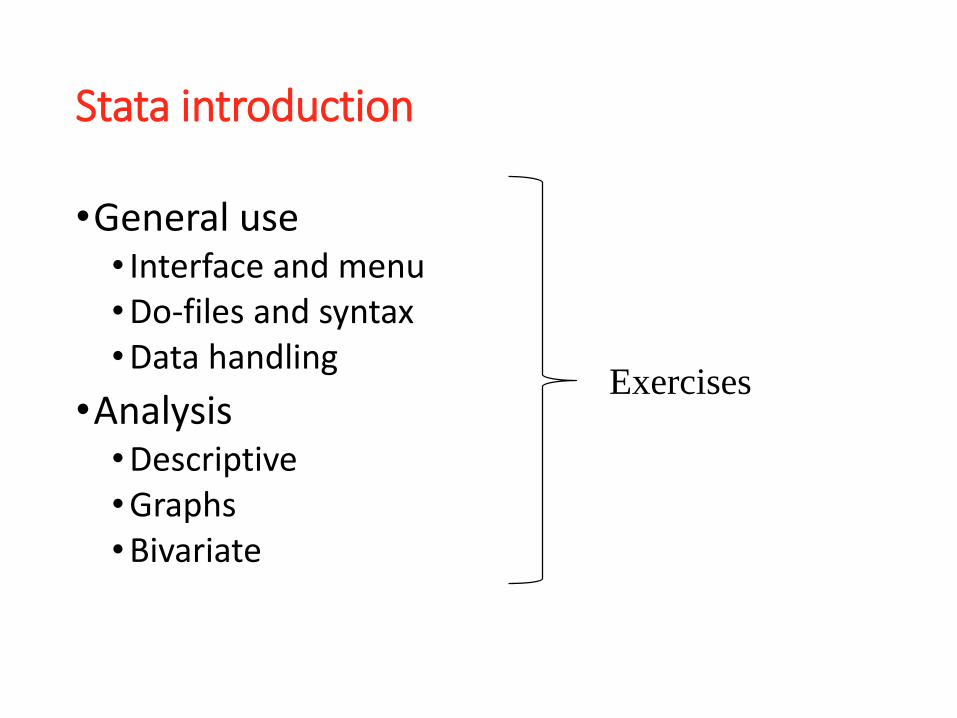
Stata introduction
•General use• Interface and menu•Do-files and syntax•Data handling
•Analysis•Descriptive•Graphs•Bivariate
Exercises

Why Stata
•Pro•Price•Aimed at epidemiology (and economy)•Many methods, growing•Graphics•Structured, Programmable
•Con•File size < Memory

Smart working
•Data (.dta)•Master file, safe•Working file for each project
•Syntax (.do)•Work in progress file•Manuscript file (Table 1…, Figure 1…, Supplement)
•Output (.smcl or .log)•Save or discard

INTERFACE
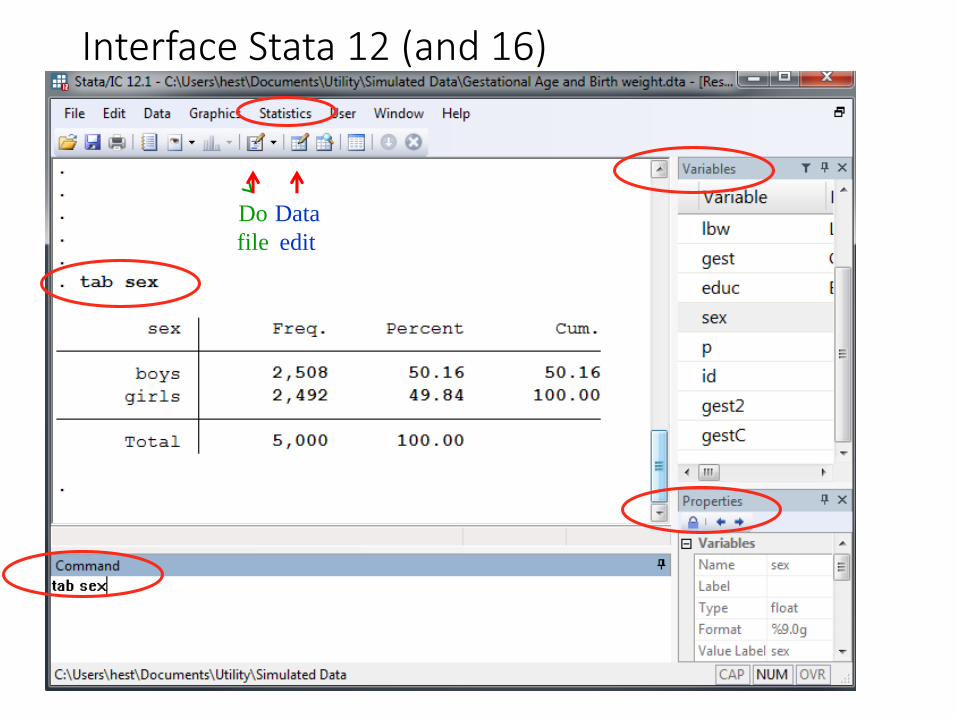
Interface Stata 12 (and 16)
Do
file
Data
edit
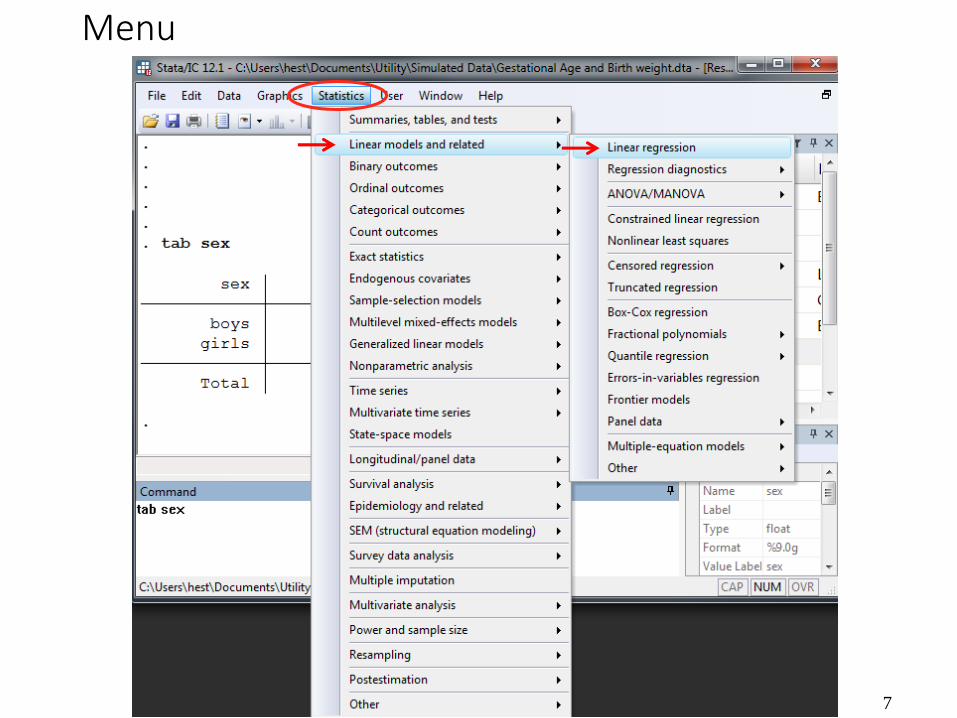
Menu
H.S. 7
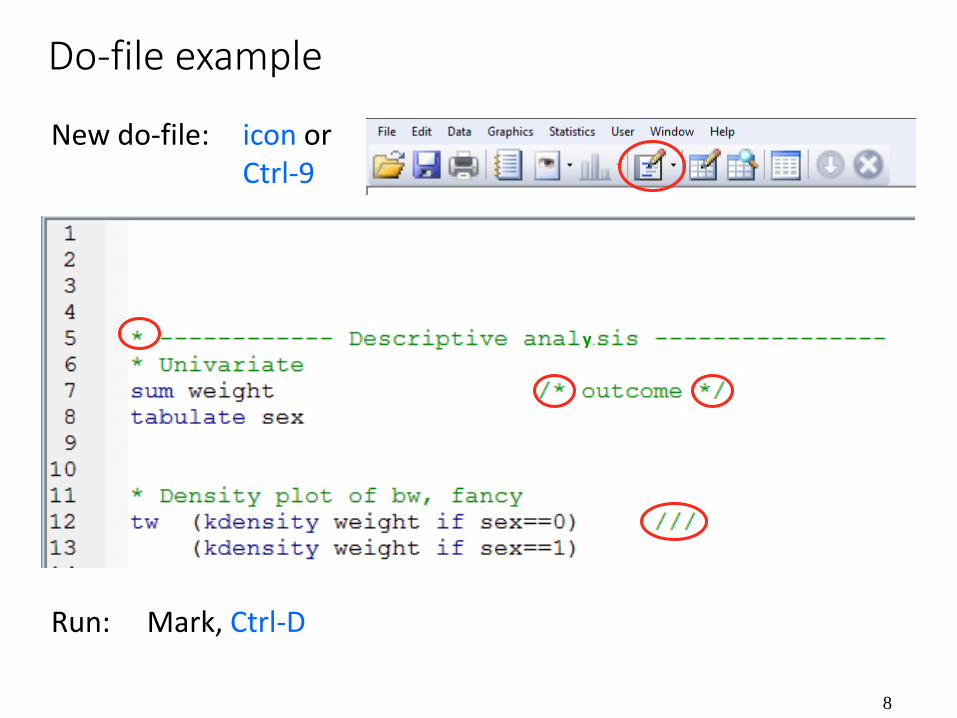
Do-file example
8
New do-file: icon or Ctrl-9
Run: Mark, Ctrl-D
y
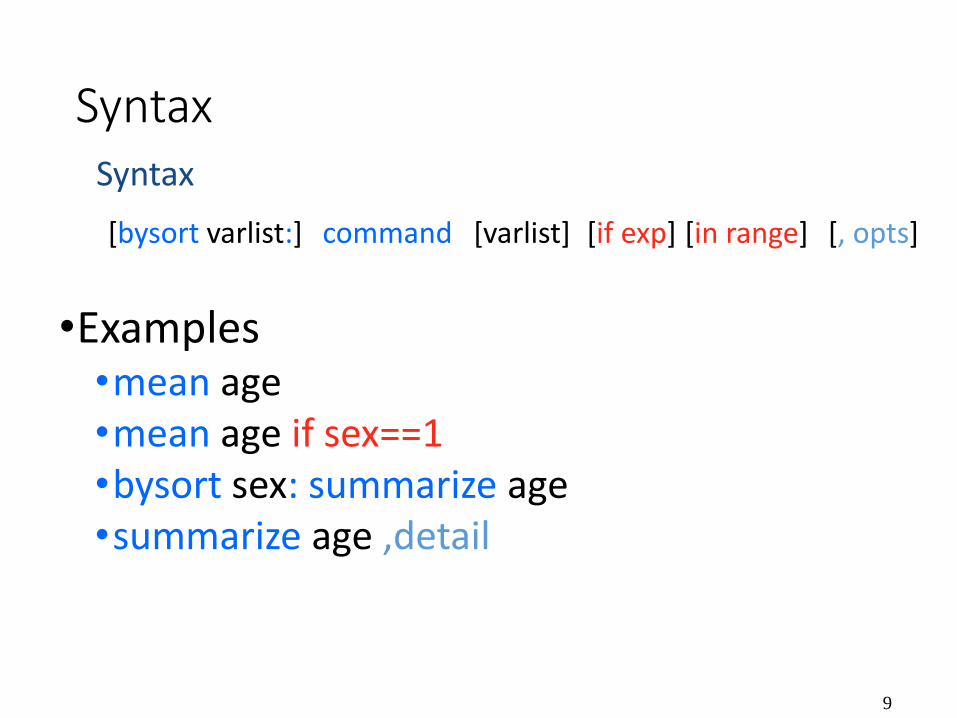
Syntax
•Examples•mean age•mean age if sex==1•bysort sex: summarize age•summarize age ,detail
9
command [varlist] [if exp] [in range] [, opts][bysort varlist:]
Syntax

DATA HANDLING
Export data from SPSS
•Using SPSS 14.0-• Save as, Stata Version 8 SE
11
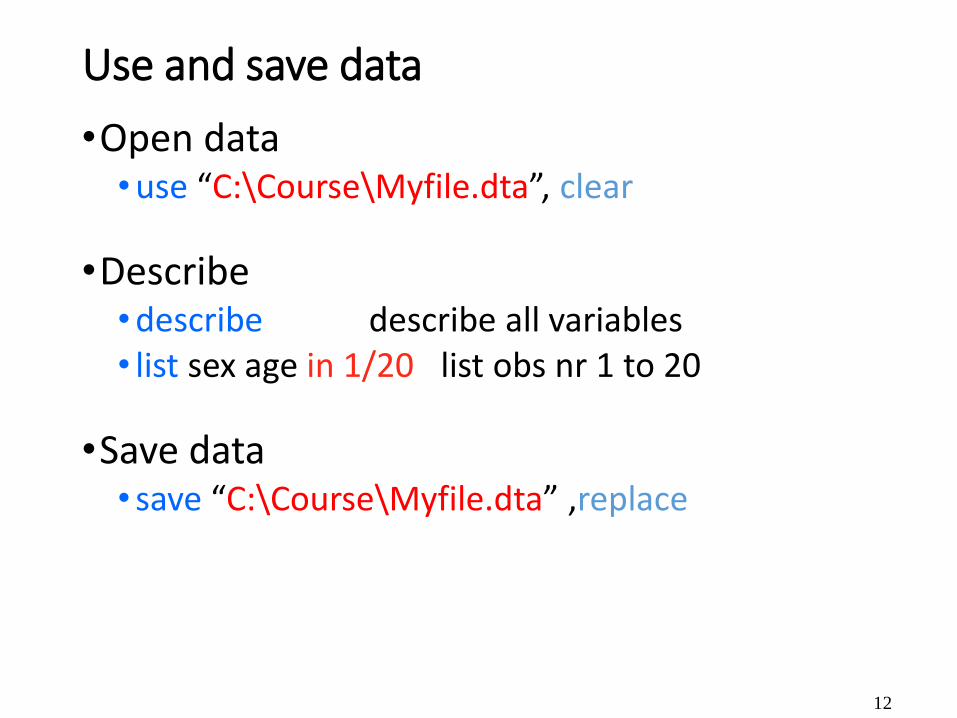
Use and save data
•Open data•use “C:\Course\Myfile.dta”, clear
•Describe•describe describe all variables• list sex age in 1/20 list obs nr 1 to 20
•Save data• save “C:\Course\Myfile.dta” ,replace
12
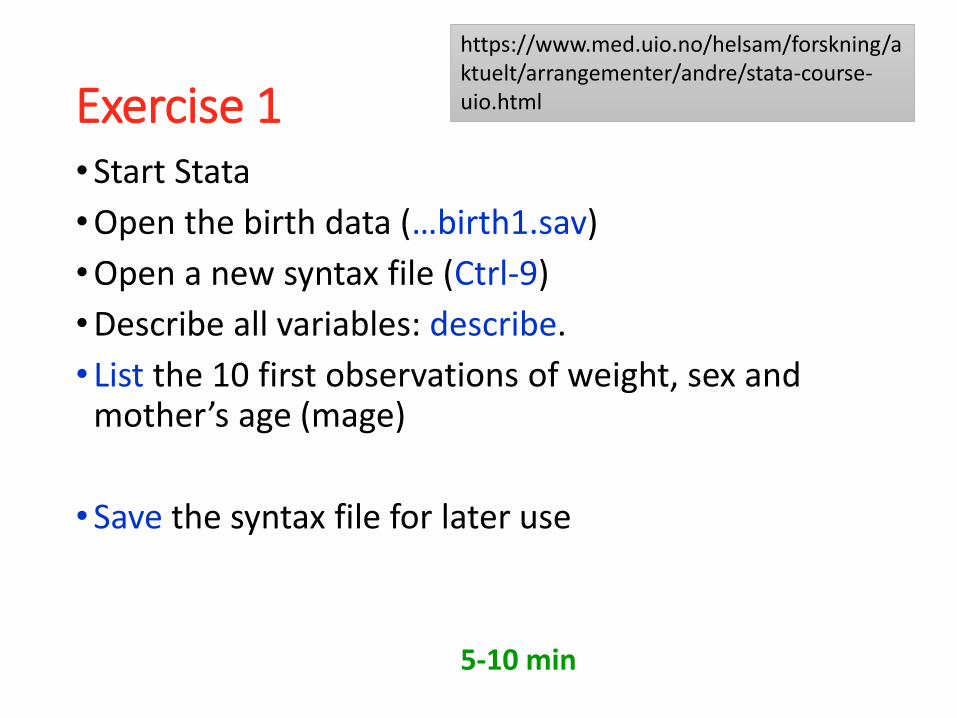
Exercise 1•Start Stata
•Open the birth data (…birth1.sav)
•Open a new syntax file (Ctrl-9)
•Describe all variables: describe.
• List the 10 first observations of weight, sex and mother’s age (mage)
•Save the syntax file for later use
5-10 min
https://www.med.uio.no/helsam/forskning/aktuelt/arrangementer/andre/stata-course-uio.html
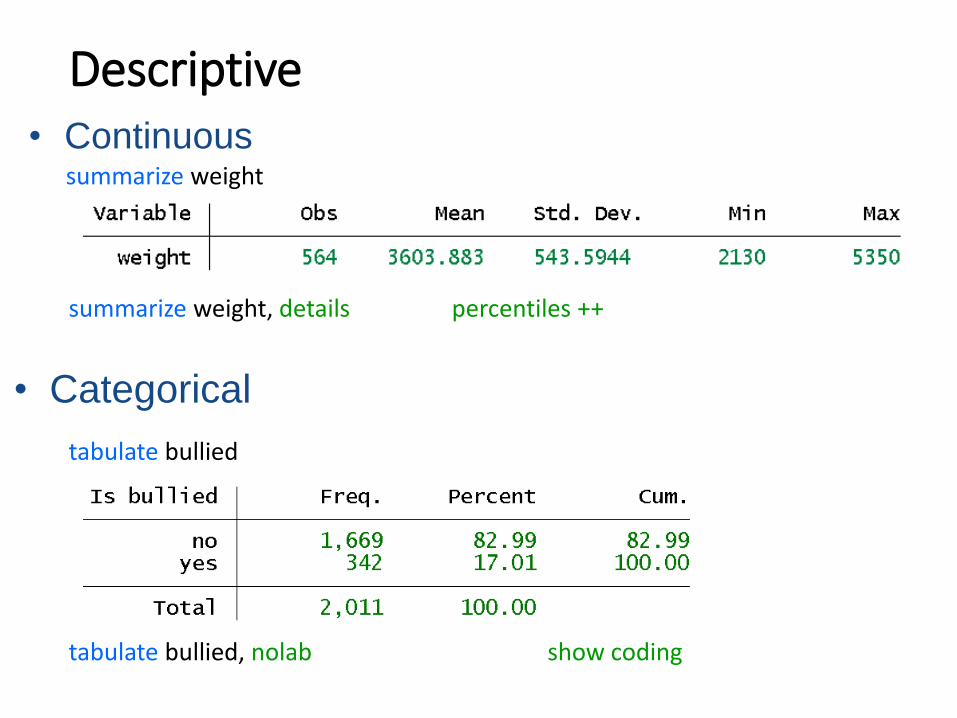
Descriptive• Continuous
• Categorical
summarize weight
summarize weight, details percentiles ++
tabulate bullied
tabulate bullied, nolab show coding
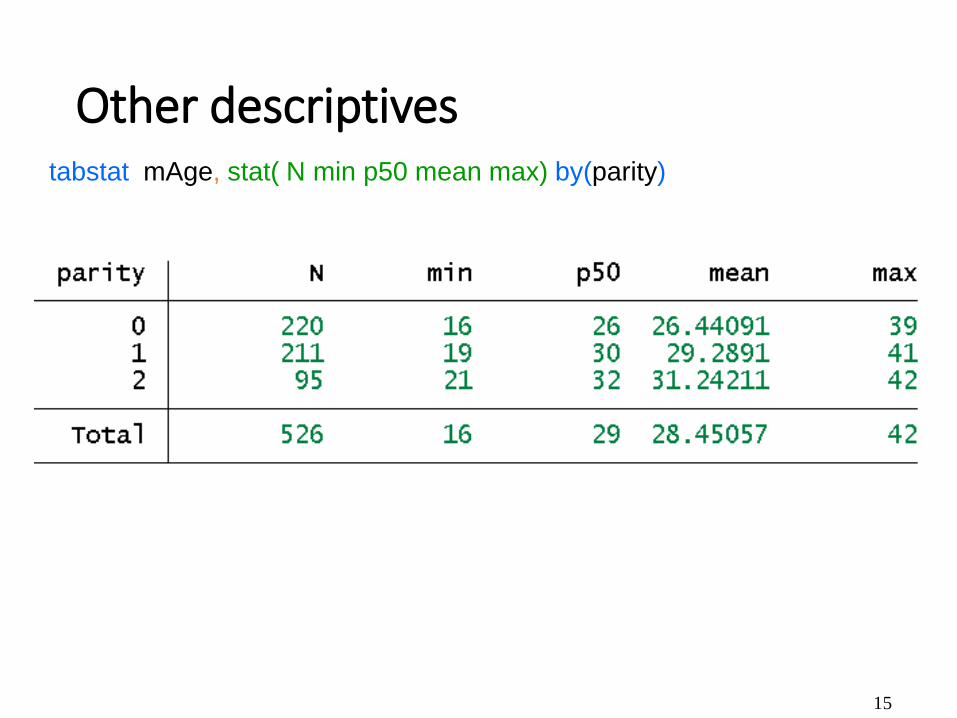
Other descriptives
15
tabstat mAge, stat( N min p50 mean max) by(parity)
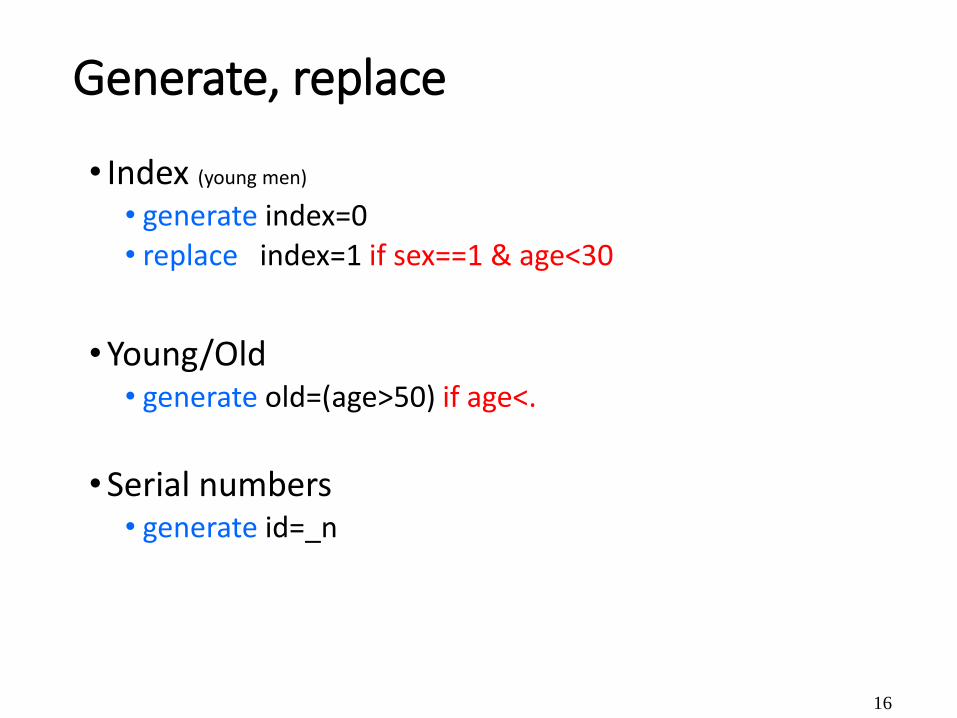
Generate, replace
• Index (young men)
• generate index=0• replace index=1 if sex==1 & age<30
•Young/Old• generate old=(age>50) if age<.
•Serial numbers• generate id=_n
16
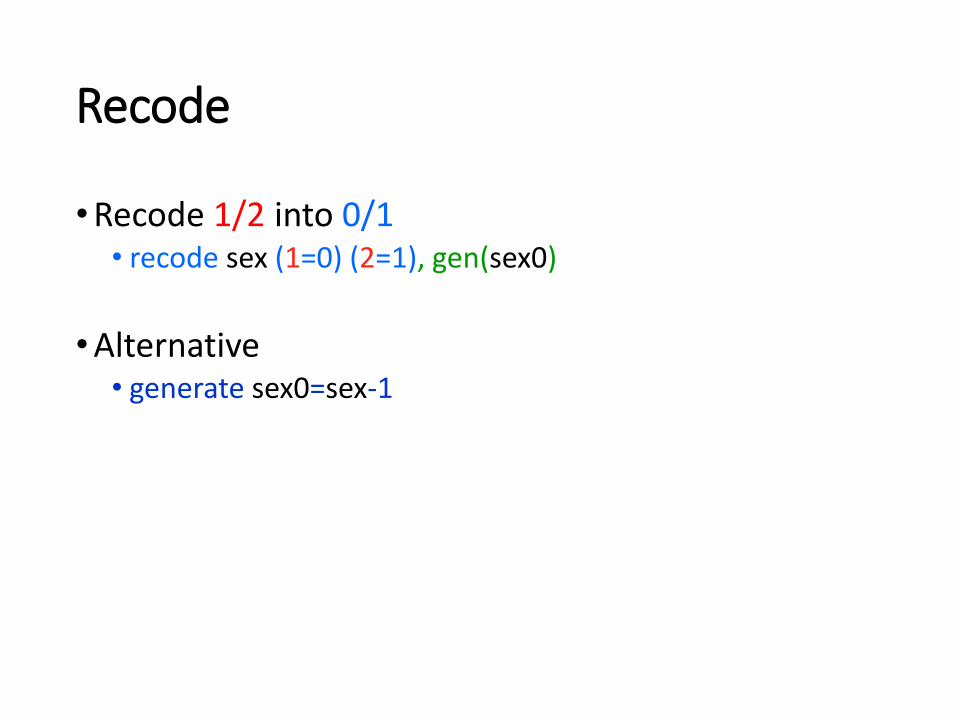
Recode
•Recode 1/2 into 0/1• recode sex (1=0) (2=1), gen(sex0)
•Alternative• generate sex0=sex-1
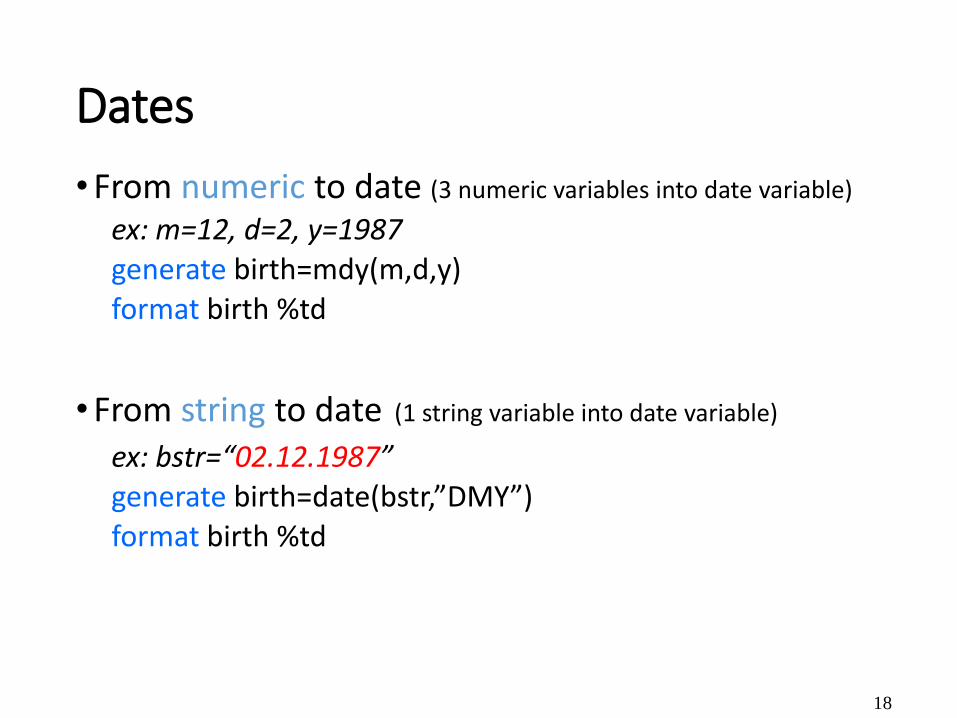
Dates
•From numeric to date (3 numeric variables into date variable)
ex: m=12, d=2, y=1987generate birth=mdy(m,d,y)format birth %td
•From string to date (1 string variable into date variable)
ex: bstr=“02.12.1987”generate birth=date(bstr,”DMY”)format birth %td
18
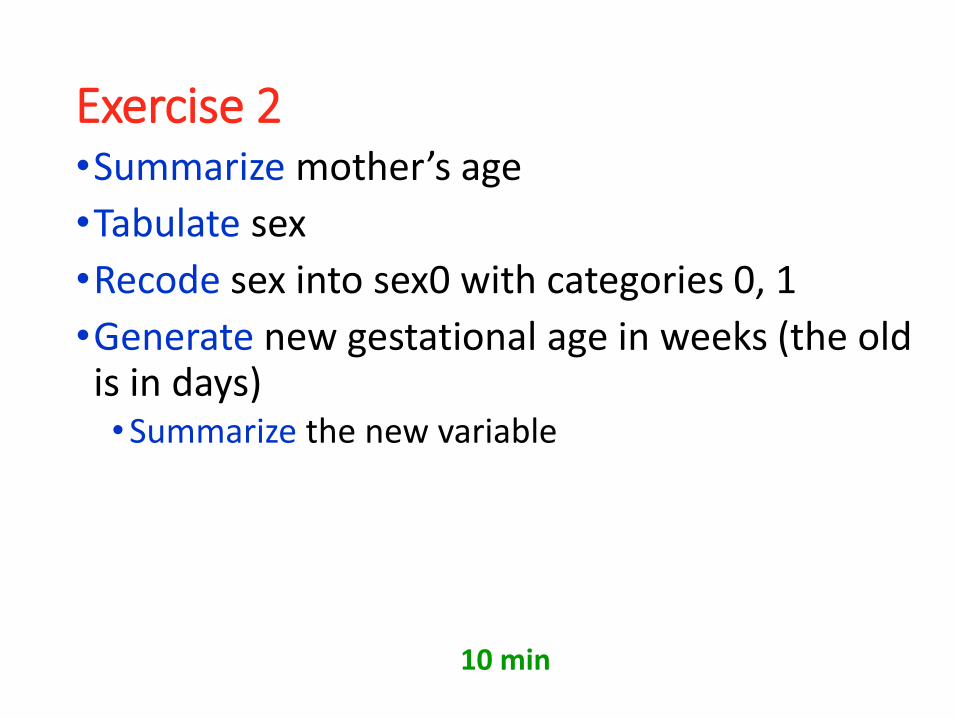
Exercise 2•Summarize mother’s age
•Tabulate sex
•Recode sex into sex0 with categories 0, 1
•Generate new gestational age in weeks (the old is in days)•Summarize the new variable
10 min

Missing
•Obs!!!• Represented as ”.”• Missing values are large numbers • age>30 will include missing.• age>30 if age<. will not.
•Test• replace age=0 if (age==.)
•Change• replace educ=. if educ==99
20
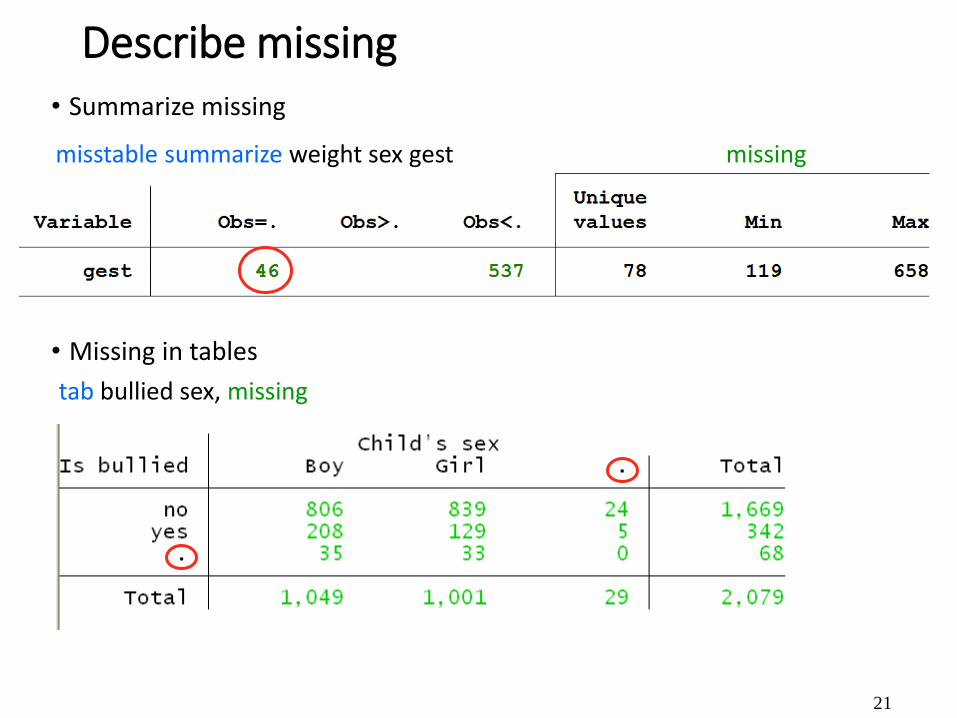
Describe missing• Summarize missing
• Missing in tables
21
tab bullied sex, missing
misstable summarize weight sex gest missing
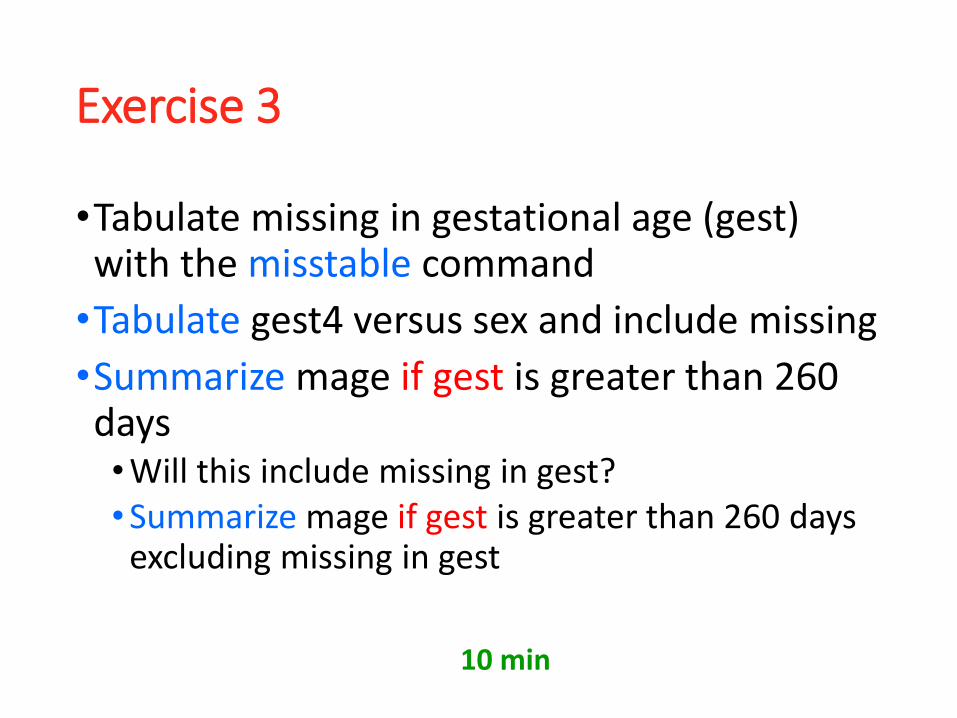
Exercise 3
•Tabulate missing in gestational age (gest) with the misstable command
•Tabulate gest4 versus sex and include missing
•Summarize mage if gest is greater than 260 days•Will this include missing in gest?•Summarize mage if gest is greater than 260 days
excluding missing in gest
10 min

Help•General• help command• findit keyword search Stata+net
•Examples• help table• findit aflogit
23
Many videos on YouTube
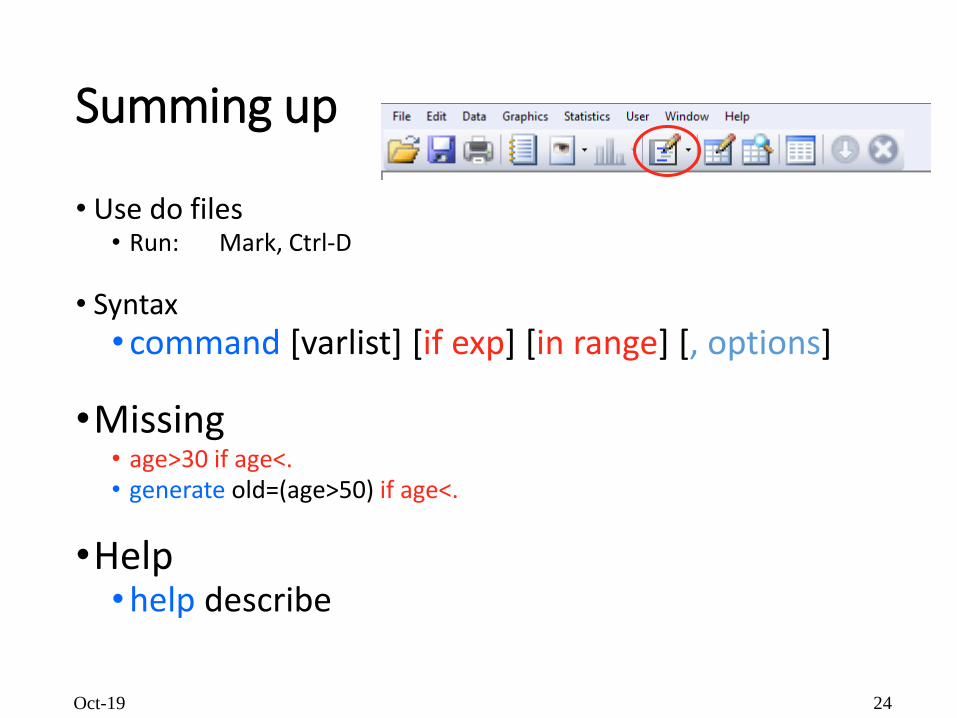
Summing up
• Use do files• Run: Mark, Ctrl-D
• Syntax• command [varlist] [if exp] [in range] [, options]
•Missing• age>30 if age<.• generate old=(age>50) if age<.
•Help•help describe
Oct-19 24

GRAPHICS
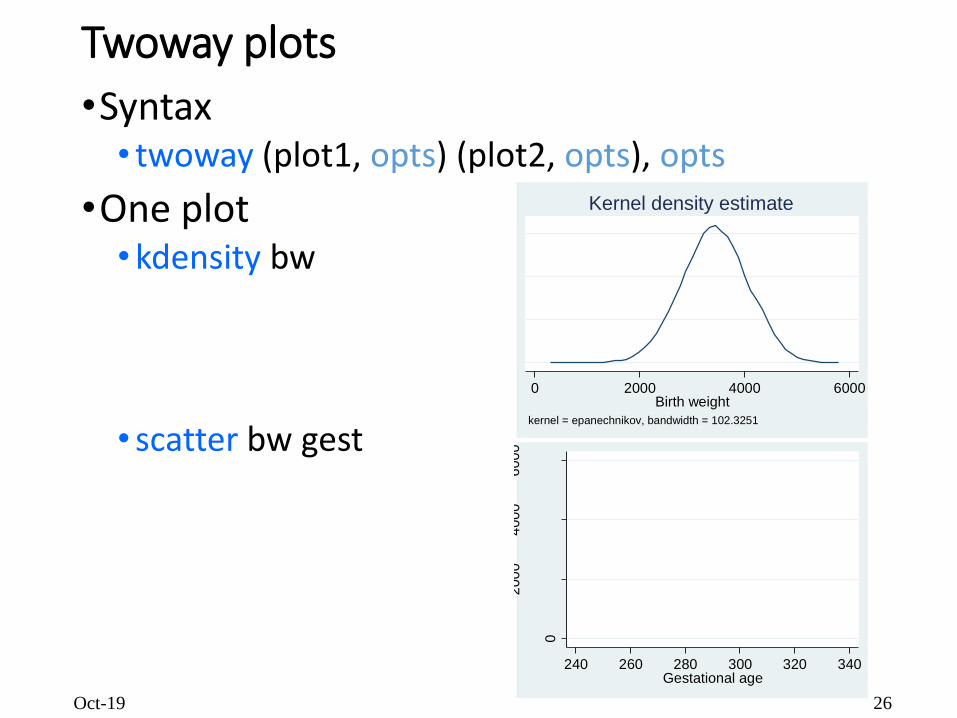
Twoway plots
•Syntax• twoway (plot1, opts) (plot2, opts), opts
•One plot•kdensity bw
• scatter bw gest
Oct-19 26
0 2000 4000 6000Birth weight
kernel = epanechnikov, bandwidth = 102.3251
Kernel density estimate
0
200
04
00
06
00
0
Birth
we
igh
t
240 260 280 300 320 340Gestational age
Oct-19 27
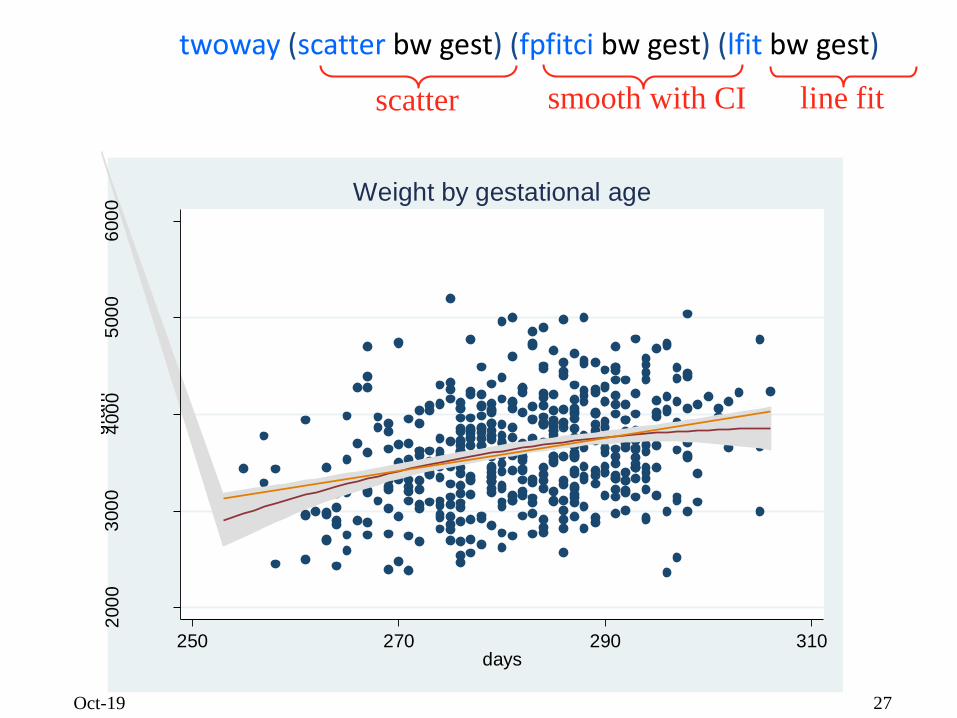
twoway (scatter bw gest) (fpfitci bw gest) (lfit bw gest)
200
03
00
04
00
05
00
06
00
0g
ram
250 270 290 310days
Weight by gestational age
scatter smooth with CI line fit
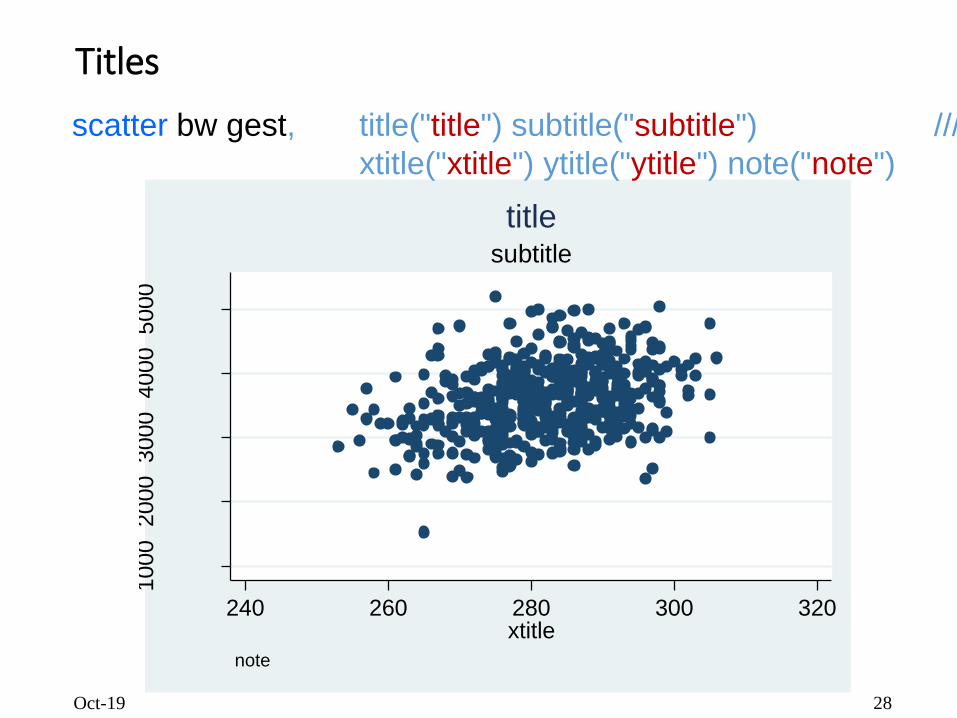
Titles
Oct-19 28
1000
2000
3000
4000
5000
ytitle
240 260 280 300 320xtitle
note
subtitle
title
scatter bw gest, title("title") subtitle("subtitle") ///
xtitle("xtitle") ytitle("ytitle") note("note")
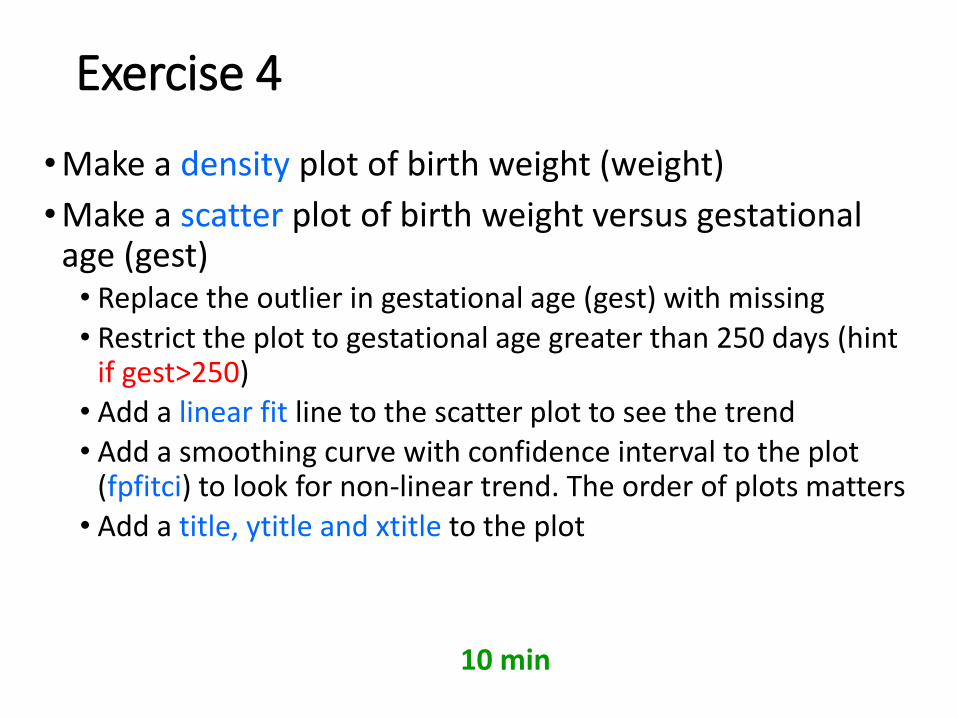
Exercise 4
•Make a density plot of birth weight (weight)
•Make a scatter plot of birth weight versus gestational age (gest)• Replace the outlier in gestational age (gest) with missing
• Restrict the plot to gestational age greater than 250 days (hint if gest>250)• Add a linear fit line to the scatter plot to see the trend• Add a smoothing curve with confidence interval to the plot
(fpfitci) to look for non-linear trend. The order of plots matters• Add a title, ytitle and xtitle to the plot
10 min

BIVARIATE ANALYSIS
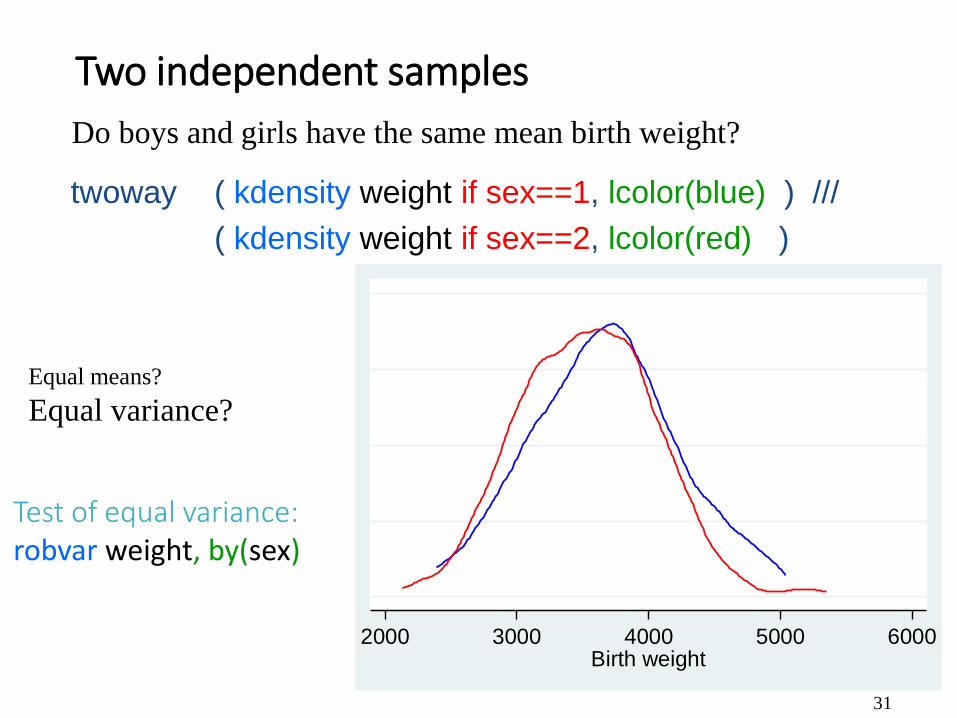
Two independent samples
31
2000 3000 4000 5000 6000Birth weight
twoway ( kdensity weight if sex==1, lcolor(blue) ) ///
( kdensity weight if sex==2, lcolor(red) )
Equal means?
Equal variance?
Do boys and girls have the same mean birth weight?
Test of equal variance:robvar weight, by(sex)
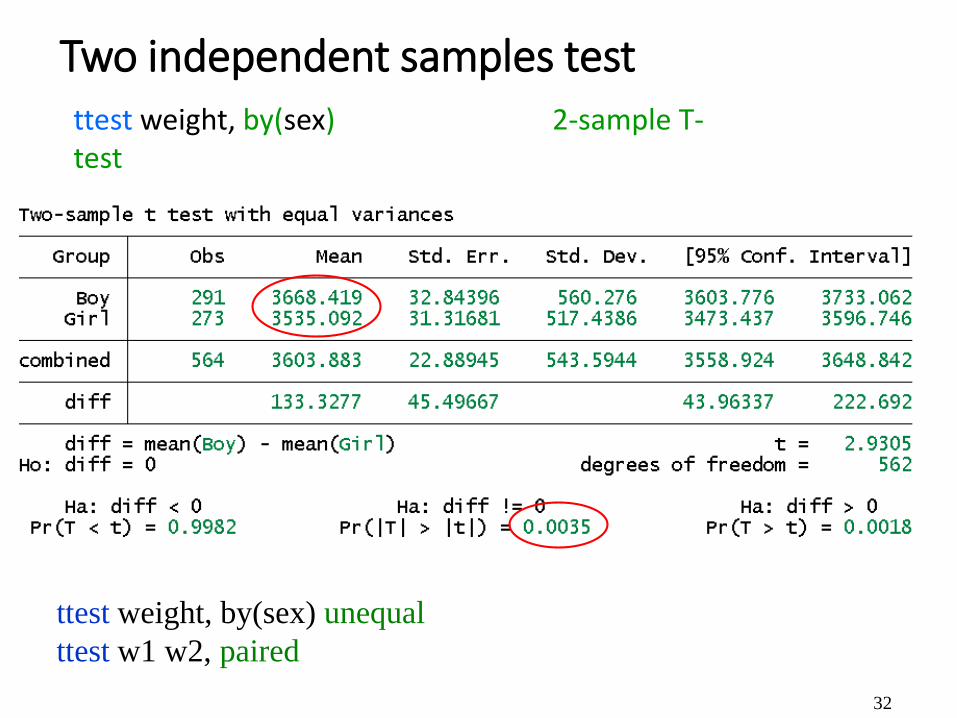
Two independent samples test
32
ttest weight, by(sex) unequal
ttest w1 w2, paired
ttest weight, by(sex) 2-sample T-test
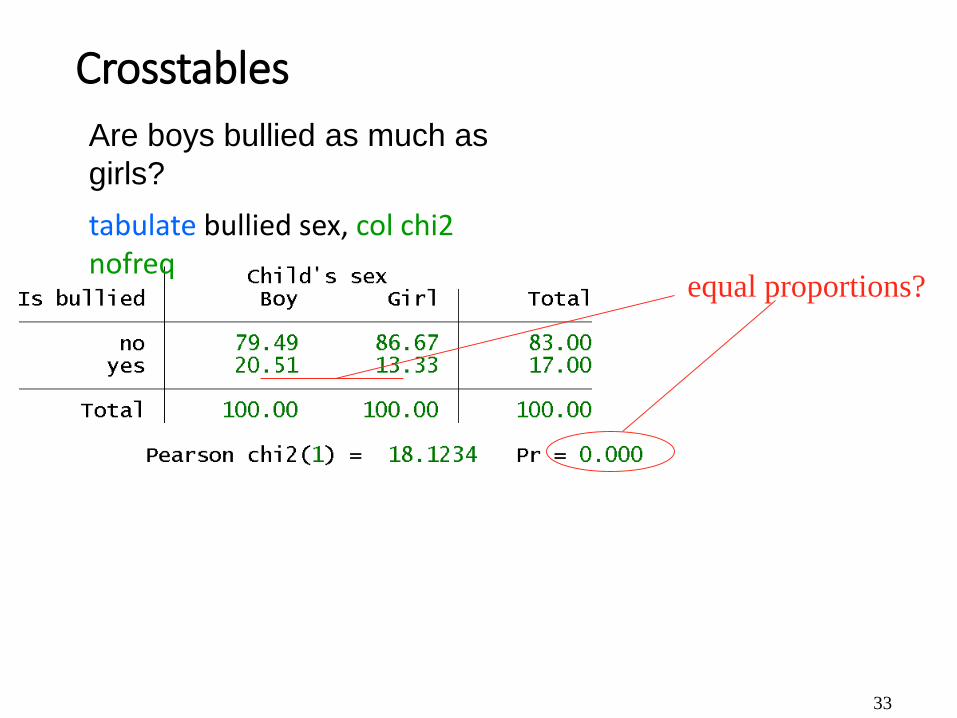
Crosstables
33
equal proportions?
Are boys bullied as much as
girls?
tabulate bullied sex, col chi2 nofreq
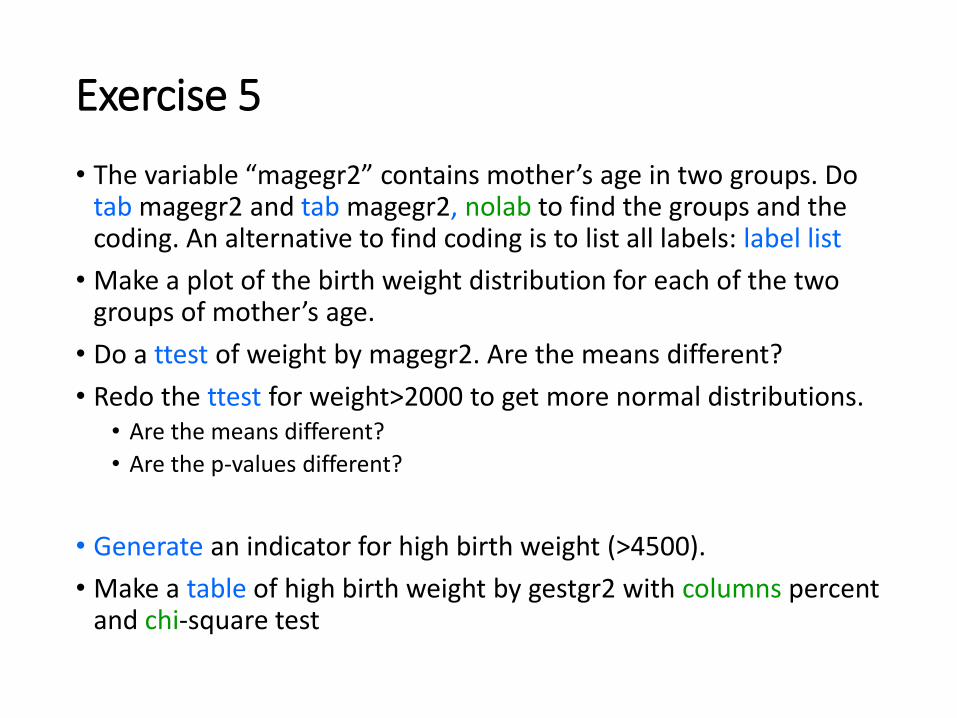
Exercise 5
• The variable “magegr2” contains mother’s age in two groups. Do tab magegr2 and tab magegr2, nolab to find the groups and the coding. An alternative to find coding is to list all labels: label list
• Make a plot of the birth weight distribution for each of the two groups of mother’s age.
• Do a ttest of weight by magegr2. Are the means different?
• Redo the ttest for weight>2000 to get more normal distributions.• Are the means different?
• Are the p-values different?
• Generate an indicator for high birth weight (>4500).
• Make a table of high birth weight by gestgr2 with columns percent and chi-square test
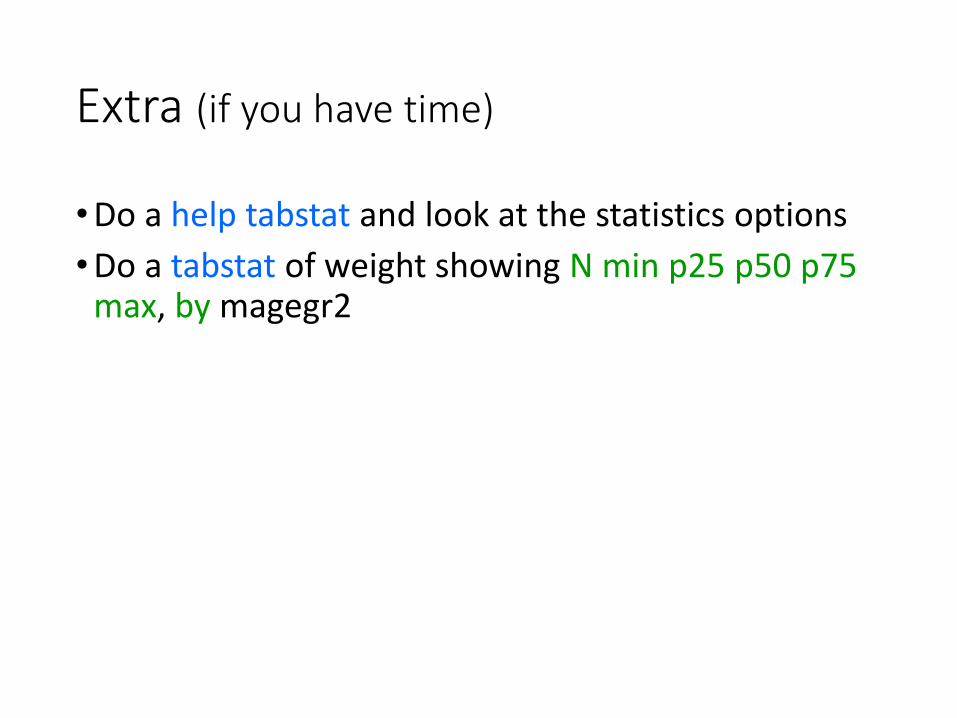
Extra (if you have time)
•Do a help tabstat and look at the statistics options
•Do a tabstat of weight showing N min p25 p50 p75 max, by magegr2
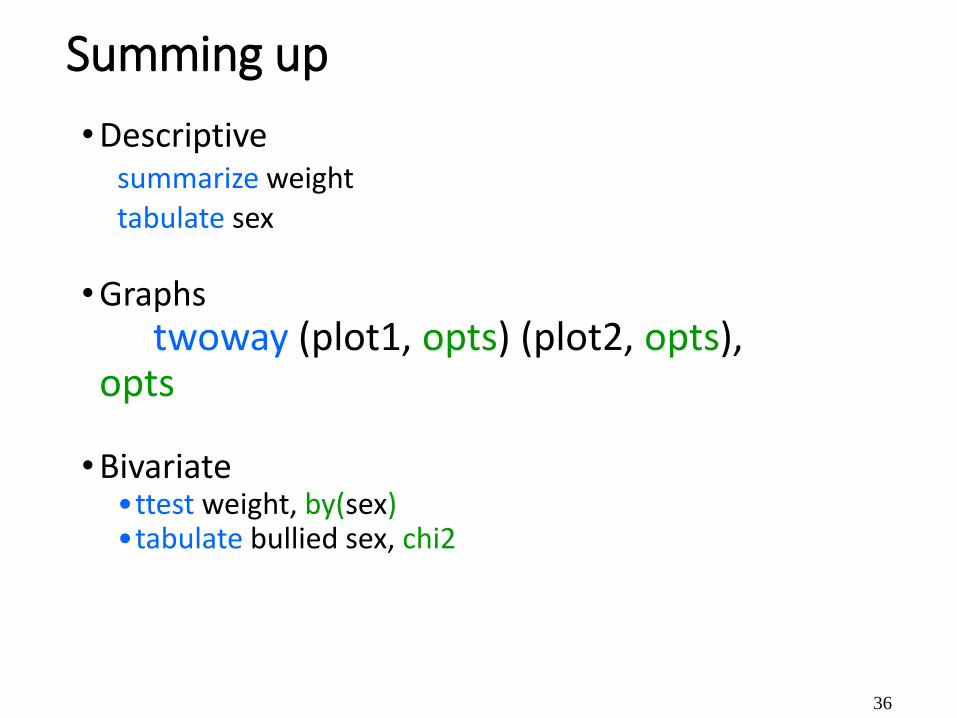
Summing up
•Descriptivesummarize weighttabulate sex
•Graphstwoway (plot1, opts) (plot2, opts),
opts
•Bivariate•ttest weight, by(sex)•tabulate bullied sex, chi2
36

EXTRA MATERIAL
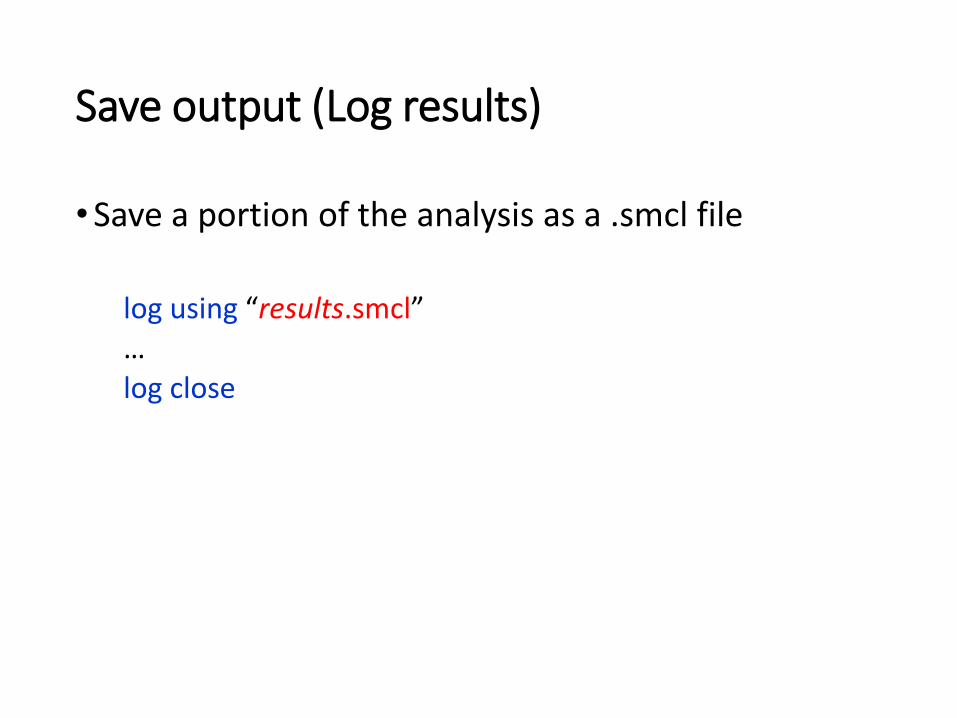
Save output (Log results)
•Save a portion of the analysis as a .smcl file
log using “results.smcl”…log close
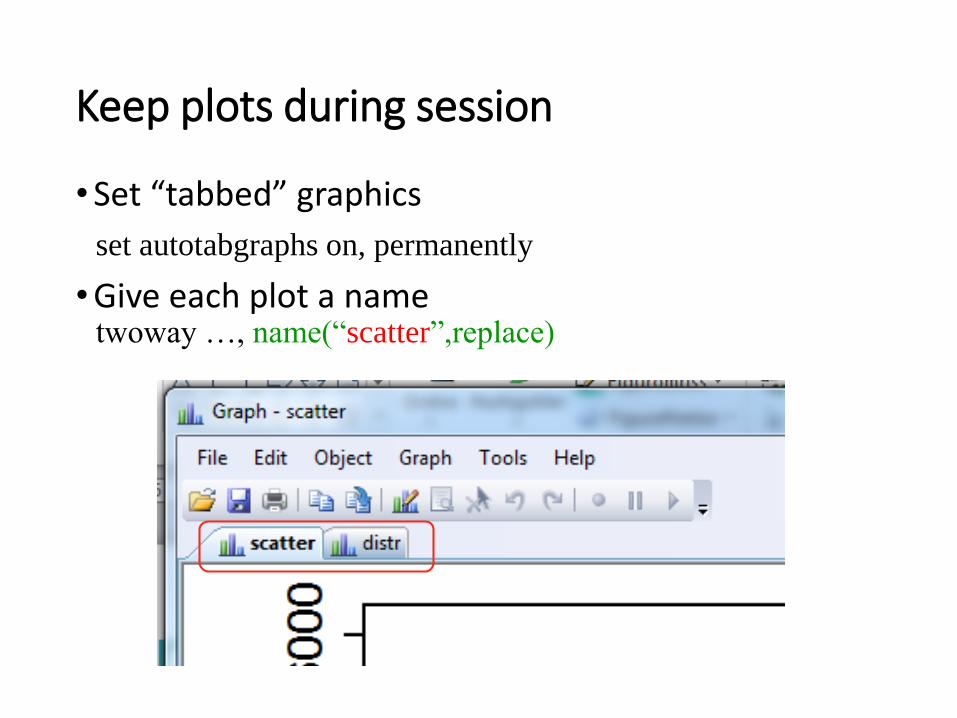
Keep plots during session
•Set “tabbed” graphics
•Give each plot a name
set autotabgraphs on, permanently
twoway …, name(“scatter”,replace)
Copy output
•Copy graphs to Word or PowerPoint
• Save graphs in many formats, or• Right-click on a graph to copy
•Copy tables to Excel
• Mark table, Ctrl-shift-C