Embed Size (px)
Citation preview
REPORT # 00-05
OFFICE OF THE LEGISLATIVE AUDITORSTATE OF MINNESOTA
PROGRAM EVALUATION REPORT
State EmployeeCompensation
FEBRUARY 2000
Photos courtesy of City of Minnetonka and Legislative Auditor staff
OO LLL AA

Photo Credits:
The cover photographs were provided by the Minnesota Zoo, Minnesota Department of Health, and the Office of the LegislativeAuditor. The photograph on page 10 was provided by the Minnesota Department of Health. The photographs on pages 25 and 30were taken by the Office of the Legislative Auditor.
Room 140, 658 Cedar Street, St. Paul, Minnesota 55155-1603 • Tel: 651/296-4708 • Fax: 651/296-4712E-mail: [email protected] • TDD Relay: 651/297-5353 • Website: www.auditor.leg.state.mn.us
Office of the Legislative AuditorState of Minnesota • James Nobles, Legislative Auditor
February 3, 2000
MembersLegislative Audit Commission
In April 1999, the Legislative Audit Commission directed us to conduct a study of stateemployee compensation. Legislators expressed interest in learning how state governmentsalaries and benefits compared to compensation offered by other employers in the private andpublic sectors. Some legislators also wanted to know which jobs were causing the greatestrecruitment and retention problems for state agencies.
Not including the University of Minnesota, the state employs about 50,000 workers in a widevariety of jobs. We found the state to be generally competitive in the salaries and benefits itoffers, but like public employers in general, state pay is relatively high for lower-skilled jobs andrelatively low for upper-level professional and managerial jobs.
Almost all state agencies reported some problems recruiting and retaining various types ofemployees. State agency human resource directors attribute many recruitment problems to thecurrent tight labor market, but also identified compensation as a factor of secondary importancein certain situations.
This report was researched and written by Elliot Long (project manager), Jennifer Moenck Feige,and Craig Helmstetter, with assistance from Beth Haney. We thank staff of the Department ofEmployee Relations and the Minnesota State Colleges and Universities for their assistance.
Sincerely,
/s/ James Nobles /s/ Roger Brooks
James Nobles Roger BrooksLegislative Auditor Deputy Legislative Auditor
������ ���
Table of Contents
Page
SUMMARY ix
INTRODUCTION 1
1. BACKGROUND 3Characteristics of State EmploymentOrganization of Human Resources in State GovernmentCompensation PolicySummary
2. COMPENSATION 19Salary ComparisonsEmployee BenefitsSummary
3. RECRUITMENT AND RETENTION 49Current Recruitment and Retention ProblemsSuggestions for ChangeSummary
APPENDICESA. State of Minnesota Career Families 63B. Central States Salary Comparisons 81
FURTHER READING 85
AGENCY RESPONSE 87
RECENT PROGRAM EVALUATIONS Back Cover
List of Tables and Figures
Tables Page
1.1 Employees by Executive Branch Agency, 1999 71.2 Largest Career Families, 1999 81.3 Job Family Growth, 1985-98 91.4 Hay Job Evaluation Factors 121.5 State Employees by Bargaining Unit, 1999 142.1 National Rankings of Minnesota State and Local Government
Employment, 1998 202.2 Minnesota Positions with Top-Ranking Salaries in Central
States Survey, 1998 212.3 Public Sector Monthly Pay in Minnesota, 1999 232.4 Average Hourly Wages, State of Minnesota and Private Sector
Employees, 1999 282.5 Regional Variation in Pay in Minnesota, 1996-97 322.6 Variation in Average State Employee Wages, Twin Cities and
Outstate Minnesota, 1999 342.7 Regional Variation in Average State Employee Wages,
Minnesota Metro Areas, 1999 352.8 Average Salaries, Faculty at MnSCU Four Year Institutions,
FY 1999 372.9 Average Salaries, Faculty at MnSCU Two Year Institutions,
FY 1999 382.10 Full-Time Employees Receiving Selected Benefits 412.11 Average Days of Paid Annual Leave After Specified Years
of Employment 432.12 Employer Costs per Employee Hour, National Averages, 1999 452.13 Employer Costs per Employee Hour, Private Industry by Size
of Establishment, 1999 462.14 Employer Costs per Employee Hour, State and Local
Governments Nationally and Minnesota State Government, 1999 473.1 State Agency Recruitment and Retention Problems 513.2 Information Technology Recruitment/Retention Problems 523.3 Reasons for Information Technology Recruitment/Retention
Problems 533.4 Office Administration Recruitment/Retention Problems 543.5 Reasons for Office Administration Recruitment/Retention Problems 543.6 Accounting Recruitment/Retention Problems 553.7 Reasons for Accounting Recruitment/Retention Problems 563.8 Suggestions for the Department of Employee Relations 573.9 Suggestions for the Legislature 57
Figures Page
1.1 Number of Minnesota State Employees (Total Appointments),1980-99 4
1.2 Minnesota State Payroll, 1980-98 51.3 Payroll per State Government Employee, National Average and
Minnesota, 1980-98 62.1 Average Hourly Pay in Minnesota, 1998 242.2 Occupational Distribution for State Government and Private
Industry in Minnesota 262.3 Average Hourly Salary by Job Complexity, Minnesota State
Employees, 1999 292.4 Average Annual Salary by Job Complexity Rating, Minnesota
State Government and National Market, 1999 30
viii STATE EMPLOYEE COMPENSATION
Major Findings:
• State government’s workforceincludes a higher proportion ofwhite collar jobs than the privatesector and, as a result, the state’saverage wage rate is higher than theprivate sector’s. (p. 25 in the fullreport)*
• Lower-skill jobs in stateemployment pay relatively morethan comparable private sector jobs,and higher-skill jobs pay relativelyless. As a result, there is lessvariation between the highest andlowest-paid jobs. (p. 27)
• Minnesota pays its state employeeshigher salaries than most otherstates. (p. 21)
• State government salaries do notvary across Minnesota as much aswages in general. Twin Cities areawages are about 15 to 20 percenthigher than wages in most outstatemetropolitan areas and thenonmetropolitan balance of thestate, while state pay is about 5percent higher in the Twin Citiesarea than outstate. (p. 31)
• Faculty at MnSCU four-yearinstitutions are paid at about thenational average for similarinstitutions. Faculty at the two-yeartechnical and community collegesare paid above the national average.(p. 36)
• Minnesota employee benefits equalabout 31 percent of totalcompensation. This percentage iscomparable to public employers andlarge private employers nationally,but distinctly higher than smallprivate employers. (p. 39)
• State agencies are experiencing avariety of problems recruiting andretaining employees. Compensationis one of several factors mentionedby state agencies as part of theproblem, but it is not the dominantfactor. The three job categories thathuman resource directors report ashaving the most serious recruitingand retention problems areinformation technology, accounting,and office clerical positions. (p. 49)
Evaluation Report Summary: PE00-05
OOLL AA OFFICE OF THE LEGISLATIVE AUDITOR
STATE OF MINNESOTA
State Employee CompensationFebruary 3, 2000
*For the full evaluation report, StateEmployee Compensation (#PE00-05),
which includes the agency’s response, call651/296-4708 or download from:
www.auditor.leg.state.mn.us/ped/2000/PE0005.htm.
Room 140, 658 Cedar Street, St. Paul, MN 55155 -- Tel: 651-296-4708 -- Fax: 651-296-4712 -- E-mail: [email protected]
Report Summary:
Minnesota employs about 50,000people in executive branch
agencies. The state is engaged in a widevariety of operations and employspeople in over 2,200 different jobs. It isuseful to periodically compare statecompensation with that offered by thepublic and private employers with whichthe state competes for workers.
Minnesota statutes direct theDepartment of Employee Relations towork toward a compensation structurethat is internally consistent, withequivalent jobs receiving equal pay, andthat bears a reasonable relationship tothe external job market. These goals arethemselves partially incompatible, butMinnesota’s employee compensationstructure is not the result of rationalplanning so much as it is the result ofbudgeting and bargaining processes inwhich political influence is exercisedand trade-offs are made. Most stateemployees belong to unions whichbargain for them on matters affectingpay and working conditions, and thefunds potentially available for employeecompensation are set through the budgetprocess every two years.
As a Group, State Employees EarnMore than Private SectorEmployees
As a group, state employees are paidmore than private sector employeesbecause the state workforce contains ahigher concentration of professionalworkers and a lower concentration ofsales, craft, and assembly-line positions.According to data from the CurrentPopulation Survey, 37.5 percent of stateemployees work in professionaloccupations, for example, compared to12.4 percent of private sectoremployees. In the private sector, a farhigher percentage of workers are
employed in sales, craft, or assemblyline positions.
State Pay is Highly Compressed
Compared to the private sector, therange of salaries in state employment ishighly compressed. Upper levelmanagers and professional positions paymore in the private sector, andlower-complexity jobs pay more in stategovernment. For example, state-employed guards, janitors, and generalrepair workers all average over 30percent more than similar positions inthe private sector. Clerical occupationspay between 10 and 20 percent morethan comparable private sector jobs.Entry level buyers and contractingspecialists earn 20 percent more in stategovernment.
By law, salaries of upper-levelmanagerial and professional positions instate agencies are limited by departmenthead salaries, and department heads arelimited by the governor’s salary. Upperlevel managerial and professionalpositions pay much less in stategovernment than in the private sector,but comparisons are difficult to makebecause compensation and jobresponsibilities tend to be unique ratherthan standardized at this level. The stateof Minnesota uses a job evaluationsystem, the Hay system, that is also usedby many private and public employers tohelp achieve proportionality and equityin employee compensation. Anumerical Hay rating is calculated formost state jobs. Data from about 400employers using the Hay systemnationally show that private sectorsalaries are more than twice as high asstate salaries for upper level professionaland managerial positions with similarHay ratings.
x STATE EMPLOYEE COMPENSATION
Minnesota State Employees arePaid More than Employees ofOther States
Minnesota paid its state employeeshigher salaries in 1998 than most of the24 states participating in a widely usedsalary survey. Minnesota’s salariesranked in the upper third of participatingstates for 87 of 107 comparablepositions, and Minnesota paid thehighest salary of all participating statesfor 21 positions. Minnesota salarieswere above the average paid by a subsetof Midwestern states for over 80 percentof the positions.
State Employee Salaries VaryLittle Across Minnesota
Economic conditions vary widely acrossMinnesota. According to data from theMinnesota Department of EconomicSecurity, wages in the Twin Cities areaare at least 20 percent higher than wagesin outstate metropolitan areas and thenonmetropolitan balance of the state.State pay, however, is set by statewidesalary schedules (and bargained for bystatewide bargaining units). While thereis some variation in the pay of stateemployees around the state, it is muchless than the geographic variation in payoffered by employers in general.
MnSCU Faculty Pay is At orAbove Average
There are over 8,500 faculty positions inthe Minnesota State Colleges andUniversities system (MnSCU), thusfaculty are a sizable proportion of stateemployees. In general, full-time facultyat MnSCU’s four-year institutions arepaid very near the national average forsimilar institutions. MnSCU salaries arealso near the average for comparablepositions in Illinois, Indiana, Iowa,Michigan, and Wisconsin.
Full-time faculty at MnSCU’s two-yearinstitutions (community and technicalcolleges) are paid above the nationalaverage for similar institutions, butMinnesota’s average for two-yearcolleges is similar to the average forcomparable faculty jobs in Illinois,Indiana, Iowa, Michigan, andWisconsin.
Minnesota Offers CompetitiveEmployee Benefits
Employee benefits are an important partof total compensation and must beconsidered when making comparisonsamong employers. Although benefitshave been extended among privateemployers in recent decades,government employees are still morelikely to receive most kinds of benefits.
Minnesota state employees, likegovernment employees in general,receive more paid holidays, vacationdays, and paid sick leave thanemployees of private companies.Minnesota employees receive 11 paidholidays per year, compared to thenational average of 9.3 days foremployees in medium and large privateestablishments, 7.6 days for employeesin small private establishments, and 11.5days for all state and local governmentemployees. Minnesota employeesreceive 13 to 29 days of vacation(depending on years of service)compared to lower vacation accrualrates for public and private employeesnationally.
The state of Minnesota offers a benefitpackage that, measured by cost, isgenerally equal to or better than benefitsoffered by other states, other publicemployers in Minnesota, and private andpublic employers nationally. About 31percent of Minnesota state employeecompensation is in the form of benefits.This compares to 29 percent for stateand local governments nationally, and
SUMMARY xi
27 percent for private employers. Largeprivate employers, those with over 500employees, pay 30 percent ofcompensation in the form of benefits, alevel close to that paid by Minnesotaand other government employers.
Most State Agencies ReportProblems with Recruitment
Almost all large state agencies reportedsome problems with employeerecruitment and retention. The three jobcategories identified as presenting thegreatest problem currently areinformation technology, officeadministration (clerical), and accountingjobs.
Inadequate compensation was notidentified as the most important factor inthese cases, although it was a strongsecond in the case of informationtechnology jobs, and mentioned bynearly 60 percent of state agency human
resource directors. The top problem inall three cases was an insufficient laborpool with the needed skills orexperience. One-third of the humanresource directors suggested that raisingsalaries to competitive levels would helpaddress the problems, but even moresuggested improving the hiring processand strengthening recruitment efforts.
xii STATE EMPLOYEE COMPENSATION
Summary of Agency Response:
In response to the study Deputy Commissioner Jim Lee wrote onJanuary 20, 2000: “The portion of the report that compares state salaries
and benefits to other employers in the public and private sectors isreminiscent of the Public Employment Study . . . released in 1979. Theearlier study also found that state and local governments tend to pay morethan the private sector for jobs at similar levels of complexity, except forhigh level managerial positions.”
“The Legislature did provide significant relief to the salary compression atthe upper end of the salary structure with the passage of the agency head paybill in 1997. However the new salary limits for agency heads still put theExecutive Branch at a disadvantage in comparison to local units ofgovernment.”
Deputy Commissioner Lee also noted: “In spite of the fact that your dataindicates that state salaries for clerical jobs are at least 20 percent above theprivate sector, 21 percent of human resources directors surveyed identifiedinadequate compensation as contributing to their difficulty in recruiting andretaining employees in these classifications. This indicates that salary dataand actual recruiting experience can tell two different stories.”
Introduction
In May 1999 the Legislative Audit Commission directed us to conduct ananalysis of Minnesota state employee compensation. Legislators wanted to
know how state employee compensation compared to pay and benefits offered byother public and private employers with which the state competes for workers.Some legislators were concerned about the state’s ability to recruit workers withskills in short supply.
By any reckoning, the state of Minnesota is a large employer. The state employsabout 50,000 workers in 2,200 different jobs. Counting state executive branchagencies and the Minnesota state colleges and universities (MnSCU), the state’spayroll reached $2.3 billion in fiscal year 1999. As an employer, the state ofMinnesota is larger than all but a few private companies in the nation.Government operations are also highly diverse compared to those of many privatecompanies. Achieving internal consistency and external competitiveness ofemployee compensation is a significant challenge, especially in a time of rapidchange in the nature of work and the skills required in many state jobs.
This study addresses the following research questions:
• How is the state’s human resources system organized? What is theprocess by which employee compesation is determined? What is thestate’s compensation policy? What are the significant features of stateemployment?
• How do state employee pay and benefits compare with compensationprovided by other public and private employers? Are there certaintypes of state jobs for which compensation is higher or lower thanmarket averages? How do state employee compensation andcompensation offered by other employers vary across Minnesota?
• What jobs are state agencies now having difficulty filling? What arethe reasons behind recruitment and retention problems? What stepscan the state take to address these problems?
This report compares state data on compensation with data from a variety ofgovernment and non-governmental sources including the Bureau of LaborStatistics, the United States Census Bureau, the Minnesota Department ofEconomic Security, and several national and local salary surveys. We alsoconducted our own survey of human resources staff in state agencies and theDepartment of Employee Relations.
In this report, Chapter 1 presents descriptive information on how the humanresource function is organized in state government. It provides data on significantfeatures of state employment that we anticipate will be of interest to
policy-makers including trends in employment and the mix of jobs in stategovernment.
Chapter 2 presents a comparison of state salaries and benefits with compensationoffered by other public and private employers in Minnesota and nationally.
Chapter 3 presents the results of a survey of state agency human resourcesdirectors who were asked to identify general and specific recruitment problemsand also asked for their recommendations on how to address these problems.
2 STATE EMPLOYEE COMPENSATION
11 Background
SUMMARY
The state of Minnesota executive branch agencies employ about50,000 workers in 2,200 jobs. State employment has grown quiteslowly over the last 19 years and the payroll per employee adjusted forinflation was almost unchanged during this period. The process bywhich state employee compensation is determined rests onmerit-system principles and the collective bargaining process. Statecompensation policy directs the Department of Employee Relations toachieve a pattern of compensation which is internally consistent andcompetitive in the larger economy.
In order to provide a context for our study of state employee compensation, thischapter asks:
• How many employees work for the state? How are they dividedamong the major divisions of state government? What are the mostpopulous job classes? How has state employment changed since 1980?
• How is the human resources function organized in Minnesota stategovernment?
• What is the process by which employee compensation is determined?What are the state’s compensation policies?
CHARACTERISTICS OF STATEEMPLOYMENT
As of December 1999, 49,853 people were employed in executive branch stateagencies including the Minnesota State Colleges and Universities system(MnSCU).1 Our study of state employee compensation is restricted to executivebranch employment; over 96 percent of state employees work in executive branch
1 This count also includes employees of the Minnesota State Retirement System, the Public Em-ployee Retirement Association, and the Teachers Retirement Association. This count includes ac-tive employees and those on paid or unpaid leave. University of Minnesota employees are not in-cluded in this total and are not covered by this report.
agencies.2 The non-executive branch state employees are distributed as follows:Approximately 860 employees (including temporary employees) work in thelegislative branch and 1,250 state employees work in the judicial branch.3
A look at the trend in state employment shows:
• State employment has grown slowly over the last 19 years.
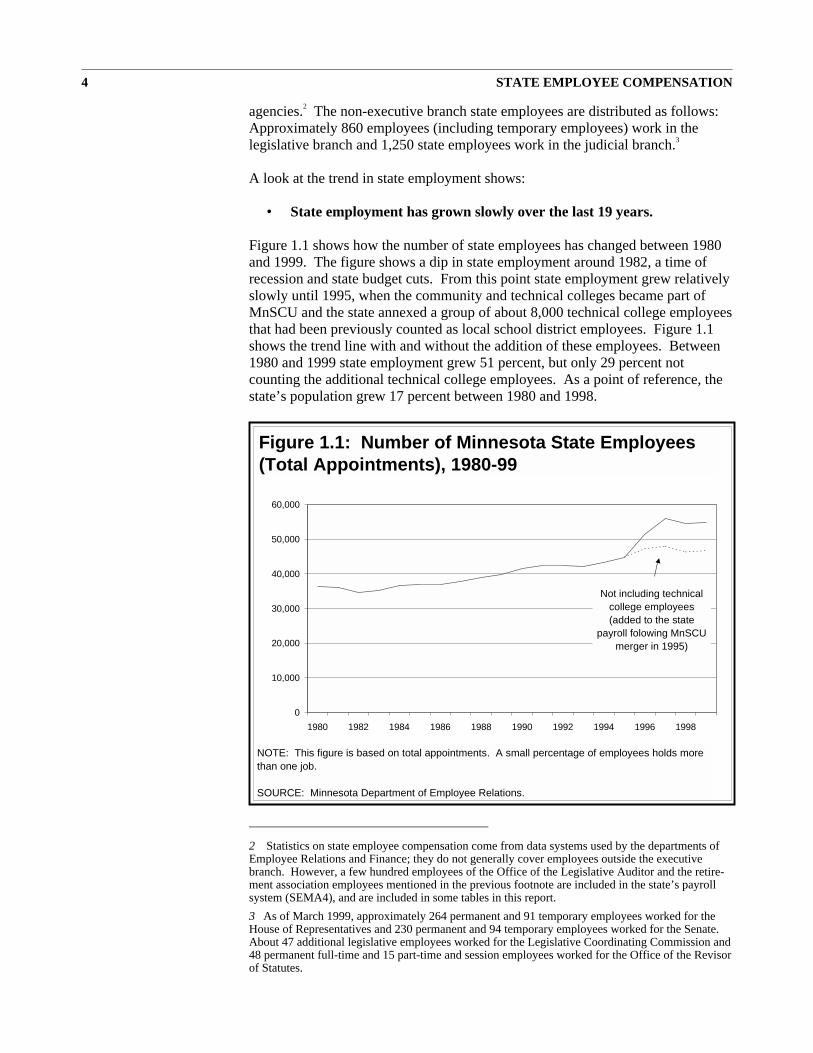
Figure 1.1 shows how the number of state employees has changed between 1980and 1999. The figure shows a dip in state employment around 1982, a time ofrecession and state budget cuts. From this point state employment grew relativelyslowly until 1995, when the community and technical colleges became part ofMnSCU and the state annexed a group of about 8,000 technical college employeesthat had been previously counted as local school district employees. Figure 1.1shows the trend line with and without the addition of these employees. Between1980 and 1999 state employment grew 51 percent, but only 29 percent notcounting the additional technical college employees. As a point of reference, thestate’s population grew 17 percent between 1980 and 1998.
4 STATE EMPLOYEE COMPENSATION
0
10,000
20,000
30,000
40,000
50,000
60,000
1980 1982 1984 1986 1988 1990 1992 1994 1996 1998
Figure 1.1: Number of Minnesota State Employees(Total Appointments), 1980-99
NOTE: This figure is based on total appointments. A small percentage of employees holds morethan one job.
SOURCE: Minnesota Department of Employee Relations.
Not including technicalcollege employees(added to the state
payroll folowing MnSCUmerger in 1995)
2 Statistics on state employee compensation come from data systems used by the departments ofEmployee Relations and Finance; they do not generally cover employees outside the executivebranch. However, a few hundred employees of the Office of the Legislative Auditor and the retire-ment association employees mentioned in the previous footnote are included in the state’s payrollsystem (SEMA4), and are included in some tables in this report.
3 As of March 1999, approximately 264 permanent and 91 temporary employees worked for theHouse of Representatives and 230 permanent and 94 temporary employees worked for the Senate.About 47 additional legislative employees worked for the Legislative Coordinating Commission and48 permanent full-time and 15 part-time and session employees worked for the Office of the Revisorof Statutes.
We also found:
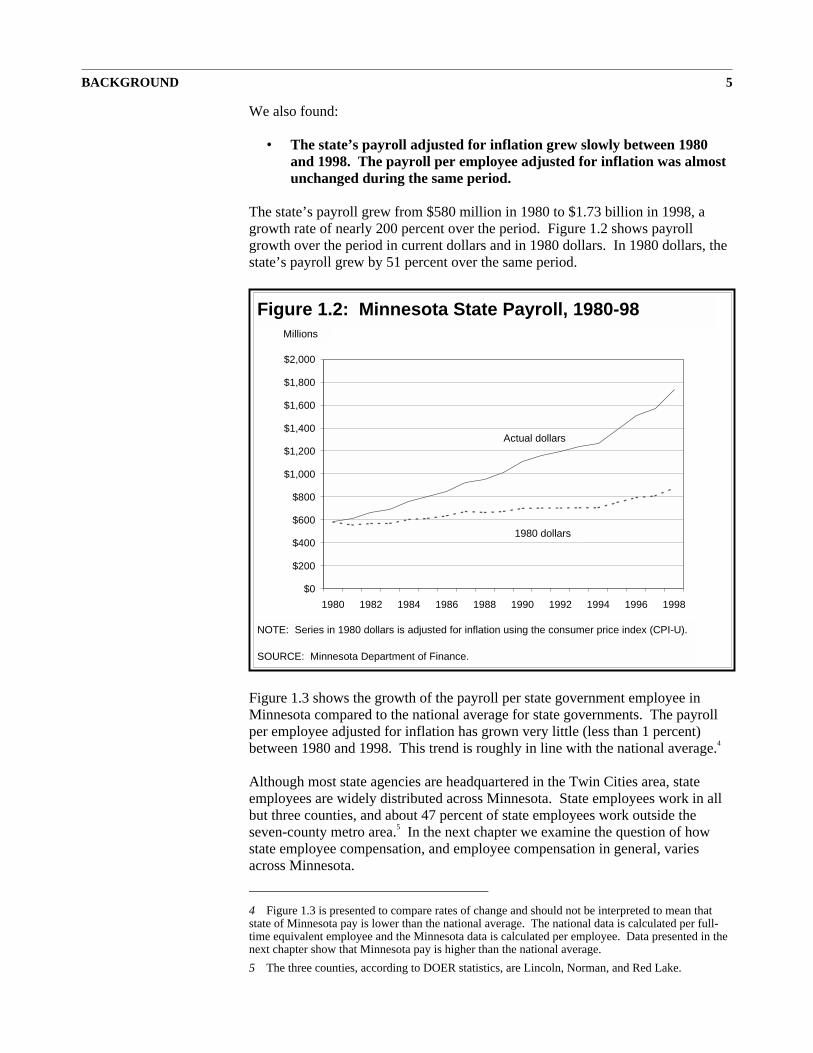
• The state’s payroll adjusted for inflation grew slowly between 1980and 1998. The payroll per employee adjusted for inflation was almostunchanged during the same period.
The state’s payroll grew from $580 million in 1980 to $1.73 billion in 1998, agrowth rate of nearly 200 percent over the period. Figure 1.2 shows payrollgrowth over the period in current dollars and in 1980 dollars. In 1980 dollars, thestate’s payroll grew by 51 percent over the same period.
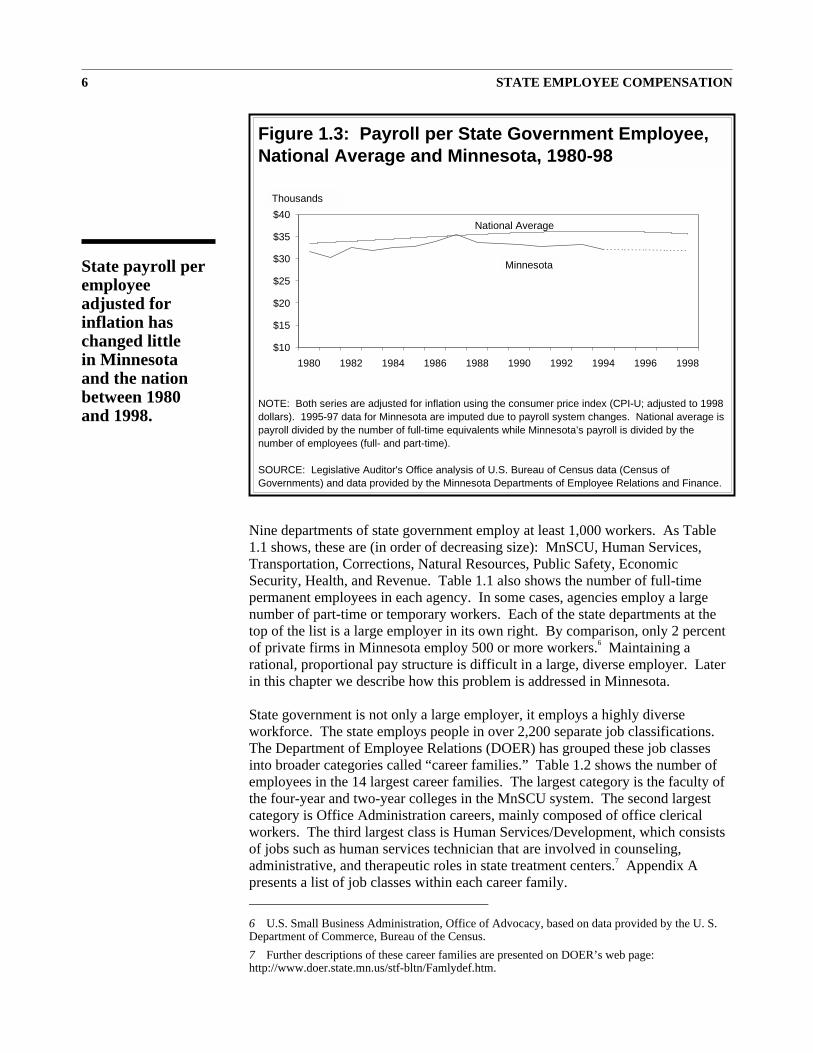
Figure 1.3 shows the growth of the payroll per state government employee inMinnesota compared to the national average for state governments. The payrollper employee adjusted for inflation has grown very little (less than 1 percent)between 1980 and 1998. This trend is roughly in line with the national average.4
Although most state agencies are headquartered in the Twin Cities area, stateemployees are widely distributed across Minnesota. State employees work in allbut three counties, and about 47 percent of state employees work outside theseven-county metro area.5 In the next chapter we examine the question of howstate employee compensation, and employee compensation in general, variesacross Minnesota.
BACKGROUND 5
$0
$200
$400
$600
$800
$1,000
$1,200
$1,400
$1,600
$1,800
$2,000
1980 1982 1984 1986 1988 1990 1992 1994 1996 1998
Figure 1.2: Minnesota State Payroll, 1980-98Millions
NOTE: Series in 1980 dollars is adjusted for inflation using the consumer price index (CPI-U).
SOURCE: Minnesota Department of Finance.
Actual dollars
1980 dollars
4 Figure 1.3 is presented to compare rates of change and should not be interpreted to mean thatstate of Minnesota pay is lower than the national average. The national data is calculated per full-time equivalent employee and the Minnesota data is calculated per employee. Data presented in thenext chapter show that Minnesota pay is higher than the national average.
5 The three counties, according to DOER statistics, are Lincoln, Norman, and Red Lake.
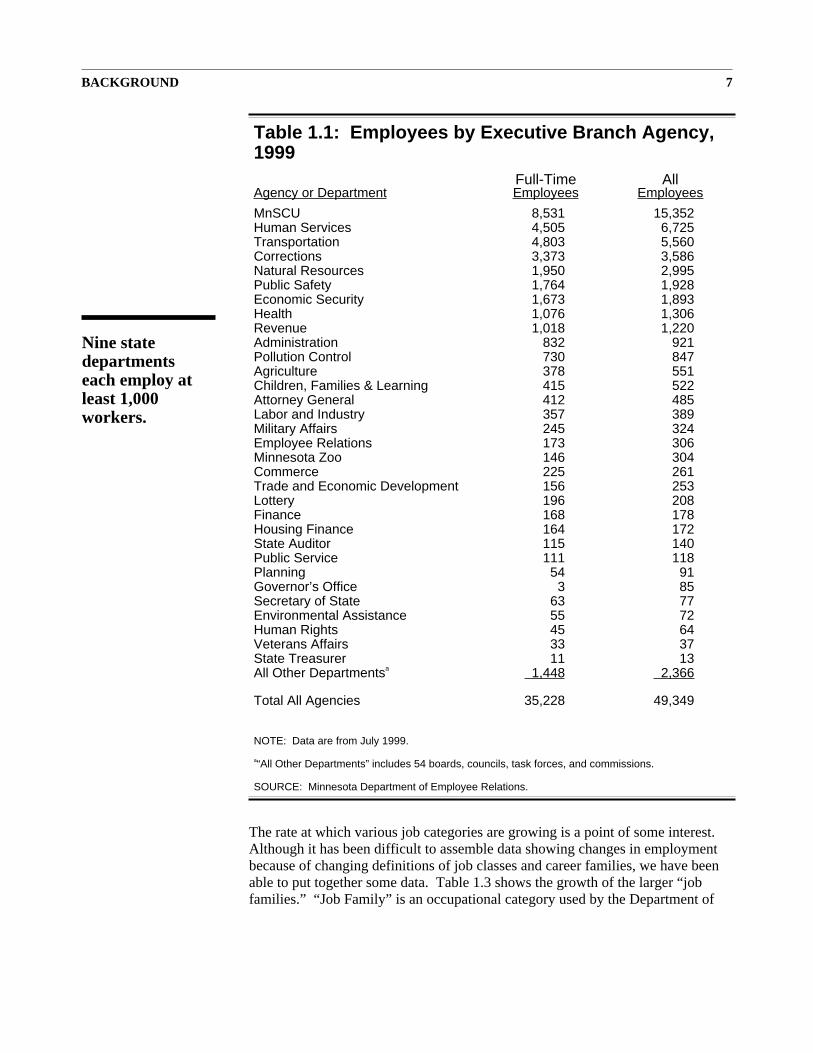
Nine departments of state government employ at least 1,000 workers. As Table1.1 shows, these are (in order of decreasing size): MnSCU, Human Services,Transportation, Corrections, Natural Resources, Public Safety, EconomicSecurity, Health, and Revenue. Table 1.1 also shows the number of full-timepermanent employees in each agency. In some cases, agencies employ a largenumber of part-time or temporary workers. Each of the state departments at thetop of the list is a large employer in its own right. By comparison, only 2 percentof private firms in Minnesota employ 500 or more workers.6 Maintaining arational, proportional pay structure is difficult in a large, diverse employer. Laterin this chapter we describe how this problem is addressed in Minnesota.
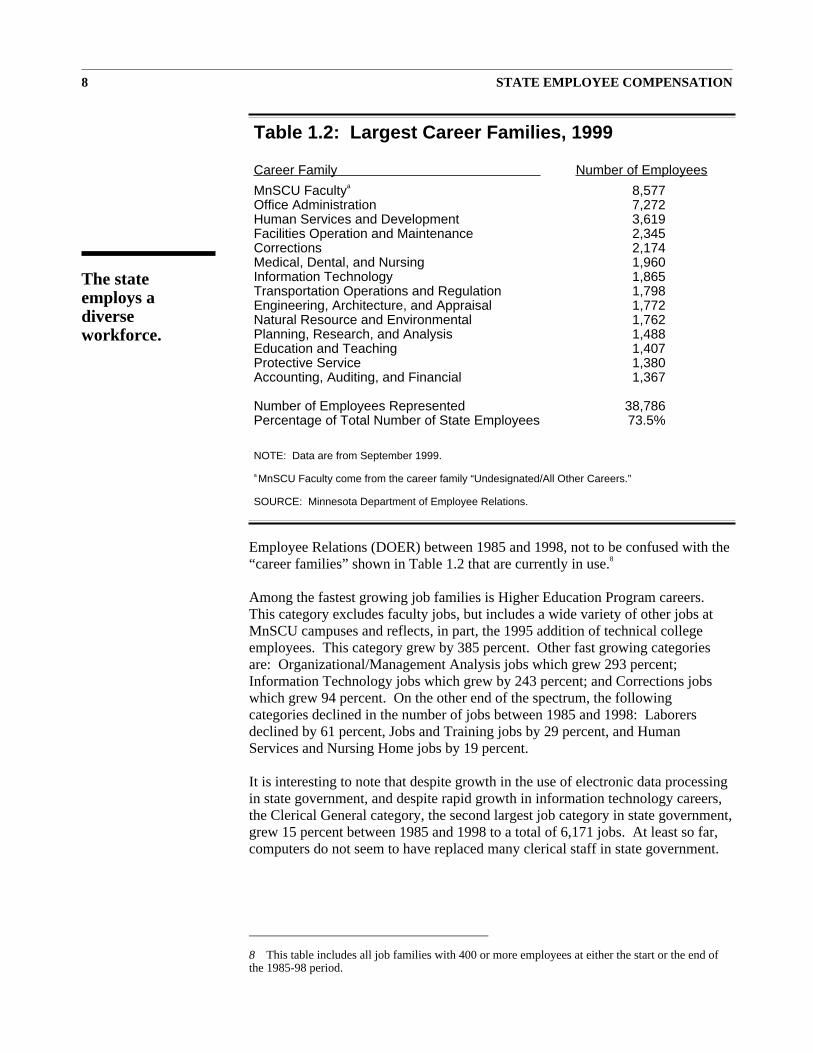
State government is not only a large employer, it employs a highly diverseworkforce. The state employs people in over 2,200 separate job classifications.The Department of Employee Relations (DOER) has grouped these job classesinto broader categories called “career families.” Table 1.2 shows the number ofemployees in the 14 largest career families. The largest category is the faculty ofthe four-year and two-year colleges in the MnSCU system. The second largestcategory is Office Administration careers, mainly composed of office clericalworkers. The third largest class is Human Services/Development, which consistsof jobs such as human services technician that are involved in counseling,administrative, and therapeutic roles in state treatment centers.7 Appendix Apresents a list of job classes within each career family.
6 STATE EMPLOYEE COMPENSATION
$10
$15
$20
$25
$30
$35
$40
1980 1982 1984 1986 1988 1990 1992 1994 1996 1998
NOTE: Both series are adjusted for inflation using the consumer price index (CPI-U; adjusted to 1998dollars). 1995-97 data for Minnesota are imputed due to payroll system changes. National average ispayroll divided by the number of full-time equivalents while Minnesota’s payroll is divided by thenumber of employees (full- and part-time).
SOURCE: Legislative Auditor's Office analysis of U.S. Bureau of Census data (Census ofGovernments) and data provided by the Minnesota Departments of Employee Relations and Finance.
Minnesota
National Average
Figure 1.3: Payroll per State Government Employee,National Average and Minnesota, 1980-98
Thousands
State payroll peremployeeadjusted forinflation haschanged littlein Minnesotaand the nationbetween 1980and 1998.
6 U.S. Small Business Administration, Office of Advocacy, based on data provided by the U. S.Department of Commerce, Bureau of the Census.
7 Further descriptions of these career families are presented on DOER’s web page:http://www.doer.state.mn.us/stf-bltn/Famlydef.htm.
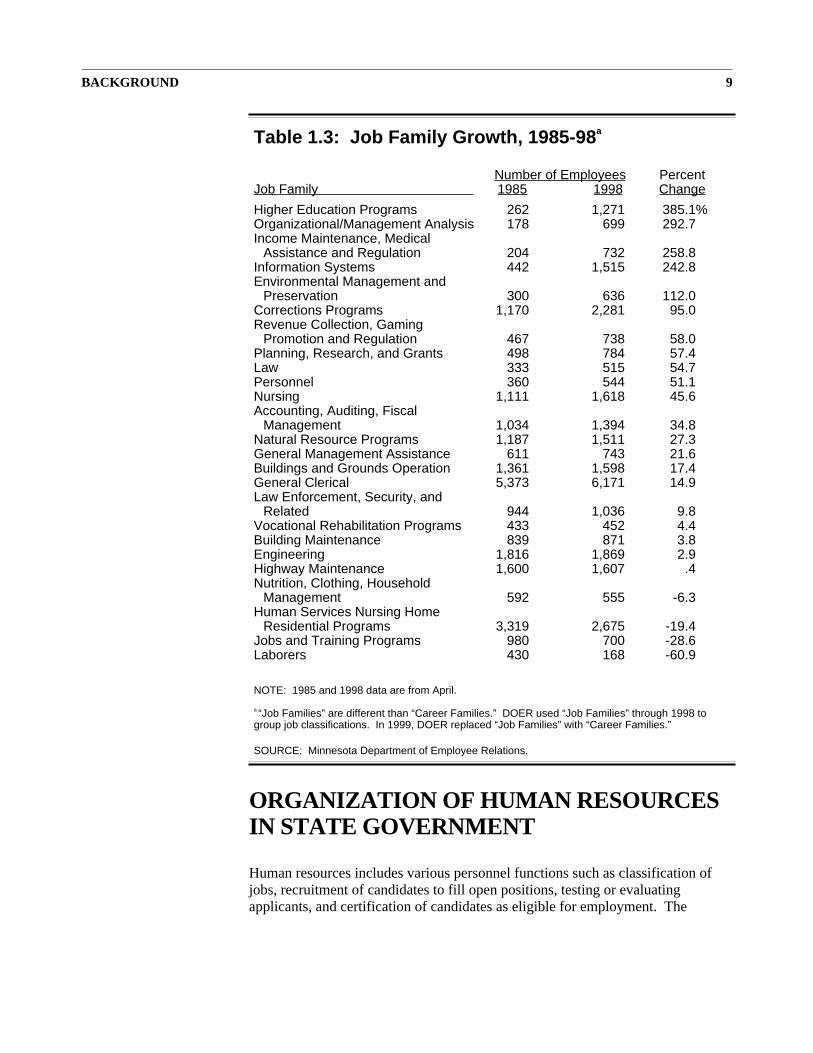
The rate at which various job categories are growing is a point of some interest.Although it has been difficult to assemble data showing changes in employmentbecause of changing definitions of job classes and career families, we have beenable to put together some data. Table 1.3 shows the growth of the larger “jobfamilies.” “Job Family” is an occupational category used by the Department of
BACKGROUND 7
Table 1.1: Employees by Executive Branch Agency,1999
Full-Time AllAgency or Department Employees Employees
MnSCU 8,531 15,352Human Services 4,505 6,725Transportation 4,803 5,560Corrections 3,373 3,586Natural Resources 1,950 2,995Public Safety 1,764 1,928Economic Security 1,673 1,893Health 1,076 1,306Revenue 1,018 1,220Administration 832 921Pollution Control 730 847Agriculture 378 551Children, Families & Learning 415 522Attorney General 412 485Labor and Industry 357 389Military Affairs 245 324Employee Relations 173 306Minnesota Zoo 146 304Commerce 225 261Trade and Economic Development 156 253Lottery 196 208Finance 168 178Housing Finance 164 172State Auditor 115 140Public Service 111 118Planning 54 91Governor’s Office 3 85Secretary of State 63 77Environmental Assistance 55 72Human Rights 45 64Veterans Affairs 33 37State Treasurer 11 13All Other Departmentsa 1,448 2,366
Total All Agencies 35,228 49,349
NOTE: Data are from July 1999.
a“All Other Departments” includes 54 boards, councils, task forces, and commissions.
SOURCE: Minnesota Department of Employee Relations.
Nine statedepartmentseach employ atleast 1,000workers.
Employee Relations (DOER) between 1985 and 1998, not to be confused with the“career families” shown in Table 1.2 that are currently in use.8
Among the fastest growing job families is Higher Education Program careers.This category excludes faculty jobs, but includes a wide variety of other jobs atMnSCU campuses and reflects, in part, the 1995 addition of technical collegeemployees. This category grew by 385 percent. Other fast growing categoriesare: Organizational/Management Analysis jobs which grew 293 percent;Information Technology jobs which grew by 243 percent; and Corrections jobswhich grew 94 percent. On the other end of the spectrum, the followingcategories declined in the number of jobs between 1985 and 1998: Laborersdeclined by 61 percent, Jobs and Training jobs by 29 percent, and HumanServices and Nursing Home jobs by 19 percent.
It is interesting to note that despite growth in the use of electronic data processingin state government, and despite rapid growth in information technology careers,the Clerical General category, the second largest job category in state government,grew 15 percent between 1985 and 1998 to a total of 6,171 jobs. At least so far,computers do not seem to have replaced many clerical staff in state government.
8 STATE EMPLOYEE COMPENSATION
Table 1.2: Largest Career Families, 1999
Career Family Number of Employees
MnSCU Facultya 8,577Office Administration 7,272Human Services and Development 3,619Facilities Operation and Maintenance 2,345Corrections 2,174Medical, Dental, and Nursing 1,960Information Technology 1,865Transportation Operations and Regulation 1,798Engineering, Architecture, and Appraisal 1,772Natural Resource and Environmental 1,762Planning, Research, and Analysis 1,488Education and Teaching 1,407Protective Service 1,380Accounting, Auditing, and Financial 1,367
Number of Employees Represented 38,786Percentage of Total Number of State Employees 73.5%
NOTE: Data are from September 1999.
a MnSCU Faculty come from the career family “Undesignated/All Other Careers.”
SOURCE: Minnesota Department of Employee Relations.
The stateemploys adiverseworkforce.
8 This table includes all job families with 400 or more employees at either the start or the end ofthe 1985-98 period.
ORGANIZATION OF HUMAN RESOURCESIN STATE GOVERNMENT
Human resources includes various personnel functions such as classification ofjobs, recruitment of candidates to fill open positions, testing or evaluatingapplicants, and certification of candidates as eligible for employment. The
BACKGROUND 9
Table 1.3: Job Family Growth, 1985-98a
Number of Employees PercentJob Family 1985 1998 Change
Higher Education Programs 262 1,271 385.1%Organizational/Management Analysis 178 699 292.7Income Maintenance, Medical
Assistance and Regulation 204 732 258.8Information Systems 442 1,515 242.8Environmental Management and
Preservation 300 636 112.0Corrections Programs 1,170 2,281 95.0Revenue Collection, Gaming
Promotion and Regulation 467 738 58.0Planning, Research, and Grants 498 784 57.4Law 333 515 54.7Personnel 360 544 51.1Nursing 1,111 1,618 45.6Accounting, Auditing, Fiscal
Management 1,034 1,394 34.8Natural Resource Programs 1,187 1,511 27.3General Management Assistance 611 743 21.6Buildings and Grounds Operation 1,361 1,598 17.4General Clerical 5,373 6,171 14.9Law Enforcement, Security, and
Related 944 1,036 9.8Vocational Rehabilitation Programs 433 452 4.4Building Maintenance 839 871 3.8Engineering 1,816 1,869 2.9Highway Maintenance 1,600 1,607 .4Nutrition, Clothing, Household
Management 592 555 -6.3Human Services Nursing Home
Residential Programs 3,319 2,675 -19.4Jobs and Training Programs 980 700 -28.6Laborers 430 168 -60.9
NOTE: 1985 and 1998 data are from April.
a “Job Families” are different than “Career Families.” DOER used “Job Families” through 1998 togroup job classifications. In 1999, DOER replaced “Job Families” with “Career Families.”
SOURCE: Minnesota Department of Employee Relations.
Minnesota Department of EmployeeRelations (DOER) is the state’s centralhuman resources agency.9
In 1939, Minnesota became one of thefirst states to enact civil service reformslinking hiring and promotion toevaluation of skills related to the job,and establishing the Department ofCivil Service, a forerunner of theDepartment of Employee Relations.Collective bargaining was authorizedby The Public Employee LaborRelations Act (PELRA) enacted in1971 and amended in 1973 to permit alimited right to strike for manyemployees. PELRA was furtheramended in 1980 to create statewidebargaining units and extend the right tostrike.10 These laws established the twokey elements of Minnesota’s humanresources policy: to base employeeselection and promotion on merit ratherthan personal or political relationships,
and to rely on collective bargaining to establish employee compensation andworking conditions.
As late as the 1970s human resources services were substantially centralized inwhat was then called the Department of Personnel. This arrangement emphasizedthe regulatory responsibility of the central human resources department to preventany departure from merit system principles. However, centralized expertise overthe staffing needs of agencies proved difficult to maintain, and complaints aboutpoor service grew.11 Over the last two decades the system has evolved so thatgreater functional responsibility is now placed in the human resource sections ofstate agencies and service rather than regulation is increasingly emphasized as thecentral responsibility of DOER. The Department of Employee Relations stillserves as the single employer for the executive branch, however, and is stillexpected to provide expertise and statewide consistency in personnelmanagement.12
DOER delegates control of many human resources functions to the larger stateagencies while providing comprehensive services only for small agencies. Thedelegated functions typically include development of experience and training
10 STATE EMPLOYEE COMPENSATION
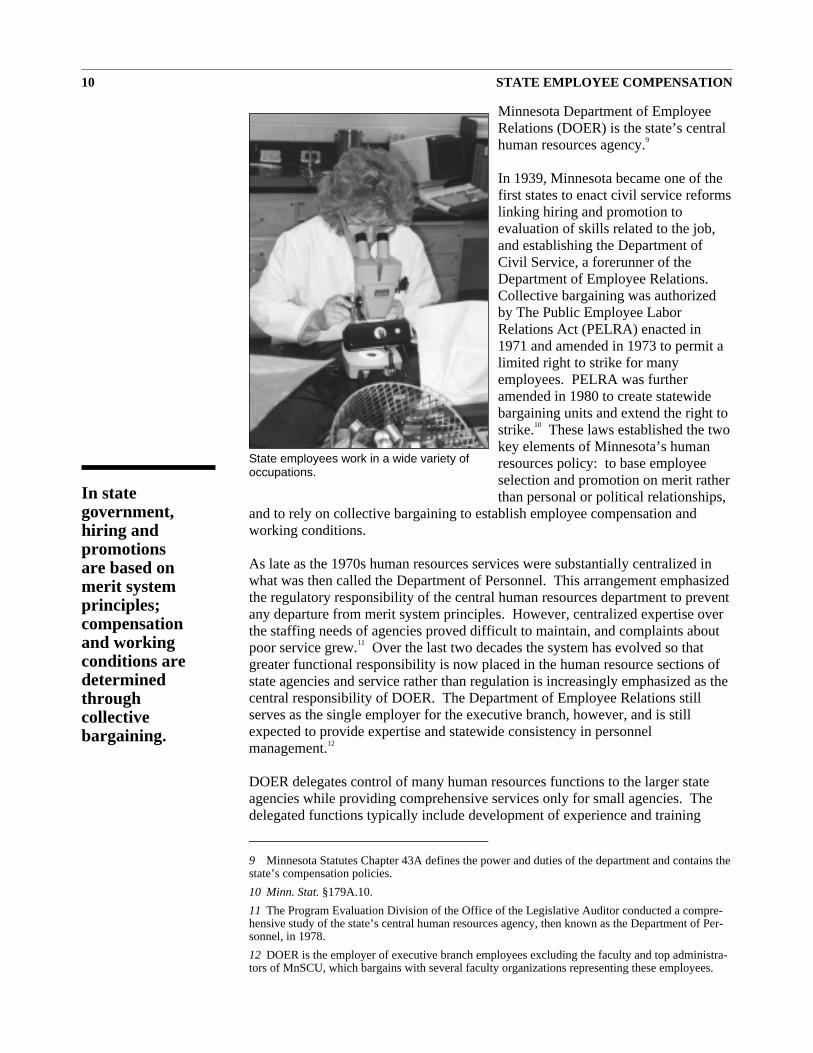
State employees work in a wide variety ofoccupations.
In stategovernment,hiring andpromotionsare based onmerit systemprinciples;compensationand workingconditions aredeterminedthroughcollectivebargaining.
9 Minnesota Statutes Chapter 43A defines the power and duties of the department and contains thestate’s compensation policies.
10 Minn. Stat. §179A.10.
11 The Program Evaluation Division of the Office of the Legislative Auditor conducted a compre-hensive study of the state’s central human resources agency, then known as the Department of Per-sonnel, in 1978.
12 DOER is the employer of executive branch employees excluding the faculty and top administra-tors of MnSCU, which bargains with several faculty organizations representing these employees.
ratings, eligible list establishment and maintenance, administration ofexaminations, approval of non-list appointments (such as transfer, mobilityassignment, temporary appointment), and various other functions. Hiring forclasses used by more than one agency continues to be restricted to statewide listsadministered by DOER. As our survey of agency human resources directorspresented in Chapter 3 shows, this is a continuing source of friction betweenDOER and state agencies. Among the departments with full delegation ofauthority from DOER are: Administration, Finance, Health, Human Services,Minnesota Planning, Natural Resources, Revenue, and Transportation. These aregenerally large departments with sizable human resources divisions.
The DOER responsibilities directly relating to employee compensation include:13
• Classification of jobs and evaluation of job complexity.
• Labor relations, including negotiation and administration of collectivebargaining agreements between the state and the unions representingstate employees.
• Administration of the compensation plans for unrepresentedemployees.
• Administration of employee insurance programs.
Job Classification and EvaluationAn employer as large and diverse as the state of Minnesota necessarily employspeople to perform many jobs. Not counting academic positions, most jobs in theexecutive branch (about 89 percent) are in the “classified” civil service.14
“Classified” jobs are those filled on the basis of formal tests or ratings of theapplicant’s ability to perform specific job requirements. DOER tries to grouppositions similar in duties and responsibilities in the same job classification inorder to maintain consistency in compensation across state agencies. Despiteefforts to group similar jobs into a limited number of job classes, Minnesota hasaround 2,200 separate job classifications, many with only one employee.15
“Unclassified” jobs in the executive branch are not subject to the same hiringrequirements as classified jobs. Unclassified jobs include department heads andtop management of state agencies, elected officials, confidential secretaries orassistants, as well as temporary and student workers and a variety of other specificjob categories spelled out in law.16
The Department of Employee Relations is responsible for maintaining, revising,and administering the state’s job classification plan. New positions need to be
BACKGROUND 11
Minnesota hasabout 2,200separate jobclassifications.
13 Minn. Stat. Ch.#43A.
14 As of January 6, 1999.
15 Additional job classes allow more specific job qualifications or job duties to be incorporated intothe recruiting process, as well as a different salary range than that of otherwise similar classes. Ingeneral, agencies have more control over the job classes that are unique to the agency.
16 Minn. Stat. §43A.08.
allocated to an appropriate class or a new class established. A salary range or ratemust be assigned to each class. If a class is in a bargaining unit, the salary rangeis assigned pursuant to the applicable collective bargaining agreement.17
Since the 1970s DOER has used a job evaluation system developed by the HayGroup, a large international human resources consulting firm. The Hay system isused by many private and public employers to help achieve proportionality andequity in employee compensation. The Hay system was first used in Minnesota in1970 to measure managerial jobs, and used in 1978 to measure all executivebranch jobs. Today about 1,900 job classifications in state government have Hayratings. Hay evaluations are conducted for new positions that do not fit intoexisting classes, when a job needs to be evaluated because of disagreement aboutthe appropriate level of a position, if a position is part of a broader jobclassification study, or if the position has not been evaluated for many years andthere is concern that the job has changed.
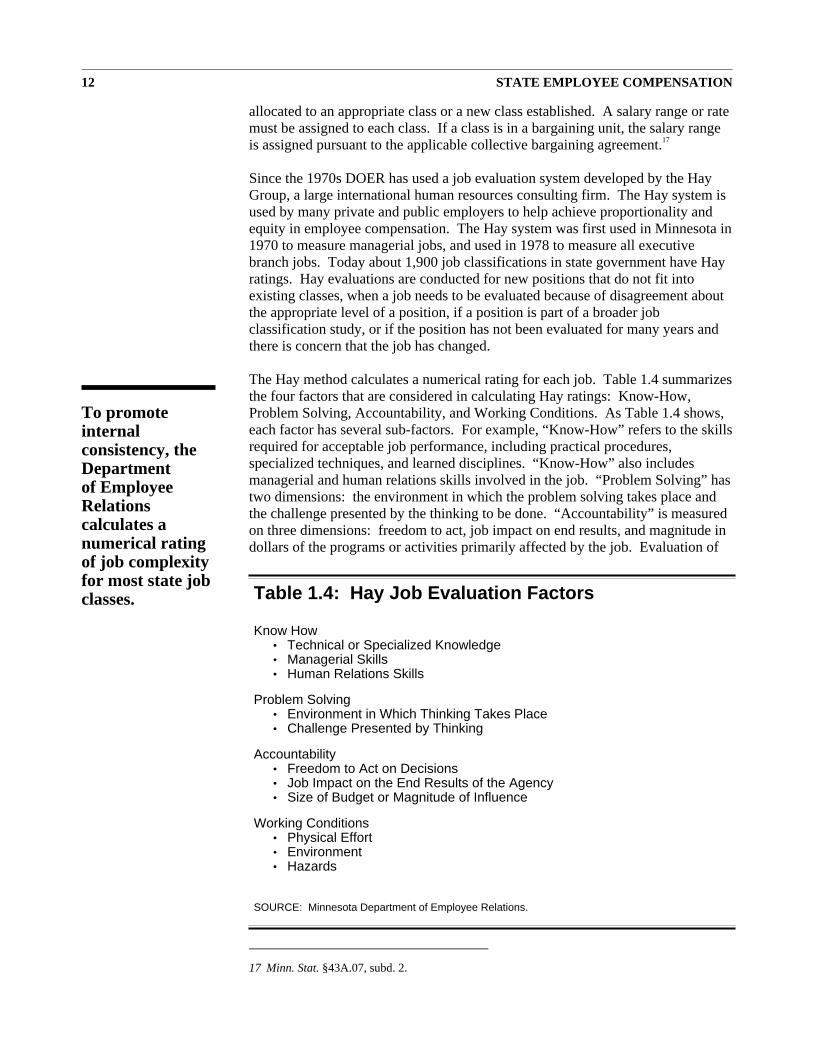
The Hay method calculates a numerical rating for each job. Table 1.4 summarizesthe four factors that are considered in calculating Hay ratings: Know-How,Problem Solving, Accountability, and Working Conditions. As Table 1.4 shows,each factor has several sub-factors. For example, “Know-How” refers to the skillsrequired for acceptable job performance, including practical procedures,specialized techniques, and learned disciplines. “Know-How” also includesmanagerial and human relations skills involved in the job. “Problem Solving” hastwo dimensions: the environment in which the problem solving takes place andthe challenge presented by the thinking to be done. “Accountability” is measuredon three dimensions: freedom to act, job impact on end results, and magnitude indollars of the programs or activities primarily affected by the job. Evaluation of
12 STATE EMPLOYEE COMPENSATION
Table 1.4: Hay Job Evaluation Factors
Know How• Technical or Specialized Knowledge• Managerial Skills• Human Relations Skills
Problem Solving• Environment in Which Thinking Takes Place• Challenge Presented by Thinking
Accountability• Freedom to Act on Decisions• Job Impact on the End Results of the Agency• Size of Budget or Magnitude of Influence
Working Conditions• Physical Effort• Environment• Hazards
SOURCE: Minnesota Department of Employee Relations.
To promoteinternalconsistency, theDepartmentof EmployeeRelationscalculates anumerical ratingof job complexityfor most state jobclasses.
17 Minn. Stat. §43A.07, subd. 2.
“Working Conditions” involves consideration of physical effort, environment, andhazards associated with the job. The various factors are combined in a somewhatcomplex fashion which will not be described here. To be clear, Hay ratings arenot based on what a job is paid in the marketplace or on the performance of stateemployees in the job.
Hay ratings range from under 100 for food service workers or traffic recorders to1,500 to 2,000 for deputy commissioners in large state departments. Agencyheads are not rated, but under the system, department heads in larger departmentswould have ratings between 1,800 and 2,400. In the next chapter we examinedata on how salaries are related to Hay points within state government incomparison to private employers nationally who use the Hay system.
Ratings are calculated by a committee of three to five trained raters drawn fromDOER, agency human resource staff, or agency management knowledgeableabout the jobs being rated. Committee members evaluate the positions separatelyusing charts developed for the purpose, then reach a consensus. Between July andDecember 1998, 18 Hay committees performed 51 Hay evaluations. The numberof annual Hay evaluations has ranged between 70 and 139 per year in recentyears. A total of 549 ratings were performed between July 1993 and December1998. DOER periodically evaluates the Hay ratings performed by its staff andothers. In April 1998, a consultant from the Hay group reviewed 166 Hay ratingsand found that 7 percent required revision and a change in total Hay points,indicating a generally high level of performance by raters.
Hay ratings are an important tool in assigning a salary range to a jobclassification. Jobs with similar Hay points ideally should receive similar pay, butDOER’s policy allows salaries to be set one or two ranges up or down from theideal salary range associated with the job’s Hay points. DOER’s CompensationDivision periodically reviews Hay ratings as a measure of internal consistency incompensation. The Compensation Division also examines the pay offemale-dominated job classes and moves any up in pay that are more than twosalary ranges below the ideal range.
Determination of Employee CompensationWhile the classification system establishes the overall framework of employeecompensation, changes in compensation are determined through collectivebargaining for represented employees. Collective bargaining agreements alsoindirectly help determine compensation for unrepresented employees. The patternof employee compensation for government typically differs from that of privateemployment. As we will see in the next chapter, the range of state employeecompensation is quite compressed compared to the range of private sectorcompensation.
DOER represents the state in bargaining, except in the case of the bargaining unitscomposed of MnSCU faculty where MnSCU represents the state. The MinnesotaPublic Employment Labor Relations Act (PELRA) defines 17 bargaining units for
BACKGROUND 13
Jobs with similarratings shouldreceive similarpay.
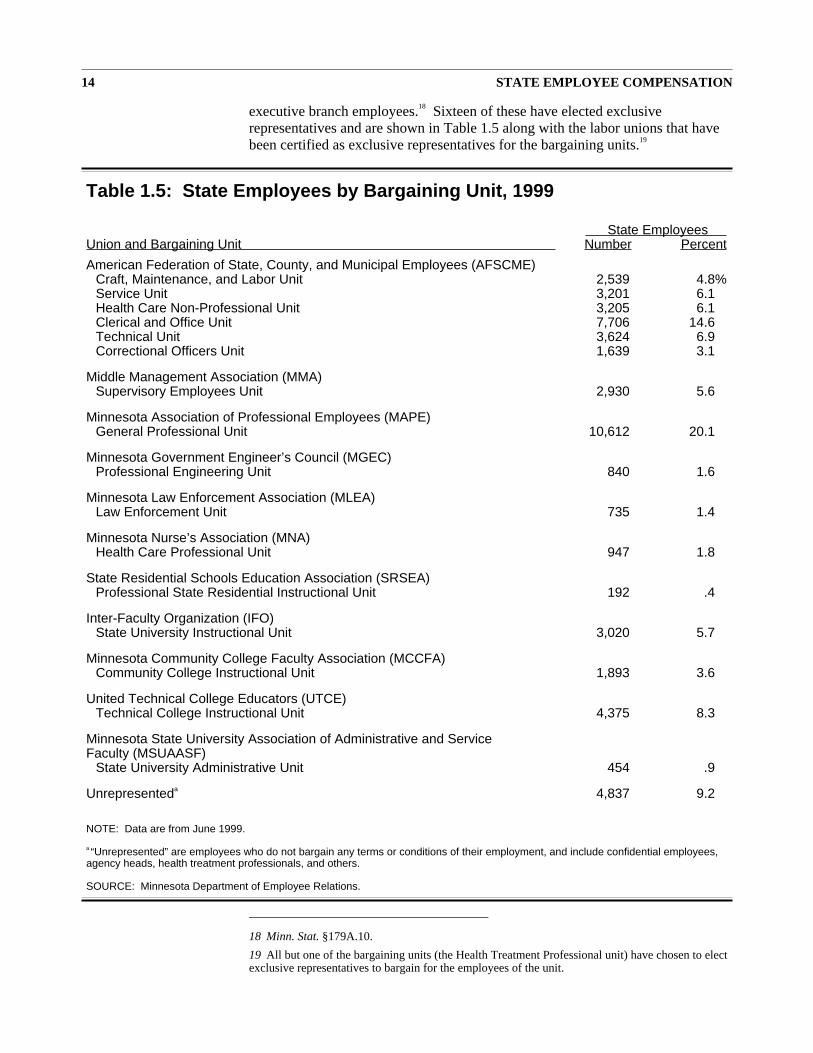
executive branch employees.18 Sixteen of these have elected exclusiverepresentatives and are shown in Table 1.5 along with the labor unions that havebeen certified as exclusive representatives for the bargaining units.19
14 STATE EMPLOYEE COMPENSATION
Table 1.5: State Employees by Bargaining Unit, 1999
State EmployeesUnion and Bargaining Unit Number Percent
American Federation of State, County, and Municipal Employees (AFSCME)Craft, Maintenance, and Labor Unit 2,539 4.8%Service Unit 3,201 6.1Health Care Non-Professional Unit 3,205 6.1Clerical and Office Unit 7,706 14.6Technical Unit 3,624 6.9Correctional Officers Unit 1,639 3.1
Middle Management Association (MMA)Supervisory Employees Unit 2,930 5.6
Minnesota Association of Professional Employees (MAPE)General Professional Unit 10,612 20.1
Minnesota Government Engineer’s Council (MGEC)Professional Engineering Unit 840 1.6
Minnesota Law Enforcement Association (MLEA)Law Enforcement Unit 735 1.4
Minnesota Nurse’s Association (MNA)Health Care Professional Unit 947 1.8
State Residential Schools Education Association (SRSEA)Professional State Residential Instructional Unit 192 .4
Inter-Faculty Organization (IFO)State University Instructional Unit 3,020 5.7
Minnesota Community College Faculty Association (MCCFA)Community College Instructional Unit 1,893 3.6
United Technical College Educators (UTCE)Technical College Instructional Unit 4,375 8.3
Minnesota State University Association of Administrative and ServiceFaculty (MSUAASF)
State University Administrative Unit 454 .9
Unrepresenteda 4,837 9.2
NOTE: Data are from June 1999.
a “Unrepresented” are employees who do not bargain any terms or conditions of their employment, and include confidential employees,agency heads, health treatment professionals, and others.
SOURCE: Minnesota Department of Employee Relations.
18 Minn. Stat. §179A.10.
19 All but one of the bargaining units (the Health Treatment Professional unit) have chosen to electexclusive representatives to bargain for the employees of the unit.
Table 1.5 also shows the number of employees in each bargaining unit as of June1999, plus the number of unrepresented employees. About 9.2 percent of stateemployees are unrepresented. The compensation and working conditions ofunrepresented employees is governed by several plans, including theCommissioner’s Plan and the Managerial Plan, which are administered by DOER,MNSCU, and several constitutional offices.
In Minnesota state government the collective bargaining cycle is tied to the budgetcycle. Agency budgets are determined every two years as the Legislatureappropriates money for each department and program. As part of theappropriations process, the Legislature may enact a salary supplement based on anassumption about how much salaries will or should increase during the biennium,but neither this amount (if any), nor the percentage change in agency budgets,places any necessary limit on the size of salary increases reached throughbargaining.
Of course, agencies need to budget for purposes other than employeecompensation. Both parties in the collective bargaining negotiations mustconsider trade offs between compensation increases and the ability to fundpositions and programs. Bargaining agreements have a varying impact acrossstate government. Agencies vary quite widely in terms of how much of theirspending goes to employee compensation or to compensation for employees inparticular bargaining units.
Employment contracts typically cover a two year period. Bargaining can beginonce the budget is enacted, but collective bargaining agreements are not usuallyreached before the first fiscal year of the new biennium which begins in July. It iscustomary for DOER to first concentrate on negotiations with the largestemployee unions, the American Federation of State, County, and MunicipalEmployees (AFSCME) and the Minnesota Association of Professional Employees(MAPE). AFSCME Council No. 6 represents six bargaining units with 21,914employees, and MAPE represents 10,612 employees. Together these unionsrepresent over half of all state employees (see Table 1.5). Bargaining agreementsbetween the state and these unions set a pattern for other negotiations with smallerunions, and also set a pattern for compensation and other issues for unrepresentedemployees. It is frequently the case, however, that bargaining continues into thetime of the legislative sessions held in even numbered years.
Once DOER and union representatives reach an agreement, union members mustvote to accept or reject it. The Legislature must ultimately approve collectivebargaining agreements, so union members actually are voting on “tentative”contracts. Since 1995, responsibility and authority for oversight of collectivebargaining and employee relations have rested with the Legislative CoordinatingCommission, which has established a subcomittee on employee relations.20 Thecommission reviews and, as appropriate, approves the contracts which then gointo effect pending final ratification by the Legislature. Contracts are almostalways approved by the commission.
BACKGROUND 15
Pay and workingconditions aredeterminedthroughcollectivebargaining oncethe state budgetis set.
20 Minn. Stat. §3.855. Before 1995, these functions were carried out by the Legislative Commis-sion on Employee Relations.
Administration of Employee BenefitsThe Department of Employee Relations administers employee insurance programsfor state employees and other active and retired employees, including employeesof the University of Minnesota. In recent years, the state has moved tostandardize health insurance benefits and to assume greater underwriting risk forhealth and dental insurance. The state also self-insures for workers’ compensationcoverage and manages workers’ compensation claims for state employees.
Retirement benefits are not administered by DOER, nor are they determinedthrough the collective bargaining process. State employees participate in variousretirement plans. Pension policy is set by the Legislature through the LegislativeCommission on Pension and Retirement which oversees most public employeepensions in the state. The great majority of state employees are covered by adefined benefit plan administered by MSRS and financed by a 4 percent of salarycontribution by the state and the employee.21 There are other plans forunclassified employees, public safety workers, and others.
This report does not examine the many policy questions involving pensions andretirement, although they are a concern of the Legislature. Our office, forexample, recently examined early retirement incentives.22 Also, last year theLegislature asked the Legislative Commission on Pensions and Retirement to do astudy comparing public and private pension benefits and report by January 2000.
COMPENSATION POLICY
We have noted above that employment in Minnesota state government isgrounded on two statutory principles: hiring and promotion is to be based onmerit as determined by tests based on the requirements of the job (rather thanpersonal or political relationships), and pay and conditions of work are to benegotiated by the state and organizations representing employees. In addition,there are other statutory goals relating to human resource management that governcompensation. State law requires personnel decisions to be nondiscriminatory asdefined by the Minnesota Human Rights Act.23 Minnesota also enacted a “payequity” policy in 1981 to establish equitable compensation relationships betweenfemale-dominated, male-dominated, and balanced classes of employees in theexecutive branch.24
Furthermore, Minnesota statutes instruct the Commissioner of EmployeeRelations to pursue several objectives in collective bargaining negotiations,including:25
16 STATE EMPLOYEE COMPENSATION
State employeecompensationshould beinternallyconsistent andexternallycompetitive tothe degreepossible.
21 Defined benefit plans pay benefits based on average salary and years of service. Defined contri-bution plans pay benefits based on employee and employer contributions and investment results.
22 Office of the Legislative Auditor, Early Retirement Incentives (St. Paul, March 1995);http://www.auditor.leg.state.mn.us/ped/1995/retire.htm.
23 Minn. Stat. Ch. 363
24 Minn. Stat. §43A.01, subd. 3.
25 Minn. Stat. §43A.18, subd. 8.
• Compensation for positions in the classified and unclassified serviceshould compare reasonably to one another;
• Compensation for state positions should bear a reasonable relationship tocompensation for similar positions outside state service;
• Compensation for management positions should bear a reasonablerelationship to compensation of represented employees managed;
• Compensation for positions within the classified service should bear areasonable relationship among related job classes and among various levelswithin the same occupation; and
• Compensation for positions which require comparable skill, effort,responsibility, and working conditions should be comparable, andcompensation for positions requiring different skill, effort, responsibility,and working conditions should be proportional to the skill, effort,responsibility, and working conditions required.
These goals are not entirely compatible with one another. A salary structure thatis competitive will not necessarily be internally consistent and proportional. Thecollective bargaining process may not result in salaries that are either internallyconsistent or competitive with market rates. In addition, it is an element of ourpolitical culture that public employees at the upper levels should not receivemonetary compensation equivalent to upper level management or professionalpositions in the private sector.
SUMMARY
About 50,000 people are employed in the executive branch of state government inover 2,200 different jobs. Excluding technical college employees added throughreorganization, the number of state employees grew 29 percent between 1980 and1999. The state payroll per employee, adjusted for inflation has remained almostconstant between 1980 and 1998. Minnesota employees are fairly evenly dividedbetween the Twin Cities area and the balance of the state.
The process by which state employee compensation is determined rests onmerit-system principles established by civil service reforms dating to the 1930sand the right of state employees to organize and bargain collectively, establishedand extended in the 1970s. Among other objectives, state laws direct theDepartment of Employee Relations to work through the bargaining process toachieve a pattern of state compensation which is internally consistent andcompetitive in the larger economy.
While Minnesota’s compensation policy is not entirely consistent, it has guidedour analysis of compensation presented in the following chapter. We examine theinternal equity and proportionality of state salaries, and we compare statecompensation to compensation offered by other employers in Minnesota and otherstates.
BACKGROUND 17
The State’scompensationpolicy goals arenot compatiblewith one another.
22 Compensation
SUMMARY
As a group, Minnesota state employees receive higher pay than privatesector employees, however this difference is largely due to thedifference in the mix of jobs employed in the public and privatesectors. Comparisons of pay rates for specific jobs show that the statetends to pay relatively more for entry-level and lower-skilled positionsand less for upper-level management and professional occupations.Minnesota pays its employees more than most other stategovernments. While wages are about 20 percent higher in the TwinCities area than the balance of the state, state government pay variesmuch less because it is set by statewide salary schedules. The cost ofstate employee benefits equals about 31 percent of total compensation,an amount that is comparable to state and local governmentemployers and large private employers nationally.
This chapter addresses the central issue of the study:
• How does Minnesota state employee compensation compare with thepay and benefits offered by other employers?
We address this question by comparing both the salary and the benefits receivedby Minnesota state employees to several other groups of employees. First, wecompare state of Minnesota wages to those of other public sector employers, bothnationally and locally. We also compare the state’s wages to those of privatesector employers in Minnesota. We then provide a more complete picture of stateemployee compensation by comparing the benefits provided by the state ofMinnesota to those provided by other employers, including other state and localgovernments as well as the private sector.
SALARY COMPARISONS
Wages are the major part of employee compensation. We first compare the wagesand salaries of Minnesota state employees to those of other public employees,including employees of other states and employees of local governments in theTwin Cities area. We also compare Minnesota state wages to those provided byprivate sector employers in Minnesota. The data available for salary comparisonsare not perfect: ideally we would be able to compare the wages ofequally-qualified and experienced employees working in very similar jobs acrosssettings (different states, local governments, and the private sector). However,
this type of data is not available. In an effort to overcome shortcomings in thedata we make comparisons based on similar job titles and, when comparing broadaverages, we control for the different mix of jobs when possible. Despite thelimitations a fairly clear picture of Minnesota state wages emerges from the data.
Other State GovernmentsThe relationship of state and local government is different in Minnesota than mostother states. In Minnesota, local governments are provided state financing tocarry out functions performed by state governments elsewhere. Partly as aconsequence:
• The state of Minnesota directly employs fewer workers per capita thanmost other state governments.
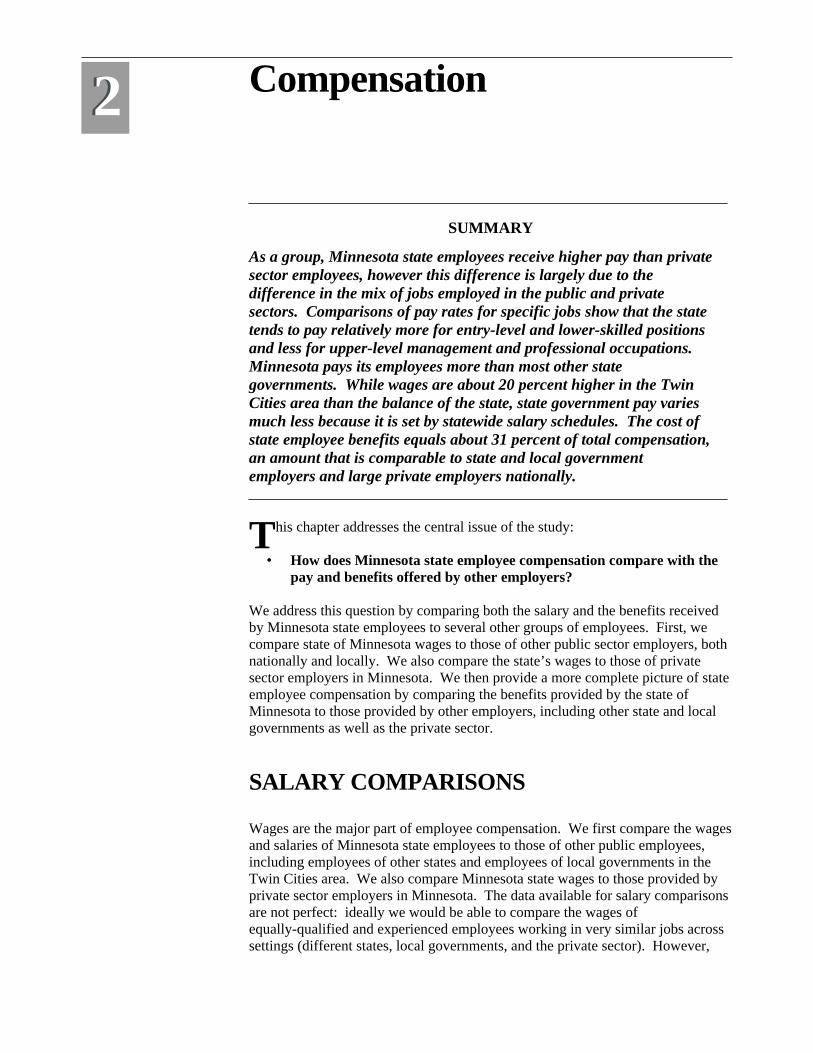
As shown Table 2.1, Minnesota state government ranks 36th among the states inthe number of employees per capita.1 However, Minnesota ranks high (8th) in thenumber of local government employees compared to other states. As a result,Minnesota ranks in the mid-range (18th) in terms of all government employees(state and local) per capita.
Possibly because Minnesota administers many of its activities through localgovernments, the state tends to have a higher percentage of employees inprofessional and managerial positions than other states. Thus, Minnesota stategovernment ranks relatively high (7th) in average monthly compensation comparedto other states.2
• The state of Minnesota tends to pay its employees higher wages thanother states.
20 STATE EMPLOYEE COMPENSATION
Table 2.1: National Rankings of Minnesota State andLocal Government Employment, 1998
State Local State and LocalGovernment Government Governments
Full-Time Equivalent Employees(FTE) Per Capita 36 8 18
Payroll Per Capita 19 6 6Payroll Per FTE 7 18 15
SOURCE: U.S. Bureau of Census, 1998 Census of Governments.
Compared toother stategovernments,Minnesota has arelatively smalland well-paidworkforce.
1 These rankings are based on data from the U.S. Bureau of Census’ annual survey of public em-ployment and payroll. The survey measures the number of government civilian employees and theirgross payrolls for one month. Each state is surveyed annually, whereas data on local governmentpayroll and employment is collected from a representative sample (see http://www.census.gov/govs/www/apes.html).
2 Minnesota’s high ranking appears to hold even when state employee compensation is adjustedfor each state’s cost of living (Steven Gold and Sarah Ritchie, “Compensation of State and LocalEmployees: Sorting Out the Issues,” in Revitalizing State and Local Public Service, ed. Frank J.Thompson (San Francisco: Jossey-Bass Publishers, 1993), 184).
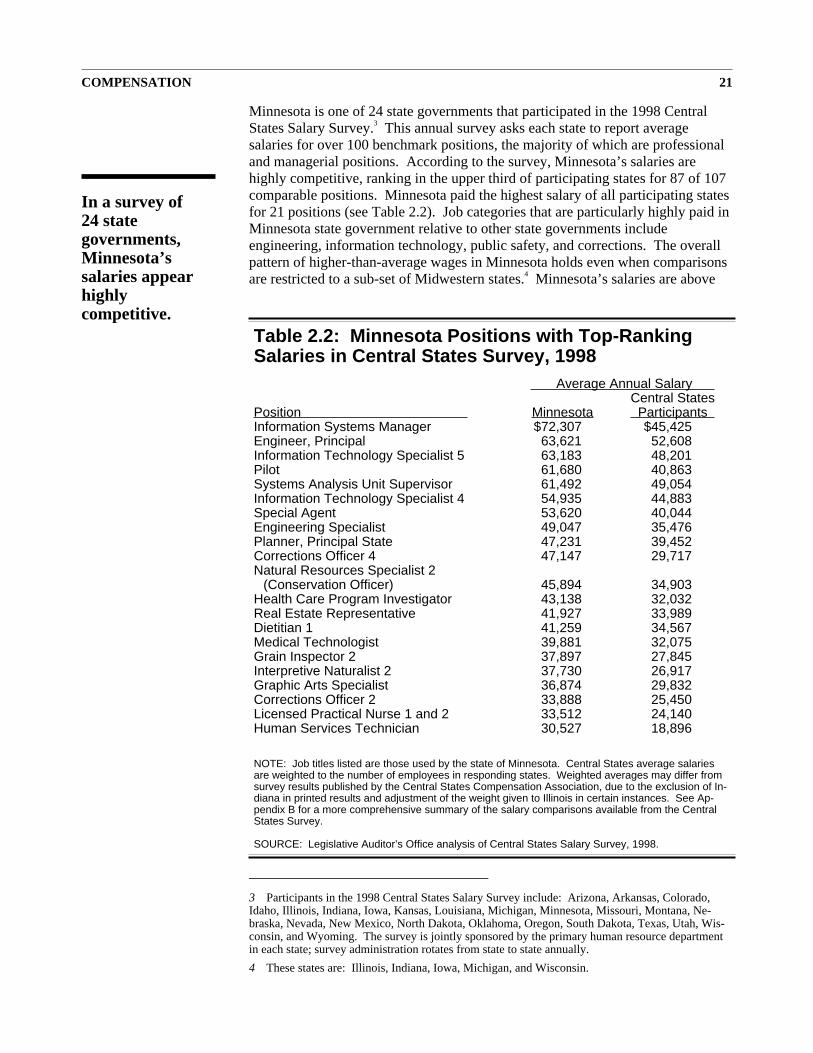
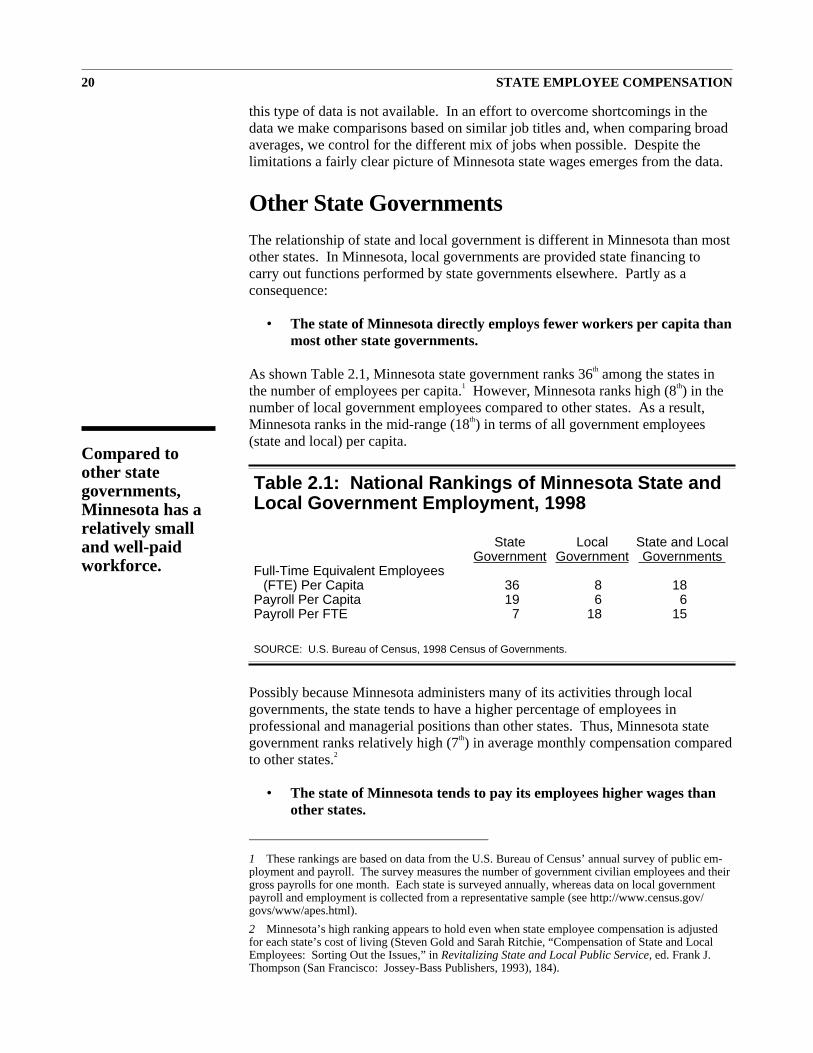
Minnesota is one of 24 state governments that participated in the 1998 CentralStates Salary Survey.3 This annual survey asks each state to report averagesalaries for over 100 benchmark positions, the majority of which are professionaland managerial positions. According to the survey, Minnesota’s salaries arehighly competitive, ranking in the upper third of participating states for 87 of 107comparable positions. Minnesota paid the highest salary of all participating statesfor 21 positions (see Table 2.2). Job categories that are particularly highly paid inMinnesota state government relative to other state governments includeengineering, information technology, public safety, and corrections. The overallpattern of higher-than-average wages in Minnesota holds even when comparisonsare restricted to a sub-set of Midwestern states.4 Minnesota’s salaries are above
COMPENSATION 21
Table 2.2: Minnesota Positions with Top-RankingSalaries in Central States Survey, 1998
Average Annual SalaryCentral States
Position Minnesota ParticipantsInformation Systems Manager $72,307 $45,425Engineer, Principal 63,621 52,608Information Technology Specialist 5 63,183 48,201Pilot 61,680 40,863Systems Analysis Unit Supervisor 61,492 49,054Information Technology Specialist 4 54,935 44,883Special Agent 53,620 40,044Engineering Specialist 49,047 35,476Planner, Principal State 47,231 39,452Corrections Officer 4 47,147 29,717Natural Resources Specialist 2
(Conservation Officer) 45,894 34,903Health Care Program Investigator 43,138 32,032Real Estate Representative 41,927 33,989Dietitian 1 41,259 34,567Medical Technologist 39,881 32,075Grain Inspector 2 37,897 27,845Interpretive Naturalist 2 37,730 26,917Graphic Arts Specialist 36,874 29,832Corrections Officer 2 33,888 25,450Licensed Practical Nurse 1 and 2 33,512 24,140Human Services Technician 30,527 18,896
NOTE: Job titles listed are those used by the state of Minnesota. Central States average salariesare weighted to the number of employees in responding states. Weighted averages may differ fromsurvey results published by the Central States Compensation Association, due to the exclusion of In-diana in printed results and adjustment of the weight given to Illinois in certain instances. See Ap-pendix B for a more comprehensive summary of the salary comparisons available from the CentralStates Survey.
SOURCE: Legislative Auditor’s Office analysis of Central States Salary Survey, 1998.
In a survey of24 stategovernments,Minnesota’ssalaries appearhighlycompetitive.
3 Participants in the 1998 Central States Salary Survey include: Arizona, Arkansas, Colorado,Idaho, Illinois, Indiana, Iowa, Kansas, Louisiana, Michigan, Minnesota, Missouri, Montana, Ne-braska, Nevada, New Mexico, North Dakota, Oklahoma, Oregon, South Dakota, Texas, Utah, Wis-consin, and Wyoming. The survey is jointly sponsored by the primary human resource departmentin each state; survey administration rotates from state to state annually.
4 These states are: Illinois, Indiana, Iowa, Michigan, and Wisconsin.
the average paid by Midwestern states for over 80 percent of the positions (seeAppendix B for a tabular summary of comparisons available from the CentralStates Salary Survey).5
Twin Cities Area Public EmployersIn this section we ask:
• How do state salaries compare to those offered by other publicemployers in the Twin Cities area?
The best source of information on how state salaries compare to those of otherpublic employers in Minnesota is an annual salary survey conducted by DCAStanton and Associates.6 Stanton collects data on salaries for a group of 106 jobs,many of which are positions used by both state and local government. We havechosen to compare state salaries to the larger public employers in the metropolitanarea. We were able to compare monthly salary data on 42 jobs shared by the stateand larger Twin Cities public employers.7 Of course, not all employers use eachof the 42 jobs, so some comparisons are based on fewer jobs.
As Table 2.3 shows, we compared average monthly salaries for the state ofMinnesota and four employer groups: (1) metropolitan agencies; (2) HennepinCounty, Ramsey County, Minneapolis, and St. Paul (Minnesota’s two largestcounties and cities); (3) suburban municipalities with populations over 25,000;and (4) suburban municipalities with populations between 10,000 and 25,000.
Five employer group salary averages are presented in Table 2.3. A comparison ofaverages weighted by the number of employees in each employer group showsthat average monthly pay for state jobs, $2,821, is lowest of the five groups. Thefour other groups are fairly close in their average monthly wage. Suburbs withpopulations over 25,000 have the highest average monthly pay at $3,626,followed by metropolitan agencies at $3,609. But the fourth highest employergroup, suburbs with populations of 10,000 to 25,000, still has an average wage ofover $3,517, distinctly higher than the state.
22 STATE EMPLOYEE COMPENSATION
We comparedMinnesota statewages to thoseof other largegovernmentemployers in theTwin Cities.
5 For additional data showing that employees of state and local government in the Twin Citiestend to earn higher wages than employees of state and local governments around the nation, see:http://www.auditor.leg.state.mn.us/ped/2000/pe0005.htm.
6 1999 Twin Cities Metropolitan Area Salary Survey (Minnetonka, Minnesota: DCA StantonGroup, 1999). The data produced by this survey are the property of the Association of MetropolitanMunicipalities.
7 The list of jobs includes all jobs with at least 100 employees among all employers represented inthe survey: Accountant 1, Accountant 2, Accountant 3, Accounting Clerk 1, Accounting Clerk 2,Accounting Clerk 3, Applications Programmer, Auto Service Worker, Civil Engineer 2, Civil Engi-neer 3, Clerk-Typist, Custodian, Data Entry Operator, Law Enforcement Dispatcher, EngineeringAide 1, Engineering Technician 2, Engineering Technician 3, Engineering Technician 4, Environ-mentalist 2, Environmentalist 3, Executive Secretary, General Clerk, Inspector 2, Junior Program-mer, Laborer, Maintenance Supervisor, Office Administrator/Supervisor, Patrol Officer/DeputySheriff, Personal Computer Technician, Police/Sheriff’s Lieutenant, Police/Sheriff’s Sergeant, Sec-retary A, Secretary C, Senior Attorney, Senior Clerk-Typist, Senior Personnel Representative, Se-nior Planner, Skilled Mechanic, Streets Maintenance Worker, Superintendent, Systems Analyst-Pro-grammer, Telephone Operator and/or Receptionist.
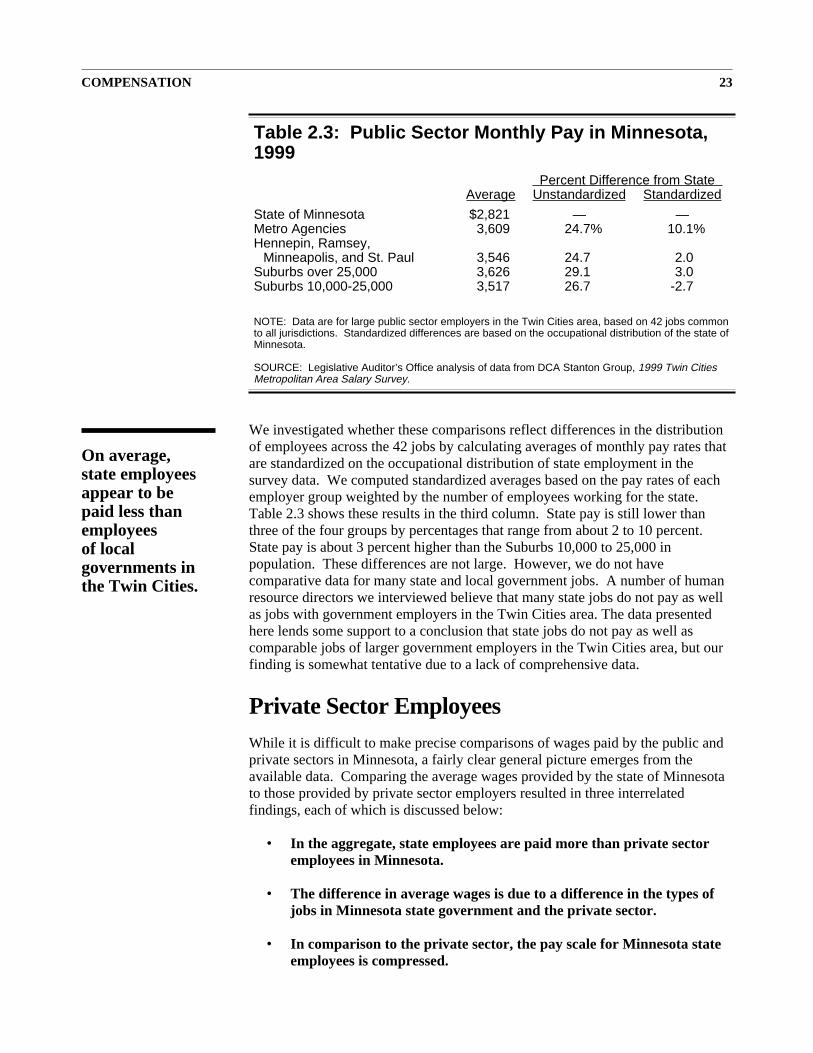
We investigated whether these comparisons reflect differences in the distributionof employees across the 42 jobs by calculating averages of monthly pay rates thatare standardized on the occupational distribution of state employment in thesurvey data. We computed standardized averages based on the pay rates of eachemployer group weighted by the number of employees working for the state.Table 2.3 shows these results in the third column. State pay is still lower thanthree of the four groups by percentages that range from about 2 to 10 percent.State pay is about 3 percent higher than the Suburbs 10,000 to 25,000 inpopulation. These differences are not large. However, we do not havecomparative data for many state and local government jobs. A number of humanresource directors we interviewed believe that many state jobs do not pay as wellas jobs with government employers in the Twin Cities area. The data presentedhere lends some support to a conclusion that state jobs do not pay as well ascomparable jobs of larger government employers in the Twin Cities area, but ourfinding is somewhat tentative due to a lack of comprehensive data.
Private Sector EmployeesWhile it is difficult to make precise comparisons of wages paid by the public andprivate sectors in Minnesota, a fairly clear general picture emerges from theavailable data. Comparing the average wages provided by the state of Minnesotato those provided by private sector employers resulted in three interrelatedfindings, each of which is discussed below:
• In the aggregate, state employees are paid more than private sectoremployees in Minnesota.
• The difference in average wages is due to a difference in the types ofjobs in Minnesota state government and the private sector.
• In comparison to the private sector, the pay scale for Minnesota stateemployees is compressed.
COMPENSATION 23
Table 2.3: Public Sector Monthly Pay in Minnesota,1999
Percent Difference from StateAverage Unstandardized Standardized
State of Minnesota $2,821 — —Metro Agencies 3,609 24.7% 10.1%Hennepin, Ramsey,
Minneapolis, and St. Paul 3,546 24.7 2.0Suburbs over 25,000 3,626 29.1 3.0Suburbs 10,000-25,000 3,517 26.7 -2.7
NOTE: Data are for large public sector employers in the Twin Cities area, based on 42 jobs commonto all jurisdictions. Standardized differences are based on the occupational distribution of the state ofMinnesota.
SOURCE: Legislative Auditor’s Office analysis of data from DCA Stanton Group, 1999 Twin CitiesMetropolitan Area Salary Survey.
On average,state employeesappear to bepaid less thanemployeesof localgovernments inthe Twin Cities.
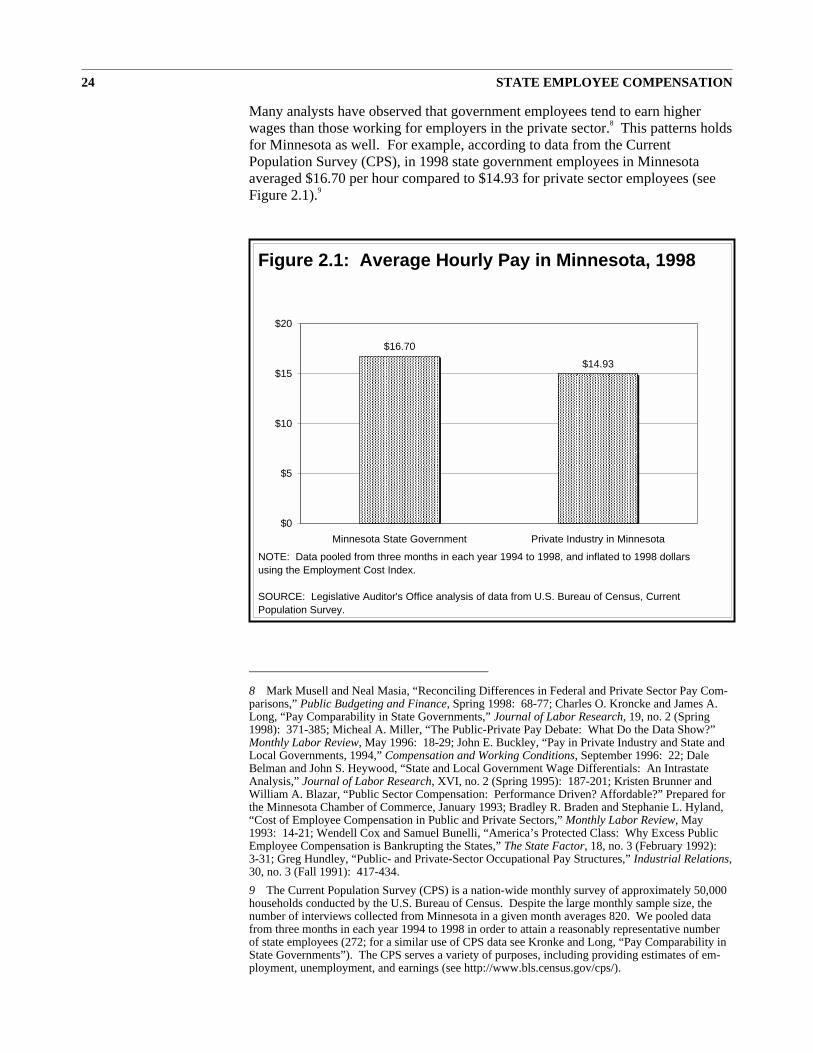
Many analysts have observed that government employees tend to earn higherwages than those working for employers in the private sector.8 This patterns holdsfor Minnesota as well. For example, according to data from the CurrentPopulation Survey (CPS), in 1998 state government employees in Minnesotaaveraged $16.70 per hour compared to $14.93 for private sector employees (seeFigure 2.1).9
24 STATE EMPLOYEE COMPENSATION
$16.70
$14.93
$0
$5
$10
$15
$20
Minnesota State Government Private Industry in Minnesota
Figure 2.1: Average Hourly Pay in Minnesota, 1998
NOTE: Data pooled from three months in each year 1994 to 1998, and inflated to 1998 dollarsusing the Employment Cost Index.
SOURCE: Legislative Auditor's Office analysis of data from U.S. Bureau of Census, CurrentPopulation Survey.
8 Mark Musell and Neal Masia, “Reconciling Differences in Federal and Private Sector Pay Com-parisons,” Public Budgeting and Finance, Spring 1998: 68-77; Charles O. Kroncke and James A.Long, “Pay Comparability in State Governments,” Journal of Labor Research, 19, no. 2 (Spring1998): 371-385; Micheal A. Miller, “The Public-Private Pay Debate: What Do the Data Show?”Monthly Labor Review, May 1996: 18-29; John E. Buckley, “Pay in Private Industry and State andLocal Governments, 1994,” Compensation and Working Conditions, September 1996: 22; DaleBelman and John S. Heywood, “State and Local Government Wage Differentials: An IntrastateAnalysis,” Journal of Labor Research, XVI, no. 2 (Spring 1995): 187-201; Kristen Brunner andWilliam A. Blazar, “Public Sector Compensation: Performance Driven? Affordable?” Prepared forthe Minnesota Chamber of Commerce, January 1993; Bradley R. Braden and Stephanie L. Hyland,“Cost of Employee Compensation in Public and Private Sectors,” Monthly Labor Review, May1993: 14-21; Wendell Cox and Samuel Bunelli, “America’s Protected Class: Why Excess PublicEmployee Compensation is Bankrupting the States,” The State Factor, 18, no. 3 (February 1992):3-31; Greg Hundley, “Public- and Private-Sector Occupational Pay Structures,” Industrial Relations,30, no. 3 (Fall 1991): 417-434.
9 The Current Population Survey (CPS) is a nation-wide monthly survey of approximately 50,000households conducted by the U.S. Bureau of Census. Despite the large monthly sample size, thenumber of interviews collected from Minnesota in a given month averages 820. We pooled datafrom three months in each year 1994 to 1998 in order to attain a reasonably representative numberof state employees (272; for a similar use of CPS data see Kronke and Long, “Pay Comparability inState Governments”). The CPS serves a variety of purposes, including providing estimates of em-ployment, unemployment, and earnings (see http://www.bls.census.gov/cps/).
Several national studies have found that the higher average wages for governmentemployees are due to differences in the mix of jobs in the public versus the privatesector.10 This pattern is also true for the state of Minnesota. We found:
• A higher percentage of state employees work in professionaloccupations, and a higher percentage of private sector employees workin sales, craft, and assembly-line positions.
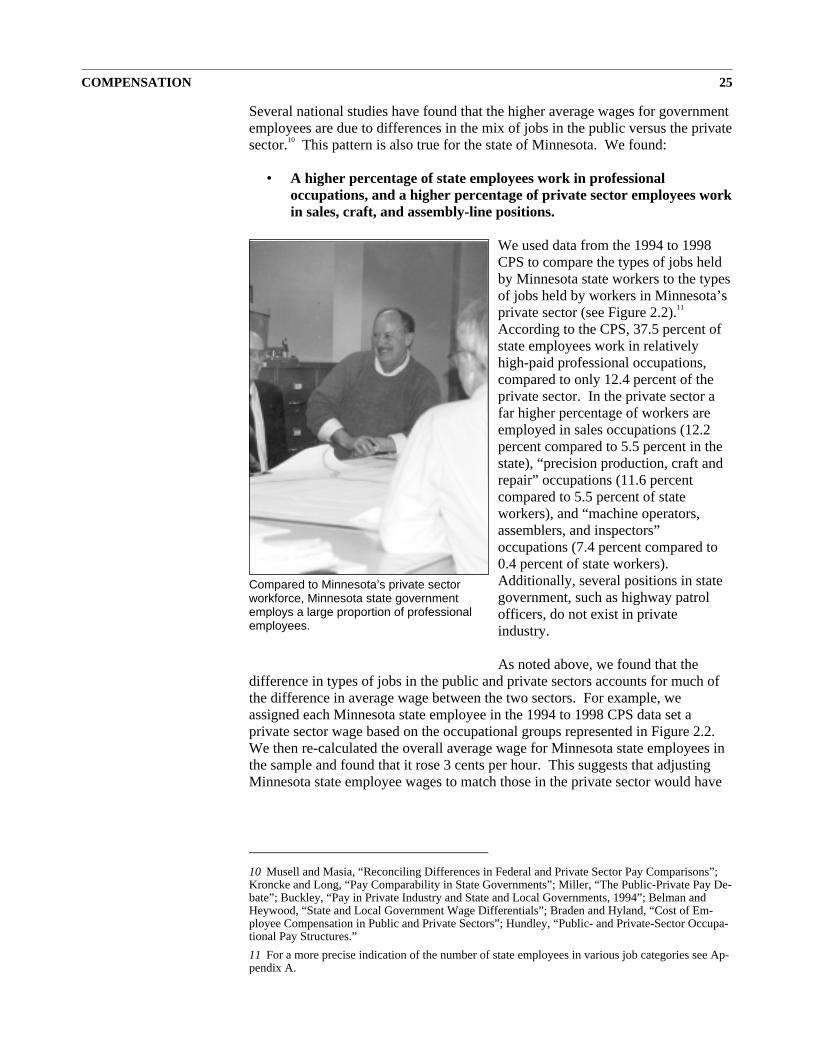
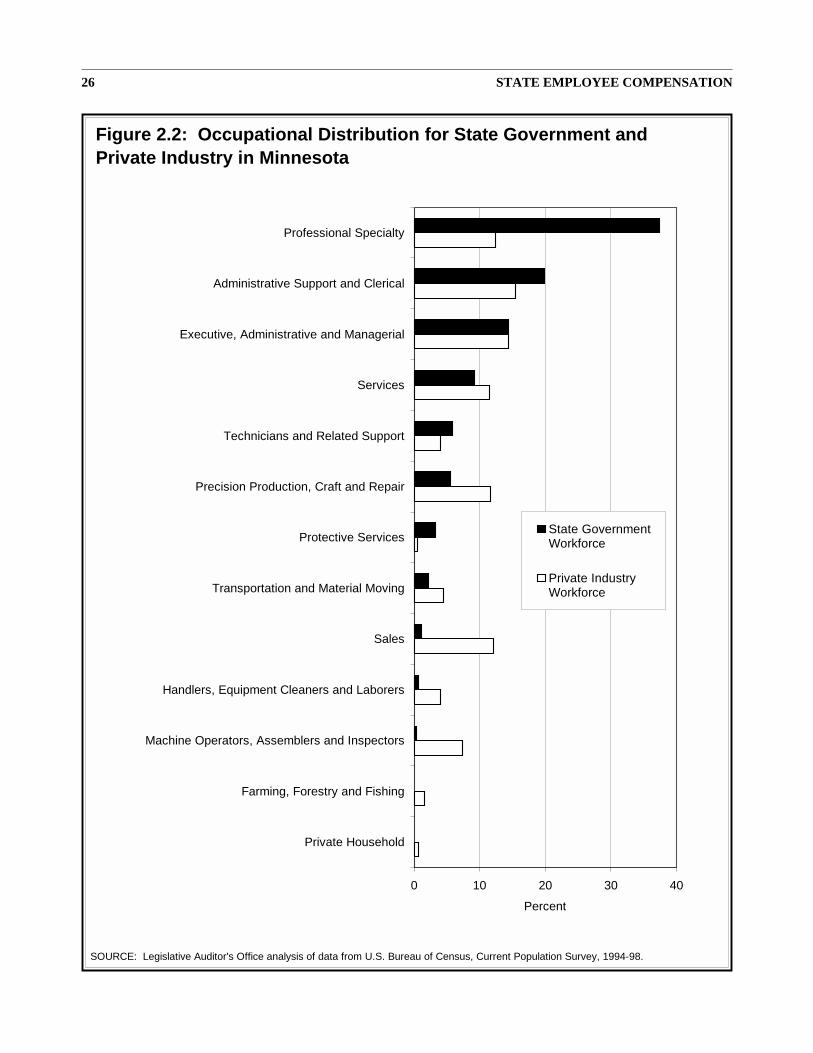
We used data from the 1994 to 1998CPS to compare the types of jobs heldby Minnesota state workers to the typesof jobs held by workers in Minnesota’sprivate sector (see Figure 2.2).11
According to the CPS, 37.5 percent ofstate employees work in relativelyhigh-paid professional occupations,compared to only 12.4 percent of theprivate sector. In the private sector afar higher percentage of workers areemployed in sales occupations (12.2percent compared to 5.5 percent in thestate), “precision production, craft andrepair” occupations (11.6 percentcompared to 5.5 percent of stateworkers), and “machine operators,assemblers, and inspectors”occupations (7.4 percent compared to0.4 percent of state workers).Additionally, several positions in stategovernment, such as highway patrolofficers, do not exist in privateindustry.
As noted above, we found that thedifference in types of jobs in the public and private sectors accounts for much ofthe difference in average wage between the two sectors. For example, weassigned each Minnesota state employee in the 1994 to 1998 CPS data set aprivate sector wage based on the occupational groups represented in Figure 2.2.We then re-calculated the overall average wage for Minnesota state employees inthe sample and found that it rose 3 cents per hour. This suggests that adjustingMinnesota state employee wages to match those in the private sector would have
COMPENSATION 25
Compared to Minnesota’s private sectorworkforce, Minnesota state governmentemploys a large proportion of professionalemployees.
10 Musell and Masia, “Reconciling Differences in Federal and Private Sector Pay Comparisons”;Kroncke and Long, “Pay Comparability in State Governments”; Miller, “The Public-Private Pay De-bate”; Buckley, “Pay in Private Industry and State and Local Governments, 1994”; Belman andHeywood, “State and Local Government Wage Differentials”; Braden and Hyland, “Cost of Em-ployee Compensation in Public and Private Sectors”; Hundley, “Public- and Private-Sector Occupa-tional Pay Structures.”
11 For a more precise indication of the number of state employees in various job categories see Ap-pendix A.
26 STATE EMPLOYEE COMPENSATION
0 10 20 30 40
Private Household
Farming, Forestry and Fishing
Machine Operators, Assemblers and Inspectors
Handlers, Equipment Cleaners and Laborers
Sales
Transportation and Material Moving
Protective Services
Precision Production, Craft and Repair
Technicians and Related Support
Services
Executive, Administrative and Managerial
Administrative Support and Clerical
Professional Specialty
Percent
State GovernmentWorkforce
Private IndustryWorkforce
SOURCE: Legislative Auditor's Office analysis of data from U.S. Bureau of Census, Current Population Survey, 1994-98.
Figure 2.2: Occupational Distribution for State Government andPrivate Industry in Minnesota
little overall impact on the size of the state’s payroll.12 However, compensatingstate employees at the same rate as private sector employees would change thedistribution of wages within Minnesota’s payroll. Lower-skilled positions wouldreceive lower wages and higher-skilled occupations would receive a significantraise, because:
• Lower-skilled occupations in Minnesota state government tend toreceive higher wages than their counterparts in the private sector.
• Higher-skilled occupations in Minnesota state government tend toreceive lower wages than their counterparts in the private sector.
As noted in the beginning of this section, we found that the wage structure inMinnesota state government follows the common pattern of “government payscale compression.”13 Relative to the private sector, the state’s pay scale iscompressed, with higher-than-average wages at the lower end of the spectrum andrelatively low wages at the upper end of the spectrum.
Table 2.4 shows a comparison of average state wages to average private sectorwages for a wide range of positions.14 The most dramatic differences are forguards, janitors, and general maintenance workers, all of whom average over 30percent more as state employees than in private industry.15 The table also revealssubstantial state-employee premiums for a range of entry level positions,including entry-level accountants, buyers, personnel specialists, drafters, andaccounting clerks.16
COMPENSATION 27
Lower-skilledpositions in stategovernment arepaid relativelymore, andhighly-skilledpositions arepaid less, than inthe privatesector.
12 We repeated this analysis using data from the Minnesota Department of Employee Relations(DOER), the Bureau of Labor Statistics (BLS), and the Hay Group (see Table 2.4 and Figure 2.4,below, and accompanying text for additional use and explanation of BLS and Hay Group data). Wefirst estimated the state’s wage-related payroll for 1999 using the employee counts and averagewages provided by DOER. We then substituted private sector wages based on each position’s Hayrating, using BLS-derived estimates for those with ratings less than 240 (approximately 60 percentof state employees) and Hay Group-derived estimates for those with Hay ratings above 240.Finally, we estimated a salary-related payroll based on the substituted private sector average wages.Despite data limitations the results were very similar to the analysis that relied on Current Popula-tion Survey data: adjusting the salaries of Minnesota state employees to mirror private sector wagesfor similar jobs would increase the amount Minnesota state government pays in salaries by approxi-mately 1 percent.
13 Miller, “The Public-Private Pay Debate,” 22-26; Hundley, “Public- and Private-Sector Occupa-tional Pay Structures.”
14 Private sector data is from the U.S. Bureau of Labor Statistics’ (BLS) Occupational Compensa-tion Survey Program (OCSP), a stratified survey of establishments with at least 50 employees(http://stats.bls.gov/ocshome.htm). Due to the sophistication of sampling techniques and the role ofprofessional field economists in BLS data collection, the OCSP is the best available data. However,note that the original data was collected in February 1996 and inflated to 1999 levels using a com-mon wage inflator (the Employment Cost Index; see http://stats.bls.gov/ecthome.htm). Also notethat the average wages for the private sector are from the Twin Cities, while the average state wagesapply to all state of Minnesota employees around the state. We feel that this is a valid comparisonbecause the state has one pay schedule for all employees throughout the state. Since private sectorpay is lower in areas outside of the Twin Cities metropolitan area, the differences between state andprivate sector wages would change somewhat if wages from the entire state were available for com-parison (see the section on geographic variation, below).
15 Table 2.4 uses the Bureau of Labor Statistics’ job titles; for a listing of the cross-references to theMinnesota state government job titles see: http://www.auditor.leg.state.mn.us/ped/2000/pe0005.htm.
16 The available data suggest that the pay scale for engineers employed by the state of Minnesota isnot compressed. The Department of Transportation indicated that this data does not reflect the expe-rience of the department and suggested that the pay scale for engineers employed by Minnesota iscompressed compared to the local market.
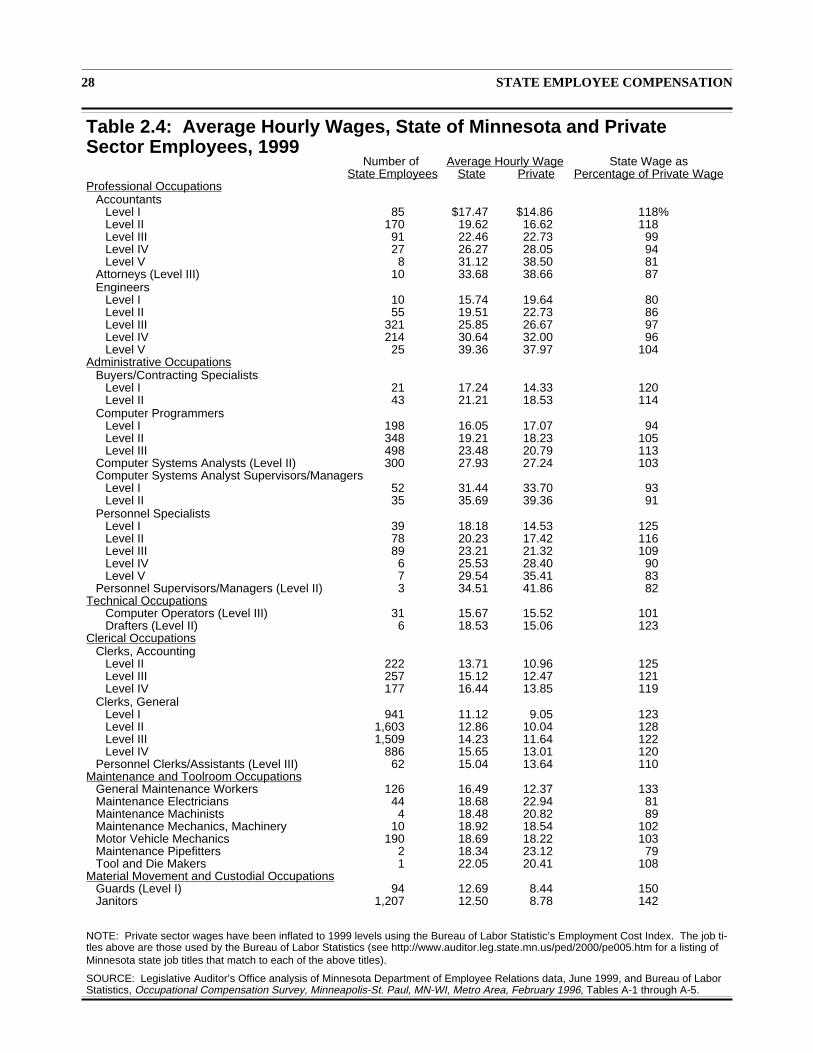
28 STATE EMPLOYEE COMPENSATION
Table 2.4: Average Hourly Wages, State of Minnesota and PrivateSector Employees, 1999
Number of Average Hourly Wage State Wage asState Employees State Private Percentage of Private Wage
Professional OccupationsAccountants
Level I 85 $17.47 $14.86 118%Level II 170 19.62 16.62 118Level III 91 22.46 22.73 99Level IV 27 26.27 28.05 94Level V 8 31.12 38.50 81
Attorneys (Level III) 10 33.68 38.66 87Engineers
Level I 10 15.74 19.64 80Level II 55 19.51 22.73 86Level III 321 25.85 26.67 97Level IV 214 30.64 32.00 96Level V 25 39.36 37.97 104
Administrative OccupationsBuyers/Contracting Specialists
Level I 21 17.24 14.33 120Level II 43 21.21 18.53 114
Computer ProgrammersLevel I 198 16.05 17.07 94Level II 348 19.21 18.23 105Level III 498 23.48 20.79 113
Computer Systems Analysts (Level II) 300 27.93 27.24 103Computer Systems Analyst Supervisors/Managers
Level I 52 31.44 33.70 93Level II 35 35.69 39.36 91
Personnel SpecialistsLevel I 39 18.18 14.53 125Level II 78 20.23 17.42 116Level III 89 23.21 21.32 109Level IV 6 25.53 28.40 90Level V 7 29.54 35.41 83
Personnel Supervisors/Managers (Level II) 3 34.51 41.86 82Technical Occupations
Computer Operators (Level III) 31 15.67 15.52 101Drafters (Level II) 6 18.53 15.06 123
Clerical OccupationsClerks, Accounting
Level II 222 13.71 10.96 125Level III 257 15.12 12.47 121Level IV 177 16.44 13.85 119
Clerks, GeneralLevel I 941 11.12 9.05 123Level II 1,603 12.86 10.04 128Level III 1,509 14.23 11.64 122Level IV 886 15.65 13.01 120
Personnel Clerks/Assistants (Level III) 62 15.04 13.64 110Maintenance and Toolroom Occupations
General Maintenance Workers 126 16.49 12.37 133Maintenance Electricians 44 18.68 22.94 81Maintenance Machinists 4 18.48 20.82 89Maintenance Mechanics, Machinery 10 18.92 18.54 102Motor Vehicle Mechanics 190 18.69 18.22 103Maintenance Pipefitters 2 18.34 23.12 79Tool and Die Makers 1 22.05 20.41 108
Material Movement and Custodial OccupationsGuards (Level I) 94 12.69 8.44 150Janitors 1,207 12.50 8.78 142
NOTE: Private sector wages have been inflated to 1999 levels using the Bureau of Labor Statistic’s Employment Cost Index. The job ti-tles above are those used by the Bureau of Labor Statistics (see http://www.auditor.leg.state.mn.us/ped/2000/pe005.htm for a listing ofMinnesota state job titles that match to each of the above titles).
SOURCE: Legislative Auditor’s Office analysis of Minnesota Department of Employee Relations data, June 1999, and Bureau of LaborStatistics, Occupational Compensation Survey, Minneapolis-St. Paul, MN-WI, Metro Area, February 1996, Tables A-1 through A-5.
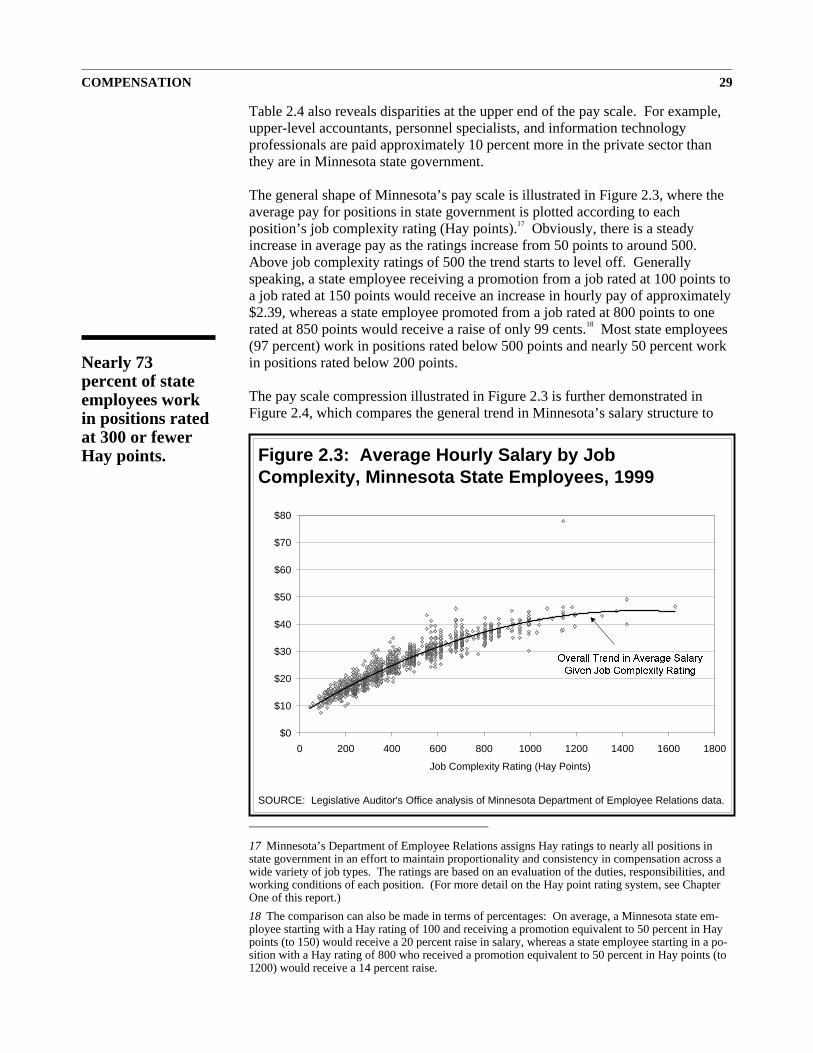
Table 2.4 also reveals disparities at the upper end of the pay scale. For example,upper-level accountants, personnel specialists, and information technologyprofessionals are paid approximately 10 percent more in the private sector thanthey are in Minnesota state government.
The general shape of Minnesota’s pay scale is illustrated in Figure 2.3, where theaverage pay for positions in state government is plotted according to eachposition’s job complexity rating (Hay points).17 Obviously, there is a steadyincrease in average pay as the ratings increase from 50 points to around 500.Above job complexity ratings of 500 the trend starts to level off. Generallyspeaking, a state employee receiving a promotion from a job rated at 100 points toa job rated at 150 points would receive an increase in hourly pay of approximately$2.39, whereas a state employee promoted from a job rated at 800 points to onerated at 850 points would receive a raise of only 99 cents.18 Most state employees(97 percent) work in positions rated below 500 points and nearly 50 percent workin positions rated below 200 points.
The pay scale compression illustrated in Figure 2.3 is further demonstrated inFigure 2.4, which compares the general trend in Minnesota’s salary structure to
COMPENSATION 29
Nearly 73percent of stateemployees workin positions ratedat 300 or fewerHay points.
Overall Trend in Average Salary
Given Job Complexity Rating
$0
$10
$20
$30
$40
$50
$60
$70
$80
0 200 400 600 800 1000 1200 1400 1600 1800
Job Complexity Rating (Hay Points)
SOURCE: Legislative Auditor's Office analysis of Minnesota Department of Employee Relations data.
Figure 2.3: Average Hourly Salary by JobComplexity, Minnesota State Employees, 1999
17 Minnesota’s Department of Employee Relations assigns Hay ratings to nearly all positions instate government in an effort to maintain proportionality and consistency in compensation across awide variety of job types. The ratings are based on an evaluation of the duties, responsibilities, andworking conditions of each position. (For more detail on the Hay point rating system, see ChapterOne of this report.)
18 The comparison can also be made in terms of percentages: On average, a Minnesota state em-ployee starting with a Hay rating of 100 and receiving a promotion equivalent to 50 percent in Haypoints (to 150) would receive a 20 percent raise in salary, whereas a state employee starting in a po-sition with a Hay rating of 800 who received a promotion equivalent to 50 percent in Hay points (to1200) would receive a 14 percent raise.
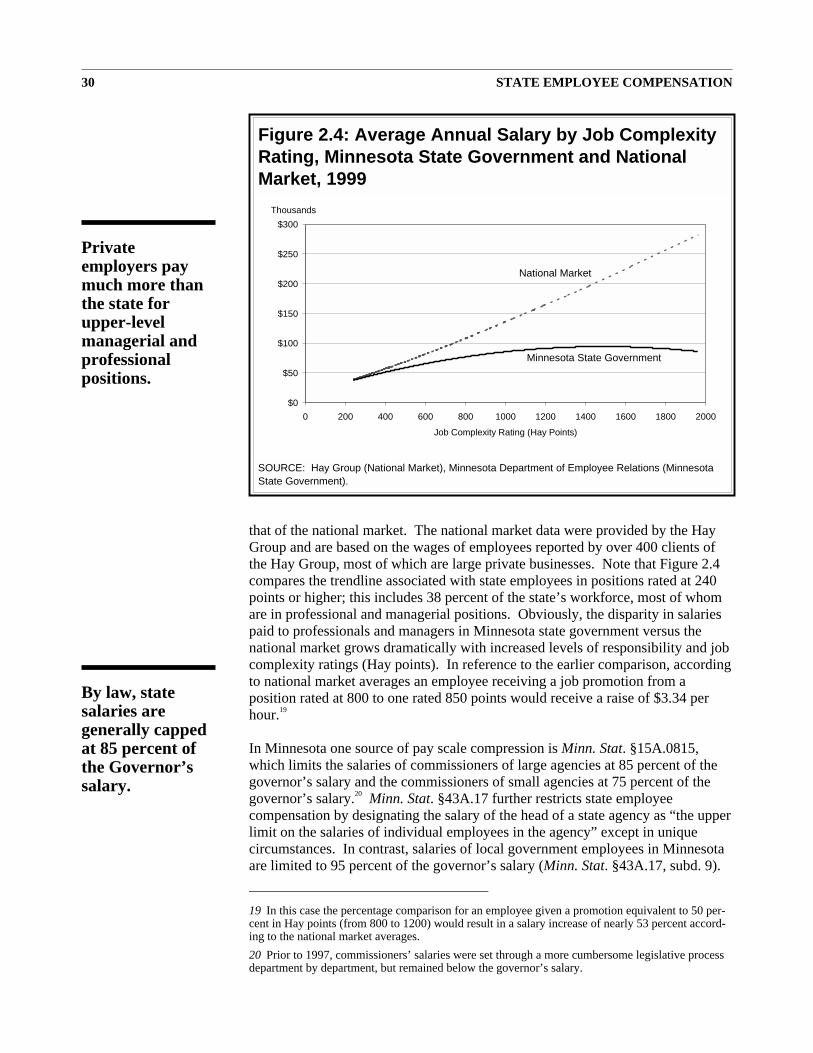
that of the national market. The national market data were provided by the HayGroup and are based on the wages of employees reported by over 400 clients ofthe Hay Group, most of which are large private businesses. Note that Figure 2.4compares the trendline associated with state employees in positions rated at 240points or higher; this includes 38 percent of the state’s workforce, most of whomare in professional and managerial positions. Obviously, the disparity in salariespaid to professionals and managers in Minnesota state government versus thenational market grows dramatically with increased levels of responsibility and jobcomplexity ratings (Hay points). In reference to the earlier comparison, accordingto national market averages an employee receiving a job promotion from aposition rated at 800 to one rated 850 points would receive a raise of $3.34 perhour.19
In Minnesota one source of pay scale compression is Minn. Stat. §15A.0815,which limits the salaries of commissioners of large agencies at 85 percent of thegovernor’s salary and the commissioners of small agencies at 75 percent of thegovernor’s salary.20 Minn. Stat. §43A.17 further restricts state employeecompensation by designating the salary of the head of a state agency as “the upperlimit on the salaries of individual employees in the agency” except in uniquecircumstances. In contrast, salaries of local government employees in Minnesotaare limited to 95 percent of the governor’s salary (Minn. Stat. §43A.17, subd. 9).
30 STATE EMPLOYEE COMPENSATION
$0
$50
$100
$150
$200
$250
$300
0 200 400 600 800 1000 1200 1400 1600 1800 2000
Job Complexity Rating (Hay Points)
Thousands
National Market
Minnesota State Government
SOURCE: Hay Group (National Market), Minnesota Department of Employee Relations (MinnesotaState Government).
Figure 2.4: Average Annual Salary by Job ComplexityRating, Minnesota State Government and NationalMarket, 1999
By law, statesalaries aregenerally cappedat 85 percent ofthe Governor’ssalary.
Privateemployers paymuch more thanthe state forupper-levelmanagerial andprofessionalpositions.
19 In this case the percentage comparison for an employee given a promotion equivalent to 50 per-cent in Hay points (from 800 to 1200) would result in a salary increase of nearly 53 percent accord-ing to the national market averages.
20 Prior to 1997, commissioners’ salaries were set through a more cumbersome legislative processdepartment by department, but remained below the governor’s salary.
The same limit (95 percent) was proposed for state commissioners by the Venturaadministration in 1999, but was not adopted.
Geographic VariationAs noted in Chapter 1, state employees are located in almost every county of thestate. About 47 percent of state employees work outside the seven-county TwinCities metropolitan area. This section asks:
• How do private sector wages and salaries vary across the state ofMinnesota?
• How does state employee pay vary across the state?
Wage and Salary Variation
The best information on variation in wages and salaries across Minnesota comesfrom the 1997 Minnesota Salary Survey carried out by the Minnesota Departmentof Economic Security (MDES) in coordination with the United States Departmentof Labor.21 The 1997 survey covers non-agricultural establishments with five ormore employees.22
Looking at the MDES salary data, it is clear that:
• Pay varies considerably around the state. On average, wages arehighest in the Twin Cities area.
• Duluth, Rochester, and St. Cloud have relatively high pay for outstatemetropolitan areas, but are still 11 to 16 percent below the Twin Citiesaverage.
• Pay for the non-metropolitan balance of the state is even lower,around 19 percent below the Twin Cities area average.
Table 2.5 compares the average salary in the Minneapolis-St. Paul metropolitanarea to salaries in six outstate metropolitan areas and the non-metropolitanbalance of the state.23 The table is based on the 50 most common jobs inMinnesota, as reported by the Minnesota Department of Economic Security
COMPENSATION 31
In general, wagesin outstateMinnesota are15 to 20 percentbelow those forsimilar positionsin the TwinCities area.
21 The 1997 Minnesota Salary Survey is a product of the Occupational Employment Statistics(OES) Wage Survey, a federally-directed program carried out by the Minnesota Department of Eco-nomic Security (MDES) Research and Statistics Office. The data we use come from an MDES bul-letin dated May 1999.
22 The 1997 report includes data from 1996 and 1997. The combined 1996 and 1997 sample was15,054 employers from whom 11,527 responses were obtained, a rate of 76.6 percent.
23 Several Minnesota metropolitan areas include one or more non-Minnesota counties. We wereunable to obtain Minnesota-only data. However the percent of population and jobs in the non-Min-nesota part of the Twin Cities metropolitan area is too small to materially affect the analysis andconclusions. The combined population of Pierce and St. Croix counties in Wisconsin is 3 percent ofthe Twin Cities metropolitan area population.
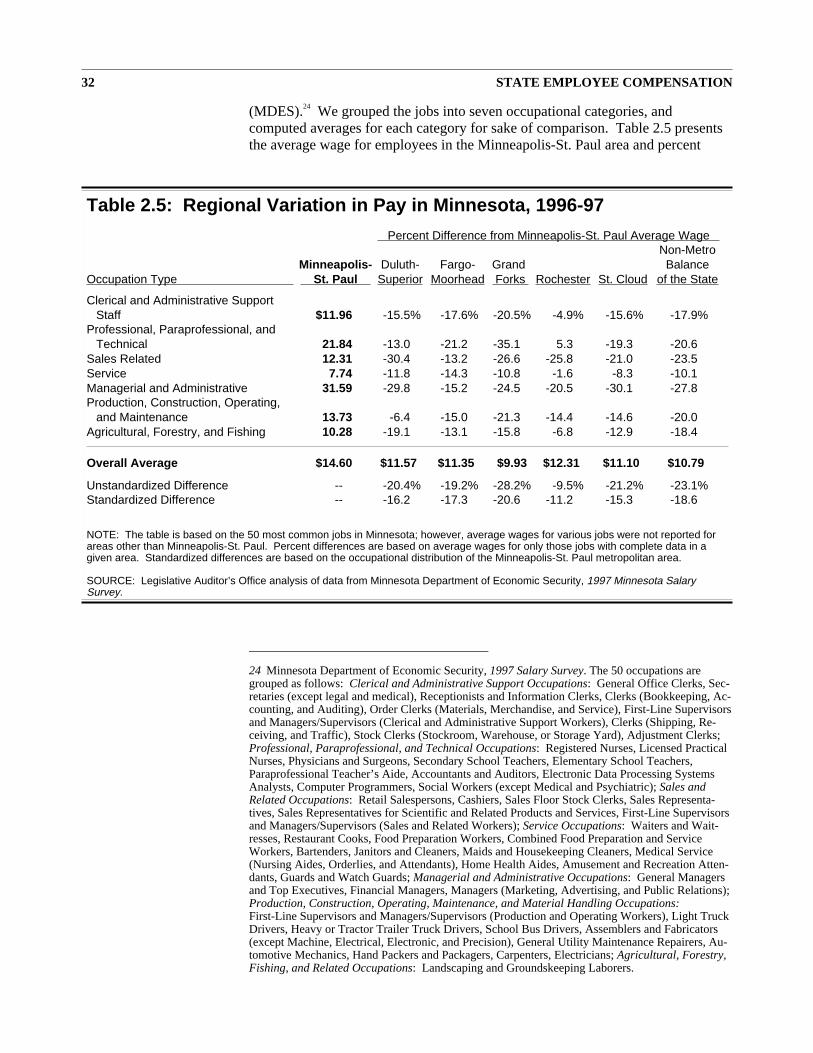
(MDES).24 We grouped the jobs into seven occupational categories, andcomputed averages for each category for sake of comparison. Table 2.5 presentsthe average wage for employees in the Minneapolis-St. Paul area and percent
32 STATE EMPLOYEE COMPENSATION
Table 2.5: Regional Variation in Pay in Minnesota, 1996-97
Percent Difference from Minneapolis-St. Paul Average WageNon-Metro
Minneapolis- Duluth- Fargo- Grand BalanceOccupation Type St. Paul Superior Moorhead Forks Rochester St. Cloud of the State
Clerical and Administrative SupportStaff $11.96 -15.5% -17.6% -20.5% -4.9% -15.6% -17.9%
Professional, Paraprofessional, andTechnical 21.84 -13.0 -21.2 -35.1 5.3 -19.3 -20.6
Sales Related 12.31 -30.4 -13.2 -26.6 -25.8 -21.0 -23.5Service 7.74 -11.8 -14.3 -10.8 -1.6 -8.3 -10.1Managerial and Administrative 31.59 -29.8 -15.2 -24.5 -20.5 -30.1 -27.8Production, Construction, Operating,
and Maintenance 13.73 -6.4 -15.0 -21.3 -14.4 -14.6 -20.0Agricultural, Forestry, and Fishing 10.28 -19.1 -13.1 -15.8 -6.8 -12.9 -18.4
Overall Average $14.60 $11.57 $11.35 $9.93 $12.31 $11.10 $10.79
Unstandardized Difference -- -20.4% -19.2% -28.2% -9.5% -21.2% -23.1%Standardized Difference -- -16.2 -17.3 -20.6 -11.2 -15.3 -18.6
NOTE: The table is based on the 50 most common jobs in Minnesota; however, average wages for various jobs were not reported forareas other than Minneapolis-St. Paul. Percent differences are based on average wages for only those jobs with complete data in agiven area. Standardized differences are based on the occupational distribution of the Minneapolis-St. Paul metropolitan area.
SOURCE: Legislative Auditor’s Office analysis of data from Minnesota Department of Economic Security, 1997 Minnesota SalarySurvey.
24 Minnesota Department of Economic Security, 1997 Salary Survey. The 50 occupations aregrouped as follows: Clerical and Administrative Support Occupations: General Office Clerks, Sec-retaries (except legal and medical), Receptionists and Information Clerks, Clerks (Bookkeeping, Ac-counting, and Auditing), Order Clerks (Materials, Merchandise, and Service), First-Line Supervisorsand Managers/Supervisors (Clerical and Administrative Support Workers), Clerks (Shipping, Re-ceiving, and Traffic), Stock Clerks (Stockroom, Warehouse, or Storage Yard), Adjustment Clerks;Professional, Paraprofessional, and Technical Occupations: Registered Nurses, Licensed PracticalNurses, Physicians and Surgeons, Secondary School Teachers, Elementary School Teachers,Paraprofessional Teacher’s Aide, Accountants and Auditors, Electronic Data Processing SystemsAnalysts, Computer Programmers, Social Workers (except Medical and Psychiatric); Sales andRelated Occupations: Retail Salespersons, Cashiers, Sales Floor Stock Clerks, Sales Representa-tives, Sales Representatives for Scientific and Related Products and Services, First-Line Supervisorsand Managers/Supervisors (Sales and Related Workers); Service Occupations: Waiters and Wait-resses, Restaurant Cooks, Food Preparation Workers, Combined Food Preparation and ServiceWorkers, Bartenders, Janitors and Cleaners, Maids and Housekeeping Cleaners, Medical Service(Nursing Aides, Orderlies, and Attendants), Home Health Aides, Amusement and Recreation Atten-dants, Guards and Watch Guards; Managerial and Administrative Occupations: General Managersand Top Executives, Financial Managers, Managers (Marketing, Advertising, and Public Relations);Production, Construction, Operating, Maintenance, and Material Handling Occupations:First-Line Supervisors and Managers/Supervisors (Production and Operating Workers), Light TruckDrivers, Heavy or Tractor Trailer Truck Drivers, School Bus Drivers, Assemblers and Fabricators(except Machine, Electrical, Electronic, and Precision), General Utility Maintenance Repairers, Au-tomotive Mechanics, Hand Packers and Packagers, Carpenters, Electricians; Agricultural, Forestry,Fishing, and Related Occupations: Landscaping and Groundskeeping Laborers.
differences from Minneapolis-St. Paul wages for each of the other areas.25 Thetable also presents an overall average, weighted by the number of employeesworking in each job, for each area. Throughout the table salary averages arepresented in bold type and deviations from the Minneapolis-St. Paul metropolitanarea average are in regular type.
As Table 2.5 shows, wages and salaries are consistently highest in theMinneapolis-St. Paul metropolitan area. The overall average salary for the 50jobs in the Minneapolis-St. Paul metropolitan area is $14.60. The average is$11.57 in Duluth, about 20 percent lower than the Twin Cities average, $12.31 inRochester, about 9.5 percent lower, and $11.10 in St. Cloud, about 21 percentbelow the Twin Cities average. Average wages are even lower in the Grand Forksarea and the nonmetropolitan balance of the state.
Wages are highest in the Twin Cities area in each of the seven occupationalcategories as well. For example, clerical and administrative jobs pay an averageof $11.96 in the Twin Cities, and are 5 to 20 percent below this level in the otherareas shown. With only one exception, wages are lower outside the Twin Citiesarea for each job category, usually by double-digit percentages.
The weighted averages discussed above reflect not only rates of pay, but also thedistribution of employment across jobs with varying pay rates. Even if there wereno differences between two areas in the rate of pay for each job, one area couldhave a higher average wage if it had a concentration of workers in high-payingjobs. For this reason, we calculated standardized averages for each area applyingthe occupational distribution of the Twin Cities area to the pay rates of eachoutstate area. We found a pattern very similar to the pattern for theunstandardized averages.26 As shown in the bottom row of Table 2.5, thestandardized averages range from about 11 percent below the Twin Cities inRochester to nearly 21 percent below in the Grand Forks area. This means thatthe sizeable geographic variation in pay across Minnesota is not due differences inthe occupational distribution, but to actual differences in local pay rates.
Variation in State Employee Salaries
Having determined the approximate statewide variation in pay for a representativesample of Minnesota’s employers, we sought to learn how state governmentsalaries vary. State salaries are set by statewide salary schedules that result fromcollective bargaining with the representatives of statewide bargaining units.While statewide salary schedules are used in Minnesota state governmentemployment, there still can be de facto variation in salaries across the statebecause of several factors: the salary step at which people are hired can vary,seniority on the job can vary, and the mix of jobs can vary.
COMPENSATION 33
Outside the TwinCities area,wages arehighest inRochester.
25 Averages for the outstate metropolitan areas are shown as percentage differences from theMinneapolis-St. Paul metropolitan area average. The averages on which the differences are calcu-lated are not always based on all 50 jobs, since not all metropolitan areas have employment in eachjob. All differences are based on the set of jobs that each metropolitan area shares with the Minne-apolis-St. Paul area.
26 We also compared medians and found little difference between means and medians.
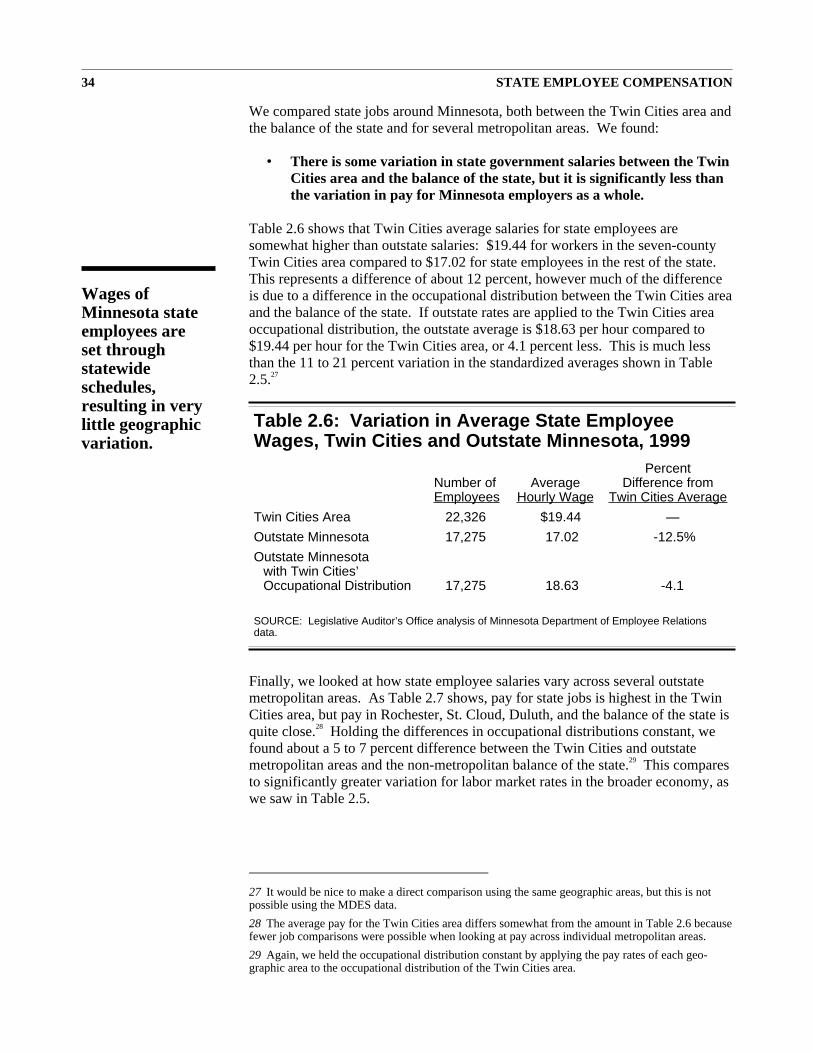
We compared state jobs around Minnesota, both between the Twin Cities area andthe balance of the state and for several metropolitan areas. We found:
• There is some variation in state government salaries between the TwinCities area and the balance of the state, but it is significantly less thanthe variation in pay for Minnesota employers as a whole.
Table 2.6 shows that Twin Cities average salaries for state employees aresomewhat higher than outstate salaries: $19.44 for workers in the seven-countyTwin Cities area compared to $17.02 for state employees in the rest of the state.This represents a difference of about 12 percent, however much of the differenceis due to a difference in the occupational distribution between the Twin Cities areaand the balance of the state. If outstate rates are applied to the Twin Cities areaoccupational distribution, the outstate average is $18.63 per hour compared to$19.44 per hour for the Twin Cities area, or 4.1 percent less. This is much lessthan the 11 to 21 percent variation in the standardized averages shown in Table2.5.27
Finally, we looked at how state employee salaries vary across several outstatemetropolitan areas. As Table 2.7 shows, pay for state jobs is highest in the TwinCities area, but pay in Rochester, St. Cloud, Duluth, and the balance of the state isquite close.28 Holding the differences in occupational distributions constant, wefound about a 5 to 7 percent difference between the Twin Cities and outstatemetropolitan areas and the non-metropolitan balance of the state.29 This comparesto significantly greater variation for labor market rates in the broader economy, aswe saw in Table 2.5.
34 STATE EMPLOYEE COMPENSATION
Table 2.6: Variation in Average State EmployeeWages, Twin Cities and Outstate Minnesota, 1999
PercentNumber of Average Difference fromEmployees Hourly Wage Twin Cities Average
Twin Cities Area 22,326 $19.44 —
Outstate Minnesota 17,275 17.02 -12.5%
Outstate Minnesotawith Twin Cities’Occupational Distribution 17,275 18.63 -4.1
SOURCE: Legislative Auditor’s Office analysis of Minnesota Department of Employee Relationsdata.
Wages ofMinnesota stateemployees areset throughstatewideschedules,resulting in verylittle geographicvariation.
27 It would be nice to make a direct comparison using the same geographic areas, but this is notpossible using the MDES data.
28 The average pay for the Twin Cities area differs somewhat from the amount in Table 2.6 becausefewer job comparisons were possible when looking at pay across individual metropolitan areas.
29 Again, we held the occupational distribution constant by applying the pay rates of each geo-graphic area to the occupational distribution of the Twin Cities area.
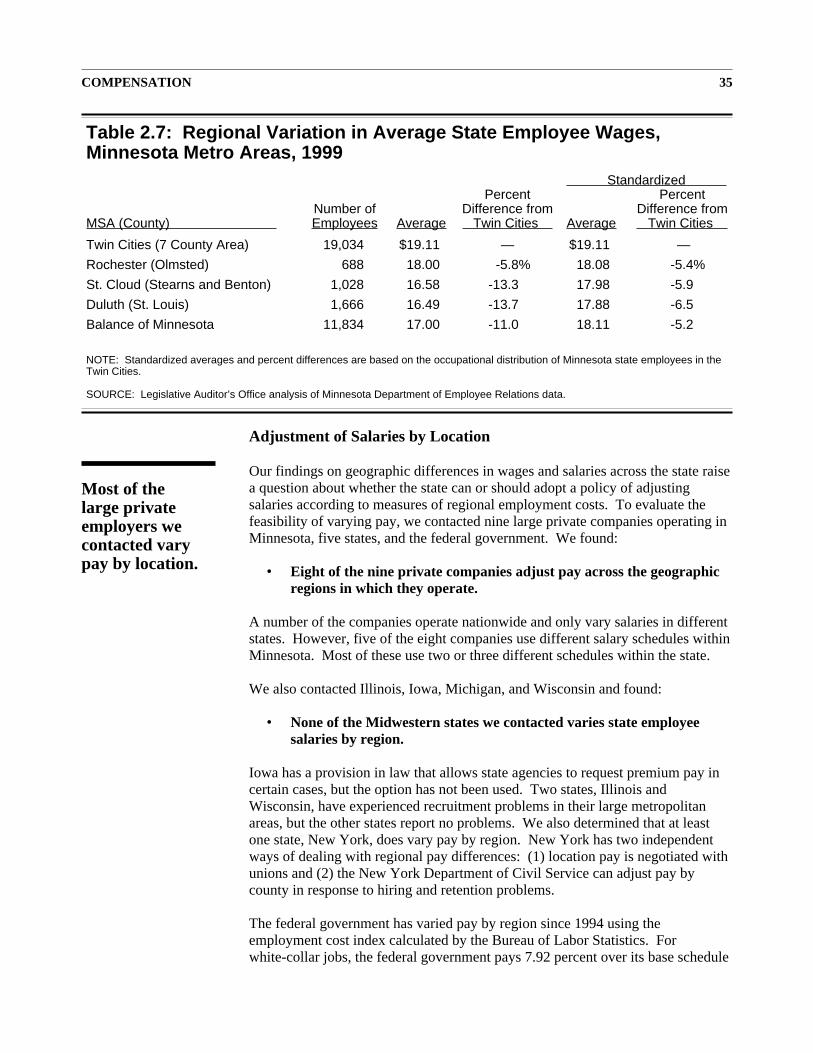
Adjustment of Salaries by Location
Our findings on geographic differences in wages and salaries across the state raisea question about whether the state can or should adopt a policy of adjustingsalaries according to measures of regional employment costs. To evaluate thefeasibility of varying pay, we contacted nine large private companies operating inMinnesota, five states, and the federal government. We found:
• Eight of the nine private companies adjust pay across the geographicregions in which they operate.
A number of the companies operate nationwide and only vary salaries in differentstates. However, five of the eight companies use different salary schedules withinMinnesota. Most of these use two or three different schedules within the state.
We also contacted Illinois, Iowa, Michigan, and Wisconsin and found:
• None of the Midwestern states we contacted varies state employeesalaries by region.
Iowa has a provision in law that allows state agencies to request premium pay incertain cases, but the option has not been used. Two states, Illinois andWisconsin, have experienced recruitment problems in their large metropolitanareas, but the other states report no problems. We also determined that at leastone state, New York, does vary pay by region. New York has two independentways of dealing with regional pay differences: (1) location pay is negotiated withunions and (2) the New York Department of Civil Service can adjust pay bycounty in response to hiring and retention problems.
The federal government has varied pay by region since 1994 using theemployment cost index calculated by the Bureau of Labor Statistics. Forwhite-collar jobs, the federal government pays 7.92 percent over its base schedule
COMPENSATION 35
Table 2.7: Regional Variation in Average State Employee Wages,Minnesota Metro Areas, 1999
StandardizedPercent Percent
Number of Difference from Difference fromMSA (County) Employees Average Twin Cities Average Twin Cities
Twin Cities (7 County Area) 19,034 $19.11 — $19.11 —
Rochester (Olmsted) 688 18.00 -5.8% 18.08 -5.4%
St. Cloud (Stearns and Benton) 1,028 16.58 -13.3 17.98 -5.9
Duluth (St. Louis) 1,666 16.49 -13.7 17.88 -6.5
Balance of Minnesota 11,834 17.00 -11.0 18.11 -5.2
NOTE: Standardized averages and percent differences are based on the occupational distribution of Minnesota state employees in theTwin Cities.
SOURCE: Legislative Auditor’s Office analysis of Minnesota Department of Employee Relations data.
Most of thelarge privateemployers wecontacted varypay by location.
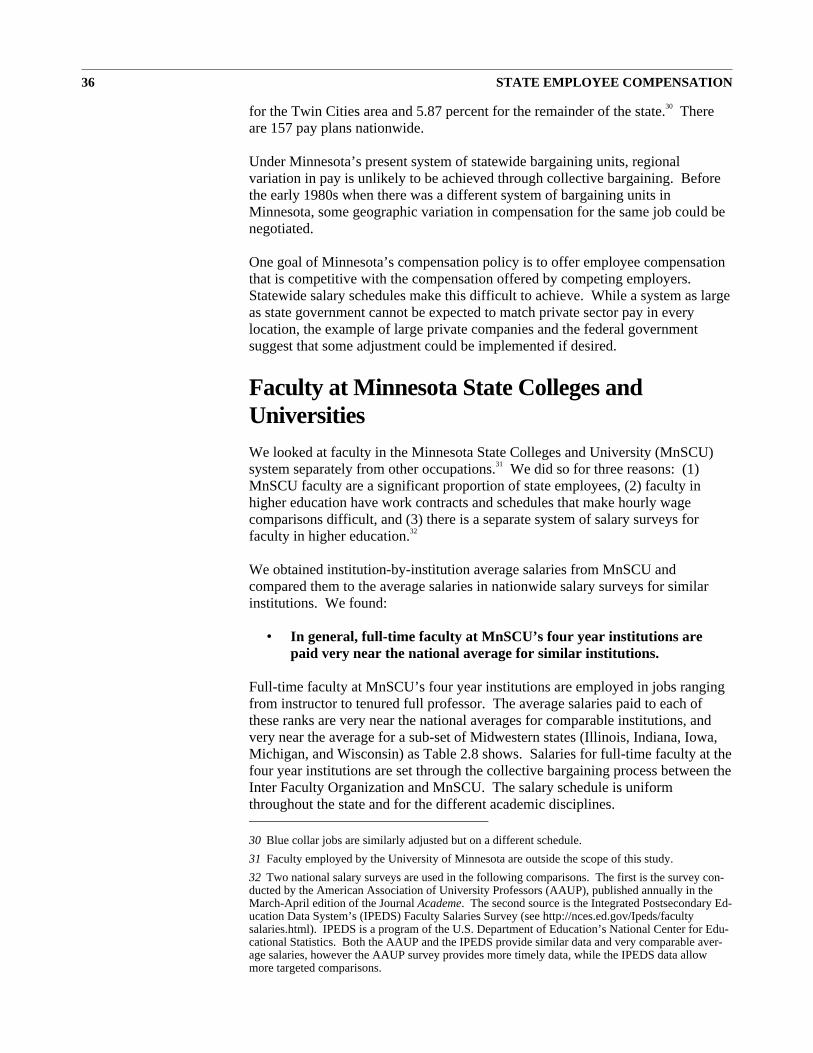
for the Twin Cities area and 5.87 percent for the remainder of the state.30 Thereare 157 pay plans nationwide.
Under Minnesota’s present system of statewide bargaining units, regionalvariation in pay is unlikely to be achieved through collective bargaining. Beforethe early 1980s when there was a different system of bargaining units inMinnesota, some geographic variation in compensation for the same job could benegotiated.
One goal of Minnesota’s compensation policy is to offer employee compensationthat is competitive with the compensation offered by competing employers.Statewide salary schedules make this difficult to achieve. While a system as largeas state government cannot be expected to match private sector pay in everylocation, the example of large private companies and the federal governmentsuggest that some adjustment could be implemented if desired.
Faculty at Minnesota State Colleges andUniversitiesWe looked at faculty in the Minnesota State Colleges and University (MnSCU)system separately from other occupations.31 We did so for three reasons: (1)MnSCU faculty are a significant proportion of state employees, (2) faculty inhigher education have work contracts and schedules that make hourly wagecomparisons difficult, and (3) there is a separate system of salary surveys forfaculty in higher education.32
We obtained institution-by-institution average salaries from MnSCU andcompared them to the average salaries in nationwide salary surveys for similarinstitutions. We found:
• In general, full-time faculty at MnSCU’s four year institutions arepaid very near the national average for similar institutions.
Full-time faculty at MnSCU’s four year institutions are employed in jobs rangingfrom instructor to tenured full professor. The average salaries paid to each ofthese ranks are very near the national averages for comparable institutions, andvery near the average for a sub-set of Midwestern states (Illinois, Indiana, Iowa,Michigan, and Wisconsin) as Table 2.8 shows. Salaries for full-time faculty at thefour year institutions are set through the collective bargaining process between theInter Faculty Organization and MnSCU. The salary schedule is uniformthroughout the state and for the different academic disciplines.
36 STATE EMPLOYEE COMPENSATION
30 Blue collar jobs are similarly adjusted but on a different schedule.
31 Faculty employed by the University of Minnesota are outside the scope of this study.
32 Two national salary surveys are used in the following comparisons. The first is the survey con-ducted by the American Association of University Professors (AAUP), published annually in theMarch-April edition of the Journal Academe. The second source is the Integrated Postsecondary Ed-ucation Data System’s (IPEDS) Faculty Salaries Survey (see http://nces.ed.gov/Ipeds/facultysalaries.html). IPEDS is a program of the U.S. Department of Education’s National Center for Edu-cational Statistics. Both the AAUP and the IPEDS provide similar data and very comparable aver-age salaries, however the AAUP survey provides more timely data, while the IPEDS data allowmore targeted comparisons.
We made similar comparisons between faculty at MnSCU’s two year institutions,and found:
• On average, full-time faculty at MnSCU’s two year institutions arepaid above the national average for similar institutions.
According to the annual salary survey produced by the U.S. Department ofEducation’s Integrated Postsecondary Education Data System, the nationalaverage salary for faculty at two year institutions is $43,234. This is over $2,500per year less than the average at MnSCU’s two year institutions ($46,096).However, Minnesota’s average salary is slightly below the average of $46,784 fora sub-set of Midwestern states (Illinois, Indiana, Iowa, Michigan, and Wisconsin)as shown in Table 2.9.
Faculty at the technical colleges are covered by the United Technical CollegeEducators (UTCE) collective bargaining agreement, faculty at communitycolleges are covered by the Minnesota Community College Faculty Association(MCCFA) agreement, and faculty at the consolidated community and technicalcolleges are divided between the two plans according to academic discipline (seeTable 2.9). Although the salary schedules of the two agreements includecomparable dollar ranges, full-time faculty covered by the MCCFA agreementaveraged $51,401 in fiscal year 1999, compared to $42,651 for full-time facultyunder the UTCE plan. According to MnSCU, the difference is largely due toseniority, with full-time MCCFA faculty tending to stay in their positions farlonger than faculty covered by the UTCE plan.
• MnSCU’s two year institutions rely heavily on part-time and adjunctfaculty.
COMPENSATION 37
Table 2.8: Average Salaries, Faculty at MnSCU Four Year Institutions,FY1999
Part-Time/Professor Associate Assistant Instructor All Ranks Adjunct
Bemidji $58,655 $46,944 $40,120 $29,685 $47,131 $30,610Mankato 61,075 52,983 42,979 31,810 51,699 31,936Metropolitan 60,971 51,455 44,668 31,996 50,898 39,044Moorhead 59,321 48,443 40,864 30,489 46,536 27,468Southwest 61,916 50,818 41,456 31,524 49,078 31,386St. Cloud 59,755 49,453 42,159 31,818 50,153 35,882Winona 60,552 48,747 40,462 30,924 49,832 36,061All MnSCU Four Year $60,143 $50,023 $41,722 $31,052 $49,528 $35,384
National Average $61,369 $49,706 $41,114 $31,883 $49,196 —Five Midwestern States 61,046 49,232 41,554 — 49,141 —
NOTE: All figures are for full-time, tenure-track appointments, except part-time/adjunct. Part-time averages are annualized base sala-ries. National and Midwestern states averages include only public, non-doctoral four year institutions.
SOURCE: MnSCU, American Association of University Professors (national averages), Legislative Auditor’s Office analysis of Inte-grated Postsecondary Educational Data System data (Midwestern states).
On average,MnSCU facultyare paid at orslightly abovenational andregional averagesfor similarinstitutions.
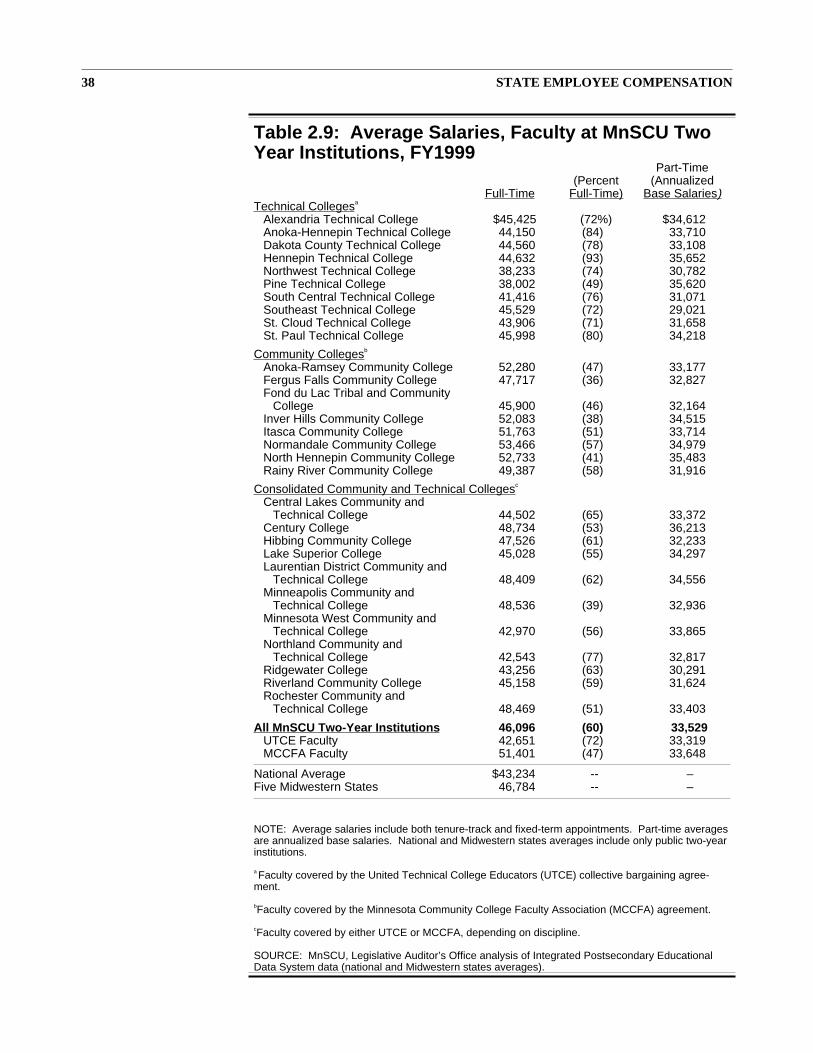
38 STATE EMPLOYEE COMPENSATION
Table 2.9: Average Salaries, Faculty at MnSCU TwoYear Institutions, FY1999
Part-Time(Percent (Annualized
Full-Time Full-Time) Base Salaries)Technical Collegesa
Alexandria Technical College $45,425 (72%) $34,612Anoka-Hennepin Technical College 44,150 (84) 33,710Dakota County Technical College 44,560 (78) 33,108Hennepin Technical College 44,632 (93) 35,652Northwest Technical College 38,233 (74) 30,782Pine Technical College 38,002 (49) 35,620South Central Technical College 41,416 (76) 31,071Southeast Technical College 45,529 (72) 29,021St. Cloud Technical College 43,906 (71) 31,658St. Paul Technical College 45,998 (80) 34,218
Community Collegesb
Anoka-Ramsey Community College 52,280 (47) 33,177Fergus Falls Community College 47,717 (36) 32,827Fond du Lac Tribal and Community
College 45,900 (46) 32,164Inver Hills Community College 52,083 (38) 34,515Itasca Community College 51,763 (51) 33,714Normandale Community College 53,466 (57) 34,979North Hennepin Community College 52,733 (41) 35,483Rainy River Community College 49,387 (58) 31,916
Consolidated Community and Technical Collegesc
Central Lakes Community andTechnical College 44,502 (65) 33,372
Century College 48,734 (53) 36,213Hibbing Community College 47,526 (61) 32,233Lake Superior College 45,028 (55) 34,297Laurentian District Community and
Technical College 48,409 (62) 34,556Minneapolis Community and
Technical College 48,536 (39) 32,936Minnesota West Community and
Technical College 42,970 (56) 33,865Northland Community and
Technical College 42,543 (77) 32,817Ridgewater College 43,256 (63) 30,291Riverland Community College 45,158 (59) 31,624Rochester Community and
Technical College 48,469 (51) 33,403
All MnSCU Two-Year Institutions 46,096 (60) 33,529UTCE Faculty 42,651 (72) 33,319MCCFA Faculty 51,401 (47) 33,648
National Average $43,234 -- –Five Midwestern States 46,784 -- –
NOTE: Average salaries include both tenure-track and fixed-term appointments. Part-time averagesare annualized base salaries. National and Midwestern states averages include only public two-yearinstitutions.
a Faculty covered by the United Technical College Educators (UTCE) collective bargaining agree-ment.
bFaculty covered by the Minnesota Community College Faculty Association (MCCFA) agreement.
cFaculty covered by either UTCE or MCCFA, depending on discipline.
SOURCE: MnSCU, Legislative Auditor’s Office analysis of Integrated Postsecondary EducationalData System data (national and Midwestern states averages).
Part-time and adjunct appointments make up 40 percent of all facultyappointments at MnSCU’s two year institutions, including over 50 percent ofthose covered by the MCCFA agreement. By comparison part-time faculty makeup only 14 percent of all appointments at MnSCU’s four year institutions.33
EMPLOYEE BENEFITS
Employee benefits are an important part of total employee compensation.Traditionally government jobs have offered better benefits than jobs in the privatesector.34 However, there has been a significant extension of benefits offered byprivate employers in recent decades.35
This section asks:
• What types of benefits are offered to state employees?
• How do the benefits offered by the state of Minnesota compare tobenefits offered by public and private employers nationally?
• What is the cost of benefits provided by the state of Minnesota? Whatpercentage of total compensation is provided in the form of benefits?How does that compare to other employers?
In general we found that the state of Minnesota offers benefits that are comparablein scope and cost to benefits offered by other government employers and largerprivate employers. A higher percentage of state employees receive certainbenefits than private sector employees, but employees of medium and largerprivate firms are likely to receive a package of benefits similar to those providedby the state. We also found that the amount spent by the state of Minnesota onemployee benefits, both as a percentage of total compensation and in dollars peremployee-hour, is similar to the national average for state and local governments.Minnesota spends more on employee benefits than the average private sector
COMPENSATION 39
We comparedthe employeebenefits offeredby Minnesotastate governmentto those offeredby otheremployersnationally.
33 Nearly half of all appointments (48%) at Metropolitan State are part-time appointments. Thesecond highest usage of part-time faculty among four year institutions is at Southwest State, wherepart-time appointments make up 16% of all appointments. According to the American Associationof University Professors, the proportion of MnSCU’s faculty appointments that are part-time is veryclose to the proportion of part-time appointments in higher education nationally (see American As-sociation of University Professors, “The Status of Non-Tenure-Track Faculty” (Washington DC,June 1993); http://www.aaup.org/Rbnonten.htm; accessed November 15, 1999).
34 For example, by 1962 all Minnesota state employees under 65 were eligible for health insurance,which was only offered to 62-63 percent of office and plant workers in metropolitan areas nationallyduring the period 1960-61 (Dean E. Clabaugh, Fringe Benefits in State Government Employment(Chicago: Council of State Governments, August 1962); William J. Wiatrowski, “Family-RelatedBenefits in the Workplace,” Monthly Labor Review, March 1990: 28-33). By 1968 the state ofMinnesota’s health insurance included catastrophic medical coverage, which was only offered to 73percent of office workers and 40 percent of plant workers in 1965-66 (Leo F. Kennedy, Fringe Ben-efits in State Government Employment (Chicago: Council of State Governments, May 1968);Wiatrowski, “Family-Related Benefits”).
35 The proportion of total compensation comprised of benefits grew from 18.3 percent in 1959 to33.8 percent in 1998 for private production workers; for all private workers the proportion grewfrom 19.2 percent in 1966 to 27.7 percent in 1998 (William J. Wiatrowski, “Tracking Changes inBenefit Costs,” Compensation and Working Conditions, Spring 1999: 32-37).
employer, but the costs are very comparable to those paid by larger privateemployers.
Unfortunately, there is less comparative data available on benefits than there is onsalaries. Therefore, it is generally necessary to compare Minnesota stateemployee benefits to national averages. However, before making anycomparisons we provide a brief outline of the benefits received by Minnesota stateemployees.
Minnesota Employee BenefitsFull-time employees of the state of Minnesota receive the following basic andoptional benefits:
• Insurance, including basic health, dental, and life insurance, as well asoptional life and disability insurance;
• Retirement and pre-tax savings programs; and
• Paid leave, including holidays, vacation, and sick leave.
All full-time employees receive health, dental, and life insurance. Employeesmay elect dependent health, dental, and life insurance. In addition, the state offersoptional accidental death and dismemberment insurance, short- and long-termdisability insurance, and additional employee life insurance.
Most state of Minnesota employees participate in a retirement program thatautomatically sets aside 4 percent of gross salary in a tax-deferred account,matched by an equal contribution from the state.36 The state also offers pre-taxbenefit accounts, including health and dental premium accounts that allowpayment of insurance premiums with pre-tax dollars; dependent care expenseaccounts; and medical/dental expense accounts. Additionally, the state offers anemployee assistance program and a health promotion program. Of course, thestate offers vacation, sick leave, and paid holidays.
Benefit IncidenceThis section presents national data on the rate at which employees in differentsectors are covered by various benefits, including a comparison of the averagenumber of days of paid leave. Table 2.10 presents data from the Bureau of LaborStatistics’ Employee Benefits Survey, comparing benefit coverage for employeesof state and local governments, small private establishments, and medium and
40 STATE EMPLOYEE COMPENSATION
Minnesota offersa package ofbenefits thatincludesinsurance,retirement, andpaid leave.
36 This is the General Employees Retirement Plan. There are other plans covering small employeegroups, such as the Correctional Employee Retirement Plan and the State Employees RetirementPlan, with larger employee and employer contributions.
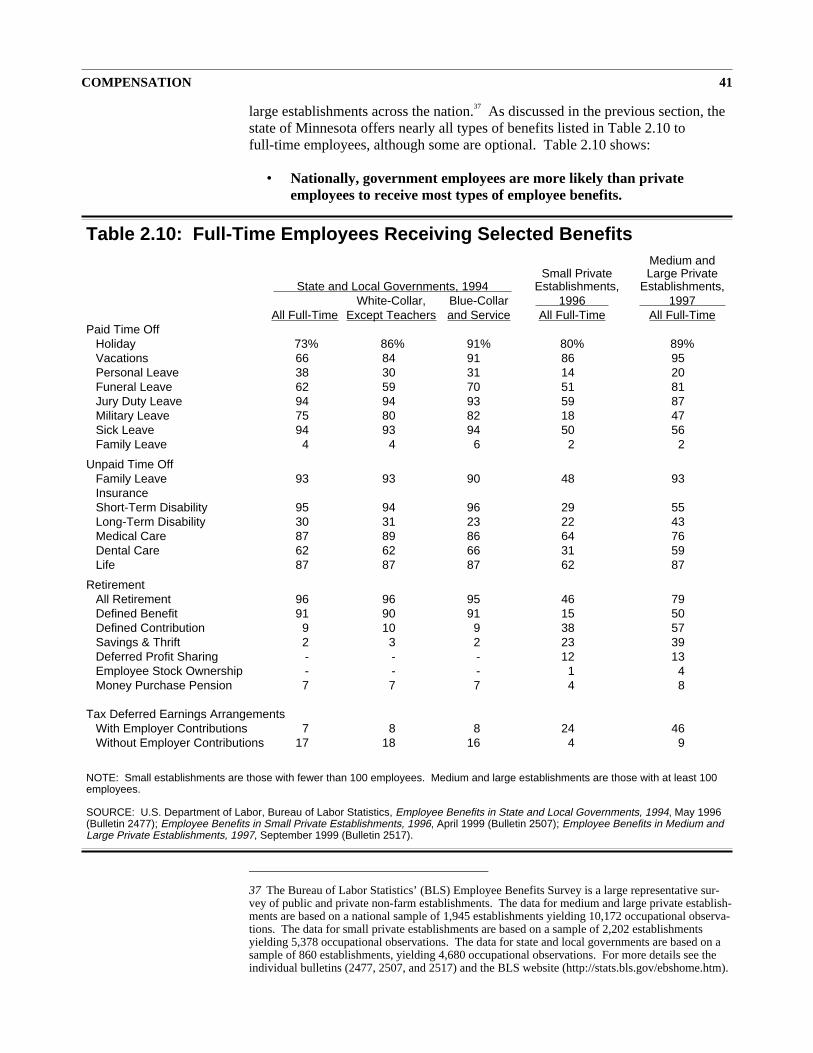
large establishments across the nation.37 As discussed in the previous section, thestate of Minnesota offers nearly all types of benefits listed in Table 2.10 tofull-time employees, although some are optional. Table 2.10 shows:
• Nationally, government employees are more likely than privateemployees to receive most types of employee benefits.
COMPENSATION 41
Table 2.10: Full-Time Employees Receiving Selected BenefitsMedium and
Small Private Large PrivateState and Local Governments, 1994 Establishments, Establishments,
White-Collar, Blue-Collar 1996 1997All Full-Time Except Teachers and Service All Full-Time All Full-Time
Paid Time OffHoliday 73% 86% 91% 80% 89%Vacations 66 84 91 86 95Personal Leave 38 30 31 14 20Funeral Leave 62 59 70 51 81Jury Duty Leave 94 94 93 59 87Military Leave 75 80 82 18 47Sick Leave 94 93 94 50 56Family Leave 4 4 6 2 2
Unpaid Time OffFamily Leave 93 93 90 48 93InsuranceShort-Term Disability 95 94 96 29 55Long-Term Disability 30 31 23 22 43Medical Care 87 89 86 64 76Dental Care 62 62 66 31 59Life 87 87 87 62 87
RetirementAll Retirement 96 96 95 46 79Defined Benefit 91 90 91 15 50Defined Contribution 9 10 9 38 57Savings & Thrift 2 3 2 23 39Deferred Profit Sharing - - - 12 13Employee Stock Ownership - - - 1 4Money Purchase Pension 7 7 7 4 8
Tax Deferred Earnings ArrangementsWith Employer Contributions 7 8 8 24 46Without Employer Contributions 17 18 16 4 9
NOTE: Small establishments are those with fewer than 100 employees. Medium and large establishments are those with at least 100employees.
SOURCE: U.S. Department of Labor, Bureau of Labor Statistics, Employee Benefits in State and Local Governments, 1994, May 1996(Bulletin 2477); Employee Benefits in Small Private Establishments, 1996, April 1999 (Bulletin 2507); Employee Benefits in Medium andLarge Private Establishments, 1997, September 1999 (Bulletin 2517).
37 The Bureau of Labor Statistics’ (BLS) Employee Benefits Survey is a large representative sur-vey of public and private non-farm establishments. The data for medium and large private establish-ments are based on a national sample of 1,945 establishments yielding 10,172 occupational observa-tions. The data for small private establishments are based on a sample of 2,202 establishmentsyielding 5,378 occupational observations. The data for state and local governments are based on asample of 860 establishments, yielding 4,680 occupational observations. For more details see theindividual bulletins (2477, 2507, and 2517) and the BLS website (http://stats.bls.gov/ebshome.htm).
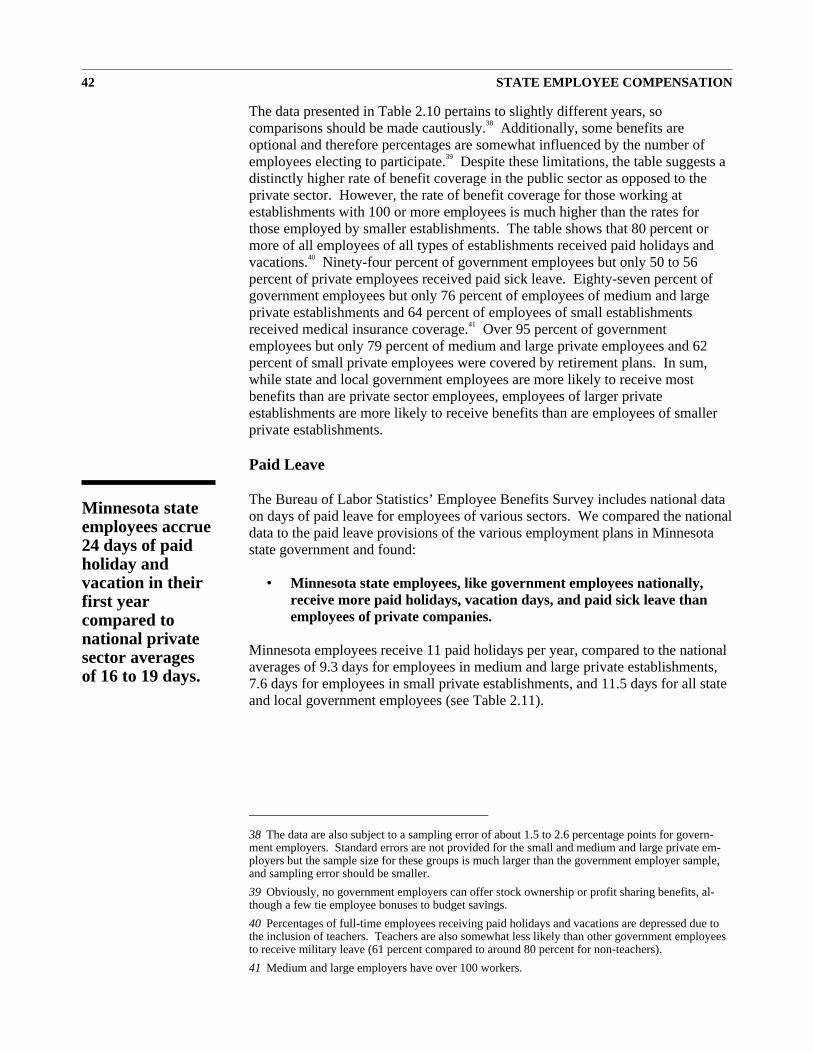
The data presented in Table 2.10 pertains to slightly different years, socomparisons should be made cautiously.38 Additionally, some benefits areoptional and therefore percentages are somewhat influenced by the number ofemployees electing to participate.39 Despite these limitations, the table suggests adistinctly higher rate of benefit coverage in the public sector as opposed to theprivate sector. However, the rate of benefit coverage for those working atestablishments with 100 or more employees is much higher than the rates forthose employed by smaller establishments. The table shows that 80 percent ormore of all employees of all types of establishments received paid holidays andvacations.40 Ninety-four percent of government employees but only 50 to 56percent of private employees received paid sick leave. Eighty-seven percent ofgovernment employees but only 76 percent of employees of medium and largeprivate establishments and 64 percent of employees of small establishmentsreceived medical insurance coverage.41 Over 95 percent of governmentemployees but only 79 percent of medium and large private employees and 62percent of small private employees were covered by retirement plans. In sum,while state and local government employees are more likely to receive mostbenefits than are private sector employees, employees of larger privateestablishments are more likely to receive benefits than are employees of smallerprivate establishments.
Paid Leave
The Bureau of Labor Statistics’ Employee Benefits Survey includes national dataon days of paid leave for employees of various sectors. We compared the nationaldata to the paid leave provisions of the various employment plans in Minnesotastate government and found:
• Minnesota state employees, like government employees nationally,receive more paid holidays, vacation days, and paid sick leave thanemployees of private companies.
Minnesota employees receive 11 paid holidays per year, compared to the nationalaverages of 9.3 days for employees in medium and large private establishments,7.6 days for employees in small private establishments, and 11.5 days for all stateand local government employees (see Table 2.11).
42 STATE EMPLOYEE COMPENSATION
Minnesota stateemployees accrue24 days of paidholiday andvacation in theirfirst yearcompared tonational privatesector averagesof 16 to 19 days.
38 The data are also subject to a sampling error of about 1.5 to 2.6 percentage points for govern-ment employers. Standard errors are not provided for the small and medium and large private em-ployers but the sample size for these groups is much larger than the government employer sample,and sampling error should be smaller.
39 Obviously, no government employers can offer stock ownership or profit sharing benefits, al-though a few tie employee bonuses to budget savings.
40 Percentages of full-time employees receiving paid holidays and vacations are depressed due tothe inclusion of teachers. Teachers are also somewhat less likely than other government employeesto receive military leave (61 percent compared to around 80 percent for non-teachers).
41 Medium and large employers have over 100 workers.
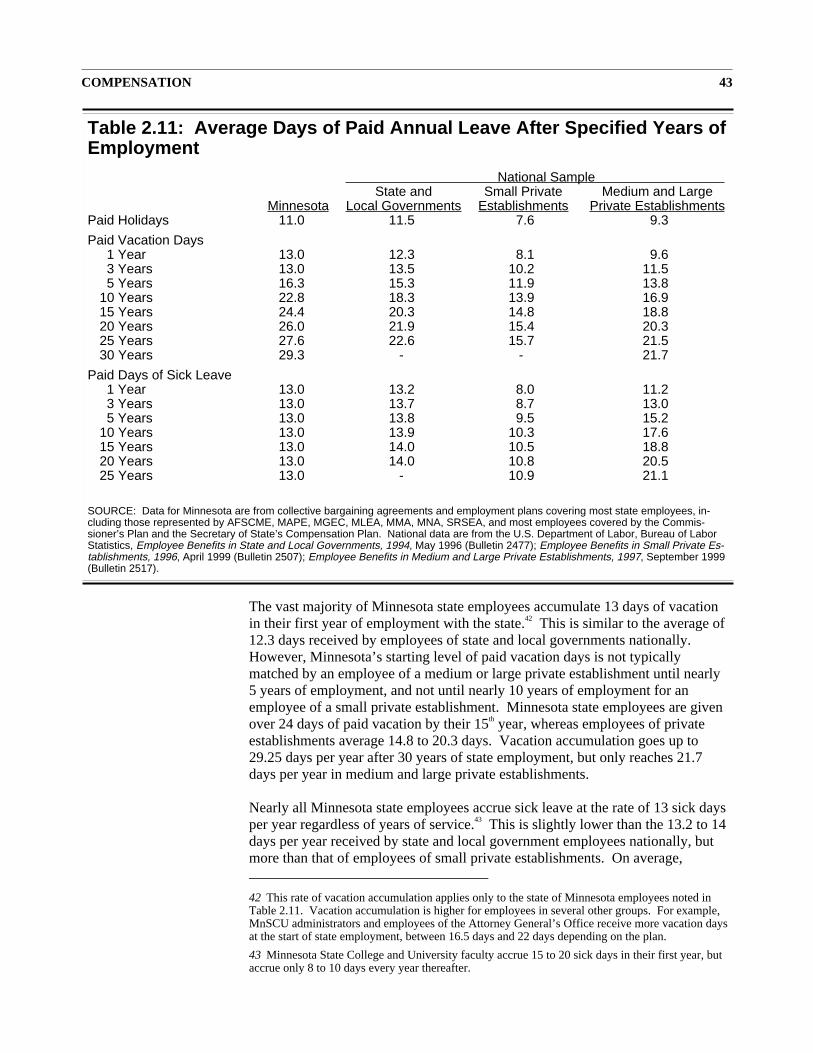
The vast majority of Minnesota state employees accumulate 13 days of vacationin their first year of employment with the state.42 This is similar to the average of12.3 days received by employees of state and local governments nationally.However, Minnesota’s starting level of paid vacation days is not typicallymatched by an employee of a medium or large private establishment until nearly5 years of employment, and not until nearly 10 years of employment for anemployee of a small private establishment. Minnesota state employees are givenover 24 days of paid vacation by their 15th year, whereas employees of privateestablishments average 14.8 to 20.3 days. Vacation accumulation goes up to29.25 days per year after 30 years of state employment, but only reaches 21.7days per year in medium and large private establishments.
Nearly all Minnesota state employees accrue sick leave at the rate of 13 sick daysper year regardless of years of service.43 This is slightly lower than the 13.2 to 14days per year received by state and local government employees nationally, butmore than that of employees of small private establishments. On average,
COMPENSATION 43
Table 2.11: Average Days of Paid Annual Leave After Specified Years ofEmployment
National SampleState and Small Private Medium and Large
Minnesota Local Governments Establishments Private EstablishmentsPaid Holidays 11.0 11.5 7.6 9.3
Paid Vacation Days1 Year 13.0 12.3 8.1 9.63 Years 13.0 13.5 10.2 11.55 Years 16.3 15.3 11.9 13.8
10 Years 22.8 18.3 13.9 16.915 Years 24.4 20.3 14.8 18.820 Years 26.0 21.9 15.4 20.325 Years 27.6 22.6 15.7 21.530 Years 29.3 - - 21.7
Paid Days of Sick Leave1 Year 13.0 13.2 8.0 11.23 Years 13.0 13.7 8.7 13.05 Years 13.0 13.8 9.5 15.2
10 Years 13.0 13.9 10.3 17.615 Years 13.0 14.0 10.5 18.820 Years 13.0 14.0 10.8 20.525 Years 13.0 - 10.9 21.1
SOURCE: Data for Minnesota are from collective bargaining agreements and employment plans covering most state employees, in-cluding those represented by AFSCME, MAPE, MGEC, MLEA, MMA, MNA, SRSEA, and most employees covered by the Commis-sioner’s Plan and the Secretary of State’s Compensation Plan. National data are from the U.S. Department of Labor, Bureau of LaborStatistics, Employee Benefits in State and Local Governments, 1994, May 1996 (Bulletin 2477); Employee Benefits in Small Private Es-tablishments, 1996, April 1999 (Bulletin 2507); Employee Benefits in Medium and Large Private Establishments, 1997, September 1999(Bulletin 2517).
42 This rate of vacation accumulation applies only to the state of Minnesota employees noted inTable 2.11. Vacation accumulation is higher for employees in several other groups. For example,MnSCU administrators and employees of the Attorney General’s Office receive more vacation daysat the start of state employment, between 16.5 days and 22 days depending on the plan.
43 Minnesota State College and University faculty accrue 15 to 20 sick days in their first year, butaccrue only 8 to 10 days every year thereafter.
employees of medium and large private establishments start with 11.2 sick days,but this number increases to 21.1 after 25 years of experience.
Benefit CostIn this section we provide comparative data on the cost of employee benefits. Thecost to employers of providing benefits is not necessarily equal to the value ofbenefits to employees; we do not attempt to measure the value of benefits toemployees or analyze the issues involved in providing different types of benefits.The state has important choices to make in what types of benefits to offer andwhat degree of choice to offer employees, but these topics merit another study.
When we compared data on the costs of benefits for Minnesota state employees tonational data on government and private company employees, we found:
• Public employers nationally offer greater employee benefits thanprivate employers measured either in dollars or as a percentage oftotal compensation.
• The state of Minnesota offers a benefit package that, measured bycost, is generally equal to or better than benefits offered by otherstates, other public employers in Minnesota, and private and publicemployers nationally.
The Bureau of Labor Statistics (BLS) publishes data on the employer cost ofemployee compensation, including both wage and salary costs and benefit costs,in its annual Employer Costs for Employer Compensation series.44 BLS compilesestimates for benefit categories including retirement, paid leave, and insurance, aswell as legally required employee-paid benefits such as social security,unemployment insurance, and workers’ compensation.
Comparing benefit costs among employers is difficult because average wagesdiffer among employers and some costs are calculated as a percent of wages orsalary.45 For example, the cost of paid leave, retirement, and social security are afunction of wage rates. Government employees in general and Minnesota stateemployees in particular are more highly paid than employees of privatecompanies. As a consequence, the dollar value of benefits is higher forgovernment employees than for private employees. One way around the problemof comparing benefits of groups with different average wages is to look at thepercentage of total compensation accounted for by benefits.
Tables 2.12, 2.13, and 2.14 present a detailed look at average benefit costs forthree categories of employees: private employees nationally, state and localgovernment employees nationally, and Minnesota state employees.46 First,
44 STATE EMPLOYEE COMPENSATION
We comparedthe cost ofbenefits paid bythe state tobenefit costs ofother employers.
44 See http://stats.bls.gov/news.release/ecec.toc.htm; accessed October 4, 1999.
45 Sectoral variations in occupational distribution also complicate the comparison of employee ben-efits. See Bradley R. Braden and Stephanie L. Hyland, “Cost of Employee Compensation in Publicand Private Sectors,” Monthly Labor Review (May 1993): 14-21.
46 Small differences between the various sectors should be interpreted with caution since all figuresare subject to sampling and non-sampling errors, and because the composition of the workforceacross employers and the level of compensation varies.
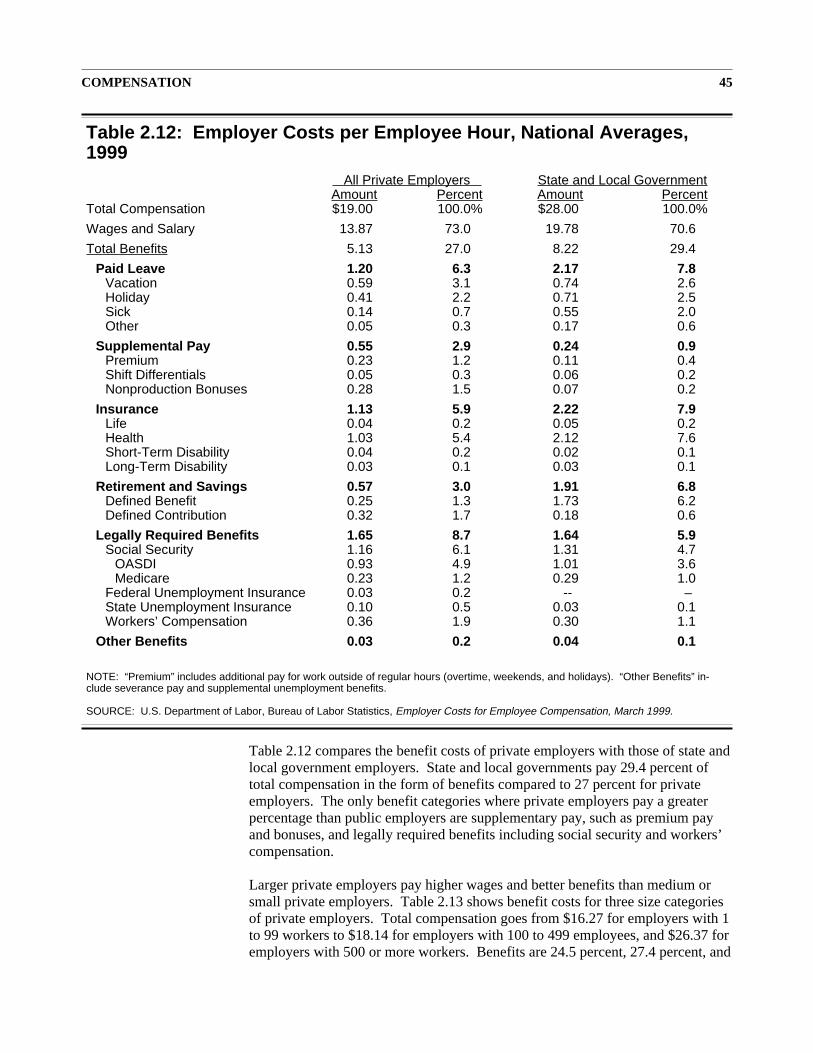
Table 2.12 compares the benefit costs of private employers with those of state andlocal government employers. State and local governments pay 29.4 percent oftotal compensation in the form of benefits compared to 27 percent for privateemployers. The only benefit categories where private employers pay a greaterpercentage than public employers are supplementary pay, such as premium payand bonuses, and legally required benefits including social security and workers’compensation.
Larger private employers pay higher wages and better benefits than medium orsmall private employers. Table 2.13 shows benefit costs for three size categoriesof private employers. Total compensation goes from $16.27 for employers with 1to 99 workers to $18.14 for employers with 100 to 499 employees, and $26.37 foremployers with 500 or more workers. Benefits are 24.5 percent, 27.4 percent, and
COMPENSATION 45
Table 2.12: Employer Costs per Employee Hour, National Averages,1999
All Private Employers State and Local GovernmentAmount Percent Amount Percent
Total Compensation $19.00 100.0% $28.00 100.0%
Wages and Salary 13.87 73.0 19.78 70.6
Total Benefits 5.13 27.0 8.22 29.4
Paid Leave 1.20 6.3 2.17 7.8Vacation 0.59 3.1 0.74 2.6Holiday 0.41 2.2 0.71 2.5Sick 0.14 0.7 0.55 2.0Other 0.05 0.3 0.17 0.6
Supplemental Pay 0.55 2.9 0.24 0.9Premium 0.23 1.2 0.11 0.4Shift Differentials 0.05 0.3 0.06 0.2Nonproduction Bonuses 0.28 1.5 0.07 0.2
Insurance 1.13 5.9 2.22 7.9Life 0.04 0.2 0.05 0.2Health 1.03 5.4 2.12 7.6Short-Term Disability 0.04 0.2 0.02 0.1Long-Term Disability 0.03 0.1 0.03 0.1
Retirement and Savings 0.57 3.0 1.91 6.8Defined Benefit 0.25 1.3 1.73 6.2Defined Contribution 0.32 1.7 0.18 0.6
Legally Required Benefits 1.65 8.7 1.64 5.9Social Security 1.16 6.1 1.31 4.7
OASDI 0.93 4.9 1.01 3.6Medicare 0.23 1.2 0.29 1.0
Federal Unemployment Insurance 0.03 0.2 -- –State Unemployment Insurance 0.10 0.5 0.03 0.1Workers’ Compensation 0.36 1.9 0.30 1.1
Other Benefits 0.03 0.2 0.04 0.1
NOTE: “Premium” includes additional pay for work outside of regular hours (overtime, weekends, and holidays). “Other Benefits” in-clude severance pay and supplemental unemployment benefits.
SOURCE: U.S. Department of Labor, Bureau of Labor Statistics, Employer Costs for Employee Compensation, March 1999.
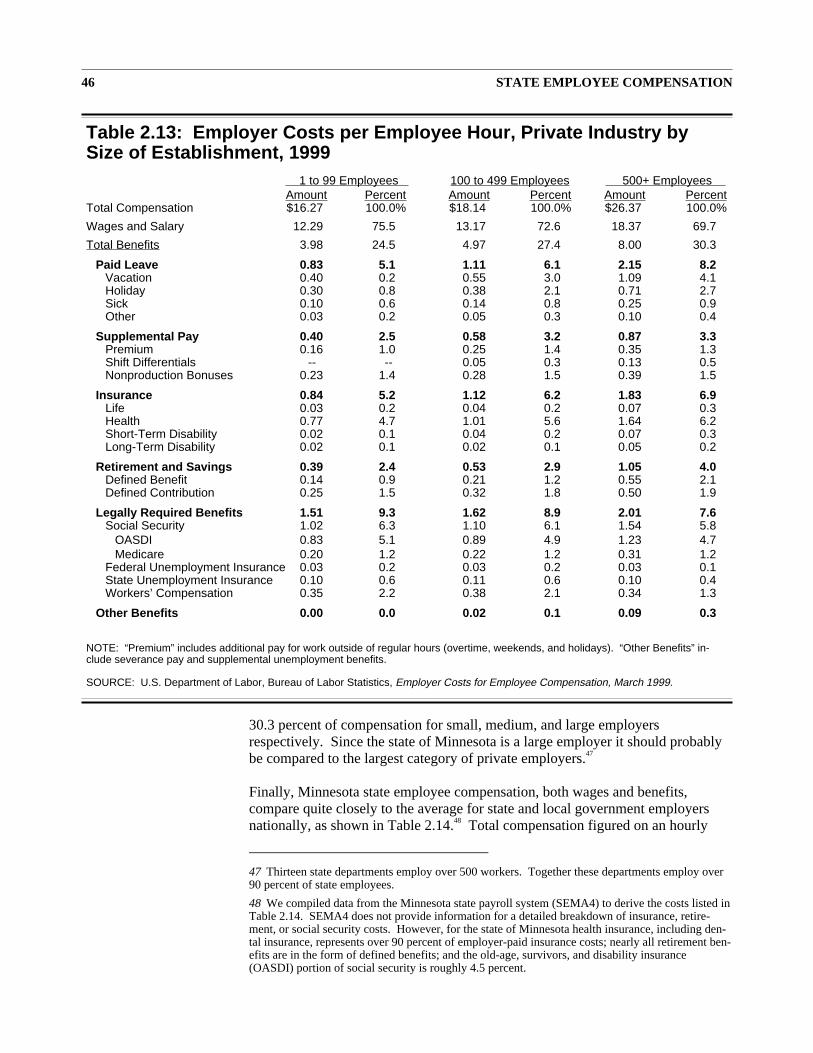
30.3 percent of compensation for small, medium, and large employersrespectively. Since the state of Minnesota is a large employer it should probablybe compared to the largest category of private employers.47
Finally, Minnesota state employee compensation, both wages and benefits,compare quite closely to the average for state and local government employersnationally, as shown in Table 2.14.48 Total compensation figured on an hourly
46 STATE EMPLOYEE COMPENSATION
Table 2.13: Employer Costs per Employee Hour, Private Industry bySize of Establishment, 1999
1 to 99 Employees 100 to 499 Employees 500+ EmployeesAmount Percent Amount Percent Amount Percent
Total Compensation $16.27 100.0% $18.14 100.0% $26.37 100.0%
Wages and Salary 12.29 75.5 13.17 72.6 18.37 69.7
Total Benefits 3.98 24.5 4.97 27.4 8.00 30.3
Paid Leave 0.83 5.1 1.11 6.1 2.15 8.2Vacation 0.40 0.2 0.55 3.0 1.09 4.1Holiday 0.30 0.8 0.38 2.1 0.71 2.7Sick 0.10 0.6 0.14 0.8 0.25 0.9Other 0.03 0.2 0.05 0.3 0.10 0.4
Supplemental Pay 0.40 2.5 0.58 3.2 0.87 3.3Premium 0.16 1.0 0.25 1.4 0.35 1.3Shift Differentials -- -- 0.05 0.3 0.13 0.5Nonproduction Bonuses 0.23 1.4 0.28 1.5 0.39 1.5
Insurance 0.84 5.2 1.12 6.2 1.83 6.9Life 0.03 0.2 0.04 0.2 0.07 0.3Health 0.77 4.7 1.01 5.6 1.64 6.2Short-Term Disability 0.02 0.1 0.04 0.2 0.07 0.3Long-Term Disability 0.02 0.1 0.02 0.1 0.05 0.2
Retirement and Savings 0.39 2.4 0.53 2.9 1.05 4.0Defined Benefit 0.14 0.9 0.21 1.2 0.55 2.1Defined Contribution 0.25 1.5 0.32 1.8 0.50 1.9
Legally Required Benefits 1.51 9.3 1.62 8.9 2.01 7.6Social Security 1.02 6.3 1.10 6.1 1.54 5.8
OASDI 0.83 5.1 0.89 4.9 1.23 4.7Medicare 0.20 1.2 0.22 1.2 0.31 1.2
Federal Unemployment Insurance 0.03 0.2 0.03 0.2 0.03 0.1State Unemployment Insurance 0.10 0.6 0.11 0.6 0.10 0.4Workers’ Compensation 0.35 2.2 0.38 2.1 0.34 1.3
Other Benefits 0.00 0.0 0.02 0.1 0.09 0.3
NOTE: “Premium” includes additional pay for work outside of regular hours (overtime, weekends, and holidays). “Other Benefits” in-clude severance pay and supplemental unemployment benefits.
SOURCE: U.S. Department of Labor, Bureau of Labor Statistics, Employer Costs for Employee Compensation, March 1999.
47 Thirteen state departments employ over 500 workers. Together these departments employ over90 percent of state employees.
48 We compiled data from the Minnesota state payroll system (SEMA4) to derive the costs listed inTable 2.14. SEMA4 does not provide information for a detailed breakdown of insurance, retire-ment, or social security costs. However, for the state of Minnesota health insurance, including den-tal insurance, represents over 90 percent of employer-paid insurance costs; nearly all retirement ben-efits are in the form of defined benefits; and the old-age, survivors, and disability insurance(OASDI) portion of social security is roughly 4.5 percent.
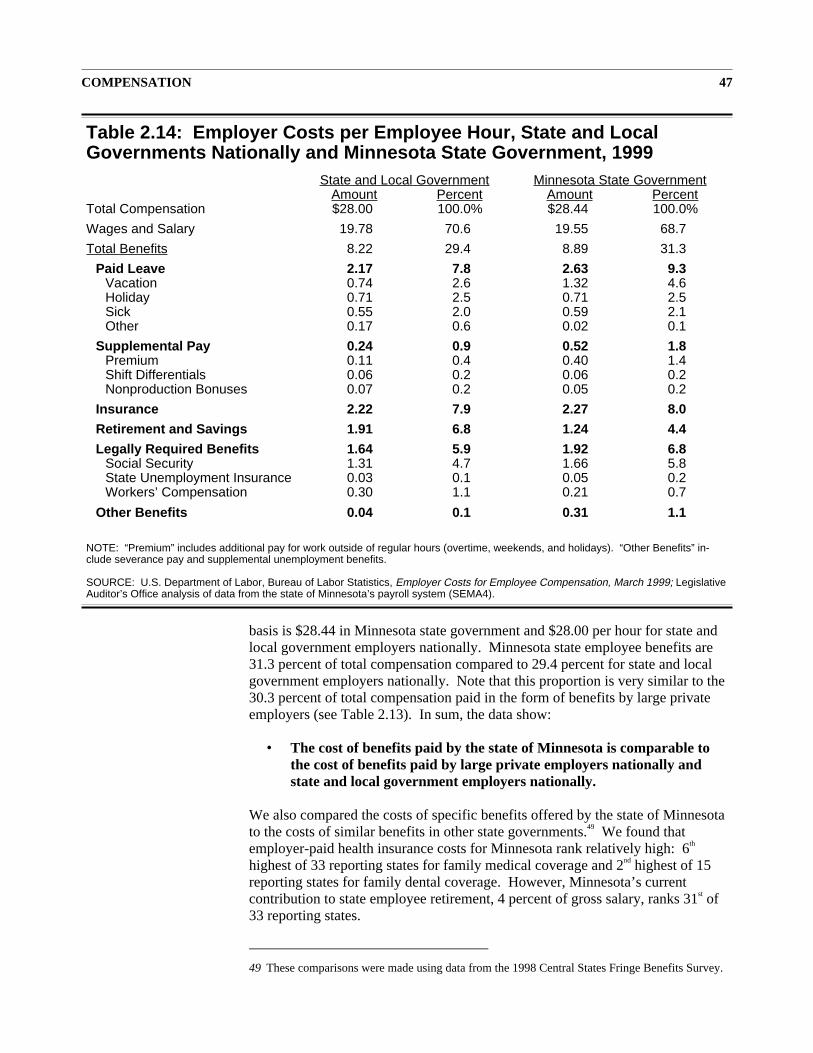
basis is $28.44 in Minnesota state government and $28.00 per hour for state andlocal government employers nationally. Minnesota state employee benefits are31.3 percent of total compensation compared to 29.4 percent for state and localgovernment employers nationally. Note that this proportion is very similar to the30.3 percent of total compensation paid in the form of benefits by large privateemployers (see Table 2.13). In sum, the data show:
• The cost of benefits paid by the state of Minnesota is comparable tothe cost of benefits paid by large private employers nationally andstate and local government employers nationally.
We also compared the costs of specific benefits offered by the state of Minnesotato the costs of similar benefits in other state governments.49 We found thatemployer-paid health insurance costs for Minnesota rank relatively high: 6th
highest of 33 reporting states for family medical coverage and 2nd highest of 15reporting states for family dental coverage. However, Minnesota’s currentcontribution to state employee retirement, 4 percent of gross salary, ranks 31st of33 reporting states.
COMPENSATION 47
Table 2.14: Employer Costs per Employee Hour, State and LocalGovernments Nationally and Minnesota State Government, 1999
State and Local Government Minnesota State GovernmentAmount Percent Amount Percent
Total Compensation $28.00 100.0% $28.44 100.0%
Wages and Salary 19.78 70.6 19.55 68.7
Total Benefits 8.22 29.4 8.89 31.3
Paid Leave 2.17 7.8 2.63 9.3Vacation 0.74 2.6 1.32 4.6Holiday 0.71 2.5 0.71 2.5Sick 0.55 2.0 0.59 2.1Other 0.17 0.6 0.02 0.1
Supplemental Pay 0.24 0.9 0.52 1.8Premium 0.11 0.4 0.40 1.4Shift Differentials 0.06 0.2 0.06 0.2Nonproduction Bonuses 0.07 0.2 0.05 0.2
Insurance 2.22 7.9 2.27 8.0
Retirement and Savings 1.91 6.8 1.24 4.4
Legally Required Benefits 1.64 5.9 1.92 6.8Social Security 1.31 4.7 1.66 5.8State Unemployment Insurance 0.03 0.1 0.05 0.2Workers’ Compensation 0.30 1.1 0.21 0.7
Other Benefits 0.04 0.1 0.31 1.1
NOTE: “Premium” includes additional pay for work outside of regular hours (overtime, weekends, and holidays). “Other Benefits” in-clude severance pay and supplemental unemployment benefits.
SOURCE: U.S. Department of Labor, Bureau of Labor Statistics, Employer Costs for Employee Compensation, March 1999; LegislativeAuditor’s Office analysis of data from the state of Minnesota’s payroll system (SEMA4).
49 These comparisons were made using data from the 1998 Central States Fringe Benefits Survey.
We also compared the health and dental insurance payments made by the state ofMinnesota to large public employers in the Twin Cities, the city of Duluth, and St.Louis and Olmsted counties. State health and dental insurance payments areabove average for the 20 public employers for which we have data.50 The state ofMinnesota pays $195 to $203 per month for individual health and dental insuranceand about $462 to $470 per month for family coverage. This amount is higherthan most metropolitan agencies, metropolitan and larger outstate counties, andlarger municipal governments in the Twin Cities area.
SUMMARY
This chapter has presented various comparisons of Minnesota state employeecompensation to compensation provided by other private and public employers.On average, the state of Minnesota tends to pay higher wages than other states.But Minnesota employs fewer workers than most other state governments and thismay affect the comparison. Minnesota state government pays a higher averagehourly wage than the private sector because government employment contains ahigher percentage of professional employees and fewer production, sales, andassembly workers.
When specific job categories are compared, we found that Minnesota follows thenational pattern of government pay scale compression by paying higher wages toentry-level and lower-skilled positions, and lower wages to upper-levelprofessional and managerial employees. Thus, there are significant differencesbetween many state salaries and market rates. However, the data suggest that ifall state jobs were paid at rates comparable to the private sector, the state’s payrollwould not change greatly.
There is significant variation in pay around the state. Pay in the Twin Cities areais approximately 20 percent higher than in most other metropolitan areas and inthe nonmetropolitan balance of the state. In contrast, state government employeesare paid according to statewide salary schedules, and while there is somegeographic variation in state salaries, it is much less than wages and salaries ingeneral. Many private employers and some public employers, including thefederal government, vary pay rates according to regional differences in employeecompensation costs.
Minnesota employee benefits total approximately 31 percent of total employeecompensation. This is about the same as government employers and large privateemployers nationally, but distinctly more than paid by most private employers.Minnesota provides vacation, sick leave, and holiday benefits that are competitivewith other public employers and higher than private employers.
As we will see in the next chapter, employee compensation is one of severalfactors that human resources staff in state agencies believe are responsible forproblems in recruitment and retention of employees.
48 STATE EMPLOYEE COMPENSATION
The state ofMinnesota payshigher healthinsurancepremiums, butlower retirementcontributions,than many otherpublicemployers.
50 The source of this information is the 1999 Stanton and Associates benefits survey.
33 Recruitment and Retention
SUMMARY
Most state agencies have experienced some recruitment and retentionproblems over the past two years, particularly in informationtechnology, office administration, and accounting jobs. Agencyhuman resource directors generally attribute these problems to thecurrent labor market, not to inadequate compensation. To help solverecruitment and retention problems, human resource directors believethe Department of Employee Relations should simplify the selectionand hiring process of employees. They also believe DOER shouldimprove and expand its recruitment efforts.
This chapter addresses the following questions:
• Which state jobs are currently hard to fill?
• To what extent is low employee compensation responsible forrecruitment and retention problems?
• What do state human resource professionals recommend as solutionsto recruitment and retention problems?
To answer these questions, we surveyed human resource directors from 34 stateagencies.1 All agencies responded to the survey.2 We also spoke with severalstate human resource directors, as well as representatives from the Department ofEmployee Relations.
CURRENT RECRUITMENT ANDRETENTION PROBLEMS
Human resource directors, responsible for employee recruitment and retention instate agencies, have knowledge about hiring and compensation problems for the
1 The 34 state agencies we surveyed are: Administration; Agriculture; Attorney General;Children, Families, and Learning; Commerce; Corrections; Economic Security; Employee Rela-tions; Environmental Assistance; Finance; Health; Housing Finance; Human Rights; Human Ser-vices; Labor and Industry; Lottery; MnSCU; Mediation Services; Military Affairs; Minnesota StateRetirement System; Natural Resources; Planning; Pollution Control; Public Employment RetirementAssociation; Public Safety; Public Service; Revenue; Secretary of State; State Auditor; Teacher Re-tirement Association; Trade and Economic Development, Transportation; Veterans Affairs; and theZoo.
2 The complete survey can be found on our website at http://www.auditor.leg.state.mn.us/ped/2000/pe0005.htm.
job classes used in their agencies. In some cases, these officials are responsiblefor large human resource divisions with employees in various locations around thestate. We surveyed human resource directors in 34 state agencies to identifycurrent recruitment and retention problems. According to our survey of stateagency human resource directors:
• Nearly all state agencies have experienced employee recruitmentand/or retention problems over the past two years.
Of the 34 state agency human resource directors we surveyed, only 3 reported thatthey have not had any problems recruiting and/or retaining employees in the lasttwo years. Agencies that experienced difficulties reported problems in varioustypes of jobs.
As explained in Chapter 1, the Minnesota Department of Employee Relations(DOER) groups the more than 2,200 state employee classifications into 39 broademployment categories called “career families.” (See Appendix A for a completedescription of the career families.)3 According to our survey, human resourcedirectors reported problems recruiting and/or retaining employees in 31 of thesecareer families. Three career families presented the greatest problems. As shownin Table 3.1:
• The most frequently-reported recruitment and retention problems arein information technology, office administration, and accountingcareers.
50 STATE EMPLOYEE COMPENSATION
Human resource directors report problems recruiting and retaining employees ininformation technology positions.
3 A description of DOER’s career families can also be found on their website athttp://www.doer.state.mn.us/stf-bltn/famlydef.htm.
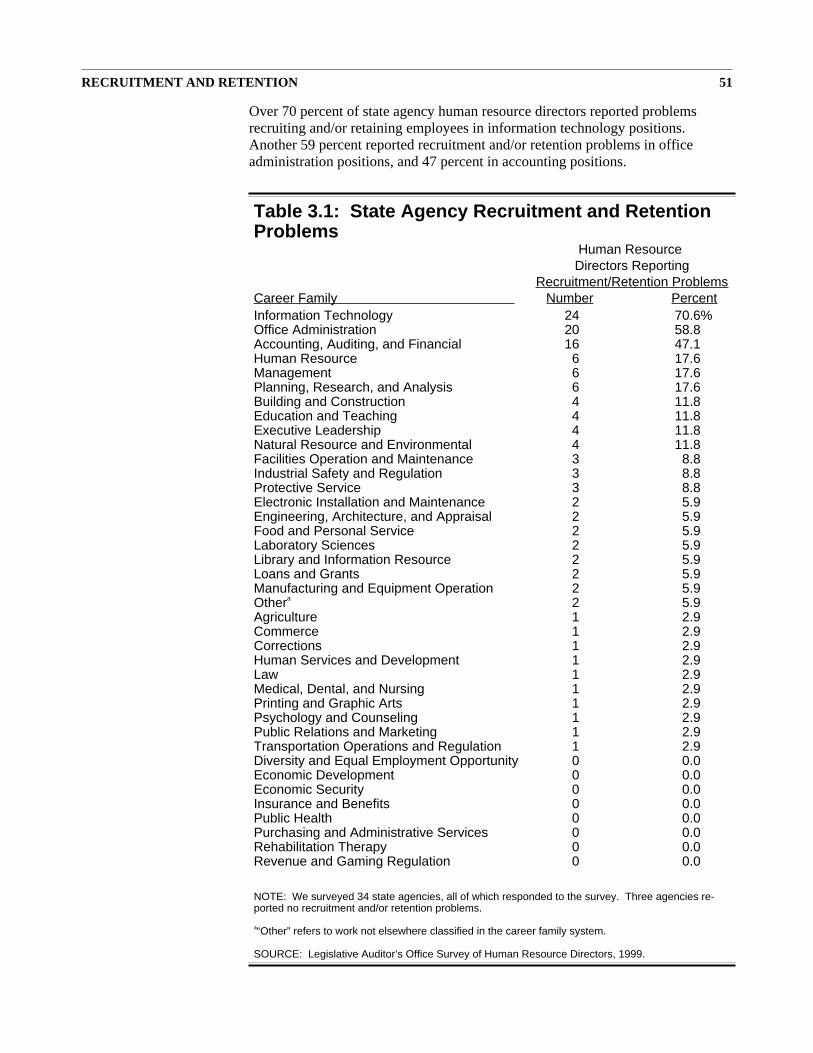
Over 70 percent of state agency human resource directors reported problemsrecruiting and/or retaining employees in information technology positions.Another 59 percent reported recruitment and/or retention problems in officeadministration positions, and 47 percent in accounting positions.
RECRUITMENT AND RETENTION 51
Table 3.1: State Agency Recruitment and RetentionProblems
Human ResourceDirectors Reporting
Recruitment/Retention ProblemsCareer Family Number PercentInformation Technology 24 70.6%Office Administration 20 58.8Accounting, Auditing, and Financial 16 47.1Human Resource 6 17.6Management 6 17.6Planning, Research, and Analysis 6 17.6Building and Construction 4 11.8Education and Teaching 4 11.8Executive Leadership 4 11.8Natural Resource and Environmental 4 11.8Facilities Operation and Maintenance 3 8.8Industrial Safety and Regulation 3 8.8Protective Service 3 8.8Electronic Installation and Maintenance 2 5.9Engineering, Architecture, and Appraisal 2 5.9Food and Personal Service 2 5.9Laboratory Sciences 2 5.9Library and Information Resource 2 5.9Loans and Grants 2 5.9Manufacturing and Equipment Operation 2 5.9Othera 2 5.9Agriculture 1 2.9Commerce 1 2.9Corrections 1 2.9Human Services and Development 1 2.9Law 1 2.9Medical, Dental, and Nursing 1 2.9Printing and Graphic Arts 1 2.9Psychology and Counseling 1 2.9Public Relations and Marketing 1 2.9Transportation Operations and Regulation 1 2.9Diversity and Equal Employment Opportunity 0 0.0Economic Development 0 0.0Economic Security 0 0.0Insurance and Benefits 0 0.0Public Health 0 0.0Purchasing and Administrative Services 0 0.0Rehabilitation Therapy 0 0.0Revenue and Gaming Regulation 0 0.0
NOTE: We surveyed 34 state agencies, all of which responded to the survey. Three agencies re-ported no recruitment and/or retention problems.
a“Other” refers to work not elsewhere classified in the career family system.
SOURCE: Legislative Auditor’s Office Survey of Human Resource Directors, 1999.
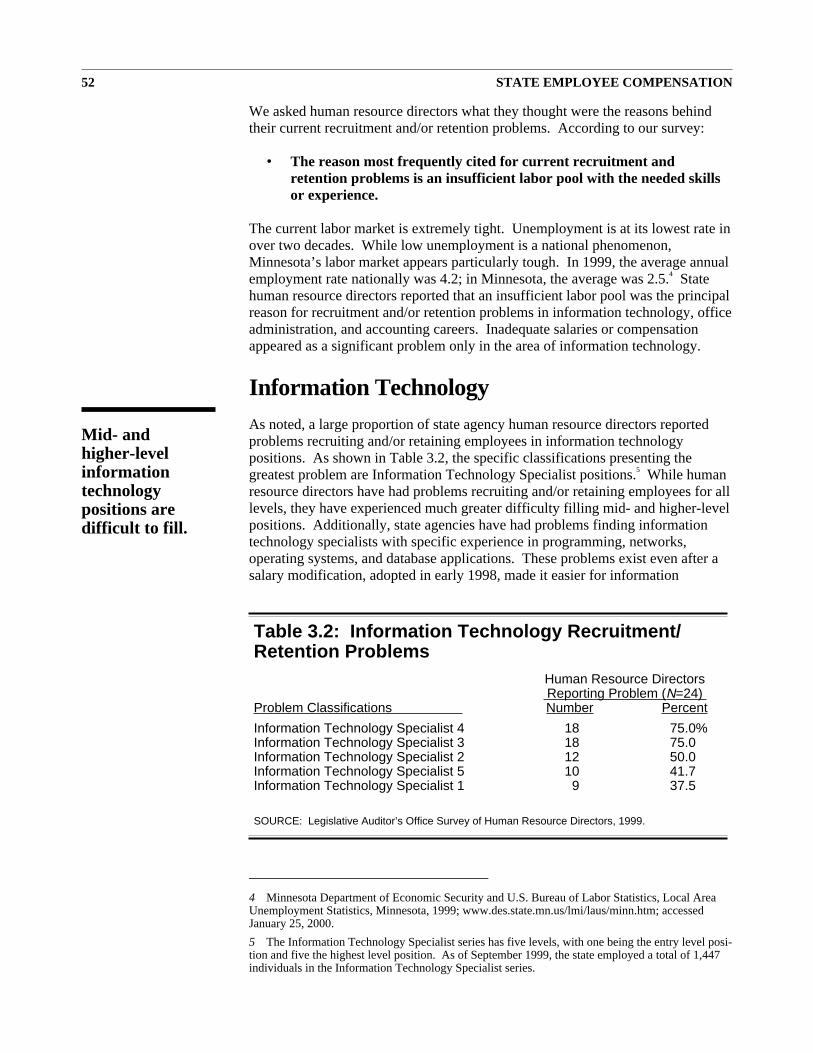
We asked human resource directors what they thought were the reasons behindtheir current recruitment and/or retention problems. According to our survey:
• The reason most frequently cited for current recruitment andretention problems is an insufficient labor pool with the needed skillsor experience.
The current labor market is extremely tight. Unemployment is at its lowest rate inover two decades. While low unemployment is a national phenomenon,Minnesota’s labor market appears particularly tough. In 1999, the average annualemployment rate nationally was 4.2; in Minnesota, the average was 2.5.4 Statehuman resource directors reported that an insufficient labor pool was the principalreason for recruitment and/or retention problems in information technology, officeadministration, and accounting careers. Inadequate salaries or compensationappeared as a significant problem only in the area of information technology.
Information TechnologyAs noted, a large proportion of state agency human resource directors reportedproblems recruiting and/or retaining employees in information technologypositions. As shown in Table 3.2, the specific classifications presenting thegreatest problem are Information Technology Specialist positions.5 While humanresource directors have had problems recruiting and/or retaining employees for alllevels, they have experienced much greater difficulty filling mid- and higher-levelpositions. Additionally, state agencies have had problems finding informationtechnology specialists with specific experience in programming, networks,operating systems, and database applications. These problems exist even after asalary modification, adopted in early 1998, made it easier for information
52 STATE EMPLOYEE COMPENSATION
Table 3.2: Information Technology Recruitment/Retention Problems
Human Resource DirectorsReporting Problem (N=24)
Problem Classifications Number Percent
Information Technology Specialist 4 18 75.0%Information Technology Specialist 3 18 75.0Information Technology Specialist 2 12 50.0Information Technology Specialist 5 10 41.7Information Technology Specialist 1 9 37.5
SOURCE: Legislative Auditor’s Office Survey of Human Resource Directors, 1999.
Mid- andhigher-levelinformationtechnologypositions aredifficult to fill.
4 Minnesota Department of Economic Security and U.S. Bureau of Labor Statistics, Local AreaUnemployment Statistics, Minnesota, 1999; www.des.state.mn.us/lmi/laus/minn.htm; accessedJanuary 25, 2000.
5 The Information Technology Specialist series has five levels, with one being the entry level posi-tion and five the highest level position. As of September 1999, the state employed a total of 1,447individuals in the Information Technology Specialist series.
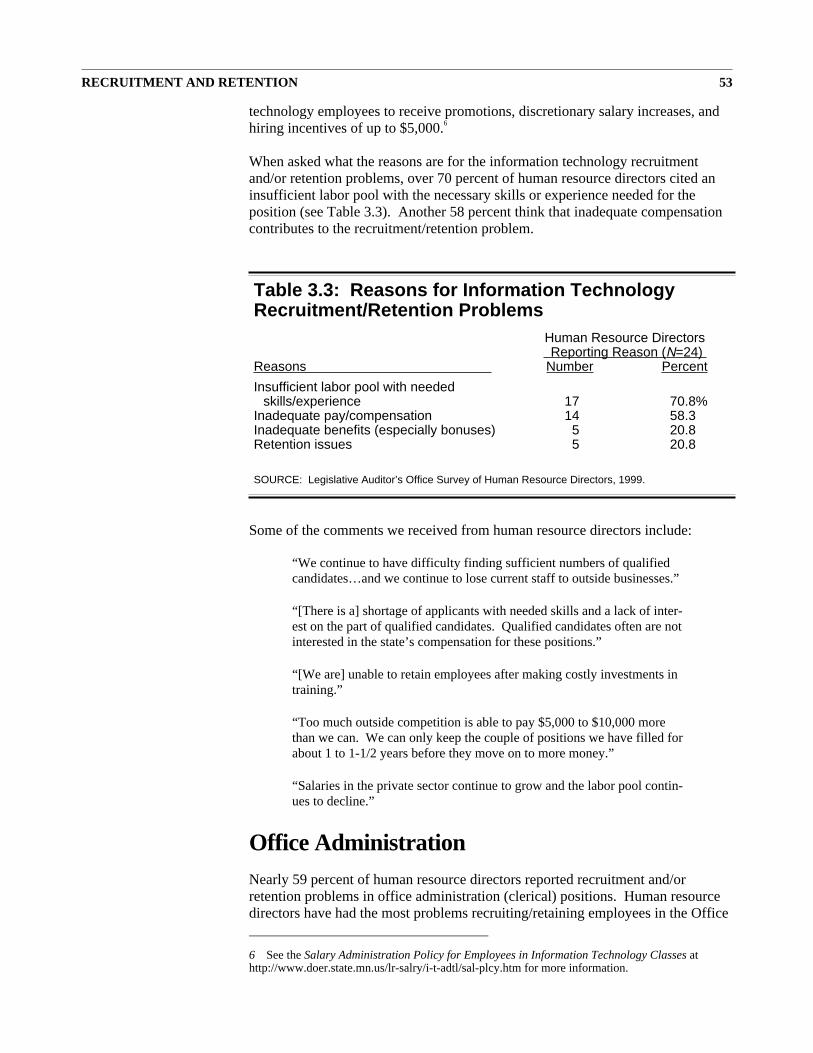
technology employees to receive promotions, discretionary salary increases, andhiring incentives of up to $5,000.6
When asked what the reasons are for the information technology recruitmentand/or retention problems, over 70 percent of human resource directors cited aninsufficient labor pool with the necessary skills or experience needed for theposition (see Table 3.3). Another 58 percent think that inadequate compensationcontributes to the recruitment/retention problem.
Some of the comments we received from human resource directors include:
“We continue to have difficulty finding sufficient numbers of qualifiedcandidates…and we continue to lose current staff to outside businesses.”
“[There is a] shortage of applicants with needed skills and a lack of inter-est on the part of qualified candidates. Qualified candidates often are notinterested in the state’s compensation for these positions.”
“[We are] unable to retain employees after making costly investments intraining.”
“Too much outside competition is able to pay $5,000 to $10,000 morethan we can. We can only keep the couple of positions we have filled forabout 1 to 1-1/2 years before they move on to more money.”
“Salaries in the private sector continue to grow and the labor pool contin-ues to decline.”
Office AdministrationNearly 59 percent of human resource directors reported recruitment and/orretention problems in office administration (clerical) positions. Human resourcedirectors have had the most problems recruiting/retaining employees in the Office
RECRUITMENT AND RETENTION 53
Table 3.3: Reasons for Information TechnologyRecruitment/Retention Problems
Human Resource DirectorsReporting Reason (N=24)
Reasons Number Percent
Insufficient labor pool with neededskills/experience 17 70.8%
Inadequate pay/compensation 14 58.3Inadequate benefits (especially bonuses) 5 20.8Retention issues 5 20.8
SOURCE: Legislative Auditor’s Office Survey of Human Resource Directors, 1999.
6 See the Salary Administration Policy for Employees in Information Technology Classes athttp://www.doer.state.mn.us/lr-salry/i-t-adtl/sal-plcy.htm for more information.
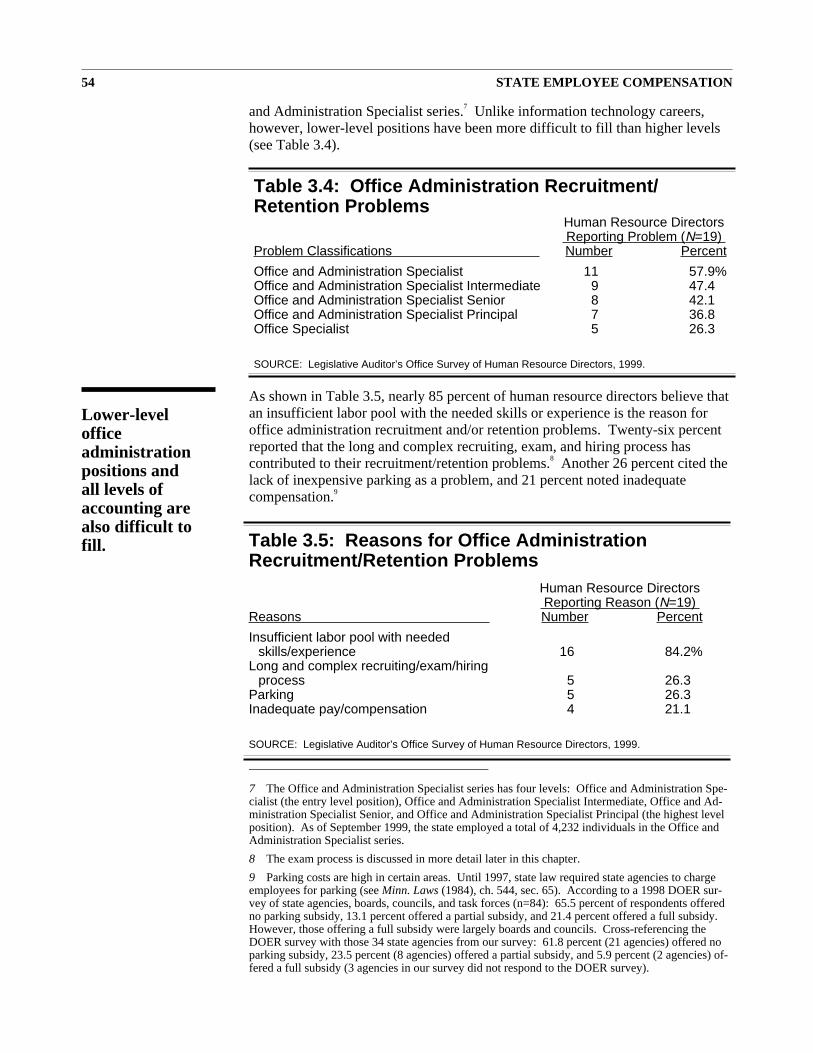
and Administration Specialist series.7 Unlike information technology careers,however, lower-level positions have been more difficult to fill than higher levels(see Table 3.4).
As shown in Table 3.5, nearly 85 percent of human resource directors believe thatan insufficient labor pool with the needed skills or experience is the reason foroffice administration recruitment and/or retention problems. Twenty-six percentreported that the long and complex recruiting, exam, and hiring process hascontributed to their recruitment/retention problems.8 Another 26 percent cited thelack of inexpensive parking as a problem, and 21 percent noted inadequatecompensation.9
54 STATE EMPLOYEE COMPENSATION
Table 3.5: Reasons for Office AdministrationRecruitment/Retention Problems
Human Resource DirectorsReporting Reason (N=19)
Reasons Number Percent
Insufficient labor pool with neededskills/experience 16 84.2%
Long and complex recruiting/exam/hiringprocess 5 26.3
Parking 5 26.3Inadequate pay/compensation 4 21.1
SOURCE: Legislative Auditor’s Office Survey of Human Resource Directors, 1999.
Table 3.4: Office Administration Recruitment/Retention Problems
Human Resource DirectorsReporting Problem (N=19)
Problem Classifications Number Percent
Office and Administration Specialist 11 57.9%Office and Administration Specialist Intermediate 9 47.4Office and Administration Specialist Senior 8 42.1Office and Administration Specialist Principal 7 36.8Office Specialist 5 26.3
SOURCE: Legislative Auditor’s Office Survey of Human Resource Directors, 1999.
Lower-levelofficeadministrationpositions andall levels ofaccounting arealso difficult tofill.
7 The Office and Administration Specialist series has four levels: Office and Administration Spe-cialist (the entry level position), Office and Administration Specialist Intermediate, Office and Ad-ministration Specialist Senior, and Office and Administration Specialist Principal (the highest levelposition). As of September 1999, the state employed a total of 4,232 individuals in the Office andAdministration Specialist series.
8 The exam process is discussed in more detail later in this chapter.
9 Parking costs are high in certain areas. Until 1997, state law required state agencies to chargeemployees for parking (see Minn. Laws (1984), ch. 544, sec. 65). According to a 1998 DOER sur-vey of state agencies, boards, councils, and task forces (n=84): 65.5 percent of respondents offeredno parking subsidy, 13.1 percent offered a partial subsidy, and 21.4 percent offered a full subsidy.However, those offering a full subsidy were largely boards and councils. Cross-referencing theDOER survey with those 34 state agencies from our survey: 61.8 percent (21 agencies) offered noparking subsidy, 23.5 percent (8 agencies) offered a partial subsidy, and 5.9 percent (2 agencies) of-fered a full subsidy (3 agencies in our survey did not respond to the DOER survey).
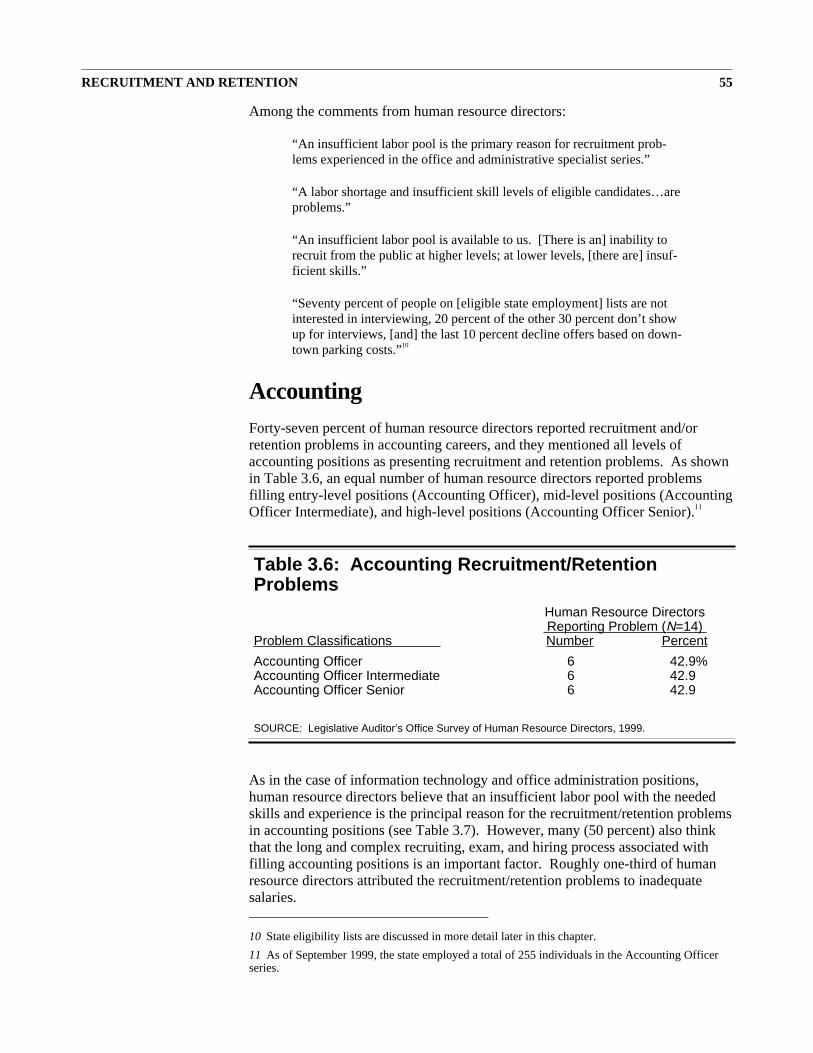
Among the comments from human resource directors:
“An insufficient labor pool is the primary reason for recruitment prob-lems experienced in the office and administrative specialist series.”
“A labor shortage and insufficient skill levels of eligible candidates…areproblems.”
“An insufficient labor pool is available to us. [There is an] inability torecruit from the public at higher levels; at lower levels, [there are] insuf-ficient skills.”
“Seventy percent of people on [eligible state employment] lists are notinterested in interviewing, 20 percent of the other 30 percent don’t showup for interviews, [and] the last 10 percent decline offers based on down-town parking costs.”10
AccountingForty-seven percent of human resource directors reported recruitment and/orretention problems in accounting careers, and they mentioned all levels ofaccounting positions as presenting recruitment and retention problems. As shownin Table 3.6, an equal number of human resource directors reported problemsfilling entry-level positions (Accounting Officer), mid-level positions (AccountingOfficer Intermediate), and high-level positions (Accounting Officer Senior).11
As in the case of information technology and office administration positions,human resource directors believe that an insufficient labor pool with the neededskills and experience is the principal reason for the recruitment/retention problemsin accounting positions (see Table 3.7). However, many (50 percent) also thinkthat the long and complex recruiting, exam, and hiring process associated withfilling accounting positions is an important factor. Roughly one-third of humanresource directors attributed the recruitment/retention problems to inadequatesalaries.
RECRUITMENT AND RETENTION 55
Table 3.6: Accounting Recruitment/RetentionProblems
Human Resource DirectorsReporting Problem (N=14)
Problem Classifications Number Percent
Accounting Officer 6 42.9%Accounting Officer Intermediate 6 42.9Accounting Officer Senior 6 42.9
SOURCE: Legislative Auditor’s Office Survey of Human Resource Directors, 1999.
10 State eligibility lists are discussed in more detail later in this chapter.
11 As of September 1999, the state employed a total of 255 individuals in the Accounting Officerseries.
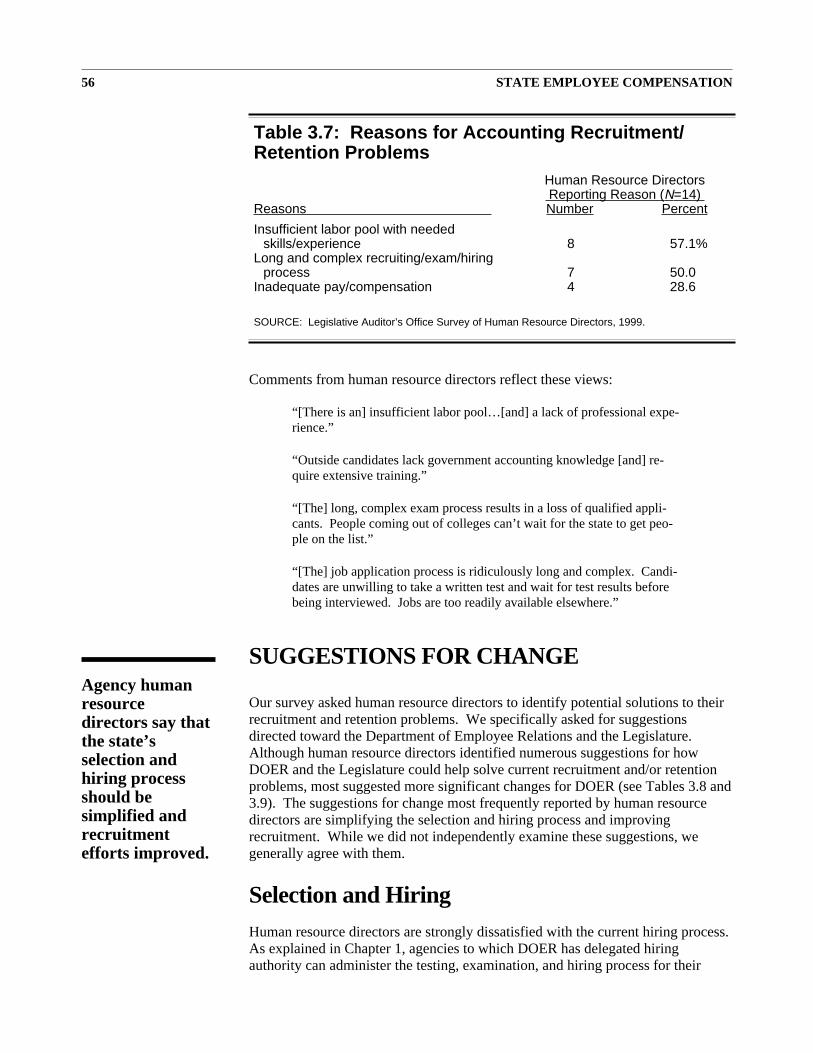
Comments from human resource directors reflect these views:
“[There is an] insufficient labor pool…[and] a lack of professional expe-rience.”
“Outside candidates lack government accounting knowledge [and] re-quire extensive training.”
“[The] long, complex exam process results in a loss of qualified appli-cants. People coming out of colleges can’t wait for the state to get peo-ple on the list.”
“[The] job application process is ridiculously long and complex. Candi-dates are unwilling to take a written test and wait for test results beforebeing interviewed. Jobs are too readily available elsewhere.”
SUGGESTIONS FOR CHANGE
Our survey asked human resource directors to identify potential solutions to theirrecruitment and retention problems. We specifically asked for suggestionsdirected toward the Department of Employee Relations and the Legislature.Although human resource directors identified numerous suggestions for howDOER and the Legislature could help solve current recruitment and/or retentionproblems, most suggested more significant changes for DOER (see Tables 3.8 and3.9). The suggestions for change most frequently reported by human resourcedirectors are simplifying the selection and hiring process and improvingrecruitment. While we did not independently examine these suggestions, wegenerally agree with them.
Selection and HiringHuman resource directors are strongly dissatisfied with the current hiring process.As explained in Chapter 1, agencies to which DOER has delegated hiringauthority can administer the testing, examination, and hiring process for their
56 STATE EMPLOYEE COMPENSATION
Table 3.7: Reasons for Accounting Recruitment/Retention Problems
Human Resource DirectorsReporting Reason (N=14)
Reasons Number Percent
Insufficient labor pool with neededskills/experience 8 57.1%
Long and complex recruiting/exam/hiringprocess 7 50.0
Inadequate pay/compensation 4 28.6
SOURCE: Legislative Auditor’s Office Survey of Human Resource Directors, 1999.
Agency humanresourcedirectors say thatthe state’sselection andhiring processshould besimplified andrecruitmentefforts improved.
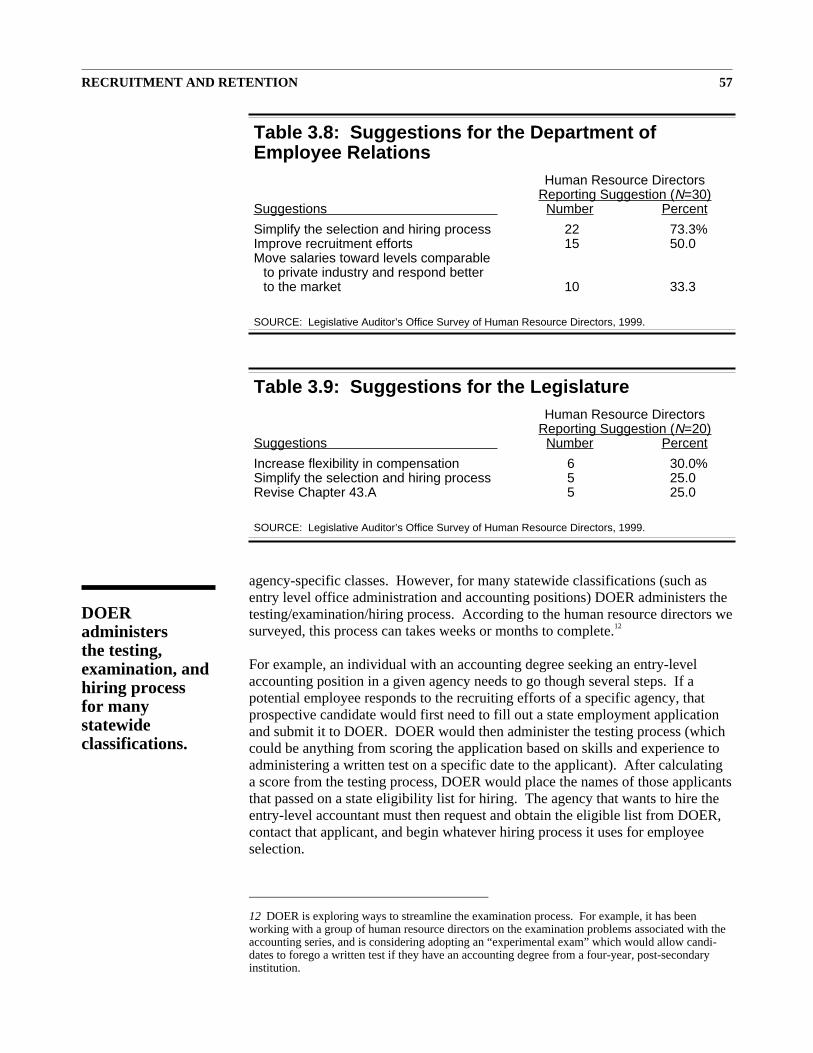
agency-specific classes. However, for many statewide classifications (such asentry level office administration and accounting positions) DOER administers thetesting/examination/hiring process. According to the human resource directors wesurveyed, this process can takes weeks or months to complete.12
For example, an individual with an accounting degree seeking an entry-levelaccounting position in a given agency needs to go though several steps. If apotential employee responds to the recruiting efforts of a specific agency, thatprospective candidate would first need to fill out a state employment applicationand submit it to DOER. DOER would then administer the testing process (whichcould be anything from scoring the application based on skills and experience toadministering a written test on a specific date to the applicant). After calculatinga score from the testing process, DOER would place the names of those applicantsthat passed on a state eligibility list for hiring. The agency that wants to hire theentry-level accountant must then request and obtain the eligible list from DOER,contact that applicant, and begin whatever hiring process it uses for employeeselection.
RECRUITMENT AND RETENTION 57
Table 3.9: Suggestions for the LegislatureHuman Resource Directors
Reporting Suggestion (N=20)Suggestions Number Percent
Increase flexibility in compensation 6 30.0%Simplify the selection and hiring process 5 25.0Revise Chapter 43.A 5 25.0
SOURCE: Legislative Auditor’s Office Survey of Human Resource Directors, 1999.
Table 3.8: Suggestions for the Department ofEmployee Relations
Human Resource DirectorsReporting Suggestion (N=30)
Suggestions Number Percent
Simplify the selection and hiring process 22 73.3%Improve recruitment efforts 15 50.0Move salaries toward levels comparable
to private industry and respond betterto the market 10 33.3
SOURCE: Legislative Auditor’s Office Survey of Human Resource Directors, 1999.
DOERadministersthe testing,examination, andhiring processfor manystatewideclassifications.
12 DOER is exploring ways to streamline the examination process. For example, it has beenworking with a group of human resource directors on the examination problems associated with theaccounting series, and is considering adopting an “experimental exam” which would allow candi-dates to forego a written test if they have an accounting degree from a four-year, post-secondaryinstitution.
Human resource directors also believe that the process used for hiring orpromoting into higher-level positions does not work well in recruiting the mostqualified candidate for the position. DOER has statutory authority to determinewhether to announce higher-level vacancies on a “competitive open” basis(meaning all applicants are welcome) or a “competitive promotional” basis(meaning the position is open only to current civil service employees).13 DOERsays that for most vacancies, it generally defers to whatever the agency requests.However, our survey of human resource directors indicates that especially forhigher-level office administrative positions, the standard practice of usingcompetitive promotional exams results in current state employees being placedinto these positions instead of candidates that might be more qualified or bettersuited for the job had they been competitively recruited.
As shown in Table 3.8:
• State agency human resource directors think that DOER shouldsimplify the selection and hiring process.
Among the more frequently reported suggestions for improving the hiring processwere: (1) streamline the testing, examination, and hiring process (make it quicker,simpler, easier, and more flexible); (2) open tests competitively to the public(especially for AFSCME and MAPE positions, where current state employeeshave preference for hiring) and have the tests open continuously; (3) base hiringon education and past job performance instead of testing; (4) let agencies hire atany point within a salary range without DOER approval; (5) allow “on the spot”hiring at conferences, job fairs, or when highly-skilled candidates becomeavailable; and (6) allow immediate on-site testing and the ability to apply and teston-line.
The following comments from human resource directors reflect their views of thecurrent hiring situation:
“DOER could assist by finding quicker, more effective evaluation de-vices, instead of relying on written exams that have questionable valid-ity…The selection process needs to be streamlined and updated. In thecurrent market, agencies cannot afford to wait three to four months forthe results of a written exam process.”
“The hiring process is lengthy and cumbersome…Agencies often cannotact in a timely manner to recruit and/or retain qualified staff.”
“DOER needs to be proactive in revamping selection and classificationsystems. Currently they do not have enough staff that are skilled or inter-ested in doing this. To the contrary, current staff are rigid and not in tunewith the needs of agencies as they try to fill their job vacancies. Decen-tralization of certain authorities to agencies has helped, however, manyjobs…are statewide classifications where DOER still runs the selectionprocess. There have been attempts over the last few years to re-engineerthis process but DOER has not had enough staff nor have they had theright staff available to sustain these efforts over the long period…So weare still operating cut and paste selection systems which are cumbersome
58 STATE EMPLOYEE COMPENSATION
Somehigher-levelpositions areopen only tocurrent stateemployees.
13 See Minn. Stat. §43A.09, subd. 6 and Minn. Rules, ch. 3900.3100.
to job applicants, take way too long to keep any qualified applicant inter-ested in state employment, and therefore do not produce sufficient num-bers of qualified job applicants. As the labor shortage continues, we arenot making the changes we need to be competitive in the job selectionmarket.”
“The current testing process, which requires applicants to apply for ge-neric jobs, wait for several weeks to be scheduled for an exam, take thewritten test, wait again for several weeks for a test score, have their nameplaced on an eligible list, then wait again for an undetermined period oftime to be contacted for a vacancy, is simply not adequate to meet ourneeds. This situation is only exacerbated given low unemployment and avery tight job market.”
“The process needs to be changed to allow agencies to recruit for specificvacancies, advertise, administer an appropriate and timely selection pro-cess, interview quickly, hire and get employees on the job.”
“[DOER should] simplify the exam process for all job classes that main-tains fairness, follows merit principles, and does not take four months toget a statewide promotion eligible list.”
“[DOER should] open up the exams on a statewide competitive basis andin some cases redesign the exams to meet agencies’ current needs.”
Human resource directors also think the Legislature could assist in simplifying thehiring and selection process. Their suggestions center around revising thelanguage governing specific applicant qualifications:
“The legislation governing examining is quite specific as to how lists ofqualified candidates are established and how many candidates should bereferred to a supervisor. It should be replaced with language that retainsthe need for a process of assessing qualifications but does not define spe-cifically what that entails.”14
“[The Legislature should] eliminate the concept of ranked eligible listsand allow for an open number of applicants for consideration for examprocesses that are not pass/fail.”
“[The Legislature should look at] language that allows for more flexibil-ity in hiring and examinations.”
RecruitmentEmployee recruitment is another area where many human resource directorsexpressed dissatisfaction. Human resource directors believe that recruitment isessential to attracting skilled workers to state employment, and they find DOER’srecruitment efforts lacking. According to our survey:
• State agency human resource directors think that DOER shouldimprove its recruitment efforts.
RECRUITMENT AND RETENTION 59
14 See Minn. Stat. §§43A.10-43A.13.
Suggestions for improving recruitment include: (1) expanding recruitment effortsby advertising in the newspaper and on the internet, attending job fairs, andworking with state colleges and universities and (2) promoting state employmentgenerally to help create a positive image of state employment. Among thecomments from state human resource directors:
“[The Department of Employee Relations should] work more with statecolleges and universities to promote the state as a potential employer[and] emphasize the substantial number of benefits gained in working forthe state; salary is not everything.”
“[DOER needs] more aggressive marketing of the state as an employer.”
“[DOER should] create a more organized effort at getting informationreadily available to prospective applicants at post secondary school,DES, job fairs, etc. that’s comparable to how the private sector makestheir organizations readily known and available to people.”
“[DOER should] provide on-going advertising to recruit more qualifiedapplicants.”
“The Department of Employee Relations can help with our recruitmentissues by…actually promoting the State of Minnesota as an employerthrough ‘real’ recruitment efforts.”
“The Department of Employee Relations could assist in recruitment byretaining a knowledgeable recruitment staff and coordinating efforts forstatewide classes. DOER did have a recruitment team that has now beendisbanded.”
“[DOER needs to] reestablish the recruitment unit that was decimated byturnover.”
Several human resource directors echoed these thoughts in suggestions to theLegislature:
“[The Legislature should provide] sufficient funding for DOER’sStaffing Division to provide recruiting support services and analysis oflong term work force planning needs.”
“[The Legislature needs to] have DOER establish a permanent, full-timerecruitment program that coordinates efforts with state agencies.”
“The whole state process needs to be accomplished faster, more effi-ciently, and with less bureaucracy. The Legislature needs to dictate thisand provide the money to DOER to add people and systems.”
In 1998, DOER’s Staffing Division began a “reengineering” project focused onthree areas of reform -- the hiring assessment process, the job classificationsystem, and the strategic planning process -- for which it received $575,000 infunding in the 1998-99 biennium. While the Staffing Division developed a planwhich required $2.4 million in funding for these three areas, the departmentrequested only $315,000 in its 2000-01 biennial budget proposal, and theLegislature did not approve this funding. The Legislature also cut the agency’s
60 STATE EMPLOYEE COMPENSATION
Agency humanresourcedirectors believethat DOERshould expandits recruitingactivities andpromote stateemployment.
budget by $140,000, a portion of which DOER had allocated to support theagency’s recruiting unit.
DOER has acknowledged a problem exists with its recruitment efforts, andattributes part of the problem to a loss of positions in its Staffing Division.Although the Staffing Division has proposed ambitious plans based on itsreengineering project, nothing has been finalized. The agency is currently in theprocess of reevaluating the results of the reengineering project and redesigning itsrecruitment unit.
SUMMARY
The tight labor market that currently exists nationally and in Minnesota hascreated problems for employers trying to recruit and retain skilled workers. Oursurvey of 34 state agency human resource directors indicates that most stateagencies have experienced employee recruitment and/or retention problems overthe past two years. The largest recruitment and retention problems are ininformation technology, office administration, and accounting careers. Humanresource directors believe the principal reason for their current recruitment andretention problems is an insufficient labor pool with the needed skills orexperience for the position.
To help solve existing recruitment and retention problems, human resourcedirectors believe that the Department of Employee Relations should simplify theselection and hiring process of employees. They also believe that DOER shouldimprove and expand its recruitment efforts of state employment.
As one human resource director notes:
“The growing perception of public service appears to be that governmentis the place you go when you cannot run, or have grown tired of trying torun, the fast track of the private sector. This exacerbates government’srecruitment and retention problems already present in a tight labor mar-ket; we cannot recruit the ‘best and brightest’ young talent since they donot view public sector employment as a stepping stone to greater things,nor can we pay them salaries commensurate with other job opportunities.Further, we have trouble attracting experienced professionals who arewilling to accept salary decreases, but only in exchange for a far-reducedworkload. Unfortunately, public sector employment does not automati-cally equate with reduced workloads, as only those of us working forgovernment well know. Thus, a great portion of the qualified labor poolremains out of our reach.”
RECRUITMENT AND RETENTION 61
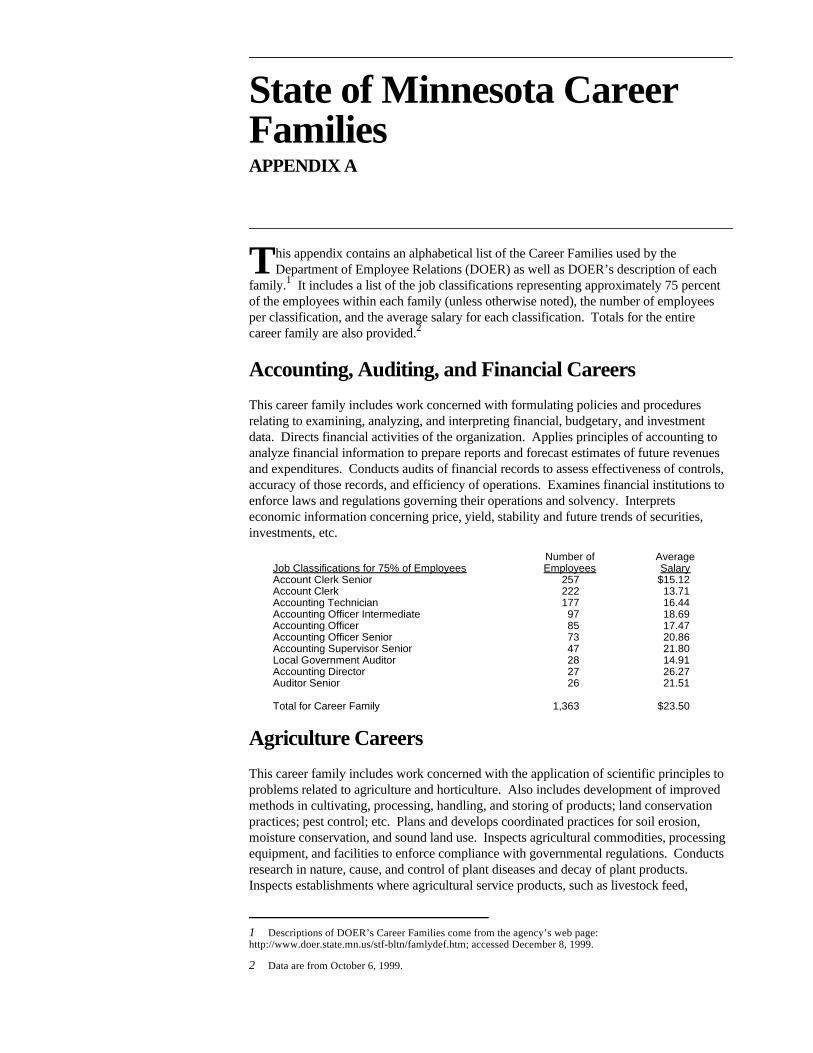
State of Minnesota CareerFamiliesAPPENDIX A
This appendix contains an alphabetical list of the Career Families used by theDepartment of Employee Relations (DOER) as well as DOER’s description of each
family.1 It includes a list of the job classifications representing approximately 75 percentof the employees within each family (unless otherwise noted), the number of employeesper classification, and the average salary for each classification. Totals for the entirecareer family are also provided.2
Accounting, Auditing, and Financial CareersThis career family includes work concerned with formulating policies and proceduresrelating to examining, analyzing, and interpreting financial, budgetary, and investmentdata. Directs financial activities of the organization. Applies principles of accounting toanalyze financial information to prepare reports and forecast estimates of future revenuesand expenditures. Conducts audits of financial records to assess effectiveness of controls,accuracy of those records, and efficiency of operations. Examines financial institutions toenforce laws and regulations governing their operations and solvency. Interpretseconomic information concerning price, yield, stability and future trends of securities,investments, etc.
Number of AverageJob Classifications for 75% of Employees Employees SalaryAccount Clerk Senior 257 $15.12Account Clerk 222 13.71Accounting Technician 177 16.44Accounting Officer Intermediate 97 18.69Accounting Officer 85 17.47Accounting Officer Senior 73 20.86Accounting Supervisor Senior 47 21.80Local Government Auditor 28 14.91Accounting Director 27 26.27Auditor Senior 26 21.51
Total for Career Family 1,363 $23.50
Agriculture CareersThis career family includes work concerned with the application of scientific principles toproblems related to agriculture and horticulture. Also includes development of improvedmethods in cultivating, processing, handling, and storing of products; land conservationpractices; pest control; etc. Plans and develops coordinated practices for soil erosion,moisture conservation, and sound land use. Inspects agricultural commodities, processingequipment, and facilities to enforce compliance with governmental regulations. Conductsresearch in nature, cause, and control of plant diseases and decay of plant products.Inspects establishments where agricultural service products, such as livestock feed,
1 Descriptions of DOER’s Career Families come from the agency’s web page:http://www.doer.state.mn.us/stf-bltn/famlydef.htm; accessed December 8, 1999.
2 Data are from October 6, 1999.
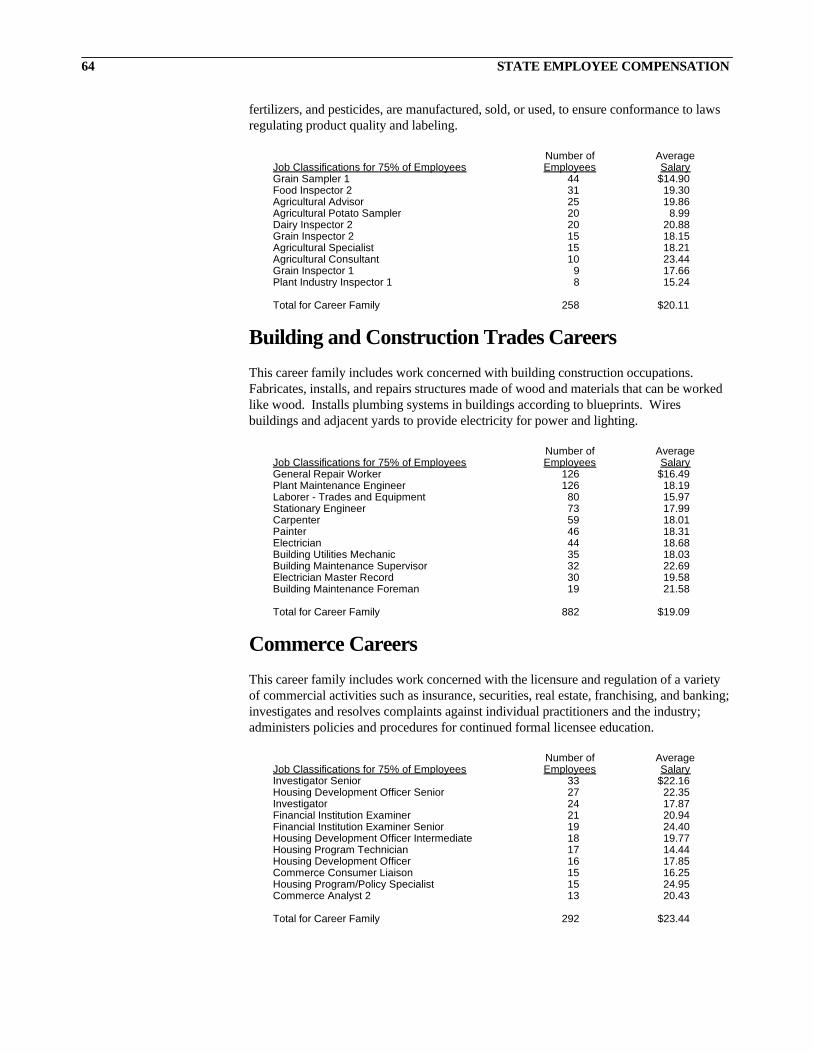
fertilizers, and pesticides, are manufactured, sold, or used, to ensure conformance to lawsregulating product quality and labeling.
Number of AverageJob Classifications for 75% of Employees Employees SalaryGrain Sampler 1 44 $14.90Food Inspector 2 31 19.30Agricultural Advisor 25 19.86Agricultural Potato Sampler 20 8.99Dairy Inspector 2 20 20.88Grain Inspector 2 15 18.15Agricultural Specialist 15 18.21Agricultural Consultant 10 23.44Grain Inspector 1 9 17.66Plant Industry Inspector 1 8 15.24
Total for Career Family 258 $20.11
Building and Construction Trades CareersThis career family includes work concerned with building construction occupations.Fabricates, installs, and repairs structures made of wood and materials that can be workedlike wood. Installs plumbing systems in buildings according to blueprints. Wiresbuildings and adjacent yards to provide electricity for power and lighting.
Number of AverageJob Classifications for 75% of Employees Employees SalaryGeneral Repair Worker 126 $16.49Plant Maintenance Engineer 126 18.19Laborer - Trades and Equipment 80 15.97Stationary Engineer 73 17.99Carpenter 59 18.01Painter 46 18.31Electrician 44 18.68Building Utilities Mechanic 35 18.03Building Maintenance Supervisor 32 22.69Electrician Master Record 30 19.58Building Maintenance Foreman 19 21.58
Total for Career Family 882 $19.09
Commerce CareersThis career family includes work concerned with the licensure and regulation of a varietyof commercial activities such as insurance, securities, real estate, franchising, and banking;investigates and resolves complaints against individual practitioners and the industry;administers policies and procedures for continued formal licensee education.
Number of AverageJob Classifications for 75% of Employees Employees SalaryInvestigator Senior 33 $22.16Housing Development Officer Senior 27 22.35Investigator 24 17.87Financial Institution Examiner 21 20.94Financial Institution Examiner Senior 19 24.40Housing Development Officer Intermediate 18 19.77Housing Program Technician 17 14.44Housing Development Officer 16 17.85Commerce Consumer Liaison 15 16.25Housing Program/Policy Specialist 15 24.95Commerce Analyst 2 13 20.43
Total for Career Family 292 $23.44
64 STATE EMPLOYEE COMPENSATION
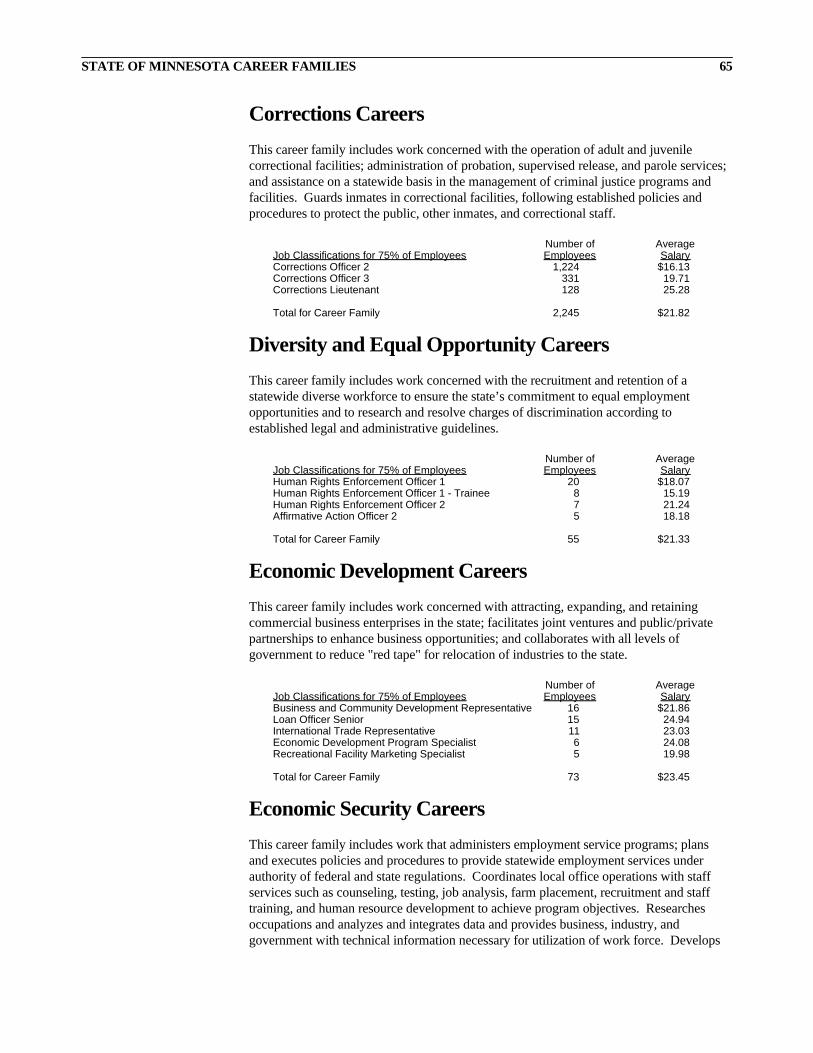
Corrections CareersThis career family includes work concerned with the operation of adult and juvenilecorrectional facilities; administration of probation, supervised release, and parole services;and assistance on a statewide basis in the management of criminal justice programs andfacilities. Guards inmates in correctional facilities, following established policies andprocedures to protect the public, other inmates, and correctional staff.
Number of AverageJob Classifications for 75% of Employees Employees SalaryCorrections Officer 2 1,224 $16.13Corrections Officer 3 331 19.71Corrections Lieutenant 128 25.28
Total for Career Family 2,245 $21.82
Diversity and Equal Opportunity CareersThis career family includes work concerned with the recruitment and retention of astatewide diverse workforce to ensure the state’s commitment to equal employmentopportunities and to research and resolve charges of discrimination according toestablished legal and administrative guidelines.
Number of AverageJob Classifications for 75% of Employees Employees SalaryHuman Rights Enforcement Officer 1 20 $18.07Human Rights Enforcement Officer 1 - Trainee 8 15.19Human Rights Enforcement Officer 2 7 21.24Affirmative Action Officer 2 5 18.18
Total for Career Family 55 $21.33
Economic Development CareersThis career family includes work concerned with attracting, expanding, and retainingcommercial business enterprises in the state; facilitates joint ventures and public/privatepartnerships to enhance business opportunities; and collaborates with all levels ofgovernment to reduce "red tape" for relocation of industries to the state.
Number of AverageJob Classifications for 75% of Employees Employees SalaryBusiness and Community Development Representative 16 $21.86Loan Officer Senior 15 24.94International Trade Representative 11 23.03Economic Development Program Specialist 6 24.08Recreational Facility Marketing Specialist 5 19.98
Total for Career Family 73 $23.45
Economic Security CareersThis career family includes work that administers employment service programs; plansand executes policies and procedures to provide statewide employment services underauthority of federal and state regulations. Coordinates local office operations with staffservices such as counseling, testing, job analysis, farm placement, recruitment and stafftraining, and human resource development to achieve program objectives. Researchesoccupations and analyzes and integrates data and provides business, industry, andgovernment with technical information necessary for utilization of work force. Develops
STATE OF MINNESOTA CAREER FAMILIES 65
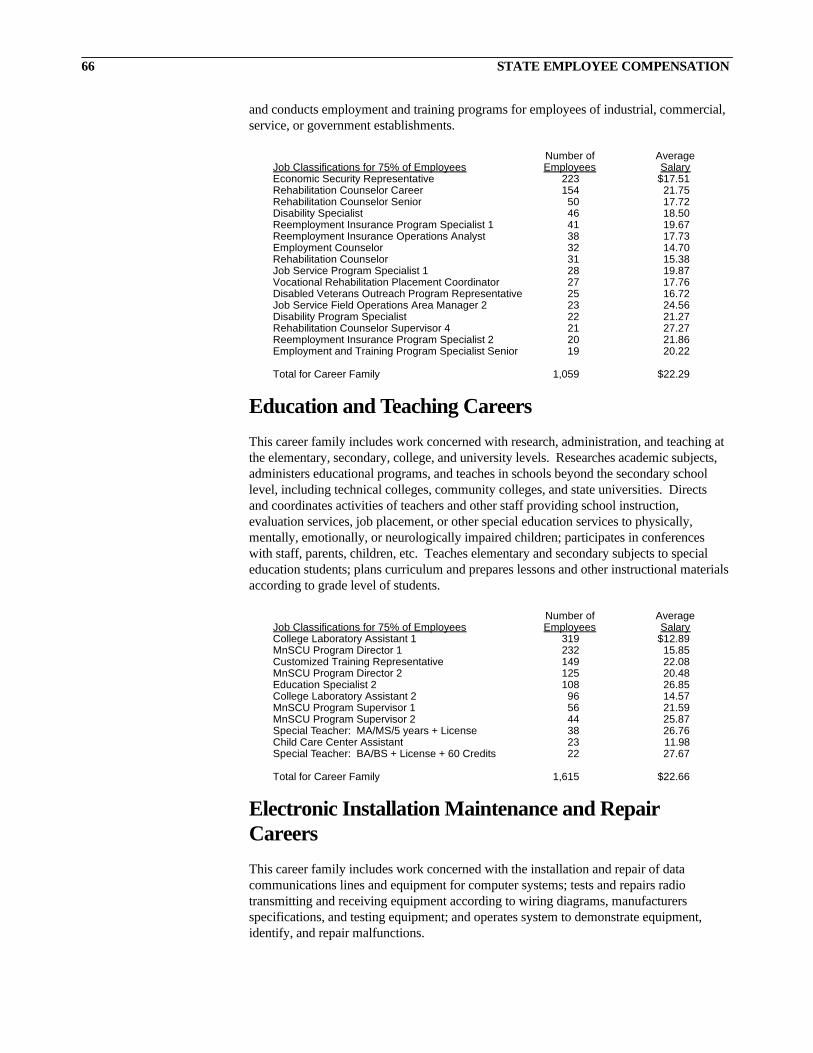
and conducts employment and training programs for employees of industrial, commercial,service, or government establishments.
Number of AverageJob Classifications for 75% of Employees Employees SalaryEconomic Security Representative 223 $17.51Rehabilitation Counselor Career 154 21.75Rehabilitation Counselor Senior 50 17.72Disability Specialist 46 18.50Reemployment Insurance Program Specialist 1 41 19.67Reemployment Insurance Operations Analyst 38 17.73Employment Counselor 32 14.70Rehabilitation Counselor 31 15.38Job Service Program Specialist 1 28 19.87Vocational Rehabilitation Placement Coordinator 27 17.76Disabled Veterans Outreach Program Representative 25 16.72Job Service Field Operations Area Manager 2 23 24.56Disability Program Specialist 22 21.27Rehabilitation Counselor Supervisor 4 21 27.27Reemployment Insurance Program Specialist 2 20 21.86Employment and Training Program Specialist Senior 19 20.22
Total for Career Family 1,059 $22.29
Education and Teaching CareersThis career family includes work concerned with research, administration, and teaching atthe elementary, secondary, college, and university levels. Researches academic subjects,administers educational programs, and teaches in schools beyond the secondary schoollevel, including technical colleges, community colleges, and state universities. Directsand coordinates activities of teachers and other staff providing school instruction,evaluation services, job placement, or other special education services to physically,mentally, emotionally, or neurologically impaired children; participates in conferenceswith staff, parents, children, etc. Teaches elementary and secondary subjects to specialeducation students; plans curriculum and prepares lessons and other instructional materialsaccording to grade level of students.
Number of AverageJob Classifications for 75% of Employees Employees SalaryCollege Laboratory Assistant 1 319 $12.89MnSCU Program Director 1 232 15.85Customized Training Representative 149 22.08MnSCU Program Director 2 125 20.48Education Specialist 2 108 26.85College Laboratory Assistant 2 96 14.57MnSCU Program Supervisor 1 56 21.59MnSCU Program Supervisor 2 44 25.87Special Teacher: MA/MS/5 years + License 38 26.76Child Care Center Assistant 23 11.98Special Teacher: BA/BS + License + 60 Credits 22 27.67
Total for Career Family 1,615 $22.66
Electronic Installation Maintenance and RepairCareersThis career family includes work concerned with the installation and repair of datacommunications lines and equipment for computer systems; tests and repairs radiotransmitting and receiving equipment according to wiring diagrams, manufacturersspecifications, and testing equipment; and operates system to demonstrate equipment,identify, and repair malfunctions.
66 STATE EMPLOYEE COMPENSATION
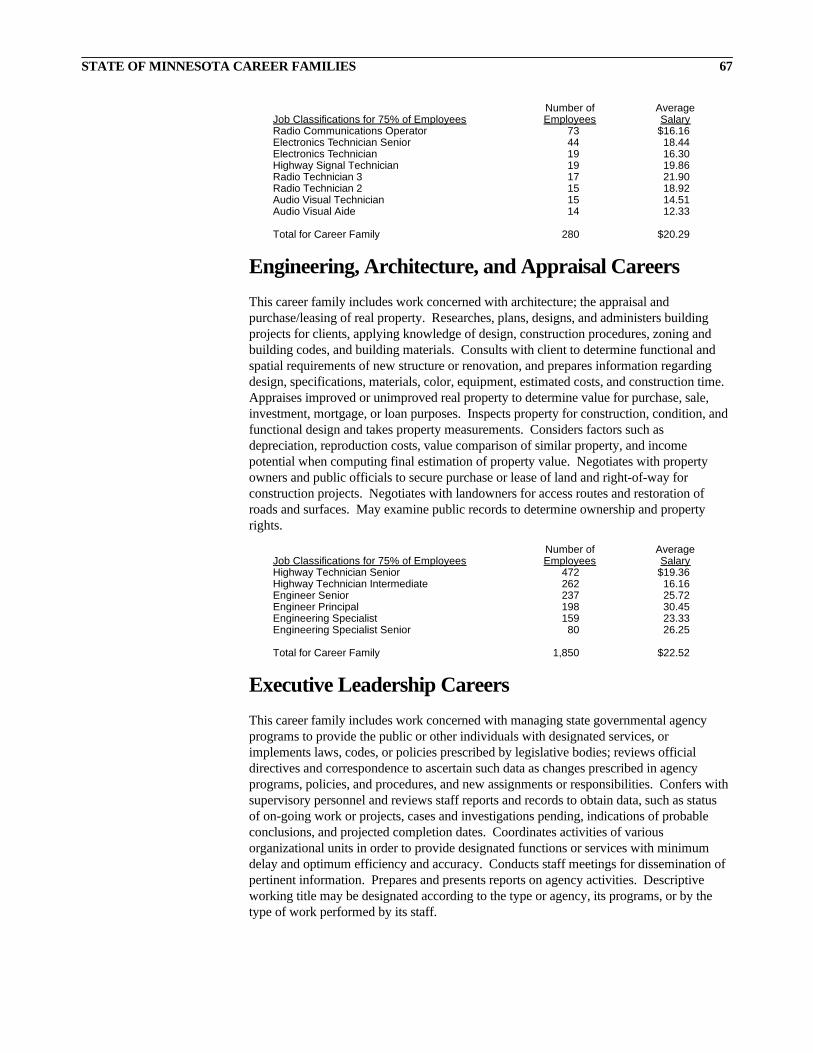
Number of AverageJob Classifications for 75% of Employees Employees SalaryRadio Communications Operator 73 $16.16Electronics Technician Senior 44 18.44Electronics Technician 19 16.30Highway Signal Technician 19 19.86Radio Technician 3 17 21.90Radio Technician 2 15 18.92Audio Visual Technician 15 14.51Audio Visual Aide 14 12.33
Total for Career Family 280 $20.29
Engineering, Architecture, and Appraisal CareersThis career family includes work concerned with architecture; the appraisal andpurchase/leasing of real property. Researches, plans, designs, and administers buildingprojects for clients, applying knowledge of design, construction procedures, zoning andbuilding codes, and building materials. Consults with client to determine functional andspatial requirements of new structure or renovation, and prepares information regardingdesign, specifications, materials, color, equipment, estimated costs, and construction time.Appraises improved or unimproved real property to determine value for purchase, sale,investment, mortgage, or loan purposes. Inspects property for construction, condition, andfunctional design and takes property measurements. Considers factors such asdepreciation, reproduction costs, value comparison of similar property, and incomepotential when computing final estimation of property value. Negotiates with propertyowners and public officials to secure purchase or lease of land and right-of-way forconstruction projects. Negotiates with landowners for access routes and restoration ofroads and surfaces. May examine public records to determine ownership and propertyrights.
Number of AverageJob Classifications for 75% of Employees Employees SalaryHighway Technician Senior 472 $19.36Highway Technician Intermediate 262 16.16Engineer Senior 237 25.72Engineer Principal 198 30.45Engineering Specialist 159 23.33Engineering Specialist Senior 80 26.25
Total for Career Family 1,850 $22.52
Executive Leadership CareersThis career family includes work concerned with managing state governmental agencyprograms to provide the public or other individuals with designated services, orimplements laws, codes, or policies prescribed by legislative bodies; reviews officialdirectives and correspondence to ascertain such data as changes prescribed in agencyprograms, policies, and procedures, and new assignments or responsibilities. Confers withsupervisory personnel and reviews staff reports and records to obtain data, such as statusof on-going work or projects, cases and investigations pending, indications of probableconclusions, and projected completion dates. Coordinates activities of variousorganizational units in order to provide designated functions or services with minimumdelay and optimum efficiency and accuracy. Conducts staff meetings for dissemination ofpertinent information. Prepares and presents reports on agency activities. Descriptiveworking title may be designated according to the type or agency, its programs, or by thetype of work performed by its staff.
STATE OF MINNESOTA CAREER FAMILIES 67
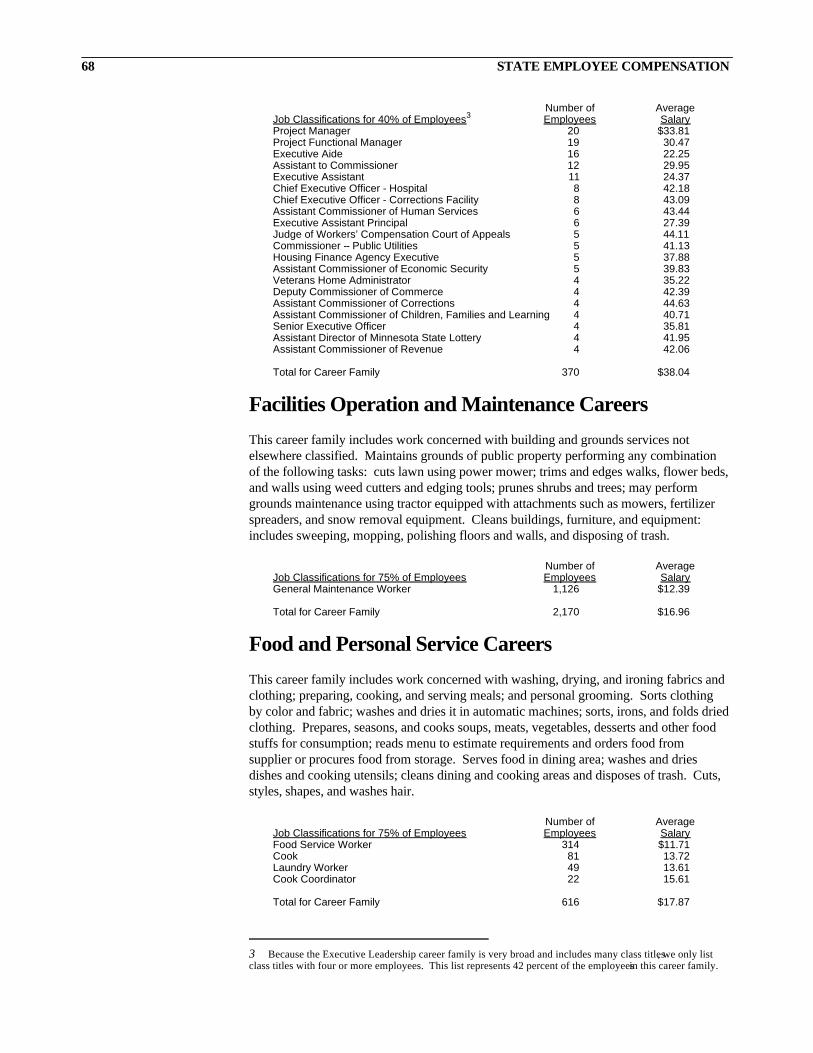
Number of AverageJob Classifications for 40% of Employees3 Employees SalaryProject Manager 20 $33.81Project Functional Manager 19 30.47Executive Aide 16 22.25Assistant to Commissioner 12 29.95Executive Assistant 11 24.37Chief Executive Officer - Hospital 8 42.18Chief Executive Officer - Corrections Facility 8 43.09Assistant Commissioner of Human Services 6 43.44Executive Assistant Principal 6 27.39Judge of Workers’ Compensation Court of Appeals 5 44.11Commissioner -- Public Utilities 5 41.13Housing Finance Agency Executive 5 37.88Assistant Commissioner of Economic Security 5 39.83Veterans Home Administrator 4 35.22Deputy Commissioner of Commerce 4 42.39Assistant Commissioner of Corrections 4 44.63Assistant Commissioner of Children, Families and Learning 4 40.71Senior Executive Officer 4 35.81Assistant Director of Minnesota State Lottery 4 41.95Assistant Commissioner of Revenue 4 42.06
Total for Career Family 370 $38.04
Facilities Operation and Maintenance CareersThis career family includes work concerned with building and grounds services notelsewhere classified. Maintains grounds of public property performing any combinationof the following tasks: cuts lawn using power mower; trims and edges walks, flower beds,and walls using weed cutters and edging tools; prunes shrubs and trees; may performgrounds maintenance using tractor equipped with attachments such as mowers, fertilizerspreaders, and snow removal equipment. Cleans buildings, furniture, and equipment:includes sweeping, mopping, polishing floors and walls, and disposing of trash.
Number of AverageJob Classifications for 75% of Employees Employees SalaryGeneral Maintenance Worker 1,126 $12.39
Total for Career Family 2,170 $16.96
Food and Personal Service CareersThis career family includes work concerned with washing, drying, and ironing fabrics andclothing; preparing, cooking, and serving meals; and personal grooming. Sorts clothingby color and fabric; washes and dries it in automatic machines; sorts, irons, and folds driedclothing. Prepares, seasons, and cooks soups, meats, vegetables, desserts and other foodstuffs for consumption; reads menu to estimate requirements and orders food fromsupplier or procures food from storage. Serves food in dining area; washes and driesdishes and cooking utensils; cleans dining and cooking areas and disposes of trash. Cuts,styles, shapes, and washes hair.
Number of AverageJob Classifications for 75% of Employees Employees SalaryFood Service Worker 314 $11.71Cook 81 13.72Laundry Worker 49 13.61Cook Coordinator 22 15.61
Total for Career Family 616 $17.87
68 STATE EMPLOYEE COMPENSATION
3 Because the Executive Leadership career family is very broad and includes many class titles, we only listclass titles with four or more employees. This list represents 42 percent of the employees in this career family.
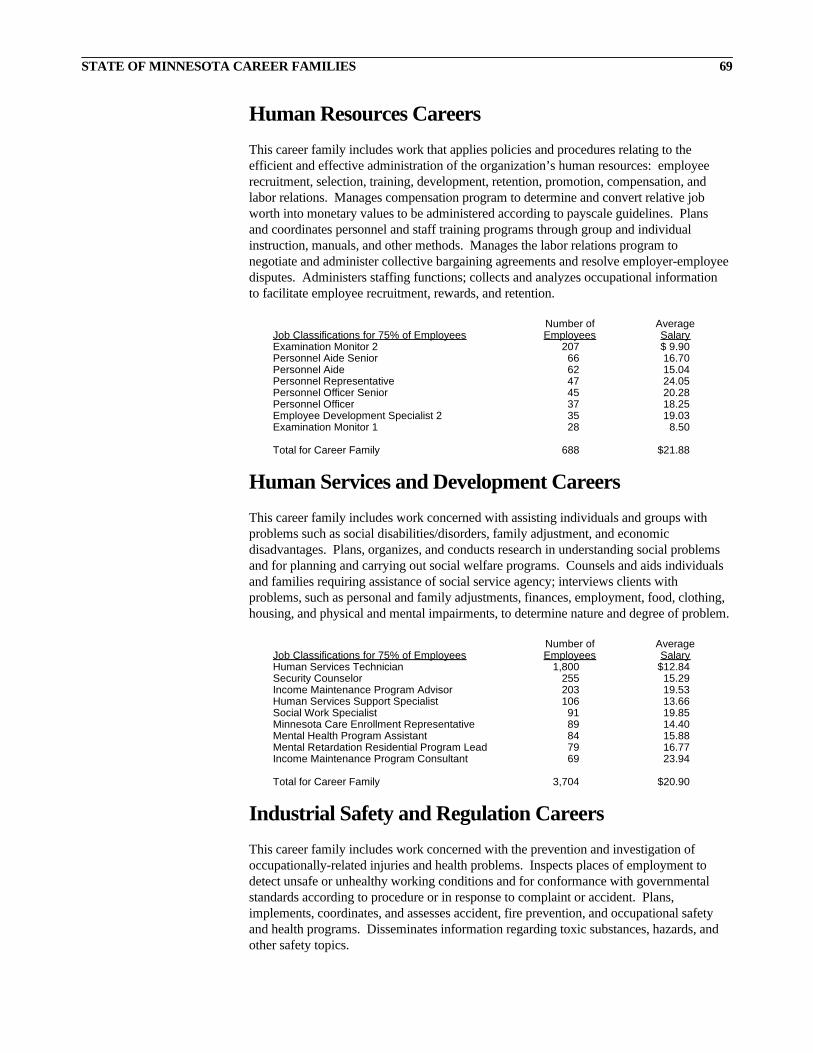
Human Resources CareersThis career family includes work that applies policies and procedures relating to theefficient and effective administration of the organization’s human resources: employeerecruitment, selection, training, development, retention, promotion, compensation, andlabor relations. Manages compensation program to determine and convert relative jobworth into monetary values to be administered according to payscale guidelines. Plansand coordinates personnel and staff training programs through group and individualinstruction, manuals, and other methods. Manages the labor relations program tonegotiate and administer collective bargaining agreements and resolve employer-employeedisputes. Administers staffing functions; collects and analyzes occupational informationto facilitate employee recruitment, rewards, and retention.
Number of AverageJob Classifications for 75% of Employees Employees SalaryExamination Monitor 2 207 $ 9.90Personnel Aide Senior 66 16.70Personnel Aide 62 15.04Personnel Representative 47 24.05Personnel Officer Senior 45 20.28Personnel Officer 37 18.25Employee Development Specialist 2 35 19.03Examination Monitor 1 28 8.50
Total for Career Family 688 $21.88
Human Services and Development CareersThis career family includes work concerned with assisting individuals and groups withproblems such as social disabilities/disorders, family adjustment, and economicdisadvantages. Plans, organizes, and conducts research in understanding social problemsand for planning and carrying out social welfare programs. Counsels and aids individualsand families requiring assistance of social service agency; interviews clients withproblems, such as personal and family adjustments, finances, employment, food, clothing,housing, and physical and mental impairments, to determine nature and degree of problem.
Number of AverageJob Classifications for 75% of Employees Employees SalaryHuman Services Technician 1,800 $12.84Security Counselor 255 15.29Income Maintenance Program Advisor 203 19.53Human Services Support Specialist 106 13.66Social Work Specialist 91 19.85Minnesota Care Enrollment Representative 89 14.40Mental Health Program Assistant 84 15.88Mental Retardation Residential Program Lead 79 16.77Income Maintenance Program Consultant 69 23.94
Total for Career Family 3,704 $20.90
Industrial Safety and Regulation CareersThis career family includes work concerned with the prevention and investigation ofoccupationally-related injuries and health problems. Inspects places of employment todetect unsafe or unhealthy working conditions and for conformance with governmentalstandards according to procedure or in response to complaint or accident. Plans,implements, coordinates, and assesses accident, fire prevention, and occupational safetyand health programs. Disseminates information regarding toxic substances, hazards, andother safety topics.
STATE OF MINNESOTA CAREER FAMILIES 69
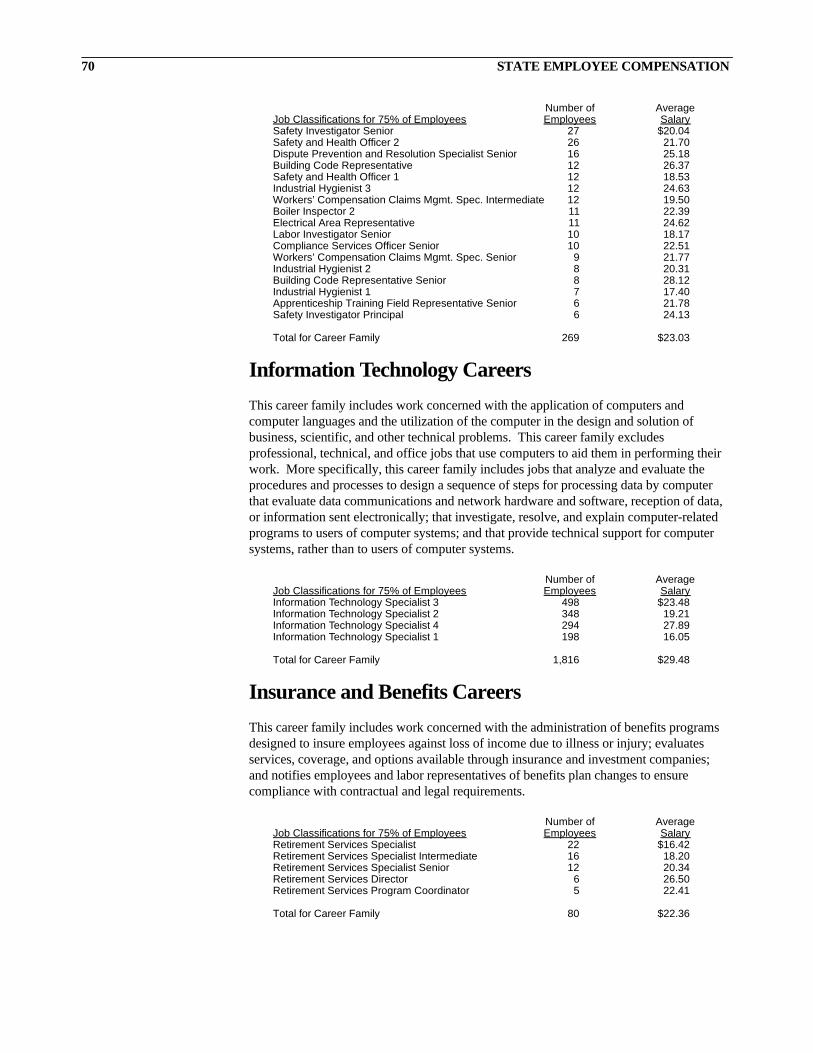
Number of AverageJob Classifications for 75% of Employees Employees SalarySafety Investigator Senior 27 $20.04Safety and Health Officer 2 26 21.70Dispute Prevention and Resolution Specialist Senior 16 25.18Building Code Representative 12 26.37Safety and Health Officer 1 12 18.53Industrial Hygienist 3 12 24.63Workers’ Compensation Claims Mgmt. Spec. Intermediate 12 19.50Boiler Inspector 2 11 22.39Electrical Area Representative 11 24.62Labor Investigator Senior 10 18.17Compliance Services Officer Senior 10 22.51Workers’ Compensation Claims Mgmt. Spec. Senior 9 21.77Industrial Hygienist 2 8 20.31Building Code Representative Senior 8 28.12Industrial Hygienist 1 7 17.40Apprenticeship Training Field Representative Senior 6 21.78Safety Investigator Principal 6 24.13
Total for Career Family 269 $23.03
Information Technology CareersThis career family includes work concerned with the application of computers andcomputer languages and the utilization of the computer in the design and solution ofbusiness, scientific, and other technical problems. This career family excludesprofessional, technical, and office jobs that use computers to aid them in performing theirwork. More specifically, this career family includes jobs that analyze and evaluate theprocedures and processes to design a sequence of steps for processing data by computerthat evaluate data communications and network hardware and software, reception of data,or information sent electronically; that investigate, resolve, and explain computer-relatedprograms to users of computer systems; and that provide technical support for computersystems, rather than to users of computer systems.
Number of AverageJob Classifications for 75% of Employees Employees SalaryInformation Technology Specialist 3 498 $23.48Information Technology Specialist 2 348 19.21Information Technology Specialist 4 294 27.89Information Technology Specialist 1 198 16.05
Total for Career Family 1,816 $29.48
Insurance and Benefits CareersThis career family includes work concerned with the administration of benefits programsdesigned to insure employees against loss of income due to illness or injury; evaluatesservices, coverage, and options available through insurance and investment companies;and notifies employees and labor representatives of benefits plan changes to ensurecompliance with contractual and legal requirements.
Number of AverageJob Classifications for 75% of Employees Employees SalaryRetirement Services Specialist 22 $16.42Retirement Services Specialist Intermediate 16 18.20Retirement Services Specialist Senior 12 20.34Retirement Services Director 6 26.50Retirement Services Program Coordinator 5 22.41
Total for Career Family 80 $22.36
70 STATE EMPLOYEE COMPENSATION
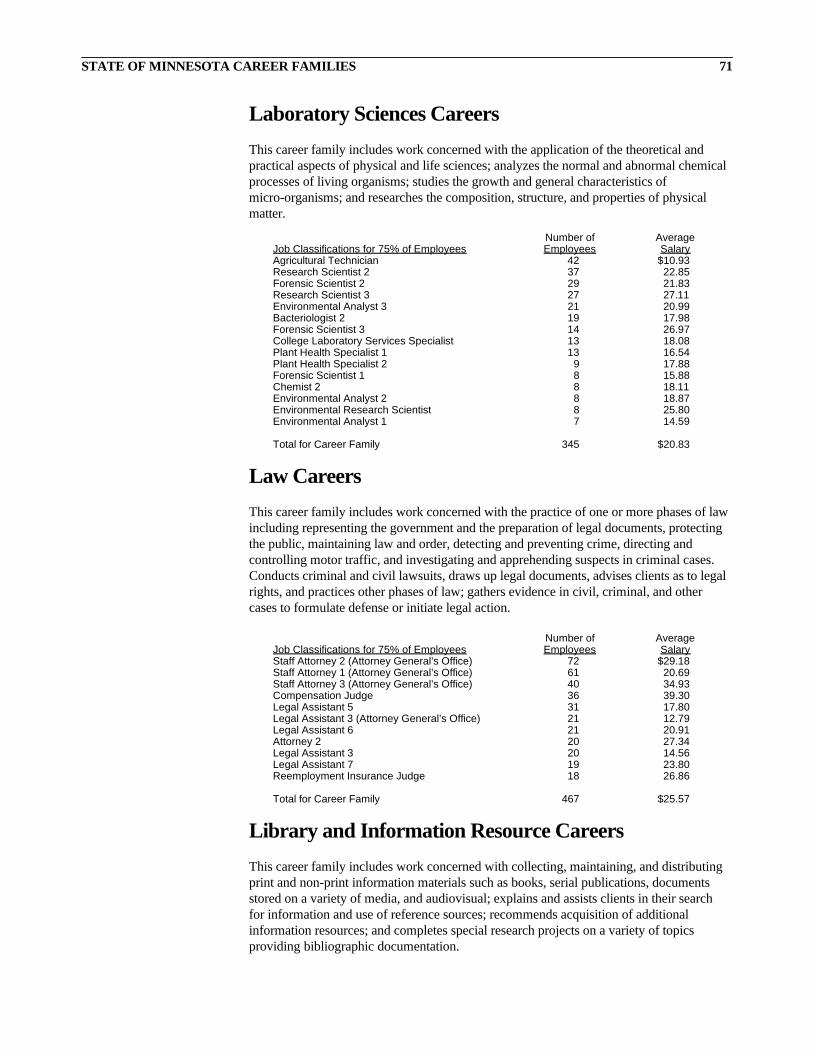
Laboratory Sciences CareersThis career family includes work concerned with the application of the theoretical andpractical aspects of physical and life sciences; analyzes the normal and abnormal chemicalprocesses of living organisms; studies the growth and general characteristics ofmicro-organisms; and researches the composition, structure, and properties of physicalmatter.
Number of AverageJob Classifications for 75% of Employees Employees SalaryAgricultural Technician 42 $10.93Research Scientist 2 37 22.85Forensic Scientist 2 29 21.83Research Scientist 3 27 27.11Environmental Analyst 3 21 20.99Bacteriologist 2 19 17.98Forensic Scientist 3 14 26.97College Laboratory Services Specialist 13 18.08Plant Health Specialist 1 13 16.54Plant Health Specialist 2 9 17.88Forensic Scientist 1 8 15.88Chemist 2 8 18.11Environmental Analyst 2 8 18.87Environmental Research Scientist 8 25.80Environmental Analyst 1 7 14.59
Total for Career Family 345 $20.83
Law CareersThis career family includes work concerned with the practice of one or more phases of lawincluding representing the government and the preparation of legal documents, protectingthe public, maintaining law and order, detecting and preventing crime, directing andcontrolling motor traffic, and investigating and apprehending suspects in criminal cases.Conducts criminal and civil lawsuits, draws up legal documents, advises clients as to legalrights, and practices other phases of law; gathers evidence in civil, criminal, and othercases to formulate defense or initiate legal action.
Number of AverageJob Classifications for 75% of Employees Employees SalaryStaff Attorney 2 (Attorney General’s Office) 72 $29.18Staff Attorney 1 (Attorney General’s Office) 61 20.69Staff Attorney 3 (Attorney General’s Office) 40 34.93Compensation Judge 36 39.30Legal Assistant 5 31 17.80Legal Assistant 3 (Attorney General’s Office) 21 12.79Legal Assistant 6 21 20.91Attorney 2 20 27.34Legal Assistant 3 20 14.56Legal Assistant 7 19 23.80Reemployment Insurance Judge 18 26.86
Total for Career Family 467 $25.57
Library and Information Resource CareersThis career family includes work concerned with collecting, maintaining, and distributingprint and non-print information materials such as books, serial publications, documentsstored on a variety of media, and audiovisual; explains and assists clients in their searchfor information and use of reference sources; recommends acquisition of additionalinformation resources; and completes special research projects on a variety of topicsproviding bibliographic documentation.
STATE OF MINNESOTA CAREER FAMILIES 71
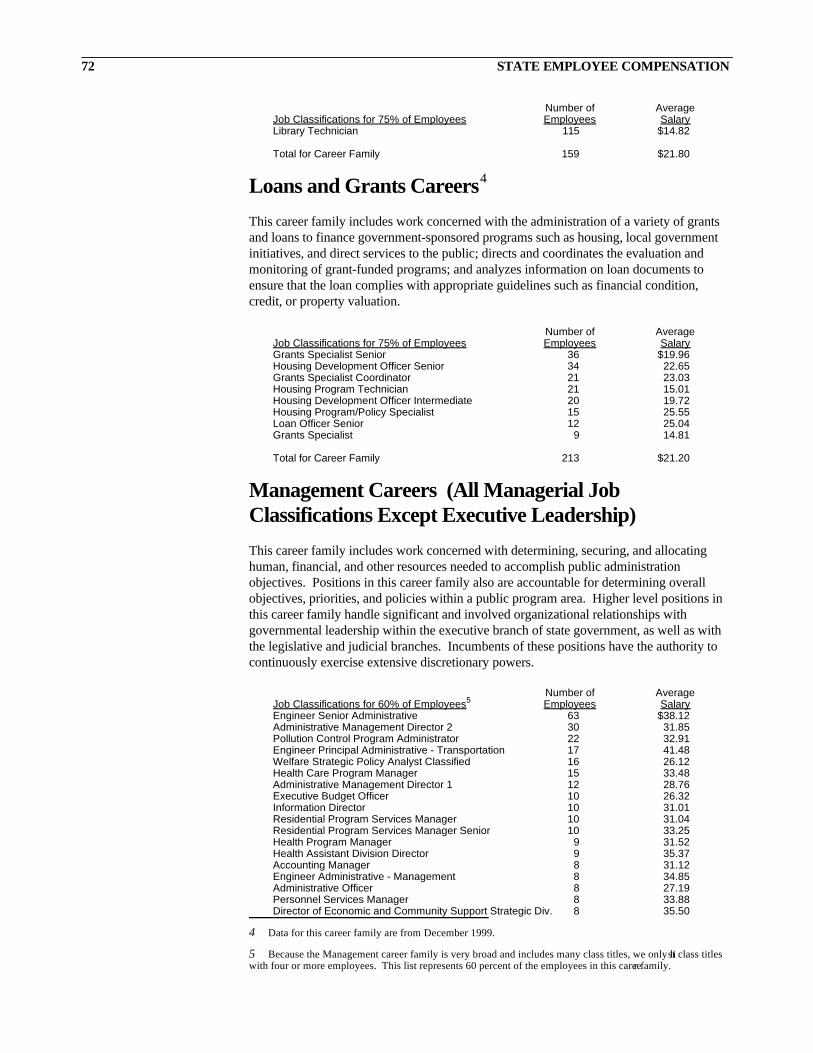
Number of AverageJob Classifications for 75% of Employees Employees SalaryLibrary Technician 115 $14.82
Total for Career Family 159 $21.80
Loans and Grants Careers4
This career family includes work concerned with the administration of a variety of grantsand loans to finance government-sponsored programs such as housing, local governmentinitiatives, and direct services to the public; directs and coordinates the evaluation andmonitoring of grant-funded programs; and analyzes information on loan documents toensure that the loan complies with appropriate guidelines such as financial condition,credit, or property valuation.
Number of AverageJob Classifications for 75% of Employees Employees SalaryGrants Specialist Senior 36 $19.96Housing Development Officer Senior 34 22.65Grants Specialist Coordinator 21 23.03Housing Program Technician 21 15.01Housing Development Officer Intermediate 20 19.72Housing Program/Policy Specialist 15 25.55Loan Officer Senior 12 25.04Grants Specialist 9 14.81
Total for Career Family 213 $21.20
Management Careers (All Managerial JobClassifications Except Executive Leadership)This career family includes work concerned with determining, securing, and allocatinghuman, financial, and other resources needed to accomplish public administrationobjectives. Positions in this career family also are accountable for determining overallobjectives, priorities, and policies within a public program area. Higher level positions inthis career family handle significant and involved organizational relationships withgovernmental leadership within the executive branch of state government, as well as withthe legislative and judicial branches. Incumbents of these positions have the authority tocontinuously exercise extensive discretionary powers.
Number of AverageJob Classifications for 60% of Employees5 Employees SalaryEngineer Senior Administrative 63 $38.12Administrative Management Director 2 30 31.85Pollution Control Program Administrator 22 32.91Engineer Principal Administrative - Transportation 17 41.48Welfare Strategic Policy Analyst Classified 16 26.12Health Care Program Manager 15 33.48Administrative Management Director 1 12 28.76Executive Budget Officer 10 26.32Information Director 10 31.01Residential Program Services Manager 10 31.04Residential Program Services Manager Senior 10 33.25Health Program Manager 9 31.52Health Assistant Division Director 9 35.37Accounting Manager 8 31.12Engineer Administrative - Management 8 34.85Administrative Officer 8 27.19Personnel Services Manager 8 33.88Director of Economic and Community Support Strategic Div. 8 35.50
72 STATE EMPLOYEE COMPENSATION
4 Data for this career family are from December 1999.
5 Because the Management career family is very broad and includes many class titles, we only list class titleswith four or more employees. This list represents 60 percent of the employees in this career family.
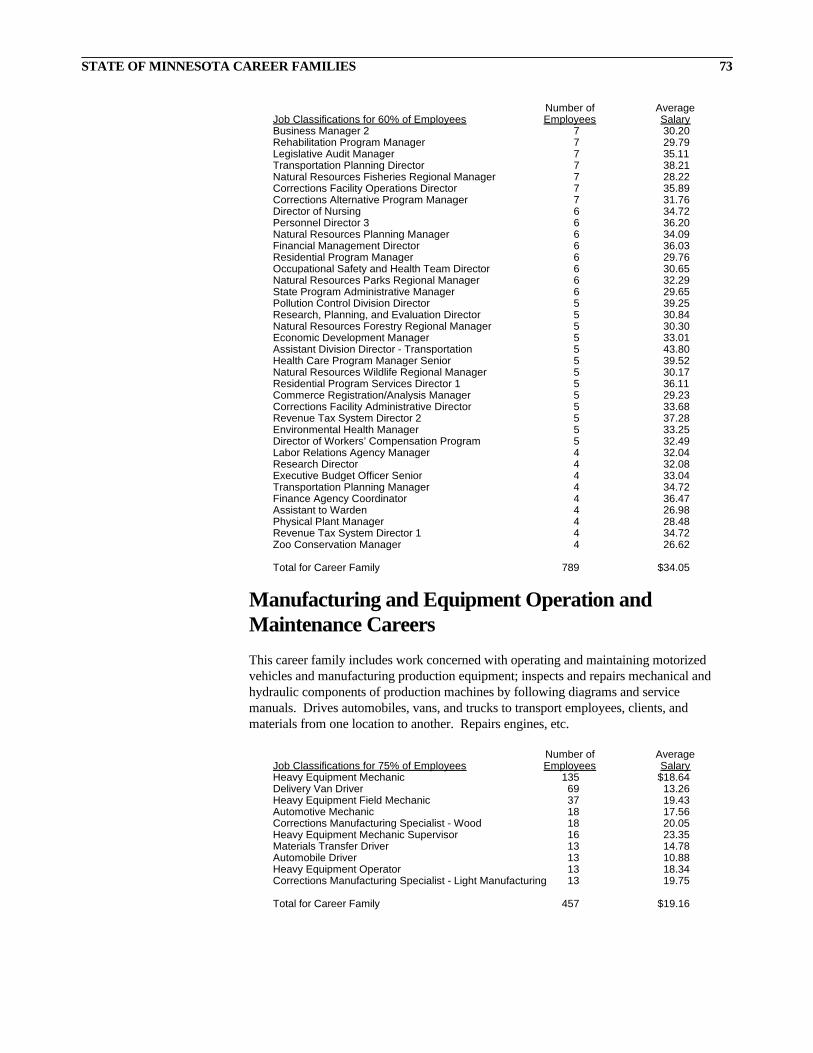
Number of AverageJob Classifications for 60% of Employees Employees SalaryBusiness Manager 2 7 30.20Rehabilitation Program Manager 7 29.79Legislative Audit Manager 7 35.11Transportation Planning Director 7 38.21Natural Resources Fisheries Regional Manager 7 28.22Corrections Facility Operations Director 7 35.89Corrections Alternative Program Manager 7 31.76Director of Nursing 6 34.72Personnel Director 3 6 36.20Natural Resources Planning Manager 6 34.09Financial Management Director 6 36.03Residential Program Manager 6 29.76Occupational Safety and Health Team Director 6 30.65Natural Resources Parks Regional Manager 6 32.29State Program Administrative Manager 6 29.65Pollution Control Division Director 5 39.25Research, Planning, and Evaluation Director 5 30.84Natural Resources Forestry Regional Manager 5 30.30Economic Development Manager 5 33.01Assistant Division Director - Transportation 5 43.80Health Care Program Manager Senior 5 39.52Natural Resources Wildlife Regional Manager 5 30.17Residential Program Services Director 1 5 36.11Commerce Registration/Analysis Manager 5 29.23Corrections Facility Administrative Director 5 33.68Revenue Tax System Director 2 5 37.28Environmental Health Manager 5 33.25Director of Workers’ Compensation Program 5 32.49Labor Relations Agency Manager 4 32.04Research Director 4 32.08Executive Budget Officer Senior 4 33.04Transportation Planning Manager 4 34.72Finance Agency Coordinator 4 36.47Assistant to Warden 4 26.98Physical Plant Manager 4 28.48Revenue Tax System Director 1 4 34.72Zoo Conservation Manager 4 26.62
Total for Career Family 789 $34.05
Manufacturing and Equipment Operation andMaintenance CareersThis career family includes work concerned with operating and maintaining motorizedvehicles and manufacturing production equipment; inspects and repairs mechanical andhydraulic components of production machines by following diagrams and servicemanuals. Drives automobiles, vans, and trucks to transport employees, clients, andmaterials from one location to another. Repairs engines, etc.
Number of AverageJob Classifications for 75% of Employees Employees SalaryHeavy Equipment Mechanic 135 $18.64Delivery Van Driver 69 13.26Heavy Equipment Field Mechanic 37 19.43Automotive Mechanic 18 17.56Corrections Manufacturing Specialist - Wood 18 20.05Heavy Equipment Mechanic Supervisor 16 23.35Materials Transfer Driver 13 14.78Automobile Driver 13 10.88Heavy Equipment Operator 13 18.34Corrections Manufacturing Specialist - Light Manufacturing 13 19.75
Total for Career Family 457 $19.16
STATE OF MINNESOTA CAREER FAMILIES 73
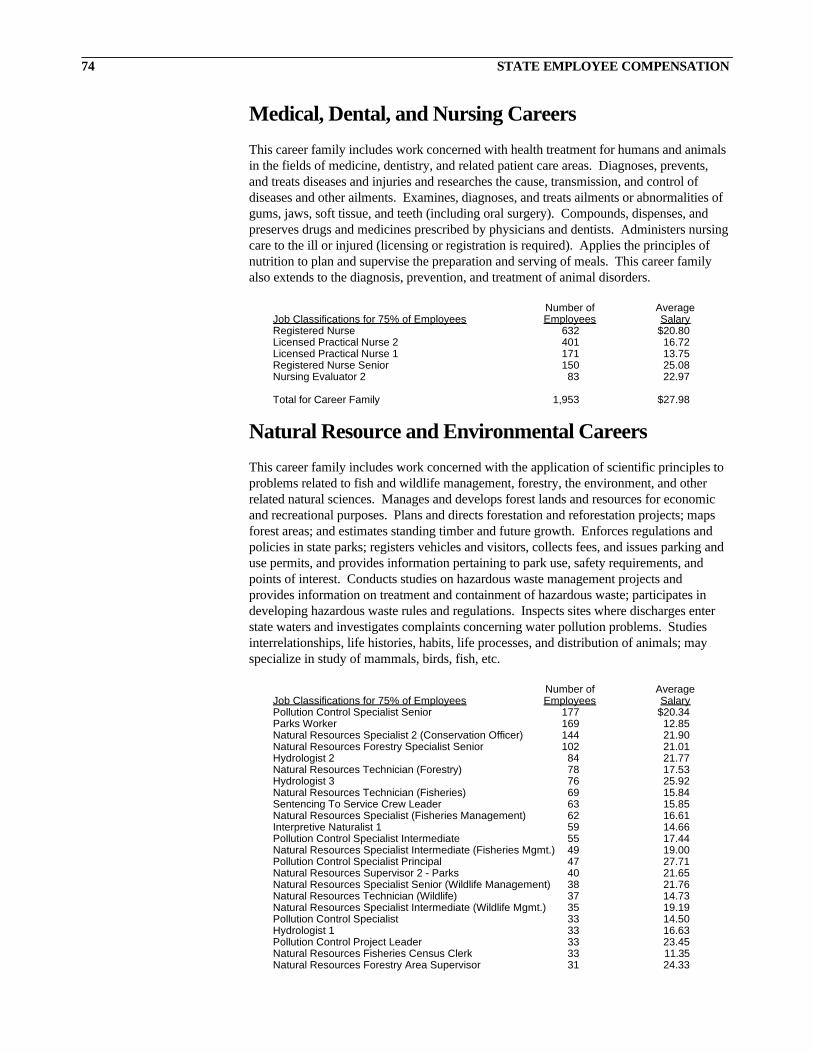
Medical, Dental, and Nursing CareersThis career family includes work concerned with health treatment for humans and animalsin the fields of medicine, dentistry, and related patient care areas. Diagnoses, prevents,and treats diseases and injuries and researches the cause, transmission, and control ofdiseases and other ailments. Examines, diagnoses, and treats ailments or abnormalities ofgums, jaws, soft tissue, and teeth (including oral surgery). Compounds, dispenses, andpreserves drugs and medicines prescribed by physicians and dentists. Administers nursingcare to the ill or injured (licensing or registration is required). Applies the principles ofnutrition to plan and supervise the preparation and serving of meals. This career familyalso extends to the diagnosis, prevention, and treatment of animal disorders.
Number of AverageJob Classifications for 75% of Employees Employees SalaryRegistered Nurse 632 $20.80Licensed Practical Nurse 2 401 16.72Licensed Practical Nurse 1 171 13.75Registered Nurse Senior 150 25.08Nursing Evaluator 2 83 22.97
Total for Career Family 1,953 $27.98
Natural Resource and Environmental CareersThis career family includes work concerned with the application of scientific principles toproblems related to fish and wildlife management, forestry, the environment, and otherrelated natural sciences. Manages and develops forest lands and resources for economicand recreational purposes. Plans and directs forestation and reforestation projects; mapsforest areas; and estimates standing timber and future growth. Enforces regulations andpolicies in state parks; registers vehicles and visitors, collects fees, and issues parking anduse permits, and provides information pertaining to park use, safety requirements, andpoints of interest. Conducts studies on hazardous waste management projects andprovides information on treatment and containment of hazardous waste; participates indeveloping hazardous waste rules and regulations. Inspects sites where discharges enterstate waters and investigates complaints concerning water pollution problems. Studiesinterrelationships, life histories, habits, life processes, and distribution of animals; mayspecialize in study of mammals, birds, fish, etc.
Number of AverageJob Classifications for 75% of Employees Employees SalaryPollution Control Specialist Senior 177 $20.34Parks Worker 169 12.85Natural Resources Specialist 2 (Conservation Officer) 144 21.90Natural Resources Forestry Specialist Senior 102 21.01Hydrologist 2 84 21.77Natural Resources Technician (Forestry) 78 17.53Hydrologist 3 76 25.92Natural Resources Technician (Fisheries) 69 15.84Sentencing To Service Crew Leader 63 15.85Natural Resources Specialist (Fisheries Management) 62 16.61Interpretive Naturalist 1 59 14.66Pollution Control Specialist Intermediate 55 17.44Natural Resources Specialist Intermediate (Fisheries Mgmt.) 49 19.00Pollution Control Specialist Principal 47 27.71Natural Resources Supervisor 2 - Parks 40 21.65Natural Resources Specialist Senior (Wildlife Management) 38 21.76Natural Resources Technician (Wildlife) 37 14.73Natural Resources Specialist Intermediate (Wildlife Mgmt.) 35 19.19Pollution Control Specialist 33 14.50Hydrologist 1 33 16.63Pollution Control Project Leader 33 23.45Natural Resources Fisheries Census Clerk 33 11.35Natural Resources Forestry Area Supervisor 31 24.33
74 STATE EMPLOYEE COMPENSATION
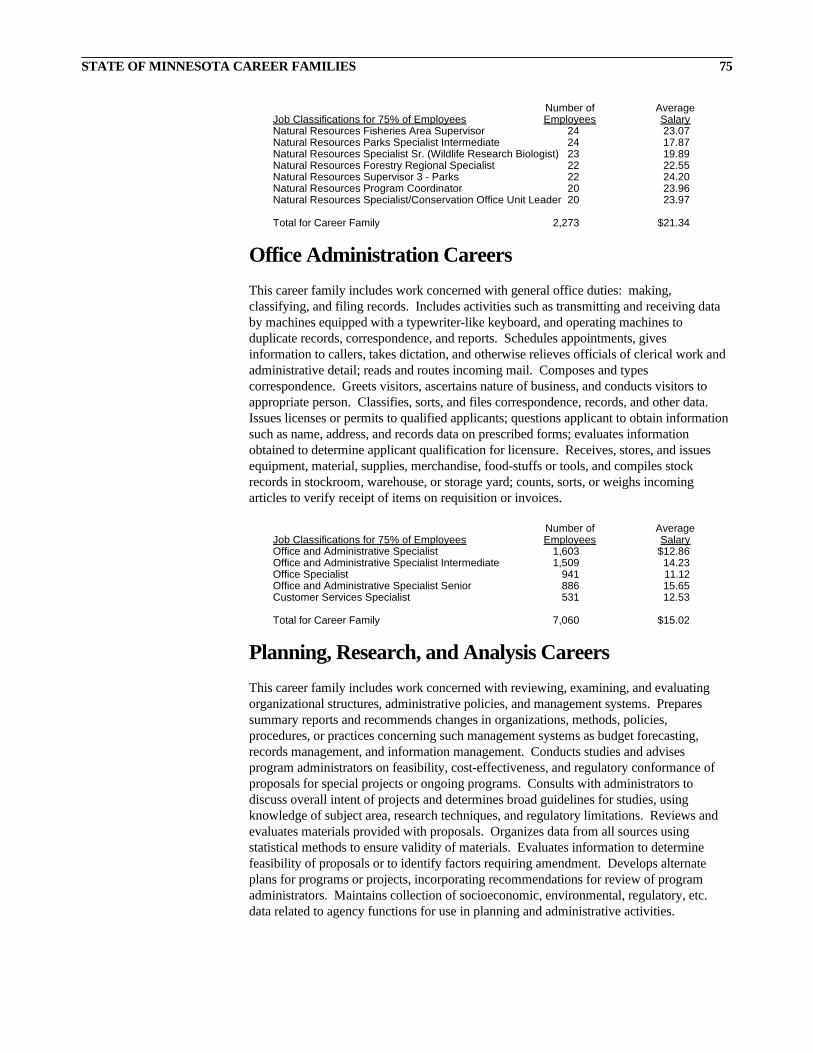
Number of AverageJob Classifications for 75% of Employees Employees SalaryNatural Resources Fisheries Area Supervisor 24 23.07Natural Resources Parks Specialist Intermediate 24 17.87Natural Resources Specialist Sr. (Wildlife Research Biologist) 23 19.89Natural Resources Forestry Regional Specialist 22 22.55Natural Resources Supervisor 3 - Parks 22 24.20Natural Resources Program Coordinator 20 23.96Natural Resources Specialist/Conservation Office Unit Leader 20 23.97
Total for Career Family 2,273 $21.34
Office Administration CareersThis career family includes work concerned with general office duties: making,classifying, and filing records. Includes activities such as transmitting and receiving databy machines equipped with a typewriter-like keyboard, and operating machines toduplicate records, correspondence, and reports. Schedules appointments, givesinformation to callers, takes dictation, and otherwise relieves officials of clerical work andadministrative detail; reads and routes incoming mail. Composes and typescorrespondence. Greets visitors, ascertains nature of business, and conducts visitors toappropriate person. Classifies, sorts, and files correspondence, records, and other data.Issues licenses or permits to qualified applicants; questions applicant to obtain informationsuch as name, address, and records data on prescribed forms; evaluates informationobtained to determine applicant qualification for licensure. Receives, stores, and issuesequipment, material, supplies, merchandise, food-stuffs or tools, and compiles stockrecords in stockroom, warehouse, or storage yard; counts, sorts, or weighs incomingarticles to verify receipt of items on requisition or invoices.
Number of AverageJob Classifications for 75% of Employees Employees SalaryOffice and Administrative Specialist 1,603 $12.86Office and Administrative Specialist Intermediate 1,509 14.23Office Specialist 941 11.12Office and Administrative Specialist Senior 886 15.65Customer Services Specialist 531 12.53
Total for Career Family 7,060 $15.02
Planning, Research, and Analysis CareersThis career family includes work concerned with reviewing, examining, and evaluatingorganizational structures, administrative policies, and management systems. Preparessummary reports and recommends changes in organizations, methods, policies,procedures, or practices concerning such management systems as budget forecasting,records management, and information management. Conducts studies and advisesprogram administrators on feasibility, cost-effectiveness, and regulatory conformance ofproposals for special projects or ongoing programs. Consults with administrators todiscuss overall intent of projects and determines broad guidelines for studies, usingknowledge of subject area, research techniques, and regulatory limitations. Reviews andevaluates materials provided with proposals. Organizes data from all sources usingstatistical methods to ensure validity of materials. Evaluates information to determinefeasibility of proposals or to identify factors requiring amendment. Develops alternateplans for programs or projects, incorporating recommendations for review of programadministrators. Maintains collection of socioeconomic, environmental, regulatory, etc.data related to agency functions for use in planning and administrative activities.
STATE OF MINNESOTA CAREER FAMILIES 75
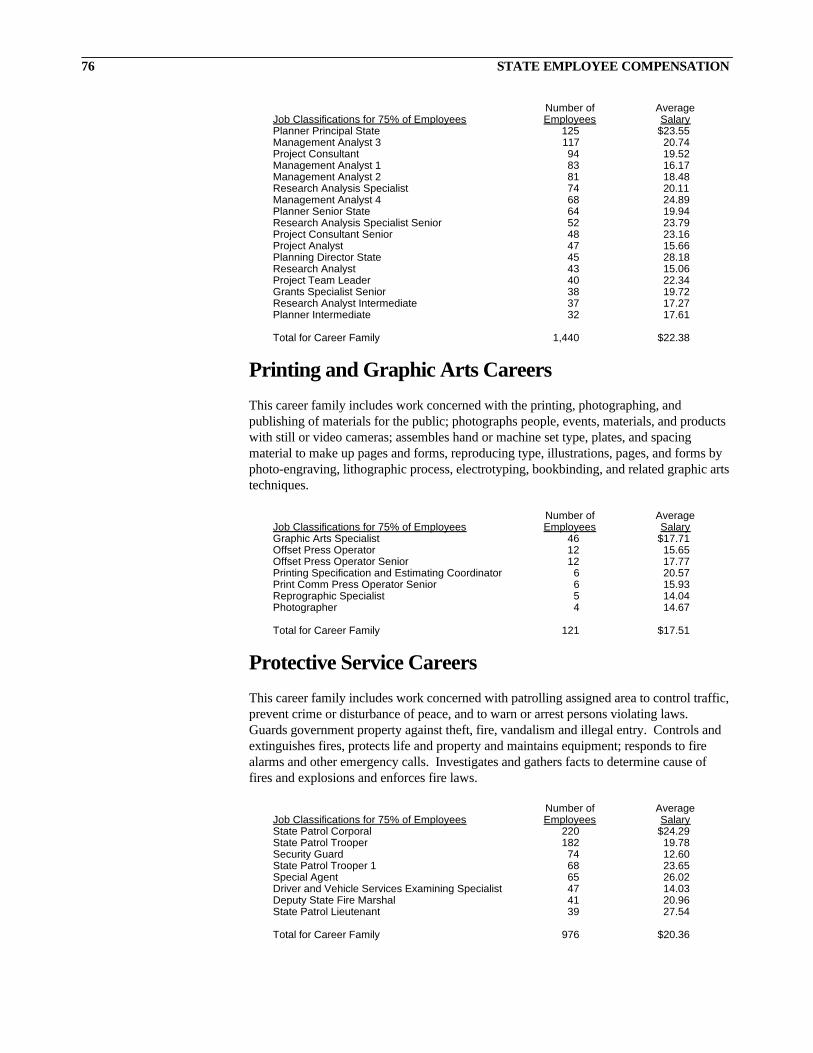
Number of AverageJob Classifications for 75% of Employees Employees SalaryPlanner Principal State 125 $23.55Management Analyst 3 117 20.74Project Consultant 94 19.52Management Analyst 1 83 16.17Management Analyst 2 81 18.48Research Analysis Specialist 74 20.11Management Analyst 4 68 24.89Planner Senior State 64 19.94Research Analysis Specialist Senior 52 23.79Project Consultant Senior 48 23.16Project Analyst 47 15.66Planning Director State 45 28.18Research Analyst 43 15.06Project Team Leader 40 22.34Grants Specialist Senior 38 19.72Research Analyst Intermediate 37 17.27Planner Intermediate 32 17.61
Total for Career Family 1,440 $22.38
Printing and Graphic Arts CareersThis career family includes work concerned with the printing, photographing, andpublishing of materials for the public; photographs people, events, materials, and productswith still or video cameras; assembles hand or machine set type, plates, and spacingmaterial to make up pages and forms, reproducing type, illustrations, pages, and forms byphoto-engraving, lithographic process, electrotyping, bookbinding, and related graphic artstechniques.
Number of AverageJob Classifications for 75% of Employees Employees SalaryGraphic Arts Specialist 46 $17.71Offset Press Operator 12 15.65Offset Press Operator Senior 12 17.77Printing Specification and Estimating Coordinator 6 20.57Print Comm Press Operator Senior 6 15.93Reprographic Specialist 5 14.04Photographer 4 14.67
Total for Career Family 121 $17.51
Protective Service CareersThis career family includes work concerned with patrolling assigned area to control traffic,prevent crime or disturbance of peace, and to warn or arrest persons violating laws.Guards government property against theft, fire, vandalism and illegal entry. Controls andextinguishes fires, protects life and property and maintains equipment; responds to firealarms and other emergency calls. Investigates and gathers facts to determine cause offires and explosions and enforces fire laws.
Number of AverageJob Classifications for 75% of Employees Employees SalaryState Patrol Corporal 220 $24.29State Patrol Trooper 182 19.78Security Guard 74 12.60State Patrol Trooper 1 68 23.65Special Agent 65 26.02Driver and Vehicle Services Examining Specialist 47 14.03Deputy State Fire Marshal 41 20.96State Patrol Lieutenant 39 27.54
Total for Career Family 976 $20.36
76 STATE EMPLOYEE COMPENSATION
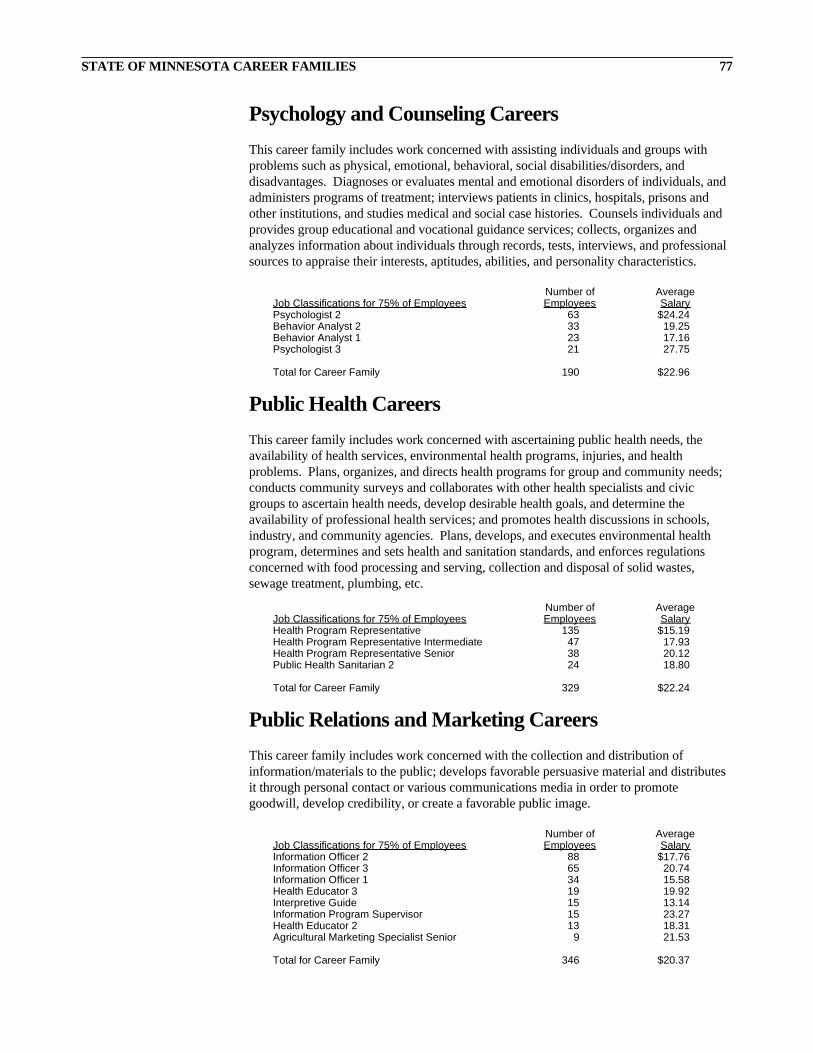
Psychology and Counseling CareersThis career family includes work concerned with assisting individuals and groups withproblems such as physical, emotional, behavioral, social disabilities/disorders, anddisadvantages. Diagnoses or evaluates mental and emotional disorders of individuals, andadministers programs of treatment; interviews patients in clinics, hospitals, prisons andother institutions, and studies medical and social case histories. Counsels individuals andprovides group educational and vocational guidance services; collects, organizes andanalyzes information about individuals through records, tests, interviews, and professionalsources to appraise their interests, aptitudes, abilities, and personality characteristics.
Number of AverageJob Classifications for 75% of Employees Employees SalaryPsychologist 2 63 $24.24Behavior Analyst 2 33 19.25Behavior Analyst 1 23 17.16Psychologist 3 21 27.75
Total for Career Family 190 $22.96
Public Health CareersThis career family includes work concerned with ascertaining public health needs, theavailability of health services, environmental health programs, injuries, and healthproblems. Plans, organizes, and directs health programs for group and community needs;conducts community surveys and collaborates with other health specialists and civicgroups to ascertain health needs, develop desirable health goals, and determine theavailability of professional health services; and promotes health discussions in schools,industry, and community agencies. Plans, develops, and executes environmental healthprogram, determines and sets health and sanitation standards, and enforces regulationsconcerned with food processing and serving, collection and disposal of solid wastes,sewage treatment, plumbing, etc.
Number of AverageJob Classifications for 75% of Employees Employees SalaryHealth Program Representative 135 $15.19Health Program Representative Intermediate 47 17.93Health Program Representative Senior 38 20.12Public Health Sanitarian 2 24 18.80
Total for Career Family 329 $22.24
Public Relations and Marketing CareersThis career family includes work concerned with the collection and distribution ofinformation/materials to the public; develops favorable persuasive material and distributesit through personal contact or various communications media in order to promotegoodwill, develop credibility, or create a favorable public image.
Number of AverageJob Classifications for 75% of Employees Employees SalaryInformation Officer 2 88 $17.76Information Officer 3 65 20.74Information Officer 1 34 15.58Health Educator 3 19 19.92Interpretive Guide 15 13.14Information Program Supervisor 15 23.27Health Educator 2 13 18.31Agricultural Marketing Specialist Senior 9 21.53
Total for Career Family 346 $20.37
STATE OF MINNESOTA CAREER FAMILIES 77
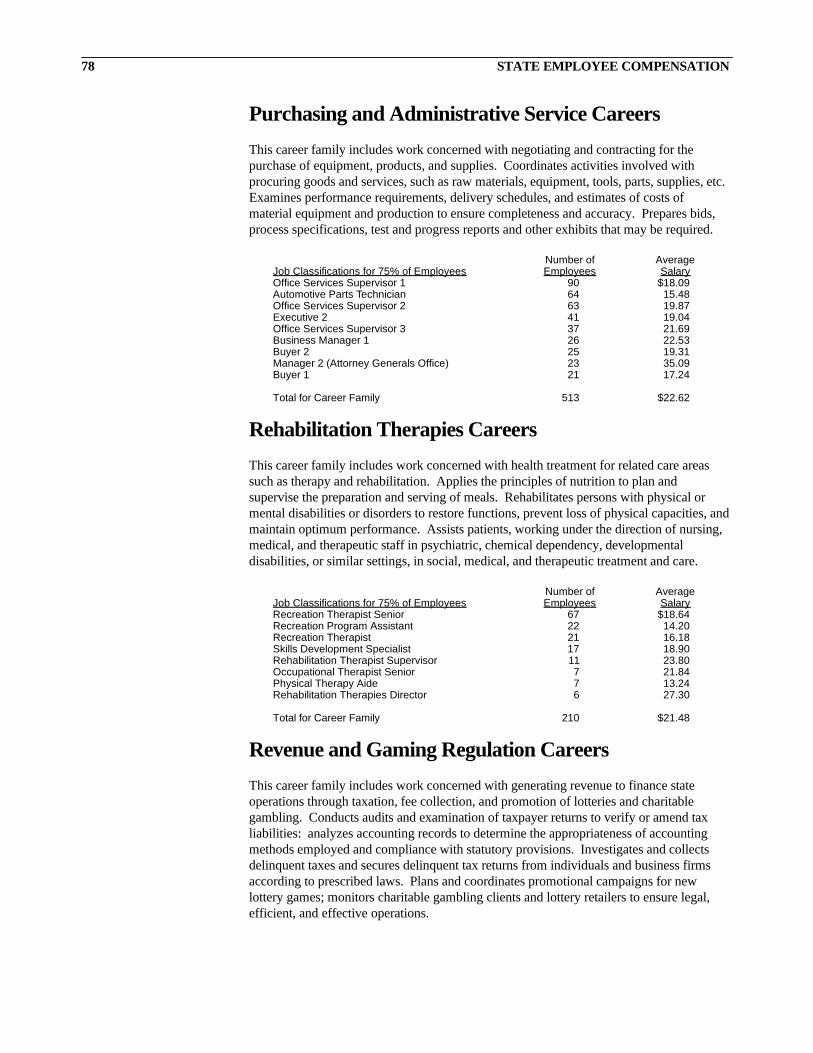
Purchasing and Administrative Service CareersThis career family includes work concerned with negotiating and contracting for thepurchase of equipment, products, and supplies. Coordinates activities involved withprocuring goods and services, such as raw materials, equipment, tools, parts, supplies, etc.Examines performance requirements, delivery schedules, and estimates of costs ofmaterial equipment and production to ensure completeness and accuracy. Prepares bids,process specifications, test and progress reports and other exhibits that may be required.
Number of AverageJob Classifications for 75% of Employees Employees SalaryOffice Services Supervisor 1 90 $18.09Automotive Parts Technician 64 15.48Office Services Supervisor 2 63 19.87Executive 2 41 19.04Office Services Supervisor 3 37 21.69Business Manager 1 26 22.53Buyer 2 25 19.31Manager 2 (Attorney Generals Office) 23 35.09Buyer 1 21 17.24
Total for Career Family 513 $22.62
Rehabilitation Therapies CareersThis career family includes work concerned with health treatment for related care areassuch as therapy and rehabilitation. Applies the principles of nutrition to plan andsupervise the preparation and serving of meals. Rehabilitates persons with physical ormental disabilities or disorders to restore functions, prevent loss of physical capacities, andmaintain optimum performance. Assists patients, working under the direction of nursing,medical, and therapeutic staff in psychiatric, chemical dependency, developmentaldisabilities, or similar settings, in social, medical, and therapeutic treatment and care.
Number of AverageJob Classifications for 75% of Employees Employees SalaryRecreation Therapist Senior 67 $18.64Recreation Program Assistant 22 14.20Recreation Therapist 21 16.18Skills Development Specialist 17 18.90Rehabilitation Therapist Supervisor 11 23.80Occupational Therapist Senior 7 21.84Physical Therapy Aide 7 13.24Rehabilitation Therapies Director 6 27.30
Total for Career Family 210 $21.48
Revenue and Gaming Regulation CareersThis career family includes work concerned with generating revenue to finance stateoperations through taxation, fee collection, and promotion of lotteries and charitablegambling. Conducts audits and examination of taxpayer returns to verify or amend taxliabilities: analyzes accounting records to determine the appropriateness of accountingmethods employed and compliance with statutory provisions. Investigates and collectsdelinquent taxes and secures delinquent tax returns from individuals and business firmsaccording to prescribed laws. Plans and coordinates promotional campaigns for newlottery games; monitors charitable gambling clients and lottery retailers to ensure legal,efficient, and effective operations.
78 STATE EMPLOYEE COMPENSATION
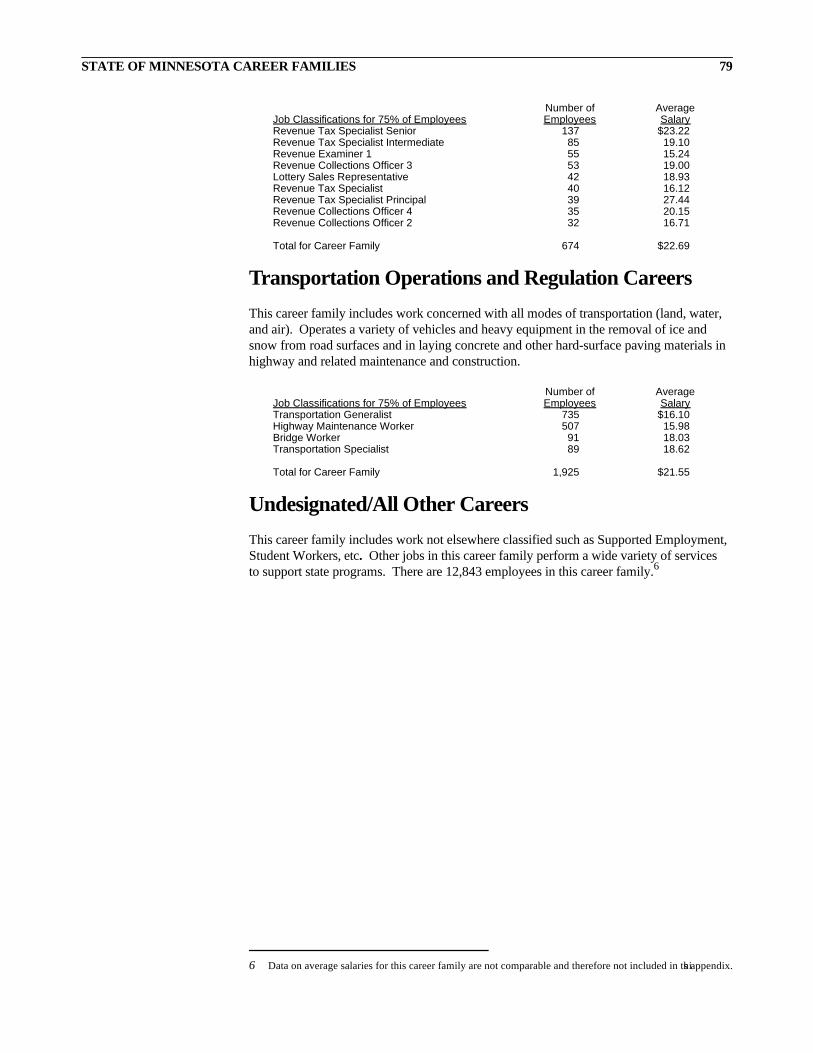
Number of AverageJob Classifications for 75% of Employees Employees SalaryRevenue Tax Specialist Senior 137 $23.22Revenue Tax Specialist Intermediate 85 19.10Revenue Examiner 1 55 15.24Revenue Collections Officer 3 53 19.00Lottery Sales Representative 42 18.93Revenue Tax Specialist 40 16.12Revenue Tax Specialist Principal 39 27.44Revenue Collections Officer 4 35 20.15Revenue Collections Officer 2 32 16.71
Total for Career Family 674 $22.69
Transportation Operations and Regulation CareersThis career family includes work concerned with all modes of transportation (land, water,and air). Operates a variety of vehicles and heavy equipment in the removal of ice andsnow from road surfaces and in laying concrete and other hard-surface paving materials inhighway and related maintenance and construction.
Number of AverageJob Classifications for 75% of Employees Employees SalaryTransportation Generalist 735 $16.10Highway Maintenance Worker 507 15.98Bridge Worker 91 18.03Transportation Specialist 89 18.62
Total for Career Family 1,925 $21.55
Undesignated/All Other CareersThis career family includes work not elsewhere classified such as Supported Employment,Student Workers, etc. Other jobs in this career family perform a wide variety of servicesto support state programs. There are 12,843 employees in this career family.6
STATE OF MINNESOTA CAREER FAMILIES 79
6 Data on average salaries for this career family are not comparable and therefore not included in this appendix.
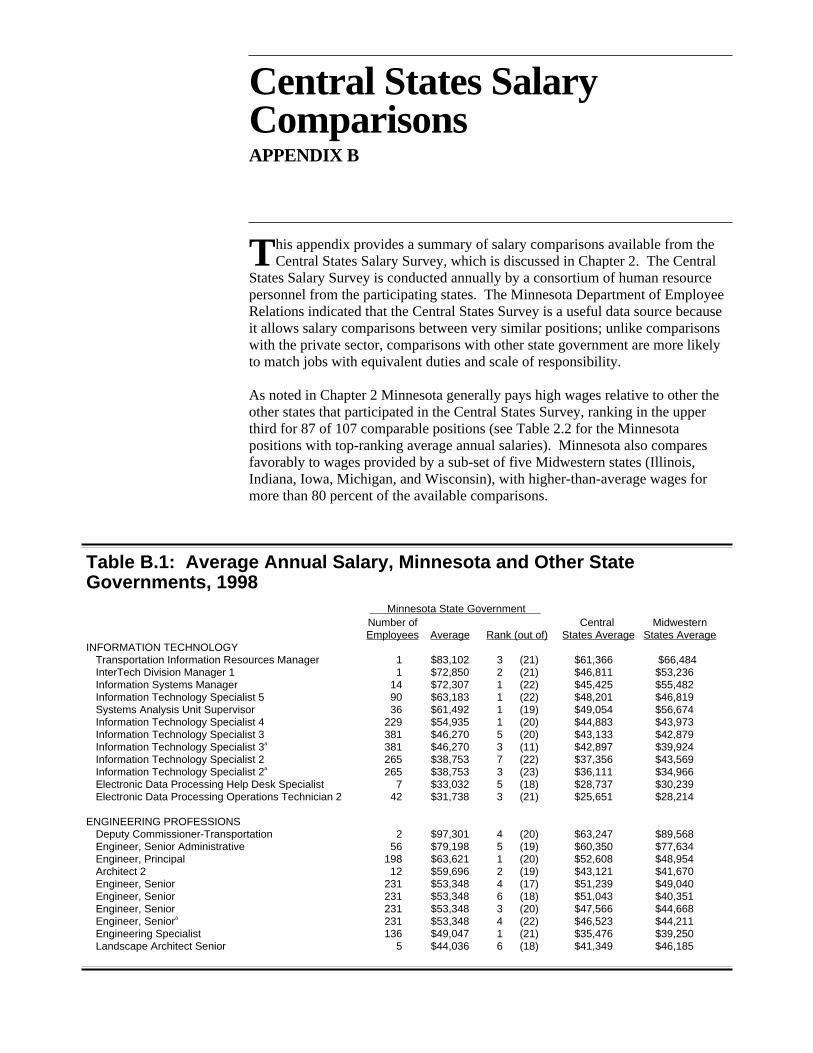
Central States SalaryComparisonsAPPENDIX B
This appendix provides a summary of salary comparisons available from theCentral States Salary Survey, which is discussed in Chapter 2. The Central
States Salary Survey is conducted annually by a consortium of human resourcepersonnel from the participating states. The Minnesota Department of EmployeeRelations indicated that the Central States Survey is a useful data source becauseit allows salary comparisons between very similar positions; unlike comparisonswith the private sector, comparisons with other state government are more likelyto match jobs with equivalent duties and scale of responsibility.
As noted in Chapter 2 Minnesota generally pays high wages relative to other theother states that participated in the Central States Survey, ranking in the upperthird for 87 of 107 comparable positions (see Table 2.2 for the Minnesotapositions with top-ranking average annual salaries). Minnesota also comparesfavorably to wages provided by a sub-set of five Midwestern states (Illinois,Indiana, Iowa, Michigan, and Wisconsin), with higher-than-average wages formore than 80 percent of the available comparisons.
Table B.1: Average Annual Salary, Minnesota and Other StateGovernments, 1998
Minnesota State GovernmentNumber of Central MidwesternEmployees Average Rank (out of) States Average States Average
INFORMATION TECHNOLOGYTransportation Information Resources Manager 1 $83,102 3 (21) $61,366 $66,484InterTech Division Manager 1 1 $72,850 2 (21) $46,811 $53,236Information Systems Manager 14 $72,307 1 (22) $45,425 $55,482Information Technology Specialist 5 90 $63,183 1 (22) $48,201 $46,819Systems Analysis Unit Supervisor 36 $61,492 1 (19) $49,054 $56,674Information Technology Specialist 4 229 $54,935 1 (20) $44,883 $43,973Information Technology Specialist 3 381 $46,270 5 (20) $43,133 $42,879Information Technology Specialist 3a 381 $46,270 3 (11) $42,897 $39,924Information Technology Specialist 2 265 $38,753 7 (22) $37,356 $43,569Information Technology Specialist 2a 265 $38,753 3 (23) $36,111 $34,966Electronic Data Processing Help Desk Specialist 7 $33,032 5 (18) $28,737 $30,239Electronic Data Processing Operations Technician 2 42 $31,738 3 (21) $25,651 $28,214
ENGINEERING PROFESSIONSDeputy Commissioner-Transportation 2 $97,301 4 (20) $63,247 $89,568Engineer, Senior Administrative 56 $79,198 5 (19) $60,350 $77,634Engineer, Principal 198 $63,621 1 (20) $52,608 $48,954Architect 2 12 $59,696 2 (19) $43,121 $41,670Engineer, Senior 231 $53,348 4 (17) $51,239 $49,040Engineer, Senior 231 $53,348 6 (18) $51,043 $40,351Engineer, Senior 231 $53,348 3 (20) $47,566 $44,668Engineer, Seniora 231 $53,348 4 (22) $46,523 $44,211Engineering Specialist 136 $49,047 1 (21) $35,476 $39,250Landscape Architect Senior 5 $44,036 6 (18) $41,349 $46,185
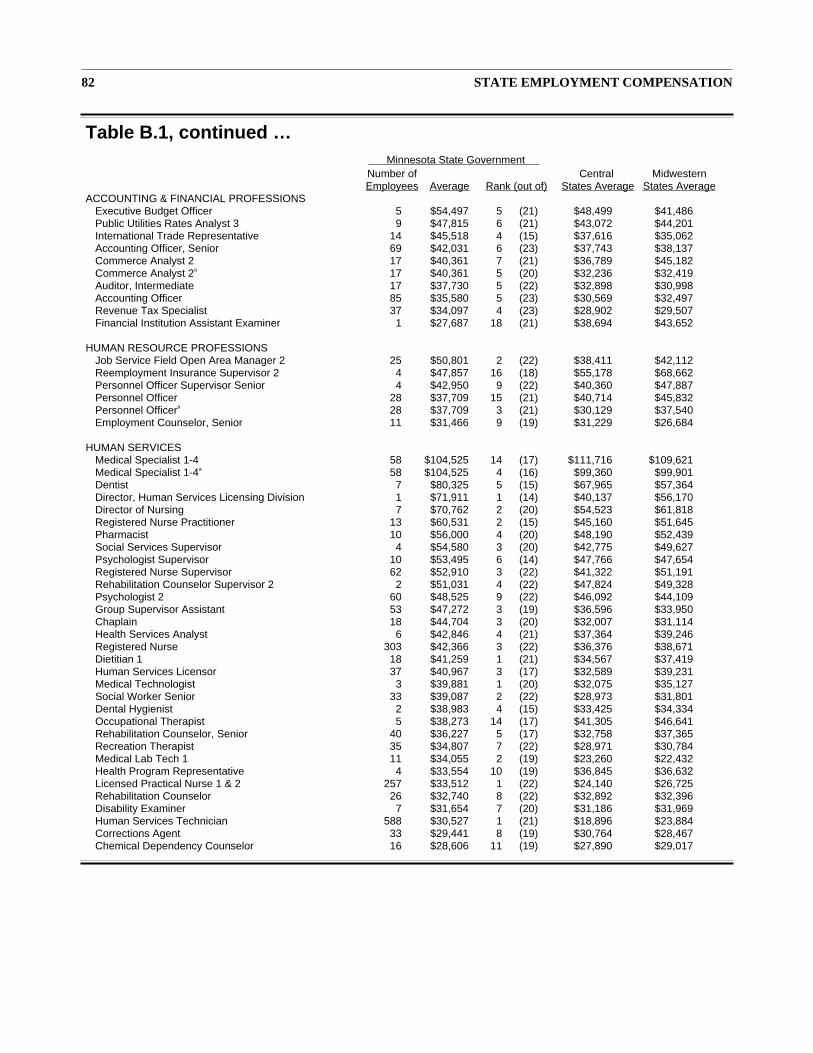
82 STATE EMPLOYMENT COMPENSATION
Table B.1, continued …Minnesota State Government
Number of Central MidwesternEmployees Average Rank (out of) States Average States Average
ACCOUNTING & FINANCIAL PROFESSIONSExecutive Budget Officer 5 $54,497 5 (21) $48,499 $41,486Public Utilities Rates Analyst 3 9 $47,815 6 (21) $43,072 $44,201International Trade Representative 14 $45,518 4 (15) $37,616 $35,062Accounting Officer, Senior 69 $42,031 6 (23) $37,743 $38,137Commerce Analyst 2 17 $40,361 7 (21) $36,789 $45,182Commerce Analyst 2a 17 $40,361 5 (20) $32,236 $32,419Auditor, Intermediate 17 $37,730 5 (22) $32,898 $30,998Accounting Officer 85 $35,580 5 (23) $30,569 $32,497Revenue Tax Specialist 37 $34,097 4 (23) $28,902 $29,507Financial Institution Assistant Examiner 1 $27,687 18 (21) $38,694 $43,652
HUMAN RESOURCE PROFESSIONSJob Service Field Open Area Manager 2 25 $50,801 2 (22) $38,411 $42,112Reemployment Insurance Supervisor 2 4 $47,857 16 (18) $55,178 $68,662Personnel Officer Supervisor Senior 4 $42,950 9 (22) $40,360 $47,887Personnel Officer 28 $37,709 15 (21) $40,714 $45,832Personnel Officera 28 $37,709 3 (21) $30,129 $37,540Employment Counselor, Senior 11 $31,466 9 (19) $31,229 $26,684
HUMAN SERVICESMedical Specialist 1-4 58 $104,525 14 (17) $111,716 $109,621Medical Specialist 1-4a 58 $104,525 4 (16) $99,360 $99,901Dentist 7 $80,325 5 (15) $67,965 $57,364Director, Human Services Licensing Division 1 $71,911 1 (14) $40,137 $56,170Director of Nursing 7 $70,762 2 (20) $54,523 $61,818Registered Nurse Practitioner 13 $60,531 2 (15) $45,160 $51,645Pharmacist 10 $56,000 4 (20) $48,190 $52,439Social Services Supervisor 4 $54,580 3 (20) $42,775 $49,627Psychologist Supervisor 10 $53,495 6 (14) $47,766 $47,654Registered Nurse Supervisor 62 $52,910 3 (22) $41,322 $51,191Rehabilitation Counselor Supervisor 2 2 $51,031 4 (22) $47,824 $49,328Psychologist 2 60 $48,525 9 (22) $46,092 $44,109Group Supervisor Assistant 53 $47,272 3 (19) $36,596 $33,950Chaplain 18 $44,704 3 (20) $32,007 $31,114Health Services Analyst 6 $42,846 4 (21) $37,364 $39,246Registered Nurse 303 $42,366 3 (22) $36,376 $38,671Dietitian 1 18 $41,259 1 (21) $34,567 $37,419Human Services Licensor 37 $40,967 3 (17) $32,589 $39,231Medical Technologist 3 $39,881 1 (20) $32,075 $35,127Social Worker Senior 33 $39,087 2 (22) $28,973 $31,801Dental Hygienist 2 $38,983 4 (15) $33,425 $34,334Occupational Therapist 5 $38,273 14 (17) $41,305 $46,641Rehabilitation Counselor, Senior 40 $36,227 5 (17) $32,758 $37,365Recreation Therapist 35 $34,807 7 (22) $28,971 $30,784Medical Lab Tech 1 11 $34,055 2 (19) $23,260 $22,432Health Program Representative 4 $33,554 10 (19) $36,845 $36,632Licensed Practical Nurse 1 & 2 257 $33,512 1 (22) $24,140 $26,725Rehabilitation Counselor 26 $32,740 8 (22) $32,892 $32,396Disability Examiner 7 $31,654 7 (20) $31,186 $31,969Human Services Technician 588 $30,527 1 (21) $18,896 $23,884Corrections Agent 33 $29,441 8 (19) $30,764 $28,467Chemical Dependency Counselor 16 $28,606 11 (19) $27,890 $29,017
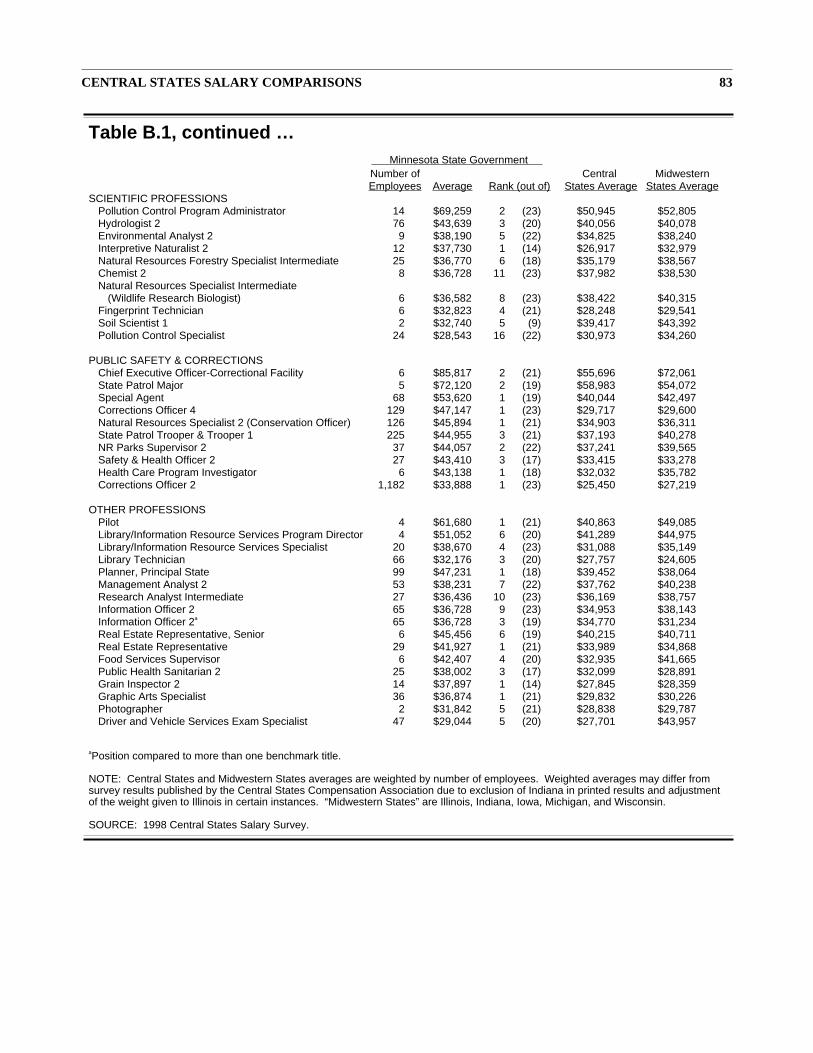
CENTRAL STATES SALARY COMPARISONS 83
Table B.1, continued …Minnesota State Government
Number of Central MidwesternEmployees Average Rank (out of) States Average States Average
SCIENTIFIC PROFESSIONSPollution Control Program Administrator 14 $69,259 2 (23) $50,945 $52,805Hydrologist 2 76 $43,639 3 (20) $40,056 $40,078Environmental Analyst 2 9 $38,190 5 (22) $34,825 $38,240Interpretive Naturalist 2 12 $37,730 1 (14) $26,917 $32,979Natural Resources Forestry Specialist Intermediate 25 $36,770 6 (18) $35,179 $38,567Chemist 2 8 $36,728 11 (23) $37,982 $38,530Natural Resources Specialist Intermediate
(Wildlife Research Biologist) 6 $36,582 8 (23) $38,422 $40,315Fingerprint Technician 6 $32,823 4 (21) $28,248 $29,541Soil Scientist 1 2 $32,740 5 (9) $39,417 $43,392Pollution Control Specialist 24 $28,543 16 (22) $30,973 $34,260
PUBLIC SAFETY & CORRECTIONSChief Executive Officer-Correctional Facility 6 $85,817 2 (21) $55,696 $72,061State Patrol Major 5 $72,120 2 (19) $58,983 $54,072Special Agent 68 $53,620 1 (19) $40,044 $42,497Corrections Officer 4 129 $47,147 1 (23) $29,717 $29,600Natural Resources Specialist 2 (Conservation Officer) 126 $45,894 1 (21) $34,903 $36,311State Patrol Trooper & Trooper 1 225 $44,955 3 (21) $37,193 $40,278NR Parks Supervisor 2 37 $44,057 2 (22) $37,241 $39,565Safety & Health Officer 2 27 $43,410 3 (17) $33,415 $33,278Health Care Program Investigator 6 $43,138 1 (18) $32,032 $35,782Corrections Officer 2 1,182 $33,888 1 (23) $25,450 $27,219
OTHER PROFESSIONSPilot 4 $61,680 1 (21) $40,863 $49,085Library/Information Resource Services Program Director 4 $51,052 6 (20) $41,289 $44,975Library/Information Resource Services Specialist 20 $38,670 4 (23) $31,088 $35,149Library Technician 66 $32,176 3 (20) $27,757 $24,605Planner, Principal State 99 $47,231 1 (18) $39,452 $38,064Management Analyst 2 53 $38,231 7 (22) $37,762 $40,238Research Analyst Intermediate 27 $36,436 10 (23) $36,169 $38,757Information Officer 2 65 $36,728 9 (23) $34,953 $38,143Information Officer 2a 65 $36,728 3 (19) $34,770 $31,234Real Estate Representative, Senior 6 $45,456 6 (19) $40,215 $40,711Real Estate Representative 29 $41,927 1 (21) $33,989 $34,868Food Services Supervisor 6 $42,407 4 (20) $32,935 $41,665Public Health Sanitarian 2 25 $38,002 3 (17) $32,099 $28,891Grain Inspector 2 14 $37,897 1 (14) $27,845 $28,359Graphic Arts Specialist 36 $36,874 1 (21) $29,832 $30,226Photographer 2 $31,842 5 (21) $28,838 $29,787Driver and Vehicle Services Exam Specialist 47 $29,044 5 (20) $27,701 $43,957
aPosition compared to more than one benchmark title.
NOTE: Central States and Midwestern States averages are weighted by number of employees. Weighted averages may differ fromsurvey results published by the Central States Compensation Association due to exclusion of Indiana in printed results and adjustmentof the weight given to Illinois in certain instances. “Midwestern States” are Illinois, Indiana, Iowa, Michigan, and Wisconsin.
SOURCE: 1998 Central States Salary Survey.
Further Reading
WEBSITES
Minnesota Department of Employee Relations: http://www.doer.state.mn.us
Minnesota Local Area Unemployment Statistics: http://www.des.state.mn.us/lmi/laus/minn.htm
U.S. Bureau of Census, Survey of Governments: http://www.census.gov/govs/www/apes.html
U.S. Bureau of Census and Bureau of Labor Statistics, Current Population Survey:http://www.bls.census.gov/cps/
U.S. Bureau of Labor Statistics, Employee Benefits Survey: http://stats.bls.gov/ebshome.htm
U.S. Bureau of Labor Statistics, Employment Cost Trends (includes informationon the Employment Cost Index): http://stats.bls.gov/ecthome.htm
U.S. Bureau of Labor Statistics, Occupational Compensation Survey Program:http://stats.bls.gov/ocshome.htm
U.S. Department of Education, National Center for Educational Statistics,Integrated Postsecondary Education Data System: http://nces.ed.gov/ipeds/
BOOKS, ARTICLES, AND REPORTS
American Association of University Professors. “The Economic Status of theProfession.” Academe, 85, no. 2 (March-April 1999): 1-108.
Belman, Dale and John S. Heywood. “State and Local Government WageDifferentials: An Intrastate Analysis.” Journal of Labor Research, XVI, no. 2(Spring 1995): 187-201.
Braden, Bradley R. and Stephanie L. Hyland. “Cost of Employee Compensationin Public and Private Sectors.” Monthly Labor Review, May 1993: 14-21.
Brunner, Kristen and William A. Blazar. “Public Sector Compensation:Performance Driven? Affordable?” Prepared for the Minnesota Chamber ofCommerce, January 1993.
Buckley, John E. “Pay in Private Industry and State and Local Governments,1994.” Compensation and Working Conditions, September 1996: 22.
Cox, Wendell and Samuel Brunelli. “America’s Protected Class: Why ExcessPublic Employee Compensation is Bankrupting the States.” The State Factor, 18,no. 3 (February, 1992): 3-31.
Hundley, Greg. “Public- and Private-Sector Occupational Pay Structures.”Industrial Relations, 30, no. 3 (Fall 1991): 417-434.
Kroncke, Charles O. and James A. Long. “Pay Comparability in StateGovernments.” Journal of Labor Research, 19, no. 2 (Spring 1998): 371-385.
Light, Paul C. The New Public Service. Washington, D.C.: Brookings InstitutionPress, 1999.
Miller, Micheal A. “The Public-Private Pay Debate: What do the Data Show?”Monthly Labor Review, 119, no. 5 (May 1996): 18-29.
Minnesota Office of the Legislative Auditor. Trends in State and LocalGovernment Spending. St. Paul: Minnesota Office of the Legislative Auditor,February 1996.
Musell, Mark and Neal Masia. “Reconciling Differences in Federal andPrivate Sector Pay Comparisons.” Public Budgeting and Finance, 18, number 1(Spring 1998): 68-77.
Thompson, Frank J., ed. Revitalizing State and Local Public Service. SanFrancisco: Jossey-Bass Publishers, 1993.
Wiatrowski, William J. “Family-Related Benefits in the Workplace.” MonthlyLabor Review, 113, no. 3 (March 1990): 28-33.
Wiatrowski, William J. “Tracking Changes in Benefit Costs.” Compensation andWorking Conditions, 4, no. 1 (Spring 1999): 32-37.
86 STATE EMPLOYEE COMPENSATION
MinnesotaDepartment ofEmployeeRelationsState of Minnesota: Employer of Choice
January 24, 2000
Roger Brooks, Deputy Legislative AuditorOffice of the Legislative Auditor658 Cedar StreetSaint Paul, MN 55155
Dear Mr. Brooks:
Thank you for the opportunity to comment on the report on state employee compensation.The portion of the report that compares state salaries and benefits to other employers in thepublic and private sectors is reminiscent of the Public Employment Study, conducted by theHay Group and released in 1979. The researchers who conducted the Public EmploymentStudy noted the difficulty in simultaneously pursuing internal equity and externalcompetitiveness, particularly for a large and diverse employer such as state government. Theearlier study also found that state and local governments tend to pay more than the privatesector for jobs at similar levels of complexity, except for high level managerial positions. It isnot surprising that these same findings are reflected in your report, twenty years later.
In the interim since the Public Employment Study there have been two significant influenceson the salary structure of the Executive Branch. First, in the early 1980’s, the state adopted aPay Equity law, which resulted in significant salary increases for female-dominatedclassifications at the lower end of the salary schedule. Second, the salaries of state agencyheads, which serve as the upper limit of compensation for employees within each stateagency, were not adjusted for eight years. The Legislature did provide significant relief to thesalary compression at the upper end of the salary structure with the passage of the agencyhead pay bill in 1997. However, the new salary limits for agency heads still put the ExecutiveBranch at a disadvantage in comparison to local units of government. The salary limit for thelargest agencies is 85 percent of the Governor’s salary while the salary limit for cities andcounties is 95 percent of the same salary. School districts have been exempted from the limitin recent years.
Your report reveals something about the value of the perceptions of human resources directorsand, indirectly, supervisors and managers. In spite of the fact that your data indicates thatstate salaries for clerical jobs are at least 20 percent above the private sector, 21 percent of thehuman resources directors surveyed identified inadequate compensation as contributing totheir difficulty in recruiting and retaining employees in these classifications. This indicatesthat salary data and actual recruiting experience can tell two different stories. Thesediscrepancies call for closer examination of wage data and non-wage factors that might be atthe root of the recruiting problem.
200 Centennial Office Building l 658 Cedar St. l St. Paul, MN 55155-1603 l (651) 297-1184 l TTY (651 282-2699An equal opportunity employer
Roger BrooksJanuary 20, 2000Page 2
The apparent contradiction between our clerical salaries appearing to be above ‘the market’and state agencies having difficulty in recruiting is also the converse of a concern we haveabout broad generalizations based upon the analysis of external salary data and Hay points.The comparison of the salary lines of the state and other employers masks a considerableamount of variability in pay for individual jobs. Even where attempts are made to match jobtitles and job descriptions, the pay data alone does not tell the whole story. When we bargainon the issue of salary range assignments of specific classifications, we also review data onemployee turnover, salary step on hire and agency input on recruiting and retentionexperience. It is not unusual for salary survey data to indicate a lack of competitiveness withexternal comparisons while the recruiting and retention data does not indicate any cause forconcern.
Again, thank you for the opportunity to comment on the report.
Sincerely,
/s/ Jim Lee
Jim LeeDeputy CommissionerLabor Relations/Compensation Division(651) 297-5738
Truck Safety Regulation, January 1992 92-01State Contracting for Professional/Technical
Services, February 1992 92-02Public Defender System, February 1992 92-03Higher Education Administrative and Student
Services Spending: Technical Colleges,Community Colleges, and State Universities,March 1992 92-04
Regional Transit Planning, March 1992 92-05University of Minnesota Supercomputing
Services, October 1992 92-06Petrofund Reimbursement for Leaking
Storage Tanks, January 1993 93-01Airport Planning, February 1993 93-02Higher Education Programs, February 1993 93-03Administrative Rulemaking, March 1993 93-04Truck Safety Regulation, Update, June 1993 93-05School District Financial Reporting,
Update, June 1993 93-06Public Defender System, Update,
December 1993 93-07Game and Fish Fund Special Stamps and
Surcharges, Update, January 1994 94-01Performance Budgeting, February 1994 94-02Psychopathic Personality Commitment Law,
February 1994 94-03Higher Education Tuition and State Grants,
February 1994 94-04Motor Vehicle Deputy Registrars, March 1994 94-05Minnesota Supercomputer Center, June 1994 94-06Sex Offender Treatment Programs, July 1994 94-07Residential Facilities for Juvenile Offenders,
February 1995 95-01Health Care Administrative Costs,
February 1995 95-02Guardians Ad Litem, February 1995 95-03Early Retirement Incentives, March 1995 95-04State Employee Training: A Best Practices
Review, April 1995 95-05Snow and Ice Control: A Best Practices
Review, May 1995 95-06Pollution Control Agency’s Use of AdministrativePenalty Orders, Update July 1995 95-07Development and Use of the 1994 Agency
Performance Reports, July 1995 PR95-22State Agency Use of Customer Satisfaction
Surveys, October 1995 PR95-23Funding for Probation Services, January 1996 96-01Department of Human Rights, January 1996 96-02Trends in State and Local Government
Spending, February 1996 96-03State Grant and Loan Programs for Businesses
February 1996 96-04
Post-Secondary Enrollment Options Program,March 1996 96-05
Tax Increment Financing, March 1996 96-06Property Assessments: Structure and Appeals,
A Best Practices Review, May 1996 96-07Recidivism of Adult Felons, January 1997 97-01Nursing Home Rates in the Upper Midwest,
January 1997 97-02Special Education, January 1997 97-03Ethanol Programs, February 1997 97-04Statewide Systems Project, February 1997 97-05Highway Spending, March 1997 97-06Non-Felony Prosecution, A Best Practices
Review, April 1997 97-07Social Service Mandates Reform, July 1997 97-08Child Protective Services, January 1998 98-01Remedial Education, January 1998 98-02Transit Services, February 1998 98-03State Building Maintenance, February 1998 98-04School Trust Land, March 1998 98-059-1-1 Dispatching: A Best Practices Review,
March 1998 98-06Minnesota State High School League,
June 1998 98-07State Building Code, January 1999 99-01Juvenile Out-of-Home Placement, January 1999 99-02Metropolitan Mosquito Control District,
January 1999 99-03Animal Feedlot Regulation, January 1999 99-04Occupational Regulation, February 1999 99-05Directory of Regulated Occupations in
Minnesota, February 1999 99-05bCounties’ Use of Administrative Penalties
for Violations of Solid and HazardousWaste Ordinances, February 1999 99-06
Fire Services: A Best PracticesReview, April 1999 99-07
State Mandates on Local Governments,January 2000 00-01
State Park Management, January 2000 00-02Welfare Reform, January 2000 00-03School District Finances, February 2000 00-04State Employee Compensation, February 2000 00-05Managing Preventive Maintenance for Local
Government Buildings: A Best PracticesReview, forthcoming
Minnesota State Colleges and Universities: StatusReport, forthcoming
Recent Program Evaluations
Evaluation reports can be obtained free of charge from the Legislative Auditor’s Office, Program Evaluation Division,Room 140, 658 Cedar Street, Saint Paul, Minnesota 55155, 651/296-4708. Full text versions of recent reports are alsoavailable at the OLA web site: http://www.auditor.leg.state.mn.us