Embed Size (px)
Citation preview

H O U S E A P P R O P R I A T I O N S C O M M I T T E E
C O M P E N S A T I O N & R E T I R E M E N T S U B C O M M I T T E E
G E N E R A L A S S E M B L Y B U I L D I N G , R I C H M O N D , V I R G I N I A
J A N U A R Y 2 8 , 2 0 1 6
STATE EMPLOYEEBUDGET, HEALTH INSURANCE, WORKFORCE, COMPENSATION, INFORMATION TECHNOLOGY
Virginia Department of
Human Resource Management

January 2016 2
BUDGET
BUDGET
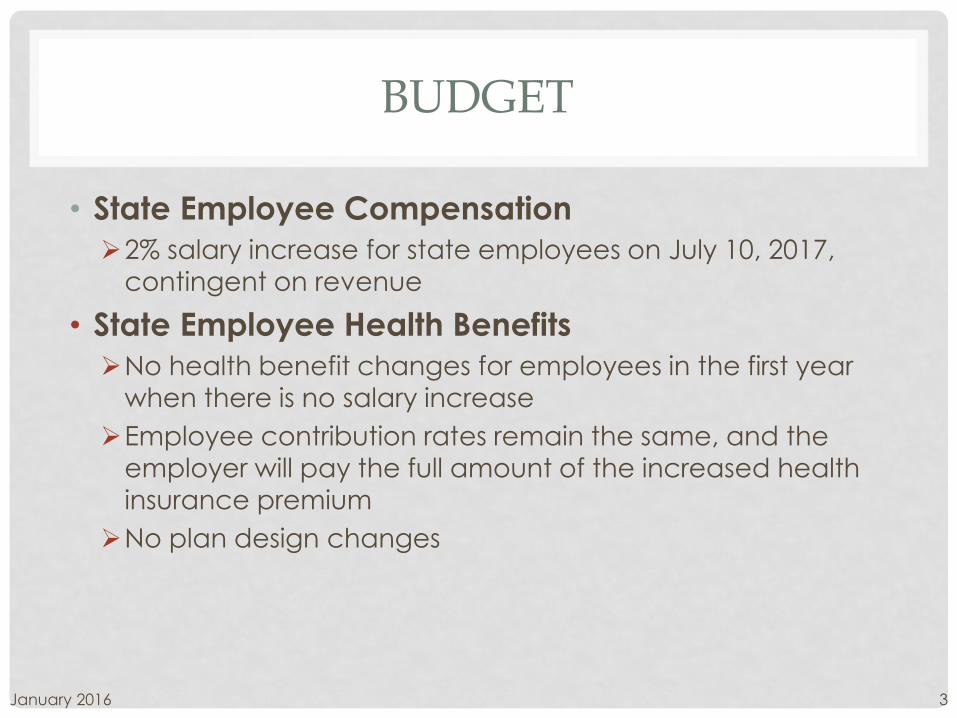
• State Employee Compensation
2% salary increase for state employees on July 10, 2017,
contingent on revenue
• State Employee Health Benefits
No health benefit changes for employees in the first year
when there is no salary increase
Employee contribution rates remain the same, and the
employer will pay the full amount of the increased health
insurance premium
No plan design changes
January 2016 3

BUDGET
REVIEW OF PUBLIC EMPLOYEE HEALTH PLANS IN THE COMMONWEALTH
Budget Item 82.H of Chapter 665 of the 2015 Virginia Acts of Assembly
• Provided up to $250,000 to DHRM to conduct comprehensive review
of public employee health plans in Commonwealth
• Required actuarial review of impact on the state, school boards, and
other political subdivisions of including their employees and
dependents in the state employee health plan or one statewide
pooled plan for employees of political subdivisions
• Required school boards and localities to provide information DHRM
requested for the actuarial analysis
• Required review of The Local Choice (TLC) policies, including pooling
and rating methodology, to determine what improvements could be
made, with a specific goal to increase TLC appeal in rural areas
• Directed DHRM to hold series of meetings with stakeholders to
educate them about TLC and solicit their feedback
January 2016 4

• 336 of the 708 schools and political subdivisions
provided complete data used in the study
• 47% provided complete data
• 26% provided incomplete data
• 27% provided no data
• 203,593 average enrollees
• 380,715 average enrolled members
• 8 educational and feedback stakeholder meetings held
• 69% group participants were TLC groups
• 31% group participants were non-TLC groups
• Locations included Abingdon, Alberta, Annandale, Chester,
Fredericksburg, Portsmouth, Roanoke, and Staunton
January 2016 5
BUDGET – HEALTH PLAN REVIEW
PARTICIPATION

• Local entities’ budget and benefit structures vary widely
• Localities currently have range of stand-alone and TLC options
• Decisions to join state or TLC plans have varying fiscal impacts
• Impact on state or TLC plans not significant based on current data by participating entities
• Estimated cost for including the local plans is similar to the state
plan
• Adverse selection is the primary risk in an optional plan• Adverse Experience Adjustment clause would mitigate this risk
January 2016 6
BUDGET - HEALTH PLAN REVIEW
FINDINGS

January 2016 7
BUDGET - HEALTH PLAN REVIEW
ACTUARIAL ANALYSIS – EXPECTED COST
Estimated FY 2016 Cost PMPM
Medical and Prescription Drugs Dental
School/Gov't State Plan Difference School/Gov't State Plan Difference
Low Trend $444 $464 (4.2%) $26.97 $30.55 (11.7%)
Best Estimate Trend $454 $464 (2.0%) $27.61 $30.55 (9.6%)
High Trend $465 $464 0.3% $28.26 $30.55 (7.5%)
Average Enrolled Members 380,715 195,483 294,651 195,483
Cost comparison of school and locality plans to the state plan • Medical & drug claim cost is slightly lower in school & locality plans than in state plan
• Dental claim cost is lower in school & locality plans than in state plan
Cost comparison of non-TLC plans to current TLC plan• Medical & drug claim cost is lower in non-TLC plans than in current TLC plan
• Dental claim cost is higher in non-TLC plans than in current TLC plan
Estimated FY2016 Cost PMPM
Medical and Prescription Drugs Dental
Schools Gov’t Total KA
Expanded
Manual
Rate
Schools Gov’t Total KA
Expanded
Manual
RateTLCNon-TLC
$480$464
$505$465
$493$465
$26.63$28.77
$19.86$24.29
$23.70$26.37
Total $466 $471 $468 $394 $28.26 $23.53 $25.83 $21.28
Average Enrolled Members 211,389 169,326 380,715 143,842 150,809 294,651

January 2016 8
$-
$150
$300
$450
$600
$750
$900
$1,050
$1,200
$1,350
$1,500
$1,650
$1,800
$1,950
Proj
ecte
d FY
16 M
edic
al a
nd P
resc
riptio
n Dr
ug P
MPM
School and Government Entities
School and Government EntitiesProjected Medical and Prescription Drugs
Cost Per Member Per Month (PMPM)
State Plan Cost
Note: Two entities with projected Medical and prescription drug PMPMs in excess of $ 2,600 are not included in the graph above due to scale.
$-
$10
$20
$30
$40
$50
$60
Proj
ecte
d FY
16 D
enta
l PM
PM
School and Government Entities
School and Government EntitiesProjected Dental
Cost Per Member Per Month (PMPM)
State Plan Cost
BUDGET - HEALTH PLAN REVIEW
ACTUARIAL ANALYSIS – COST VARIABILITY
• Cost and coverage vary considerably by entity Entities above the red line would pay less if they joined the state plan
Entities below the red line would pay more if they joined the state plan

January 2016 9
BUDGET - HEALTH PLAN REVIEW
ACTUARIAL ANALYSIS – EMPLOYER SUBSIDY
• Employer subsidy varies widely across all plans
• State plan - 88% employer
subsidy for COVA Care
Basic
o 70% of plan participants
would have higher
employer subsidies under the state COVA
Care Basic plan
• TLC - 80% employer subsidy of single
employee cost + 20% of
dependent cost if less
than 75% participation
January 2016 10
BUDGET - HEALTH PLAN REVIEW
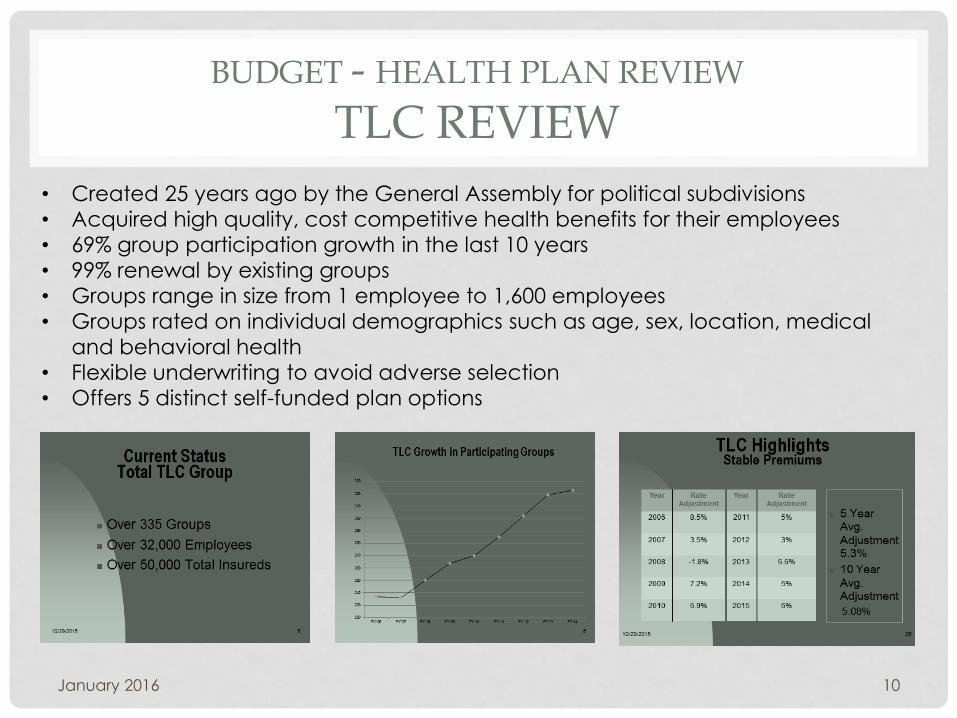
TLC REVIEW
• Created 25 years ago by the General Assembly for political subdivisions
• Acquired high quality, cost competitive health benefits for their employees
• 69% group participation growth in the last 10 years
• 99% renewal by existing groups
• Groups range in size from 1 employee to 1,600 employees
• Groups rated on individual demographics such as age, sex, location, medical
and behavioral health
• Flexible underwriting to avoid adverse selection
• Offers 5 distinct self-funded plan options

STATE EMPLOYEE HEALTH INSURANCE
January 2016 11

TOTAL POPULATION HEALTHCLAIMS
January 2016 12
Total Population
Health
$1.1B
Medical
$813.3M
Drug
$233.9M
Dental
$53.7M
Behavior Health &
EAP
$12.1M

13
TOTAL POPULATION HEALTH
January 201613
11,79939%
6,80122%
5,56418%
4,41614%
2,0637%
Top Health
Goals
Losing WeightMore Physical ActivityHealthier DietBetter manage stress
26,85133%
14,27718%
13,83817%
7,793 17%
12,37915%
Top Identified Conditions
Stress IssuesSleep DisordersExercise IssuesOverweightAdult Obesity
35,39833%
24,90924%
13,49513%
19,27718%
13,18812%
Top Areas Ready
To Change
Healthier Diet
Managing Stress
Managing Weight
Weight-bearing Exercises
Physical Activity
Identified in Health Assessment
As of June 30, 2015
Source: ActiveHealth Management
2015 Weight of State Population
• Employee engagement • Cost and quality tools
• Healthy lifestyle
coaching
• Financial rewards
• Education
• Top conditions identified
in health assessment• Stress issues
• Sleep disorders
• Lack of exercise
• Conditions correlate with
obesity• 70% of state plan
members overweight or
obese
2,803 2,787 2,6732,399
1,026
4,5794,329
3,5933,890
1,805
0
500
1,000
1,500
2,000
2,500
3,000
3,500
4,000
4,500
5,000
AdultHypertension
HighChloesterol
AdultDiabetes
WeightManagement
GERD
Nurse Engaged Members Top Five Conditions Identified
2014 2015

January 2016 14
INNOVATION
January 2016 14
57
53
48
24
20
334
0 100 200 300 400
Total Bariatric Surgeries FY 2010 - 2015
2010 2011 2012 2013 2014 2015
$5.9
$0.8
$1.5 $1.3
$1.1 $1.3
$0.0
$1.0
$2.0
$3.0
$4.0
$5.0
$6.0
$7.0
Total Bariatric Surgery and
Obesity Medical Expense
FY 2010-2015(in millions)
2010 2011 2012 2013 2014 2015
• COVA HealthAware
Consumer driven health plan• Increase member accountability• Manage health spending
• Bariatric surgery program• Improve health outcomes• 88% decline in cost since 2010
• Value Based Insurance Design• Diabetes
• Hypertension
• Asthma • COPD
• Medication Therapy Management• 3,614 safety alerts• Higher medication adherence• Closing of gaps in care
$3,098,488
$458,500
$705,610
$0
$400,000
$800,000
$1,200,000
$1,600,000
$2,000,000
$2,400,000
$2,800,000
$3,200,000
$3,600,000
$4,000,000
$4,400,000
Total Available Funds
Initial HRA Funds "Do Right" incentives earned Rollover from prior period
Health Reimbursement ArrangementFY 2015
68%
32%Using HRAFunds
Total Claims Paid
$4,262,598

January 2016 15
INCENTIVES
January 2016 15
6429%
1852%
2,90341%
3,398 48%
Participants in Incentive Programs
FY 2015
Asthma
COPD
Diabetes
Hypertension
Diabetes management outcomes for CY 2014:•4.8 conditions per member
•92 percent had HbA1C test•VBID-engaged had higher compliance than disease management-engaged members in 3 out of 5 diabetes metrics
Value-Based Insurance Design COVA Care and COVA HealthAware
Total = 7,128
42,684 63%
1028 2%
2366235%
Member Premium Rewards
Participant Only Spouse Only Both
FY 2015Total # of Rewards
$9.5 million
43,67035,253
0
10,000
20,000
30,000
40,000
50,000
FY 2014 FY 2015
Members Eligible for Premium Reward
• Premium Rewards• 35,253 eligible
• Earned $9.5 million
• “Do Rights” • Applies to COVA HealthAware
• Earned by employees/retirees &
spouses for healthy activities
• Receive $50 each for up to 3
“do rights”
• VBID Programs• 7,128 total engaged
• Diabetes program compliance
rates higher than other similar
Active Health programs
2,75126%
3,782 35%
1631%
1,53214%
2442%
2883%
2,00819%
COVA HealthAware "Do Right" Healthy Activities
Annual Exam Dental Exam Digital Coaching Flu Shot
Online Coaching AHM Tracker Vision Exam
FY 2015Total = 10,768

WELLNESS AND PREVENTIVE
January 2016 16Source: DHRM 2015 Health Benefits Annual Report
68%
91%
83%
61%
69%
68%
55%
91%
76%
60%
92%
82%
66%
87%
73%
65%
68%
71%
0% 20% 40% 60% 80% 100%
Body Mass Index <30.0
Cholesterol <240
Blood Pressure <140/90
State Employee Health Measures
National Average 2020 National Goal 2015 2014 2013 2005
Sources: ActiveHealth Management 2015 biometric screenings , CommonHealth biennial health checks of select employee groups, the Centers for Disease Control and Prevention, and Healthy People 2020.
269600 273290
261337
281949
261045
250,000
255,000
260,000
265,000
270,000
275,000
280,000
285,000
$17,000,000
$17,500,000
$18,000,000
$18,500,000
$19,000,000
$19,500,000
$20,000,000
$20,500,000
$21,000,000
$21,500,000
$22,000,000
FY 2011 FY2012 FY 2013 FY 2014 FY 2015
Preventing ScreeningsCost and Volume
Preventive Screening Cost Preventive Screening Volume
2011 2012 2013 2014 2015
Pharmacy 24,791 26,747 30,627 32,398 35,477
Medical 34,817 34,777 33,254 36,636 33,824
0
20,000
40,000
60,000
80,000
Total Flu ShotsState Health Plan Members
61,52463,881
59,608
69,034 69,301
• Preventive cancer screenings • No cost to members
• Biometric screenings • Hypertension
• Cholesterol
• BMI
• Healthy Lifestyles coaching • Helps members stay on track
• Flu shots
• Paid at 100%

FY 2015 HEALTH BENEFITS
TOP TEN CLAIMS EXPENSE
January 2016 17
TOP TEN CLAIMS EXPENSE• $771 million of total plan expense• 75% of total plan expense• Obesity related
• Diabetes
• Coronary artery disease
• Hypertension
• Musculoskeletal disorders
• Digestive disorders
• High cost specialty drugs required• Rheumatoid arthritis
• Multiple sclerosis
Source: DHRM 2015 Health Benefits Annual Report
26% 25%
5%
12%
2% 2%
29%
15%
8% 7% 7% 7%
30%
27%
6%
14%
6%
3%
35%
18%
10%8% 8%
6%
0%
5%
10%
15%
20%
25%
30%
35%
40%
DEPRESSIVEDISORDERS
ADJUSTMENTDISORDERS
BIPOLARDISORDERS
ANXIETYDISORDERS
CHEMICALDEPENDENCYDISORDERS
PSYCHOTICDISORDERS
Top Behavioral Health ConditionsCOVA Care
FY 2014-2015
2014 %Total Claims 2014 %Total Cost 2015 %Total Claims 2015 %Total Cost

COST DRIVERS
January 2016 18Source: DHRM 2015 Health Benefits Annual Report
9000 9800
11400
41600
45000
0
5,000
10,000
15,000
20,000
25,000
30,000
35,000
40,000
45,000
50,000
$0
$10,000,000
$20,000,000
$30,000,000
$40,000,000
$50,000,000
$60,000,000
$70,000,000
$80,000,000
$90,000,000
FY 2011 FY 2012 FY 2013 FY 2014 FY 2015
Specialty Drug Cost and UseFY 2011-2015
Plan Cost Prescriptions Linear (Plan Cost)
0-29 30-34 35-39 40-44 45-49 50-54 55-59 60-64 65+
2011 $1,551 $2,619 $2,498 $2,805 $3,317 $4,136 $4,908 $6,024 $8,264
2012 $1,667 $2,663 $2,615 $2,951 $3,540 $4,362 $4,957 $6,515 $7,910
2013 $1,751 $2,811 $2,808 $3,290 $3,623 $4,505 $5,393 $6,969 $8,222
2014 $2,394 $3,776 $3,785 $4,486 $5,112 $6,576 $7,657 $9,324 $11,584
2015 $2,669 $3,884 $4,101 $5,089 $5,815 $6,974 $8,875 $10,479 $13,465
$0
$2,000
$4,000
$6,000
$8,000
$10,000
$12,000
$14,000
$16,000Medical Expense By Age
(Per Member)
2015 Medical and Pharmacy Expense
With Pharmacy Medical Only
$648.27
$178.82 $250.20
$344.93
$461.00
$673.17
$857.36
$1,072.83
1,508
36,995
29,791
22,705
29,092
36,706
18,955
7,652
0
5,000
10,000
15,000
20,000
25,000
30,000
35,000
40,000
$0
$200
$400
$600
$800
$1,000
$1,200
<1 1-17 18-29 30-39 40-49 50-59 60-64 65+
COVA Care Medical Expense by AgeFY 2015
Cost per Member per Month Member Count
• Expensive procedures
• Treatment of chronic conditions
• Employee lifestyle
•Average employee age
•Prescription drug therapy cost• 5 times more specialty prescriptions
filled than in 2011
• 2.5 times cost of specialty drugs than
in 2011

COST OF COVERAGE
January 2016 19Source: DHRM 2015 Health Benefits Annual Report
2010 2011 2012 2013 2014
State Employer CostPer Employee
$10,043 $10,431 $11,471 $11,835 $12,883
National LargeGovernment Employer
Cost Per Employee$11,251 $12,042 $12,311 $12,761 $14,198
State Employee Cost $2,666 $2,819 $3,112 $3,611 $3,682
National AverageEmployee Cost
$8,008 $8,584 $9,144 $9,695 $10,473
$0
$2,000
$4,000
$6,000
$8,000
$10,000
$12,000
$14,000
$16,000National and State Average Annual Cost
Per Employer and Employee
*
*
$6,058
$12,037 $9,159
$12,710 $2,313
$3,637
$3,334
$3,643
$0
$2,000
$4,000
$6,000
$8,000
$10,000
$12,000
$14,000
$16,000
$18,000
$20,000
2014 COVAHealthAware
2014 COVA Care 2015 COVAHealthAware
2015 COVA Care
State Cost Per Employee Per PlanCOVA Care and COVA HealthAware*
Employer Cost (includes premium)
Employee Cost (includes out-of-pocket and premium)
*Employee contribution to premium varies by dependent coverage. In general, premium represented 16 percent of total employee cost in 2015.
$8,371
$15,674
$12,493
$16,353
• $16,565 total cost per employee in FY 2015• 8.8% increase from prior year
• COVA Care • $16,353 total cost per employee
• 4.3% higher than prior year
• COVA HealthAware• $12,493 total cost per employee
• 49.2% higher than prior year

PLAN ENROLLMENT AND PREMIUMS
January 2016 20Source: DHRM 2015 Health Benefits Annual Report & Benefits Eligibility data as of December 31, 2015
• Plan Enrollment• 100,615 employees eligible for state health benefits
• 90,428 employees enrolled in all plans
• 197,030 members enrolled in all plans
• Premiums• 16% - employee
• 84% - state
82,60482%
4,8115%
2,1412%
7701%
1020%
10,18710%
Kaiser Permanente HMOWaived Coverage
COVA HDHP
COVA HealthAware
Health Plan Enrollment
FY 2016
TRICARE
COVA Care
$1,002 $1,002 $1,126
$1,321 $1,390
$150 $150
$165
*$220 *$230
$200 $200 $64
$0
$200
$400
$600
$800
$1,000
$1,200
$1,400
$1,600
$1,800
2011 2012 2013 2014 2015
Employer Premium Employee Premium Subsidy
Employee and Employer Share of Total PremiumMonthly Family Coverage
COVA Care
*Premium rewards of $17 and $34 for employee and spouse not reflected

FY 2016 HEALTH BENEFITS
RATES
January 2016 21
PLAN Current Monthly Cost Proposed Monthly Change Proposed Monthly Cost
COVA Care Basic
Employee Only
Employee Plus One
Employee Plus 2 or
More
Employee Only
Employee Plus One
Employee Plus 2 or
More
Employee Only
Employee Plus One
Employee Plus 2 or
More
Employee $59 $141 $201 $0 $0 $0 $59 $141 $201
Employer $543 $973 $1,427 $58 $106 $ 155 $601 $1,079 $1,582
TOTAL PREMIUM
$ 602 $ 1,114 $1,628 $58 $ 106 $155 $660 $1,220 $1,783
COVA HealthAware Basic
Employee Only
Employee Plus One
Employee Plus 2 or
More
Employee Only
Employee Plus One
Employee Plus 2 or
More
Employee Only
Employee Plus One
Employee Plus 2 or
More
Employee $6 $44 $56 ($2) ($2) ($3) $4 $42 $53
Employer $ 543 $973 $ 1,427 $52 $93 $ 136 $595 $1,066 $1,563
TOTAL PREMIUM
$ 549 $ 1,017 $1,483 $50 $91 $133 $599 $1,108 $1,616
• Includes health care reform costs
• Assumes employee and spouse receive Premium Rewards
Source: Aon Hewitt Premium Schedule - November 2015

January 201622
HEALTH INSURANCE FUND
Plan Year End Balances• FY 2009 – $228.4 million
• FY 2012 – $69.4 million
• FY 2013 – $1.8 million
• FY 2014 – $81.8 million
• FY 2015 – $177.7 million
$0
$50,000,000
$100,000,000
$150,000,000
$200,000,000
$250,000,000
2009 2010 2011 2012 2013 2014 2015
Health Insurance Fund
Year End Balances
STATE EMPLOYEE WORKFORCE
January 2016 23

STATE WORKFORCE
EMPLOYMENT LEVEL
STATEWIDE FTEs 6/30/2015
Salaried Employees
• Executive 97,815.00
• Legislative 498.00
• Judicial 3,256.10
• Independent 1,552.00
Total Salaried 103,121.10
Temporary Employees
• Executive 21,339.43
• Legislative 21.08
• Judicial 124.73
• Independent 80.22
Total Temporary 21,565.46
TOTAL EMPLOYEES STATEWIDE 124,686.56
Contractors 5,116.40
TOTAL HUMAN CAPITAL 129,802.96
EXECUTIVE -Secretariat FTEs 6/30/2015
• Executive Offices 489.90
• Administration 744.11
• Natural Resources 1,814.87
• Education 49,841.14
• Health & Human Resources 14,129.78
• Transportation 9,234.25
• Public Safety & Homeland 17,385.54
• Finance 1,097.05
• Commerce & Trade 1,552.95
• Technology 249.50
• Agriculture & Forestry 671.11
• Veterans Affairs 604.80
TOTAL EXECUTIVE SALARIED 97,815.00
• 17% of total employees statewide are wage • 51% Executive Branch employees in Education
Source: DHRM Reports as of June 30 2015January 2016 24
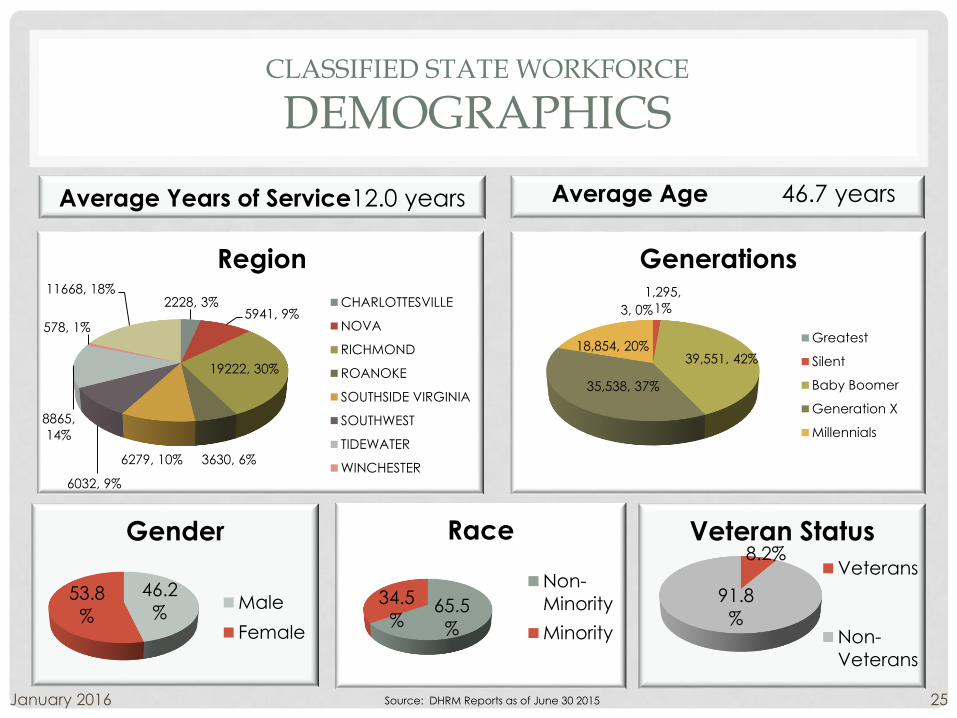
CLASSIFIED STATE WORKFORCE
DEMOGRAPHICS
46.2
%53.8
%
Gender
Male
Female
8.2%
91.8
%
Veteran Status
Veterans
Non-
Veterans
Average Age 46.7 years
Source: DHRM Reports as of June 30 2015January 2016 25
2228, 3%5941, 9%
19222, 30%
3630, 6%6279, 10%
6032, 9%
8865,
14%
578, 1%
11668, 18%
Region
CHARLOTTESVILLE
NOVA
RICHMOND
ROANOKE
SOUTHSIDE VIRGINIA
SOUTHWEST
TIDEWATER
WINCHESTER
Average Years of Service12.0 years
3, 0%
1,295,
1%
39,551, 42%
35,538, 37%
18,854, 20%
Generations
Greatest
Silent
Baby Boomer
Generation X
Millennials
65.5
%
34.5
%
Race
Non-
Minority
Minority

Recruitment
• Vacancy rate 13.9%
• Average vacancy 332 days
• Average time to hire 72 days
• Hire offers accepted 88.8%
• Exceptional recruitment
options 2.9%
• Total recruitments 12,323
• Promotions 13.8%
• Demotions 1.8%
• Transfers 26.7%
• New hires & rehires 57.7%
• Average age new hires 35.2 years
Retention
• Turnover rate 13.2%
• Turnover - probationary 13.8%
• Turnover - < 5 years service 54.1
• Average retention bonus 4.4%
• Employees w/ retention in-
band adjustment increase1.5%
• Avg retention in-band
adjustment increase6.5%
• Eligible retirement today 11.7%
• Eligible retirement ≤ 5 years 25.4%
• Retirement rate 3.3%
CLASSIFIED STATE WORKFORCE
RECRUITMENT & RETENTION
January 2016 26Source: DHRM Reports as of June 30 2015

VOLUNTARY TURNOVER
•Voluntary turnover is trending up
•Voluntary turnover average age is trending down
•Millennials voluntarily resign at a
higher rate than other
generations
January 2016 27

STATE WORKFORCE
WORK LIFE BALANCE
ANNUAL LEAVE
• Average annual leave earned 115.3 hours
• Average annual leave used 96.7 hours
• Average annual leave lost 3.3 hoursJanuary 2016 28Source: DHRM Reports as of June 30 2015

STATE WORKFORCE
SALARIED FULL-TIME EMPLOYEES RECEIVING FEDERAL ASSISTANCE
• Number of employees receiving assistance
2015 1,215 employees
2013 2,287 employees
2011 892 employees
2007 < 12 employees*
• Number of employees receiving food stamps
2015 896 employees
2013 1,898 employees
2011 856 employees
2007 0 employees
•Number of employees qualifying for EITC
2015 9.5% of salaried full-time employees
2013 10% of salaried full-time employees
• Change over time
Poor economy and lack of employee raises
have taken a toll on state employees
2.6% increase in eligibility threshold from 2010
to 2013
* Received temporary assistance because they had
legal guardianship of grandchildren, and otherwise
would not meet benefits eligibility criteria
January 2016 29Source: DHRM Reports May 2014
856
97 12
1,898
729
88
575
896
598
200
500
1000
1500
2000
SNAP Medicaid TANF Energy
Assistance
State EmployeesReceiving Federal Assistance
2011
2013
2015
9,125 9,621 9,501
-
2,000
4,000
6,000
8,000
10,000
12,000
CY 2010 CY 2013 CY 2015
State EmployeesQualifying for Earned Income Tax Credits

STATE EMPLOYEE COMPENSATION
January 2016 30

COMPENSATION
GOAL & POLICIES
COMPENSATION GOAL• Pay employees fairly and consistently for jobs they perform
• Sufficient to attract, retain, and motivate the Commonwealth workforce
• General Assembly adopted goal of bringing state employees to market rate by 2010
COMPENSATION POLICIES
• Market Rate – established in 2000 by General Assembly as compensation policy
• Pay for Performance – formula driven increase based on individual/team performance
• Pay Practices – practices available to address agency issues
• Base Pay – continues over time
• Non-Base Pay – lump sum payment, leave or non-monetary item
• Exceptional Recruitment & Retention Incentive Options - used for significant recruitment and retention problems critical for agency mission
• Pay Factors – uses 13 pay factors when setting pay
• Agency Business Need •Work Experience & Education
• Internal Salary Alignment • Total Compensation
• Duties & Responsibilities • Knowledge, Skills, Abilities & Competencies
• Market Availability • Budget Implications
• Long Term Impact • Training, Certification, & License
• Performance • Salary Reference Data
• Current Salary
January 2016 31
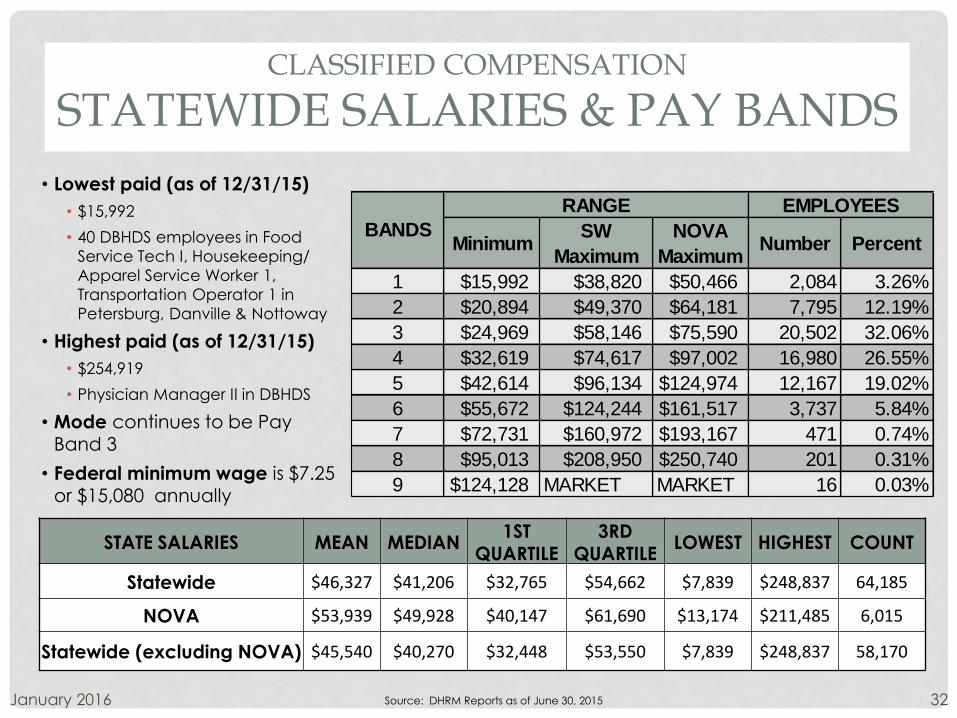
CLASSIFIED COMPENSATION
STATEWIDE SALARIES & PAY BANDS
January 2016 32Source: DHRM Reports as of June 30, 2015
STATE SALARIES MEAN MEDIAN1ST
QUARTILE3RD
QUARTILELOWEST HIGHEST COUNT
Statewide $46,327 $41,206 $32,765 $54,662 $7,839 $248,837 64,185
NOVA $53,939 $49,928 $40,147 $61,690 $13,174 $211,485 6,015
Statewide (excluding NOVA) $45,540 $40,270 $32,448 $53,550 $7,839 $248,837 58,170
• Lowest paid (as of 12/31/15)
• $15,992
• 40 DBHDS employees in Food
Service Tech I, Housekeeping/
Apparel Service Worker 1,
Transportation Operator 1 in
Petersburg, Danville & Nottoway
• Highest paid (as of 12/31/15)
• $254,919
• Physician Manager II in DBHDS
• Mode continues to be Pay Band 3
• Federal minimum wage is $7.25 or $15,080 annually
MinimumSW
Maximum
NOVA
MaximumNumber Percent
1 $15,992 $38,820 $50,466 2,084 3.26%
2 $20,894 $49,370 $64,181 7,795 12.19%
3 $24,969 $58,146 $75,590 20,502 32.06%
4 $32,619 $74,617 $97,002 16,980 26.55%
5 $42,614 $96,134 $124,974 12,167 19.02%
6 $55,672 $124,244 $161,517 3,737 5.84%
7 $72,731 $160,972 $193,167 471 0.74%
8 $95,013 $208,950 $250,740 201 0.31%
9 $124,128 MARKET MARKET 16 0.03%
RANGE EMPLOYEES
BANDS

COMPENSATIONSELECTED LOCALITIES
BASE SALARY ADJUSTMENT
BASE SALARY INCREASES
Locality FY-04 FY-05 FY-06 FY-07 FY-08 FY-09 FY-10 FY-11 FY-12 FY-13 FY-14 FY-15
Richmond City 3.00% 3.00% 3.00% 3.00% 3.00% 3.00% 0.00% 0.00% 0.00% 0.00% 2.00% 0.00%
Charlottesville 3.50% 3.00% 4.00% 4.00% 4.00% 4.00% 0.00% 2.00% 0.00% 2.00% 2.00% 2.00%
Montgomery County 2.50% 5.50% 4.80% 2.50% 6.77% 5.50% 0.00% 3.00% 2.00% 1.00%
Fairfax County 4.00% 4.32% 4.37% 4.40% 4.98% 4.98% 0.00% 2.00% 4.70% 0.00% 2.29%
Chesterfield County 2.50% 4.00% 3.00% 4.00% 5.25% 4.00% 0.00% 0.00% 2.00% 1.00% 1.00% 1.00%
Norfolk 4.00% 4.00% 4.00% 4.50% 4.50% 3.50% 0.00% 0.00% 0.00% 2.00% 2.00%
Chesapeake 3.00% 3.00% 4.00% 4.00% 4.50% 3.00% 0.00% 1.50% 1.50% 0.00% 1.60% 3.00%
Virginia Beach 6.00% 5.00% 6.50% 4.50% 3.50% 2.50% 0.00% 0.00% 2.50% 1.00% 3.00% 1.66%
Albemarle County 3.19% 4.40% 3.95% 4.00% 3.35% 0.00% 0.00% 0.00% 0.00% 1.00% 2.00% 2.30%
Augusta County 4.00% 4.00% 4.00% 3.83% 3.06% 3.06% 0.00% 0.00% 0.00% 4.00%
Locality Average 3.31% 3.85% 3.90% 3.78% 4.40% 3.35% 0.00% 0.35% 1.10% 1.37% 1.86% 1.75%
State Employees 2.25% 3.00% 4.40% 4.50% 4.00% 0.00% 0.00% 5.00% 0.00% 0.00% 2.00% 0.00%
January 2016 33
State 5% increase in FY 11 was offset by 5% contribution to VRS
Source: DHRM Survey

COMPENSATION
STATE SALARIES
January 2016 34
Year
CPI %
Change
Cumulative
CPI%
Change
Salary
Increase
% Change
Cumulative
Salary
Increase %
Change
2000 3.4 3.4 3.25 3.25
2001 2.8 6.2 0.00 3.25
2002 1.6 7.8 0.00 3.25
2003 2.3 10.1 2.25 5.50
2004 2.7 12.8 3.00 8.50
2005 3.4 16.2 4.40 12.90
2006 3.2 19.4 4.00 16.90
2007 2.8 22.2 4.00 20.90
2008 3.8 26.0 0.00 20.90
2009 -0.4 25.6 0.00 20.90
2010 1.6 27.2 0.00 20.90
2011 3.2 30.4 5.00 25.90
2012 2.1 32.5 0.00 25.90
2013 1.5 34.0 2.73 28.63
2014 1.6 35.6 0.00 28.63
2015 0.1 35.7 3.86 32.49
• State employees wages have been lower than all other sectors since 2003
• Take home pay increased 8/10/15 for the first time since 2007• 2011 increase of 5% was offset by the 5% employee contribution to VRS• 2013 increase of 2.73% was offset by the payroll tax
• Buying power has decreased since 2000
100
110
120
130
140
150
160
170
180
190
200
19
97
19
98
19
99
20
00
20
01
20
02
20
03
20
04
20
05
20
06
20
07
20
08
20
09
20
10
20
11
20
12
20
13
20
14
20
15
Average Weekly Wage
Federal State Local Private

COMPENSATION
NATIONAL PAY RANKING OF STATES
Source: 2014 Bureau of Labor Statistics data based on payroll records of what is actually paid out to employees as reported quarterly to employment commissionsJanuary 2016 35
Agv
Annual
Pay
State
Ranking
Agv
Annual
Pay
State
Ranking
Agv
Annual
Pay
State
Ranking
Agv
Annual
Pay
State
Ranking
State Avg
as % of
Private
Avg
State
Ranking
Alabama 77,550 4 49,728 26 38,371 32 42,359 37 117% 14
Alaska 76,174 8 56,624 13 47,660 12 52,625 12 108% 25
Arizona 70,362 24 53,853 18 43,456 20 46,541 21 116% 17
Arkansas 64,303 40 42,591 46 36,055 45 39,720 46 107% 26
California 76,502 6 69,810 1 57,954 3 58,507 5 119% 13
Colorado 74,184 11 56,656 12 43,756 19 53,070 11 107% 31
Connecticut 71,978 19 65,894 4 53,741 7 64,813 2 102% 44
Delaware 68,187 29 52,503 22 50,202 11 53,260 9 99% 41
Florida 70,848 22 46,272 36 46,666 16 44,057 30 105% 35
Georgia 71,007 20 42,972 45 38,254 33 48,841 18 88% 50
Hawaii 72,562 18 47,314 33 59,712 2 42,583 36 111% 27
Idaho 63,408 43 42,143 47 32,593 49 37,962 48 111% 19
Illinois 73,274 13 66,681 3 47,497 15 54,286 7 123% 8
Indiana 67,777 30 45,409 39 36,649 42 42,719 35 106% 28
Iowa 60,206 48 63,884 5 38,784 31 41,972 39 152% 1
Kansas 63,430 42 49,786 25 33,124 47 43,530 33 114% 20
Kentucky 61,772 45 44,466 42 37,696 36 41,783 40 106% 29
Louisiana 67,145 32 47,960 31 37,622 37 45,792 24 105% 30
Maine 69,576 27 41,810 49 36,937 40 39,967 45 105% 32
Maryland 94,156 1 54,685 17 52,046 9 53,139 10 103% 40
Massachusetts 75,549 9 62,465 7 55,867 6 64,732 3 96% 43
Michigan 72,719 16 59,107 10 44,533 17 48,090 19 123% 7
Minnesota 67,750 31 59,350 9 44,250 18 51,958 15 114% 18
Mississippi 64,906 39 43,832 44 33,407 46 36,501 50 120% 10
Missouri 64,919 37 40,683 50 37,780 35 44,700 28 91% 47
State
Federal Government State Gov Local Gov Private Industry

Source: 2014 Bureau of Labor Statistics data based on payroll records of what is actually paid out to employees as reported quarterly to employment commissions
COMPENSATION
NATIONAL PAY RANKING OF STATES
Virginia Pay Ranking
• 2nd in Federal Government • same as 2010, 2011, 2012, & 2013
• 13th in Private Industry • Down from 11th in 2013 & 2012, 9th in 2011 &
8th in 2010
• 25th in Local Government • Down from 24th in 2013 and 23rd in 2010
and same as 2012, & 2011& down from
23rd in 2010
• 34th in State Government • Down from 33rd in 2013 & 32nd in 2012 &,
2010 and same as 2011
• 49th in State average as a percent of Private average
• Same as 2013 & down from 47th in 2012, &
48th in 2010 & 2011
January 2016 36
Agv
Annual
Pay
State
Ranking
Agv
Annual
Pay
State
Ranking
Agv
Annual
Pay
State
Ranking
Agv
Annual
Pay
State
Ranking
State Avg
as % of
Private
Avg
State
Ranking
Montana 63,252 44 44,572 41 36,973 39 37,866 49 118% 11
Nebraska 64,046 41 48,435 30 39,415 29 40,642 42 119% 9
Nevada 66,999 33 48,548 29 52,373 8 43,536 32 112% 24
NewHampshire 74,805 10 48,716 28 42,894 22 51,810 16 94% 45
NewJersey 76,198 7 67,460 2 59,917 1 60,171 4 112% 23
NewMexico 70,870 21 50,684 24 36,605 43 40,748 41 124% 6
NewYork 73,858 12 59,960 8 56,778 4 67,182 1 89% 48
NorthCarolina 65,086 36 46,518 35 40,722 26 45,028 27 103% 33
NorthDakota 60,269 47 51,050 23 37,188 38 52,079 14 98% 42
Ohio 72,745 15 58,751 11 43,351 21 45,482 25 129% 3
Oklahoma 66,390 34 44,648 40 36,298 44 44,089 29 101% 37
Oregon 69,775 26 47,470 32 47,655 13 45,910 23 103% 36
Pennsylvania 70,474 23 56,236 14 47,560 14 50,306 17 112% 21
RhodeIsland 78,821 3 63,223 6 55,980 5 47,457 20 133% 2
SouthCarolina 64,915 38 44,466 42 40,228 27 40,165 44 111% 22
SouthDakota 59,798 50 45,412 38 31,894 50 38,628 47 118% 12
Tennessee 77,134 5 46,127 37 38,237 34 45,330 26 102% 38
Texas 72,879 14 52,900 20 42,584 24 54,217 8 98% 46
Utah 65,522 35 48,755 27 32,964 48 42,996 34 113% 16
Vermont 69,254 28 52,730 21 39,047 30 42,165 38 125% 5
Virginia 87,246 2 47,174 34 42,379 25 52,563 13 90% 49
Washington 72,715 17 55,753 16 51,747 10 54,897 6 102% 39
WestVirginia 69,985 25 42,009 48 36,898 41 40,496 43 104% 34
Wisconsin 61,471 46 56,218 15 40,089 28 43,646 31 129% 4
Wyoming 60,090 49 52,928 19 42,862 23 46,411 22 114% 15
State
Federal Government State Gov Local Gov Private Industry

COMPENSATION
MARKET
January 2016 37
•Average Structure Adjustments
• FY15 Actual 1.98%
• FY16 Forecast 1.98%
•Average Performance Increase
• FY15 Market movement 2.66%
• FY16 Forecast 2.66%
• FY16 Projected State Deviation -23.38%
Source: 2015 DHRM Annual Salary Report
• State salaries for certain positions
deviate from the private sector
on average by – 21.2%
Occupation
Private Industry Average
Salary
Average Virginia
Employee SalaryDeviation
Attorney 145,224 80,138 -81.20%
Environmental Engineer 108,012 67,748 -59.40%
Marketing Specialist 84,355 54,018 -56.20%
Generic Engineer Supv 160,631 110,279 -45.70%
Accountant 83,604 60,405 -38.40%
Internal Auditor 83,604 60,405 -38.40%
Systems Analysis Supv 104,677 78,061 -34.10%
Chemist 89,957 67,145 -34.00%
Employee Training Specialist 74,073 58,297 -27.10%
Truck Driver, Light 29,449 23,639 -24.60%
HR Admin Supv 133,300 107,287 -24.20%
Laboratory Aide 52,810 43,330 -21.90%
Data Base Administrator 96,713 83,431 -15.90%
Security Guard, Unarmed 33,823 29,725 -13.80%
Maintenance Electrician 50,575 46,155 -9.60%
Yard Laborer/Janitorial Supv 32,758 30,519 -7.30%
Staff RN 67,698 64,009 -5.80%
Cook 26,865 25,581 -5.00%
Physical Therapist 90,254 88,323 -2.20%
Architect 87,924 86,412 -1.80%
Medical Lab Tech 58,824 58,037 -1.40%
Mail Clerk 28,761 28,582 -0.60%
Secretary 36,417 37,171 2.00%
Social Worker (MSW) 47,716 52,221 8.60%
Cashier 26,304 28,821 8.70%
Average -21.20%

STATE EMPLOYEE INFORMATION TECHNOLOGY
38January 2016

INFORMATION TECHNOLOGY
PMIS MIGRATION PROJECT
• What: Migrate all DHRM’s systems running on the Unisys
Mainframe to a modern environment by July 1, 2016
• Why: Money and people• Cost Avoidance - ~ $15 million in new charges annually for full cost of
mainframe if DHRM is the sole user of the system
• Staffing Issues – 80% of the Unisys mainframe systems are eligible for retirement
and there is a dwindling pool of resources that can support the system
• Who: Procure vendor services to translate the system from its legacy technologies to modern ones
• When: Executed statement of work in February 2015 and transition
from Unisys mainframe to new environment by June 2016
• How Much: $2.72 million appropriated in FY15 and $2.72 million in
FY16, with unused FY15 funds needed in FY16
• Status: Budget – Scope – Schedule –
January 2016 39

INFORMATION TECHNOLOGY
TIME, ATTENDANCE & LEAVE
January 2016 40
• Delivered on time and on budget
• Went live on April 25, 2013 as scheduled
• Cost $702,923 for in-house development, which was on budget
• Customers
• Phased rollout
• 50 agencies with 13,998 employees
as of January 2015
• Additional 8 agencies with 1,730
employees scheduled through June 2015
• First college with over 1200 employees
• Other agencies are considering system
• Awards
• 2014 Governor’s Technology Award – IT as Efficiency Driver – Government to Government
• 2014 VITA Project Management Summit – Project Excellence Award – 1st Place

• Training shared within and across agencies
29,534 classes provided last year
Delivers mandatory training to all state agencies
Provides a more efficient and effective method of maximizing training at
an acceptable cost
• Customers
243 participating state agencies
54 nonparticipating agencies
134,982 state employees subscribed
60,755 state employees accounts with frequent activity
249,913 other subscribed users
• Funding
Hosted fee charged to participating agencies
Proposed Budget provides for additional staff and one-time software
upgrades
January 2016 41
INFORMATION TECHNOLOGY
COMMONWEALTH OF VIRGINIA KNOWLEDGE CENTER