Embed Size (px)
Citation preview
73State Employees’ Retirement System of Illinois
State Employees’ Retirement System of Illinois
Comprehensive Annual Financial Report for the Fiscal Year Ended June 30, 2012
A Pension Trust Fund of the State of Illinois
The Illinois Old State Capitol
72 State Employees’ Retirement System of Illinois
State Employees’ Retirement System of Illinois2101 South Veterans Parkway, P. O. Box 19255Springfield, Illinois 62794-9255Phone 217-785-7444 • Fax 217-785-7019Internet: http://www.state.il.us/srsEmail: [email protected]
Mission Statement
To provide an orderly means whereby aged or disabled employees may retire from active service, without hardship or prejudice, and to enable
them to accumulate reserves for themselves and their dependents for old age, disability, death and termination of employment, thus affecting the
economy and efficiency in the administration of State government.
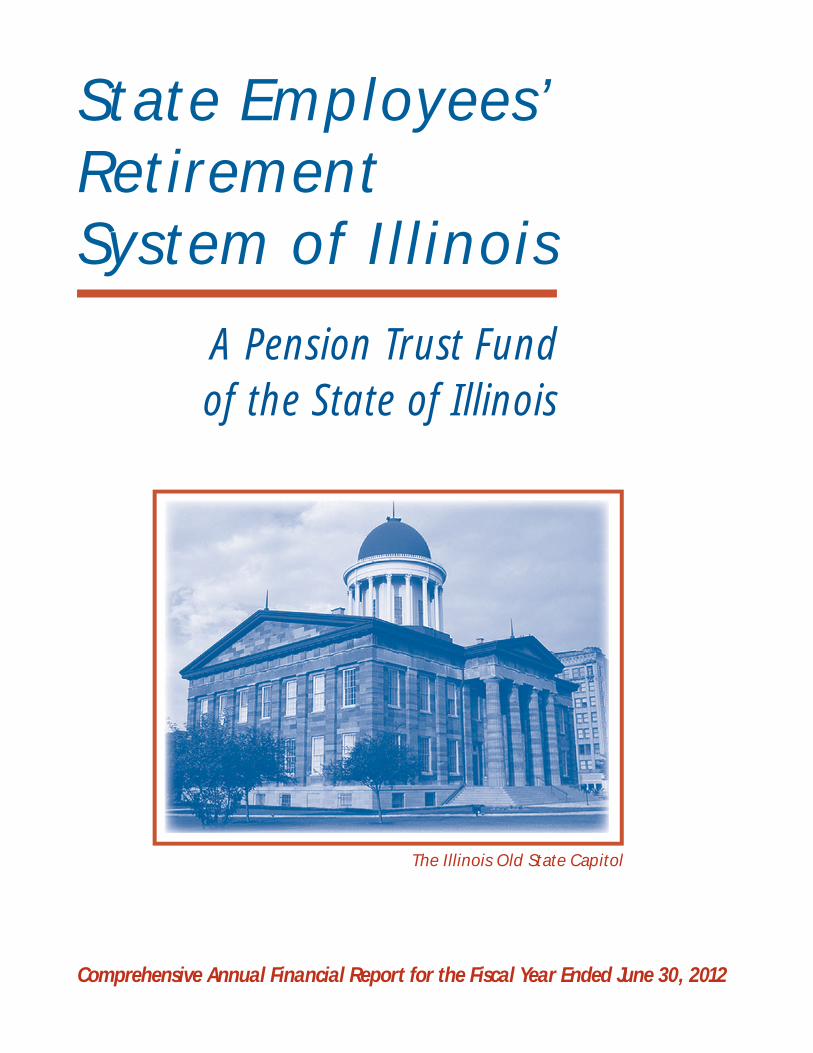
Fiscal Year 2012 Highlights
85,373 Total Membership 62,732 Active Contributing Members Net Assets Held in Trust for $10,960,687,824 Pension Benefi ts, fair value Contributions $259,122,881 Employees $1,391,416,375 Employer
$5,975,369 Investment Income 0.10% Investment Return
Benefit Recipients 50,000 Retirement Annuities 10,502 Survivors’ Annuities 2,286 Disability Benefi ts
$1,627,373,601 Benefi ts Paid
$33,091,186,194 Actuarial Accrued Liability $11,477,264,329 Actuarial Value of Assets $21,613,921,865 Unfunded Actuarial Liability
34.7% Funded Ratio
On the Cover
Th e Old State Capitol is a Greek Revival-style building that served as Illinois’ fi fth statehouse, the fi rst to be located in Springfi eld. Th e building was the seat of state government and a center of Illinois political life from 1839 to 1876. During the dramatic years leading up to the Civil War, the building had an important role in the political struggle between Stephen Douglas and Abraham Lincoln. Lincoln visited the building frequently as both a lawyer and politician, serving in the build-ing during his last term in the Illinois House of Representatives and delivering the famous 1858 “House Divided” speech in Representatives Hall. Th e building was also the scene of the assassinated President’s fi nal laying-in-state on May 3-4, 1865. Th e Capitol was completely reconstructed in the 1960s and in 1961 the building was designated a National Historic Landmark and in 1966 was listed on the National Register of Historic Places.
1 State Employees’ Retirement System of Illinois
STATE EMPLOYEES’ RETIREMENT SYSTEM OF ILLINOIS
A Pension Trust Fund of the State of Illinois
COMPREHENSIVE ANNUAL FINANCIAL REPORTFOR THE FISCAL YEAR ENDED JUNE 30, 2012
STATE EMPLOYEES’ RETIREMENT SYSTEM OF ILLINOIS
2101 South Veterans ParkwayP. O. Box 19255 Springfield, Illinois 62794-9255
Prepared by the Accounting Division
Printed by Authority of the State of Illinois 350/$2.96 ea/12/12 Printed on Recycled Paper

2 State Employees’ Retirement System of Illinois
TABLE OF CONTENTS
INTRODUCTORY SECTION ........................................ 3 Letter of Transmittal ........................................................... 4 Board of Trustees and Administrative Staff .........................7 Certificate of Achievement for Excellence in Financial Reporting .........................................................8
FINANCIAL SECTION....................................................9 Independent Auditors’ Report ......................................10 Management’s Discussion and Analysis .......................12 Financial Statements: Statements of Plan Net Assets ......................................14 Statements of Changes in Plan Net Assets ...................15 Notes to Financial Statements ......................................16
Required Supplementary Information: Schedule of Funding Progress ......................................37 Schedule of Employer Contributions ............................37 Notes to Required Supplementary Information ...........37
Supplementary Financial Information: Summary of Revenues by Source .................................38 Summary Schedule of Cash Receipts and Disbursements ...................................................38 Schedule of Payments to Consultants and Advisors ....................................................................38
INVESTMENT SECTION ..............................................39 Investment Report ....................................................... 40 Investment Portfolio Summary (Asset Allocation) .......43 Analysis of Investment Performance ........................... 44 Additional Investment Information ............................. 44 ACTUARIAL SECTION .................................................45 Actuary’s Certification Letter ....................................... 46 Introduction ................................................................. 48 Actuarial Cost Method and Summary of Major Actuarial Assumptions ............................................. 49 Summary of and Changes to the Plan Provisions ........ 50 Short-Term Solvency Test..............................................50 Valuation Results ......................................................... 51
Computed Actuarial Values (in thousands of dollars).... 51 Reconciliation of Unfunded Actuarial Liability .............. 52 Summary of Accrued and Unfunded Accrued Liabilities (Analysis of Funding) ................................ 53 Schedule of Active Member Valuation Data ................. 53 Schedule of Retirants Added To & Removed From Rolls .................................................................. 54 Schedule of Survivors’ Annuitants Added to and Removed From Rolls .................................................. 54 Schedule of Disability Recipients Added to and Removed From Rolls .................................................. 54 STATISTICAL SECTION ................................................. 55 Asset Balances ................................................................ 56 Liabilities and Reserve Balances .................................... 56 Changes in Net Assets ................................................... 57 Total Membership - Coordinated/Noncoordinated .................................. 58 Active Membership - Coordinated/Noncoordinated .................................. 58 Number of Recurring Benefit Payments/ Termination Refunds .................................................. 59 Retirement Annuities - Average Monthly Benefit for Current Year Retirees by Type ...............................60 Retirement Annuities - Current Age of Active Recipients ..................................................................60 Retirement Annuities - Average Service (in months) for Current Year Retirees at Effective Date of Benefit ...................................................................60 Annuitants by Benefit Range (Monthly) ....................... 61 Widow’s and Survivors’ by Benefit Range (Monthly) .................................................................. 61 Occupational and Non-Occupational (Incl. Temp.) Disabilities by Benefit Range (Monthly) ................... 61 Active Retirees by State .................................................. 61 Average Benefit Payments ............................................. 62
PLAN SUMMARY AND LEGISLATIVE SECTION ........... 63

3 State Employees’ Retirement System of Illinois
INTRODUCTORY SECTION
4 State Employees’ Retirement System of Illinois
January 9, 2013
The Board of Trustees and MembersState Employees’ Retirement System of IllinoisSpringfield, IL 62794
Dear Board and Members:
The comprehensive annual financial report of the State Employees’ Retirement System of Illinois (Sys-tem) as of and for the fiscal year ended June 30, 2012 is hereby submitted. Responsibility for both the accuracy of the data and the completeness and fairness of the presentation, including all disclosures, rests with the System.
To the best of our knowledge and belief, the enclosed data are accurate in all material respects and are reported in a manner designed to present fairly the financial position and results of operations of the various funds of the System. All disclosures necessary to enable the reader to gain an understanding of the System’s financial activities have been included.
Generally accepted accounting principles require that management provide a narrative introduction, over-view, and analysis to accompany the basic financial statements in the form of Management’s Discussion and Analysis (MD&A). This letter of transmittal is designed to complement MD&A and should be read in conjunction with it. The System’s MD&A can be found immediately following the report of the inde-pendent auditors.
The report consists of six sections:
1. The Introductory Section contains this letter of transmittal and the identification of the administra-tive organization and the Certificate of Achievement for Excellence in Financial Reporting;
2. The Financial Section contains management’s dis-cussion and analysis, the report of the Independent Auditors, the financial statements of the System, and certain required and other supplementary financial information;
3. The Investment Section contains a summary of the System’s investment management approach and selected summary tables, including investment performance;
4. The Actuarial Section contains an Actuary’s Certi-fication Letter and the results of the annual actuarial valuation;
5. The Statistical Section contains significant statisti-cal data;
6. The Plan Summary and Legislative Section con-tains a summary of the System’s plan provisions and current legislative changes.
Generally accepted accounting principles require that the financial reporting entity include:1. the primary government; 2. organizations for which the primary govern- ment is financially accountable; and3. other organizations for which the nature and significance of their relationship with the primary government are such that exclusion would cause the reporting entity’s financial statements to be misleading or incomplete.
Based on the criteria of the Governmental Account-ing Standards Board Statement No. 14, there are no other state agencies, boards or commissions, or other organizations required to be combined with the System. The System is considered to be part of the State of Illinois financial reporting entity, and is to be combined and included in the State of Illinois’ comprehensive annual financial report.
Although the State Employees’ Retirement System, Judges’ Retirement System and General Assembly Re-tirement System share a common administration, they are separate entities for legal and financial reporting purposes. Therefore, the financial statements of the State Employees’ Retirement System do not include plan net asset information nor the changes in plan net assets of the General Assembly Retirement System or Judges’ Retirement System.
PLAN HISTORY & SERVICES PROVIDEDThe System is the administrator of a single-employer public employee retirement system established to pro-vide pension benefits for State of Illinois employees. The System also administers widows and survivors benefits as well as the state’s occupational and non-occupational disability programs.
L E T T E R O F T R A N S M I T T A L
• State Employees’ Retirement System of Illinois • General Assembly Retirement System• Judges’ Retirement System of Illinois
STATE RETIREMENT SYSTEMS
2101 South Veterans Parkway, P.O. Box 19255, Springfield, IL 62794-9255 217-785-7444
5 State Employees’ Retirement System of Illinois
The System was established January 1, 1944 and 17,237 state employees became members on that date. As of June 30, 1944, net assets of the System amounted to $1,255,778. The fair value of plan net assets at the end of the fiscal year June 30, 2012 are approximately $11.0 billion, and there are 62,732 active members.
INVESTMENTSThe System’s investments are managed by the Illinois State Board of Investment (ISBI) pursuant to Chapter 40, Article 5/22A of the Illinois Compiled Statues, using the “prudent person rule”.
This rule states that fiduciaries shall discharge their duties solely in the interest of the fund participants and beneficiaries and with the degree of diligence, care and skill which prudent men and women would ordinarily exercise under similar circumstances in a like position.
The ISBI maintains a wide diversification of invest-ments within this fund which is intended to reduce overall risk and increase returns. As further detailed in the Investment Section, the ISBI Commingled Fund had a gain of 0.10%, net of expenses, for the fiscal year ended June 30, 2012.
FUNDINGFunding is the process of specifically allocating monies for current and future use. Proper funding includes an actuarial review of the fund balances to ensure that funds will be available for current and future benefit payments. The greater the level of funding, the larger the ratio of accumulated assets to the actuarial accrued liability and the greater the level of investment potential.
The funding plan for the System, enacted in 1994 with subsequent modifications, requires that state contributions be paid to the System so that by the end of fiscal year 2045, the ratio of the actuarial value of assets to the actuarial accrued liability will be 90%. For fiscal years 2011 through 2045, the required state contributions are to be computed as a level percent-age of participant payroll.
For fiscal years up through 2010, the required state contributions, except for fiscal years 2006 and 2007, were to be increased incrementally as a percentage of the participant payroll so that by fiscal year 2011 the state is contributing at the required level con-tribution rate to achieve the financing objective by the end of fiscal year 2045. For fiscal years 2012 and
2011, the state contributed the appropriate amount as required by law. The funding legislation also provides for the establish-ment of a continuing appropriation of the required state contributions to the System. This has, in effect, removed the appropriation of these funds from the annual budgetary process.
The actuarial determined liability of the System using the projected unit credit actuarial method at June 30, 2012, amounted to $33.091 billion. The actuarial value of assets amounted to $11.477 billion resulting in an unfunded accrued actuarial liability of $21.614 billion as of the same date. A detailed discussion of funding is provided in the Actuarial Section of this report.
MAJOR EVENTS/ INITIATIVESThe operational plan for FY12 included: moderniza-tion efforts including, the implementation of an imaging system and a reengineering of the business functions of the active member system.
New projects for FY13 include: modernization efforts continue and include implementation of a new Active Member Inquiry System, continued re-engineering of accounting and financial processes, establishment of a web presence to allow member services to be made available through the internet and the completion of the conversion of over eight million member file documents to the imaging system.
ACCOUNTING SYSTEM & INTERNAL CONTROLThis report has been prepared to conform with the principles of governmental accounting and reporting pronounced by the Governmental Accounting Stan-dards Board and the American Institute of Certified Public Accountants.
The accrual basis of accounting is used to record the financial transactions and activities of the System. Revenues are recognized in the accounting period in which they are earned, without regard to the date of collection, and expenses are recognized when the corresponding liabilities are incurred, regardless of when payment is made.
The System also uses the State of Illinois, Statewide Accounting Management System (SAMS) as a basis for the preparation of the financial statements. In developing the System’s accounting system, consider-ation is given to the adequacy of internal accounting controls. These controls are designed to provide rea-
L E T T E R O F T R A N S M I T T A L

6 State Employees’ Retirement System of Illinois
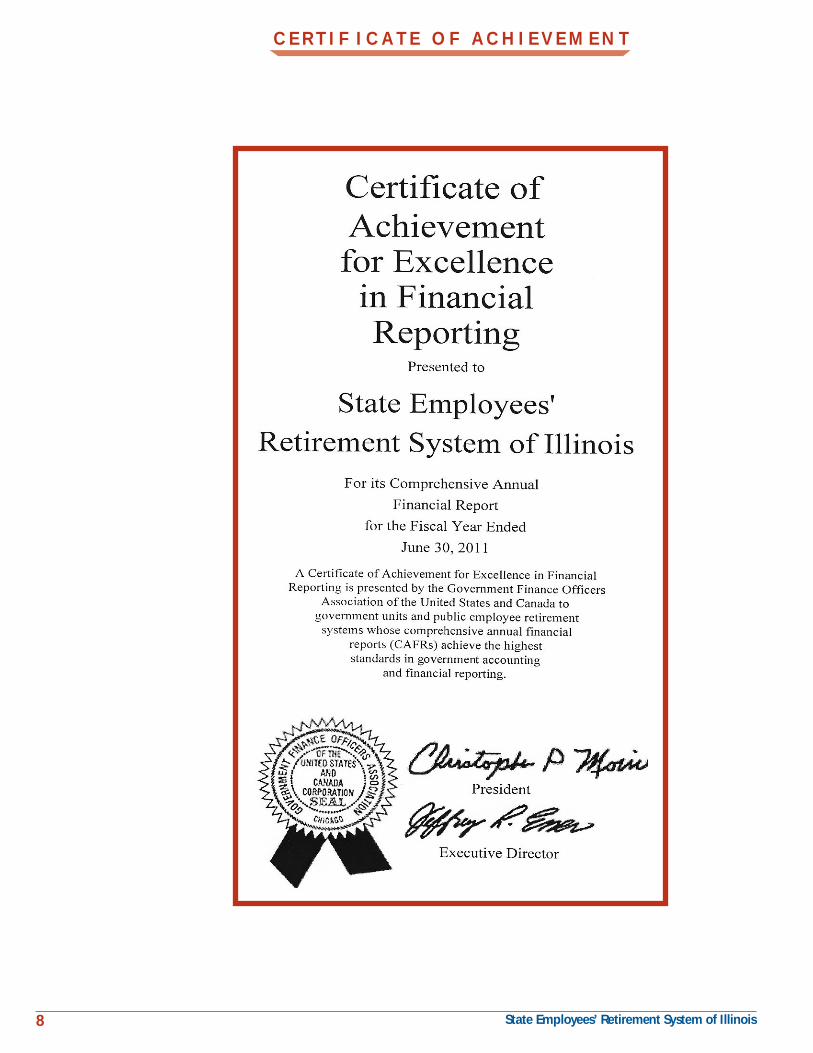
To be awarded a Certificate of Achievement, a gov-ernmental unit must publish an easily readable and efficiently organized CAFR, whose contents meet or exceed program standards. This report must satisfy both generally accepted accounting principles and applicable legal requirements.
A Certificate of Achievement is valid for a period of one year only. The State Employees’ Retirement Sys-tem of Illinois has received a Certificate of Achieve-ment for the past twenty-six consecutive years (fiscal years ended June 30, 1986 through June 30, 2011).
We believe our current report continues to conform to the Certificate of Achievement program requirements, and we are submitting it to the GFOA to determine its eligibility for another certificate.
ACKNOWLEDGMENTS & COMMENTSThe preparation of this report reflects the combined efforts of the System’s staff under the direction of the Board of Trustees. It is intended to provide com-plete and reliable information as a basis for making management decisions, as a means of determining compliance with legal provisions, and for determining responsible stewardship for the assets contributed by the members in the State of Illinois. On behalf of the Board of Trustees, we would like to express our appreciation to the staff and professional consultants who worked so effectively to ensure the successful operation of the System.
Respectfully submitted,
L E T T E R O F T R A N S M I T T A L
sonable assurance regarding the safekeeping of assets and the reliability of financial records. The concept of reasonable assurance recognizes that the cost of a control should not exceed the benefits likely to be derived and that the valuation of costs and benefits requires estimates and judgements by management. Constant effort is directed by the System at improving this level to assure the participants of a financially sound retirement system.
PROFESSIONAL SERVICESIndependent consultants are retained by the Board of Trustees to perform professional services that are essential to the effective and efficient operation of the System. Actuarial services are provided by Gabriel, Roeder, Smith & Co., Chicago, Illinois.
The annual financial audit of the System was con-ducted by the accounting firm of BKD, LLP, under the direction of the Auditor General of the State of Illinois. In addition to the annual financial audit, a compliance attestation examination is also performed by the auditors.
The purpose of the compliance attestation examina-tion was to determine whether the System obligated, expended, received and used public funds of the state in accordance with the purpose for which such funds have been authorized by law. The System’s investment function is managed by the Illinois State Board of Investment.
CERTIFICATE OF ACHIEVEMENT
The Government Finance Officers Association of the United States and Canada (GFOA) awarded a Certificate of Achievement for Excellence in Financial Reporting to the State Employees’ Retirement System of Illinois for its comprehensive annual financial re-port for the fiscal year ended June 30, 2011.
The Certificate of Achievement is a prestigious na-tional award recognizing excellence in the prepara-tion of state and local government financial reports.
Timothy B. Blair Executive Secretary
Nicholas C. Merrill, Jr., CPAChief Fiscal Officer
7 State Employees’ Retirement System of Illinois
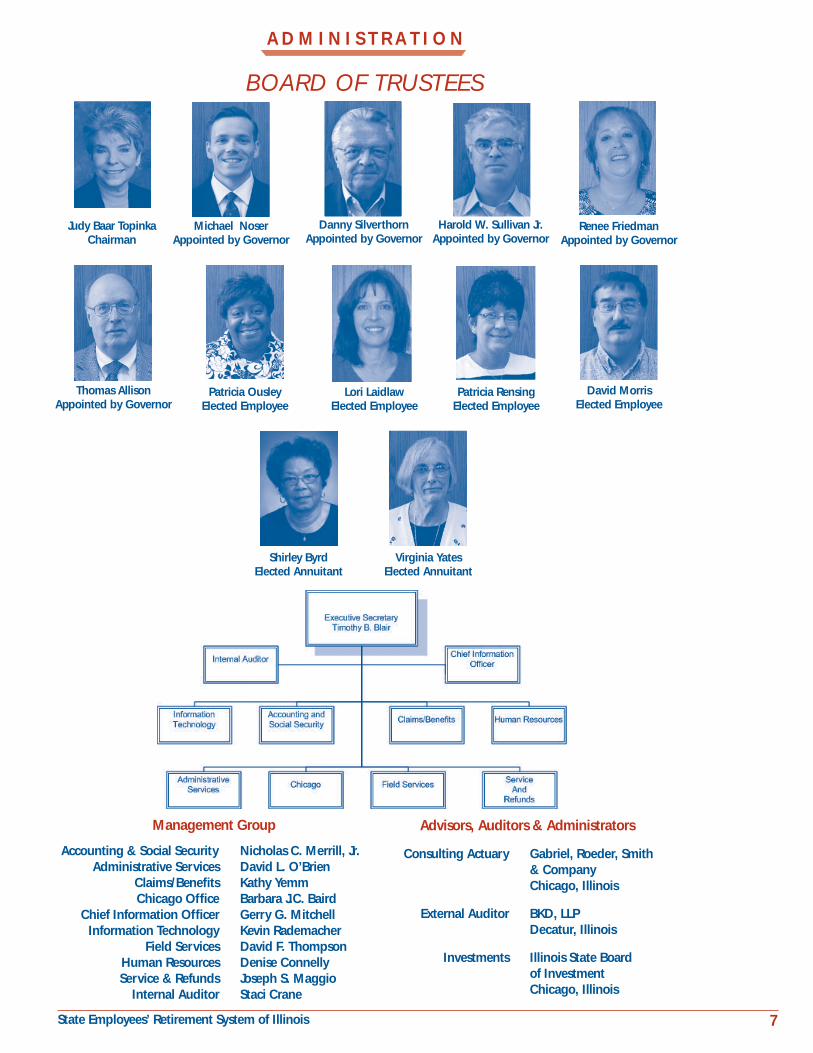
Management Group
Accounting & Social Security Nicholas C. Merrill, Jr. Administrative Services David L. O’Brien Claims/Benefits Kathy Yemm Chicago Office Barbara J.C. Baird Chief Information Officer Gerry G. Mitchell Information Technology Kevin Rademacher Field Services David F. Thompson Human Resources Denise Connelly Service & Refunds Joseph S. Maggio Internal Auditor Staci Crane
Advisors, Auditors & Administrators
Consulting Actuary Gabriel, Roeder, Smith & Company Chicago, Illinois
External Auditor BKD, LLP Decatur, Illinois Investments Illinois State Board of Investment Chicago, Illinois
BOARD OF TRUSTEES
A D M I N I S T R A T I O N
Michael NoserAppointed by Governor
Patricia RensingElected Employee
Lori LaidlawElected Employee
Judy Baar TopinkaChairman
Patricia OusleyElected Employee
Danny SilverthornAppointed by Governor
Harold W. Sullivan Jr.Appointed by Governor
Renee FriedmanAppointed by Governor
Thomas AllisonAppointed by Governor
David MorrisElected Employee
Shirley ByrdElected Annuitant
Virginia YatesElected Annuitant
8 State Employees’ Retirement System of Illinois
C E R T I F I C A T E O F A C H I E V E M E N T

9 State Employees’ Retirement System of Illinois
FINANCIAL SECTION

10 State Employees’ Retirement System of Illinois
I N D E P E N D E N T A U D I T O R S’ R E P O R T
11 State Employees’ Retirement System of Illinois
I N D E P E N D E N T A U D I T O R S’ R E P O R T

12 State Employees’ Retirement System of Illinois
M A N A G E M E N T ‘ S D I S C U S S I O N A N D A N A L Y S I S
This financial
report is designed
to provide a
general overview
of the State
Employees’
Retirement
System’s finances
for all those with
an interest
in the System’s
finances.
This section presents management’s discussion and analysis of the financial position and performance of the State Employees’ Retirement Systems of Illinois (System) for the years ended June 30, 2012 and 2011. It is presented as a narrative overview and analysis. Readers are encouraged to consider the information presented here in conjunction with the Letter of Transmittal included in the Introductory Section, of the Comprehensive Annual Financial Report.
The System is a defined benefit, single-employer public employee retirement system. It provides ser vices to approximately 62,700 active state employees and nearly 62,800 benefit recipients. Throughout this discussion and analysis units of measure (i.e. billions, millions, thousands) are approximate, being rounded up or down to the nearest tenth of the respective unit value.
OVERVIEW OF THE FINANCIAL STATEMENTSThis discussion and analysis is intended to serve as an introduction to the System’s financial reporting which is comprised of the following components:
1. Basic Financial Statements. For the fiscal years ended June 30, 2012 and 2011, basic financial state-ments are presented for the System. This information presents the net assets held in trust for pension ben-efits for the System as of June 30, 2012 and 2011. This financial information also summarizes the changes in net assets held in trust for pension benefits for the years then ended.
2. Notes to the Financial Statements. The notes to the Financial Statements provide additional informa-tion that is essential to achieve a full understanding of the data provided in the basic financial statements.
3. Required Supplementary Information. The re-quired supplementary information consists of two schedules and related notes concerning actuarial information, funded status and required contributions for the System.
4. Other Supplementary Schedules. Other schedules include more detailed information pertaining to the System, including schedules of revenues by source, cash receipts and disbursements, and payments to consultants.
FINANCIAL HIGHLIGHTS• The Systems’ net assets decreased by $10.0 mil-lion and increased by $1,768.9 million during fiscal years 2012 and 2011, respectively. The changes were primarily due to an increase/(decrease) of $(206.7) million (excluding securities lending collateral), and $1,761.9 million in the System’s investments, at fair value, for fiscal years 2012 and 2011, respectively. • The System was actuarially funded at 34.7% as of June 30, 2012, compared to 35.6% as of June 30, 2011. For fiscal years 2012 and 2011, the actuarial value of assets equals the fair value of assets adjusted for any actuarial gains or losses from investment return in-curred in the fiscal year recognized in equal amounts over the five year period following that fiscal year. • The overall rate of return for the Illinois State Board of Investment (ISBI) Commingled Fund was
0.1% for fiscal year 2012 compared to 21.7% for fiscal year 2011.
ADDITIONS TO PLAN NET ASSETSAdditions to Plan Net Assets include em-ployer and participant contributions and net income from investment activities. Participant contributions were approxi-mately $259.1 million and $254.2 million for the years ended June 30, 2012 and 2011, respectively. Participant contribution rates are set by statute as a percentage of gross salary. Employer contributions increased to approximately $1,391.4 million in 2012 from approximately $1,127.9 million in 2011. This increase was the result of the State’s funding plan.
PLAN NET ASSETS The condensed Statements of Plan Net Assets reflect the resources available to pay benefits to members, including retirees and beneficiaries, at the end of the years reported. A summary of the System’s Plan Net Assets is presented below.
Condensed Statements of Plan Net Assets(in millions)
Increase/(Decrease) from As of June 30 2011 to 2010 to 2012 2011 2010 2012 2011
Cash $ 134.0 $ 54.9 $ 49.9 $ 79.1 $ 5.0Receivables 160.8 41.1 39.3 119.7 1.8Investments, at fair value * 10,748.6 10,908.9 9,143.2 (160.3) 1,765.7Property & equipment, net 2.7 2.7 2.8 – (.1)Total assets 11,046.1 11,007.6 9,235.2 38.5 1,772.4Liabilities * 85.4 36.9 33.4 48.5 3.5Total plan net assets $ 10,960.7 $ 10,970.7 $ 9,201.8 $ (10.0) $ 1,768.9
* Including securities lending collateral

13 State Employees’ Retirement System of Illinois
M A N A G E M E N T ‘ S D I S C U S S I O N A N D A N A L Y S I S
DEDUCTIONS FROM PLAN NET ASSETSDeductions from Plan Net Assets are primarily benefit payments. During 2012 and 2011, the System paid out approximately $1,650.9 million and $1,529.6 million, respectively, in benefits and refunds, an increase of approximately 7.9%. These higher payments were mainly due to a scheduled 3% increase in retirement and other benefit payments, and a 5% increase in beneficiaries. The administrative costs of the System represented approximately 1% of total deductions in both 2012 and 2011.
FUNDED RATIOThe funded ratio of the plan measures the ratio of the actuarial value of assets against actuarially de-termined liabilities and is one indicator of the fiscal strength of a pension fund’s ability to meet obliga-tions to its members. An annual actuarial valuation is required by statute. The most recent available valuation showed the funded status of the System on June 30, 2012 decreased to 34.7% from 35.6% at June 30, 2011. The major reason for the decline was the lingering effect of prior investment performance on the smoothed-market value of assets. The amount by which actuarially determined liabilities exceeded the actuarial value of assets was $21.6 billion at June 30, 2012 compared to $20.2 billion at June 30, 2011.
INVESTMENTSInvestments of the System are combined in a com-mingled investment pool with the Judges’ Retirement System and the General Assembly Retirement System. Each system owns an equity position in the pool and receives proportionate investment income from the pool in accordance with respective ownership percentage. Investment gains or losses are reported in the Statement of Changes in Net Assets of each retirement system.
The net investment gain for the System totaled ap-proximately $6.0 million during fiscal year 2012, versus a net investment gain of $1,930.2 million dur-ing fiscal year 2011, resulting in returns of 0.1% and 21.7%, respectively. For the three, five, and ten year period ended June 30, 2012, the ISBI Commingled Fund earned a compounded rate of return of positive 10.0%, negative 0.1%, and positive 5.2%, respectively.
The ISBI is exposed to general market risk. This general market risk is reflected in asset valuations fluctuating with market volatility. Any impact from market volatility on the ISBI’s investment portfolio depends in large measure on how deep the market downturn is, how long it lasts, and how it fits within fiscal year reporting periods. The resulting market risk and associated realized and unrealized gains and losses could significantly impact the ISBI’s financial condition.
CHANGES IN PLAN NET ASSETS
The condensed Statements of Changes in Plan Net Assets reflect the changes in the resources available to pay benefits to members, including retirees and beneficiaries.
Condensed Statements of Changes in Plan Net Assets(In millions)
Increase/(Decrease) from For the Year Ended June 30, 2011 to 2010 to 2012 2011 2010 2012 2011Additions Participant contributions $ 259.1 $ 254.2 $ 246.2 $ 4.9 8.0 Employer contributions 1,391.4 1,127.9 1,095.5 263.5 32.4 Investment income/(loss) 6.0 1,930.2 799.9 (1,924.2) 1,130.3 Total additions/(deductions) 1,656.5 3,312.3 2,141.6 (1,655.8) 1,170.7Deductions Benefits 1,627.3 1,492.1 1,390.7 135.2 101.4 Refunds 23.5 37.6 15.3 (14.1) 22.3 Administrative expenses 15.7 13.7 11.7 2.0 2.0 Total deductions 1,666.5 1,543.4 1,417.7 123.1 125.7 Net increase/(decrease) in plan net assets $ (10.0) $ 1,768.9 $ 723.9 $ (1,778.9) $ 1,045.0
Questions concerning any of the informa-tion provided in this report or requests for additional financial informa-tion should be addressed to the State Employees’ Retirement Sys-tem of Illinois, Accounting Divi-sion, 2101 S. Veterans Park-way, P. O. Box 19255, Spring-field, Illinois 62794
14 State Employees’ Retirement System of Illinois
F I N A N C I A L S T A T E M E N T S
STATE EMPLOYEES’ RETIREMENT SYSTEM OF ILLINOIS
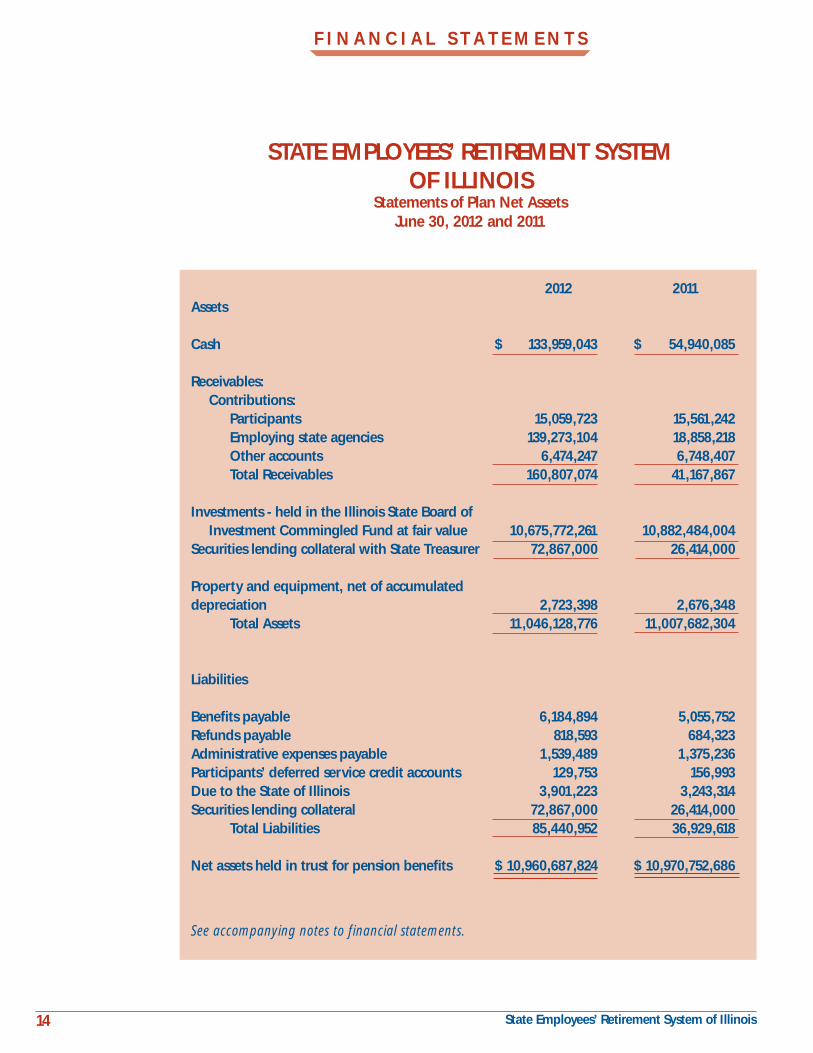
Statements of Plan Net AssetsJune 30, 2012 and 2011
2012 2011Assets
Cash $ 133,959,043 $ 54,940,085
Receivables: Contributions: Participants 15,059,723 15,561,242 Employing state agencies 139,273,104 18,858,218 Other accounts 6,474,247 6,748,407 Total Receivables 160,807,074 41,167,867
Investments - held in the Illinois State Board of Investment Commingled Fund at fair value 10,675,772,261 10,882,484,004Securities lending collateral with State Treasurer 72,867,000 26,414,000
Property and equipment, net of accumulateddepreciation 2,723,398 2,676,348 Total Assets 11,046,128,776 11,007,682,304
Liabilities
Benefits payable 6,184,894 5,055,752Refunds payable 818,593 684,323Administrative expenses payable 1,539,489 1,375,236Participants’ deferred service credit accounts 129,753 156,993Due to the State of Illinois 3,901,223 3,243,314Securities lending collateral 72,867,000 26,414,000 Total Liabilities 85,440,952 36,929,618
Net assets held in trust for pension benefits $ 10,960,687,824 $ 10,970,752,686
See accompanying notes to financial statements.
15 State Employees’ Retirement System of Illinois
F I N A N C I A L S T A T E M E N T S
STATE EMPLOYEES’ RETIREMENT SYSTEMOF ILLINOIS
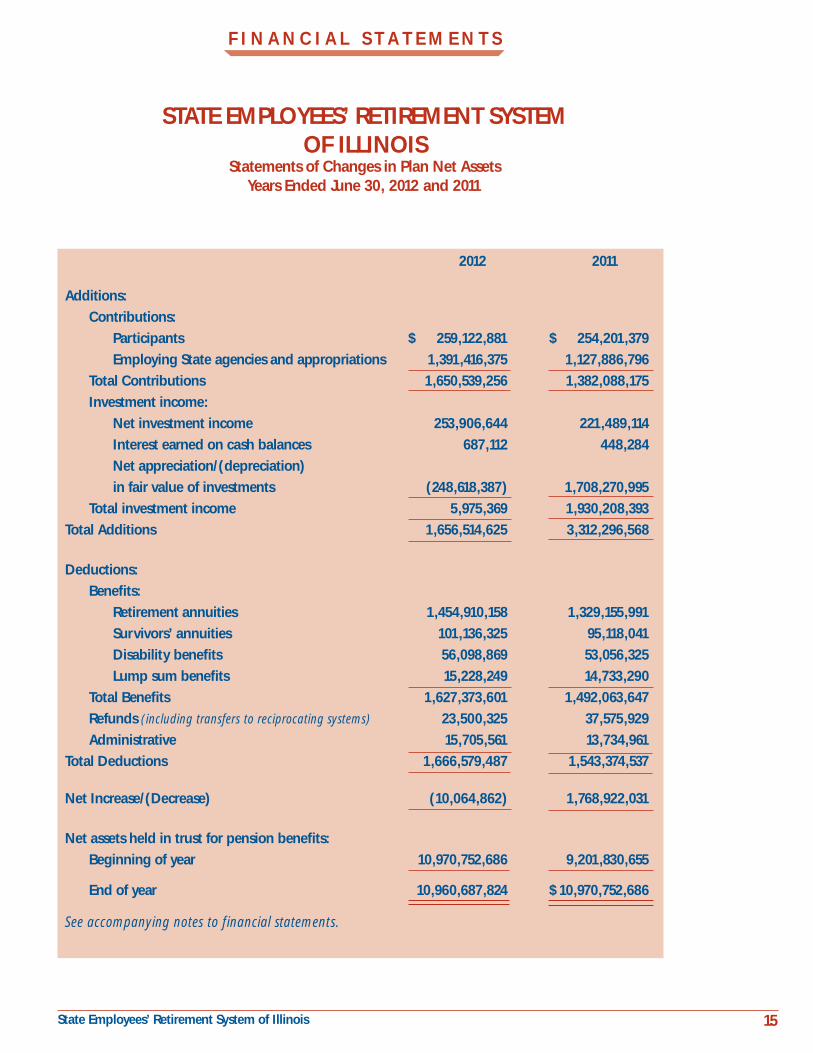
Statements of Changes in Plan Net AssetsYears Ended June 30, 2012 and 2011
2012 2011
Additions:
Contributions:
Participants $ 259,122,881 $ 254,201,379
Employing State agencies and appropriations 1,391,416,375 1,127,886,796
Total Contributions 1,650,539,256 1,382,088,175
Investment income:
Net investment income 253,906,644 221,489,114
Interest earned on cash balances 687,112 448,284
Net appreciation/(depreciation)
in fair value of investments (248,618,387) 1,708,270,995
Total investment income 5,975,369 1,930,208,393
Total Additions 1,656,514,625 3,312,296,568
Deductions:
Benefits:
Retirement annuities 1,454,910,158 1,329,155,991
Survivors’ annuities 101,136,325 95,118,041
Disability benefits 56,098,869 53,056,325
Lump sum benefits 15,228,249 14,733,290
Total Benefits 1,627,373,601 1,492,063,647
Refunds (including transfers to reciprocating systems) 23,500,325 37,575,929
Administrative 15,705,561 13,734,961
Total Deductions 1,666,579,487 1,543,374,537
Net Increase/(Decrease) (10,064,862) 1,768,922,031
Net assets held in trust for pension benefits:
Beginning of year 10,970,752,686 9,201,830,655
End of year 10,960,687,824 $ 10,970,752,686
See accompanying notes to financial statements.

16 State Employees’ Retirement System of Illinois
F I N A N C I A L S T A T E M E N T S
STATE EMPLOYEES’ RETIREMENT SYSTEM OF ILLINOIS
Notes to Financial Statements June 30, 2012 and 2011
1. Reporting EntityGenerally accepted accounting principles require that the financial reporting entity include: 1) the primary government; 2) organizations for which the primary government is financially accountable; and 3) other organizations for which the nature and significance of their relationship with the primary government are such that exclusion would cause the reporting entity’s financial statement to be misleading or incomplete.
The State Employees’ Retirement System of Illinois (System) is administered by a Board of Trustees consisting of thirteen persons, which includes: a. the Comptroller, who shall be the Chairperson; b. six persons appointed by the Governor with the advice and consent of the Senate who may not be members of the system or hold an elective State office and who shall serve for a term of 5 years, except that the terms
of the initial appointees under the amendatory Act of the 96th General Assembly shall be as follows: 3 for a term of 3 years and 3 for a term of 5 years; c. four active participants of the System having at least 8 years of creditable service, to be elected from the contributing members of the System by the contribu-tion members; and d. two annuitants of the System who have been annuitants for at least one full year, to be elected from and by the annuitants of the System.
Based on the criteria of the Governmental Account-ing Standards Board Statement No. 14, there are no other state agencies, boards or commissions, or other organizations required to be combined with the Sys-tem. However, the System is considered to be part of the State of Illinois financial reporting entity, and is to be combined and included in the State of Illinois’ comprehensive annual financial report.
Pursuant to federal tax laws and regulations governing the ad-ministration of public employee pension plans, the System has established a separate fund for the sole purpose of disbursing benefits in accordance with Sec-tion 415 of the Internal Revenue Code. For fiscal years 2012 and 2011, receipts were approximately $63,400 and $23,800, respective-ly. For fiscal years 2012 and 2011, disbursements were approxi-mately $63,600 and $53,100, respectively.
Due to the immaterial nature of the separate fund, these receipts and disbursements have been in-cluded in the financial statements of the System.
At June 30, 2012 and 2011, the number of participating state agencies, boards and commissions totaled: 2012 2011State agencies 40 38State boards and commissions 43 43TOTAL 83 81 At June 30, 2012 and 2011, SERS membership consisted of:
Retirees and beneficiaries currently receiving benefits: Retirement annuities 50,000 47,002 Survivors’ annuities 10,502 10,428 Disability benefits 2,286 2,356 TOTAL 62,788 59,786Inactive employees entitled to benefits, but not yet receiving them 4,391 4,489TOTAL 67,179 64,275
Current Employees: Vested: Coordinated with Social Security 43,165 45,839 Noncoordinated 1,692 1,854 Nonvested: Coordinated with Social Security 17,160 17,969 Noncoordinated 715 701TOTAL 62,732 66,363
Operation of the System and the direction of its policies are the responsibility of the Board of Trustees of the System.
17 State Employees’ Retirement System of Illinois
F I N A N C I A L S T A T E M E N T S
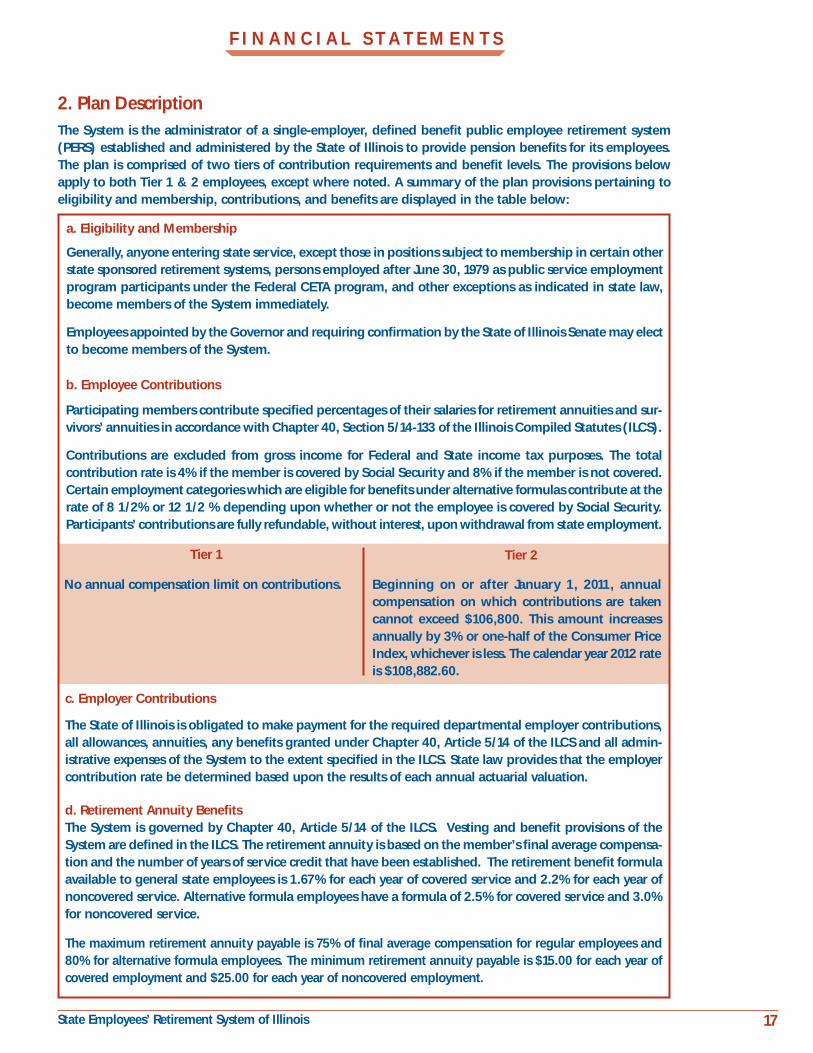
2. Plan DescriptionThe System is the administrator of a single-employer, defined benefit public employee retirement system (PERS) established and administered by the State of Illinois to provide pension benefits for its employees. The plan is comprised of two tiers of contribution requirements and benefit levels. The provisions below apply to both Tier 1 & 2 employees, except where noted. A summary of the plan provisions pertaining to eligibility and membership, contributions, and benefits are displayed in the table below:
a. Eligibility and Membership
Generally, anyone entering state service, except those in positions subject to membership in certain other state sponsored retirement systems, persons employed after June 30, 1979 as public service employment program participants under the Federal CETA program, and other exceptions as indicated in state law, become members of the System immediately.
Employees appointed by the Governor and requiring confirmation by the State of Illinois Senate may elect to become members of the System.
b. Employee Contributions
Participating members contribute specified percentages of their salaries for retirement annuities and sur-vivors’ annuities in accordance with Chapter 40, Section 5/14-133 of the Illinois Compiled Statutes (ILCS).
Contributions are excluded from gross income for Federal and State income tax purposes. The total contribution rate is 4% if the member is covered by Social Security and 8% if the member is not covered. Certain employment categories which are eligible for benefits under alternative formulas contribute at the rate of 8 1/2% or 12 1/2 % depending upon whether or not the employee is covered by Social Security. Participants’ contributions are fully refundable, without interest, upon withdrawal from state employment.
Tier 1 Tier 2
No annual compensation limit on contributions. Beginning on or after January 1, 2011, annual compensation on which contributions are taken cannot exceed $106,800. This amount increases annually by 3% or one-half of the Consumer Price Index, whichever is less. The calendar year 2012 rate is $108,882.60.
c. Employer Contributions
The State of Illinois is obligated to make payment for the required departmental employer contributions, all allowances, annuities, any benefits granted under Chapter 40, Article 5/14 of the ILCS and all admin-istrative expenses of the System to the extent specified in the ILCS. State law provides that the employer contribution rate be determined based upon the results of each annual actuarial valuation.
d. Retirement Annuity BenefitsThe System is governed by Chapter 40, Article 5/14 of the ILCS. Vesting and benefit provisions of the System are defined in the ILCS. The retirement annuity is based on the member’s final average compensa-tion and the number of years of service credit that have been established. The retirement benefit formula available to general state employees is 1.67% for each year of covered service and 2.2% for each year of noncovered service. Alternative formula employees have a formula of 2.5% for covered service and 3.0% for noncovered service.
The maximum retirement annuity payable is 75% of final average compensation for regular employees and 80% for alternative formula employees. The minimum retirement annuity payable is $15.00 for each year of covered employment and $25.00 for each year of noncovered employment.

18 State Employees’ Retirement System of Illinois
F I N A N C I A L S T A T E M E N T S
Regular Formula Tier 1 Regular Formula Tier 2
A member must have a minimum of eight years of service credit and may retire at:
• Age 60, with 8 years of service credit.
• Any age, when the member’s age (years & whole months) plus years of service credit (years & whole months) equal 85 years (1,020 months) (Rule of 85) with eight years of credited service.
• Between ages 55-60 with 25-30 years of service credit (reduced 1/2 of 1% for each month under age 60).
The retirement benefit is based on final average com-pensation and credited service. Final average compen-sation is the 48 highest consecutive months of service
within the last 120 months of service.
Under the Rule of 85, a member is eligible for the first 3% increase on January 1 following the first full year of retirement, even if the member is not age 60. If the member retires at age 60 or older, he/she will receive a 3% pension increase every year on January 1, following the first full year of retirement.
If the member retires before age 60 with a reduced retirement benefit, he/she will receive a 3% pension increase every January 1 after the member turns age 60 and has been retired at least one full year. These pension increases are not limited by the 75% maximum.
Members eligible for the alternative formula may retire at age 50 with 25 years of service credit, or at age 55 with 20 years of service credit.
Final average compensation is figured one of three ways:
• The average of the highest 48 consecutive months over the last 120 months of service (for members in service prior to January 1, 1998).
• Average of last 48 months of service.
• Final rate of pay: cannot exceed the average of the last 24 months of pay by 115%.
Alternative formula retirees receive their first 3% pen-sion increase on January 1 following the first full year of retirement after age 55. These increases are not limited by the 80% maximum.
A member must have a minimum of 10 years of cred-ited service and may retire at:
• Age 67, with 10 years of credited service.
• Between ages 62-67 with 10 years of credited service (reduced 1/2 of 1% for each month under age 67).
The retirement benefit is based on final average com-pensation and credited service. For regular formula employees, final average compensation is the average of the 96 highest consecutive months of service within the last 120 months of service. The retirement benefit is calculated on a maximum salary of $106,800. This amount increases annually by 3% or one-half of the Consumer Price Index, whichever is less.
If the member retires at age 67 or older, he/she will receive a pension increase of 3% or one-half of the Consumer Price Index for the preceding calendar year, whichever is less, every year on January 1, following the first full year of retirement. The calendar year 2012 rate is $108,882.60. If the member retires before age 67 with a reduced retirement benefit, he/she will receive a pension in-crease of 3% or one-half of the Consumer Price Index for the preceding calendar year, whichever is less, every January 1 after the member turns age 67 and has been retired at least one full year. These pension increases are not limited by the 75% maximum.
Members eligible for the alternative formula may retire at age 60 with 20 years of service.
Final average compensation is the average monthly sal-ary during the 96 highest consecutive months of service within the last 120 months. The retirement benefit is cal-culated on a maximum salary of $106,800. This amount increases annually by 3% or one-half of the Consumer Price Index, whichever is less. The calendar year 2012 rate is $108,882.60.
Alternative formula retirees receive their first pension increase of 3% or one-half of the Consumer Price In-dex for the preceding calendar year, whichever is less, following the first full year of retirement after age 60. These increases are not limited by the 80% maximum.
Alternative Formula Tier 1 Alternative Formula Tier 2

19 State Employees’ Retirement System of Illinois
e. Disability & Death BenefitsOccupational and nonoccupational (including temporary) disability benefits are available through the System. To be eligible for nonoccupational (including temporary) disability benefits, an employee must have at least eighteen months of credited service with the System.
The nonoccupational (including temporary) disability benefit is equal to 50% of the monthly rate of compen-sation of the employee on the date of removal from the payroll. Occupational disability benefits are provided when the member becomes disabled as a direct result of injuries or diseases arising out of and in the course of state employment. The monthly benefit is equal to 75% of the monthly rate of compensation on the date of removal from the payroll. This benefit amount is reduced by Workers’ Compensation or payments under the Occupational Diseases Act.
Occupational and nonoccupational death benefits are also available through the System. Certain nonoccupa-tional death benefits vest after eighteen months of credited service. Occupational death benefits are provided from the date of employment.
Tier 1 Tier 2
For disability benefits, final average compensation is the rate of pay on the date of the disability, or the 48 highest consecutive months of service within the last 10 years, whichever is greater.
For disability benefits, final average compensation is the rate of pay on the date of the disability, or the 96 highest consecutive months of service within the last 10 years, whichever is greater. The disability benefit is calculated on a maximum salary of $106,800. The calendar year 2012 rate is $108,882.60.
3. Summary of Significant Accounting Policies & Plan Asset Mattersa. Basis of AccountingThe financial transactions of the System are main-tained and these financial statements have been prepared using the accrual basis of accounting in conformity with generally accepted accounting principles. Employee and employer contributions are recognized as revenues when due pursuant to statutory requirements.
Benefits and refunds are recognized as expenses when due and payable in accordance with the terms of the plan.
b. CashThe System retains all of its available cash in a com-mingled investment pool managed by the Treasurer of the State of Illinois (Treasurer). All deposits are fully collateralized by the Treasurer.
“Available cash” is determined to be that amount which is required for the current operating expendi-tures of the System. The excess of available cash is transferred to the Illinois State Board of Investment (ISBI) for purposes of long-term investment for the System.
c. Implementation of New Accounting StandardGASB Statement No. 64, “Derivative Instruments: Ap-plication of Hedge Accounting Termination Provisions – An Amendment to GASB Statement No. 53”, was
established to enhance comparability and improve financial reporting by clarifying the circumstances in which hedge accounting should continue when a swap counterparty, or a swap counterparty’s credit support provider, is replaced. The ISBI implemented this Statement for the year ending June 30, 2012.
d. Methods Used to Value InvestmentsInvestments are managed by the ISBI pursuant to Chapter 40, Article 5/22A of the Illinois Compiled Statutes (ILCS) and are maintained in the ISBI Com-mingled Fund.
Investments owned are reported at fair value as follows: (1) U.S. Government and Agency, Foreign and Corporate Obligations, Convertible Bonds – prices quoted by a major dealer in such securities; (2) Common Stock and Equity Funds, Preferred Stock, Foreign Equity Securities, Forward Foreign Currency Contracts and Options: (a) Listed – closing prices as reported on the composite summary of national securities exchanges; (b) Over-the-counter – bid prices; (3) Money Market Instruments – average cost which approximates fair values; (4) Real Estate Investments – fair values as determined by the ISBI and its investment managers; (5) Alternative Investments (Private Equity, Hedge Funds, Bank loans, and Infrastructure Funds) fair values as determined by the ISBI and its investment managers; and (6) Commingled Funds- fair values as determined by the ISBI and its investment managers.
F I N A N C I A L S T A T E M E N T S
20 State Employees’ Retirement System of Illinois
the State’s self-insurance program. The System ob-tains commercial insurance for fidelity, surety, and property. There have been no commercial insurance claims in the past four fiscal years.
h. General LitigationThe System is subject to claims and lawsuits that arise primarily in the ordinary course of business. It is the opinion of management that the disposition or ultimate resolution of such claims and lawsuits will not have a material adverse effect on the plan net assets or the changes in plan net assets of the System.
i. Use of EstimatesIn preparing financial statements in conformity with U.S. generally accepted accounting principles, the System makes estimates and assumptions that af-fect the reported amounts of assets and liabilities and disclosures of contingent assets and liabilities at the date of the financial statements, as well as the reported amounts of revenue and expenses during the reporting period. Actual results could differ from those estimates and assumptions.
j. ReclassificationsCertain fiscal year 2011 amounts have been reclassi-fied to conform to the fiscal year 2012 presentation. These reclassifications have not changed the fiscal year 2011 results.
F I N A N C I A L S T A T E M E N T S
Units of the ISBI Commingled Fund are issued to the member systems on the last day of the month based on the unit net asset value calculated as of that date. Net investment income of the ISBI Commingled Fund is allocated to each of the member systems on the last day of the month on the basis of percentage of accumulated units owned by the respective systems. Management expenses are deducted monthly from income before distribution.
The investment authority of the ISBI is provided in Chapter 40, Section 5/22A-112 of the ILCS. Such investment authority requires that all opportunities be undertaken with care, skill, prudence and dili-gence given prevailing circumstances that a prudent person acting in like capacity and experience would undertake.
e. Actuarial Experience ReviewIn accordance with Illinois Compiled Statutes, an actuarial experience review is to be performed at least once every five years to determine the adequacy of actuarial assumptions regarding the mortality, retirement, disability, employment, turnover, inter-est and earnable compensation of the members and beneficiaries of the System. An experience review was last performed as of June 30, 2010 resulting in the adoption of new assumptions as of June 30, 2011.
f. Administrative ExpensesExpenses related to the administration of the Sys-tem are financed through investment earnings and employer retirement contributions. These expenses are budgeted and approved by the System’s Board of Trustees.
g. Risk ManagementThe System, as part of the primary government of the State, provides for risks of loss associated with workers’ compensation and general liability through
21 State Employees’ Retirement System of Illinois
F I N A N C I A L S T A T E M E N T S
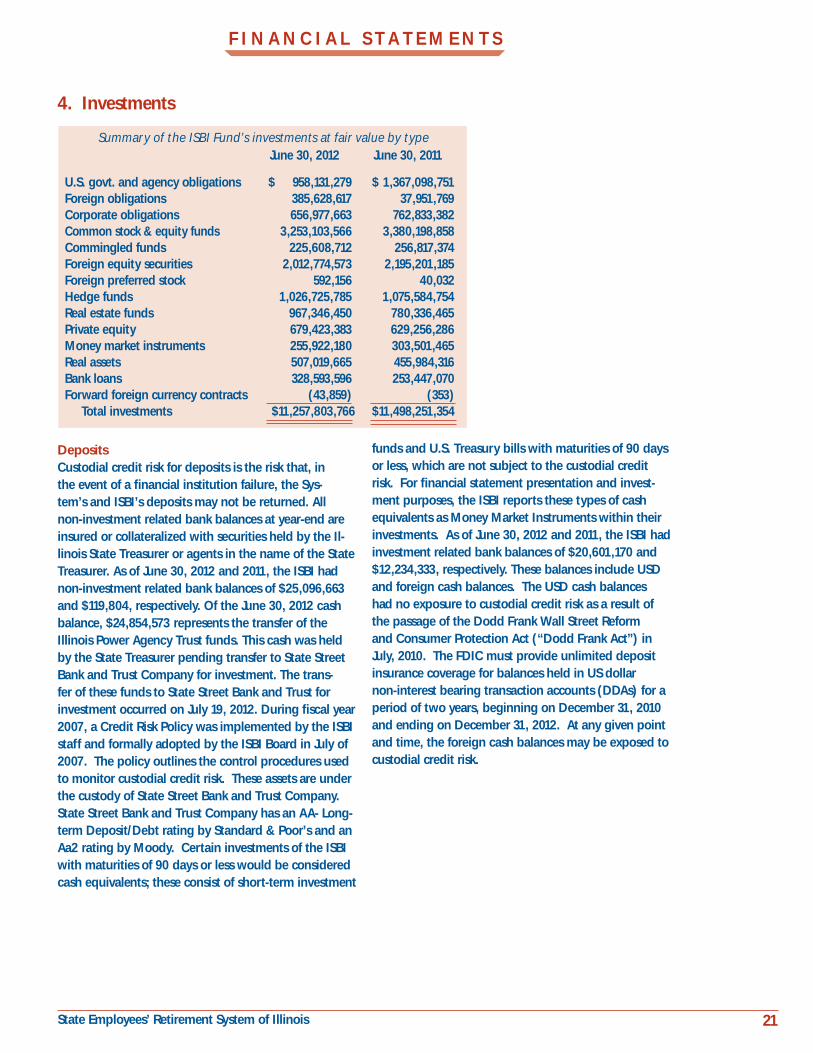
Deposits Custodial credit risk for deposits is the risk that, in the event of a financial institution failure, the Sys-tem’s and ISBI’s deposits may not be returned. All non-investment related bank balances at year-end are insured or collateralized with securities held by the Il-linois State Treasurer or agents in the name of the State Treasurer. As of June 30, 2012 and 2011, the ISBI had non-investment related bank balances of $25,096,663 and $119,804, respectively. Of the June 30, 2012 cash balance, $24,854,573 represents the transfer of the Illinois Power Agency Trust funds. This cash was held by the State Treasurer pending transfer to State Street Bank and Trust Company for investment. The trans-fer of these funds to State Street Bank and Trust for investment occurred on July 19, 2012. During fiscal year 2007, a Credit Risk Policy was implemented by the ISBI staff and formally adopted by the ISBI Board in July of 2007. The policy outlines the control procedures used to monitor custodial credit risk. These assets are under the custody of State Street Bank and Trust Company. State Street Bank and Trust Company has an AA- Long-term Deposit/Debt rating by Standard & Poor’s and an Aa2 rating by Moody. Certain investments of the ISBI with maturities of 90 days or less would be considered cash equivalents; these consist of short-term investment
Summary of the ISBI Fund’s investments at fair value by type June 30, 2012 June 30, 2011
U.S. govt. and agency obligations $ 958,131,279 $ 1,367,098,751 Foreign obligations 385,628,617 37,951,769Corporate obligations 656,977,663 762,833,382Common stock & equity funds 3,253,103,566 3,380,198,858Commingled funds 225,608,712 256,817,374Foreign equity securities 2,012,774,573 2,195,201,185Foreign preferred stock 592,156 40,032Hedge funds 1,026,725,785 1,075,584,754Real estate funds 967,346,450 780,336,465Private equity 679,423,383 629,256,286Money market instruments 255,922,180 303,501,465Real assets 507,019,665 455,984,316Bank loans 328,593,596 253,447,070Forward foreign currency contracts (43,859) (353) Total investments $ 11,257,803,766 $ 11,498,251,354
funds and U.S. Treasury bills with maturities of 90 days or less, which are not subject to the custodial credit risk. For financial statement presentation and invest-ment purposes, the ISBI reports these types of cash equivalents as Money Market Instruments within their investments. As of June 30, 2012 and 2011, the ISBI had investment related bank balances of $20,601,170 and $12,234,333, respectively. These balances include USD and foreign cash balances. The USD cash balances had no exposure to custodial credit risk as a result of the passage of the Dodd Frank Wall Street Reform and Consumer Protection Act (“Dodd Frank Act”) in July, 2010. The FDIC must provide unlimited deposit insurance coverage for balances held in US dollar non-interest bearing transaction accounts (DDAs) for a period of two years, beginning on December 31, 2010 and ending on December 31, 2012. At any given point and time, the foreign cash balances may be exposed to custodial credit risk.
4. Investments
22 State Employees’ Retirement System of Illinois
F I N A N C I A L S T A T E M E N T S
Investment Commitments The ISBI’s real estate and private equity investment portfolios consist of passive interests in limited partner-ships. The ISBI had outstanding commitments to these limited partnerships of approximately $478 million and $344 million, as of June 30, 2012 and 2011, respec-tively. Also, at the end of fiscal year 2012 and 2011, the ISBI had outstanding commitments of $196 million and $321 million, respectively, to separate real estate accounts. Also at the end of fiscal year 2012 and 2011, the ISBI had outstanding amounts of $63 million and $102 million, respectively, committed to real assets. The ISBI would fund outstanding commitments by utilizing available cash and then selling liquid securities in the portfolio as necessary.
Investment LiquidityThe ISBI holds investments in hedge funds, real estate funds, private equity funds and real assets that are con-sidered illiquid by the very nature of the investment. Market risk exists with respect to these investments as the ISBI may not be able to exit from the investments during periods of significant market value declines.
Alternative InvestmentsThe ISBI’s investments in hedge funds are structured to achieve a diversified hedged equity fund-of-funds port-folio. Capital is allocated to a select group of hedge fund managers that invest predominately in equity securities, both long and short. The investments shall be managed with the intent of preserving capital in a declining market and in a rising market they will gener-ate a smaller return than the overall equity market.
The ISBI’s investments in Private Equity and Real Estate funds represent investment vehicles used for making investments in various equity and debt securities ac-cording to the investment strategies as determined by the fund managers at the commencement of the fund.
Investment strategies of Private Equity funds include, but are not limited to, leveraged buyouts, venture capi-tal, growth capital and mezzanine capital.
Investment strategies of Real Estate investments include, but are not limited to, the purchase, development, own-ership, management, rental and/or sale of real estate for profit. In May, 2011, RLJ Lodging Fund II, a limited partnership investment, was exchanged by the ISBI for 1,035,092 shares of restricted common stock as a result of an initial public offering (IPO) transaction conducted by RLJ Lodging Trust. Due to the fact that this holding is
currently restricted for sale as a result of a lock-up agree-ment in place that specifies that during the period that commences 180 days from the date of the initial IPO the holders of the shares will not, without prior writ-ten consent of the underwriting group, directly or indi-rectly offer, pledge, sell, contract to sell, sell any option or contract to purchase, purchase any option or contract to sell, grant any option, right or warrant for sale of, or otherwise dispose or transfer such shares. As of June 30, 2011, this holding is an illiquid asset as a result of this re-striction. During fiscal year 2012, the restriction attached to these shares expired and 1,043,923 in RLJ Lodging Trust shares were sold in March 2012. This included an additional amount of 8,831 shares received by the ISBI during the fiscal year.
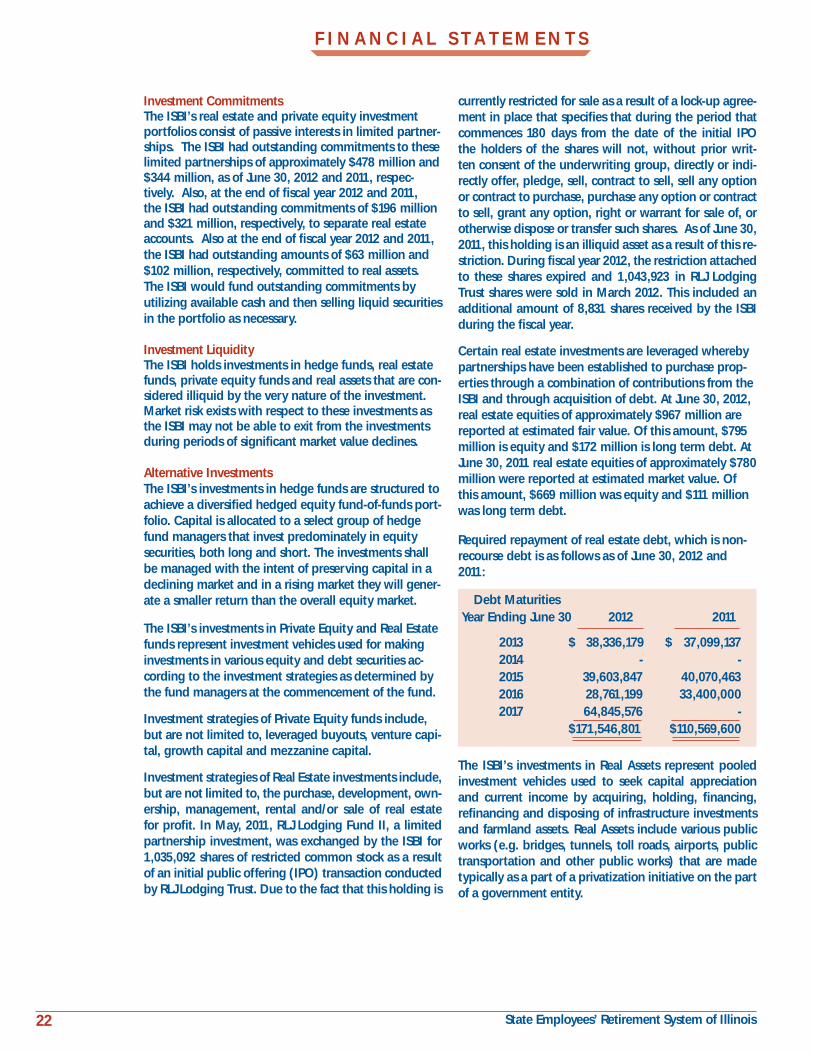
Certain real estate investments are leveraged whereby partnerships have been established to purchase prop-erties through a combination of contributions from the ISBI and through acquisition of debt. At June 30, 2012, real estate equities of approximately $967 million are reported at estimated fair value. Of this amount, $795 million is equity and $172 million is long term debt. At June 30, 2011 real estate equities of approximately $780 million were reported at estimated market value. Of this amount, $669 million was equity and $111 million was long term debt.
Required repayment of real estate debt, which is non-recourse debt is as follows as of June 30, 2012 and 2011:
Debt Maturities Year Ending June 30 2012 2011
2013 $ 38,336,179 $ 37,099,137 2014 - - 2015 39,603,847 40,070,463 2016 28,761,199 33,400,000 2017 64,845,576 - $171,546,801 $110,569,600
The ISBI’s investments in Real Assets represent pooled investment vehicles used to seek capital appreciation and current income by acquiring, holding, financing, refinancing and disposing of infrastructure investments and farmland assets. Real Assets include various public works (e.g. bridges, tunnels, toll roads, airports, public transportation and other public works) that are made typically as a part of a privatization initiative on the part of a government entity.
23 State Employees’ Retirement System of Illinois
F I N A N C I A L S T A T E M E N T S
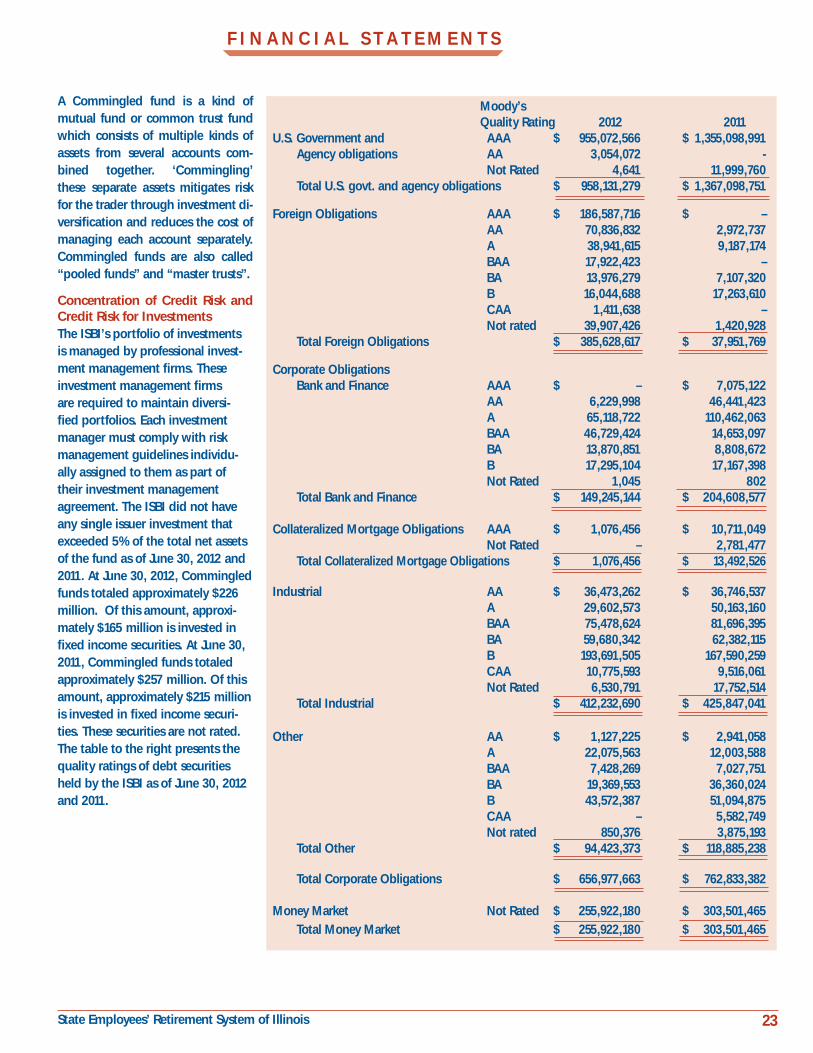
Moody’s Quality Rating 2012 2011U.S. Government and AAA $ 955,072,566 $ 1,355,098,991 Agency obligations AA 3,054,072 - Not Rated 4,641 11,999,760 Total U.S. govt. and agency obligations $ 958,131,279 $ 1,367,098,751 Foreign Obligations AAA $ 186,587,716 $ – AA 70,836,832 2,972,737 A 38,941,615 9,187,174 BAA 17,922,423 – BA 13,976,279 7,107,320 B 16,044,688 17,263,610 CAA 1,411,638 – Not rated 39,907,426 1,420,928 Total Foreign Obligations $ 385,628,617 $ 37,951,769
Corporate Obligations Bank and Finance AAA $ – $ 7,075,122 AA 6,229,998 46,441,423 A 65,118,722 110,462,063 BAA 46,729,424 14,653,097 BA 13,870,851 8,808,672 B 17,295,104 17,167,398 Not Rated 1,045 802 Total Bank and Finance $ 149,245,144 $ 204,608,577
Collateralized Mortgage Obligations AAA $ 1,076,456 $ 10,711,049 Not Rated – 2,781,477 Total Collateralized Mortgage Obligations $ 1,076,456 $ 13,492,526
Industrial AA $ 36,473,262 $ 36,746,537 A 29,602,573 50,163,160 BAA 75,478,624 81,696,395 BA 59,680,342 62,382,115 B 193,691,505 167,590,259 CAA 10,775,593 9,516,061 Not Rated 6,530,791 17,752,514 Total Industrial $ 412,232,690 $ 425,847,041 Other AA $ 1,127,225 $ 2,941,058 A 22,075,563 12,003,588 BAA 7,428,269 7,027,751 BA 19,369,553 36,360,024 B 43,572,387 51,094,875 CAA – 5,582,749 Not rated 850,376 3,875,193 Total Other $ 94,423,373 $ 118,885,238
Total Corporate Obligations $ 656,977,663 $ 762,833,382
Money Market Not Rated $ 255,922,180 $ 303,501,465 Total Money Market $ 255,922,180 $ 303,501,465
A Commingled fund is a kind of mutual fund or common trust fund which consists of multiple kinds of assets from several accounts com-bined together. ‘Commingling’ these separate assets mitigates risk for the trader through investment di-versification and reduces the cost of managing each account separately. Commingled funds are also called “pooled funds” and “master trusts”.
Concentration of Credit Risk and Credit Risk for Investments The ISBI’s portfolio of investments is managed by professional invest-ment management firms. These investment management firms are required to maintain diversi-fied portfolios. Each investment manager must comply with risk management guidelines individu-ally assigned to them as part of their investment management agreement. The ISBI did not have any single issuer investment that exceeded 5% of the total net assets of the fund as of June 30, 2012 and 2011. At June 30, 2012, Commingled funds totaled approximately $226 million. Of this amount, approxi-mately $165 million is invested in fixed income securities. At June 30, 2011, Commingled funds totaled approximately $257 million. Of this amount, approximately $215 million is invested in fixed income securi-ties. These securities are not rated. The table to the right presents the quality ratings of debt securities held by the ISBI as of June 30, 2012 and 2011.
24 State Employees’ Retirement System of Illinois
F I N A N C I A L S T A T E M E N T S
Custodial Credit Risk for Investments The custodial credit risk for investments is the risk that, in the event of the failure of the counterparty to a transaction, the ISBI will not be able to recover the value of investments or collateral securities that are in the possession of a counterparty. As of June 30, 2012 and 2011, there were no investments that were uninsured and unregistered, securities held by the counterparty or by its trust department or agent but not in the ISBI’s name.
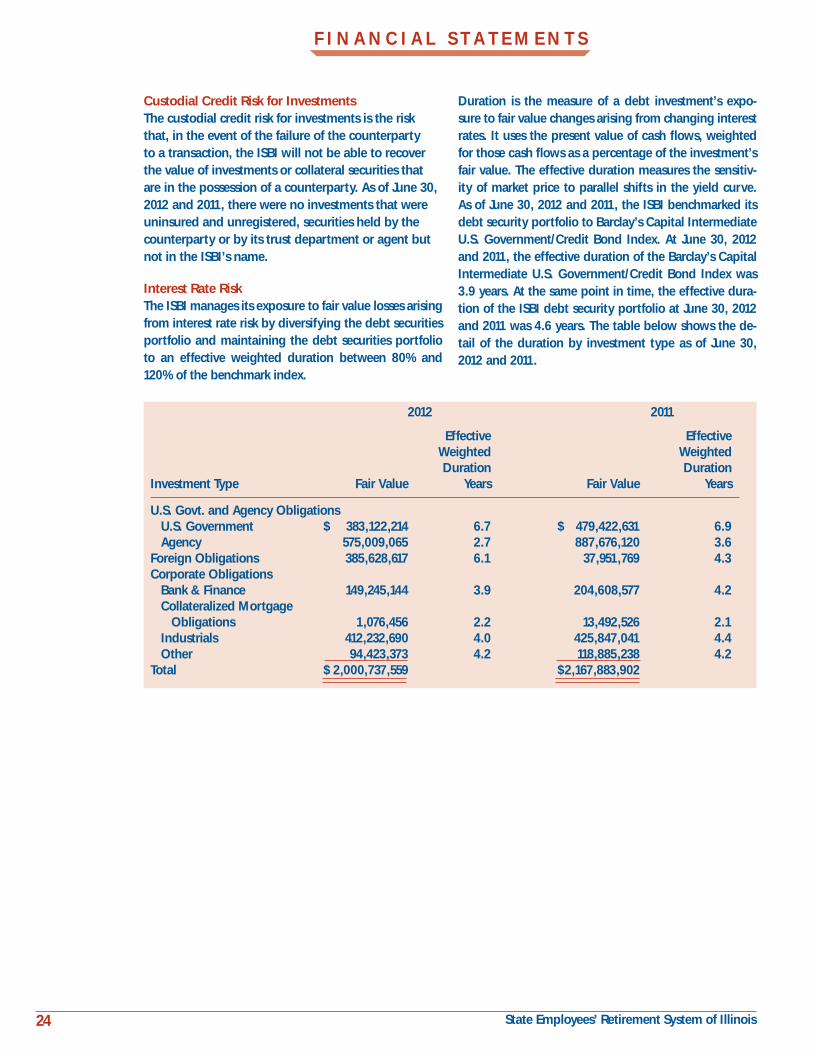
Interest Rate RiskThe ISBI manages its exposure to fair value losses arising from interest rate risk by diversifying the debt securities portfolio and maintaining the debt securities portfolio to an effective weighted duration between 80% and 120% of the benchmark index.
2012 2011
Effective Effective Weighted Weighted Duration DurationInvestment Type Fair Value Years Fair Value Years
U.S. Govt. and Agency Obligations U.S. Government $ 383,122,214 6.7 $ 479,422,631 6.9 Agency 575,009,065 2.7 887,676,120 3.6Foreign Obligations 385,628,617 6.1 37,951,769 4.3Corporate Obligations Bank & Finance 149,245,144 3.9 204,608,577 4.2 Collateralized Mortgage Obligations 1,076,456 2.2 13,492,526 2.1 Industrials 412,232,690 4.0 425,847,041 4.4 Other 94,423,373 4.2 118,885,238 4.2Total $ 2,000,737,559 $ 2,167,883,902
Duration is the measure of a debt investment’s expo-sure to fair value changes arising from changing interest rates. It uses the present value of cash flows, weighted for those cash flows as a percentage of the investment’s fair value. The effective duration measures the sensitiv-ity of market price to parallel shifts in the yield curve. As of June 30, 2012 and 2011, the ISBI benchmarked its debt security portfolio to Barclay’s Capital Intermediate U.S. Government/Credit Bond Index. At June 30, 2012 and 2011, the effective duration of the Barclay’s Capital Intermediate U.S. Government/Credit Bond Index was 3.9 years. At the same point in time, the effective dura-tion of the ISBI debt security portfolio at June 30, 2012 and 2011 was 4.6 years. The table below shows the de-tail of the duration by investment type as of June 30, 2012 and 2011.
25 State Employees’ Retirement System of Illinois
F I N A N C I A L S T A T E M E N T S
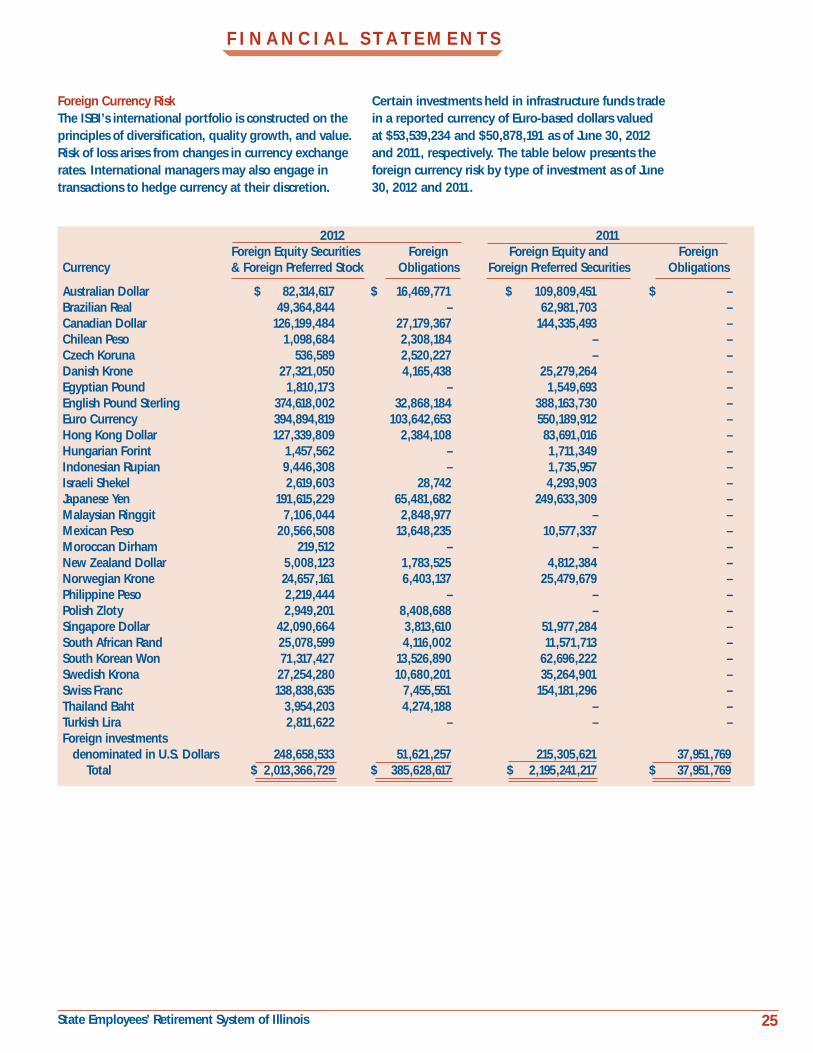
Foreign Currency RiskThe ISBI’s international portfolio is constructed on the principles of diversification, quality growth, and value. Risk of loss arises from changes in currency exchange rates. International managers may also engage in transactions to hedge currency at their discretion.
2012 2011 Foreign Equity Securities Foreign Foreign Equity and ForeignCurrency & Foreign Preferred Stock Obligations Foreign Preferred Securities Obligations
Australian Dollar $ 82,314,617 $ 16,469,771 $ 109,809,451 $ – Brazilian Real 49,364,844 – 62,981,703 –Canadian Dollar 126,199,484 27,179,367 144,335,493 –Chilean Peso 1,098,684 2,308,184 – –Czech Koruna 536,589 2,520,227 – –Danish Krone 27,321,050 4,165,438 25,279,264 –Egyptian Pound 1,810,173 – 1,549,693 –English Pound Sterling 374,618,002 32,868,184 388,163,730 –Euro Currency 394,894,819 103,642,653 550,189,912 –Hong Kong Dollar 127,339,809 2,384,108 83,691,016 – Hungarian Forint 1,457,562 – 1,711,349 –Indonesian Rupian 9,446,308 – 1,735,957 –Israeli Shekel 2,619,603 28,742 4,293,903 –Japanese Yen 191,615,229 65,481,682 249,633,309 –Malaysian Ringgit 7,106,044 2,848,977 – –Mexican Peso 20,566,508 13,648,235 10,577,337 –Moroccan Dirham 219,512 – – –New Zealand Dollar 5,008,123 1,783,525 4,812,384 –Norwegian Krone 24,657,161 6,403,137 25,479,679 –Philippine Peso 2,219,444 – – –Polish Zloty 2,949,201 8,408,688 – –Singapore Dollar 42,090,664 3,813,610 51,977,284 – South African Rand 25,078,599 4,116,002 11,571,713 –South Korean Won 71,317,427 13,526,890 62,696,222 –Swedish Krona 27,254,280 10,680,201 35,264,901 –Swiss Franc 138,838,635 7,455,551 154,181,296 –Thailand Baht 3,954,203 4,274,188 – –Turkish Lira 2,811,622 – – –Foreign investments denominated in U.S. Dollars 248,658,533 51,621,257 215,305,621 37,951,769 Total $ 2,013,366,729 $ 385,628,617 $ 2,195,241,217 $ 37,951,769
Certain investments held in infrastructure funds trade in a reported currency of Euro-based dollars valued at $53,539,234 and $50,878,191 as of June 30, 2012 and 2011, respectively. The table below presents the foreign currency risk by type of investment as of June 30, 2012 and 2011.
26 State Employees’ Retirement System of Illinois
F I N A N C I A L S T A T E M E N T S
Securities Lending The ISBI participates in a securities lending program with Credit Suisse AG, New York Branch who acts as securities lending agent. Securities are loaned to bro-kers and, in return, the ISBI receives cash and non-cash collateral. All of the securities are eligible for the securi-ties lending program. Collateral consists solely of cash and government securities having a fair value equal to or exceeding 102% of the value of the loaned securities (105% for non-U.S. securities). In the event of borrower default, Credit Suisse AG, New York Branch provides the ISBI with counterparty default indemnification. Invest-ments in the cash collateral account represent securities that were distributed to the ISBI in connection with the in-kind redemption of the ISBI’s ownership in the State Street Bank and Trust Company Quality Funds for Short-Term Investment (“Quality D”). Credit Suisse is not responsible for any losses with regards to these legacy investments. This arrangement subjects the ISBI to credit risk as the credit quality of these investments may decline over time. The credit risk on the legacy investments is the risk of a possible loss arising from the inability of a counterparty to meet its obligations. These losses could include the loss of principal, interest and/or decreased expected cash flows in any of the invest-ments held in the ISBI’s cash collateral account. In the event a counterparty defaults on its obligations, the ISBI would need to credit the cash collateral account with the amount of the default to make the account whole so that once loaned securities are returned, the cash pledged by borrowers is returned to them. As of June 30, 2012 and 2011, respectively, the collateral received exceeded the fair value of the securities loaned. As of June 30, 2012 and 2011, there were outstanding loaned investment securities having fair values of $115,655,166 and $221,448,333, respectively; against which col-lateral was received with a fair value of $120,556,697 and $230,083,146, respectively. Collateral received at June 30, 2012 and 2011 consisted of $72,452,520 and $216,717,213, respectively, in cash and $48,104,177 and $13,987,903, respectively, in securities for which the ISBI does not have the ability to pledge or sell.
The cash collateral received is invested in a short-term investment pool having a fair value of $67,901,315 and $211,162,204 as of June 30, 2012 and 2011, respectively. This investment pool had an average duration of 32.42 days and 31.18 days as of June 30, 2012 and 2011, respectively. Any decrease in the fair value of invested cash collateral is recorded by the ISBI as unrealized losses and reported as a component of the investment income/loss on the ISBI’s Statement of Changes in Net Assets.
Cash and cash equivalents included in the System’s Statement of Plan Net Assets consist of deposits held in the State Treasury. The Illinois Office of the Trea-
surer invests the deposits held and allocates investment income on a monthly basis.
The State Treasurer lends securities to broker-dealers and other entities for collateral that will be returned for the same securities in the future. The State Treasurer has, through a Securities Lending Agreement, autho-rized Deutsche Bank Group to lend the State Treasur-er’s securities to broker–dealers and banks pursuant to a form of loan agreement.
During fiscal years 2012 and 2011, Deutsche Bank Group lent U.S. Treasury and U.S. Agency securities and received as collateral U.S. dollar denominated cash. Borrowers were required to deliver collateral for each loan equal to at least 100% of the aggre-gated market value of the loaned securities. Loans are marked to market daily. If the market value of collateral falls below 100%, the borrower must provide additional collateral to raise the market value to 100%.
The State Treasurer did not impose any restrictions during fiscal years 2012 and 2011 on the amount of the loans of available, or the eligible securities. In the event of borrower default, Deutsche Bank Group provides the State Treasurer with counterparty default indemnifica-tion. In addition, Deutsche Bank Group is obligated to indemnify the State Treasurer if the Deutsche Bank Group loses any securities, collateral or investments of the State Treasurer in Deutsche Bank Group’s custody. Moreover, there were no losses during the fiscal years 2012 and 2011 resulting from a default of the borrowers or Deutsche Bank Group.
During fiscal years 2012 and 2011, the State Treasurer and borrowers maintained the right to terminate all securities lending transactions on demand. The cash collateral received on each loan was invested in repurchase agreements with approved counterparties collateralized with securities approved by Deutsche Bank Group and marked to market daily at no less than 102%. Because the loans are terminable at will, their duration did not generally match the duration of the investments made with the cash collateral. The State Treasurer had no credit risk as a result of its securities lending program as the collateral held exceeded the fair value of the securities lent. The securities lend-ing collateral invested in repurchase agreements and the fair value of securities on loan for the State Trea-surer as of June 30, 2012 were $4,556,511,251 and $4,551,829,732, respectively. The securities lending col-lateral invested in repurchase agreements and the fair value of securities on loan for the State Treasurer as of June 30, 2011 were $3,456,373,500 and $3,446,138,880, respectively. The System’s portion of securities lending collateral that was invested in repurchase agreements as of June 30, 2012 and June 30, 2011 were $72,867,000 and $26,414,000, respectively.
27 State Employees’ Retirement System of Illinois
F I N A N C I A L S T A T E M E N T S
Derivative Securities In fiscal year 2010, the ISBI implemented GASB State-ment No. 53 Accounting and Financial Reporting for Derivative Instruments with respect to investments held in derivative securities. A derivative security is an investment whose payoff depends upon the value of other assets such as commodity prices, bond and stock prices, or a market index. The ISBI invests in derivative instruments including forward foreign currency con-tracts, futures, rights and warrants. The ISBI’s deriva-tives are considered investment derivatives.
Foreign currency forward contracts (FX forwards) are used to protect against the currency risk in the ISBI’s foreign equity portfolio. A foreign currency forward contract is an agreement to buy or sell a specific amount of a foreign currency at a specified delivery or maturity date for an agreed-upon price. Fluctua-tions in the market value of foreign currency forward contracts are marked to market on a daily basis. These investments are reported at fair value in the investment section of the ISBI’s Statement of Net Assets. The gain or loss arising from the difference between the original contracts and the closing of such contracts is recog-nized in the net increase/decrease in the fair value of investments in the ISBI’s Statement of Changes in Net Assets. In May 2011, the ISBI removed language from the investment management agreements allowing managers to hedge foreign currencies and/or to hedge equity positions.
The ISBI’s investment managers use financial futures to replicate an underlying security they wish to hold (sell) in the portfolio. In certain instances, it may be benefi-cial to own a futures contract rather than the underly-ing security (arbitrage). Additionally, financial futures are used in the ISBI’s fixed income portfolio to adjust portfolio strategy and overall portfolio duration. A financial futures contract is an agreement to buy or sell a specific amount at a specified delivery or maturity date for an agreed-upon price. As the fair values of the futures contract vary from the original contract price, a gain or loss is recognized and paid to or received from the clearinghouse. The gain or loss is recognized in the net increase/decrease in the fair value of investments in the ISBI’s Statement of Changes in Net Assets. Financial futures represent an off-balance sheet obligation, as there are no balance sheet assets or liabilities associ-ated with those contracts. The cash or securities to meet these obligations are held in the ISBI’s investment portfolio.
The ISBI’s investment managers use options in an at-tempt to add value to the portfolio (collect premiums)
or protect (hedge) a position in the portfolio. Financial options are an agreement that gives one party the right, but not the obligation, to buy or sell a specific amount of an asset for a specified price, called the strike price, on or before a specified expiration date. As a writer of financial options, the ISBI receives a pre-mium at the outset of the agreement and bears the risk of an unfavorable change in the price of the financial instrument underlying the option. All written financial options are recognized as a liability in the ISBI’s State-ment of Net Assets. As a purchaser of financial options, the ISBI pays a premium at the outset of the agreement and the counterparty bears the risk of an unfavorable change in the price of the financial instrument underly-ing the option. The gain or loss associated with options is recognized in the net increase/decrease in the fair value of investments in the ISBI’s Statement of Changes in Net Assets.
Rights and warrants allow the ISBI’s investment manag-ers to replicate an underlying security they wish to hold (sell) in the portfolio. Rights and warrants provide the holder with the right, but not the obligation, to buy or sell a company’s stock at a predetermined price. Rights usually expire after a few weeks and warrants can expire from one to several years. Under certain circumstances, a type of warrant called Participatory Notes (P-Notes) are used in the portfolio by the ISBI’s investment managers that are not registered to trade in domestic Indian Capital Markets. P-Notes are issued by Indian-based brokerage firms against an underly-ing Indian security permitting holders to get a share in the income from the security. These investments are reported at fair value in the investment section of the ISBI’s Statement of Net Assets within the common stock and foreign equity classifications. The gain or loss associated with rights and warrants is recognized in the net increase/decrease in the fair value of investments in the ISBI’s Statement of Changes in Net Assets.
The fair values of the forward contracts are estimated based on the present value of their estimated future cash flows. Futures contracts are exchange traded instruments where the fair value is determined by the equilibrium between the forces of supply and demand. The fair value of a right or warrant closely tracks the intrinsic value of the underlying stock and can be de-termined either by formulaic methodology (most com-monly Black-Scholes) or intrinsic value methodology.
28 State Employees’ Retirement System of Illinois
F I N A N C I A L S T A T E M E N T S
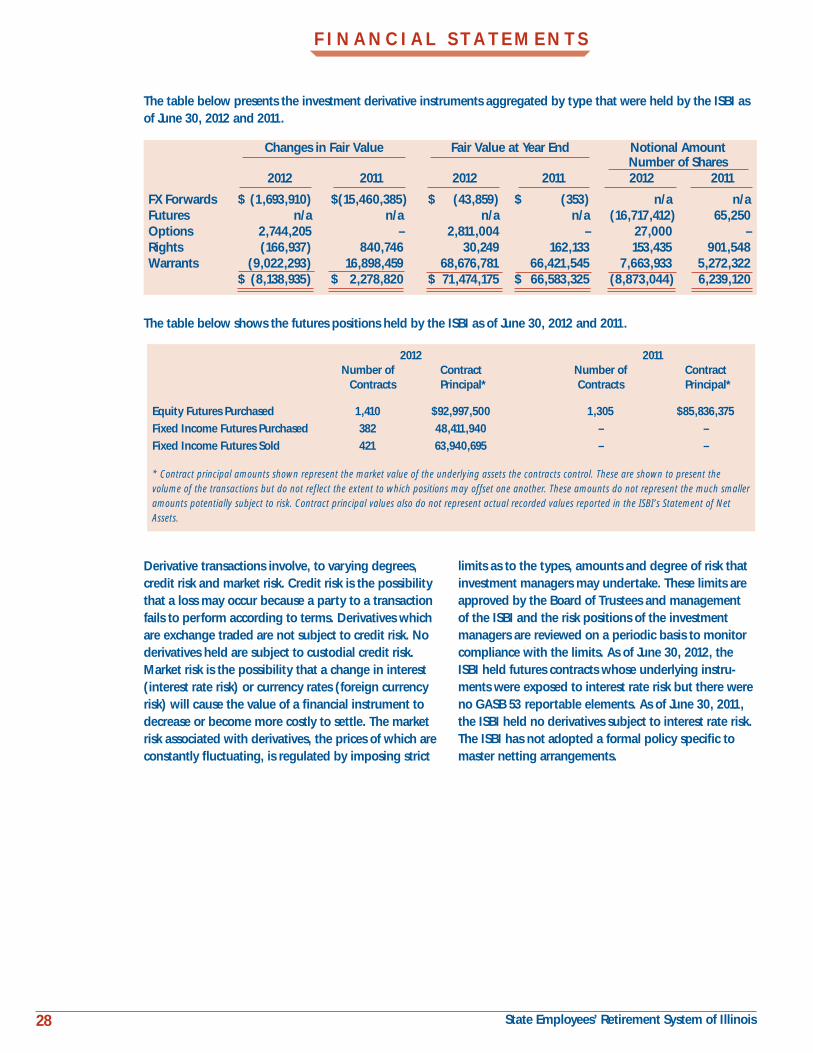
Changes in Fair Value Fair Value at Year End Notional Amount Number of Shares 2012 2011 2012 2011 2012 2011
FX Forwards $ (1,693,910) $ (15,460,385) $ (43,859) $ (353) n/a n/a Futures n/a n/a n/a n/a (16,717,412) 65,250Options 2,744,205 – 2,811,004 – 27,000 –Rights (166,937) 840,746 30,249 162,133 153,435 901,548Warrants (9,022,293) 16,898,459 68,676,781 66,421,545 7,663,933 5,272,322 $ (8,138,935) $ 2,278,820 $ 71,474,175 $ 66,583,325 (8,873,044) 6,239,120
Derivative transactions involve, to varying degrees, credit risk and market risk. Credit risk is the possibility that a loss may occur because a party to a transaction fails to perform according to terms. Derivatives which are exchange traded are not subject to credit risk. No derivatives held are subject to custodial credit risk. Market risk is the possibility that a change in interest (interest rate risk) or currency rates (foreign currency risk) will cause the value of a financial instrument to decrease or become more costly to settle. The market risk associated with derivatives, the prices of which are constantly fluctuating, is regulated by imposing strict
limits as to the types, amounts and degree of risk that investment managers may undertake. These limits are approved by the Board of Trustees and management of the ISBI and the risk positions of the investment managers are reviewed on a periodic basis to monitor compliance with the limits. As of June 30, 2012, the ISBI held futures contracts whose underlying instru-ments were exposed to interest rate risk but there were no GASB 53 reportable elements. As of June 30, 2011, the ISBI held no derivatives subject to interest rate risk. The ISBI has not adopted a formal policy specific to master netting arrangements.
The table below presents the investment derivative instruments aggregated by type that were held by the ISBI as of June 30, 2012 and 2011.
2012 2011 Number of Contract Number of Contract Contracts Principal* Contracts Principal*
Equity Futures Purchased 1,410 $92,997,500 1,305 $85,836,375
Fixed Income Futures Purchased 382 48,411,940 – –
Fixed Income Futures Sold 421 63,940,695 – – * Contract principal amounts shown represent the market value of the underlying assets the contracts control. These are shown to present the volume of the transactions but do not reflect the extent to which positions may offset one another. These amounts do not represent the much smaller amounts potentially subject to risk. Contract principal values also do not represent actual recorded values reported in the ISBI’s Statement of Net Assets.
The table below shows the futures positions held by the ISBI as of June 30, 2012 and 2011.

29 State Employees’ Retirement System of Illinois
F I N A N C I A L S T A T E M E N T S
Other InformationThe System owns approximately 94% of the net invest-ment assets of the ISBI Commingled Fund as of June 30, 2012 and 2011. A schedule of investment expenses is included in the ISBI’s annual report.
For additional information on ISBI’s investments, please refer to their Annual Report as of June 30, 2012. A copy of the report can be obtained from the ISBI at 180 North LaSalle Street, Suite 2015, Chicago, Illinois 60601.
2012 2011
Moody’s Net Percentage of Net Pecentage ofRating Fair Value Exposure Net Exposure Fair Value Exposure Net Exposure
Aa3 $ 45,189 $ 45,189 11.50% $ 188 $ 188 0.01%Aa2 46,885 46,885 12.00% – – –A3 84,367 84,367 21.59% 2,736,018 2,736,018 99.99%A2 64,971 64,971 16.62% – – –A1 3,119 3,119 0.80% – – –Baa1 146,228 146,228 37.42% – – – $ 390,759 $ 390,759 100.00% $ 2,736,206 $ 2,736,206 100.00%
The ISBI’s derivative investments in foreign currency forward contracts are held with counterparties. The credit ratings and net exposure as of June 30, 2012 and 2011 for the counterparties are as follows:
2012 2011 Currency FX Forwards Rights Warrants Options FX Forwards Rights Warrants OptionsAustralian Dollar $ (85,578) $ – $ – $ – $ – $ – $ – $ –Brazilian Real 1,589 – – – – – – –Canadian Dollar (13,256) 10,733 – – – – – –Chilean Peso 1,450 1,296 – – – – – –Columbian Peso (15,312) – – – – – – –Czech Koruna 9,411 – – – – – – –Danish Krone (30) – – – – – – –Egyptian Pound (148) – – – – – – –English Pound Sterling 49,917 – – – – – – –Euro Currency 118,889 18,220 6,103 – (391) 153,078 – –Hong Kong Dollar 234 – – – – 9,055 – –Indonesian Rupiah (619) – – – – – – –Japanese Yen (19,071) – – – 38 – – –Malaysian Ringgit (1,234) – – – – – – –Mexican Peso 27,008 – – – – – – –New Zealand Dollar 46,885 – – – – – – –Norwegian Krone 4,157 – – – – – – –Polish Zloty (32,461) – – – – – – –Singapore Dollar (13,207) – – – – – – –South African Rand 14,798 – – – – – – –South Korean Won 23,502 – – – – – – –Swedish Krona (154,835) – – – – – – –Swiss Franc (5,251) – – – – – – –Thailand Baht (697) – – – – – – –Investments denominated in U.S. dollars – – 68,670,678 2,806,363 – – 66,421,545 –
$ (43,859) $ 30,249 $ 68,676,781 $ 2,806,363 $ (353) $ 162,133 $ 66,421,545 $ –
The following table presents the fair value of derivative investments exposed to foreign currency risk as of June 30, 2012 and 2011:
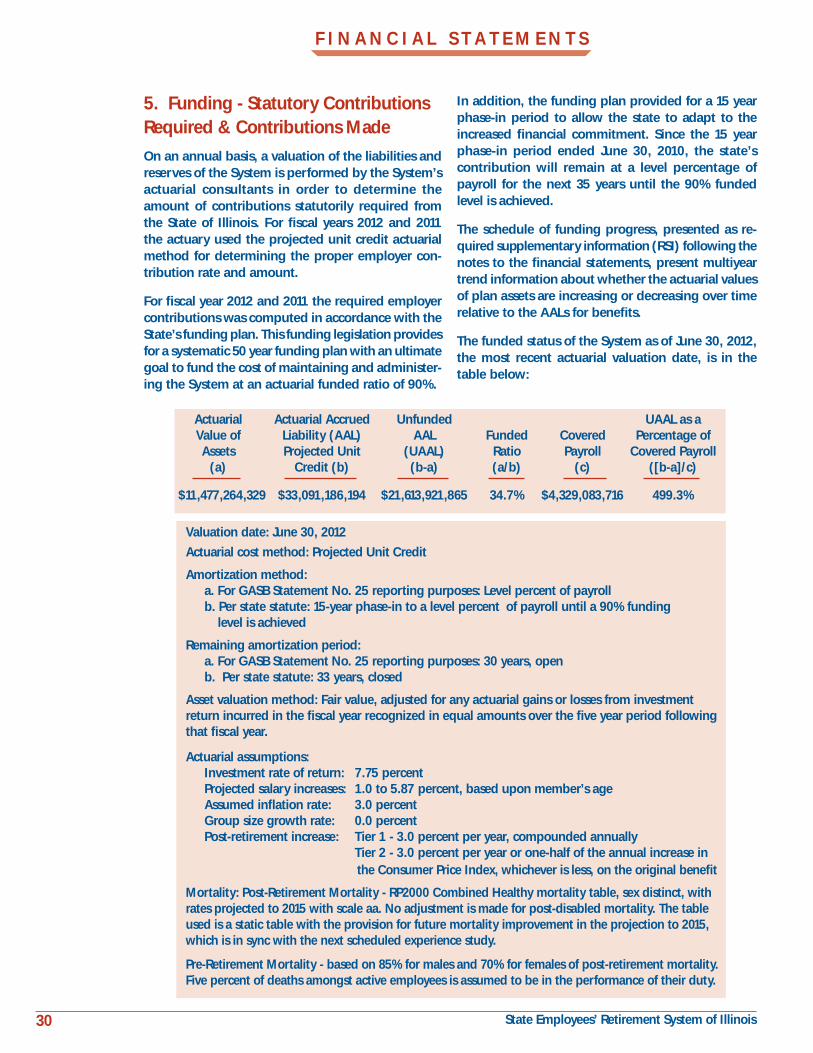
30 State Employees’ Retirement System of Illinois
5. Funding - Statutory Contributions Required & Contributions Made
On an annual basis, a valuation of the liabilities and reserves of the System is performed by the System’s actuarial consultants in order to determine the amount of contributions statutorily required from the State of Illinois. For fiscal years 2012 and 2011 the actuary used the projected unit credit actuarial method for determining the proper employer con-tribution rate and amount.
For fiscal year 2012 and 2011 the required employer contributions was computed in accordance with the State’s funding plan. This funding legislation provides for a systematic 50 year funding plan with an ultimate goal to fund the cost of maintaining and administer-ing the System at an actuarial funded ratio of 90%.
F I N A N C I A L S T A T E M E N T S
Valuation date: June 30, 2012
Actuarial cost method: Projected Unit Credit
Amortization method: a. For GASB Statement No. 25 reporting purposes: Level percent of payroll b. Per state statute: 15-year phase-in to a level percent of payroll until a 90% funding level is achieved Remaining amortization period: a. For GASB Statement No. 25 reporting purposes: 30 years, open b. Per state statute: 33 years, closed
Asset valuation method: Fair value, adjusted for any actuarial gains or losses from investment return incurred in the fiscal year recognized in equal amounts over the five year period following that fiscal year.
Actuarial assumptions: Investment rate of return: 7.75 percent Projected salary increases: 1.0 to 5.87 percent, based upon member’s age Assumed inflation rate: 3.0 percent Group size growth rate: 0.0 percent Post-retirement increase: Tier 1 - 3.0 percent per year, compounded annually Tier 2 - 3.0 percent per year or one-half of the annual increase in the Consumer Price Index, whichever is less, on the original benefit
Mortality: Post-Retirement Mortality - RP2000 Combined Healthy mortality table, sex distinct, with rates projected to 2015 with scale aa. No adjustment is made for post-disabled mortality. The table used is a static table with the provision for future mortality improvement in the projection to 2015, which is in sync with the next scheduled experience study.
Pre-Retirement Mortality - based on 85% for males and 70% for females of post-retirement mortality. Five percent of deaths amongst active employees is assumed to be in the performance of their duty.
In addition, the funding plan provided for a 15 year phase-in period to allow the state to adapt to the increased financial commitment. Since the 15 year phase-in period ended June 30, 2010, the state’s contribution will remain at a level percentage of payroll for the next 35 years until the 90% funded level is achieved.
The schedule of funding progress, presented as re-quired supplementary information (RSI) following the notes to the financial statements, present multiyear trend information about whether the actuarial values of plan assets are increasing or decreasing over time relative to the AALs for benefits.
The funded status of the System as of June 30, 2012, the most recent actuarial valuation date, is in the table below:
Actuarial Actuarial Accrued Unfunded UAAL as a Value of Liability (AAL) AAL Funded Covered Percentage of Assets Projected Unit (UAAL) Ratio Payroll Covered Payroll (a) Credit (b) (b-a) (a/b) (c) ([b-a]/c)
$11,477,264,329 $33,091,186,194 $21,613,921,865 34.7% $4,329,083,716 499.3%
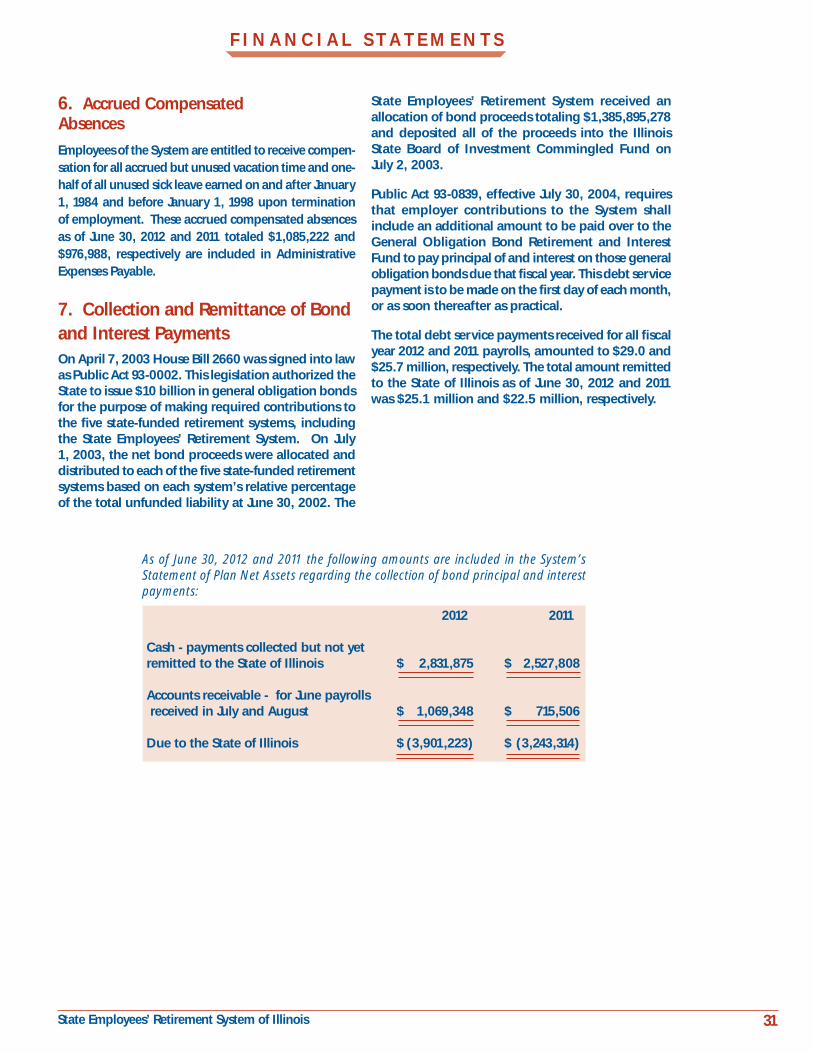
31 State Employees’ Retirement System of Illinois
F I N A N C I A L S T A T E M E N T S
State Employees’ Retirement System received an allocation of bond proceeds totaling $1,385,895,278 and deposited all of the proceeds into the Illinois State Board of Investment Commingled Fund on July 2, 2003.
Public Act 93-0839, effective July 30, 2004, requires that employer contributions to the System shall include an additional amount to be paid over to the General Obligation Bond Retirement and Interest Fund to pay principal of and interest on those general obligation bonds due that fiscal year. This debt service payment is to be made on the first day of each month, or as soon thereafter as practical.
The total debt service payments received for all fiscal year 2012 and 2011 payrolls, amounted to $29.0 and $25.7 million, respectively. The total amount remitted to the State of Illinois as of June 30, 2012 and 2011 was $25.1 million and $22.5 million, respectively.
6. Accrued Compensated Absences
Employees of the System are entitled to receive compen-sation for all accrued but unused vacation time and one-half of all unused sick leave earned on and after January 1, 1984 and before January 1, 1998 upon termination of employment. These accrued compensated absences as of June 30, 2012 and 2011 totaled $1,085,222 and $976,988, respectively are included in Administrative Expenses Payable.
7. Collection and Remittance of Bond and Interest PaymentsOn April 7, 2003 House Bill 2660 was signed into law as Public Act 93-0002. This legislation authorized the State to issue $10 billion in general obligation bonds for the purpose of making required contributions to the five state-funded retirement systems, including the State Employees’ Retirement System. On July 1, 2003, the net bond proceeds were allocated and distributed to each of the five state-funded retirement systems based on each system’s relative percentage of the total unfunded liability at June 30, 2002. The
2012 2011
Cash - payments collected but not yet remitted to the State of Illinois $ 2,831,875 $ 2,527,808
Accounts receivable - for June payrolls received in July and August $ 1,069,348 $ 715,506
Due to the State of Illinois $ (3,901,223) $ (3,243,314)
As of June 30, 2012 and 2011 the following amounts are included in the System’s Statement of Plan Net Assets regarding the collection of bond principal and interest payments:
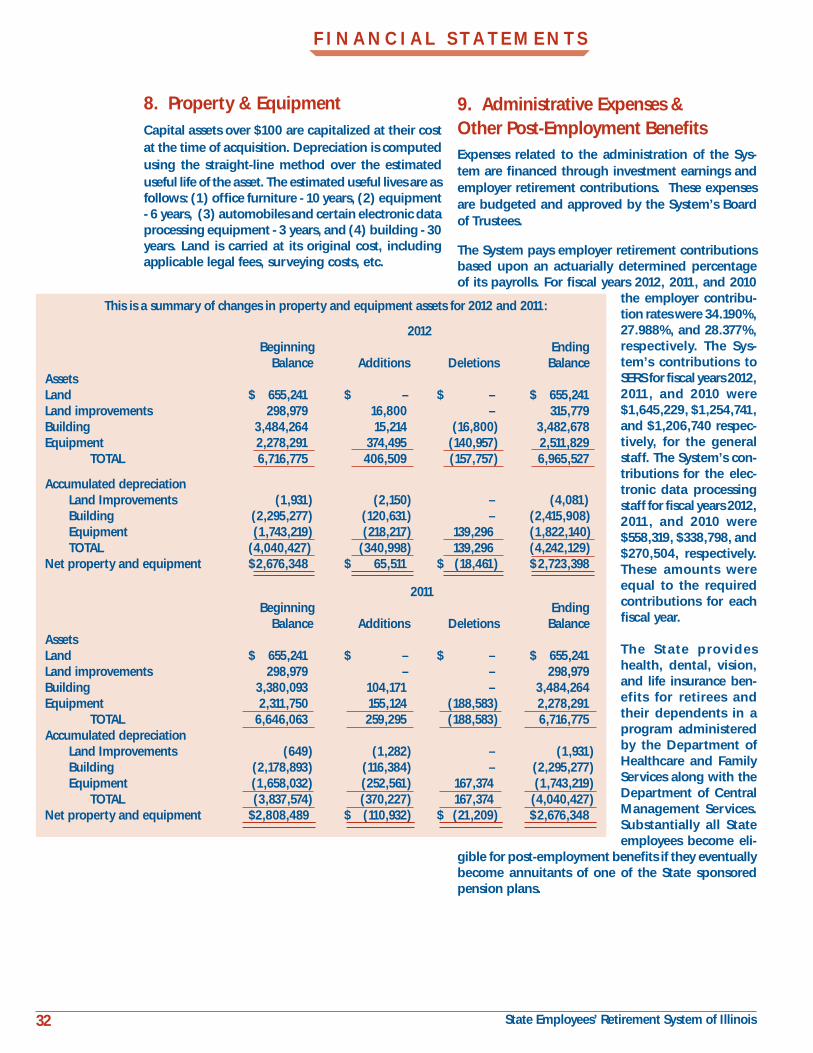
32 State Employees’ Retirement System of Illinois
This is a summary of changes in property and equipment assets for 2012 and 2011:
2012 Beginning Ending Balance Additions Deletions BalanceAssetsLand $ 655,241 $ – $ – $ 655,241Land improvements 298,979 16,800 – 315,779Building 3,484,264 15,214 (16,800) 3,482,678Equipment 2,278,291 374,495 (140,957) 2,511,829 TOTAL 6,716,775 406,509 (157,757) 6,965,527
Accumulated depreciation Land Improvements (1,931) (2,150) – (4,081) Building (2,295,277) (120,631) – (2,415,908) Equipment (1,743,219) (218,217) 139,296 (1,822,140) TOTAL (4,040,427) (340,998) 139,296 (4,242,129)Net property and equipment $ 2,676,348 $ 65,511 $ (18,461) $ 2,723,398
2011 Beginning Ending Balance Additions Deletions BalanceAssetsLand $ 655,241 $ – $ – $ 655,241Land improvements 298,979 – – 298,979Building 3,380,093 104,171 – 3,484,264Equipment 2,311,750 155,124 (188,583) 2,278,291 TOTAL 6,646,063 259,295 (188,583) 6,716,775Accumulated depreciation Land Improvements (649) (1,282) – (1,931) Building (2,178,893) (116,384) – (2,295,277) Equipment (1,658,032) (252,561) 167,374 (1,743,219) TOTAL (3,837,574) (370,227) 167,374 (4,040,427)Net property and equipment $ 2,808,489 $ (110,932) $ (21,209) $ 2,676,348
8. Property & EquipmentCapital assets over $100 are capitalized at their cost at the time of acquisition. Depreciation is computed using the straight-line method over the estimated useful life of the asset. The estimated useful lives are as follows: (1) office furniture - 10 years, (2) equipment - 6 years, (3) automobiles and certain electronic data processing equipment - 3 years, and (4) building - 30 years. Land is carried at its original cost, including applicable legal fees, surveying costs, etc.
9. Administrative Expenses & Other Post-Employment BenefitsExpenses related to the administration of the Sys-tem are financed through investment earnings and employer retirement contributions. These expenses are budgeted and approved by the System’s Board of Trustees.
The System pays employer retirement contributions based upon an actuarially determined percentage of its payrolls. For fiscal years 2012, 2011, and 2010
the employer contribu-tion rates were 34.190%, 27.988%, and 28.377%, respectively. The Sys-tem’s contributions to SERS for fiscal years 2012, 2011, and 2010 were $1,645,229, $1,254,741, and $1,206,740 respec-tively, for the general staff. The System’s con-tributions for the elec-tronic data processing staff for fiscal years 2012, 2011, and 2010 were $558,319, $338,798, and $270,504, respectively. These amounts were equal to the required contributions for each fiscal year.
The State provides health, dental, vision, and life insurance ben-ef its for retirees and their dependents in a program administered by the Department of Healthcare and Family Services along with the Department of Central Management Services. Substantially all State employees become eli-
gible for post-employment benefits if they eventually become annuitants of one of the State sponsored pension plans.
F I N A N C I A L S T A T E M E N T S
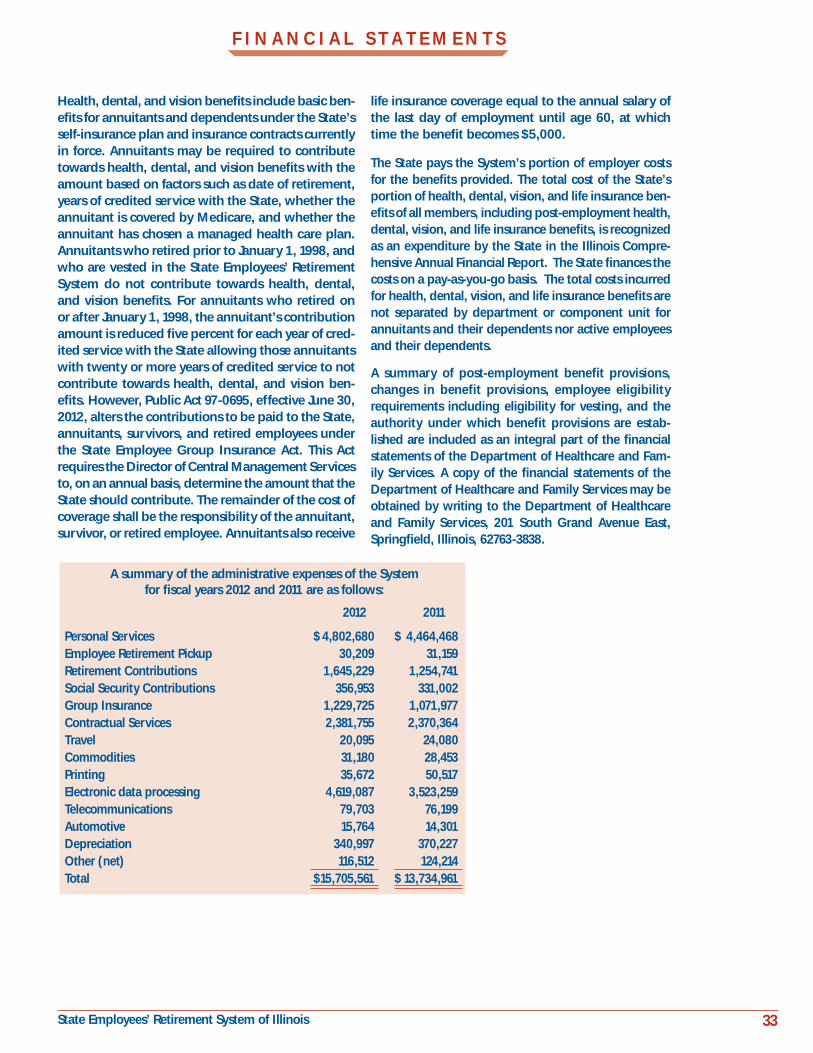
33 State Employees’ Retirement System of Illinois
Health, dental, and vision benefits include basic ben-efits for annuitants and dependents under the State’s self-insurance plan and insurance contracts currently in force. Annuitants may be required to contribute towards health, dental, and vision benefits with the amount based on factors such as date of retirement, years of credited service with the State, whether the annuitant is covered by Medicare, and whether the annuitant has chosen a managed health care plan. Annuitants who retired prior to January 1, 1998, and who are vested in the State Employees’ Retirement System do not contribute towards health, dental, and vision benefits. For annuitants who retired on or after January 1, 1998, the annuitant’s contribution amount is reduced five percent for each year of cred-ited service with the State allowing those annuitants with twenty or more years of credited service to not contribute towards health, dental, and vision ben-efits. However, Public Act 97-0695, effective June 30, 2012, alters the contributions to be paid to the State, annuitants, survivors, and retired employees under the State Employee Group Insurance Act. This Act requires the Director of Central Management Services to, on an annual basis, determine the amount that the State should contribute. The remainder of the cost of coverage shall be the responsibility of the annuitant, survivor, or retired employee. Annuitants also receive
A summary of the administrative expenses of the Systemfor fiscal years 2012 and 2011 are as follows:
2012 2011
Personal Services $ 4,802,680 $ 4,464,468Employee Retirement Pickup 30,209 31,159Retirement Contributions 1,645,229 1,254,741Social Security Contributions 356,953 331,002Group Insurance 1,229,725 1,071,977Contractual Services 2,381,755 2,370,364Travel 20,095 24,080Commodities 31,180 28,453Printing 35,672 50,517Electronic data processing 4,619,087 3,523,259Telecommunications 79,703 76,199 Automotive 15,764 14,301Depreciation 340,997 370,227Other (net) 116,512 124,214Total $ 15,705,561 $ 13,734,961
life insurance coverage equal to the annual salary of the last day of employment until age 60, at which time the benefit becomes $5,000.
The State pays the System’s portion of employer costs for the benefits provided. The total cost of the State’s portion of health, dental, vision, and life insurance ben-efits of all members, including post-employment health, dental, vision, and life insurance benefits, is recognized as an expenditure by the State in the Illinois Compre-hensive Annual Financial Report. The State finances the costs on a pay-as-you-go basis. The total costs incurred for health, dental, vision, and life insurance benefits are not separated by department or component unit for annuitants and their dependents nor active employees and their dependents.
A summary of post-employment benefit provisions, changes in benefit provisions, employee eligibility requirements including eligibility for vesting, and the authority under which benefit provisions are estab-lished are included as an integral part of the financial statements of the Department of Healthcare and Fam-ily Services. A copy of the financial statements of the Department of Healthcare and Family Services may be obtained by writing to the Department of Healthcare and Family Services, 201 South Grand Avenue East, Springfield, Illinois, 62763-3838.
F I N A N C I A L S T A T E M E N T S
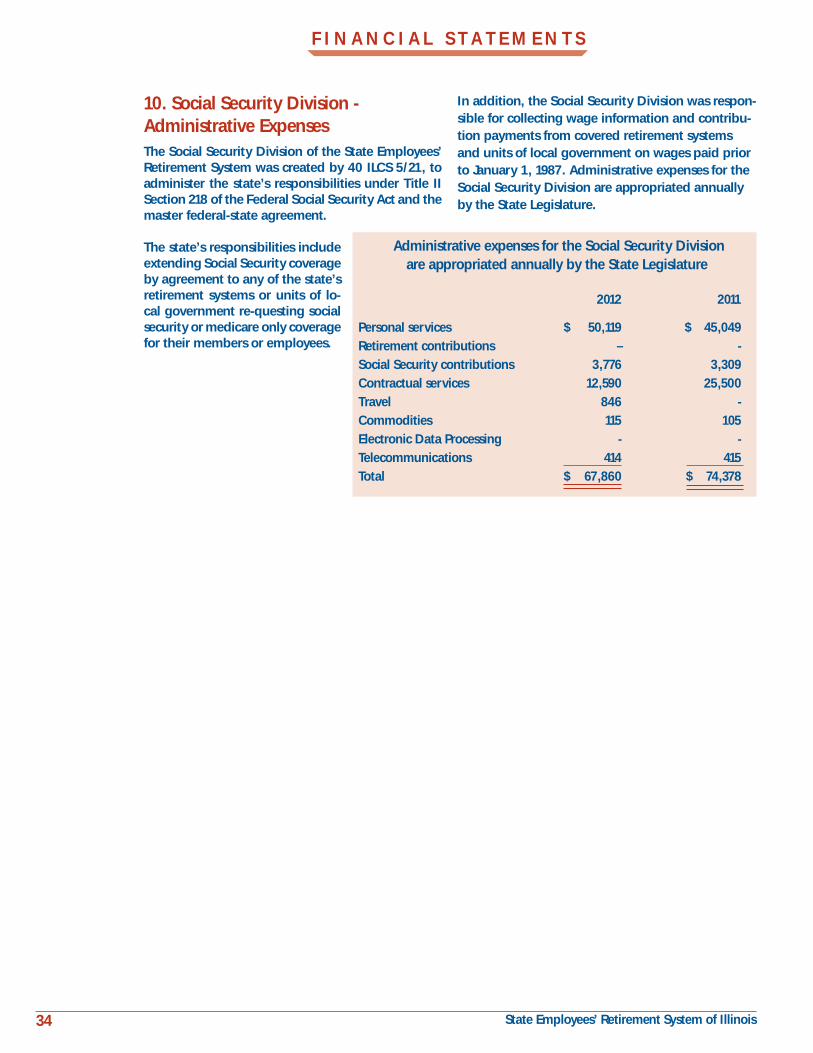
34 State Employees’ Retirement System of Illinois
F I N A N C I A L S T A T E M E N T S
10. Social Security Division - Administrative ExpensesThe Social Security Division of the State Employees’ Retirement System was created by 40 ILCS 5/21, to administer the state’s responsibilities under Title II Section 218 of the Federal Social Security Act and the master federal-state agreement.
The state’s responsibilities include extending Social Security coverage by agreement to any of the state’s retirement systems or units of lo-cal government re-questing social security or medicare only coverage for their members or employees.
Administrative expenses for the Social Security Division are appropriated annually by the State Legislature
2012 2011 Personal services $ 50,119 $ 45,049Retirement contributions – -Social Security contributions 3,776 3,309Contractual services 12,590 25,500Travel 846 -Commodities 115 105Electronic Data Processing - -Telecommunications 414 415Total $ 67,860 $ 74,378
In addition, the Social Security Division was respon-sible for collecting wage information and contribu-tion payments from covered retirement systems and units of local government on wages paid prior to January 1, 1987. Administrative expenses for the Social Security Division are appropriated annually by the State Legislature.
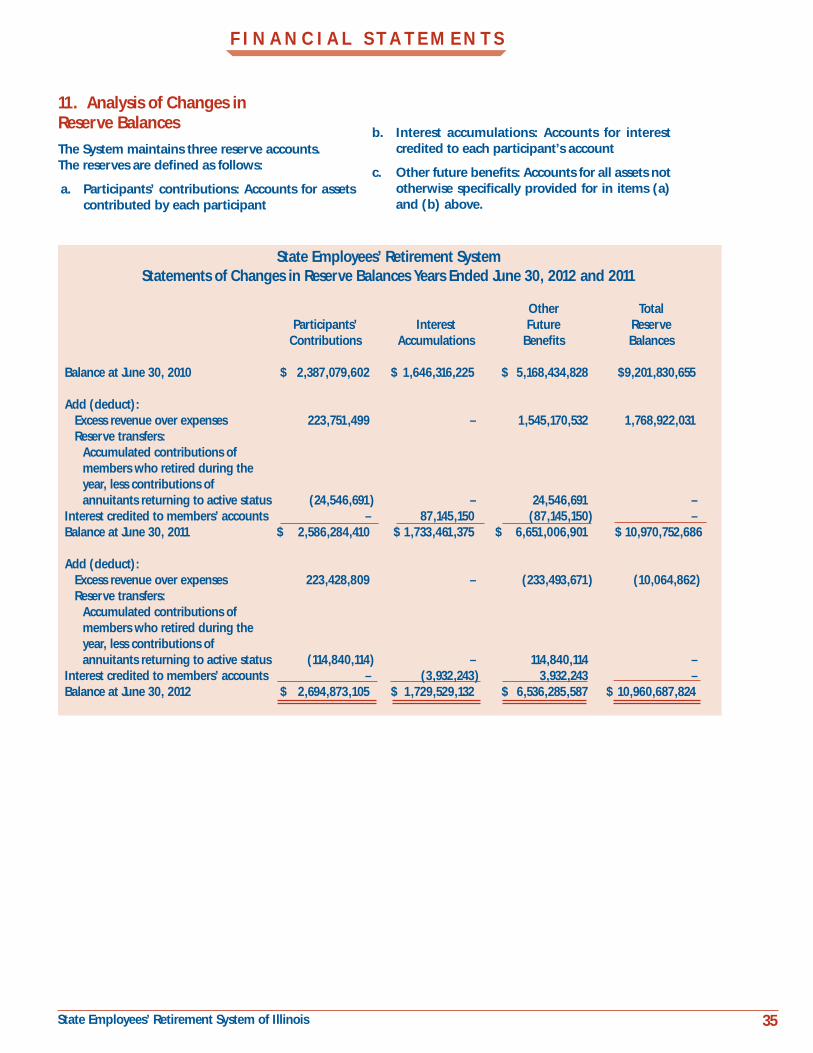
35 State Employees’ Retirement System of Illinois
F I N A N C I A L S T A T E M E N T S
State Employees’ Retirement SystemStatements of Changes in Reserve Balances Years Ended June 30, 2012 and 2011
Other Total Participants’ Interest Future Reserve Contributions Accumulations Benefits Balances
Balance at June 30, 2010 $ 2,387,079,602 $ 1,646,316,225 $ 5,168,434,828 $9,201,830,655
Add (deduct): Excess revenue over expenses 223,751,499 – 1,545,170,532 1,768,922,031 Reserve transfers: Accumulated contributions of members who retired during the year, less contributions of annuitants returning to active status (24,546,691) – 24,546,691 –Interest credited to members’ accounts – 87,145,150 (87,145,150) –Balance at June 30, 2011 $ 2,586,284,410 $ 1,733,461,375 $ 6,651,006,901 $ 10,970,752,686
Add (deduct): Excess revenue over expenses 223,428,809 – (233,493,671) (10,064,862) Reserve transfers: Accumulated contributions of members who retired during the year, less contributions of annuitants returning to active status (114,840,114) – 114,840,114 –Interest credited to members’ accounts – (3,932,243) 3,932,243 –Balance at June 30, 2012 $ 2,694,873,105 $ 1,729,529,132 $ 6,536,285,587 $ 10,960,687,824
11. Analysis of Changes in Reserve Balances
The System maintains three reserve accounts. The reserves are defined as follows:
a. Participants’ contributions: Accounts for assets contributed by each participant
b. Interest accumulations: Accounts for interest credited to each participant’s account
c. Other future benefits: Accounts for all assets not otherwise specifically provided for in items (a) and (b) above.
36 State Employees’ Retirement System of Illinois
F I N A N C I A L S T A T E M E N T S
12. New Accounting PronouncementsGASB Statement No. 67, “Financial Reporting for Pension Plans”, was established to provide improved financial reporting by state and local governmental pension plans. The scope of the Statement addresses accounting and financial reporting for the activities of pension plans that are administered through trusts
that have the specific characteristics. For defined benefit pension plans, the Statement establishes standards of financial reporting for separately issued financial reports and specifies the required approach to measuring the pension liability for benefits provid-ed through the pension plan. The System is required to implement this Statement for the year ending June 30, 2014.

37 State Employees’ Retirement System of Illinois
SCHEDULE OF FUNDING PROGRESS Actuarial Actuarial Accrued Unfunded UAAL as a Actuarial Value of Liability (AAL) AAL Funded Covered Percentage Valuation Assets Projected Unit (UAAL) Ratio Payroll Covered Payroll Date (a) Credit (b) (b-a) (a/b) (c) ([b-a]/c)
6/30/07 $12,078,908,954 $ 22,280,916,665 $ 10,202,007,711 54.2% $ 3,762,777,000 271.1% 6/30/08 10,995,366,485 23,841,280,102 12,845,913,617 46.1 3,967,704,000 323.8 6/30/09 10,999,953,527 25,298,346,092 14,298,392,565 43.5 4,027,263,000 355.0 6/30/10 10,961,540,164 29,309,464,296 18,347,924,132 37.4 4,119,360,842 445.4 6/30/11 11,159,836,617 31,395,007,782 20,235,171,165 35.6 4,211,186,269 480.5 6/30/12 11,477,264,329 33,091,186,194 21,613,921,865 34.7 4,329,083,716 499.3
* For fiscal years prior to 2009, the actuarial value of assets was equal to the fair value of assets. Beginning in fiscal year 2009, the actuarial value of assets was equal to the fair value of assets adjusted for any actuarial gains or losses from investment return incurred in the fiscal year recognized in equal amounts over the five year period following that fiscal year.
Annual Annual Required Required Year Contribution Payroll Contribution Ended per GASB Percentage per State Percentage June 30 Statement No. 25 (1) Contributed Statute(2) Contributed
2007 $ 823,802,760 43.6% $ 361,113,709 99%
2008 986,410,891 59.6 576,626,422 102
2009 1,003,432,849 77.2 769,851,595 101
2010 1,177,313,343 93.1 1,093,072,413 100
2011 1,289,002,005 87.5 1,102,783,348 102
2012 1,614,834,808 86.2 1,396,216,080 100
Notes to Required Supplementary Information
Valuation date: June 30, 2012Actuarial cost method: Projected Unit CreditAmortization method: a. For GASB Statement No. 25 reporting pur-poses – Level percent of payroll b. Per state statute – 15-year phase-in to a level percent of payroll until a 90% funding level is achievedRemaining amortization period: a. For GASB Statement No. 25 reporting pur-poses – 30 years, open b. Per state statute – 33 years, closedAsset valuation method – Fair value, adjusted for any actuarial gains or losses from investment return in-curred in the fiscal year recognized in equal amounts over the five year period following that fiscal year.Actuarial assumptions:
Investment rate of return – 7.75 percentProjected salary increases – 1.0 to 5.87 percent, based upon member’s age
R E Q U I R E D S U P P L E M E N T A R Y I N F O R M A T I O N
SCHEDULE OF EMPLOYER CONTRIBUTIONS
(1) This amount includes both payroll and non-payroll employer required contributions.(2) Employer required contribution determined in accordance with P.A. 88-0593, and P.A. 94-0004 (for Fiscal Years 2006 and 2007 only). These amounts reflect only payroll required contributions.
Assumed inflation rate – 3.0 percent Group size growth rate – 0.0 percent Post-retirement increase – Tier 1 - 3.0 percent per year, compounded annually Tier 2 - 3.0 percent per year or one-half of the annual increase in the Consumer Price Index, whichever is less, on the original benefit.
Mortality: Post-Retirement Mortality - RP2000 Com-bined Healthy mortality table, sex distinct, with rates projected to 2015 with scale aa. No adjustment is made for post-disabled mortality. The table used is a static table with the provision for future mortality improve-ment in the projection to 2015, which is in sync with the next scheduled experience study.
Pre-Retirement Mortality - based on 85% for males and 70% for females of post-retirement mortality. Five per-cent of deaths amongst active employees is assumed to be in the performance of their duty.
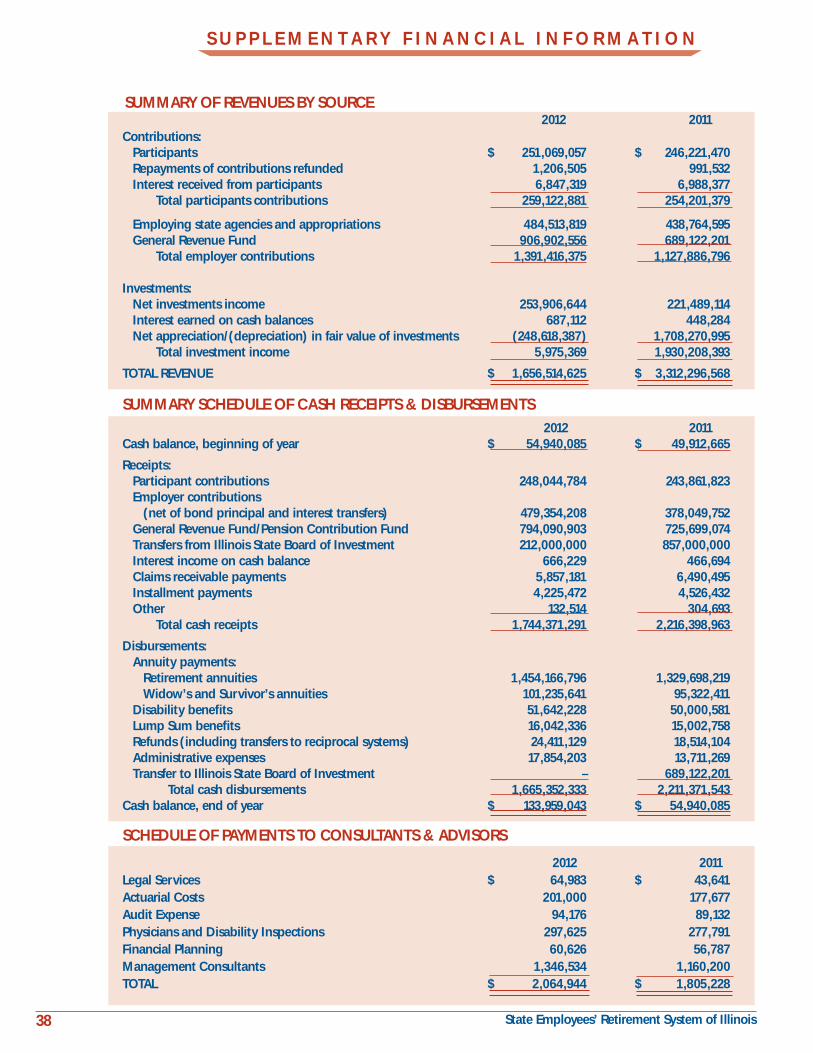
38 State Employees’ Retirement System of Illinois
S U P P L E M E N T A R Y F I N A N C I A L I N F O R M A T I O N
SUMMARY OF REVENUES BY SOURCE
Contributions: Participants $ 251,069,057 $ 246,221,470 Repayments of contributions refunded 1,206,505 991,532 Interest received from participants 6,847,319 6,988,377 Total participants contributions 259,122,881 254,201,379 Employing state agencies and appropriations 484,513,819 438,764,595 General Revenue Fund 906,902,556 689,122,201 Total employer contributions 1,391,416,375 1,127,886,796 Investments: Net investments income 253,906,644 221,489,114 Interest earned on cash balances 687,112 448,284 Net appreciation/(depreciation) in fair value of investments (248,618,387) 1,708,270,995 Total investment income 5,975,369 1,930,208,393 TOTAL REVENUE $ 1,656,514,625 $ 3,312,296,568
2012 2011Cash balance, beginning of year $ 54,940,085 $ 49,912,665 Receipts: Participant contributions 248,044,784 243,861,823 Employer contributions (net of bond principal and interest transfers) 479,354,208 378,049,752 General Revenue Fund/Pension Contribution Fund 794,090,903 725,699,074 Transfers from Illinois State Board of Investment 212,000,000 857,000,000 Interest income on cash balance 666,229 466,694 Claims receivable payments 5,857,181 6,490,495 Installment payments 4,225,472 4,526,432 Other 132,514 304,693 Total cash receipts 1,744,371,291 2,216,398,963
Disbursements: Annuity payments: Retirement annuities 1,454,166,796 1,329,698,219 Widow’s and Survivor’s annuities 101,235,641 95,322,411 Disability benefits 51,642,228 50,000,581 Lump Sum benefits 16,042,336 15,002,758 Refunds (including transfers to reciprocal systems) 24,411,129 18,514,104 Administrative expenses 17,854,203 13,711,269 Transfer to Illinois State Board of Investment – 689,122,201 Total cash disbursements 1,665,352,333 2,211,371,543Cash balance, end of year $ 133,959,043 $ 54,940,085
2012 2011Legal Services $ 64,983 $ 43,641Actuarial Costs 201,000 177,677Audit Expense 94,176 89,132Physicians and Disability Inspections 297,625 277,791Financial Planning 60,626 56,787Management Consultants 1,346,534 1,160,200TOTAL $ 2,064,944 $ 1,805,228
2012 2011
SCHEDULE OF PAYMENTS TO CONSULTANTS & ADVISORS
SUMMARY SCHEDULE OF CASH RECEIPTS & DISBURSEMENTS

39 State Employees’ Retirement System of Illinois
INVESTMENT SECTION
40 State Employees’ Retirement System of Illinois
INVESTMENT REPORT By state law, the System’s investment function is man-aged by the Illinois State Board of Investment (ISBI). The ISBI was created in 1969 to provide a means of centralizing the investment management function for public employee pension funds and retirement systems operating in the state.
In addition to the assets of the State Employees’ Retirement System, the ISBI also manages the in-vestment function for the Judges’ and General As-sembly Retirement Systems. All ISBI investments are accounted for in a commingled fund (ISBI Fund).
As of June 30, 2012, total net assets under man-agement valued at market, amounted to $11.284 billion. Of the total market value of assets under management, $10.675 billion or approximately 94% represented assets of the State Employees’ Retire-ment System.
A summary of the portfolio’s largest holdings, as well as the complete listing of the ISBI portfolio, are included in the ISBI Annual Report. A schedule of fees and commissions paid by brokerage firms and a listing of transactions executed, including transaction value, are also contained in the ISBI Annual Report. The following investment information and analysis has been prepared from information provided by the ISBI. Investment performance returns are prepared by State Street Bank. Investment activities are presented on a trade date basis and measurements are calcu-lated using time weighted rates of return consistent with investment industry standards.
INVESTMENT POLICYThe ISBI operates under a strategic investment policy. The investment objective of the total portfolio is to maximize the rate of return on investments within a prudent level of risk. To achieve this objective, the ISBI invests in different types of assets and uses multiple managers to ensure diversification.
EMERGING & MINORITY PARTICIPATIONIn accordance with Public Act 96-006, the ISBI Board continues to put forth best efforts to comply with the goals outlined in the ISBI’s following policies: the Emerg-ing and Minority Investment Manager and Minority and Illinois Broker Policy, the Fiduciary Diversification Policy, and the Minority Contract/Service Utilization
Policy. The aforementioned policies exemplify the ISBI Board’s commitment to providing opportunities for busi-nesses owned by minorities, females and persons with disabilities, as well as increasing the racial, ethnic and gender diversity of its fiduciaries.
As of fiscal year 2012, the ISBI allocated 21.6% of its assets to minority and female-owned firms, of which 10.3% was allocated to emerging firms. 18.0% of ISBI’s assets were allocated to minority-owned investment firms, and 4.4% to female-owned investment firms. Some investment firms qualify as both female-owned and minority-owned. Within asset classes, the ISBI has allocated 30.1% of equities, 17.6% of fixed income and 1.4% of alternatives to minority and female-owned firms. Alternatives include allocations to Real Estate funds and Private Equity funds.
The ISBI Board has established a goal of allocating 20% of brokerage commissions to broker dealers owned by females, minorities, or persons with disabilities. Invest-ment firms are required to execute trades directly with disadvantaged broker dealers and are prohibited from utilizing step-outs. During fiscal year 2012, utilization of such broker dealers by the ISBI Board’s investment advisers exceeded the Policy goals: approximately 44.9% utilization for domestic equity advisers, 28.9% utilization for fixed income advisers (based on par value) and 28.3% utilization for international equity advisers. The ISBI Board’s investment advisers also exceeded the Policy goal to direct 25% of trades to Illinois-based broker/dealers: approximately 51.4% utilization by domestic and international equity advisers and 27.6% utilization by fixed income advisers (based on par value).
In monitoring the utilization of disadvantaged broker dealers, the ISBI has retained a third party transaction cost analysis service provider to ensure the ISBI Board’s investment managers operate in a manner consistent with best execution practices.
ASSET ALLOCATIONThe investment policy of the ISBI establishes asset allo-cation targets and ranges for each asset class, selected to achieve overall risk and return objectives. This policy is implemented by allocations to investment managers with assignments to invest in specific asset classes, with defined security selection styles and methodologies.
The asset allocation policy for fiscal year 2012 is set forth on page 41.
I N V E S T M E N T S E C T I O N
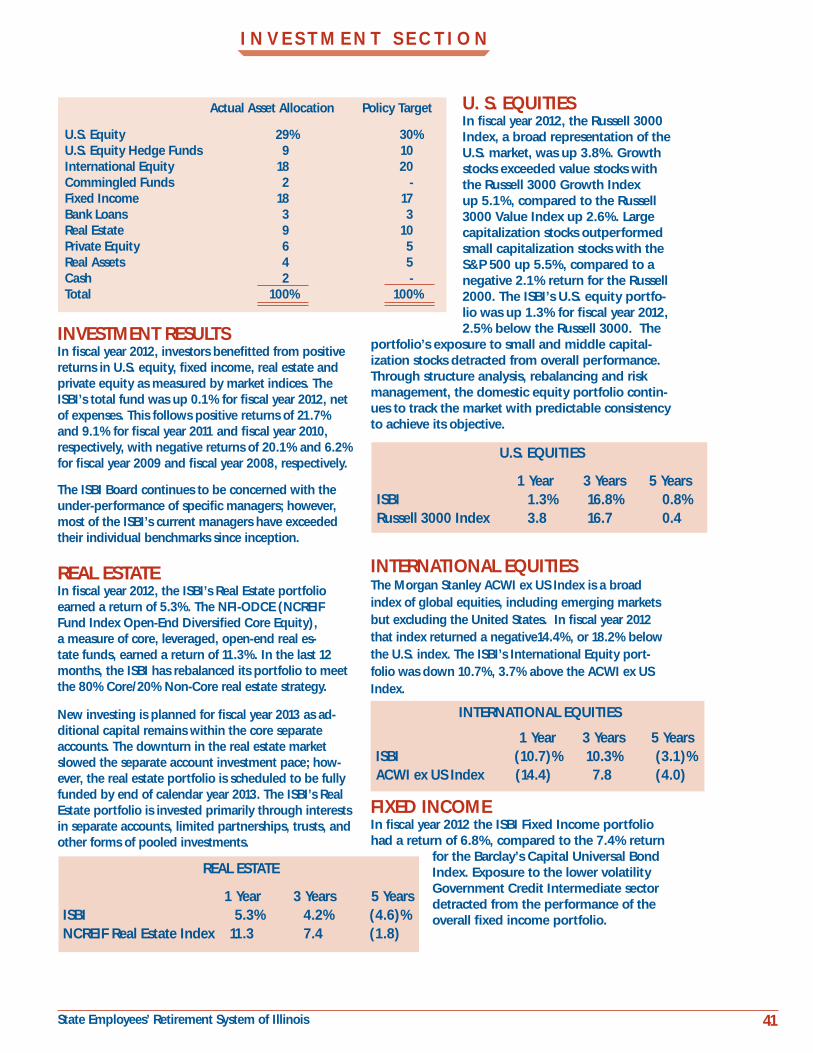
41 State Employees’ Retirement System of Illinois
I N V E S T M E N T S E C T I O N
INVESTMENT RESULTSIn fiscal year 2012, investors benefitted from positive returns in U.S. equity, fixed income, real estate and private equity as measured by market indices. The ISBI’s total fund was up 0.1% for fiscal year 2012, net of expenses. This follows positive returns of 21.7% and 9.1% for fiscal year 2011 and fiscal year 2010, respectively, with negative returns of 20.1% and 6.2% for fiscal year 2009 and fiscal year 2008, respectively.
The ISBI Board continues to be concerned with the under-performance of specific managers; however, most of the ISBI’s current managers have exceeded their individual benchmarks since inception.
REAL ESTATEIn fiscal year 2012, the ISBI’s Real Estate portfolio earned a return of 5.3%. The NFI-ODCE (NCREIF Fund Index Open-End Diversified Core Equity), a measure of core, leveraged, open-end real es-tate funds, earned a return of 11.3%. In the last 12 months, the ISBI has rebalanced its portfolio to meet the 80% Core/20% Non-Core real estate strategy.
New investing is planned for fiscal year 2013 as ad-ditional capital remains within the core separate accounts. The downturn in the real estate market slowed the separate account investment pace; how-ever, the real estate portfolio is scheduled to be fully funded by end of calendar year 2013. The ISBI’s Real Estate portfolio is invested primarily through interests in separate accounts, limited partnerships, trusts, and other forms of pooled investments.
U.S. EQUITIES
1 Year 3 Years 5 YearsISBI 1.3% 16.8% 0.8%Russell 3000 Index 3.8 16.7 0.4
INTERNATIONAL EQUITIES
1 Year 3 Years 5 YearsISBI (10.7)% 10.3% (3.1)%ACWI ex US Index (14.4) 7.8 (4.0)
REAL ESTATE
1 Year 3 Years 5 YearsISBI 5.3% 4.2% (4.6)%NCREIF Real Estate Index 11.3 7.4 (1.8)
U. S. EQUITIESIn fiscal year 2012, the Russell 3000 Index, a broad representation of the U.S. market, was up 3.8%. Growth stocks exceeded value stocks with the Russell 3000 Growth Index up 5.1%, compared to the Russell 3000 Value Index up 2.6%. Large capitalization stocks outperformed small capitalization stocks with the S&P 500 up 5.5%, compared to a negative 2.1% return for the Russell 2000. The ISBI’s U.S. equity portfo-lio was up 1.3% for fiscal year 2012, 2.5% below the Russell 3000. The
portfolio’s exposure to small and middle capital-ization stocks detracted from overall performance. Through structure analysis, rebalancing and risk management, the domestic equity portfolio contin-ues to track the market with predictable consistency to achieve its objective.
INTERNATIONAL EQUITIESThe Morgan Stanley ACWI ex US Index is a broad index of global equities, including emerging markets but excluding the United States. In fiscal year 2012 that index returned a negative14.4%, or 18.2% below the U.S. index. The ISBI’s International Equity port-folio was down 10.7%, 3.7% above the ACWI ex US Index.
FIXED INCOMEIn fiscal year 2012 the ISBI Fixed Income portfolio had a return of 6.8%, compared to the 7.4% return
for the Barclay’s Capital Universal Bond Index. Exposure to the lower volatility Government Credit Intermediate sector detracted from the performance of the overall fixed income portfolio.
Actual Asset Allocation Policy Target
U.S. Equity 29% 30%U.S. Equity Hedge Funds 9 10International Equity 18 20Commingled Funds 2 -Fixed Income 18 17Bank Loans 3 3Real Estate 9 10Private Equity 6 5Real Assets 4 5 Cash 2 -Total 100% 100%
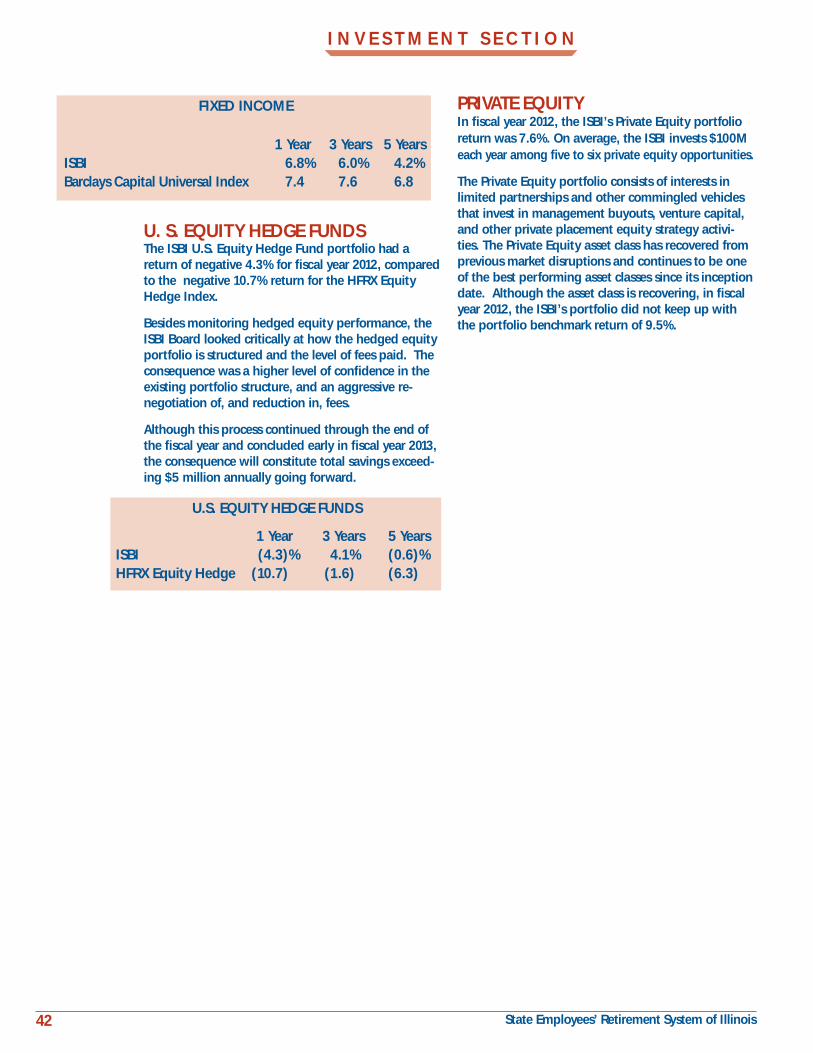
42 State Employees’ Retirement System of Illinois
I N V E S T M E N T S E C T I O N
U. S. EQUITY HEDGE FUNDSThe ISBI U.S. Equity Hedge Fund portfolio had a return of negative 4.3% for fiscal year 2012, compared to the negative 10.7% return for the HFRX Equity Hedge Index.
Besides monitoring hedged equity performance, the ISBI Board looked critically at how the hedged equity portfolio is structured and the level of fees paid. The consequence was a higher level of confidence in the existing portfolio structure, and an aggressive re-negotiation of, and reduction in, fees.
Although this process continued through the end of the fiscal year and concluded early in fiscal year 2013, the consequence will constitute total savings exceed-ing $5 million annually going forward.
PRIVATE EQUITYIn fiscal year 2012, the ISBI’s Private Equity portfolio return was 7.6%. On average, the ISBI invests $100M each year among five to six private equity opportunities.
The Private Equity portfolio consists of interests in limited partnerships and other commingled vehicles that invest in management buyouts, venture capital, and other private placement equity strategy activi-ties. The Private Equity asset class has recovered from previous market disruptions and continues to be one of the best performing asset classes since its inception date. Although the asset class is recovering, in fiscal year 2012, the ISBI’s portfolio did not keep up with the portfolio benchmark return of 9.5%.
U.S. EQUITY HEDGE FUNDS
1 Year 3 Years 5 YearsISBI (4.3)% 4.1% (0.6)%HFRX Equity Hedge (10.7) (1.6) (6.3)
FIXED INCOME
1 Year 3 Years 5 YearsISBI 6.8% 6.0% 4.2%Barclays Capital Universal Index 7.4 7.6 6.8
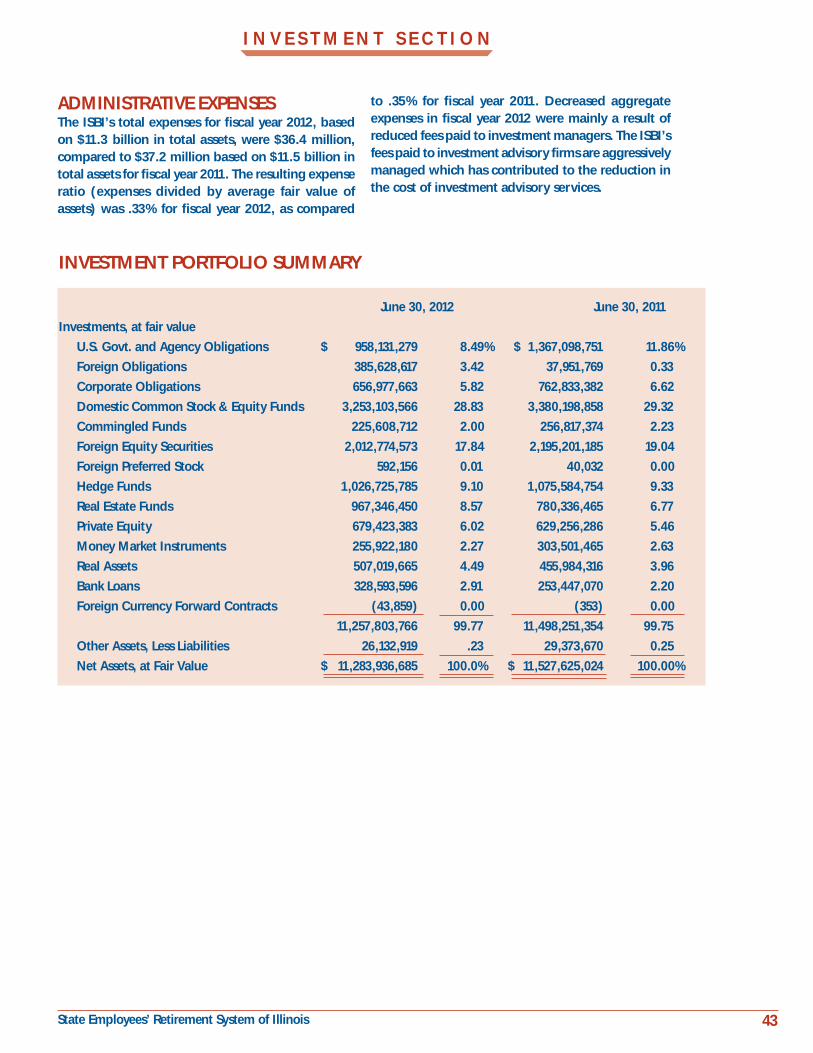
43 State Employees’ Retirement System of Illinois
I N V E S T M E N T S E C T I O N
ADMINISTRATIVE EXPENSESThe ISBI’s total expenses for fiscal year 2012, based on $11.3 billion in total assets, were $36.4 million, compared to $37.2 million based on $11.5 billion in total assets for fiscal year 2011. The resulting expense ratio (expenses divided by average fair value of assets) was .33% for fiscal year 2012, as compared
INVESTMENT PORTFOLIO SUMMARY June 30, 2012 June 30, 2011
Investments, at fair value
U.S. Govt. and Agency Obligations $ 958,131,279 8.49% $ 1,367,098,751 11.86%
Foreign Obligations 385,628,617 3.42 37,951,769 0.33
Corporate Obligations 656,977,663 5.82 762,833,382 6.62
Domestic Common Stock & Equity Funds 3,253,103,566 28.83 3,380,198,858 29.32
Commingled Funds 225,608,712 2.00 256,817,374 2.23
Foreign Equity Securities 2,012,774,573 17.84 2,195,201,185 19.04
Foreign Preferred Stock 592,156 0.01 40,032 0.00
Hedge Funds 1,026,725,785 9.10 1,075,584,754 9.33
Real Estate Funds 967,346,450 8.57 780,336,465 6.77
Private Equity 679,423,383 6.02 629,256,286 5.46
Money Market Instruments 255,922,180 2.27 303,501,465 2.63
Real Assets 507,019,665 4.49 455,984,316 3.96
Bank Loans 328,593,596 2.91 253,447,070 2.20
Foreign Currency Forward Contracts (43,859) 0.00 (353) 0.00
11,257,803,766 99.77 11,498,251,354 99.75
Other Assets, Less Liabilities 26,132,919 .23 29,373,670 0.25
Net Assets, at Fair Value $ 11,283,936,685 100.0% $ 11,527,625,024 100.00%
to .35% for fiscal year 2011. Decreased aggregate expenses in fiscal year 2012 were mainly a result of reduced fees paid to investment managers. The ISBI’s fees paid to investment advisory firms are aggressively managed which has contributed to the reduction in the cost of investment advisory services.
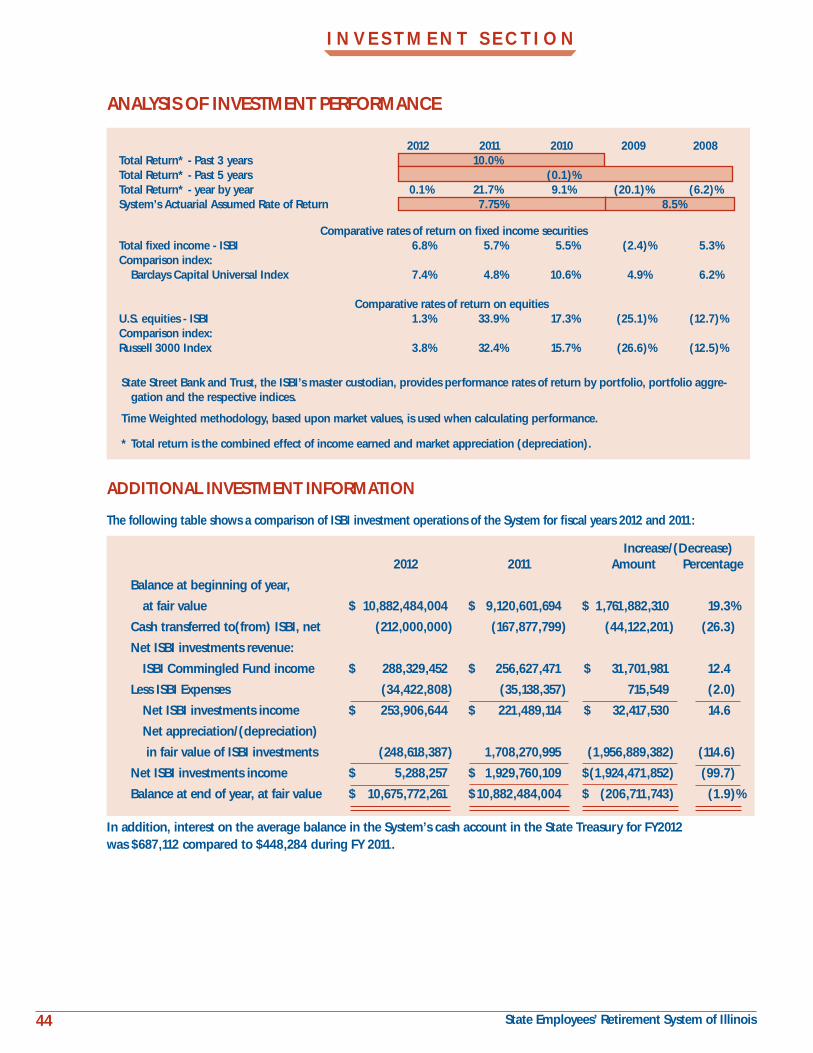
44 State Employees’ Retirement System of Illinois
ADDITIONAL INVESTMENT INFORMATION
The following table shows a comparison of ISBI investment operations of the System for fiscal years 2012 and 2011:
Increase/(Decrease) 2012 2011 Amount Percentage
Balance at beginning of year,
at fair value $ 10,882,484,004 $ 9,120,601,694 $ 1,761,882,310 19.3%
Cash transferred to(from) ISBI, net (212,000,000) (167,877,799) (44,122,201) (26.3)
Net ISBI investments revenue:
ISBI Commingled Fund income $ 288,329,452 $ 256,627,471 $ 31,701,981 12.4
Less ISBI Expenses (34,422,808) (35,138,357) 715,549 (2.0)
Net ISBI investments income $ 253,906,644 $ 221,489,114 $ 32,417,530 14.6
Net appreciation/(depreciation)
in fair value of ISBI investments (248,618,387) 1,708,270,995 (1,956,889,382) (114.6)
Net ISBI investments income $ 5,288,257 $ 1,929,760,109 $ (1,924,471,852) (99.7)
Balance at end of year, at fair value $ 10,675,772,261 $ 10,882,484,004 $ (206,711,743) (1.9)%
In addition, interest on the average balance in the System’s cash account in the State Treasury for FY2012 was $687,112 compared to $448,284 during FY 2011.
ANALYSIS OF INVESTMENT PERFORMANCE
2012 2011 2010 2009 2008 Total Return* - Past 3 years 10.0% Total Return* - Past 5 years (0.1)% Total Return* - year by year 0.1% 21.7% 9.1% (20.1)% (6.2)% System’s Actuarial Assumed Rate of Return 7.75% 8.5% Comparative rates of return on fixed income securities Total fixed income - ISBI 6.8% 5.7% 5.5% (2.4)% 5.3% Comparison index: Barclays Capital Universal Index 7.4% 4.8% 10.6% 4.9% 6.2%
Comparative rates of return on equities U.S. equities - ISBI 1.3% 33.9% 17.3% (25.1)% (12.7)% Comparison index: Russell 3000 Index 3.8% 32.4% 15.7% (26.6)% (12.5)%
State Street Bank and Trust, the ISBI’s master custodian, provides performance rates of return by portfolio, portfolio aggre-gation and the respective indices.
Time Weighted methodology, based upon market values, is used when calculating performance.
* Total return is the combined effect of income earned and market appreciation (depreciation).
I N V E S T M E N T S E C T I O N
45 State Employees’ Retirement System of Illinois
ACTUARIAL SECTION
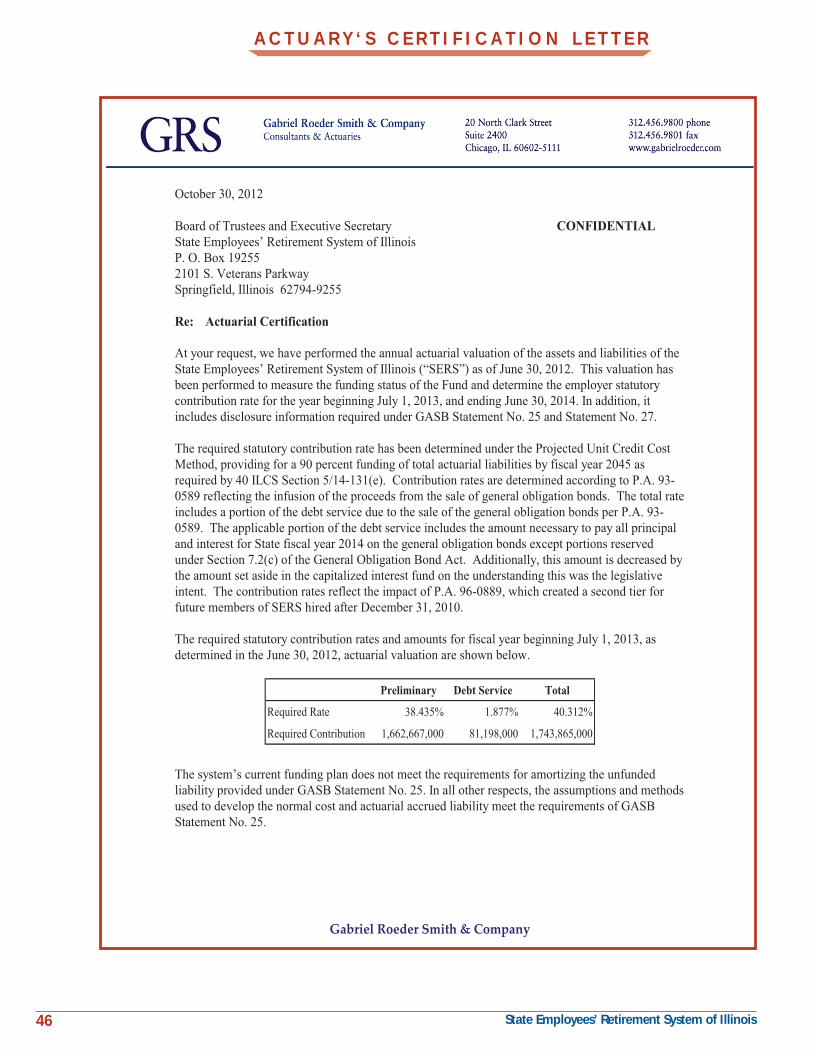
46 State Employees’ Retirement System of Illinois
A C T U A R Y ‘ S C E R T I F I C A T I O N L E T T E R
Gabriel Roeder Smith & Company
October 30, 2012 Board of Trustees and Executive Secretary CONFIDENTIAL State Employees’ Retirement System of Illinois P. O. Box 19255 2101 S. Veterans Parkway Springfield, Illinois 62794-9255 Re: Actuarial Certification At your request, we have performed the annual actuarial valuation of the assets and liabilities of the State Employees’ Retirement System of Illinois (“SERS”) as of June 30, 2012. This valuation has been performed to measure the funding status of the Fund and determine the employer statutory contribution rate for the year beginning July 1, 2013, and ending June 30, 2014. In addition, it includes disclosure information required under GASB Statement No. 25 and Statement No. 27. The required statutory contribution rate has been determined under the Projected Unit Credit Cost Method, providing for a 90 percent funding of total actuarial liabilities by fiscal year 2045 as required by 40 ILCS Section 5/14-131(e). Contribution rates are determined according to P.A. 93-0589 reflecting the infusion of the proceeds from the sale of general obligation bonds. The total rate includes a portion of the debt service due to the sale of the general obligation bonds per P.A. 93-0589. The applicable portion of the debt service includes the amount necessary to pay all principal and interest for State fiscal year 2014 on the general obligation bonds except portions reserved under Section 7.2(c) of the General Obligation Bond Act. Additionally, this amount is decreased by the amount set aside in the capitalized interest fund on the understanding this was the legislative intent. The contribution rates reflect the impact of P.A. 96-0889, which created a second tier for future members of SERS hired after December 31, 2010. The required statutory contribution rates and amounts for fiscal year beginning July 1, 2013, as determined in the June 30, 2012, actuarial valuation are shown below.
Preliminary Debt Service Total
Required Rate 38.435% 1.877% 40.312%
Required Contribution 1,662,667,000 81,198,000 1,743,865,000
The system’s current funding plan does not meet the requirements for amortizing the unfunded liability provided under GASB Statement No. 25. In all other respects, the assumptions and methods used to develop the normal cost and actuarial accrued liability meet the requirements of GASB Statement No. 25.

47 State Employees’ Retirement System of Illinois
A C T U A R Y ‘ S C E R T I F I C A T I O N L E T T E R
Board of Trustees and Executive Secretary October 26, 2012 Page 2
Gabriel Roeder Smith & Company
Pursuant to P.A. 96-0043, for purposes of determining statutory contribution rates for fiscal year 2013 an actuarial value of the System's assets was used. The actuarial value of assets is assumed to earn a rate of return equal to the System's actuarially assumed rate of return. The liabilities have been valued based on financial and employee data, which is supplied by the administrative staff of the System and verified by the System’s auditor. We did not audit this data, but have reviewed the statistical support and concluded that the data is reasonable and consistent with the prior year’s data. For the actuarial valuation as of June 30, 2012, the assumed rate of return used to discount liabilities and project assets was 7.75 percent. In our opinion, the calculations also comply with the requirements of Illinois state law and, where applicable, the Internal Revenue Code, ERISA, and the Statements of the Governmental Accounting Standards Board except as noted above. All of our work conforms with generally accepted actuarial principles and practices, and to the Actuarial Standards of Practice issued by the Actuarial Standards Board. We certify that the information presented herein is accurate and fairly portrays the actuarial position of SERS as of June 30, 2012. We prepared the accompanying Summary of Actuarial Cost Method and Major Actuarial Assumptions, but the SERS staff prepared the other supporting schedules in this section and the trend tables in the financial section, based on information supplied in our report. The undersigned are Members of the American Academy of Actuaries (MAAA) as indicated, and meet the Qualification Standards of the American Academy of Actuaries to render the actuarial opinion contained herein. Respectfully submitted, Gabriel, Roeder, Smith & Company
By: By: Alex Rivera, FSA, EA, MAAA David Kausch, FSA, EA, MAAA Senior Consultant Senior Consultant
l:\c3029_sers\2012\valuation_fye2012\certification\certification2012_electronicletterhead.doc
48 State Employees’ Retirement System of Illinois
INTRODUCTIONAnnually, the System’s actuarial consultant prepares a valuation of the liabilities and reserves of the System in order to make a determination of the amount of contributions required from the state. These results are then certified to the Board.
The Board, in turn, has the duty of certifying an employer contribution amount, required to be paid to the System by the state during the succeeding fiscal year.
The System receives contributions from several sources which can be considered as employer con-tributions, with the largest source being the regular state appropriation.
The employers’ contribution amount, together with members’ contributions, income from investments and any other income received by the System, shall be sufficient to meet the cost of maintaining and administering the System on a funded basis in ac-cordance with actuarial reserve requirements, pur-suant to Chapter 40, Section 5/14-131 of the Illinois Compiled Statutes.
The statutes define “actuarial reserves” as “An ac-cumulation of funds in advance of benefit payments which will be sufficient with respect to each member and his beneficiaries, if any, to pay the prescribed benefits, computed according to the actuarial tables, without further contributions by or on behalf of the member.”
In August, 1994, Senate Bill 533 was signed into law as Public Act 88-0593. This funding legislation, which became effective July 1, 1995, provides that:
• For fiscal years 1996 through 2010, the contribution to the System, as a percentage of the payroll, shall be increased in equal annual increments so that by fiscal year 2010 the contribution rate is at the same level as the contribution rate for fiscal years 2011 through 2045.
• For fiscal years 2011 through 2045, the minimum contribution to the System for each fiscal year shall be an amount determined to be sufficient to bring the total actuarial value of assets of the System up to 90% of the total actuarial liabilities of the System by the end of fiscal year 2045. In making these determinations, the required contribution shall be calculated each year as a level percentage of payroll
over the years remaining to and including fiscal year 2045 and shall be determined under the projected unit credit actuarial cost method.
• Beginning in fiscal year 2045, the minimum contribution to the System for each fiscal year shall be the amount needed to maintain the total actuarial value of assets of the System at 90% of the total actuarial liabilities of the System.
The funding legislation also provides for the establishment of a continuing appropriation of the required state contributions to the System. This has, in ef fect, removed the appropriation of these funds from the annual budgetary process.
The amortization period required by the state’s funding plan, as described above, does not meet the parameters of GASB Statement No. 25.
In April, 2003, House Bill 2660 was signed into law as Public Act 93-0002. This legislation authorized the sale of $10 billion of General Obligation bonds for the purpose of making contributions to the five state-financed retirement systems. This legislation also modified the funding plan by mandating that, beginning in fiscal year 2005, the required state contribution for each fiscal year not exceed the state contributions that would have been required had the General Obligation bond program not been in effect, reduced by the total debt service for each year for the System’s portion of the General Obligation bond proceeds.
In June, 2005, Senate Bill 0027 was signed into law as Public Act 94-0004. This legislation further modified the funding plan by reducing the amount of required employer contributions for fiscal years 2006 and 2007 that would have otherwise been required under Public Act 88-0593, as modified by Public Act 93-0002. The required state contributions for fiscal years 2008 through 2010 were then to be increased incrementally as a percentage of the participant payroll so that by fiscal year 2011 the state would be contributing at the required level contribution rate to achieve the financing objective of a 90% funded status by the end of fiscal year 2045.
For fiscal years 2012 and 2011, the System received the actuarially determined employer contributions in accordance with the state’s funding plan described above.
A C T U A R I A L S E C T I O N
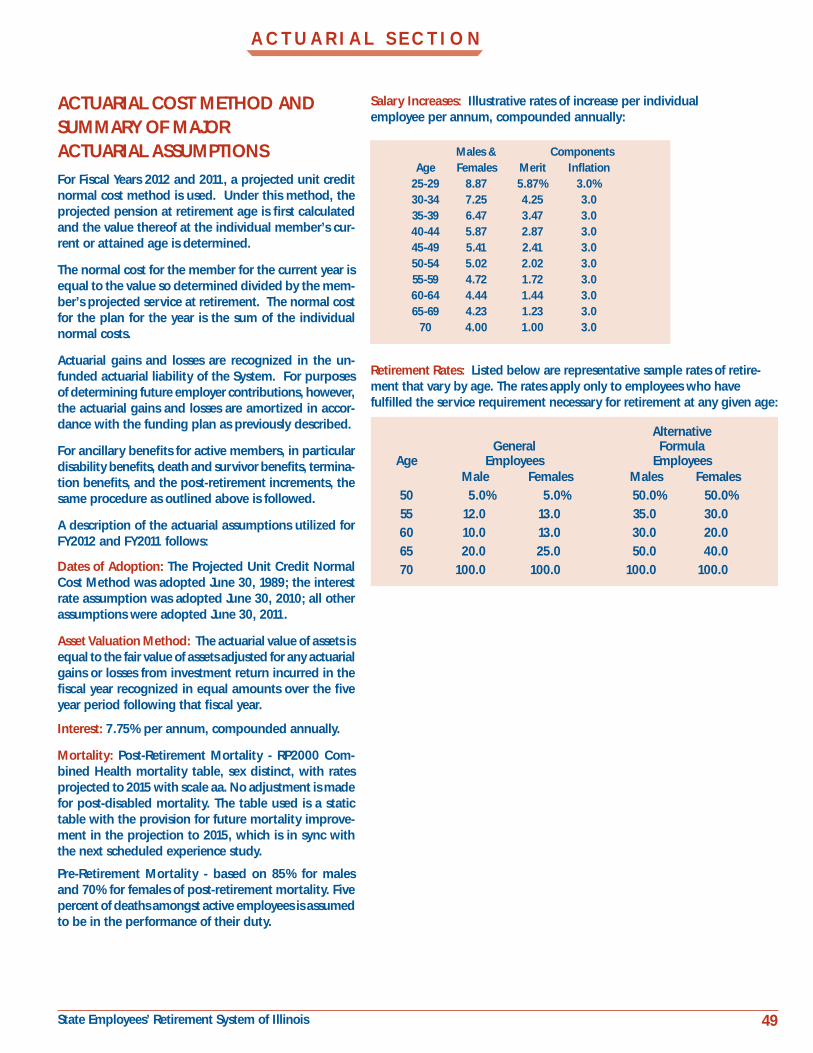
49 State Employees’ Retirement System of Illinois
ACTUARIAL COST METHOD ANDSUMMARY OF MAJORACTUARIAL ASSUMPTIONSFor Fiscal Years 2012 and 2011, a projected unit credit normal cost method is used. Under this method, the projected pension at retirement age is first calculated and the value thereof at the individual member’s cur-rent or attained age is determined.
The normal cost for the member for the current year is equal to the value so determined divided by the mem-ber’s projected service at retirement. The normal cost for the plan for the year is the sum of the individual normal costs.
Actuarial gains and losses are recognized in the un-funded actuarial liability of the System. For purposes of determining future employer contributions, however, the actuarial gains and losses are amortized in accor-dance with the funding plan as previously described.
For ancillary benefits for active members, in particular disability benefits, death and survivor benefits, termina-tion benefits, and the post-retirement increments, the same procedure as outlined above is followed.
A description of the actuarial assumptions utilized for FY2012 and FY2011 follows:
Dates of Adoption: The Projected Unit Credit Normal Cost Method was adopted June 30, 1989; the interest rate assumption was adopted June 30, 2010; all other assumptions were adopted June 30, 2011.
Asset Valuation Method: The actuarial value of assets is equal to the fair value of assets adjusted for any actuarial gains or losses from investment return incurred in the fiscal year recognized in equal amounts over the five year period following that fiscal year.
Interest: 7.75% per annum, compounded annually.
Mortality: Post-Retirement Mortality - RP2000 Com-bined Health mortality table, sex distinct, with rates projected to 2015 with scale aa. No adjustment is made for post-disabled mortality. The table used is a static table with the provision for future mortality improve-ment in the projection to 2015, which is in sync with the next scheduled experience study.
Pre-Retirement Mortality - based on 85% for males and 70% for females of post-retirement mortality. Five percent of deaths amongst active employees is assumed to be in the performance of their duty.
A C T U A R I A L S E C T I O N
Males & Components Age Females Merit Inflation 25-29 8.87 5.87% 3.0% 30-34 7.25 4.25 3.0 35-39 6.47 3.47 3.0 40-44 5.87 2.87 3.0 45-49 5.41 2.41 3.0 50-54 5.02 2.02 3.0 55-59 4.72 1.72 3.0 60-64 4.44 1.44 3.0 65-69 4.23 1.23 3.0 70 4.00 1.00 3.0
Retirement Rates: Listed below are representative sample rates of retire-ment that vary by age. The rates apply only to employees who have fulfilled the service requirement necessary for retirement at any given age:
Alternative General Formula Age Employees Employees Male Females Males Females 50 5.0% 5.0% 50.0% 50.0% 55 12.0 13.0 35.0 30.0 60 10.0 13.0 30.0 20.0 65 20.0 25.0 50.0 40.0 70 100.0 100.0 100.0 100.0
Salary Increases: Illustrative rates of increase per individual employee per annum, compounded annually:
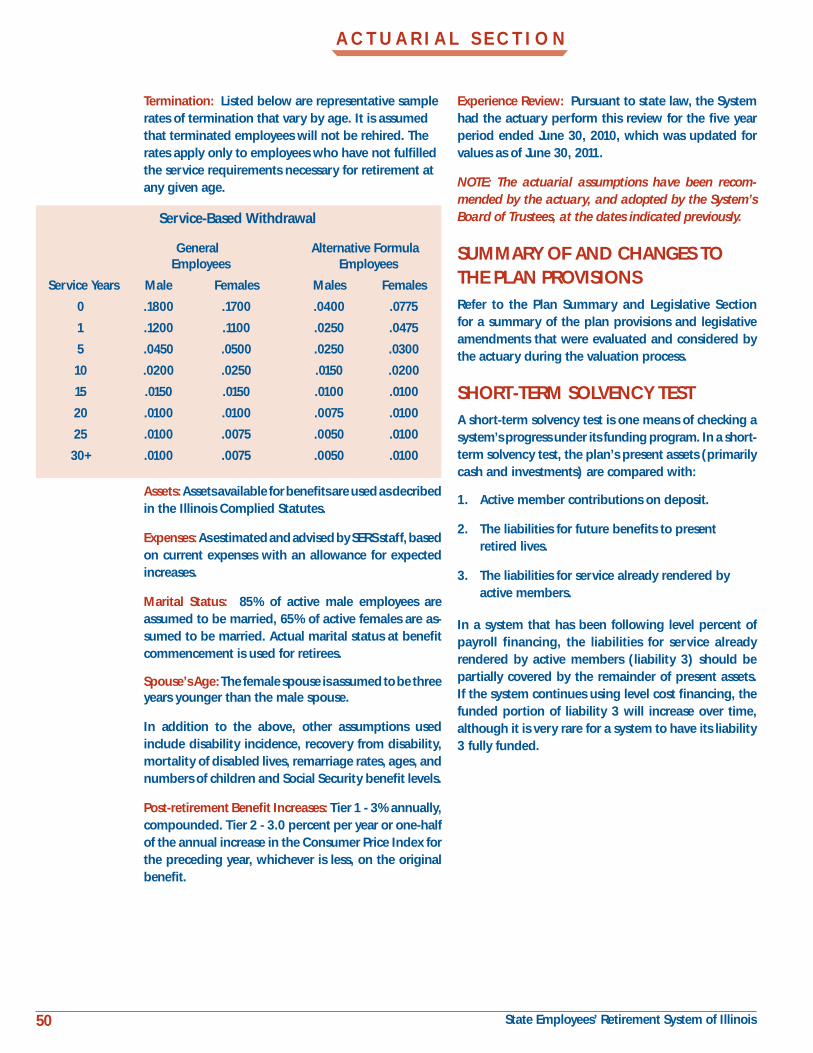
50 State Employees’ Retirement System of Illinois
Assets: Assets available for benefits are used as decribed in the Illinois Complied Statutes.
Expenses: As estimated and advised by SERS staff, based on current expenses with an allowance for expected increases.
Marital Status: 85% of active male employees are assumed to be married, 65% of active females are as-sumed to be married. Actual marital status at benefit commencement is used for retirees.
Spouse’s Age: The female spouse is assumed to be three years younger than the male spouse.
In addition to the above, other assumptions used include disability incidence, recovery from disability, mortality of disabled lives, remarriage rates, ages, and numbers of children and Social Security benefit levels.
Post-retirement Benefit Increases: Tier 1 - 3% annually, compounded. Tier 2 - 3.0 percent per year or one-half of the annual increase in the Consumer Price Index for the preceding year, whichever is less, on the original benefit.
A C T U A R I A L S E C T I O N
Experience Review: Pursuant to state law, the System had the actuary perform this review for the five year period ended June 30, 2010, which was updated for values as of June 30, 2011.
NOTE: The actuarial assumptions have been recom-mended by the actuary, and adopted by the System’s Board of Trustees, at the dates indicated previously.
SUMMARY OF AND CHANGES TO THE PLAN PROVISIONSRefer to the Plan Summary and Legislative Section for a summary of the plan provisions and legislative amendments that were evaluated and considered by the actuary during the valuation process.
SHORT-TERM SOLVENCY TESTA short-term solvency test is one means of checking a system’s progress under its funding program. In a short-term solvency test, the plan’s present assets (primarily cash and investments) are compared with:
1. Active member contributions on deposit. 2. The liabilities for future benefits to present retired lives.
3. The liabilities for service already rendered by active members.
In a system that has been following level percent of payroll financing, the liabilities for service already rendered by active members (liability 3) should be partially covered by the remainder of present assets. If the system continues using level cost financing, the funded portion of liability 3 will increase over time, although it is very rare for a system to have its liability 3 fully funded.
Service-Based Withdrawal
General Alternative Formula Employees Employees
Service Years Male Females Males Females
0 .1800 .1700 .0400 .0775
1 .1200 .1100 .0250 .0475
5 .0450 .0500 .0250 .0300
10 .0200 .0250 .0150 .0200
15 .0150 .0150 .0100 .0100
20 .0100 .0100 .0075 .0100
25 .0100 .0075 .0050 .0100
30+ .0100 .0075 .0050 .0100
Termination: Listed below are representative sample rates of termination that vary by age. It is assumed that terminated employees will not be rehired. The rates apply only to employees who have not fulfilled the service requirements necessary for retirement at any given age.
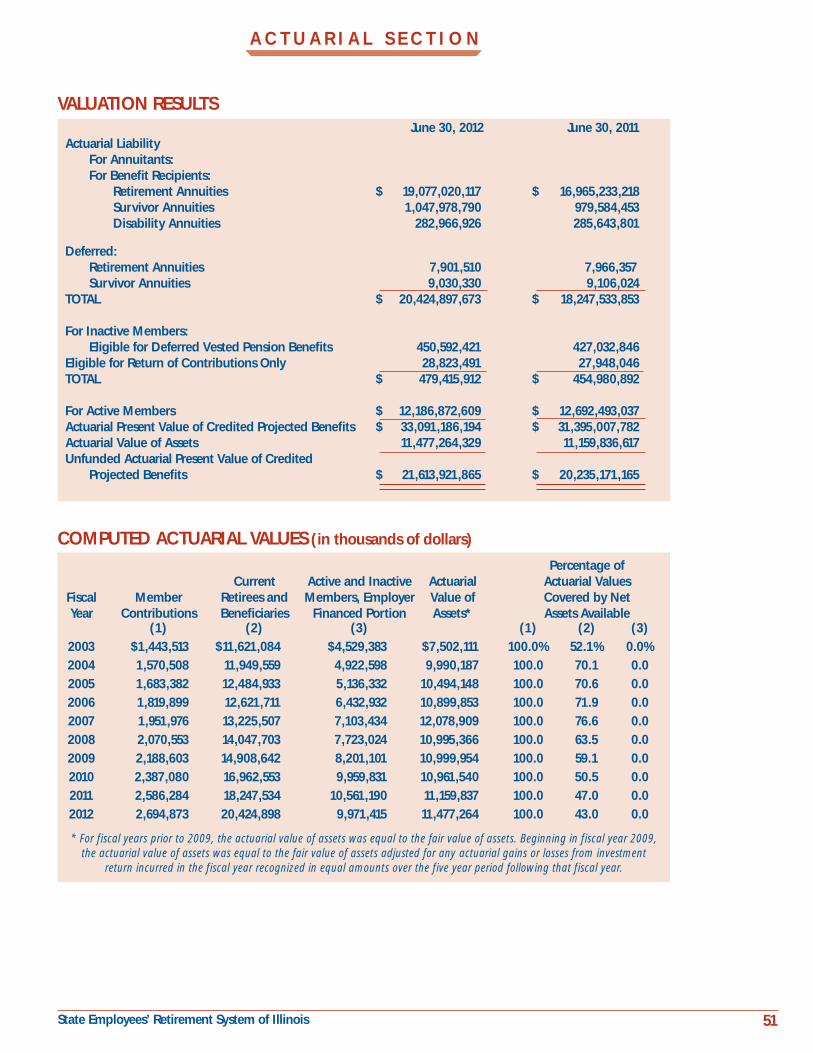
51 State Employees’ Retirement System of Illinois
June 30, 2012 June 30, 2011Actuarial Liability For Annuitants: For Benefit Recipients: Retirement Annuities $ 19,077,020,117 $ 16,965,233,218 Survivor Annuities 1,047,978,790 979,584,453 Disability Annuities 282,966,926 285,643,801 Deferred: Retirement Annuities 7,901,510 7,966,357 Survivor Annuities 9,030,330 9,106,024TOTAL $ 20,424,897,673 $ 18,247,533,853 For Inactive Members: Eligible for Deferred Vested Pension Benefits 450,592,421 427,032,846Eligible for Return of Contributions Only 28,823,491 27,948,046TOTAL $ 479,415,912 $ 454,980,892 For Active Members $ 12,186,872,609 $ 12,692,493,037Actuarial Present Value of Credited Projected Benefits $ 33,091,186,194 $ 31,395,007,782Actuarial Value of Assets 11,477,264,329 11,159,836,617Unfunded Actuarial Present Value of Credited Projected Benefits $ 21,613,921,865 $ 20,235,171,165
VALUATION RESULTS
A C T U A R I A L S E C T I O N
COMPUTED ACTUARIAL VALUES (in thousands of dollars)
Percentage of Current Active and Inactive Actuarial Actuarial Values Fiscal Member Retirees and Members, Employer Value of Covered by Net Year Contributions Beneficiaries Financed Portion Assets* Assets Available (1) (2) (3) (1) (2) (3) 2003 $1,443,513 $11,621,084 $4,529,383 $7,502,111 100.0% 52.1% 0.0% 2004 1,570,508 11,949,559 4,922,598 9,990,187 100.0 70.1 0.0 2005 1,683,382 12,484,933 5,136,332 10,494,148 100.0 70.6 0.0 2006 1,819,899 12,621,711 6,432,932 10,899,853 100.0 71.9 0.0 2007 1,951,976 13,225,507 7,103,434 12,078,909 100.0 76.6 0.0 2008 2,070,553 14,047,703 7,723,024 10,995,366 100.0 63.5 0.0 2009 2,188,603 14,908,642 8,201,101 10,999,954 100.0 59.1 0.0 2010 2,387,080 16,962,553 9,959,831 10,961,540 100.0 50.5 0.0 2011 2,586,284 18,247,534 10,561,190 11,159,837 100.0 47.0 0.0 2012 2,694,873 20,424,898 9,971,415 11,477,264 100.0 43.0 0.0
* For fiscal years prior to 2009, the actuarial value of assets was equal to the fair value of assets. Beginning in fiscal year 2009, the actuarial value of assets was equal to the fair value of assets adjusted for any actuarial gains or losses from investment
return incurred in the fiscal year recognized in equal amounts over the five year period following that fiscal year.
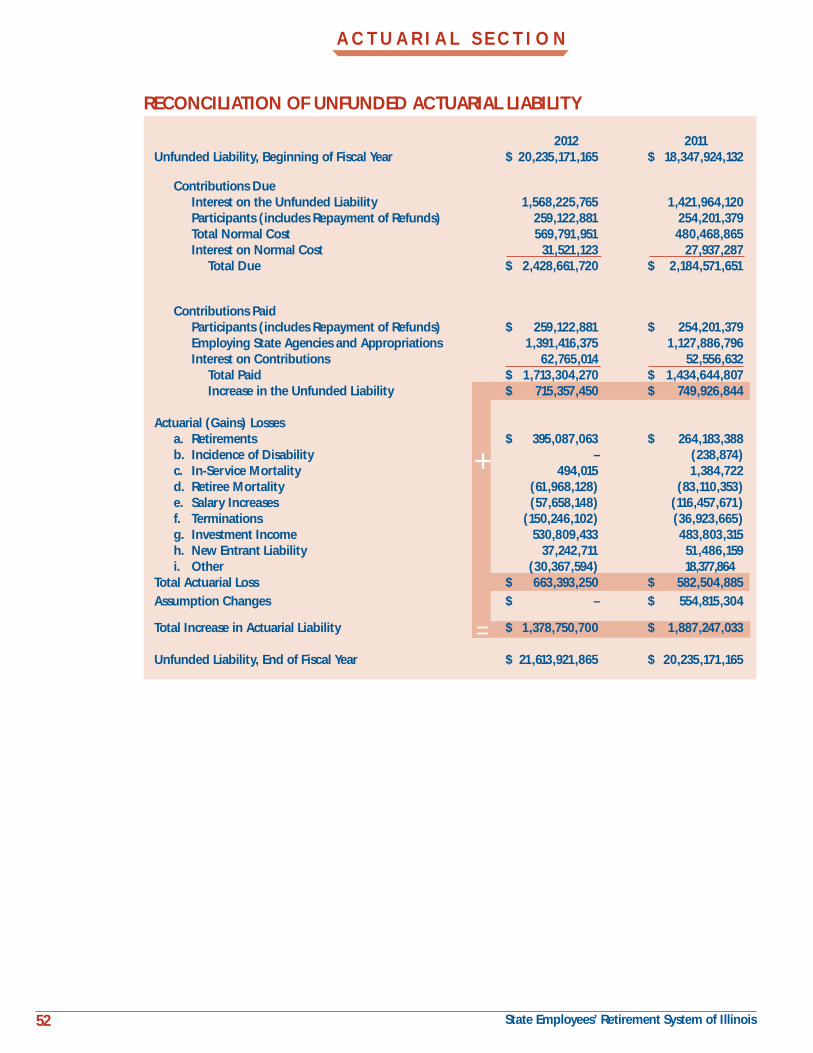
52 State Employees’ Retirement System of Illinois
A C T U A R I A L S E C T I O N
+
RECONCILIATION OF UNFUNDED ACTUARIAL LIABILITY
2012 2011 Unfunded Liability, Beginning of Fiscal Year $ 20,235,171,165 $ 18,347,924,132
Contributions Due Interest on the Unfunded Liability 1,568,225,765 1,421,964,120 Participants (includes Repayment of Refunds) 259,122,881 254,201,379 Total Normal Cost 569,791,951 480,468,865 Interest on Normal Cost 31,521,123 27,937,287 Total Due $ 2,428,661,720 $ 2,184,571,651
Contributions Paid Participants (includes Repayment of Refunds) $ 259,122,881 $ 254,201,379 Employing State Agencies and Appropriations 1,391,416,375 1,127,886,796 Interest on Contributions 62,765,014 52,556,632 Total Paid $ 1,713,304,270 $ 1,434,644,807 Increase in the Unfunded Liability $ 715,357,450 $ 749,926,844 Actuarial (Gains) Losses a. Retirements $ 395,087,063 $ 264,183,388 b. Incidence of Disability – (238,874) c. In-Service Mortality 494,015 1,384,722 d. Retiree Mortality (61,968,128) (83,110,353) e. Salary Increases (57,658,148) (116,457,671) f. Terminations (150,246,102) (36,923,665) g. Investment Income 530,809,433 483,803,315 h. New Entrant Liability 37,242,711 51,486,159 i. Other (30,367,594) 18,377,864 Total Actuarial Loss $ 663,393,250 $ 582,504,885 Assumption Changes $ – $ 554,815,304
Total Increase in Actuarial Liability $ 1,378,750,700 $ 1,887,247,033
Unfunded Liability, End of Fiscal Year $ 21,613,921,865 $ 20,235,171,165
=

53 State Employees’ Retirement System of Illinois
SUMMARY OF ACCRUED AND UNFUNDED ACCRUED LIABILITIES (Analysis of Funding)In an inflationary economy, the value of the dollar decreases. This environment results in employees’ pay and retirement benefits increasing in dollar amounts resulting in unfunded accrued liabilities which in-crease in dollar amounts, all at a time when the actual substance of these items may be decreasing. Looking at just the dollar amounts of unfunded ac-crued liabilities can be misleading. The ratio of the
ACCRUED AND UNFUNDED ACCRUED LIABILITIES
(in thousands of dollars) Actuarial Net Assets as a Total Unfunded Unfunded Actuarial Fiscal Total Actuarial Value of % of Actuarial Actuarial Member Liability as a % of Year Liability Assets* Liability Liability Payroll Member Payroll
2003 $ 17,593,980 $ 7,502,111 42.6% $ 10,091,869 $ 3,639,334 277.3% 2004 18,442,665 9,990,187 54.2 8,452,478 3,439,251 245.8 2005 19,304,647 10,494,148 54.4 8,810,499 3,475,528 253.5 2006 20,874,542 10,899,853 52.2 9,974,689 3,572,541 279.2 2007 22,280,917 12,078,909 54.2 10,202,008 3,762,777 271.1 2008 23,841,280 10,995,366 46.1 12,845,914 3,967,704 323.8 2009 25,298,346 10,999,954 43.5 14,298,392 4,027,263 355.0 2010 29,309,464 10,961,540 37.4 18,347,924 4,119,361 445.4 2011 31,395,008 11,159,837 35.6 20,235,171 4,211,186 480.5 2012 33,091,186 11,477,264 34.7 21,613,922 4,329,084 499.3
* For fiscal years prior to 2009, the actuarial value of assets was equal to the fair value of assets. Beginning in fiscal year 2009, the actu-arial value of assets was equal to the fair value of assets adjusted for any actuarial gains or losses from investment return incurred in the fiscal year recognized in equal amounts over the five year period following that fiscal year.
SCHEDULE OF ACTIVE MEMBER VALUATION DATA
Valuation Annual Annual % Increase Date Number Payroll Average Pay In Average Pay
6/30/03 70,192 $3,639,334,000 $51,848 14.1% 6/30/04 70,621 3,439,251,000 48,700 (6.1) 6/30/05 69,163 3,475,528,000 50,251 3.2 6/30/06 68,075 3,572,541,000 52,479 4.4 6/30/07 67,699 3,762,777,000 55,581 5.9 6/30/08 66,237 3,967,704,000 59,902 7.8 6/30/09 65,599 4,027,263,000 61,392 2.5 6/30/10 64,143 4,119,360,892 64,222 4.6 6/30/11 66,363 4,211,186,269 63,457 (1.2) 6/30/12 62,732 4,329,083,716 69,009 8.7
A C T U A R I A L S E C T I O N
unfunded accrued liabilities to active employee pay-roll provides an index which clarifies understanding. The smaller the ratio of unfunded liabilities to active member payroll, the stronger the system.
Observation of this relative index over a period of years will give an indication of whether the system is becoming financially stronger or weaker.
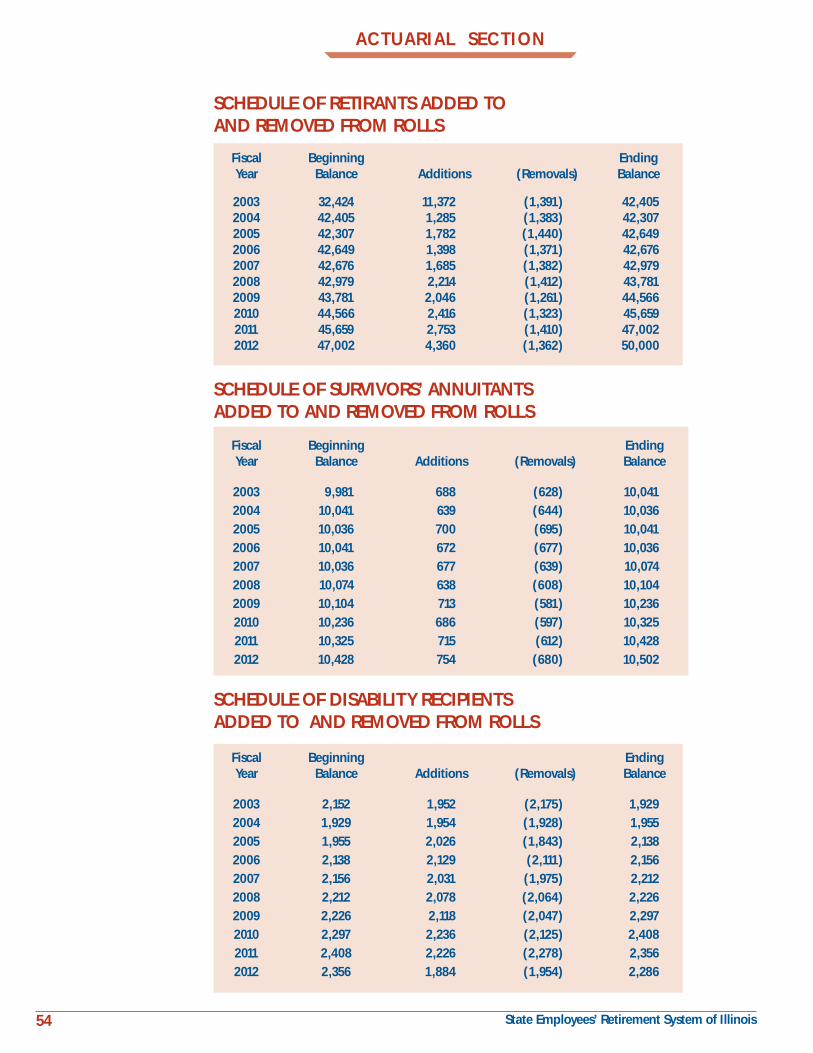
54 State Employees’ Retirement System of Illinois
AC TUARIAL SEC TION
SCHEDULE OF DISABILITY RECIPIENTSADDED TO AND REMOVED FROM ROLLS
Fiscal Beginning Ending Year Balance Additions (Removals) Balance
2003 2,152 1,952 (2,175) 1,929 2004 1,929 1,954 (1,928) 1,955 2005 1,955 2,026 (1,843) 2,138 2006 2,138 2,129 (2,111) 2,156 2007 2,156 2,031 (1,975) 2,212 2008 2,212 2,078 (2,064) 2,226 2009 2,226 2,118 (2,047) 2,297 2010 2,297 2,236 (2,125) 2,408 2011 2,408 2,226 (2,278) 2,356 2012 2,356 1,884 (1,954) 2,286
SCHEDULE OF SURVIVORS’ ANNUITANTS ADDED TO AND REMOVED FROM ROLLS
Fiscal Beginning Ending Year Balance Additions (Removals) Balance
2003 9,981 688 (628) 10,041 2004 10,041 639 (644) 10,036 2005 10,036 700 (695) 10,041 2006 10,041 672 (677) 10,036 2007 10,036 677 (639) 10,074 2008 10,074 638 (608) 10,104 2009 10,104 713 (581) 10,236 2010 10,236 686 (597) 10,325 2011 10,325 715 (612) 10,428 2012 10,428 754 (680) 10,502
SCHEDULE OF RETIRANTS ADDED TO AND REMOVED FROM ROLLS Fiscal Beginning Ending Year Balance Additions (Removals) Balance
2003 32,424 11,372 (1,391) 42,405 2004 42,405 1,285 (1,383) 42,307 2005 42,307 1,782 (1,440) 42,649 2006 42,649 1,398 (1,371) 42,676 2007 42,676 1,685 (1,382) 42,979 2008 42,979 2,214 (1,412) 43,781 2009 43,781 2,046 (1,261) 44,566 2010 44,566 2,416 (1,323) 45,659 2011 45,659 2,753 (1,410) 47,002 2012 47,002 4,360 (1,362) 50,000
55 State Employees’ Retirement System of Illinois
STATISTICAL SECTION
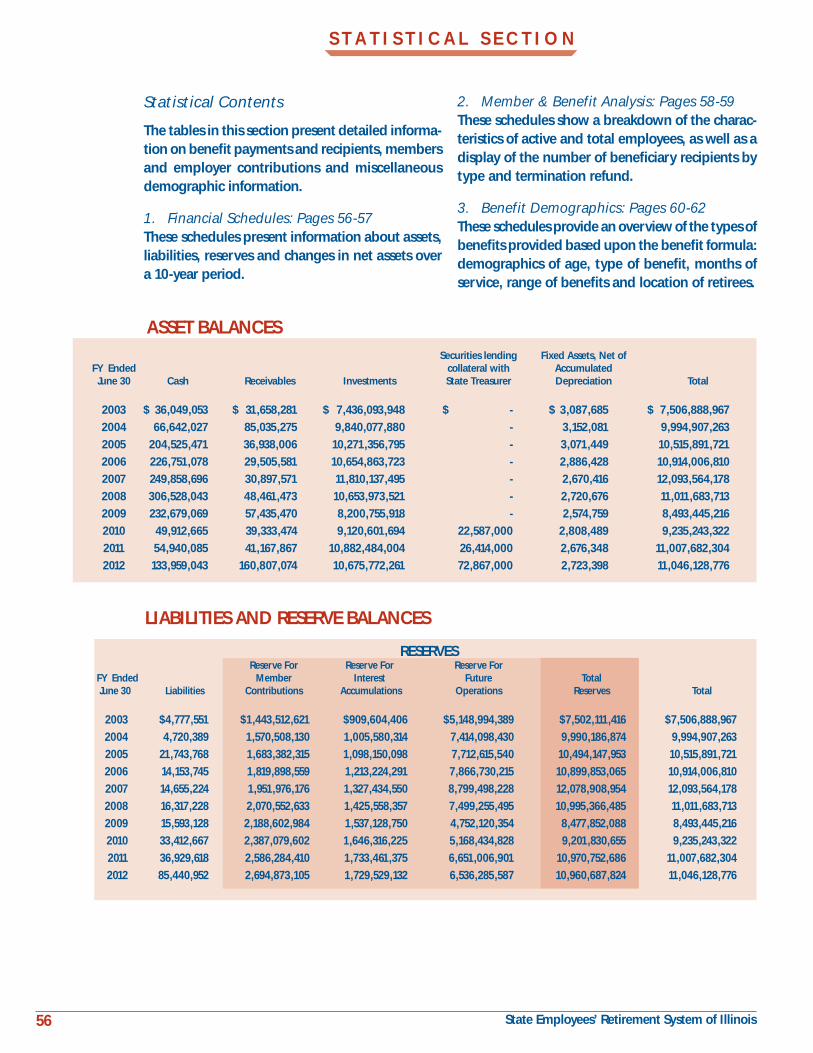
56 State Employees’ Retirement System of Illinois
S T A T I S T I C A L S E C T I O N
RESERVES Reserve For Reserve For Reserve For FY Ended Member Interest Future Total June 30 Liabilities Contributions Accumulations Operations Reserves Total
2003 $4,777,551 $1,443,512,621 $909,604,406 $5,148,994,389 $7,502,111,416 $7,506,888,967
2004 4,720,389 1,570,508,130 1,005,580,314 7,414,098,430 9,990,186,874 9,994,907,263
2005 21,743,768 1,683,382,315 1,098,150,098 7,712,615,540 10,494,147,953 10,515,891,721
2006 14,153,745 1,819,898,559 1,213,224,291 7,866,730,215 10,899,853,065 10,914,006,810
2007 14,655,224 1,951,976,176 1,327,434,550 8,799,498,228 12,078,908,954 12,093,564,178
2008 16,317,228 2,070,552,633 1,425,558,357 7,499,255,495 10,995,366,485 11,011,683,713
2009 15,593,128 2,188,602,984 1,537,128,750 4,752,120,354 8,477,852,088 8,493,445,216
2010 33,412,667 2,387,079,602 1,646,316,225 5,168,434,828 9,201,830,655 9,235,243,322
2011 36,929,618 2,586,284,410 1,733,461,375 6,651,006,901 10,970,752,686 11,007,682,304
2012 85,440,952 2,694,873,105 1,729,529,132 6,536,285,587 10,960,687,824 11,046,128,776
ASSET BALANCES Securities lending Fixed Assets, Net of FY Ended collateral with Accumulated June 30 Cash Receivables Investments State Treasurer Depreciation Total
2003 $ 36,049,053 $ 31,658,281 $ 7,436,093,948 $ - $ 3,087,685 $ 7,506,888,967
2004 66,642,027 85,035,275 9,840,077,880 - 3,152,081 9,994,907,263
2005 204,525,471 36,938,006 10,271,356,795 - 3,071,449 10,515,891,721
2006 226,751,078 29,505,581 10,654,863,723 - 2,886,428 10,914,006,810
2007 249,858,696 30,897,571 11,810,137,495 - 2,670,416 12,093,564,178
2008 306,528,043 48,461,473 10,653,973,521 - 2,720,676 11,011,683,713
2009 232,679,069 57,435,470 8,200,755,918 - 2,574,759 8,493,445,216
2010 49,912,665 39,333,474 9,120,601,694 22,587,000 2,808,489 9,235,243,322
2011 54,940,085 41,167,867 10,882,484,004 26,414,000 2,676,348 11,007,682,304
2012 133,959,043 160,807,074 10,675,772,261 72,867,000 2,723,398 11,046,128,776
LIABILITIES AND RESERVE BALANCES
Statistical Contents
The tables in this section present detailed informa-tion on benefit payments and recipients, members and employer contributions and miscellaneous demographic information.
1. Financial Schedules: Pages 56-57These schedules present information about assets, liabilities, reserves and changes in net assets over a 10-year period.
2. Member & Benefit Analysis: Pages 58-59These schedules show a breakdown of the charac-teristics of active and total employees, as well as a display of the number of beneficiary recipients by type and termination refund.
3. Benefit Demographics: Pages 60-62These schedules provide an overview of the types of benefits provided based upon the benefit formula: demographics of age, type of benefit, months of service, range of benefits and location of retirees.
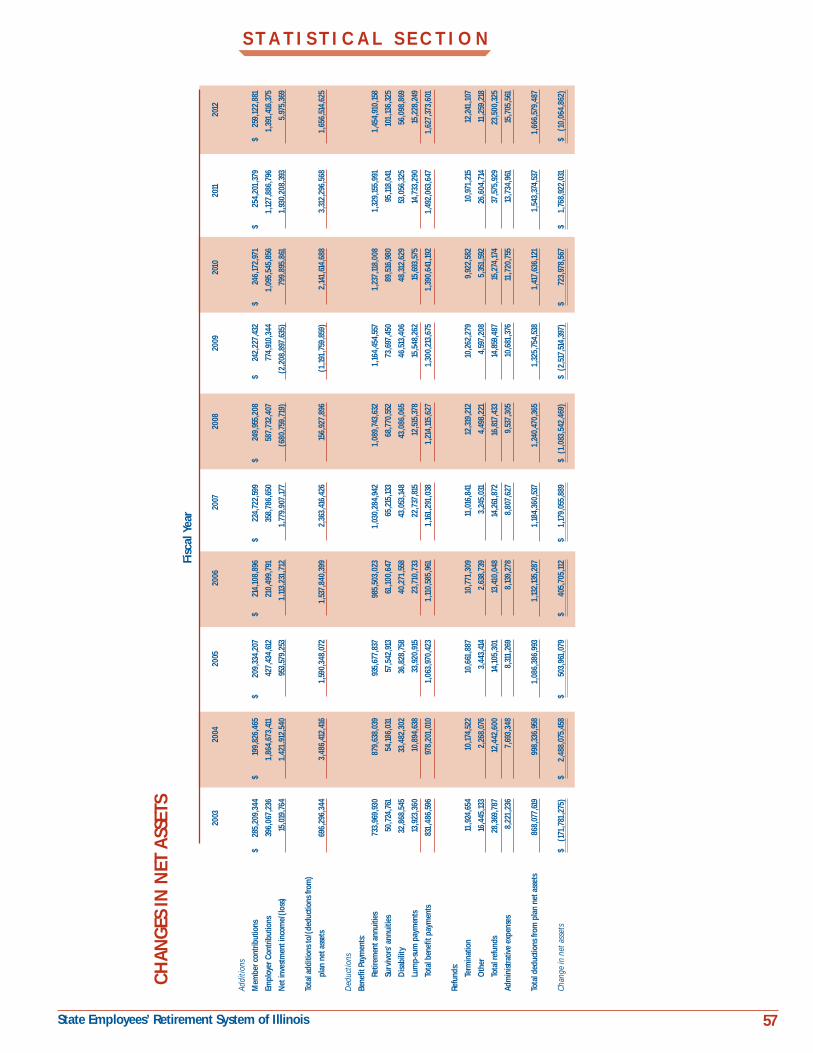
57 State Employees’ Retirement System of Illinois
S T A T I S T I C A L S E C T I O N
Fisc
al Y
ear
20
03
2004
20
05
2006
20
07
2008
20
09
2010
20
11
2012
Addi
tions
Mem
ber c
ontri
butio
ns
$ 28
5,20
9,34
4 $
199,
826,
465
$ 20
9,33
4,20
7 $
214,
108,
896
$ 22
4,72
2,59
9 $
249,
955,
208
$ 24
2,22
7,43
2 $
246,
172,
971
$ 25
4,20
1,37
9 $
259,
122,
881
Empl
oyer
Con
tribu
tions
396,
067,
236
1,
864,
673,
411
42
7,43
4,61
2
210,
499,
791
35
8,78
6,65
0
587,
732,
407
77
4,91
0,34
4
1,09
5,54
5,85
6
1,12
7,88
6,79
6
1,39
1,41
6,37
5
Net
inve
stm
ent i
ncom
e/(lo
ss)
15
,019
,764
1,42
1,91
2,54
0
953,
579,
253
1,
113,
231,
712
1,
779,
907,
177
(6
80,7
59,7
19)
(2
,208
,897
,635
)
799,
895,
861
1,
930,
208,
393
5,
975,
369
Tota
l add
ition
s to/
(ded
uctio
ns fr
om)
pl
an n
et a
sset
s
696,
296,
344
3,
486,
412,
416
1,
590,
348,
072
1,
537,
840,
399
2,
363,
416,
426
15
6,92
7,89
6
(1,1
91,7
59,8
59)
2,
141,
614,
688
3,
312,
296,
568
1,
656,
514,
625
Ded
uctio
ns
Bene
fit P
aym
ents
:
Re
tirem
ent a
nnui
ties
73
3,96
9,93
0
879,
638,
039
93
5,67
7,83
7
985,
503,
023
1,
030,
284,
942
1,
089,
743,
632
1,
164,
454,
557
1,
237,
118,
008
1,
329,
155,
991
1,
454,
910,
158
Su
rviv
ors’
annu
ities
50,7
24,7
61
54
,186
,031
57,5
42,9
13
61
,100
,647
65,2
15,13
3
68,7
70,5
52
73
,697
,450
89,5
16,9
80
95
,118,
041
10
1,13
6,32
5
D
isabi
lity
32
,868
,545
33,4
82,3
02
36
,828
,758
40,2
71,5
58
43
,053
,148
43
,086
,065
46,5
13,4
06
48
,312
,629
53,0
56,3
25
56
,098
,869
Lu
mp-
sum
pay
men
ts
13
,923
,360
10,8
94,6
38
33
,920
,915
23,7
10,7
33
22
,737
,815
12,5
15,3
78
15
,548
,262
15,6
93,5
75
14
,733
,290
15,2
28,2
49
To
tal b
enef
it pa
ymen
ts
83
1,48
6,59
6
978,
201,
010
1,
063,
970,
423
1,
110,
585,
961
1,
161,
291,
038
1,
214,
115,
627
1,
300,
213,
675
1,
390,
641,
192
1,
492,
063,
647
1,
627,
373,
601
Refu
nds:
Te
rmin
atio
n
11,9
24,6
54
10
,174,
522
10
,661
,887
10,7
71,3
09
11
,016
,841
12,3
19,2
12
10
,262
,279
9,92
2,58
2
10,9
71,2
15
12
,241
,107
O
ther
16,4
45,13
3
2,26
8,07
6
3,44
3,41
4
2,63
8,73
9
3,24
5,03
1
4,49
8,22
1
4,59
7,20
8
5,35
1,59
2
26,6
04,7
14
11
,259
,218
To
tal r
efun
ds
28
,369
,787
12,4
42,6
00
14
,105
,301
13,4
10,0
48
14
,261
,872
16,8
17,4
33
14
,859
,487
15,2
74,17
4
37,5
75,9
29
23
,500
,325
Adm
inist
rativ
e ex
pens
es
8,
221,
236
7,
693,
348
8,
311,
269
8,
139,
278
8,
807,
627
9,
537,
305
10
,681
,376
11,7
20,7
55
13
,734
,961
15,7
05,5
61
Tota
l ded
uctio
ns fr
om p
lan
net a
sset
s
868,
077,
619
99
8,33
6,95
8
1,08
6,38
6,99
3
1,13
2,13
5,28
7
1,18
4,36
0,53
7
1,24
0,47
0,36
5
1,32
5,75
4,53
8
1,41
7,63
6,12
1
1,54
3,37
4,53
7
1,66
6,57
9,48
7
Chan
ge in
net
ass
ets
$ (1
71,7
81,2
75)
$
2,48
8,07
5,45
8
$ 50
3,96
1,07
9
$ 40
5,70
5,11
2
$ 1,
179,
055,
889
$
(1,0
83,5
42,4
69)
$ (2
,517
,514
,397
) $
723,
978,
567
$ 1,
768,
922,
031
$ (1
0,06
4,86
2)
CH
ANG
ES IN
NET
ASS
ETS
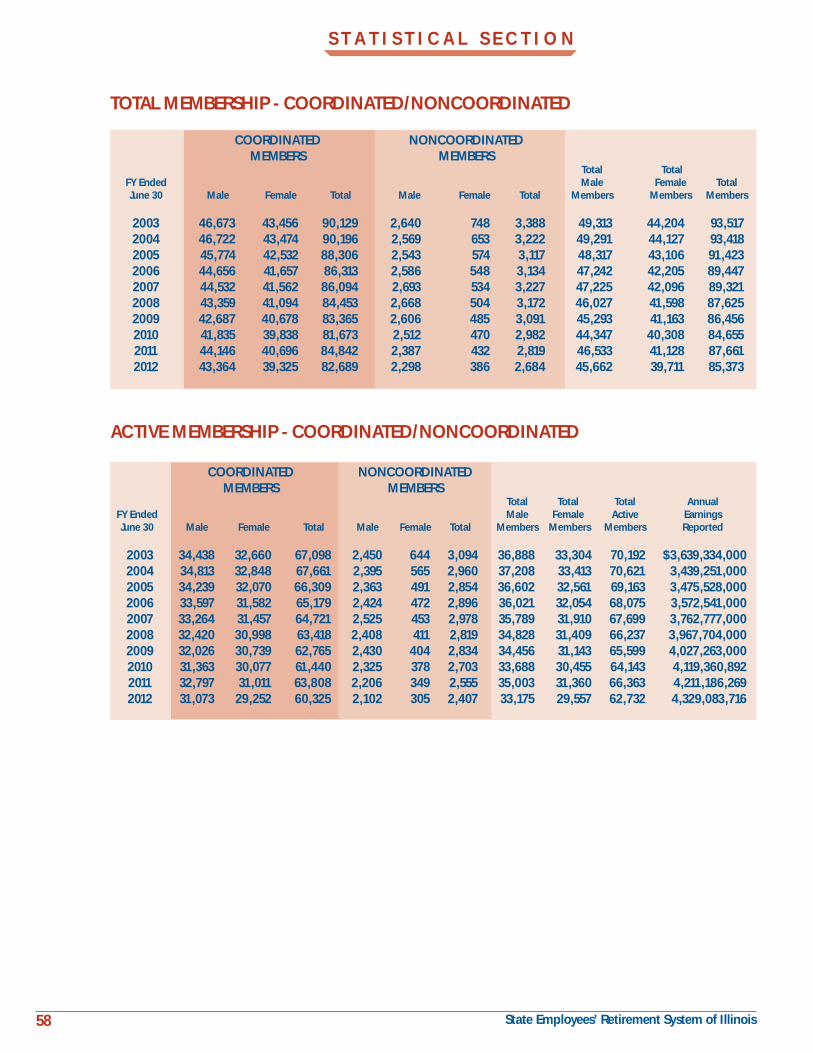
58 State Employees’ Retirement System of Illinois
TOTAL MEMBERSHIP - COORDINATED/NONCOORDINATED
COORDINATED NONCOORDINATED MEMBERS MEMBERS Total Total FY Ended Male Female Total June 30 Male Female Total Male Female Total Members Members Members
2003 46,673 43,456 90,129 2,640 748 3,388 49,313 44,204 93,517 2004 46,722 43,474 90,196 2,569 653 3,222 49,291 44,127 93,418 2005 45,774 42,532 88,306 2,543 574 3,117 48,317 43,106 91,423 2006 44,656 41,657 86,313 2,586 548 3,134 47,242 42,205 89,447 2007 44,532 41,562 86,094 2,693 534 3,227 47,225 42,096 89,321 2008 43,359 41,094 84,453 2,668 504 3,172 46,027 41,598 87,625 2009 42,687 40,678 83,365 2,606 485 3,091 45,293 41,163 86,456 2010 41,835 39,838 81,673 2,512 470 2,982 44,347 40,308 84,655 2011 44,146 40,696 84,842 2,387 432 2,819 46,533 41,128 87,661 2012 43,364 39,325 82,689 2,298 386 2,684 45,662 39,711 85,373
COORDINATED NONCOORDINATED MEMBERS MEMBERS Total Total Total Annual FY Ended Male Female Active Earnings June 30 Male Female Total Male Female Total Members Members Members Reported
2003 34,438 32,660 67,098 2,450 644 3,094 36,888 33,304 70,192 $3,639,334,000 2004 34,813 32,848 67,661 2,395 565 2,960 37,208 33,413 70,621 3,439,251,000 2005 34,239 32,070 66,309 2,363 491 2,854 36,602 32,561 69,163 3,475,528,000 2006 33,597 31,582 65,179 2,424 472 2,896 36,021 32,054 68,075 3,572,541,000 2007 33,264 31,457 64,721 2,525 453 2,978 35,789 31,910 67,699 3,762,777,000 2008 32,420 30,998 63,418 2,408 411 2,819 34,828 31,409 66,237 3,967,704,000 2009 32,026 30,739 62,765 2,430 404 2,834 34,456 31,143 65,599 4,027,263,000 2010 31,363 30,077 61,440 2,325 378 2,703 33,688 30,455 64,143 4,119,360,892 2011 32,797 31,011 63,808 2,206 349 2,555 35,003 31,360 66,363 4,211,186,269 2012 31,073 29,252 60,325 2,102 305 2,407 33,175 29,557 62,732 4,329,083,716
S T A T I S T I C A L S E C T I O N
ACTIVE MEMBERSHIP - COORDINATED/NONCOORDINATED
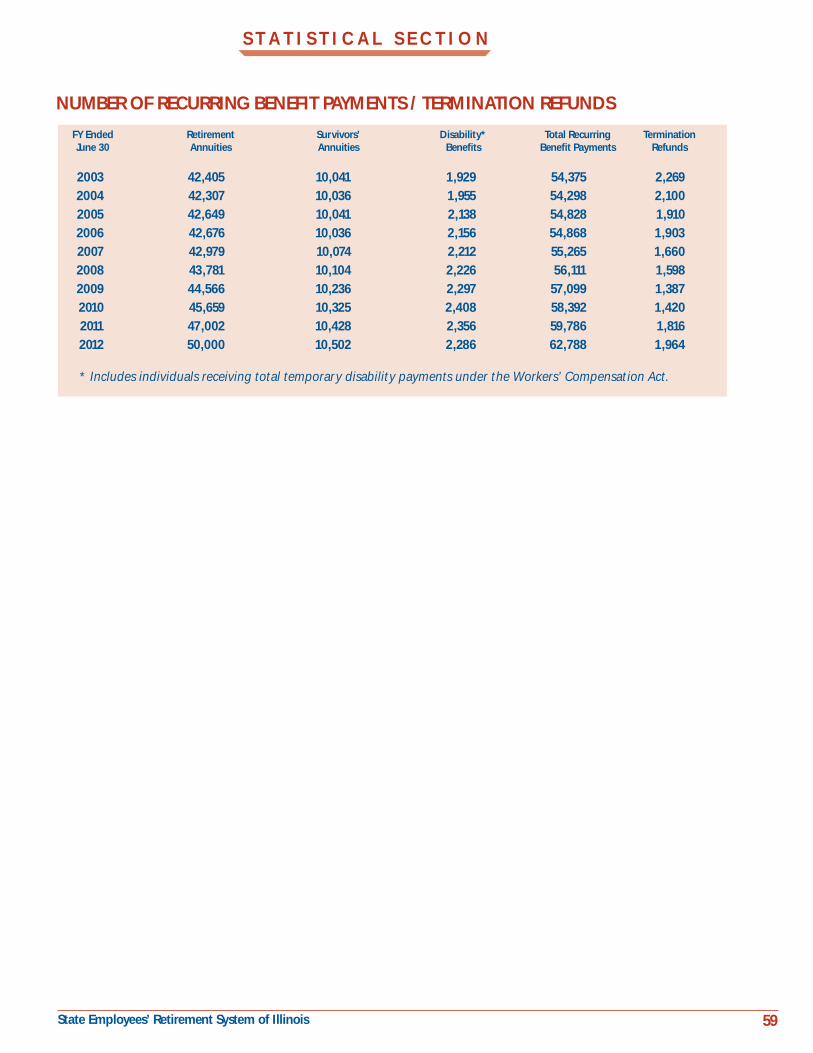
59 State Employees’ Retirement System of Illinois
NUMBER OF RECURRING BENEFIT PAYMENTS / TERMINATION REFUNDS
FY Ended Retirement Survivors’ Disability* Total Recurring Termination June 30 Annuities Annuities Benefits Benefit Payments Refunds 2003 42,405 10,041 1,929 54,375 2,269 2004 42,307 10,036 1,955 54,298 2,100 2005 42,649 10,041 2,138 54,828 1,910 2006 42,676 10,036 2,156 54,868 1,903 2007 42,979 10,074 2,212 55,265 1,660 2008 43,781 10,104 2,226 56,111 1,598 2009 44,566 10,236 2,297 57,099 1,387 2010 45,659 10,325 2,408 58,392 1,420 2011 47,002 10,428 2,356 59,786 1,816 2012 50,000 10,502 2,286 62,788 1,964
* Includes individuals receiving total temporary disability payments under the Workers’ Compensation Act.
S T A T I S T I C A L S E C T I O N
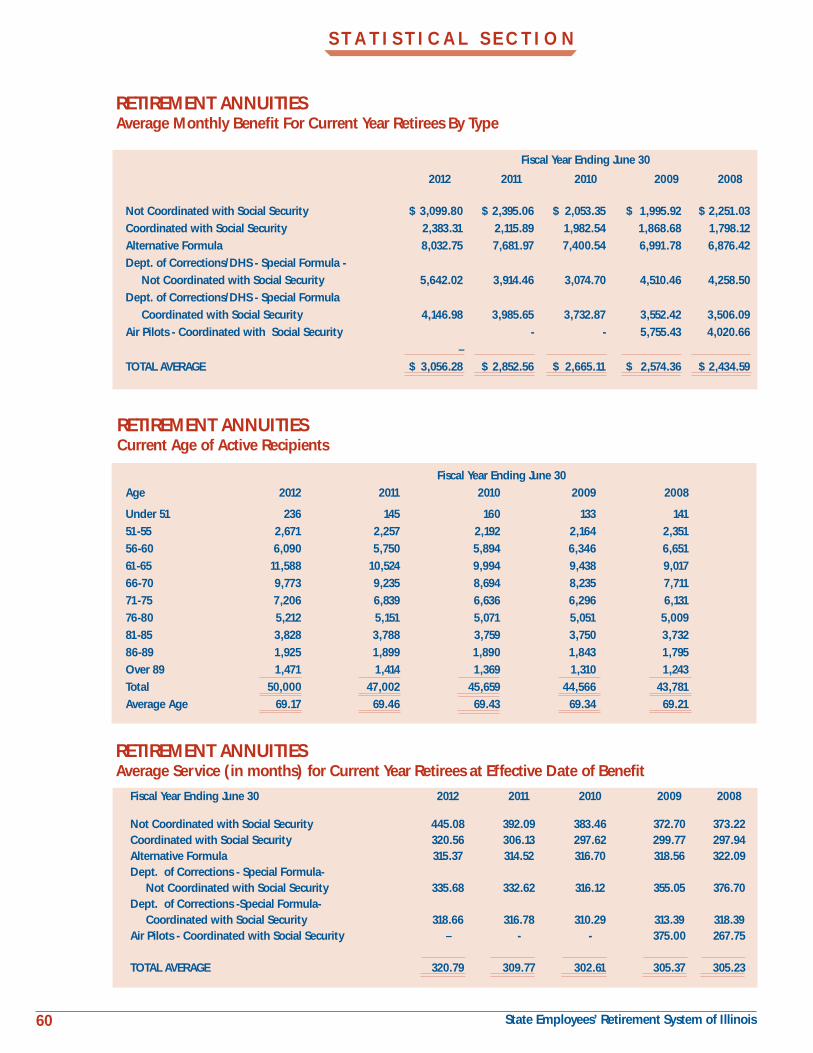
60 State Employees’ Retirement System of Illinois
RETIREMENT ANNUITIESAverage Monthly Benefit For Current Year Retirees By Type
Fiscal Year Ending June 30
2012 2011 2010 2009 2008
Not Coordinated with Social Security $ 3,099.80 $ 2,395.06 $ 2,053.35 $ 1,995.92 $ 2,251.03
Coordinated with Social Security 2,383.31 2,115.89 1,982.54 1,868.68 1,798.12
Alternative Formula 8,032.75 7,681.97 7,400.54 6,991.78 6,876.42
Dept. of Corrections/DHS - Special Formula -
Not Coordinated with Social Security 5,642.02 3,914.46 3,074.70 4,510.46 4,258.50
Dept. of Corrections/DHS - Special Formula
Coordinated with Social Security 4,146.98 3,985.65 3,732.87 3,552.42 3,506.09
Air Pilots - Coordinated with Social Security - - 5,755.43 4,020.66
–
TOTAL AVERAGE $ 3,056.28 $ 2,852.56 $ 2,665.11 $ 2,574.36 $ 2,434.59
Fiscal Year Ending June 30
Age 2012 2011 2010 2009 2008
Under 51 236 145 160 133 141
51-55 2,671 2,257 2,192 2,164 2,351
56-60 6,090 5,750 5,894 6,346 6,651
61-65 11,588 10,524 9,994 9,438 9,017
66-70 9,773 9,235 8,694 8,235 7,711
71-75 7,206 6,839 6,636 6,296 6,131
76-80 5,212 5,151 5,071 5,051 5,009
81-85 3,828 3,788 3,759 3,750 3,732
86-89 1,925 1,899 1,890 1,843 1,795
Over 89 1,471 1,414 1,369 1,310 1,243
Total 50,000 47,002 45,659 44,566 43,781
Average Age 69.17 69.46 69.43 69.34 69.21
RETIREMENT ANNUITIESAverage Service (in months) for Current Year Retirees at Effective Date of Benefit
Fiscal Year Ending June 30 2012 2011 2010 2009 2008
Not Coordinated with Social Security 445.08 392.09 383.46 372.70 373.22Coordinated with Social Security 320.56 306.13 297.62 299.77 297.94Alternative Formula 315.37 314.52 316.70 318.56 322.09Dept. of Corrections - Special Formula- Not Coordinated with Social Security 335.68 332.62 316.12 355.05 376.70Dept. of Corrections -Special Formula- Coordinated with Social Security 318.66 316.78 310.29 313.39 318.39Air Pilots - Coordinated with Social Security – - - 375.00 267.75
TOTAL AVERAGE 320.79 309.77 302.61 305.37 305.23
S T A T I S T I C A L S E C T I O N
RETIREMENT ANNUITIESCurrent Age of Active Recipients
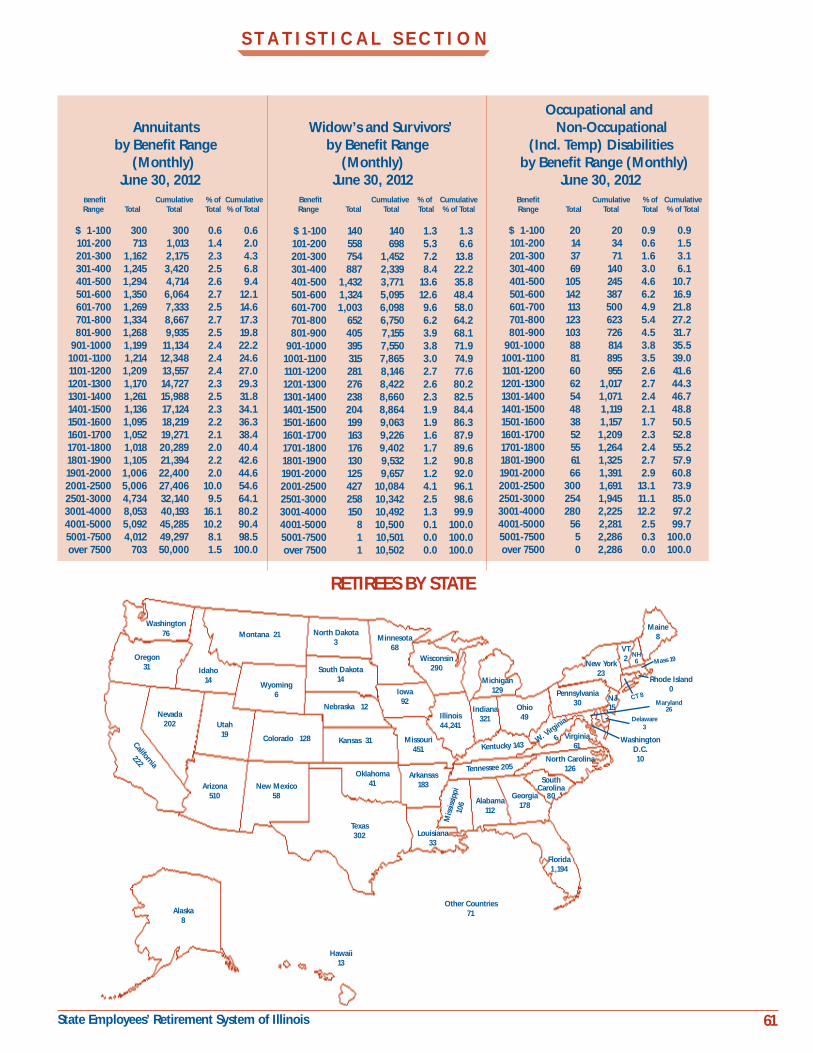
61 State Employees’ Retirement System of Illinois
Occupational and Annuitants Widow’s and Survivors’ Non-Occupational by Benefit Range by Benefit Range (Incl. Temp) Disabilities (Monthly) (Monthly) by Benefit Range (Monthly)
June 30, 2012 June 30, 2012 June 30, 2012 Benefit Cumulative % of Cumulative Benefit Cumulative % of Cumulative Benefit Cumulative % of Cumulative Range Total Total Total % of Total Range Total Total Total % of Total Range Total Total Total % of Total
$ 1-100 300 300 0.6 0.6 101-200 713 1,013 1.4 2.0 201-300 1,162 2,175 2.3 4.3 301-400 1,245 3,420 2.5 6.8 401-500 1,294 4,714 2.6 9.4 501-600 1,350 6,064 2.7 12.1 601-700 1,269 7,333 2.5 14.6 701-800 1,334 8,667 2.7 17.3 801-900 1,268 9,935 2.5 19.8 901-1000 1,199 11,134 2.4 22.2 1001-1100 1,214 12,348 2.4 24.6 1101-1200 1,209 13,557 2.4 27.0 1201-1300 1,170 14,727 2.3 29.3 1301-1400 1,261 15,988 2.5 31.8 1401-1500 1,136 17,124 2.3 34.1 1501-1600 1,095 18,219 2.2 36.3 1601-1700 1,052 19,271 2.1 38.4 1701-1800 1,018 20,289 2.0 40.4 1801-1900 1,105 21,394 2.2 42.6 1901-2000 1,006 22,400 2.0 44.6 2001-2500 5,006 27,406 10.0 54.6 2501-3000 4,734 32,140 9.5 64.1 3001-4000 8,053 40,193 16.1 80.2 4001-5000 5,092 45,285 10.2 90.4 5001-7500 4,012 49,297 8.1 98.5 over 7500 703 50,000 1.5 100.0
$ 1-100 140 140 1.3 1.3 101-200 558 698 5.3 6.6 201-300 754 1,452 7.2 13.8 301-400 887 2,339 8.4 22.2 401-500 1,432 3,771 13.6 35.8 501-600 1,324 5,095 12.6 48.4 601-700 1,003 6,098 9.6 58.0 701-800 652 6,750 6.2 64.2 801-900 405 7,155 3.9 68.1 901-1000 395 7,550 3.8 71.9 1001-1100 315 7,865 3.0 74.9 1101-1200 281 8,146 2.7 77.6 1201-1300 276 8,422 2.6 80.2 1301-1400 238 8,660 2.3 82.5 1401-1500 204 8,864 1.9 84.4 1501-1600 199 9,063 1.9 86.3 1601-1700 163 9,226 1.6 87.9 1701-1800 176 9,402 1.7 89.6 1801-1900 130 9,532 1.2 90.8 1901-2000 125 9,657 1.2 92.0 2001-2500 427 10,084 4.1 96.1 2501-3000 258 10,342 2.5 98.6 3001-4000 150 10,492 1.3 99.9 4001-5000 8 10,500 0.1 100.0 5001-7500 1 10,501 0.0 100.0 over 7500 1 10,502 0.0 100.0
$ 1-100 20 20 0.9 0.9 101-200 14 34 0.6 1.5 201-300 37 71 1.6 3.1 301-400 69 140 3.0 6.1 401-500 105 245 4.6 10.7 501-600 142 387 6.2 16.9 601-700 113 500 4.9 21.8 701-800 123 623 5.4 27.2 801-900 103 726 4.5 31.7 901-1000 88 814 3.8 35.5 1001-1100 81 895 3.5 39.0 1101-1200 60 955 2.6 41.6 1201-1300 62 1,017 2.7 44.3 1301-1400 54 1,071 2.4 46.7 1401-1500 48 1,119 2.1 48.8 1501-1600 38 1,157 1.7 50.5 1601-1700 52 1,209 2.3 52.8 1701-1800 55 1,264 2.4 55.2 1801-1900 61 1,325 2.7 57.9 1901-2000 66 1,391 2.9 60.8 2001-2500 300 1,691 13.1 73.9 2501-3000 254 1,945 11.1 85.0 3001-4000 280 2,225 12.2 97.2 4001-5000 56 2,281 2.5 99.7 5001-7500 5 2,286 0.3 100.0 over 7500 0 2,286 0.0 100.0
S T A T I S T I C A L S E C T I O N
RETIREES BY STATE
Montana 21Washington
76
Nevada202
North Dakota3 Minnesota
68Wisconsin
290
Iowa92
Missouri451
South Dakota14
Nebraska 12
Wyoming6
Idaho14
Utah19
Arizona510
Illinois44,241
Kansas 31
Oklahoma41
Arkansas183
California
222
Oregon31
Texas302
New Mexico58
Louisiana33
Alabama112
Georgia178
Maine8
New York23
Pennsylvania30
Michigan129
Ohio49
W. Virg
inia
6
North Carolina126
Virginia61
VT2 NH
6 Mass 19
CT 8
Rhode Island 0
Maryland26
Delaware3
NJ15
Washington D.C.10
Alaska8
Hawaii13
SouthCarolina
80
Other Countries71
Colorado 128Kentucky 143
Indiana321
Mis
siss
ippi
106
Florida1,194
Tennessee 205

62 State Employees’ Retirement System of Illinois
Average Benefit Payments Fiscal Years 2003 through 2012
Years Credited Service
0-5 5-10 10-15 15-20 20-25 25-30 30+Retirement Effective Dates
Period 7/1/02 to 6/30/03 Average monthly benefit $ - $ 417 $ 774 $ 1,165 $ 1,921 $ 2,523 $ 2,889 Average final average salary $ - $ 2,799 $ 3,284 $ 3,533 $ 3,816 $ 4,210 $ 4,407 Number of retired members - 36 317 812 2,017 2,362 5,828
Period 7/1/03 to 6/30/04 Average monthly benefit $ - $ 532 $ 666 $ 939 $ 1,650 $ 3,214 $ 2,317 Average final average salary $ - $ 3,499 $ 3,283 $ 3,468 $ 3,953 $ 5,326 $ 4,685 Number of retired members - 65 105 122 210 305 478
Period 7/1/04 to 6/30/05 Average monthly benefit $ - $ 537 $ 744 $ 1,072 $ 1,642 $ 2,742 $ 2,659 Average final average salary $ - $ 3,464 $ 3,721 $ 3,799 $ 4,050 $ 4,807 $ 4,820 Number of retired members - 99 145 177 235 400 726
Period 7/1/05 to 6/30/06 Average monthly benefit $ - $ 536 $ 715 $ 1,090 $ 1,696 $ 2,893 $ 2,422 Average final average salary $ - $ 3,672 $ 3,614 $ 3,763 $ 4,169 $ 4,990 $ 4,769 Number of retired members - 69 148 160 215 356 450
Period 7/1/06 to 6/30/07 Average monthly benefit $ - $ 536 $ 728 $ 1,117 $ 1,875 $ 3,171 $ 2,736 Average final average salary $ - $ 3,531 $ 3,668 $ 3,820 $ 4,539 $ 5,248 $ 5,034 Number of retired members - 91 190 178 289 417 520
Period 7/1/07 to 6/30/08 Average monthly benefit $ - $ 565 $ 791 $ 1,370 $ 2,143 $ 3,336 $ 2,978 Average final average salary $ - $ 3,628 $ 3,879 $ 4,333 $ 4,642 $ 5,377 $ 5,311 Number of retired members - 96 165 238 423 604 688
Period 7/1/08 to 6/30/09 Average monthly benefit $ - $ 645 $ 835 $ 1,398 $ 2,343 $ 3,598 $ 3,051 Average final average salary $ - $ 4,308 $ 4,075 $ 4,360 $ 4,926 $ 5,783 $ 5,402 Number of retired members - 91 187 191 409 509 659
Period 7/1/09 to 6/30/10 Average monthly benefit $ - $ 587 $ 817 $ 1,437 $ 2,438 $ 3,687 $ 3,243 Average final average salary $ - $ 3,975 $ 4,046 $ 4,623 $ 5,193 $ 5,928 $ 5,537 Number of retired members - 101 188 233 555 617 722
Period 7/1/10 to 6/30/11 Average monthly benefit $ - $ 597 $ 852 $ 1,460 $ 2,591 $ 3,936 $ 3,273 Average final average salary $ - $ 4,089 $ 4,383 $ 4,894 $ 5,549 $ 6,502 $ 5,858 Number of retired members - 96 233 224 532 747 921
Period 7/1/11 to 6/30/12 Average monthly benefit $ – $ 740 $ 944 $ 1,401 $ 2,620 $ 3,989 $ 3,514Average final average salary $ – $ 4,939 $ 4,739 $ $4,788 $ 5,687 $ 6,491 $ 5,922Number of retired members – 104 268 328 843 1,226 1,591
S T A T I S T I C A L S E C T I O N

63 State Employees’ Retirement System of Illinois
PLAN SUMMARY & LEGISLATIVE SECTION
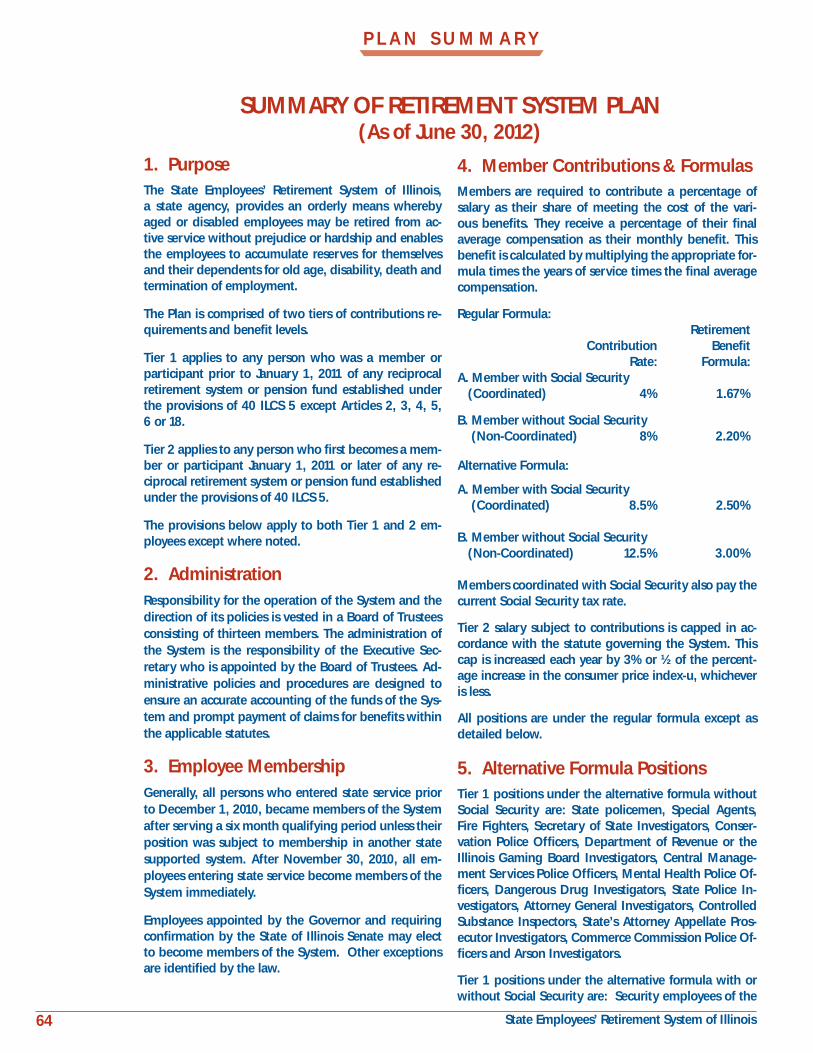
64 State Employees’ Retirement System of Illinois
SUMMARY OF RETIREMENT SYSTEM PLAN(As of June 30, 2012)
1. PurposeThe State Employees’ Retirement System of Illinois, a state agency, provides an orderly means whereby aged or disabled employees may be retired from ac-tive service without prejudice or hardship and enables the employees to accumulate reserves for themselves and their dependents for old age, disability, death and termination of employment.
The Plan is comprised of two tiers of contributions re-quirements and benefit levels.
Tier 1 applies to any person who was a member or participant prior to January 1, 2011 of any reciprocal retirement system or pension fund established under the provisions of 40 ILCS 5 except Articles 2, 3, 4, 5, 6 or 18.
Tier 2 applies to any person who first becomes a mem-ber or participant January 1, 2011 or later of any re-ciprocal retirement system or pension fund established under the provisions of 40 ILCS 5.
The provisions below apply to both Tier 1 and 2 em-ployees except where noted.
2. AdministrationResponsibility for the operation of the System and the direction of its policies is vested in a Board of Trustees consisting of thirteen members. The administration of the System is the responsibility of the Executive Sec-retary who is appointed by the Board of Trustees. Ad-ministrative policies and procedures are designed to ensure an accurate accounting of the funds of the Sys-tem and prompt payment of claims for benefits within the applicable statutes.
3. Employee Membership Generally, all persons who entered state service prior to December 1, 2010, became members of the System after serving a six month qualifying period unless their position was subject to membership in another state supported system. After November 30, 2010, all em-ployees entering state service become members of the System immediately.
Employees appointed by the Governor and requiring confirmation by the State of Illinois Senate may elect to become members of the System. Other exceptions are identified by the law.
4. Member Contributions & FormulasMembers are required to contribute a percentage of salary as their share of meeting the cost of the vari-ous benefits. They receive a percentage of their final average compensation as their monthly benefit. This benefit is calculated by multiplying the appropriate for-mula times the years of service times the final average compensation.
Regular Formula: Retirement Contribution Benefit Rate: Formula:A. Member with Social Security (Coordinated) 4% 1.67%
B. Member without Social Security (Non-Coordinated) 8% 2.20% Alternative Formula:
A. Member with Social Security (Coordinated) 8.5% 2.50%
B. Member without Social Security (Non-Coordinated) 12.5% 3.00% Members coordinated with Social Security also pay the current Social Security tax rate.
Tier 2 salary subject to contributions is capped in ac-cordance with the statute governing the System. This cap is increased each year by 3% or ½ of the percent-age increase in the consumer price index-u, whichever is less.
All positions are under the regular formula except as detailed below.
5. Alternative Formula PositionsTier 1 positions under the alternative formula without Social Security are: State policemen, Special Agents, Fire Fighters, Secretary of State Investigators, Conser-vation Police Officers, Department of Revenue or the Illinois Gaming Board Investigators, Central Manage-ment Services Police Officers, Mental Health Police Of-ficers, Dangerous Drug Investigators, State Police In-vestigators, Attorney General Investigators, Controlled Substance Inspectors, State’s Attorney Appellate Pros-ecutor Investigators, Commerce Commission Police Of-ficers and Arson Investigators.
Tier 1 positions under the alternative formula with or without Social Security are: Security employees of the
P L A N S U M M A R Y
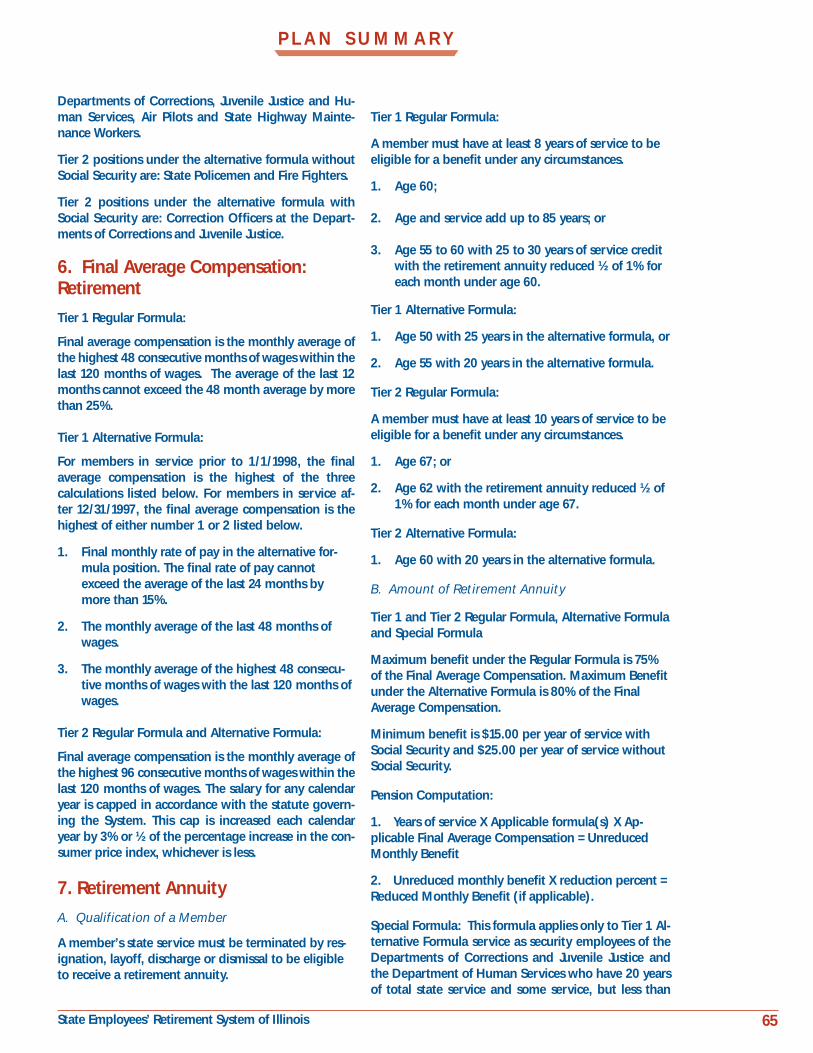
65 State Employees’ Retirement System of Illinois
Departments of Corrections, Juvenile Justice and Hu-man Services, Air Pilots and State Highway Mainte-nance Workers.
Tier 2 positions under the alternative formula without Social Security are: State Policemen and Fire Fighters.
Tier 2 positions under the alternative formula with Social Security are: Correction Officers at the Depart-ments of Corrections and Juvenile Justice.
6. Final Average Compensation: Retirement
Tier 1 Regular Formula:
Final average compensation is the monthly average of the highest 48 consecutive months of wages within the last 120 months of wages. The average of the last 12 months cannot exceed the 48 month average by more than 25%.
Tier 1 Alternative Formula:
For members in service prior to 1/1/1998, the final average compensation is the highest of the three calculations listed below. For members in service af-ter 12/31/1997, the final average compensation is the highest of either number 1 or 2 listed below.
1. Final monthly rate of pay in the alternative for- mula position. The final rate of pay cannot exceed the average of the last 24 months by more than 15%.
2. The monthly average of the last 48 months of wages.
3. The monthly average of the highest 48 consecu- tive months of wages with the last 120 months of wages.
Tier 2 Regular Formula and Alternative Formula:
Final average compensation is the monthly average of the highest 96 consecutive months of wages within the last 120 months of wages. The salary for any calendar year is capped in accordance with the statute govern-ing the System. This cap is increased each calendar year by 3% or ½ of the percentage increase in the con-sumer price index, whichever is less.
7. Retirement Annuity
A. Qualification of a Member
A member’s state service must be terminated by res-ignation, layoff, discharge or dismissal to be eligible to receive a retirement annuity.
Tier 1 Regular Formula:
A member must have at least 8 years of service to be eligible for a benefit under any circumstances.
1. Age 60;
2. Age and service add up to 85 years; or
3. Age 55 to 60 with 25 to 30 years of service credit with the retirement annuity reduced ½ of 1% for each month under age 60.
Tier 1 Alternative Formula:
1. Age 50 with 25 years in the alternative formula, or
2. Age 55 with 20 years in the alternative formula.
Tier 2 Regular Formula:
A member must have at least 10 years of service to be eligible for a benefit under any circumstances.
1. Age 67; or
2. Age 62 with the retirement annuity reduced ½ of 1% for each month under age 67.
Tier 2 Alternative Formula:
1. Age 60 with 20 years in the alternative formula.
B. Amount of Retirement Annuity
Tier 1 and Tier 2 Regular Formula, Alternative Formula and Special Formula
Maximum benefit under the Regular Formula is 75% of the Final Average Compensation. Maximum Benefit under the Alternative Formula is 80% of the Final Average Compensation.
Minimum benefit is $15.00 per year of service with Social Security and $25.00 per year of service without Social Security.
Pension Computation:
1. Years of service X Applicable formula(s) X Ap-plicable Final Average Compensation = Unreduced Monthly Benefit
2. Unreduced monthly benefit X reduction percent = Reduced Monthly Benefit (if applicable).
Special Formula: This formula applies only to Tier 1 Al-ternative Formula service as security employees of the Departments of Corrections and Juvenile Justice and the Department of Human Services who have 20 years of total state service and some service, but less than
P L A N S U M M A R Y
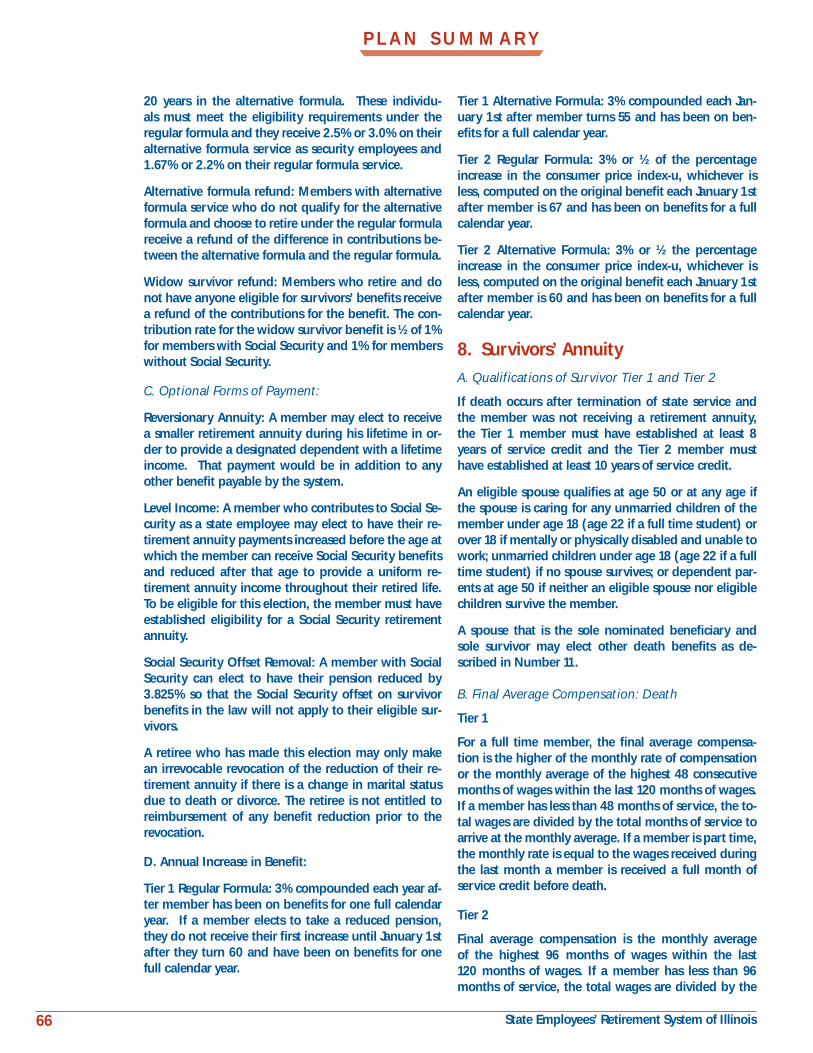
66 State Employees’ Retirement System of Illinois
20 years in the alternative formula. These individu-als must meet the eligibility requirements under the regular formula and they receive 2.5% or 3.0% on their alternative formula service as security employees and 1.67% or 2.2% on their regular formula service.
Alternative formula refund: Members with alternative formula service who do not qualify for the alternative formula and choose to retire under the regular formula receive a refund of the difference in contributions be-tween the alternative formula and the regular formula.
Widow survivor refund: Members who retire and do not have anyone eligible for survivors’ benefits receive a refund of the contributions for the benefit. The con-tribution rate for the widow survivor benefit is ½ of 1% for members with Social Security and 1% for members without Social Security.
C. Optional Forms of Payment:
Reversionary Annuity: A member may elect to receive a smaller retirement annuity during his lifetime in or-der to provide a designated dependent with a lifetime income. That payment would be in addition to any other benefit payable by the system.
Level Income: A member who contributes to Social Se-curity as a state employee may elect to have their re-tirement annuity payments increased before the age at which the member can receive Social Security benefits and reduced after that age to provide a uniform re-tirement annuity income throughout their retired life. To be eligible for this election, the member must have established eligibility for a Social Security retirement annuity.
Social Security Offset Removal: A member with Social Security can elect to have their pension reduced by 3.825% so that the Social Security offset on survivor benefits in the law will not apply to their eligible sur-vivors.
A retiree who has made this election may only make an irrevocable revocation of the reduction of their re-tirement annuity if there is a change in marital status due to death or divorce. The retiree is not entitled to reimbursement of any benefit reduction prior to the revocation.
D. Annual Increase in Benefit:
Tier 1 Regular Formula: 3% compounded each year af-ter member has been on benefits for one full calendar year. If a member elects to take a reduced pension, they do not receive their first increase until January 1st after they turn 60 and have been on benefits for one full calendar year.
Tier 1 Alternative Formula: 3% compounded each Jan-uary 1st after member turns 55 and has been on ben-efits for a full calendar year.
Tier 2 Regular Formula: 3% or ½ of the percentage increase in the consumer price index-u, whichever is less, computed on the original benefit each January 1st after member is 67 and has been on benefits for a full calendar year.
Tier 2 Alternative Formula: 3% or ½ the percentage increase in the consumer price index-u, whichever is less, computed on the original benefit each January 1st after member is 60 and has been on benefits for a full calendar year.
8. Survivors’ AnnuityA. Qualifications of Survivor Tier 1 and Tier 2
If death occurs after termination of state service and the member was not receiving a retirement annuity, the Tier 1 member must have established at least 8 years of service credit and the Tier 2 member must have established at least 10 years of service credit.
An eligible spouse qualifies at age 50 or at any age if the spouse is caring for any unmarried children of the member under age 18 (age 22 if a full time student) or over 18 if mentally or physically disabled and unable to work; unmarried children under age 18 (age 22 if a full time student) if no spouse survives; or dependent par-ents at age 50 if neither an eligible spouse nor eligible children survive the member.
A spouse that is the sole nominated beneficiary and sole survivor may elect other death benefits as de-scribed in Number 11.
B. Final Average Compensation: Death
Tier 1
For a full time member, the final average compensa-tion is the higher of the monthly rate of compensation or the monthly average of the highest 48 consecutive months of wages within the last 120 months of wages. If a member has less than 48 months of service, the to-tal wages are divided by the total months of service to arrive at the monthly average. If a member is part time, the monthly rate is equal to the wages received during the last month a member is received a full month of service credit before death.
Tier 2
Final average compensation is the monthly average of the highest 96 months of wages within the last 120 months of wages. If a member has less than 96 months of service, the total wages are divided by the
P L A N S U M M A R Y

67 State Employees’ Retirement System of Illinois
total months of service to arrive at the monthly aver-age. The salary for any calendar year is capped in ac-cordance with the statute governing the System. This cap is increased each calendar year by 3% or ½ of the percentage increase in the consumer price index-u, whichever is less.
C. Amount of Payment
Tier 1
If the member’s death occurs before retirement, the named beneficiary receives a lump sum refund of all the member’s retirement contributions plus the inter-est credited to the member’s account, excluding con-tributions for widow and survivors’ benefits. A single lump sum payment of $1,000 is also made to the qual-ified survivor of the member.
An eligible spouse receives a monthly annuity equal to 30% of the member’s final average compensation subject to a maximum of $400.
If children of the member are under the care of the spouse, the annuity is increased for each child, subject to a maximum of $600 or 80% of final average com-pensation.
If only eligible children survive, the monthly annuity may not exceed $600 or 80% of the final average com-pensation, whichever is less. The maximum combined monthly payment to parents may not exceed $400.
If the member’s death occurs after termination of state employment, but before the member receives a re-tirement annuity, the monthly benefit is the same as during active employment or 80% of the earned retire-ment annuity at date of death.
The minimum total survivor benefit payable to the sur-vivors; annuity beneficiaries of a deceased member or annuitant shall be 50% of the amount of retirement annuity that was or would have been payable to the deceased member on the date of death.
For survivors of retired members who were covered by Social Security and who did not elect the Social Security offset removal option, monthly benefits pay-able are reduced by one-half of the amount of benefits they are eligible to receive from Social Security from the deceased member’s account. The Social Security offset may not reduce the benefit by more than 50%. The offset does not apply to the survivor of members who die before receiving retirement benefits whether active or inactive, survivors of members who retired prior to January 1, 1998 and survivors who were re-ceiving benefits prior to July 1, 2009. For survivors of retired members who were covered by Social Security and did elect the Social Security offset removal option, the offset does not apply.
Tier 2
A single lump sum payment of $1000 and a monthly benefit of 66 2/3% of the members earned pension at death. This benefit is allocated among all eligible sur-vivors.
For survivors of retired members who were covered by Social Security as a state employee and who did not elect the social security offset removal option, monthly benefits payable are reduced by one-half of the amount of benefits they are eligible to receive from Social Se-curity from the deceased member’s account. The So-cial Security offset may not reduce the benefit by more than 50%. The offset does not apply to members who die before receiving retirement benefits whether active or inactive. For survivors of retired members who were covered by Social Security and did not elect the Social Security offset removal option, the offset does not ap-ply.
D. Duration of Payment
The monthly annuity payable to a spouse terminates upon death; to children upon death, marriage, or at-tainment of age 18 (age 22 if a full time student), ex-cept for a child who at age 18 is physically or mentally disabled and unable to accept gainful employment, which terminate at death or gainful employment. De-pendent parents’ benefits terminate at death or remar-riage.
E. Annual Increase in Benefit
Tier 1
The survivor benefit is increased by 3% each January 1, after receipt of benefits for one full year. Survivors of retired members receive an increase on January 1 fol-lowing the commencement of the benefit.
Tier 2
The benefit is increased by 3% or ½ of the percent-age increase in the consumer price index-u, whichever is less, computed on the original benefit amount each January 1, after receipt of benefits for one full calendar year. Survivors of retired members increase on January 1 following the commencement of the benefit.
9. Widows Annuity (Tier 1 only)The widow of a male member who was a participant in the System prior to July 19, 1961, may have the option of taking a Widow’s Annuity rather than the Survivors’ Annuity.
A. Qualification of a Widow
An eligible widow receives a Widow’s Annuity if she is age 50 or over or has in her care any of the member’s
P L A N S U M M A R Y
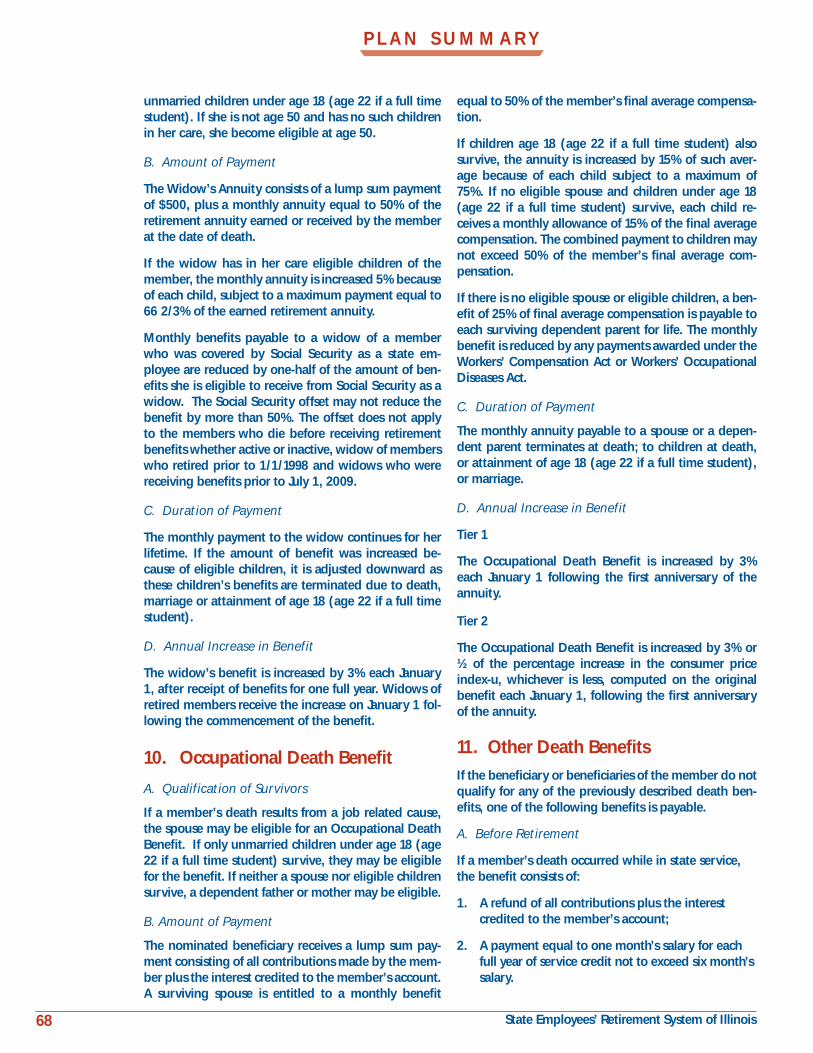
68 State Employees’ Retirement System of Illinois
unmarried children under age 18 (age 22 if a full time student). If she is not age 50 and has no such children in her care, she become eligible at age 50.
B. Amount of Payment
The Widow’s Annuity consists of a lump sum payment of $500, plus a monthly annuity equal to 50% of the retirement annuity earned or received by the member at the date of death.
If the widow has in her care eligible children of the member, the monthly annuity is increased 5% because of each child, subject to a maximum payment equal to 66 2/3% of the earned retirement annuity.
Monthly benefits payable to a widow of a member who was covered by Social Security as a state em-ployee are reduced by one-half of the amount of ben-efits she is eligible to receive from Social Security as a widow. The Social Security offset may not reduce the benefit by more than 50%. The offset does not apply to the members who die before receiving retirement benefits whether active or inactive, widow of members who retired prior to 1/1/1998 and widows who were receiving benefits prior to July 1, 2009.
C. Duration of Payment
The monthly payment to the widow continues for her lifetime. If the amount of benefit was increased be-cause of eligible children, it is adjusted downward as these children’s benefits are terminated due to death, marriage or attainment of age 18 (age 22 if a full time student).
D. Annual Increase in Benefit
The widow’s benefit is increased by 3% each January 1, after receipt of benefits for one full year. Widows of retired members receive the increase on January 1 fol-lowing the commencement of the benefit.
10. Occupational Death Benefit
A. Qualification of Survivors
If a member’s death results from a job related cause, the spouse may be eligible for an Occupational Death Benefit. If only unmarried children under age 18 (age 22 if a full time student) survive, they may be eligible for the benefit. If neither a spouse nor eligible children survive, a dependent father or mother may be eligible.
B. Amount of Payment
The nominated beneficiary receives a lump sum pay-ment consisting of all contributions made by the mem-ber plus the interest credited to the member’s account. A surviving spouse is entitled to a monthly benefit
equal to 50% of the member’s final average compensa-tion.
If children age 18 (age 22 if a full time student) also survive, the annuity is increased by 15% of such aver-age because of each child subject to a maximum of 75%. If no eligible spouse and children under age 18 (age 22 if a full time student) survive, each child re-ceives a monthly allowance of 15% of the final average compensation. The combined payment to children may not exceed 50% of the member’s final average com-pensation.
If there is no eligible spouse or eligible children, a ben-efit of 25% of final average compensation is payable to each surviving dependent parent for life. The monthly benefit is reduced by any payments awarded under the Workers’ Compensation Act or Workers’ Occupational Diseases Act.
C. Duration of Payment
The monthly annuity payable to a spouse or a depen-dent parent terminates at death; to children at death, or attainment of age 18 (age 22 if a full time student), or marriage.
D. Annual Increase in Benefit
Tier 1
The Occupational Death Benefit is increased by 3% each January 1 following the first anniversary of the annuity.
Tier 2
The Occupational Death Benefit is increased by 3% or ½ of the percentage increase in the consumer price index-u, whichever is less, computed on the original benefit each January 1, following the first anniversary of the annuity.
11. Other Death BenefitsIf the beneficiary or beneficiaries of the member do not qualify for any of the previously described death ben-efits, one of the following benefits is payable.
A. Before Retirement
If a member’s death occurred while in state service, the benefit consists of:
1. A refund of all contributions plus the interest credited to the member’s account;
2. A payment equal to one month’s salary for each full year of service credit not to exceed six month’s salary.
P L A N S U M M A R Y

69 State Employees’ Retirement System of Illinois
If the member had terminated state service, but not yet qualified for a retirement annuity, the benefit con-sists of a refund of all the member’s contributions to the System plus the interest credited to the member’s account.
B. After Retirement
The benefit consists of a lump sum payment equal to the excess of contributions plus the interest credited to the member’s account over the total amount of retirement annuity payments made to the member. The minimum payment is $500.
12. Final Average Compensation All Disability Benefits
Tier 1
For a full time member, the final average compensa-tion is the higher of the monthly rate of compensation or the monthly average of the highest 48 consecutive months of wages within the last 120 months of wages. If a member has less than 48 months service, the total wages are divided by the total months of service to ar-rive at the monthly average. If a member is part time, the monthly rate is equal to the wages received during the last month a member received a full month of ser-vice credit before death.
Tier 2
Final average compensation is the monthly average of the highest 96 months of wages within the last 120 months of wages. If a member has less than 96 months, the total wages are divided by the total months of ser-vice to arrive at the monthly average. The salary for any calendar year is capped on accordance with the statute governing the System. This cap is increased each cal-endar year by 3% or ½ of the percentage increase in the consumer price index-u, whichever is less.
13. Non-Occupational Disability Benefits
A. Qualification and Amount of Payment
Available to any member who has established at least 18 months of creditable service and who has been granted a disability leave of absence by employing agency. The benefit is 50% of salary or final average compensation, whichever is higher, and credit to the member’s account of service and contributions. It be-gins on the 31st day of absence from service on ac-count of disability (including any periods for which sick pay was received).
If the member has Social Security coverage as a state employee, the benefit payable by the System is re-
duced by the amount of any disability or retirement payment to which he is entitled under Social Security.
B. Duration of Payment
The member is eligible for the monthly benefit until the occurrence of any of the following events:
1. Disability ceases;
2. Resumption of gainful employment;
3. Payments are made for a period of time equal to one-half of the service credit established as of the date disability began;
4. Attainment of age 65, if benefit commenced prior to the attainment of age 60;
5. The fifth anniversary of the effective date of the benefit if the benefit commenced on or after the attainment of age 60;
6. Death of a member.
C. Increase in Benefit
The Nonoccupational Disability Benefit shall be in-creased by 7% on January 1, following the fourth an-niversary of the benefit and 3% each year thereafter.
14. Occupational Disability Benefits
A. Qualification and Amount of Payment
Provided for any member who becomes disabled as the direct result of an injury or disease arising out of and in the course of state employment.
The benefit is 75% of salary or final average compen-sation, whichever is higher, plus a credit to the mem-ber’s account of service and contributions. The cash benefit is reduced by any payment received under the Workers’ Compensation Act or Workers’ Occupational Diseases Act.
B. Duration of Payment
Monthly benefits are payable until the occurrence of any of the following events:
1. Disability ceases;
2. Resumption of gainful employment;
3. Attainment of age 65, if benefit commenced prior to the attainment of age 60;
4. The fifth anniversary of the effective date of the benefit if the benefit commenced on or after the attainment of age 60;
5. Death of a member.
P L A N S U M M A R Y
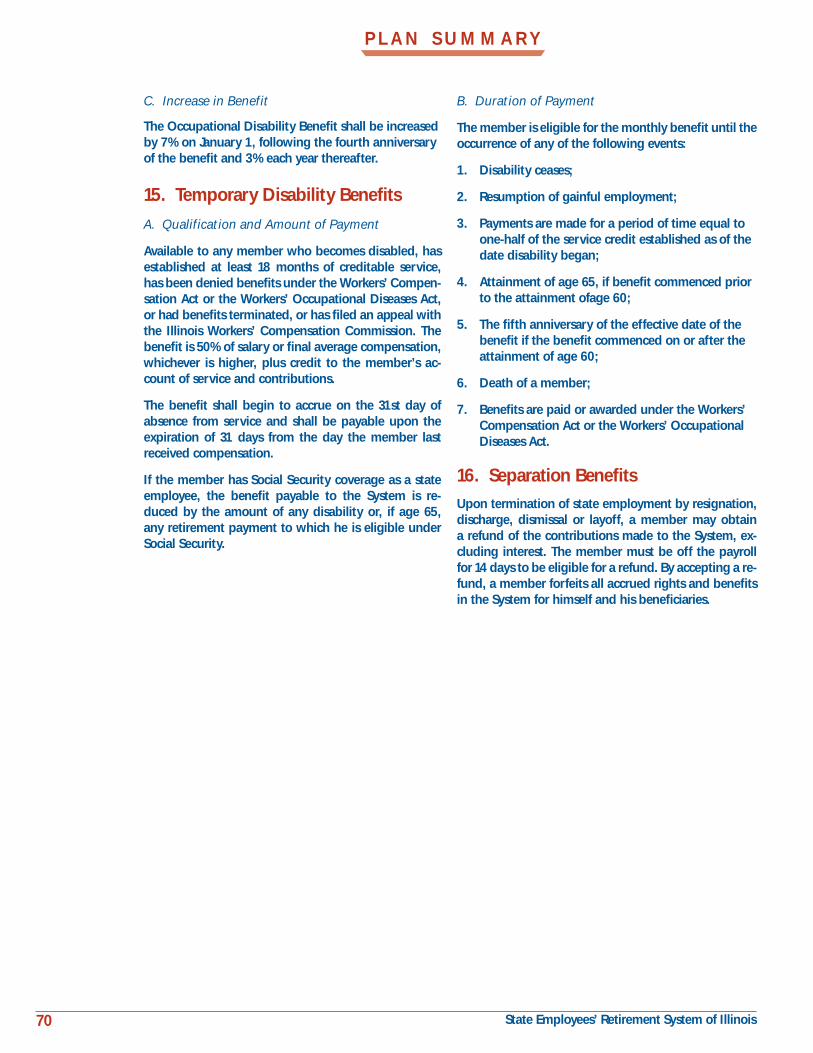
70 State Employees’ Retirement System of Illinois
C. Increase in Benefit
The Occupational Disability Benefit shall be increased by 7% on January 1, following the fourth anniversary of the benefit and 3% each year thereafter.
15. Temporary Disability Benefits
A. Qualification and Amount of Payment
Available to any member who becomes disabled, has established at least 18 months of creditable service, has been denied benefits under the Workers’ Compen-sation Act or the Workers’ Occupational Diseases Act, or had benefits terminated, or has filed an appeal with the Illinois Workers’ Compensation Commission. The benefit is 50% of salary or final average compensation, whichever is higher, plus credit to the member’s ac-count of service and contributions.
The benefit shall begin to accrue on the 31st day of absence from service and shall be payable upon the expiration of 31 days from the day the member last received compensation.
If the member has Social Security coverage as a state employee, the benefit payable to the System is re-duced by the amount of any disability or, if age 65, any retirement payment to which he is eligible under Social Security.
P L A N S U M M A R Y
B. Duration of Payment
The member is eligible for the monthly benefit until the occurrence of any of the following events:
1. Disability ceases;
2. Resumption of gainful employment;
3. Payments are made for a period of time equal to one-half of the service credit established as of the date disability began;
4. Attainment of age 65, if benefit commenced prior to the attainment ofage 60;
5. The fifth anniversary of the effective date of the benefit if the benefit commenced on or after the attainment of age 60;
6. Death of a member;
7. Benefits are paid or awarded under the Workers’ Compensation Act or the Workers’ Occupational Diseases Act.
16. Separation BenefitsUpon termination of state employment by resignation, discharge, dismissal or layoff, a member may obtain a refund of the contributions made to the System, ex-cluding interest. The member must be off the payroll for 14 days to be eligible for a refund. By accepting a re-fund, a member forfeits all accrued rights and benefits in the System for himself and his beneficiaries.
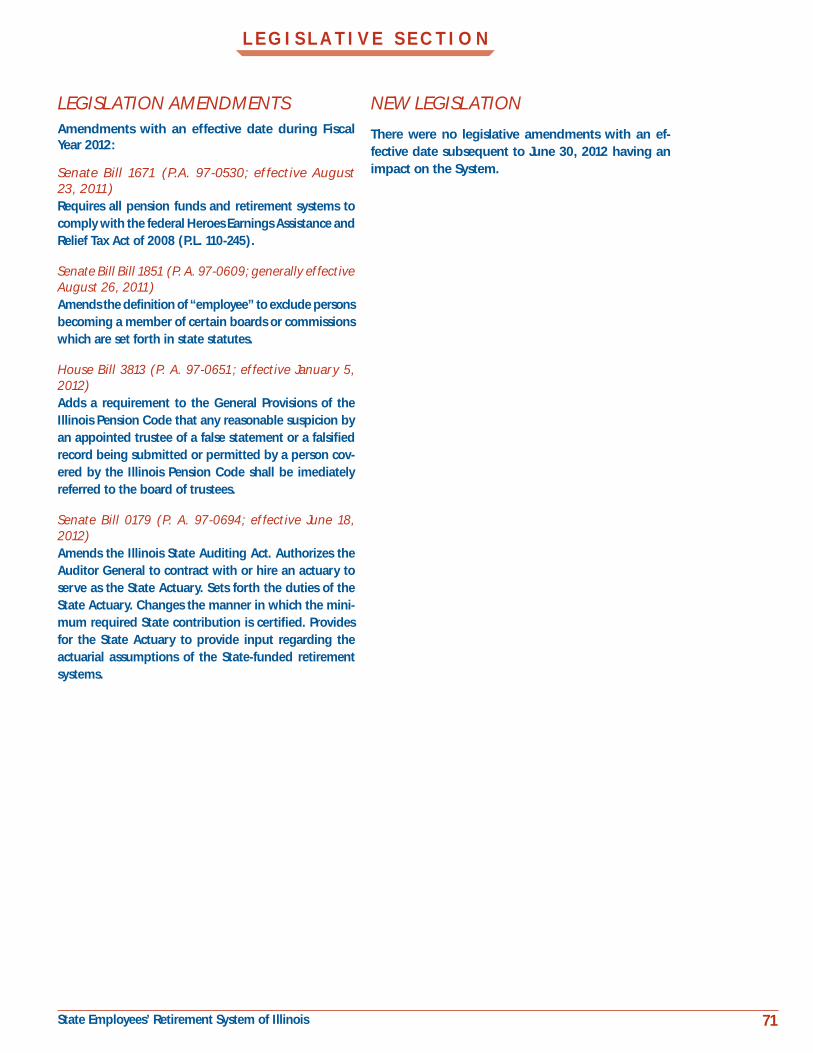
71 State Employees’ Retirement System of Illinois
LEGISLATION AMENDMENTSAmendments with an effective date during Fiscal Year 2012:
Senate Bill 1671 (P.A. 97-0530; effective August 23, 2011)Requires all pension funds and retirement systems to comply with the federal Heroes Earnings Assistance and Relief Tax Act of 2008 (P.L. 110-245).
Senate Bill Bill 1851 (P. A. 97-0609; generally effective August 26, 2011)Amends the definition of “employee” to exclude persons becoming a member of certain boards or commissions which are set forth in state statutes.
House Bill 3813 (P. A. 97-0651; effective January 5, 2012)Adds a requirement to the General Provisions of the Illinois Pension Code that any reasonable suspicion by an appointed trustee of a false statement or a falsified record being submitted or permitted by a person cov-ered by the Illinois Pension Code shall be imediately referred to the board of trustees.
Senate Bill 0179 (P. A. 97-0694; effective June 18, 2012)Amends the Illinois State Auditing Act. Authorizes the Auditor General to contract with or hire an actuary to serve as the State Actuary. Sets forth the duties of the State Actuary. Changes the manner in which the mini-mum required State contribution is certified. Provides for the State Actuary to provide input regarding the actuarial assumptions of the State-funded retirement systems.
L E G I S L A T I V E S E C T I O N
NEW LEGISLATION
There were no legislative amendments with an ef-fective date subsequent to June 30, 2012 having an impact on the System.