Embed Size (px)
Citation preview

HigherHigher
EducationEducation
FinanceFinance
StateState
FY 2013FY 2013
Sta
te H
igher E
ducatio
n f
inance F
Y 2
013

© 2014 State Higher Education Executive Officers
State Higher Education Executive Officers (SHEEO) is a nonprofit, nationwide association of the chief executive officers serving statewide coordinating, policy and governing boards for postsecondary education. The mission of SHEEO is to assist its members and the states in developing and sustaining excellent systems of higher education. SHEEO pursues its mission by organizing regular professional development meetings for its members and their senior staff; maintaining regular systems of communication among the professional staffs of member agencies; serving as a liaison between the states and the federal government; studying higher education policy issues and state activities and publishing reports to inform the field; and implementing projects to enhance the capacity of the states and SHEEO agencies to improve higher education.
An electronic version of this report, State Higher Education Finance FY 2013, and numerous supplementary tables containing extensive state-level data are available at www.sheeo.org. These may be freely used with appropriate attribution and citation. In addition, core data and derived variables used in the SHEF study for fiscal years 1993 through 2013 are available on the SHEEO website and also through the National Center for Higher Education Management Systems (NCHEMS)-sponsored Information Center for State Higher Education Policymaking and Analysis website at www.higheredinfo.org.
Higher
Education
Finance
FY 2013
State
A project of the staff of the State Higher Education Executive Officers (SHEEO)
SHEEO gratefully acknowledges the assistance of The College Board in financing the costs of publication.

State Higher Education Finance FY 2013
i
Acknowledgements We are pleased to present the eleventh annual SHEEO State Higher Education Finance (SHEF) study of state support for higher education. Over the years, a community of policy analysts has utilized federal surveys, collected supplemental data, and performed a wide range of analytical studies to inform state-level policy and decisions. While it is possible to aggregate federal data from the National Center for Education Statistics Integrated Postsecondary Education Data System up to the state level, the need for a simpler and more reliable source for state data became apparent several years ago. Thus, SHEEO developed the SHEF study, building directly on a twenty-five year effort by Kent Halstead, an analyst and scholar of state policy for higher education, who conceptualized and implemented a report on state finance for higher education and created a file of state financial data that extends from the early 1970s to the late 1990s. Halstead’s data were frequently used in the states as a resource to guide policy decisions. While he never described it as such, his survey became widely known as the “Halstead Finance Survey.” SHEF also draws on the surveys and analytical tools provided by the Grapevine survey, established in 1962 by M.M. Chambers and maintained by his successors, Edward Hines and, currently, James Palmer, at Illinois State University. In the summer of 2010, SHEEO and Illinois State University aligned the Grapevine and SHEF data collections into one. Since then, the combined State Support for Higher Education Database (SSDB) data collection has simplified and aligned data collection procedures, reduced the burden placed on state offices, and created a more timely and comprehensive picture of state fiscal support for higher education. We are grateful for the leadership of James Palmer in making this effort possible. SHEEO is deeply indebted to the staff of state higher education agencies who annually provide the state-level data essential for the preparation of this report. Their names and organizations are listed in Appendix C. We also appreciate the input and suggestions from many state higher education finance officers (SHEFOs) and others who have contrib uted much to the development of this report over the years. Once again, Andrew Carlson was the principal analyst for the State Higher Education Finance study this year, building on the foundation laid since 2003 by a talented group of other SHEEO staff. Katie Zaback, Gloria Auer, and Chris Ott made important contributions to this year’s study, and I am grateful for their dedicated professional work. Finally, we gratefully acknowledge the assistance of The College Board in financing the costs of publishing and distributing the FY 2013 report. George Pernsteiner President State Higher Education Executive Officers


State Higher Education Finance FY 2013
1
Table of Contents
Acknowledgements .......................................................................................................................... i
Table of Contents ............................................................................................................................ 1
List of Tables ................................................................................................................................... 2
List of Figures .................................................................................................................................. 3
Introduction .................................................................................................................................... 5
Overview and Highlights ................................................................................................................. 7
Measures, Methods, and Analytical Tools .................................................................................... 11
Revenue Sources and Uses ........................................................................................................... 14
National Trends in Enrollment and Revenue ................................................................................ 16
Interstate Comparisons—Making Sense of Many Variables ........................................................ 23
State Wealth, Taxes, and Allocations for Higher Education ......................................................... 37
Conclusion ..................................................................................................................................... 42
Technical Paper A .......................................................................................................................... 44
Technical Paper B .......................................................................................................................... 47
Technical Paper C .......................................................................................................................... 51
APPENDIX A—Grapevine Media Tables ........................................................................................ 54
APPENDIX B—Glossary of Terms .................................................................................................. 56
APPENDIX C—State Data Providers .............................................................................................. 60
APPENDIX D—SSDB Collection Instructions ................................................................................. 65

State Higher Education Finance FY 2013
2
List of Tables
Table 1: Major Sources and Uses of State and Local Government Support ................................. 15
Table 2: Higher Education Finance Indicators (Current Unadjusted Dollars in Millions) ............ 20
Table 3: Higher Education Finance Indicators (Constant Adjsuted 2013 Dollars in Millions) ...... 21
Table 4: Public Higher Education Full-Time Equivalent (FTE) Enrollment ................................... 25
Table 5: Educational Appropriations per FTE (Constant Adjusted 2013 Dollars) ......................... 27
Table 6: Public Higher Education Net Tuition Revenue per FTE (Constant Adjusted 2013 Dollars)........................................................................................................................................ 29
Table 7: Total Educational Revenue per FTE (Constant Adjusted 2013 Dollars) .......................... 31
Table 8: State Wealth, Tax Revenue, Effective Tax Rates, and Higher Education Allocation U.S. 2001-2011 (Current Unadjusted Dollars) ............................................................... 38
Table 9: Tax Revenues, Taxable Resources, and Effective Tax Rates by State Fiscal 2011 .......... 40
Table 10: Perspectives on State and Local Government Higher Education Funding Effort by State ..................................................................... 41
Technical Paper Table 1: CPI-U, HEPI, and HECA Indexed to Fiscal Year 2013 ............................. 46
Technical Paper Table 2: Enrollment Mix Index and Cost of Living Adjustments by State .......... 49
Technical Paper Table 3: Impact of Enrollment Mix Index and Cost of Living Adjustments by State ............................................................................. 50

State Higher Education Finance FY 2013
3
List of Figures Figure 1: State, Local, and Net Tuition Revenue Supporting General Operating Expenses of
Higher Education, U.S., Fiscal Year 2012, Current (Unadjusted) Dollars ......................... 8
Figure 2: State, Local, and Net Tuition Revenue Supporting General Operating Expenses of Higher Education, U.S., Fiscal Year 2013, Current (Unadjusted) Dollars ......................... 9
Figure 3: Public FTE Enrollment and Educational Appropriations per FTE U.S., Fiscal 1988-2013 .................................................................................................... 18
Figure 4: Net Tuition as a Percent of Public Higher Education Total Educational Revenue U.S., Fiscal 1988-2013 ............................................................................................................ 22
Figure 5: Full-Time Equivalent (FTE) Enrollment in Public Higher Education Percent Change by State, Fiscal 2008-2013 ................................................................... 24
Figure 6: Educational Appropriations per FTE, Percent Change by State, Fiscal 2008-2013 ....... 26
Figure 7: Net Tuition as a Percent of Public Higher Education Total Educational Revenue by State, Fiscal 2013 ........................................................................................................... 28
Figure 8: Total Educational Revenue per FTE, Percent Change by State, Fiscal 2008-2013 ....... 30
Figure 9: Educational Appropriations per FTE, State Differences from U.S. Average FY 2013….. 33
Figure 10: Total Educational Revenue per FTE, State Differences from U.S. Average FY 2013 ... 34
Figure 11: Percent Change by State in Educational Appropriations and Net Tuition Revenue per FTE, Fiscal 1998-2013 ............................................................ 35
Figure 12: Net Tuition Revenue per FTE and State-Funded Tuition Aid per FTE by State, Fiscal 2013 (Public Institutions Only) .............................................................. 36

State Higher Education Finance FY 2013
4

State Higher Education Finance FY 2013
5
Introduction Financing higher education requires political leaders, policymakers, and educators to address broad public policy questions, including:
• What levels of state funding to colleges and universities are necessary to maintain the economic and social well-being of its citizenry and to ensure the United States remains globally competitive?
How can states balance the need for higher education support with the needs of other major state programs given limited resources and budgetary pressures?
• What tuition levels are appropriate given the costs of higher education, its benefits to individuals, and the desirability of encouraging participation and improving degree and certificate attainment?
• What level of student financial assistance is necessary to provide meaningful educational opportunities to traditionally underserved students and students from low- and moderate-income families?
• How might colleges and universities use available resources to increase productivity without impairing the quality of services to students?
The State Higher Education Finance (SHEF) report is produced annually by the State Higher Education Executive Officers (SHEEO) to broaden understanding of the context and consequences of multiple decisions made every year in each of these areas. No single report can provide definitive answers to such broad and fundamental questions of public policy, but the SHEF report provides information to help inform such decisions. The report includes:
• An Overview and Highlights of national trends and the current status of state funding for higher education;
• An explanation of the Measures, Methods, and Analytical Tools used in the report;
• A description of the Revenue Sources and Uses for higher education, including state tax and nontax revenues, local tax support, tuition revenue, and the proportion of this funding available for general educational support;
• An analysis of National Trends in Enrollment and Revenue, in particular, changes over time in the public resources available for general operating support;
• Interstate Comparisons—Making Sense of Many Variables, using tables, charts, and graphs to compare data among states and over time; and
• Indicators of Relative State Wealth, Tax Effort, and Allocations for Higher Education, along with ways to take these factors into account when making interstate comparisons.
The SHEF report provides the earliest possible review of state and local support, tuition revenue, and enrollment trends for the most recent fiscal year. Please note: Generally, years referenced in the body of this publication refer to state fiscal years, which commonly start July 1 and run through June 30 of the following calendar year. For example, FY 2013 includes July 2012 through June 2013. All enrollments are full-time equivalent for an academic year (including summer term). National averages are calculated using the sum of all of the states. For example, the national average per FTE expenditure is calculated as the total of all states’ expenditures divided by the total of all states’ FTEs.

State Higher Education Finance FY 2013
6

State Higher Education Finance FY 2013
7
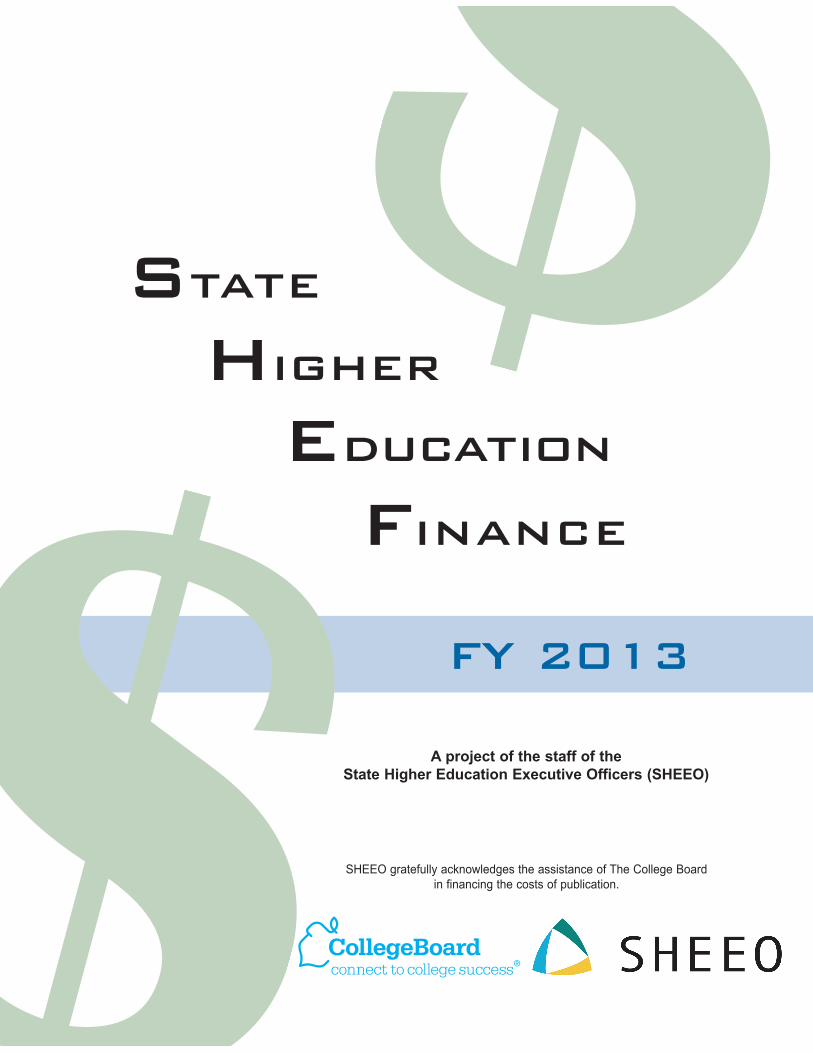
Overview and Highlights National Trends in State Funding for Higher Education A recession beginning in 2008 dramatically reduced state revenue and ended the growth in state and local support achieved between 2004 and 2008. In response, the American Recovery and Reinvestment Act (ARRA), provided funding to stabilize state support for education (among other interventions). With the approval of the Secretary of Education, funds allocated to the states by Congress could be used to supplement state and local funding for education in 2009, 2010, and 2011. In 2011, 31 states provided ARRA funding to their higher education systems totaling $2.8 billion, helping to offset reductions in state and local support since 2008. State and local support in 2011 including ARRA funds totaled $87.2 billion, actually showing a slight percent increase in funding for higher education over 2010 (although still below 2008 and 2009). The stability in support for higher education is an indicator that ARRA funding has served its purpose in minimizing the negative effects of the economic recession on higher education.1 By 2012, however, these ARRA funds had largely been spent and state and local support for higher education fell 7 percent to $81.1 billion. The decline in 2012 due to the expiration of ARRA funding (the “fiscal cliff”) was widely and accurately projected, based on a fear that the recovery of state economies and revenues from the 2008 recession would be sluggish. In 2013, state and local funding for higher education increased slightly to $81.6 billion, showing initial signs of a slow economic recovery. Appropriations in 2014 show an overall increase of 5.7 percent indicating continued growth and recovery. (Please see the Grapevine Report for details.) In addition to state and local revenues, public institutions collected net tuition revenue of $61.8 billion in 2013, for a total of about $143.4 billion available to support the general operating expenses of higher education (see Figures 1 and 2). Of the $81.6 billion in state and local support during 2013, 76.5 percent was allocated to the general operating expenses of public higher education. Special purpose or restricted state appropriations for research, agricultural extension, and medical education accounted for another 12.2 percent of the total. The percent of total support allocated for financial aid to students attending public institutions increased to 7.9 percent in 2013. This is up from 5.6 percent in 2007 and 2008 and shows the efforts states made to maintain critical aid programs during the downturn. The remaining 3.4 percent supported students attending independent institutions, independent institutions’ operating expenses, and non-credit and continuing education expenditures. Further analysis of the data indicates that constant (adjusted for the impact of inflation over time) dollar per-student state and local funding for public colleges and universities reversed the annual decline that began in 2009, increasing slightly in 2013 over 2012. State and local support (excluding appropriations for research, agricultural extension, and medical education) per full-time equivalent student was $6,105 in 2013, an $85 (or 1.4 percent) increase, in constant dollars, from 2012. In 2010, 2011, and 2012, the per-student state and local support were the lowest in the last 25 years. Although 2013 per-student state and local support increased, it still remains lower than any of the years prior to 2009. It should be noted, however, that most of the growth in state and local support was due to increases in local support. Further, there was considerable state variation, with increases seen in 30 states and decreases continuing in 20 states .
1 “State and local support” in SHEF is generally meant to include funds allocated to states by the federal government through the American
Recovery and Reinvestment Act of 2009 (ARRA) and funds from the Education Stabilization Fund and the Other Government Services Fund used to fill shortfalls in state support for general operating expenses at public colleges and universities.
State Higher Education Finance FY 2013
8
Higher education has historically experienced large increases in enrollment during times of economic recession, and this tendency has been accentuated by the growing economic importance of postsecondary education. In periods of economic growth or recovery, enrollments may decline or stabilize. Nationally, FTE enrollment grew 5.7 percent between 2009 and 2010, and 2.5 percent between 2010 and 2011, before declining by 0.5 percent in 2012 and 2.4 percent in 2013. Much of the 2013 decline was at two-year colleges. Highlights of the SHEF report provided below illustrate the long-term patterns, shorter-term changes, and state-level variables affecting the resources available to support higher education between 198 8 and 2013. These and other factors that shape higher education funding are examined in more detail in the sections of the full report that follow.
Figure 1
State, Local, and Net Tuition Revenue Supporting General Operating Expenses of Higher Education U.S., Fiscal Year 2012 (Current Unadjusted Dollars)
Source: State Higher Education Executive Officers

State Higher Education Finance FY 2013
9
Figure 2 State, Local, and Net Tuition Revenue Supporting General Operating Expenses of Higher Education
U.S., Fiscal Year 2013 (Current Unadjusted Dollars)
Long-term Revenue and Enrollment Patterns
1. From 1988 to 2013, FTE enrollment at public institutions of higher education increased from 7.3 million to 11.3
million. The all-time peak enrollment occurred in 2011, and then declined slightly in 2012 and 2013.
2. Educational appropriations per FTE (defined to include state and local support for general higher education operations) rose slightly to $6,105 in 2013, after four straight years of declines in inflation-adjusted terms. Annual educational appropriations from 1988 through 2013 are displayed in Figure 3.
3. Tuition charges are the other primary source of revenue used to support public higher education (excluding research grants and revenue from independent operations). Net tuition revenue typically grows faster when state and local revenues fail to keep pace with enrollment growth and inflation, because more students pay tuition and some institutions may charge more to compensate for declining public revenue per student. Net tuition revenue continued to grow more rapidly than state and local support in 2013 even as the recovery began.
Source: State Higher Education Executive Officers

State Higher Education Finance FY 2013
10
4. Partially offsetting decreased state and local support, constant (adjusted) dollar net tuition per FTE increased annually at 5.0 percent between 2009 and 2011 and then by 7.1 percent in 2012, and 4.7 percent 2013.
5. Constant dollar total educational revenue (as displayed in Figure 3) per FTE declined from the late 1980s to the early 1990s, from $11,264 in 1988 to $10,728 in 1993. Thereafter, total educational revenue per FTE grew steadily from 1994 to 2001, reaching $12,436. Total revenue per FTE then fell sharply (about 10 percent) from 2001 to 2004 (to $11,248), rebounding to $12,289 by 2008. From a peak in 2008, total revenue per student dropped to $11,248 in 2012. In 2013, total educational revenue grew to $11,580 due to increases in state and local support and tuition coupled with enrollment declines. According to the U.S. Census Bureau, state and local revenue per K-12 pupil was $10,884 in 2011.
6. The student share of total educational revenue to support public higher education operations has grown steadily since the early 1980s (see Figure 4) and by FY 2013, net tuition made up 47.5 percent of total educational revenue.
Changes Over the Past Five Years in the States Total public higher education enrollment has increased substantially in recent years. Following dramatic increases nationally from 2002 through 2005, FTE enrollment at public institutions of higher education slowed somewhat, only to increase sharply again between 2007 and 2011, tapering off slightly in 2012 and declining in 2013. These enrollment trends significantly affected the per-student revenue available to support higher education. Across states, both enrollment and appropriations growth varied widely from the national average.
7. Nationally, FTE enrollment grew 10.0 percent over the past five years. Forty-eight states have experienced increases in FTE enrollment since 2008, and total public FTE enrollment increased by 31.1 percent from 2000 to 2013.
8. Per-FTE constant dollar educational appropriations increased in three states between 2008 and 2013. Across all 50 states, the change in educational appropriations per FTE varied from -50.7 to +17.6 percent.
9. Even after adding revenue from tuition increases, constant dollar educational revenue per FTE (excluding net tuition revenue used for capital or debt service) decreased 5.9 percent on average between 2008 and 2013, with 36 of the states experiencing declines in this measure.
Wealth, Taxes, and Allocations for Higher Education
Each state’s unique combination of policy choices and fiscal and environmental conditions provides the context within which higher education funding occurs. The national trends outlined below give a sense of general conditions, but individual state contexts vary widely. The available data are from 2001 to 2011, lagging two years behind appropriations data reported elsewhere in this report. The effects of the recession beginning in 2008 on state and local revenues are evident in these data.
11. Total taxable resources per capita, a statistic that captures state income and wealth, peaked at $53,612 in 2007, then decreased in 2008 and 2009 when it was $50,051. After increasing slightly in 2010 to $50,974, total taxable resources grew rapidly to $53,017 in 2011 approaching pre-recession levels.
12. Over the ten-year period from 2001 to 2011, total taxable resources per capita increased 33.5 percent, while the effective tax rate grew by 0.5 percent.
13. The proportion of state and local tax revenues allocated to higher education declined over the decade from 7.3 percent in 2001 to 6.5 percent in 2011.
State Higher Education Finance FY 2013
11
Measures, Methods, and Analytical Tools Primary SHEF Measures
To assemble the annual SHEF report, SHEEO collects data on all state and local revenues used to support higher education, including revenue from taxes, lottery receipts, royalty revenue, and state-funded endowments. It also identifies the major purposes for which these public revenues are provided, including general institutional operating expenses, student financial assistance, and support for centrally-funded research, medical education, and extension programs. Analysis of these data yields the following key indicators:
• State and Local Support—consists of state tax appropriations and local tax support plus additional nontax funds (e.g., lottery revenue) that support or benefit higher education, and funds appropriated to other state entities for specific higher education expenditures or benefits (e.g., employee fringe benefits disbursed by the state treasurer). State and local support for 2009–2012 (federal fiscal years 2009–2011) also includes federal ARRA revenue provided to stabilize this source of revenue for higher education.
• Educational Appropriations—that part of state and local support available for public higher education operating expenses, defined to exclude spending for research, agricultural, and medical education, as well as support for independent institutions or students attending them. Since funding for medical education and other major non-instructional purposes varies substantially across states, excluding these funding components helps to improve the comparability of state-level data on a per-student basis.
• Net Tuition Revenue—the gross amount of tuition and fees, less state and institutional financial aid, tuition waivers or discounts, and medical student tuition and fees. This is a measure of the resources available from tuition and fees to support instruction and related operations at public higher education institutions. Net tuition revenue generally reflects the share of instructional support received from students and their families, although it is not the same as, and does not take into account many factors that need to be considered in analyzing, the “net price” students pay for higher education.2
• Total Educational Revenue—the sum of educational appropriations and net tuition revenue excluding any tuition revenue used for capital and debt service. It measures the amount of revenue available to public institutions to support instruction (excluding medical students). Very few public institutions have significant non-restricted revenue from gifts and endowments to support instruction. In some states, a portion of the net tuition revenue is used to fund capital debt service and similar non-operational activities. These sums are excluded from calculations used to determine total educational revenue.
• Full-Time Equivalent Enrollment (FTE)—a measure of enrollment equal to one student enrolled full time for one academic year, calculated from the aggregate number of enrolled credit hours (including summer session enrollments). SHEF excludes most non-credit or non-degree program enrollments; medical school enrollments also are excluded for the reasons mentioned above. The use of FTE enrollment reduces multiple types of enrollment to a single measure in order to compare changes in total enrollment across states and sectors, and to provide a straightforward method for analyzing revenue on a per-student basis.
2 SHEF does not provide a measure of “net price,” a term that generally refers to the cost of attending college after deducting assistance provided by federal, state, and institutional grants. SHEF does not deduct federal grant assistance (primarily from Pell Grants) from gross tuition revenue, since these are non-state funds that substitute, at least in part, for non-tuition costs borne by students. Non-tuition costs (room and board, transportation, books, and incidentals) typically total $10,000 or more annually in addition to tuition costs. This requires students with a low expected family contribution (most Pell recipients) to augment federal grants with a substantial contribution from part-time work or loans, even at a comparatively low-tuition public institution. In addition, the availability of federal tuition tax credits since 1999 has helped reduce “net price” for middle- and lower-middle-income students. While these tax credits have no impact on the net tuition revenue received by institutions, they do reduce the “net price” paid by students. SHEF’s net tuition revenue statistic is not a measure of “net price,” but a measure of the revenue that institutions received from tuition. It is a straightforward measure of the proportion of public institution instructional costs borne by students and families. Measures of net price for the student need to include non-tuition costs and all forms of aid.

State Higher Education Finance FY 2013
12
Adjustments for Comparability SHEF’s analytic methods are designed to make basic data about higher education finance as comparable as possible across states and over time. Toward that end, financial indicators are provided on a per-student basis (using FTE enrollment as the denominator), and the State Higher Education Finance (SHEF) report employs three adjustments to the “raw data” provided by states:
• Cost of Living Adjustment (COLA) to account for cost of living differences among the states;
• Enrollment Mix Index (EMI) to adjust for differences in the mix of enrollment and costs among types of institutions with different costs across the states; and
• Higher Education Cost Adjustment (HECA) to adjust for inflation over time. Technical Papers A and B appended to this report describe these adjustments in some detail. Tables provided in these technical papers show the actual effects of the COLA and EMI adjustments on the data provided by individual states, as well as the HECA adjustment from current to constant dollars (inflation-adjusted dollar values that are made annually to reflect inflation). Additional appendices provide a glossary of terms and definitions, a copy of the data collection instructions, and a list of state data providers.
Financial Data in Perspective: Uses and Cautions Higher education financial analysis is essential, but using financial data can be tricky and even deceptive. This section is intended to help readers and users focus on some of the core purposes of interstate financial analysis, while being cognizant of limitations inherent in the data and methods. Comparing institutions and states is a difficult task. Consider how different the states are, even after adjusting for population size. They vary in climate, energy costs, housing costs, population densities, growth rates, resource bases, and the mix of industries and enterprises driving their local economies. Some have a relatively homogeneous, well-educated population, while others have large numbers of traditionally underserved populations and recent immigrants. Most states have pockets of poverty, but these vary in their extent and concentration. Finally, the extent and rate to which these socio-economic and demographic factors are changing also varies across states. State higher education systems also differ. Some have many small institutions, others fewer but larger institutions. Some have many independent (privately controlled) institutions; others rely almost entirely on public institutions, with varying combinations of research universities, community colleges, and four-year universities. Across states, tuition policies and rates vary, as do the amounts and types of financial aid, which in turn affect enrollment patterns. Some states have multiple institutions that offer high-cost programs (e.g., in the sciences or engineering), while others provide substantially more funding for research or emphasize undergraduate education. In addition to these differences, technical factors can make interstate comparisons misleading. As one example, states differ in how they finance employee benefits, including retirement. Some pay all retirement costs to employee accounts when the benefits are earned, while others defer part of the costs until the benefits are paid. Some pay benefit costs through a state agency, while others pay from institutional budgets. Many studies of state finance try to account for such factors, but no study, including this one, can assure flawless comparisons. The SHEF report seeks to provide—to the extent possible—comparable data and reliable methods for examining many of the most fundamental financial issues facing higher education, particularly at the state level. Its purpose is to help educators and policymakers:
• Examine whether or not state funding for colleges and universities has kept pace with enrollment growth and inflationary cost increases;

State Higher Education Finance FY 2013
13
• Focus on the major purposes for state spending on higher education and how these investments are allocated;
• Assess trends in the proportion or “share” that students and families are paying for higher education;
• See how funding of their state’s higher education system compares to that in other states; and
• Assess the capacity of a state’s economy and tax policies to generate revenue to support public priorities such as higher education.
While making finance data cleaner, consistent, and more comparable, SHEF’s analytic methods also add complexity. All comparisons can claim only to be "valid, more or less," and SHEF is no exception. Analysts with knowledge of particular states probably know of other factors that should be taken into account or that could mislead comparative analysis. SHEEO continues to welcome all efforts to improve the quality of its data and analytical tools. We urge readers and users to help us improve both methods and understanding. Many educators and policymakers (and segments of the public) may look to interstate financial analysis to determine "appropriate" or "sufficient" funding for higher education. But sufficiency is meaningful only in the context of a particular state’s objectives and circumstances. State leaders, educators, and others must work together to set goals and develop strategies to achieve those goals, and then determine the amount and allocation of funds required for success. Whether the objective is to sustain competitive advantage or to improve the postsecondary education system, money is always an issue. With additional resources, educators can serve more students at higher levels of quality. But additional spending does not necessarily yield proportional increases in quantity or quality.3 Efficiency is a thorny issue in education finance; educators always can find good uses for additional resources, and resources always are limited. If educators and policymakers can agree that it is highly desirable to achieve widespread educational attainment more cost-effectively, they can work together to increase educational productivity. Authentic productivity gains require sustained effort, a combination of investing in priorities, and finding efficiencies through incentives, reallocation, and innovation. And such an effort cannot focus solely on the numbers of degrees but must consider also measures (direct and indirect) of student learning and achievement. The question, "How much funding is enough?" has no easy answer at the state or national level. Educators and policymakers must work together to address such key questions as:
• What kind of higher education system do we want?
• What will it take, given our circumstances, to establish and sustain such a system?
• Are we making effective use of our current investments?
• Where would an incremental or reallocated dollar lead to improved outcomes and help to meet state and national goals?
Good financial data and analysis are essential for addressing such questions.
3 Kelly, P. and Jones, D. (2005). A New Look at the Institutional Component of Higher Education Finance: A Guide for Evaluating Performance Relative to Financial Resources. Boulder, CO: NCHEMS.

State Higher Education Finance FY 2013
14
Revenue Sources and Uses
Support for higher education involves a substantial financial commitment by state and local governments. Twenty-five years ago, in 1988, state and local governments invested $35.3 billion ($74.8 billion in constant 2013 dollars) in direct support for the operations of public and independent higher education institutions. By 2013, state and local support for higher education was $81.6 billion. As shown in Table 1, 2013 unadjusted state and local support was slightly higher than in 2012 but 8 percent lower than the 2008 pre-recession high point. 2013 state and local support is 0.7 percent higher than the 2012 total, indicating the recovery from the Great Recession is beginning to positively impact state and local appropriations for higher education.
This section provides data and analysis of these sources of state and local government support for higher education, focusing on the most recent five-year trend (2008-2013). It also provides an overview of the major uses of that support, including state support for (1) research, agricultural extension, and medical education; (2) student financial aid; and (3) independent (private, not-for-profit) institutions.4
As shown in Table 1, sources for the $81.6 billion state and local government support for higher education in 2013 included the following:
• State sources accounted for more than 88.9 percent, with 84.2 percent coming from appropriations from state tax revenue.
• Nontax appropriations, mostly from state lotteries, were a small but rapidly growing portion of state funds, increasing from $2.2 billion in 2008 to $2.9 billion in 2011, 2012, and 2013.
• Local appropriations accounted for 11.3 percent, up from 10.9 percent in 2012 with some degree of local tax support for higher education in 31 states. Local appropriations grew steadily from $8.1 billion in 2008 to $9.2 billion in 2013, as support from states declined.
• State-funded endowment earnings accounted for another 0.6 percent.
• Oil and mineral extraction fees or other lease income (generally not appropriated) accounted for 0.1 percent.
• States were no longer eligible to use federal funds from the American Recovery and Reinvestment Act in 2013. All told, states used $9.7 billion of these funds between 2009 and 2012, significantly lessening the impact of the Great Recession on higher education budgets. In 2010, the high point of the downturn, 5.2 percent of the total governmental funds were from this source.
Major uses of the $81.6 billion in 2013 state and local government funding for higher education included:
• $62.5 billion (76.5 percent) for general operating expenses of public higher education institutions
• $9.9 billion (12.2 percent) for special-purpose appropriations—research, agricultural extension, and medical education
• State-funded student financial aid programs, including state-funded programs for students attending independent as well as public institutions, accounted for about 10.7 percent of the funds used. States spent 7.9 percent of state and local government funding on student financial aid programs at public institutions, up from 5.6 percent in 2008. Since 2008, when states allocated $5.0 billion for state financial aid for students attending public institutions, funding for this purpose has annually increased, reaching $6.4 billion in 2013, although 15 states made cuts to their aid programs over this period. Despite the challenges of the economic downturn, states remained invested in maintaining support for
4 Supplemental SHEF tables, which are available at www.sheeo.org, provide more-detailed data and tables on state-by-state sources and uses
of higher education funding for 2013. As noted in the examples below, revenue sources vary considerably across states and from the national averages.

State Higher Education Finance FY 2013
15
these aid programs; although the enrollment growth that occurred throughout the downturn likely led to decreased purchasing power of these funds (because more students were eligible for aid).
Table 1 Major Sources and Uses of State and Local Government Support
Fiscal 2008-2013 (Current Dollars in Millions)
Percentages may not equal 100 due to rounding. Notes: 1) "Other" includes multi-year appropriations from previous years and funds not classified in one of the other source categories. 2) "Funds Not Available for Use" includes appropriations that were returned to the state, and portions of multi-year appropriations to be spread over other years. 3) "Public Student Aid" is state appropriated student financial aid for public institution tuition and fees. Includes aid appropriated outside the recognized state student aid program(s). Some respondents could not separate tuition aid from aid for living expenses. 4) "Independent Student Aid" is state appropriated student financial aid for students attending independent institutions in the state. Source: State Higher Education Executive Officers

State Higher Education Finance FY 2013
16
National Trends in Enrollment and Revenue This section highlights national trends in higher education enrollment and the relationship between these trends and available revenue (and other components of financing). These “national” trends are actually composites of 50 unique and varied state trends. The following section and supplemental SHEF tables (on the website www.sheeo.org) provide detailed information on the varied patterns over time and across states. The historical data in Figure 3 demonstrate the relationships between higher education enrollment and revenue over time, especially the impact of the economic cycle on these measures. Figure 3 also illustrates the longer-term trends. In the 2010 SHEF report, state and locally financed educational appropriations for public higher education hit the lowest level ($6,875 per FTE in constant 2013 dollars) in a quarter century, driven by accelerating enrollment growth, modest inflation, and the failure of state and local funding to keep pace with either during the previous two years. This downward trend continued in 2011 and 2012 with state and locally financed educational appropriations falling to $6,611 and $6,020 per FTE, respectively. Reversing the annual decline that began in 2009, 2013 educational appropriations per FTE rose to $6,105 in 2013, a constant dollar increase of $85 (1.4 percent) over 2012. Figure 3 illustrates the following:
Full-Time Equivalent Enrollment (FTE)
• Nationally, the explosive enrollment growth at public institutions from 2008 through 2011 that tapered off in 2012 continued downward in 2013, falling 0.5 percent and 2.4 percent, respectively. Despite these declines, 2013 enrollment is 13.1 percent higher over 2007. Since the beginning of the 21st century, enrollments have grown by 31.1 percent.
• Enrollment grew rapidly from 2000 to 2005, and then more modestly in 2006 and 2007 (see the “public FTE enrollment” trend line in Figure 3). Growth accelerated again in 2009 (4.6 percent) and 2010 (5.7 percent). 2011 shows more modest growth of 2.5 percent over 2010.
• The rate of enrollment growth normally varies from year to year and state to state in response to the economy and job market as well as underlying demographic factors. Budget conditions in 2012 and 2013, however, likely had an especially adverse effect on higher education enrollments. Budget driven enrollment caps, increased tuition and fees, and the beginnings of economic recovery likely drove enrollments down in 2012 and 2013.
Educational Appropriations
• Constant dollar educational appropriations per FTE (see the blue bars in Figure 3) reached a high of $8,790 in 2001.
• Following four years of decline (2002, 2003, 2004, and 2005), per-student educational appropriations increased in 2006, 2007, and 2008, recovering to $7,924 and then declining each of the following four years to $6,020 in 2012.
• 2013 saw a small increase in appropriations per FTE to $6,105. In constant dollars, 2009 through 2013 have the lowest per FTE appropriations over the last 25 years.

State Higher Education Finance FY 2013
17
Net Tuition Revenue
• The rate of increase in net tuition was slower in 2013 than in the previous three years, but in 2013, net tuition as a percentage of total educational revenue per student continued to climb, increasing to 47.5 percent.
• The rate of growth in net tuition revenue has been particularly steep during periods when state and local support have fallen short of inflation and enrollment growth, typically during and immediately following economic recessions.
The substantial shift of responsibility for financing public higher education toward net tuition (from around 30 percent to nearly 50 percent) in a dozen years is a significant change for American higher education.

State Higher Education Finance FY 2013
18
Figu
re 3
Pu
blic
FTE
En
rollm
ent
and
Ed
uca
tio
nal
Ap
pro
pri
atio
ns
per
FTE
, U.S
., Fi
scal
198
8-20
13
No
te: N
et t
uit
ion
rev
enu
e u
sed
fo
r ca
pit
al d
ebt
serv
ice
incl
ud
ed in
th
e a
bo
ve f
igu
res.
Co
nst
an
t 2
01
3 d
olla
rs a
dju
sted
by
SHEE
O H
igh
er E
du
cati
on
Co
st A
dju
stm
ent
(HEC
A).
Sou
rce:
Sta
te H
igh
er E
du
cati
on
Exe
cuti
ve O
ffic
ers
State Higher Education Finance FY 2013
19
Net Tuition Revenue at Public Institutions–Further Discussion Among the many policy-relevant financial issues facing policymakers, the increased reliance on tuition revenue to support higher education stands out. The SHEF data collection instrument requests that states calculate and report annual estimates for gross tuition and fee revenue based on tuition rates and credit-hour enrollment. Across all states, these gross tuition and fee assessments in public postsecondary institutions totaled $81.1 billion in 2013. After subtracting state-funded public financial aid, institutional discounts and waivers, and tuition and fees paid by medical school students, the net tuition revenue available to support “general operating costs” was $61.8 billion, 76.2 percent of gross assessments. The resulting total net tuition revenue for selected years between 1988 and 2013 is reported in Table 2 in current dollars and in Table 3 in constant dollar values.5 Some states report that a portion of the public institution tuition and fees is used for capital debt service or retirement. Tables 2 and 3 show this amount. Tuition and fees used for debt service are included in net tuition, but they are not included in the calculation of total educational revenue. This procedure reflects the fact that these debt service costs are borne by students, but are not available to support general operating and educational costs. As shown in Figures 3 and 4, net tuition revenue has grown most rapidly as a percentage of total educational revenue in public institutions during periods when constant dollar state support per student has declined, that is, during economic downturns. This correlation illustrates the relationship between state support and tuition. This relationship is further supported by SHEEO’s survey on State Tuition, Fees, and Financial Assistance Policies6 where we found that the level of state support was the primary driver of how tuition rates are set each year. Further, most governing boards set tuition in the spring once state support has been set through the budget process. However, if tuition only increased to offset reductions in state support, we would expect to see decreases in tuition when state funding cuts are restored. The full relationship between the two funding sources is more complicated. The SHEF data presented in Figures 3 and 4 show the sharpest increases in reliance on tuition revenues during economic downturns and after each downturn that level of reliance remains relatively steady. Nationally, net tuition accounted for just about 23.8 percent of educational revenue in 1988, which followed the recession of 1981-82. Net tuition revenue remained near that level through the rest of the decade. Following the recession of 1990-91, the net tuition share of educational revenue grew rapidly to 31 percent, where it stayed through the 1990s. In the three years following the recession in 2001, during which enrollment grew rapidly and aggregate state funding remained relatively constant, the net tuition share of total educational revenue rose to 35 percent. Following the recession of 2008, net tuition has climbed to its current level of 47.5 percent. These figures are nationwide averages. Many states saw much more dramatic increases in each of these periods. In nearly half the states (23), more support for colleges and universities comes from student tuition fees than from state and local appropriations. The combination of state government support, local tax appropriations, and tuition revenue constitutes the principal source of support for instructional programs at public institutions. Estimates made on the basis of institutional data reported to the National Center for Education Statistics indicate that the proportion of public institution revenue derived from tuition varies substantially. At public, two-year institutions, on the average, just over 75 percent of educational operating revenue is derived from state or local sources, with the remaining 25 percent coming from tuition revenue. At public four-year institutions, on the average, well over 40 percent of educational operating revenue is derived from tuition with the remainder from state and other sources. State funding remains central to supporting educational services even at public research universities where its importance tends to become obscured within the complex budgets of these large institutions. (Multiple other sources of revenue received and used by research universities are associated with sponsored research and contracts, auxiliary enterprises, and hospitals and other medical activities. These activities may complement and enhance instruction, but
5 Detailed state-level information can be found in the supplemental SHEF tables (www.sheeo.org). 6 State Tuition, Fees, and Financial Assistance Policies for Public Colleges and Universities 2012-2013. Carlson, A.,(2013) SHEEO can be found at www.sheeo.org

State Higher Education Finance FY 2013
20
they are typically expected to be mostly, or entirely, financially self-supporting.) The combination of state support and tuition remains the dominant revenue source for instructional programs, and in 27 states public support still exceeds that provided through student charges. In seven states, however, net tuition revenue is more than twice the amount of public support. Rapid increases in public tuition rates have naturally and appropriately attracted substantial attention and concern. While some assume the rapid “price increases” reflect excessive spending, per-student spending in public institutions has been flat or declining since 2000. Recent tuition increases are driven primarily by the failure of public support to keep pace with enrollment growth and inflation. Others suggest that states are abandoning their historical commitment to public higher education. National data and more careful attention to variable state conditions strongly suggest that such a sweeping conclusion is not justified generally. It also is not consistent with the stated intentions of most state policymakers. But the steady increase in tuition rates and the growing reliance on this source of revenue have the strong potential of reducing opportunity and decreasing the educational attainment of the American people. The overriding objective for public investment in education is to achieve authentic, high quality educational attainment at scale, which in turn will yield greater economic security and better, more satisfying lives for the American people. Adequate revenue for a world-class educational system, and prices and financial assistance that encourage and enable widespread completion are essential.
Table 2 Higher Education Finance Indicators (Current Unadjusted Dollars in Millions)
Notes: 1) FTE enrollment excludes medical school enrollments. 2) Data for aid to independent institutions and students attending private institutions not reported in 1988. Source: State Higher Education Executive Officers

State Higher Education Finance FY 2013
21
Tab
le 3
H
igh
er E
du
cati
on
Fin
ance
Ind
icat
ors
(Co
nst
ant
Ad
just
ed 2
013
Do
llars
in M
illio
ns)
No
tes:
1
) FT
E en
rollm
ent
excl
ud
es m
edic
al s
cho
ol e
nro
llmen
ts.
2)
Da
ta f
or
aid
to
ind
epen
den
t in
stit
uti
on
s a
nd
stu
den
ts a
tten
din
g p
riva
te in
stit
uti
on
s n
ot
rep
ort
ed in
19
88
.So
urc
e: S
tate
Hig
her
Ed
uca
tio
n E
xecu
tive
Off
icer
s So
urc
e: S
tate
Hig
her
Ed
uca
tio
n E
xecu
tive
Off
icer
s

State Higher Education Finance FY 2013
22
Fi
gure
4
Net
Tu
itio
n a
s a
Perc
ent
of P
ub
lic H
igh
er E
du
cati
on
To
tal E
du
cati
on
al R
even
ue,
U.S
., Fi
scal
198
8-20
13
Note: Net tuition revenue used for capital debt service is included in net tuition revenue, but excluded from total educational revenue in calculating the above figures. Source: State Higher Education Executive Officers
No
te:
Net
tu
itio
n r
even
ue
use
d f
or
cap
ita
l deb
t se
rvic
e is
incl
ud
ed in
net
tu
itio
n r
even
ue,
bu
t ex
clu
ded
fro
m t
ota
l ed
uca
tio
na
l rev
enu
e in
ca
lcu
lati
ng
th
e a
bo
ve f
igu
res.
Sou
rce:
Sta
te H
igh
er E
du
cati
on
Exe
cuti
ve O
ffic
ers

State Higher Education Finance FY 2013
23
Interstate Comparisons— Making Sense of Many Variables
National averages and trends often mask substantial variation and important differences across the 50 states. This section provides ways to examine interstate differences more closely. First, it explains in greater detail the adjustments SHEF makes to state-level data. Next, it illustrates differences across single variables or dimensions of higher education financing; for example, rates of enrollment growth or the varying proportions of public versus tuition financing. Third, it compares or “locates” states in relation to one another across two variables or dimensions of higher education finance.
SHEF Adjustments to Facilitate Interstate Comparisons Many factors affect the decisions and relative positions of states in their funding of higher education. Although no comparative analysis can take all of these into account, SHEF makes two adjustments to reflect the most basic differences—differences in the cost of living across states and in the public postsecondary enrollment mix among different types of institutions. Technical Paper Table 1 (in Technical Paper B) shows the impact of SHEF cost of living and enrollment mix adjustments on total educational revenue per FTE. These adjustments tend to draw states toward the national average; for example, states with a high cost of living also often tend to support higher education at above average levels, in which cases, the SHEF adjustments for living costs reduce the extent of their above average higher education revenues per student. The size and direction of these adjustments vary across states. In brief:
• In states where the cost of living exceeds the national average, dollars per FTE are adjusted downward (e.g., Massachusetts). In states where the cost of living is below the national average, dollars per FTE are adjusted upward (e.g., Arkansas).
• If the proportion of enrollment in higher-cost institutions (e.g., research institutions) exceeds the national average, the dollars per FTE are adjusted downward. In states with a relatively inexpensive enrollment mix (e.g., more community colleges), the dollars per FTE are adjusted upward7.
• Dollars per FTE are adjusted upward the most in states with an inexpensive enrollment mix and low cost of living (e.g., Mississippi). The reverse is true for states that possess both a more expensive enrollment mix and a higher cost of living (e.g., Colorado). In some states, the two factors cancel out each other (e.g., Washington).
Comparing States across Single Dimensions or Variables This section illustrates the variability across states and over time with respect to higher education enrollment growth, total state and local appropriations, the proportion of tuition-derived revenue, total revenue available for public educational programs, and current funding in the context of each state’s average national position over the past 25 years.
7 SHEEO’s Enrollment Mix Index adjusts state metrics based on the distribution of enrollment across institution type in a state. The adjustment
does not account for distribution of students across educational level or the discipline mix offered across a state’s institutions.

State Higher Education Finance FY 2013
24
Figure 5 (and the accompanying data in Table 4) shows changes in full-time equivalent enrollment (FTE) in public higher education by state for the five years between 2008 and 2013.
• Forty-eight of the fifty states have seen enrollment growth over the last five years, ranging from 4.1 percent in Nevada to 31.5 percent in Idaho. Two states, Illinois and California, saw declines over this time period of 4.1 and 1.9 percent, respectively.
• The 29 states in which enrollment growth exceeded the national average of 10.0 percent include both large and small states, high and low population growth states, and several states where enrollment increased much faster than overall population.
• Thirteen states saw enrollment growth of more than 15 percent, while three states exceeded 20 percent.
• Between 2012 and 2013, enrollment declined 2.4 percent nationally and most states saw declines in enrollment.
Figure 5 Full-Time Equivalent (FTE) Enrollment in Public Higher Education
Percent Change by State, Fiscal 2008-2013
Source: State Higher Education Executive Officers

State Higher Education Finance FY 2013
25
Table 4 Public Higher Education Full-Time Equivalent (FTE) Enrollment
Notes: 1) Full-time equivalent enrollment equates student credit hours to full-time, academic year students, but excludes medical students. Source: State Higher Education Executive Officers

State Higher Education Finance FY 2013
26
Figure 6 (and the accompanying data in Table 5) shows the percent change by state in higher education appropriations per public FTE student between 2008 and 2013. The national average per FTE funding for 2013 increased 1.4 percent over 2012 to $6,105 (see Table 5). However, educational appropriations per FTE remain 23.0 percent lower than 2008 (the recent high point for funding prior to the Great Recession).
• Three states — Wyoming, North Dakota, and Illinois — increased constant dollar per-student support for public institutions during this five-year period. In Illinois, the increases are primarily to cover historical underfunding of pension programs.
• Forty-seven states decreased constant dollar per-student funding during this five-year period, 32 by more than 20 percent.
• Federal funds available through the American Recovery and Reinvestment Act were used to fill shortfalls in state support for general operating expenses at public colleges and universities in 2009, 2010, and 2011. These funds were largely spent by 2012 and were no longer available in 2013.
Figure 6 Educational Appropriations per FTE
Percent Change by State, Fiscal 2008-2013
Note: Dollars adjusted by 2013 HECA, Cost of Living Adjustment, and Enrollment Index. Source: State Higher Education Executive Officers

State Higher Education Finance FY 2013
27
Table 5 Educational Appropriations per FTE (Constant Adjusted 2013 Dollars)
Notes: 1) Educational appropriations are a measure of state and local support available for public higher education operating expenses including ARRA funds, and exclude appropriations for independent institutions, financial aid for students attending independent institutions, research, hospitals, and medical education. 2) Adjustment factors, to arrive at constant dollar figures, include Cost of Living Adjustment (COLA), Enrollment Mix Index (EMI), and Higher Education Cost Adjustment (HECA).The Cost of Living Adjustment (COLA) is not a measure of inflation over time. Source: State Higher Education Executive Officers

State Higher Education Finance FY 2013
28
Figure 7 shows net tuition revenue as a percent of total educational revenue for public higher education by state for 2013. The accompanying Table 6 shows the dollar values of net tuition per FTE by state.
• States vary widely in the percent of educational revenue supported by net tuition, from a low of 13.0
percent in Wyoming to a high of 85.3 percent in Vermont.
• Twenty-eight states are above the national average of 47.5 percent in the proportion of educational revenue from tuition sources, while 15 states are above 60.0 percent.
Figure 7 Net Tuition as a Percent of Public Higher Education
Total Educational Revenue by State, Fiscal 2013
Note: Dollars adjusted by 2013 HECA, Cost of Living Adjustment, and Enrollment Index. Source: State Higher Education Executive Officers

State Higher Education Finance FY 2013
29
Table 6 Public Higher Education Net Tuition Revenue per FTE (Constant Adjusted 2013 Dollars)
Notes: 1) Net Tuition Revenue is calculated by taking the gross amount of tuition and fees, less state and institutional financial aid, tuition waivers or discounts, and medical student tuition and fees. Net tuition revenue used for capital debt service is included in the net tuition revenue figures above. 2) Adjustment factors, to arrive at constant dollar figures, include Cost of Living Adjustment (COLA), Enrollment Mix Index (EMI), and Higher Education Cost Adjustment (HECA).The Cost of Living Adjustment (COLA) is not a measure of inflation over time. Source: State Higher Education Executive Officers 3) Some states have changed calculation methods slightly during the period covered.

State Higher Education Finance FY 2013
30
Figure 8 (and the accompanying data in Table 7) shows the percent change by state in total educational revenue per FTE in public higher education from 2008 to 2013. Total revenue per FTE in 2013 is 2.9 percent higher than in 2012, but 5.9 percent lower than in 2008 (see Table 7).
• Fourteen states increased total educational revenue per student between 2008 and 2013.
• In 36 states, total educational revenue per FTE decreased. Despite increases in tuition revenue, public higher education has less total revenue per student than in 2008 in these states.
• The U.S. average showed a 5.9 percent decrease in total educational revenue per FTE from 2008 to 2013, indicative that tuition increases did not fully offset the reductions in per-student funding since 2008.
Figure 8 Total Educational Revenue per FTE
Percent Change by State, Fiscal 2008-2013
Note: Dollars adjusted by 2013 HECA, Cost of Living Adjustment, and Enrollment Index; total educational revenue excludes net tuition revenue used for capital debt services. Source: State Higher Education Executive Officers

State Higher Education Finance FY 2013
31
Table 7 Total Educational Revenue per FTE (Constant Adjusted 2013 Dollars)
Notes: 1) Total educational revenue is the sum of educational appropriations and net tuition excluding net tuition revenue used for capital debt service. 2) Adjustment factors, to arrive at constant dollar figures, include Cost of Living Adjustment (COLA), Enrollment Mix Index (EMI), and Higher Education Cost Adjustment (HECA).The Cost of Living Adjustment (COLA) is not a measure of inflation over time. Source: State Higher Education Executive Officers

State Higher Education Finance FY 2013
32
Figures 9 and 10 compare states to the national average on 2013 Educational Appropriations per FTE and Total Educational Revenue per FTE, respectively. In 21 states, educational appropriations per FTE are within $1,000 of the U.S. average and a majority of states are within $2,000. In total education revenue per FTE, 22 states are within $1,000 of the U.S. average, and 35 are within $2,000. Comparing states across both charts, traditionally high tuition states like New Hampshire and Vermont are well below the national average for education appropriations (Figure 9) but average and above average, respectively, on total revenue (Figure 10).

State Higher Education Finance FY 2013
33
Figure 9 Educational Appropriations per FTE
State Differences from U.S. Average Fiscal 2013
Notes: Dollars adjusted by Cost of Living Adjustment and Enrollment Index Source: State Higher Education Executive Officers

State Higher Education Finance FY 2013
34
Figure 10 Total Educational Revenue per FTE
State Differences from U.S. Average Fiscal 2013
Notes: Dollars adjusted by Cost of Living Adjustment and Enrollment Index Source: State Higher Education Executive Officers

State Higher Education Finance FY 2013
35
Comparing States on Two Dimensions This section provides figures in which SHEF data are plotted along two dimensions in order to compare states with respect to two trends simultaneously. For example, analysts and policymakers might want to know not just where a state stands relative to others in terms of higher education support, but whether the state is gaining or losing over time relative to others. Figure 11 displays the rate of change in the two primary components of educational revenue per FTE—educational appropriations and net tuition. Data on the horizontal axis indicate the extent to which educational appropriations grew or declined in constant dollars from 1998 to 2013. The vertical axis indicates the percentage change in net tuition revenue over the same period.
• States in the upper right quadrant exceeded the national average in both educational appropriations changes and net tuition revenue changes.
• States in the lower right quadrant exceeded the national average in educational appropriations changes, but lagged the national average in net tuition revenue changes.
• States in the lower left quadrant lagged the national average in both educational appropriations changes and tuition revenue changes.
• States in the upper left quadrant lagged the national average in educational appropriations changes, but exceeded the national average in net tuition changes.
Figure 11 Percent Change by State in Educational Appropriations and Net Tuition Revenue per FTE
Fiscal 1998-2013

State Higher Education Finance FY 2013
36
Many states provide funding for student financial aid programs in order to help offset the cost of tuition. In Figure 12, points along the horizontal axis represent 2013 net tuition revenue per FTE for each state. Ordering along the vertical axis reflects per-student state funding intended to help students pay public institution tuition during 2013.
• States in the upper right quadrant exceeded the national average in both net tuition revenue and tuition aid.
• States in the lower right quadrant exceeded the national average in net tuition revenue, but fell below the national average in tuition aid.
• States in the lower left quadrant lagged the national average in both net tuition revenue and tuition aid.
• States in the upper left quadrant lagged the national average in net tuition, and exceeded the national average in tuition aid.
Figure 12
Net Tuition Revenue per FTE and State-Funded Tuition Aid per FTE by State Fiscal 2013 (Public Institutions Only)
Note: Figures are adjusted for inflation, public system enrollment mix, and state cost of living. Source: State Higher Education Executive Officers
Note: Figures are adjusted for inflation, public system enrollment mix, and state cost of living. Source: State Higher Education Executive Officers

State Higher Education Finance FY 2013
37
State Wealth, Taxes, and Allocations for Higher Education Within each state, policies and decisions about the financing of higher education are made in the context of prevailing economic conditions, tax structures, and competing budgetary priorities. Within this context, state policymakers face challenging questions including:
• What revenue is needed to support important public services?
• What level of taxation will generate that revenue without impairing economic productivity or individual opportunities?
• What combination of public services, spending, and tax policy is most likely to enhance economic growth, future assets, and the quality of life?
• What should the spending priorities be for different public services and investments? Opinions vary widely about a host of issues concerning taxes, public services, and public investments. Differences of opinion and ideology combine with conditions in the economy and demography to affect state taxing and spending decisions. As these conditions change, policymakers reevaluate taxation and spending policies. That reevaluation may be less likely to lead to changes in those states where tax and/or spending policies are dictated or influence by provisions of the state constitution rather than by state statute. No single standard exists to evaluate public policy decisions with respect to funding for higher education. Relevant, comparative information about states can, however, help inform higher education financing decisions. This section explores several types of comparative data and indicators, including relative state and personal wealth, tax capacity and effort, and comparative allocations to higher education.8 Nationally, effective state and local tax rates were nearly unchanged over the last decade. As shown in Table 8, based on a combination of federal government data sources:
• Aggregate state wealth (total taxable resources) per capita increased 33.5 percent from 2001 to 2011, from $39,727 to $53,017. The effects of the 2008 recession are evident, however, in 2009 and 2010 numbers. Total taxable resources per capita reached a high of $53,612 in 2007, declining to $53,071 in 2008 and to $50,051 in 2009. 2010 total taxable resources rebounded 1.8 percent in 2010 to $50,974, signaling the beginning of a slow recovery. In 2011, they grew more quickly, increasing 4.0% to $53,017.
• Total state and local tax revenues per capita increased 34.1 percent from $3,196 in 2001 to $4,287 in 2011, but remain below the high of $4,362 in 2008.
• As a result of total taxable resources and revenues increasing at about the same rate, the national aggregate effective state and local tax rate (tax revenue as a percentage of state wealth) was essentially flat over this period.
Also based on aggregate, national data, the allocation of the available state revenue to higher education fluctuated somewhat between 2001 and 2011. Of total state and local revenues (including lottery proceeds), the allocation to higher education ranged from a low of 6.4 percent in 2006 and 2007 to a high of 7.6 percent in 2002 and 2003. In 2011, the most recent year available, the percentage allocation to higher education was 6.5 percent, lower than
8 Part of this section draws on previous work by Kent Halstead to assemble data and develop indicators for higher education support per capita
and relative to wealth (personal income), state tax capacity, and tax effort.

State Higher Education Finance FY 2013
38
the past three years and showing the impact of economic downturns on state budgets. While the economy is in recovery, budget challenges remain.
Table 8 State Wealth, Tax Revenue, Effective Tax Rates, and Higher Education Allocation
U.S. 2001-2011 (Current Unadjusted Dollars)
Notes: 1) Total Taxable Resources per Capita: 2002, 2003, 2004 data: U.S. Treasury Department, http://www.treas.gov/offices/economic-policy/resources/estimates.html 1993-2001: Compson, Michael. L (March, 2003) 2) State and Local Tax Revenues per Capita: U.S. Census Bureau, 2011 Annual Surveys of State and Local Government Finances 3) Local Tax Revenues in 2001 and 2003 are estimates; the following formula was used: FY2001 Local Tax Revenue = (((FY1998Local/FY1998State)+(FY1999Local/FY1999State)+(FY2000Local/FY2000State))/3)*FY2001State; FY2003 Local Tax Revenues = (((FY1999Local/FY1999State)+(FY2000Local/FY2000State)+(FY2002Local/FY2002State))/3)*FY2003State 4) Effective Tax Rate = State & Local Tax Revenues per Capita / Total Taxable Resources per Capita. 5) State and local tax revenues data from U.S. Census Bureau; lottery profits data from North American Association of State and Provincial Lotteries. 6) Higher Education Support = State and local tax and nontax support for general operating expenses of public and independent higher education. Includes special purpose appropriations for research-agricultural-medical. Source: State Higher Education Executive Officers

State Higher Education Finance FY 2013
39
In Table 9, state tax revenue per capita, total taxable resources per capita, and the effective tax rates are indexed to the national average in order to indicate the variability across states relative to the national average. Taxable resources per capita vary by a factor of two, from a low of $37,253 per capita to a high of $77,912 per capita. The U.S. average is $53,017. Effective tax rates also vary substantially, from a low of 5.7 percent to a high of 13.8 percent, while the U.S. average is 8.1 percent. Table 10, based on federal data sources, shows two measures of state-by-state support for higher education (per capita and per $1,000 in personal income) for 2012. Per-capita support for higher education averages $259 nationally and ranges from $63 in New Hampshire to $639 in Wyoming. Support for higher education relative to personal income varies from $1.27 to $12.63 per $1,000 of personal income across the states. Nationally, state and local support for higher education per $1,000 of personal income was $5.93 in 2012. These comparative statistics reflect interstate differences in wealth, population characteristics and density, participation rates, the relative size of the public and independent higher education sectors, student mobility, and numerous other factors. Poorer states may lag the national average in per-capita support, but exceed the national average in support per thousand dollars of personal income. Similarly, sparsely populated states sometimes exceed the national average in both per-capita support and per thousand dollars of personal income. Table 10 also provides an analysis of state support as a percentage of state budgets in 2011. While such statistics show relative investments in higher education, they do not necessarily indicate the relative "priority" or valuation of higher education by each state. They do reflect the different paths states have taken in financing a set of public purposes as they assess need, urgency, and financing options. As previously discussed, tuition revenue frequently (but not universally) has increased when state and local sources of support have not kept pace with enrollment growth and inflation. The data in Table 8, indicating a slight increase in the effective state tax rate combined with the pressures created by growing higher education enrollment, increasing demands for elementary and secondary funding, rising Medicaid costs, and other factors, help explain the stress on state budgets and policymakers. Starting with California’s Proposition 13 in 1978, many states saw limits on taxation and, sometimes, mandatory spending for programs such as K -12 education and correction placed in their constitutions. These factors are unique to each state and affect what states are able to devote to supporting higher education. Pursuing the goals of assuring higher education access, determining appropriate levels of support, and sorting out "who pays, who benefits," in the context of state needs, resources, and other policy objectives, remains a complex task in every state.

State Higher Education Finance FY 2013
40
Table 9 Tax Revenues, Taxable Resources, and Effective Tax Rates by State Fiscal 2011
Notes: 1) Population and tax revenues data from U.S. Census Bureau, 2011 Annual Surveys of State and Local Government Finances and U.S. Bureau of Economic Analysis 2) Total Taxable Resources per capita from U.S. Treasury Department 3) Actual State + Local Tax Revenues by State, Fiscal 2011: U.S. Census Bureau, 2011 Annual Surveys of State and Local Government Finances

State Higher Education Finance FY 2013
41
Table 10 Perspectives on State and Local Government Higher Education Funding Effort by State
Notes: 1) Higher Education Support = State and local tax and nontax support for public and independent higher education. Includes special purpose appropriations for research-agricultural-medical. 2) Population and personal income data from U.S. Census Bureau and Bureau of Economic Analysis. 3) State and local tax revenues data from U.S. Census Bureau; lottery profits data from North American Association of State and Provincial Lotteries. Source: State Higher Education Executive Officers.
State Higher Education Finance FY 2013
42
Conclusion Since the beginning of the 21st century, higher education enrollment has grown faster than in any decade since the 1960s. Simultaneously, state and local funding for higher education stagnated twice due to recessions. From 2002 to 2004, total state and local funding hovered around $70 billion. Then, over four years (2005 to 2008), state and local support for public higher education grew to $88.8 billion, partially restoring the per-student support eroded by the 2001 recession. This four-year recovery abruptly ended when, in 2008, the nation suffered the worst recession since the Great Depression. From 2008 to 2011, enrollment grew by an additional 13.3 percent; but state and local support, even with the assistance of the federal economic stimulus funds, stagnated, declining modestly for the nation as a whole and falling dramatically in some states. This report has summarized enrollment and funding data for 2013. State and local support grew slightly and, coupled with a small decline in enrollment, per-student educational appropriations increased for the first time since 2008, rising 1.4 percent to $6,105. Based on this increase, state and local support for higher education has begun to recover from the Great Recession. However, compared to the recovery following the recession of the early 2000s, the recovery is happening more slowly. And 20 states made cuts in FY 2013, from 2012 support levels, illustrating that the recovery is not uniform nationwide. Initial estimates of state appropriations for FY 2014 show a 5.7 percent increase. At the same time, tuition revenue per student continues to grow at a faster pace and the share of total revenue that comes from tuition is now at 47.5 percent, a trend that is likely unsustainable. In the past decade, these two recessions and the larger macroeconomic challenges facing the United States have created what some are calling the “new normal” for state funding for public higher education and other public services. In the new normal, retirement and health care costs simultaneously drive up the cost of higher education and compete with education for limited public resources. The new normal no longer expects to see a recovery of state support for higher education such as occurred repeatedly in the last half of the 20th century. The new normal expects students and their families to continue to make increasingly greater financial sacrifices in order to complete a postsecondary education. The new normal expects schools and colleges to find ways of increasing productivity and to absorb ever larger budget cuts, while increasing degree production without compromising quality. One cannot responsibly ignore either the financial realities outlined in this report or the larger economic challenges facing the American people. Somehow, the nation and its educators must come to grips with these realities and create effective responses to them. Colleges and universities must find ways to reduce the cost of instruction, improve student progress and reduce the time to a degree, while improving student learning and increasing the numbers of students who graduate ready to be productive citizens. Parents, students, institutions, and states must make tough decisions about priorities—what investments are essential for a better future and where can we and should we reduce spending on non-essentials in order to secure what is essential? But avoiding bad judgments can be difficult when facing tough choices. Institutions may cut too many quality corners or compete with each other to raise revenue from “new” sources (such as out-of-state or international students) rather than make difficult decisions about priorities or the extra effort required to create and effectively implement innovative practices. Policymakers may overestimate how many students can be well educated within existing resources, or make unrealistic assumptions about the potential for technology and new delivery methods to rapidly become a panacea offsetting the long-term negative effects of budget cuts or tuition increases on access to higher education and the quality of our workforce. Or the better-off public may be lulled into thinking that the American economy can get by with limited opportunities and 20
th century standards for educational attainment, so long as their
own families are well educated. The educational and economic edge the United States once enjoyed in comparison to other nations is eroding rapidly. Sound judgment about priorities and extra measures of commitment and creativity are needed in order to regain our educational and economic momentum. The data and analysis of this and future SHEF reports are intended to help higher education leaders and state policymakers focus on how discrete, year-to-year decisions fit into broader patterns of change over time, and to help them make decisions in the coming years that will meet the long-term needs of the American people.

State Higher Education Finance FY 2013
43

State Higher Education Finance FY 2013
44
Technical Paper A
The Higher Education Cost Adjustment: A Proposed Tool for Assessing Inflation in Higher Education Costs
Introduction Prices charged to students, the total cost of higher education, and the effect of inflation are all important issues for the public, state and federal governments, and colleges and universities. This brief technical paper discusses two relevant dimensions of inflation in higher education—the consumer and the provider perspectives—and describes a tool to benchmark the inflation experienced by providers, colleges, and universities.
The Consumer Perspective The student, parent, or student-aid provider most often views higher education prices compared to how much consumers pay for other goods and services. The Consumer Price Index for Urban Consumers (CPI-U) is most often used for such comparisons. The CPI-U "market basket" consists of: housing (42 percent of the index), transportation (19 percent), food and beverage (18 percent), apparel and upkeep (7 percent), medical care (5 percent), entertainment (4 percent), and other goods and services (5 percent). To calculate the CPI-U, the Bureau of Labor Statistics measures average changes in the prices paid for these goods and services in 27 local areas. Prices for different goods and services generally change faster or slower than the average rate of increase in the CPI-U. Incomes also grow or decline at different rates. Consumers notice when prices increase and they become concerned when prices for important goods and services grow faster than their incomes. Prices for higher education and health care, for example, have grown faster than overall consumer prices over the past 15 years. While consumer prices, as measured by CPI-U, grew by 43 percent between 1995 and 2010, the cost of medical care grew by 85 percent9, and enrollment-weighted tuition and fees for four-year public universities grew by 175 percent.10 U.S. income per capita grew by 85 percent11 during the same period—more than prices in general, but less than the health care and college tuition price increases. In view of these facts, it is not surprising that college prices are attracting national attention. Colleges and universities are certainly aware of the issues and of the increase in their prices. At the same time, however, they face growth in the prices that they pay.
The Provider Perspective The CPI-U is based on goods and services purchased by the typical urban consumer. Colleges and universities spend their funds on different things—mostly (about 75 percent) on salaries and benefits for faculty and staff; and lesser amounts on utilities, supplies, books and library materials, and computing. Trends in the costs of these items don't necessarily run parallel to the average price increases of the goods and services tracked by the CPI-U. Kent Halstead developed the Higher Education Price Index (HEPI) to track changes in the prices paid by colleges and universities. This index, which tracks price changes since 1961, is based on a 1972 market basket of expenditures for
9 “Economic Report of the President.” February 2007. Appendix B, Table B-60: "Consumer Price Indexes for Major Expenditure Classes" (www.gpoaccess.gov/eop/2007/B60.xls). 10 Source: Washington Higher Education Coordinating Board 11 Source: Bureau of Economic Analysis

State Higher Education Finance FY 2013
45
colleges and universities. To estimate price changes for components in this market basket, Halstead used trends in faculty salaries collected by the American Association of University Professors (AAUP), and a number of price indices generated by federal agencies. Dr. Halstead last updated the HEPI in 2001, using regression analysis to estimate price increases for more recent years. Since 2005, Commonfund Institute has maintained the HEPI project, continuing to provide yearly updates to the data based on a regression analysis. The HEPI has made an important contribution to understanding the cost increases borne by colleges and universities. Over the past years, the State Higher Education Executive Officers association (SHEEO) and chief fiscal officers of higher education agencies discussed the feasibility and desirability of a fresh analysis of higher education cost inflation and reached the following conclusions:
• While the HEPI has been useful, it has not been universally accepted because it is a privately developed analysis, and one of its main components, average faculty salaries, has been criticized as self-referential.
• The HEPI has not diverged dramatically from other inflation indices over short time periods. Hence, many policymakers reference indices such as the CPI-U in annual budget deliberations, especially in budgeting for projected price increases.
• It would be costly to update, refine, and maintain the HEPI in such a way that would meet professional standards for price indexing. The most labor-intensive work would be in refreshing the data in the higher education market basket.
For these reasons, SHEEO decided not to develop a successor to the HEPI. But, over an extended period of time, differences between the market basket of higher education cost increases and the CPI market basket cost increases are material. The most fundamental problem is that the largest expenditure for higher education is salaries for educated people. In the past 20 years, such people have demanded increasingly higher compensation in both the private and public sectors, including colleges and universities. SHEEO developed the Higher Education Cost Adjustment (HECA) as an alternative to the CPI-U and the HEPI for estimating inflation in the costs paid by colleges and universities. HECA is constructed from two federally developed and maintained price indices—the Employment Cost Index (ECI) and the Gross Domestic Product Implicit Price Deflator (GDP IPD). The ECI reflects employer compensation costs including wages, salaries, and benefits.12 The GDP IPD reflects general price inflation in the U.S. economy.13 The HECA has the following advantages:
1. It is constructed from measures of inflation in the broader U.S. economy;
2. It is simple, straightforward to calculate, and transparent; and
3. The underlying indices are developed and routinely updated by the Bureaus of Labor Statistics and Economic Analysis.
Because the best available data suggest that faculty and staff salaries account for roughly 75 percent of college and university expenditures, the HECA is based on a market basket with two components—personnel costs (75 percent of the index), and non-personnel costs (25 percent). SHEEO constructed the HECA based on the growth of the ECI (for 75 percent of costs) and the growth of the GDP IPD (for 25 percent of costs).
12 The Employment Cost Index (ECI) for White Collar Workers (excluding sales occupations), which has traditionally been used in SHEF, was
discontinued in March 2006. The ECI for management, professional, and related occupations (not seasonally adjusted) is the closest to the discontinued index and is now used in SHEF. This index is available back to 2001, and historical SHEF data have been adjusted to represent this new series.
13 Gross Domestic Product (GDP) is the total market value of all final goods and services produced in the country in a given year. It is equal to
total consumer, investment, and government spending, plus the value of exports, minus the value of imports. The GDP Implicit Price Deflator is current dollar GDP divided by constant dollar GDP. This ratio is used to account for the effects of inflation by reflecting the change in the prices of the bundle of goods that make up the GDP as well as changes to the bundle itself.

State Higher Education Finance FY 2013
46
Technical Paper Table 1 displays three indices—the CPI-U, HEPI, and HECA—for the years 1998 to 2013. For comparison purposes, per capita income growth is shown.
Summary of the Indices Between 1998 and 2013:
• Consumer prices grew by 43 percent;
• Provider prices for higher education grew 51 percent (as estimated by HECA); and
• Provider prices for higher education grew 61 percent (as estimated by HEPI).
Technical Paper Table 1 CPI-U, HEPI, and HECA Indexed to Fiscal Year 2013

State Higher Education Finance FY 2013
47
Technical Paper B
Adjusting for Interstate Differences in Cost of Living and Enrollment Mix
It is difficult to compare interstate higher education unit costs. The analytical tools available are, at best, blunt instruments for measuring differences. Nevertheless, blunt instruments can be better than no instruments at all. This technical paper briefly describes two approaches for assessing the relative significance of two factors—cost of living and the enrollment mix among institutions. The cost of living varies greatly across the 50 states. The most significant difference is in median housing values. In the 2005 American Community Survey census, median housing value was $167,500 for the nation, but ranged from $84,400 to $477,000 across different regions and states. Enrollment mix also poses a challenge for interstate financial comparisons. Each level of higher education, from the lowest undergraduate work through doctoral studies, is progressively more expensive. A state or institution with a large proportion of enrollment in graduate programs will normally have a higher cost per FTE than a state or institution with a larger proportion of enrollment in undergraduate and two-year degree programs.
SHEF Adjustments for Cost of Living and Enrollment Mix The SHEF report provides separate analytical adjustments for differences among the states in the cost of living (COLA: Cost of Living Adjustment) and the mix in enrollment among categories of institutions (EMI: Enrollment Mix Index). The adjustment for interstate cost of living differences is drawn from the Berry index (a study by Berry et al. that provides a single index for each state).14 While this index does not solve the problem of differing intrastate costs of living, it offers a way to get a rough estimate of these differences for adjusting interstate unit cost data. The range of values extends from 0.88 to 1.22 among the 48 contiguous states in 2003, the most recent year available for these data. The Berry index does not provide an estimate of cost of living in Alaska and Hawaii, two states with unique characteristics. Alaska is estimated to have a cost of living consistent with the highest cost of living in the contiguous 48 United States. As a result, in the SHEF analysis, the value of 1.22 (the highest value of the 48 contiguous states) is assigned to Alaska. The cost of living in Hawaii is about 30 percent higher than the average in the 48 contiguous United States15. SHEEO has developed an adjustment for interstate enrollment mix differences based on the proportion of enrollment in each state compared with the national proportions of enrollment by Carnegie Classification for FY 2011 (the most recent finance data available at the time of data collection and analysis). The essential steps are as follows:
14 Berry, W.D., R.C. Fording, and R.L. Hanson. Cost of Living Index for the American States, 1960-2003. (Available at ICPSR Publication-
Related Archive, study # 1275 http://webapp.icpsr.umich.edu/cocoon/ICPSR-STUDY/01275.xml) 15 An examination of city-based cost of living adjustment factors resulted in assigning Hawaii a cost of living adjustment factor of 1.35. This is
comparable to Boston’s ACCRA cost of living adjustment, but lower than Honolulu’s adjustment of 1.64. Honolulu’s adjustment factor would not be appropriate because, while most of Hawaii’s higher education is concentrated there, it is a disproportionately high cost area.

State Higher Education Finance FY 2013
48
1. Integrated Postsecondary Education Data System (IPEDS) data were used to develop a national average cost per fall FTE for each of the Carnegie Classifications of institutions. This calculation used financial information from FY 2011 and fall 2010 FTE data.
2. The proportion of each state's FTE in each of the Carnegie Classifications was calculated for fall 2010, and then multiplied by the national average cost per FTE in FY 2011 for each respective classification. For each state, the products for each Classification were summed, which yields the state’s enrollment mix unit cost for the year.
If the state has relatively more enrollment in higher cost Carnegie Classifications (e.g., research universities) the enrollment mix unit cost will surpass the aggregated national unit cost. If the state has relatively more enrollment in lower cost Carnegie Classifications (e.g., community colleges) the enrollment mix unit cost will be less than the aggregated national unit cost.
3. The ratio of enrollment mix unit cost to aggregated national unit cost constitutes each state's enrollment mix "index." For example, the enrollment mix index for California in FY 2011 equals 0.944 because California has a large community college system. This calculation illustrates that, if unit costs in each sector were at the national average, the statewide cost per FTE would be lower than the aggregated national unit cost by 5.5 percent.
Each SHEF adjustment is expressed in index values where the national average equals 1.00. Hence, actual expenditures per FTE are divided by the SHEF adjustment in order to obtain the adjusted value. For example, presume that State X has an actual expenditure per FTE of $8,000. If the cost of living index for State X equals 1.05, its expenditure per FTE, adjusted for differences in the cost of living, would be $7,619 ($8,000 / 1.05). If State X has an enrollment mix index of 0.98, its expenditure per FTE, adjusted for differences in enrollment mix, would be $8,163 ($8,000 / .98). When both adjustments are made, State X would have an adjusted expenditure per FTE of $7,775 ($8,000 / 1.05 / .98). Technical Paper Table 2 shows the EMI, COLA, and combined EMI and COLA measures for each state. Technical Paper Table 3 summarizes results for the SHEF adjustments for interstate cost of living and enrollment mix differences among the states. SHEEO welcomes comments on the utility and limitations of these analytical tools and any suggestions for improvement.

State Higher Education Finance FY 2013
49
Technical Paper Table 2 Enrollment Mix Index and Cost of Living Adjustments by State
Notes: 1) Fall 2010 FTE data and FY 2011 financial data from IPEDS are used to produce Enrollment Mix. 2) As of 2003, obtained from Berry, 2003.

State Higher Education Finance FY 2013
50
Technical Paper Table 3 Impact of Enrollment Mix Index and Cost of Living Adjustments by State
Source: State Higher Education Executive Officers

State Higher Education Finance FY 2013
51
Technical Paper C
Diverse Perspectives on State Higher Education Finance Data
Understanding state support for higher education is complicated by the various perspectives of organizations that measure monetary support. Aside from SHEF, two annual studies are national in scope and report different numbers based on unique definitions and data elements—Illinois State University's Grapevine survey (noted earlier) and the National Association of State Budget Officers (NASBO) State Expenditure Report. Further complicating the issue, states observe different practices in collecting and reporting data. For example, as reported by NASBO, in FY 2011, nine states exclude all or some of tuition and fees in state expenditures for higher education and eighteen states exclude all or part of student loan programs. Reconciling these differences (both at the data collection and state levels) may be impossible; understanding them, however, is essential for interpreting information on state trends in financing higher education from different sources. The following summarizes data collected by SHEEO, NASBO, and Grapevine.
Grapevine – "State Effort" Grapevine reports on total "state effort" for higher education, defined as funds from all state sources for universities, colleges, community colleges, and state higher education agencies. The Grapevine data collection effort has merged with the SHEF data collection effort to form the new State Support for Higher Education Database (SSDB) data collection. Therefore, Grapevine’s “state effort” and SHEF’s “state support” are now identical. The SSDB data collection requires that states follow the following guidelines in reporting:
1. Report only appropriations, not actual expenditures.
2. Report only sums appropriated for annual operating expenses.
3. For state tax appropriations in complex universities, separate the sums appropriated for (or allocated to) the main campus, branch campuses, and medical centers (even if on the main campus). Medical center data should include the operations of colleges of medicine, dentistry, pharmacy, and nursing; and teaching hospitals, either lumped as one sum or set out separately, as preferred.
"State effort" for Grapevine includes:
• Sums appropriated for state aid to local public community colleges, state-supported community colleges, and vocational-technical two-year colleges or institutions predominantly for high school graduates and adult students.
• Sums appropriated for statewide coordinating or governing boards (for expenses and/or allocation to other institutions) and sums appropriated directly to institutions of higher education.
• Sums appropriated for state scholarships or other student financial aid.
• Sums destined for higher education but appropriated to another state agency.
• Appropriations directed to independent institutions of higher education.
• Funding under state auspices for appropriated nontax state support (such as monies from lotteries set aside for institutional support or for student assistance).

State Higher Education Finance FY 2013
52
• Funding under state auspices for non-appropriated state support (such as monies from receipt of lease income and oil/mineral extraction fees on land set aside for public institution benefit).
• Interest or earnings received from state funded endowments set aside for public sector institutions.
• Portions of multi-year appropriations from previous years.
• Any other sources of state funding for higher education operations not listed above. Excluded items include appropriations for capital outlays and debt service, and appropriations of sums derived from federal sources, student tuition and fee revenues, and auxiliary enterprises.
National Association of State Budget Officers (NASBO) – "State Funds" NASBO defines state support of higher education as expenditures reflecting support of state universities and university systems, community colleges, and vocational education. "State Funds" are defined as general funds plus certain other state funds. Fund revenue sources include:
• Sales Tax
• Gaming Tax
• Corporate Income Tax
• Personal Income Tax
• Other taxes and fees (depending on the state, these may include cigarette and tobacco taxes, alcoholic beverage taxes, insurance premiums, severance taxes, licenses and fees for permits, inheritance taxes, and charges for state-provided services)
• Tuition and fees and student loan revenue (in many states) States are also requested to include capital spending (for some states this can be substantial and tends to vary widely from year to year). Exclusions include federal research grants and university endowments.
SHEEO – "Total State and Local Support" As a result of the combined SSDB effort, the SHEEO definition of Total State Support is the same as the Grapevine definition of State Effort. However, SHEEO adds in local tax appropriations for higher education to calculate State and Local Support. The SHEF report was originally built on Dr. Kent Halstead's State Profiles: Financing Public Higher Education, better known as the "Halstead Study." Starting in the 1970s, Research Associates of Washington, headed by Halstead, produced a model of the principal factors governing state support of public higher education. Through the presentation of raw state data, indexed data, weighted state comparisons, and national overviews, Halstead sought to provide states with the capability to assess their support of public higher education. He analyzed state FTE, appropriations, and net tuition data, along with data gathered from the U.S. Census Bureau, the Department of Treasury, and the National Center for Education Statistics, and created tables displaying state support, tax capacity, tax effort, and family share of funding. His results were published in two volumes —the annual State Profiles: Financing Public Higher Education Rankings, and the companion trend data, State Profiles: Financing Public Higher Education Trend Data. Both were last published in 1998. In 2001, SHEEO resumed this endeavor.

State Higher Education Finance FY 2013
53
Like the "Halstead studies," the SHEEO study:
• Analyzes state support for higher education, setting aside support in categories that vary widely among states (research, medical education, and agricultural extension services) so as to focus the analysis on appropriations for instruction and public service in more comparable areas;
• Collects annual student FTE enrollment data to calculate more comparable estimates of state support per student;
• Examines state support for higher education in the context of a state's capacity to raise revenue from taxation;
• Examines the relative contribution of students to the cost of public higher education; and
• Examines interstate differences in the cost of living and in the enrollment mix among different types of institutions.
Additionally, SHEEO's annual survey provides national summary information on:
• State support for the education of students attending independent colleges and universities (direct state grants to institutions, or financial aid to students).
• State support of higher education operations through nontax revenue, including lottery proceeds, royalties from natural resources, and state-supported endowments.
• Trends in state support for research, medical education, and agricultural extension services.
• State-supported student financial assistance.

State Higher Education Finance FY 2013
54
APPENDIX A—Grapevine Media Tables Since 1960, Grapevine has published annual compilations of data on state tax support for higher education, including general fund appropriations for universities, colleges, community colleges, and state higher education agencies. Each year’s Grapevine survey has asked states for tax appropriations data for the new fiscal year and for revisions (if any) to data reported in previous years. The results of the Grapevine survey for fiscal year 2013-14 (FY14), including tax and nontax monies, are compiled in the national tables available on this website: http://grapevine.illinoisstate.edu/. The FY14 data summarized in these tables represent initial allocations and estimates reported by the states from September 2013 through January 14, 2014 and are subject to change.
Grapevine Table 1 State Fiscal Support for Higher Education by State
Fiscal Years 2008-09 (FY09), 2011-12 (FY12), 2012-13 (FY13), 2013-14 (FY14)a

State Higher Education Finance FY 2013
55
Grapevine Table 2 One-Year (FY13-FY14), Two-Year (FY12-FY14), and Five-Year (FY09-FY14)
Percent Changes in State Fiscal Support for Higher Education

State Higher Education Finance FY 2013
56
APPENDIX B—Glossary of Terms Cost Adjustments Consumer Price Index (CPI). A measure of the average change over time in the price of a market basket of consumer goods and services. Sources: Bureau of Labor Statistics, U.S. Department of Labor. Employment Cost Index (ECI). A measure of the change in labor costs, outside the influence of employment shifts, among occupations and industries. The ECI for private industry white-collar occupations (excluding sales) accounts for 75 percent of the State Higher Education Executive Officers (SHEEO) Higher Education Cost Adjustment (HECA). HECA uses the compensation series that includes changes in wages and salaries plus employer costs for employee benefits. Sources: Bureau of Labor Statistics, U.S. Department of Labor. Gross Domestic Product (GDP). The total market value of all final goods and services produced in the country in a given year—the sum of total consumer spending, investment spending, government spending, and exports, minus imports. Source: Bureau of Economic Analysis, Office of Economic Policy, U.S. Department of Commerce. Gross Domestic Product Implicit Price Deflator (GDP IPD). Current dollar GDP divided by constant dollar GDP. This ratio is used to account for inflationary effects by reflecting both the change in the price of the bundle of goods comprising the GDP and the change to the bundle itself. The GDP IPD accounts for 25 percent of the SHEEO HECA. Sources: Bureau of Economic Analysis, Office of Economic Policy, U.S. Department of Commerce. Higher Education Cost Adjustment (HECA). Measures price inflation experienced by colleges and universities. The HECA uses two external indices maintained by the federal government—the ECI (accounts for 75 percent of the index) and the GDP IPD (accounts for the remainder). Source: SSDB. Higher Education Price Index (HEPI). Developed by Kent Halstead, the HEPI measures the inflationary effect on college and university operations. It measures the average relative level in the price of a fixed market basket of goods and services purchased by colleges and universities through current fund educational and general expenses (excluding those for sponsored research, department sales and services, and auxiliary enterprises). Source: Commonfund (www.commonfund.org; rollover “Investor Services” and choose “Research”). Price Inflation. The percentage increase in the price of a market basket of goods and services over a specific time period.
Enrollment Full-Time Equivalent Enrollment (FTE). A measure of enrollment equal to one student enrolled full-time for one academic year, based on all credit hours (including summer sessions). The SHEF data capture FTE enrollment in public institutions of higher education from those credit or contact hours associated with courses that apply to a degree or certificate, excluding non-credit continuing education, adult education, and extension courses. If courses meet the "formal award potential" criterion, they may include vocational-technical, remedial, and other program enrollment at two-year community colleges and state-approved area vocational-technical centers. Medical school enrollment is reported but set aside from the net FTE used in "funding per FTE" calculations because states vary widely in the extent of medical school funding. The FTE calculation differs with the type and level of instruction:
• Contact hour courses: One annual FTE is the sum of total contact hours divided by 900.

State Higher Education Finance FY 2013
57
• Undergraduate credit hour courses: One annual FTE is the sum of total credits divided by 30 (for semester-based calendar systems) or 45 (for quarter systems).
• Graduate and first-professional credit hour courses: One annual FTE is the sum of total credits divided by 24 (for semester systems) or 36 (for quarter systems). Source: SSDB.
Revenue Appropriations. Money set aside by formal legislative action for a specific use. Educational Appropriations.16 Net State Support plus Local Tax Appropriations minus Research, Agricultural, and Medical (RAM) appropriations. Source: SSDB. Gross State Support. The sum of State Tax Appropriations plus:
• Funding under state auspices for appropriated nontax state support (e.g., lotteries, casinos, and tobacco settlement funds) set aside for higher education;
• Funding under state auspices for non-appropriated state support (e.g., monies from receipt of lease income, cattle grazing rights, and oil/mineral extraction fees on land) set aside for higher education;
• Sums destined for higher education but appropriated to some other state agency (e.g., administered funds or funds intended for faculty/staff fringe benefits that are appropriated to the state treasurer);
• Interest or earnings received from state-funded endowments pledged to public sector institutions; and
• Portions of multi-year appropriations from previous years. Source: SSDB. Local Tax Appropriations. Annual appropriations from local government taxes for public higher education institution operating expenses. Source: SSDB. Net State Support. State support for public higher education annual operating expenses. The difference resulting from Gross State Support less:
• Appropriations returned to the state;
• State-appropriated funds derived from federal sources;
• Portions of multi-year appropriations to be distributed over subsequent years;
• Tuition charges remitted to the state to offset state appropriations;
• Tuition and fees used for capital debt service and capital improvement (other than that paid by students for auxiliary enterprise debt service);
• State funding for students in non-credit continuing or adult education courses and non-credit extension courses;
• Sums appropriated to independent institutions for capital outlay or operating expenses;
• Allocation of appropriations for financial aid grants to students attending in-state independent institutions; and
• Allocation of appropriations for financial aid grants to students attending out-of-state institutions. Source: SSDB.
16 For FY 2009 through FY 2012, educational appropriations includes funds allocated to states by the federal government through the American Recovery and Reinvestment Act of 2009 (ARRA), specifically those funds from the Education Stabilization Fund and Other Government Services Fund that were to be used to fill shortfalls in state support for general operating expenses at public colleges and universities. In FY 2011, this totaled to $2.8 billion

State Higher Education Finance FY 2013
58
Personal Income. The income received by all persons from participation in production, from government and business transfer payments, and from government interest. Personal income is the sum of net earnings by place of residence, rental income, personal dividend income, personal interest income, and transfer payments. Net earnings is earnings by place of work (wage and salary disbursements, and proprietors' income) less personal contributions for social insurance, including an adjustment to convert earnings by place of work to earnings by place of residence. Personal income is measured before the deduction of personal income taxes and is reported in current dollars. Sources: Bureau of Economic Analysis, Office of Economic Policy, U.S. Department of Treasury. Research, Agricultural, and Medical Appropriations (RAM). Special purpose appropriations targeted by legislative budget line-item identification or institutional designation for the direct operation and administrative support of research centers and institutes, agricultural experiment stations, cooperative extension services, teaching hospitals, health care public services, and four types of medical schools—medical, osteopathic, dental, and veterinary. Source: SSDB. State Tax Appropriations. Appropriations from state government taxes for public and private higher education institution and agency annual operating expenses, excluding capital outlay (for new construction or debt retirement) and revenue from auxiliary enterprises. These sums are largely the same as those reported as part of the annual Grapevine survey of the Center for the Study of Higher Education Policy at Illinois State University. Source: Grapevine, as reported to SHEEO. Student Share. The share of Total Educational Revenue from students or their families. Net Tuition Revenue as a percentage of Total Educational Revenue. Source: SSDB. Total Educational Revenue. The sum of Educational Appropriations and Net Tuition Revenue. Source: SSDB.
State Tax Revenue, Capacity, Effort, and Higher Education Allocation Actual Tax Revenue (ATR). General revenue derived from taxation by state and local governments. Source: U.S. Census Bureau. Effective Tax Rate (ETR). Actual Tax Revenue per capita divided by Total Taxable Resources per capita, expressed as a percentage. In 2000, the national average effective tax rate was 7.8 percent, or $3,086 divided by $39,579. An indexed value is derived by dividing the state's effective tax rate by the national average effective tax rate. Sources: Population and Actual Tax Revenue from the U.S. Census Bureau; Total Taxable Resources from the Bureau of Economic Analysis, Office of Economic Policy, U.S. Department of Treasury. State Higher Education Allocation. Measures total state support and local appropriations to higher education as a percentage of state plus local tax revenues. Source: SHEEO calculation from SHEF and U.S. Census data. Total Taxable Resources Index (TTR). Total Taxable Resources is the sum of Gross State Product (in-state production) minus components presumed not taxable by the state plus various components of income derived from out-of-state sources. An indexed value for each state is derived by dividing the state's TTR per capita by the national average TTR per capita. Source: Bureau of Economic Analysis, the Office of Economic Policy, and the U.S. Department of Treasury (with the exception of net realized capital gains (from the Internal Revenue Service).

State Higher Education Finance FY 2013
59
Tuition and Fee Revenue Gross Tuition and Fees. Gross assessments by public postsecondary institutions for tuition and mandatory education fees. Source: SSDB. Net Tuition Revenue. The sum of Gross Tuition and Mandatory Fee Assessments minus state-funded student financial aid, institutional discounts and waivers, and medical school student tuition revenue. Enrollment, state appropriations, and medical school tuition revenue are set aside in many SHEF analyses to improve interstate evaluation. Source: SSDB.

State Higher Education Finance FY 2013
60
APPENDIX C—State Data Providers
Alabama Susan Cagle Alabama Commission on Higher Education [email protected] Alaska Alesia M. Kruckenberg University of Alaska Planning and Budget [email protected] Arizona Gale Tebeau Arizona Board of Regents [email protected] Arkansas Tara Smith Arkansas Department of Higher Education [email protected] Callan Callaway Arkansas Department of Higher Education [email protected] California Jennifer Kuhn California Legislative Analyst’s Office [email protected] Colorado Julia Ramsey Colorado Department of Higher Education [email protected] Connecticut Keith Norton Connecticut Office of Higher Education [email protected] Scott A. Ciecko Connecticut Office of Higher Education [email protected]
Delaware Chesiree Wise Delaware Department of Education Higher Education Office [email protected] Florida Alicia D. Trexler Florida College System Budget Office/FDOE [email protected] Tim Jones State University System of Florida Board of Governors [email protected] Kristie L. Harris State University System of Florida Board of Governors [email protected] Hollis Key Florida Department of Education [email protected] John Holdnak Florida Department of Education, Division of Florida Colleges [email protected] Georgia Patrick D. Roessler Board of Regents of the University System of Georgia [email protected] Tracey Cook Board of Regents of the University System of Georgia [email protected] Ken Kincaid Technical College System of Georgia [email protected]

State Higher Education Finance FY 2013________________________________________________________________________
61
Hawaii Dennis Nishino University of Hawai`i System [email protected] Idaho Scott Christie Idaho Office of the State Board of Education [email protected] Illinois Jim Palmer Illinois State University [email protected] Brook Stewart Illinois Board of Higher Education [email protected] Alan D. Phillips Illinois Board of Higher Education [email protected] Indiana Matt Hawkins Indiana Commission for Higher Education [email protected] Iowa Patrice Sayre Board of Regents, State of Iowa [email protected] Kansas Diane C. Duffy Kansas Board of Regents [email protected] Kentucky Debbie Weakly Kentucky Council on Postsecondary Education [email protected] William Payne Kentucky Council on Postsecondary Education [email protected]
Louisiana Barbara Goodson Louisiana Board of Regents [email protected] Lori H. Parker Louisiana Board of Regents [email protected] Maine Miriam White University of Maine System [email protected] Maryland Geoffrey Newman Maryland Higher Education Commission [email protected] Massachusetts Jonathan Keller Massachusetts Department of Higher Education [email protected] Catherine Cheng Massachusetts Department of Higher Education [email protected] Sean Nelson Massachusetts Department of Higher Education [email protected] Michigan Robert Murphy Michigan State Budget Office [email protected] Minnesota Alexandra Djurovich Minnesota Office of Higher Education [email protected] Mississippi Chris Halliwell Mississippi Institutions of Higher Learning [email protected]

State Higher Education Finance FY 2013
62
Missouri Paula Wolken Missouri Department of Higher Education [email protected]
Leroy Wade Missouri Department of Higher Education [email protected]
Montana Frieda Houser Montana University System [email protected]
Nebraska Carna Pfeil Nebraska's Coordinating Commission for Postsecondary Education [email protected]
James Schiltz Nebraska's Coordinating Commission for Postsecondary Education [email protected]
Nevada Jamie Hullman Nevada System of Higher Education [email protected] New Hampshire Michael E. Marr Community College System of New Hampshire [email protected] Melanie DeZenzo University System of New Hampshire [email protected] New Jersey Elizabeth S. Garlatti New Jersey Higher Education/Office of the Secretary of Higher Education [email protected] Shakia Williams New Jersey Higher Education/Office of the Secretary of Higher Education [email protected]
New Mexico Qi Liu New Mexico Higher Education Department [email protected] John Rush New Mexico Higher Education Department [email protected] Loretta Marquez New Mexico Higher Education Department [email protected] Dina Advani New Mexico Higher Education Department [email protected] New York Catherine Abata City University of New York [email protected] Josh Sager State University of New York [email protected] Wendy C. Gilman University of the State of New York State Education Department Office of Higher Education [email protected] North Carolina Brandy Andrews North Carolina Community College System Office [email protected] Jonathan Pruitt University of North Carolina [email protected] North Dakota Cathy McDonald North Dakota University System [email protected]

State Higher Education Finance FY 2013________________________________________________________________________
63
Ohio David Cannon Ohio Board of Regents [email protected] Oklahoma Amanda Paliotta Oklahoma State Regents for Higher Education [email protected] Oregon Paul Schroeder Oregon Department of Community Colleges and Workforce Development [email protected] William Todd Downes Oregon Health & Science University [email protected] Elizabeth Willis Schauermann Oregon Health & Science University [email protected] Trina McGaughy Oregon University System [email protected] Pennsylvania Naomi Rudisill Pennsylvania Department of Education [email protected] Jeannine J. Weiser Pennsylvania Department of Education [email protected] Rhode Island Robin Beaupre Rhode Island Board of Education [email protected] South Carolina Gary Glenn South Carolina Commission on Higher Education [email protected]
South Dakota Mary Ellen Garrett South Dakota Board of Regents [email protected] Monte Kramer South Dakota Board of Regents [email protected] Tennessee Crystal L. Collins Tennessee Higher Education Commission [email protected] Russ Deaton Tennessee Higher Education Commission [email protected] Texas Ed Buchanan Texas Higher Education Coordinating Board [email protected] Utah Gregory Stauffer Utah System of Higher Education [email protected] Brian L. Shuppy Utah System of Higher Education [email protected] Vermont Richard Cate University of Vermont [email protected] Alberto M. Citarella University of Vermont [email protected] Jasmine Manuelyan University of Vermont [email protected] Deborah Robinson Vermont State Colleges [email protected]

State Higher Education Finance FY 2013
64
Vermont, continued Thomas A. Robbins Vermont State Colleges [email protected] Virginia Yan Zheng State Council of Higher Education for Virginia [email protected] R. Dan Hix State Council of Higher Education for Virginia [email protected] Washington Marc Webster Washington Student Achievement Council [email protected] Christy England-Siegerdt Washington Student Achievement Council [email protected] West Virginia Patty Miller West Virginia Higher Education Policy Commission [email protected] Wisconsin Sue Ellen Buth University of Wisconsin System [email protected] Gary Buehler University of Wisconsin System [email protected]
Wyoming Larry Buchholtz Wyoming Community College Commission [email protected] Janet Lowe University of Wyoming [email protected] Arley Williams University of Wyoming [email protected] Mark Collins University of Wyoming [email protected] Suzie Waggoner University of Wyoming Office of Institutional Analysis [email protected] Matthew Petry Wyoming Community College Commission [email protected] Claire Smith Wyoming Community College Commission [email protected]

State Higher Education Finance FY 2013________________________________________________________________________
65
APPENDIX D—SSDB Collection Instructions
State Support for Higher Education Database Collection for the FY14 Grapevine and the FY13 SHEF reports
Thank you so much for taking the time to complete SHEEO’s 2012-2013 State Higher Education Finance (SHEF) data collection. We are continuing to use the online collection form for this year’s data collection since most data providers have become comfortable with the functionality of this tool. Not including this page, there are a total of SIX pages on which we’d like you to enter information for your state. General Instructions:
Please fill out the collection form as completely as possible.
Please complete AT LEAST PAGE 1 by October 15, 2012. Page 1 contains information on ARRA Funds and state support for ALL higher education; it is the basis for the Grapevine Survey. If you are able to complete the other sections by this time, please do so.
Complete the entire form by December 3, 2012.
Enter data for the years that appear on each page. You can also edit any past data that need to be updated in the data collection tool.
Please report appropriations, not actual expenditures.
If you don’t have actual figures, but can provide an estimate, please do so. You can indicate that these are estimates in the comment box. There is a comment box at the bottom of each page.
Please enter only whole numbers.
If you place your cursor on a data element name for a few moments, a pop-up box will appear and will provide additional guidance.
If you have no data for a particular entry, please enter "0."
Do not enter information into any GREY shaded cells.
To navigate between the pages, use buttons at the bottom of each page. To go back you can also use tabs across the top.
Please let us know your progress by marking the designated check boxes at the bottom of the page when you are finished with each page of data and with the survey as a whole. Marking these checkboxes will tell us the data for the respective page is accurate, complete, and ready to be published.
To exit the collection instrument, click on “Save and Exit” button. Please do not close the window before doing this. There is a “Save and Exit” button at the bottom of each page.
When you click "Save and Exit" you will have the opportunity to have an Excel Report version of your current data emailed to you. Enter your email address into the "Email Address" Box and click "Email Excel File".
The information that is collected on Pages 1-4 is described in the following pages. Page 5 is a verification page, showing unadjusted data and data adjusted by the EMI and COLA indices. This is how your data will be reported. Please take a moment to review and make sure they are correct. On Page 6, you are asked to break down State Support for All Higher Education, Net Tuition Revenue, and Public FTE Net of Medical Enrollment by sector. We continually receive data requests for these elements and have tried to make collecting this information as simple as possible. Thank you for all the work you do to help us publish the Grapevine and SHEF reports!

State Higher Education Finance FY 2013
66
Page 1: American Reinvestment and Recovery Act of 2009 (ARRA) Funds Please report all ARRA funds received in this section. There is a place to report Education Stabilization Funds, Government Services Funds for public higher education operations, and Government Services Funds for capital improvements to higher education institutions, whether they are public or private. Please make sure that these funds are NOT included in your state support figures. In the reports, these funds will be reported separately AND added to state support figures. If you include these funds in the state support figures, they will be double counted. NOTE: ARRA funds were available for Fiscal Years 2009, 2010, and 2011. In some states, these funds may have been encumbered in their FY 2012. ARRA funds should not be reported in FY 2013. Data Elements collected in this section:
1. Education Stabilization Funds used to restore the level of state support for public higher education.
2. Government Services Funds used for public higher education excluding modernization, renovation, or repair.
3. Government Service Funds used for modernization, renovation, or repair of higher education institutions (public and private).
State Support for All Higher Education The intent of this section is to collect information about how much money the state provides to support higher education (excluding capital and debt service). Include:
sums appropriated for state aid to local public community colleges and for operation of state-supported community colleges, and for vocational-technical two-year colleges or institutes that are predominantly for high school graduates and adult students;
sums appropriated to statewide coordinating boards or governing boards, either for board expenses or for allocation by the board to other institutions or both;
sums appropriated for state scholarships or other state-level student financial aid programs;
sums destined for higher education but designated to some other state agency (as in the case of funds intended for faculty fringe benefits that are appropriated to the state treasurer and disbursed by that office); and
appropriations directed to private institutions of higher education at all levels. Exclude:
sums for capital outlays and debt service; and
sums derived from federal sources, student fees, and auxiliary enterprises. ALL state funding for higher education (even those sums that are appropriated to other state agencies) should be reported in this section. Please DO NOT include any ARRA funds in this section. State Support for All Higher Education is calculated by adding state tax support, nontax support, non-appropriated support, endowment earnings, portions of multi-year appropriations from previous years, and other state support and SUBTRACTING from that sum appropriations that you expect will have to be returned to the state and appropriations in the current year for use in other years (in other words, any appropriated funds that are not usable in the fiscal year in which they are appropriated).

State Higher Education Finance FY 2013________________________________________________________________________
67
Data elements collected in this section:
1. Appropriations from state government taxes to institutions for operations and other higher education activities.
2. Funding under state auspices for appropriated nontax state support set aside by the state for higher education. These may include, but are not limited to, monies from lotteries (including lottery scholarships), tobacco settlement, or casinos, or other gaming sources.
3. Funding under state auspices for non-appropriated state support. These may include, but are not limited to, monies from receipt of lease income, cattle-grazing rights fees, and oil/mineral extraction fees on land set aside by the state for higher education.
4. Interest or earnings received from state funded endowments set aside and pledged to public sector institutions.
5. Portions of multi-year appropriations from previous years. 6. Any other state funds not included above. Please explain in the comments box below. 7. Appropriations you expect will have to be returned to the state. 8. Portions of multi-year appropriations in the current year which are to be spread over other
years.
Page 2: Adjustments to State Support for Higher Education In this section, you are asked to identify sums of state support that do not fund directly or through student assistance the degree credit instruction, research, or services of public higher education. Any funds you report in this section should be included in your State Support for Higher Education figure from Page 1. The sums reported in this section will be subtracted from State Support for Higher Education to calculate State Support for Public Higher Education. Data elements collected in this section:
1. State funding for students in continuing or adult education courses (non-credit) and non-credit extension courses which are not part of a regular program leading to a degree or certificate.
2. Sums to independent (private) institutions for operating expenses. 3. Allocation of state appropriations for student financial aid grants awarded to students attending
state independent (private) institutions. Include dollars intended solely for students attending independent institutions and the independent sector’s portion of state aid programs. Estimate if needed.
4. Allocation of appropriations for student financial aid grants awarded to students attending out-of-state institutions (estimate if needed).
Additional Funding Sources The sums collected in this section are for informational purposes only. None of the sums reported in this section should be included in the sums reported in any of the previous sections. Data elements collected in this section:
1. State appropriated funds derived from federal sources. 2. Tuition charges collected by the institutions and remitted to the state as an offset to the state
appropriations. 3. Sums to independent (private) institutions for capital outlay (new construction and debt
service/retirement).

State Higher Education Finance FY 2013
68
Page 3: Local Appropriations Appropriations should reflect your best estimate, at the time of reporting, of amounts actually provided to institutions and expected to be provided during the fiscal year. For analytical purposes, we will assume that local appropriations support two-year institutions, please note in the comments section if local appropriations support four-year or research institutions. Data elements collected in this section:
1. Local Appropriations: From local government taxes to institutions for operating expenses.
Research-Agriculture-Medical (RAM) Appropriations to Public Institutions of Higher Education As a component of total state and local appropriations, report collectively the appropriations intended for the direct operations of research, agriculture and health care public services, and medical schools. Exclude the indirect costs. Do not include discretionary use by faculty of unrestricted appropriations supplemented by other revenues for short-term research primarily performed as an adjunct component of instruction (departmental research of an unsponsored nature). When unknown, appropriations for sponsored research should be estimated equal to total research expenditures less state grants and contracts for research and federal and private revenues restricted for research. Assume no tuition revenues are used for research. These funds SHOULD be included in your State Support for All Higher Education figures. Data elements collected in this section:
1. Appropriated sums for research centers, laboratories, and institutes, and appropriated sums separately budgeted by institutions for organized research. Generally, these are ongoing programs. Include all health and science research.
2. Appropriated sums for agricultural experiment stations and cooperative extension services. 3. Appropriated sums for teaching or affiliated hospital operations and public service patient care.
Include all medical, dental, veterinary, optometry, pharmacy, mental health, nursing, and other health science institutes, clinics, laboratories, dispensaries, etc. primarily serving the public.
4. Appropriated sums for the direct operation and administrative support of the four major types of medical schools (medicine, dentistry, veterinary medicine, and osteopathic medicine) and centers corresponding to the medical enrollments reported on Page 4.
Public Institution Tuition Revenue In this section, you are asked to supply information about tuition revenues. One of the intents of this section is to calculate “Net Tuition Revenue,” which is used in the SHEF report as a measure of how much revenue institutions have to spend that is paid by students. “Net Tuition Revenue” is “Gross Tuition and Fees” less state funded student aid, institutional discounts and waivers, and tuition revenue paid by medical students.

State Higher Education Finance FY 2013________________________________________________________________________
69
Data elements collected in this section:
1. Gross Tuition plus Mandatory “Education and General” Fees (public institutions). 2. Tuition and Fees waived or discounted by public institutions (If you enter “0,” please provide
additional information in the comments box explaining why it is “0” for your state). (Will be subtracted.)
3. State appropriated student aid for Tuition and Mandatory Fees for public institutions. (Will be subtracted.)
4. Tuition and Mandatory Fees paid by public Medical Students. (Will be subtracted.) 5. Public institution tuition and fees used for capital debt service/retirement and capital
improvement other than that paid by user students for auxiliary enterprise debt service.
Page 4: Annual FTE at Public Institutions To calculate annual FTE, determine the total number of degree credit hours* (including summer sessions) and apply the following conversion factors: • 30 semester or 45 quarter undergraduate credit hours/year = 1 annual FTE student • 24 semester or 36 quarter graduate credit hours/year = 1 annual FTE student These conversion factors are based on 15 undergraduate and 12 graduate credit hours per semester or quarter. To calculate annual FTE for non-degree credit* vocational-technical, remedial and other program enrollments at two-year community colleges and state approved area vocational-technical institutes in courses which result in some form of certificate or other formal recognition, determine the total yearly number of contact hours and apply the following conversion factor: • 900 contact hours/year = 1 annual FTE student This conversion factor is based on a normal load of 25 contact hours per week for 36 weeks. * Credits counted in the FTE calculation, for purposes of SHEF, include credits that are state funded and could potentially lead to a degree. Data elements collected in this section:
1. FTE calculated from course work creditable for a degree (including all health science and medical school enrollment) plus course work in a vocational or technical program normally terminal and results in a certificate or some other formal recognition.
2. Enrollment in schools of medicine, dentistry, veterinary medicine, and osteopathic medicine (hereafter referred to as medical schools).

State Higher Education Finance FY 2013
70
Page 5: This page is a verification page. These are the figures you will see in the SHEF report and are presented in adjusted and unadjusted formats. Please review for accuracy. Page 6: On this page, you are asked to break certain data elements down by sector. Please complete this section to the best of your ability.

State Higher Education Executive Officers3035 Center Green Drive, Suite 100, Boulder, Colorado, 80301
(303) 541-1600www.sheeo.org
Sta
te H
igher E
ducatio
n f
inance F
Y 2
013