Embed Size (px)
Citation preview

STATE OF CALIFORNIA
STATE BOARD OF EQUALIZATION PROPERTY AND SPECIAL TAXES DEPARTMENT 450 N STREET, SACRAMENTO, CALIFORNIA PO BOX 942879, SACRAMENTO, CALIFORNIA 94279-0064 916 445-4982 FAX 916 323-8765 www.boe.ca.gov
November 19, 2008 TO COUNTY ASSESSORS: No. 2008/065
ASSESSORS' HANDBOOK SECTION 581, EQUIPMENT INDEX AND PERCENT GOOD FACTORS
Enclosed is the 2009 revision of Assessors' Handbook Section 581, Equipment Index and Percent Good Factors (AH 581), which was approved by the Board on November 13, 2008. This annual revision includes updates to the equipment index and percent good factors tables. All information is for use as of the 2009 lien date, January 1, 2009. Also included are valuation factors for computers, semiconductor manufacturing equipment and fixtures, and biopharmaceutical industry equipment and fixtures. The valuation factors for semiconductor manufacturing equipment and fixtures (approved by the Board in October 2008) and the valuation factors for biopharmaceutical industry equipment and fixtures (approved by the Board in July 2008) are a result of recently completed valuation studies. This revision also includes the recently adopted guidelines for conducting valuation studies, which industry will use to request future property tax valuation factor studies. The guidelines were developed to provide guidance to industry in identifying, gathering, and verifying data to submit to Board staff for the purpose of conducting a valuation study of their personal property/equipment. AH 581 is posted on the Board's website at www.boe.ca.gov/proptaxes/prioryrs.htm. If you have questions regarding this publication, you may contact Mrs. Ladeena Ford at 916-445-0208 or at [email protected]. Sincerely, /s/ Mickie Stuckey for David J. Gau Deputy Director Property and Special Taxes Department DJG:lf Enclosures
BETTY T. YEE First District, San Francisco
BILL LEONARD
Second District, Ontario/Sacramento
MICHELLE STEEL Third District, Rolling Hills Estates
JUDY CHU, Ph.D.
Fourth District, Los Angeles
JOHN CHIANG State Controller
RAMON J. HIRSIG Executive Director

ASSESSORS' HANDBOOK SECTION 581
EQUIPMENT INDEX AND PERCENT GOOD FACTORS
JANUARY 2009
(USE FOR LIEN DATE JANUARY 1, 2009)
CALIFORNIA STATE BOARD OF EQUALIZATION BETTY T. YEE, SAN FRANCISCO FIRST DISTRICT BILL LEONARD, ONTARIO/SACRAMENTO SECOND DISTRICT MICHELLE STEEL, ROLLING HILLS ESTATES THIRD DISTRICT JUDY CHU, PH.D., LOS ANGELES FOURTH DISTRICT JOHN CHIANG, SACRAMENTO STATE CONTROLLER
RAMON J. HIRSIG, EXECUTIVE DIRECTOR

AH 581 January 2009 i
FOREWORD
This handbook section contains several tables of equipment index, percent good, and valuation factors that will aid in the mass appraisal of various types of personal property and fixtures. General instructions and pertinent information regarding the use of these tables are included in Chapters 1, 2, and 3. The tables are presented in Chapter 4.
Starting with the 2002 lien date, the commercial equipment index factors and the industrial equipment index factors in Tables 1 and 2 have been averaged into a single category of factors for each table. Use of a single category of factors for commercial equipment and a single category of factors for industrial equipment will provide value estimates within a reasonable band of value for the assessment of business property and promote statewide uniformity.
Prior to approval by the Board of this handbook section for 2002, staff researched the issue of whether the use of the index factors in Tables 1, 2, and 3 results in an estimate of replacement cost new or reproduction cost new. Board staff contacted representatives from the publications used to derive the index factors (Marshall & Swift/Boeckh, LLC and the U. S. Bureau of Labor Statistics) while investigating this issue. From the responses, staff concluded that application of the index factors in this handbook section to a property's original cost typically results in reproduction cost new.
Index factors (Tables 1, 2, and 3) may be used to estimate current reproduction costs. Table 1, Commercial Equipment Index Factors, was compiled based on equipment price data published by the Marshall & Swift/Boeckh, LLC, Marshall Valuation Service. Table 2, Industrial Machinery and Equipment Index Factors, and Table 3, Agricultural and Construction Equipment Index Factors, were derived using the Bureau of Labor Statistics' Producer Price Indexes as a basis. A discussion regarding the use of these factors can be found in Chapter 1.
Percent good factors (Tables 4 and 5) may be used in conjunction with the index factors to estimate reproduction cost new less normal depreciation. Table 4, Machinery and Equipment Percent Good Factors, was derived from a system developed by the Iowa State University Engineering Research Center. (See Chapter 2 for more information.) Table 5, Construction Mobile Equipment Percent Good Factors, and Table 6, Agricultural Mobile Equipment Percent Good Factors, were derived from a detailed analysis of used equipment sales data.
For construction mobile equipment and agricultural mobile equipment, we suggest using the comparative sales approach if possible. Several valuation guides are available for this purpose (see Chapter 7). If the valuation guides are not used, the cost approach can be employed. The appropriate index factor from Table 3 should be applied to the equipment cost along with a percent good factor from Table 5 for construction mobile equipment, and the appropriate index factor from Table 3 should be applied to the equipment cost along with a percent good factor from Table 6 for agricultural mobile equipment.

AH 581 January 2009 ii
Valuation factors (Tables 7, 8, and 9) are intended to be applied directly to historical costs. The valuation factors in Table 7, Computer Valuation Factors, were developed by analyzing resale values of personal, mid-range, and mainframe computers as compared to original costs. The Board initially approved these factors in 1996. The valuation factors for semiconductor manufacturing equipment and fixtures, Table 8, were approved by the Board in October 2008. The valuation factors for biopharmaceutical industry equipment and fixtures, Table 9, were adopted by the Board in July 2008.
All of the information presented in this section of the Assessors' Handbook is current for use as of the 2009 lien date, January 1, 2009. We hope the information presented proves useful to all concerned parties, and that it promotes uniformity of assessment. The tables are intended for use in the mass appraisal of equipment and fixtures when determining market value for taxation purposes. However, relevant data pertinent to the assessment of specific property should always be reviewed and considered.
/s/ David J. Gau
David J. Gau Deputy Director Property and Special Taxes Department California State Board of Equalization January 2009

AH 581 January 2009 iii
TABLE OF CONTENTS
CHAPTER 1: USE OF EQUIPMENT INDEX FACTORS.......................................................1 PRICE CHANGES................................................................................................................................1 COMMERCIAL EQUIPMENT INDEX FACTORS .....................................................................................2 INDUSTRIAL EQUIPMENT INDEX FACTORS ........................................................................................3 MAXIMUM RECOMMENDED EQUIPMENT INDEX FACTOR ..................................................................4 SUMMARY.........................................................................................................................................5
CHAPTER 2: USE OF EQUIPMENT PERCENT GOOD FACTORS ...................................6 MACHINERY AND EQUIPMENT PERCENT GOOD FACTORS .................................................................6 CONSTRUCTION AND AGRICULTURAL MOBILE EQUIPMENT PERCENT GOOD FACTORS....................7
CHAPTER 3: USE OF VALUATION FACTORS...................................................................11 COMPUTER VALUATION FACTORS ..................................................................................................11 SEMICONDUCTOR MANUFACTURING EQUIPMENT AND FIXTURE VALUATION FACTORS .................12 BIOPHARMACEUTICAL INDUSTRY EQUIPMENT AND FIXTURES VALUATION FACTORS ....................13
CHAPTER 4: EQUIPMENT INDEX FACTORS, PERCENT GOOD FACTORS, AND VALUATION FACTORS TABLES ..........................................................................................14 TABLE 1: COMMERCIAL EQUIPMENT INDEX FACTORS ....................................................................16 TABLE 2: INDUSTRIAL MACHINERY AND EQUIPMENT INDEX FACTORS ..........................................17 TABLE 3: AGRICULTURAL AND CONSTRUCTION EQUIPMENT INDEX FACTORS ...............................18 TABLE 4: MACHINERY AND EQUIPMENT PERCENT GOOD FACTORS................................................19 TABLE 5: CONSTRUCTION MOBILE EQUIPMENT PERCENT GOOD FACTORS ....................................20 TABLE 6: AGRICULTURAL MOBILE EQUIPMENT PERCENT GOOD FACTORS ....................................21 TABLE 7: COMPUTER VALUATION FACTORS...................................................................................22 TABLE 8: SEMICONDUCTOR MANUFACTURING EQUIPMENT & FIXTURES VALUATION FACTORS....23 TABLE 9: BIOPHARMACEUTICAL INDUSTRY EQUIPMENT & FIXTURES VALUATION FACTORS ........26
CHAPTER 5: CLASS INFORMATION...................................................................................29 COMMERCIAL CLASSES CONTAINED IN AVERAGE INDEX (TABLE 1) ..............................................29 INDUSTRY CLASSES CONTAINED IN AVERAGE INDEX (TABLE 2) ....................................................30 DESCRIPTION OF INDUSTRY CLASSES..............................................................................................31
CHAPTER 6: CLASSIFICATION OF IMPROVEMENTS AS STRUCTURE ITEMS OR FIXTURES ...................................................................................................................................34
CHAPTER 7: VALUATION GUIDES......................................................................................39
CHAPTER 8: VALUATION FACTOR STUDIES ..................................................................40 OVERVIEW ......................................................................................................................................40 MARKET DATA ...............................................................................................................................41 CONFIDENTIALITY OF DATA ...........................................................................................................42 INDUSTRY GROUP STUDIES.............................................................................................................42
Market Data for Group Studies .................................................................................................42 Accounting Records for Economic Lifing Study ........................................................................43

AH 581 January 2009 iv
ASSET SPECIFIC STUDIES ................................................................................................................44 Market Data for Asset Specific Studies......................................................................................44 Accounting Records for Economic Lifing Study ........................................................................44
VERIFICATION OF DATA..................................................................................................................44 Accounting Records ...................................................................................................................44 Market Data ...............................................................................................................................45
TIMELINE FOR SUBMITTING DATA ..................................................................................................45 PETITION.........................................................................................................................................45

Chapter 1
AH 581 1 January 2009
CHAPTER 1: USE OF EQUIPMENT INDEX FACTORS Equipment index factors are developed for use in mass appraisals and are generally reliable and practical for converting original cost to estimates of reproduction cost or replacement cost new. Index factors are used to adjust a property's original cost for price level changes since the property was acquired. The index factors recommended by the Board, updated and distributed annually, include three separate index factor tables: Table 1, Commercial Equipment; Table 2, Industrial Equipment; and Table 3, Agricultural and Construction Equipment. The tables rely on indexes published by the U.S. Government Bureau of Labor Statistics (BLS) and on information published by Marshall & Swift/Boeckh, LLC (Marshall & Swift). The BLS and Marshall & Swift have indicated to Board staff that their indexes attempt to track price changes for an identical product sold under identical terms over time, such that the indexes approximate an estimate of reproduction cost new. Thus, when the original cost of property is multiplied by the Board's index factor for the year of acquisition, the product typically approximates current reproduction cost new.
In situations where equipment has undergone minimal changes in technology, reproduction cost and replacement cost are likely to be similar. In industries where the equipment used is undergoing rapid changes in technology, further adjustments are likely to be needed to arrive at replacement cost new. Thus, there may be situations where market evidence supports the need to make adjustments to reproduction cost to account for functional obsolescence before the percent good factors from Table 4 can be applied when determining market value for taxation purposes. Any such adjustments should be based on reasonable evidence and appropriate adjustments should be made to arrive at replacement cost new. Assessors should consider such evidence provided by assessees when making these adjustments.
Please refer to Assessors' Handbook Section 504, Assessment of Personal Property and Fixtures, for guidelines on the use of reproduction and replacement costs in the appraisal process.
PRICE CHANGES
Price changes are usually an increasing factor (inflation). During those periods of time when the cost of raw material and/or labor actually declines, price changes may be a decreasing factor (deflation).
Effects of Technological Progress
If technological progress has occurred since the acquisition date of an asset, the cost of producing a functionally superior but physically similar asset may now be lower. Consequently, the current replacement cost new of previously existing assets will probably decline. High technology equipment, for example, typically suffers greater than normal functional obsolescence due to technological progress.

Chapter 1
AH 581 2 January 2009
COMMERCIAL EQUIPMENT INDEX FACTORS
Indexes for commercial equipment are supplied in Chapter 4, Table 1, Commercial Equipment Index Factors. If the index factors do not reasonably represent changes in equipment costs for a particular industry, additional research should be done to find a more appropriate method of estimating replacement cost new.
The following example demonstrates how to use the index factors to estimate reproduction cost new.
Example 1.1: Estimating Reproduction Cost New Using Commercial Equipment Index Factors
A taxpayer acquired office equipment for $1,000 in 2005. What is the estimated reproduction cost new of this office equipment as of the January 1, 2009 lien date?
The appropriate factor is found in Table 1 under the Average column for 2005.
TABLE 1: COMMERCIAL EQUIPMENT INDEX FACTORS
Year Average 2008 100 2007 104 2006 109 2005 113
The factor is shown in the table as a percentage and must be converted to a decimal (1.13). The factor in decimal format is applied to the acquisition cost to compute the reproduction cost new.
Year of Acquisition
Cost
Index Factor
Reproduction Cost New
2005 $1,000 1.13 $1,130
In other words, it would require an expenditure of approximately $1,130 on the 2009 lien date to reproduce the office equipment purchased in 2005 for $1,000.

Chapter 1
AH 581 3 January 2009
INDUSTRIAL EQUIPMENT INDEX FACTORS
The indexes for industrial equipment are supplied in Chapter 4, Table 2, Industrial Machinery and Equipment Index Factors. Chapter 5 of this handbook contains a listing of industry classes that are represented by these indexes. A detailed description of each industry class follows in Chapter 5.
The following example demonstrates the use of the index factors to compute reproduction cost new.
Example 1.2: Estimating Reproduction Cost New Using Industrial Machinery and Equipment Index Factors
On the 2009 lien date, what is the reproduction cost new for rubber tire manufacturing equipment acquired for $100,000 in 2005?
The appropriate index factor is found in Table 2 under the column across from the year of acquisition, 2005.
TABLE 2: INDUSTRIAL MACHINERY AND EQUIPMENT INDEX FACTORS
Year Average 2008 100 2007 105 2006 108 2005 111
The appropriate index factor of 111 percent is converted to a decimal (1.11) and multiplied by the acquisition cost as follows:
Year of Acquisition
Cost
Index Factor
Reproduction Cost New
2005 $100,000 1.11 $111,000
In other words, it would require an expenditure of approximately $111,000 on the 2009 lien date to reproduce the rubber tire manufacturing equipment acquired in 2005 for $100,000.

Chapter 1
AH 581 4 January 2009
MAXIMUM RECOMMENDED EQUIPMENT INDEX FACTOR
Because rapid technological changes have taken place in recent years, Board staff recommends that appraisers use a maximum equipment index factor when valuing equipment. The recommended maximum factor is the factor for an age equal to 125 percent of the estimated average service life. The following example demonstrates the use of the 125 percent maximum.
Example 1.3: Estimating the Maximum Recommended Equipment Index Factor
• A taxpayer acquired warehouse equipment for $15,000 in 1991. What is the maximum recommended equipment index factor if this equipment has a 12 year average service life?
• Average service life of 12 years multiplied by the recommended 125 percent maximum equals 15 years (12 x 1.25 = 15) recommended maximum.
• Since the recommended maximum is 15 years, the appropriate index factor is the index factor corresponding to an item acquired in 1994 (2009 - 15). The index factor is 141 percent.
• Actual age of equipment on 2009 lien date is 18 years (2009 - 1991 = 18). Without using the recommended maximum, the index factor for 1991 is 150 percent.
• TABLE 1: COMMERCIAL EQUIPMENT INDEX FACTORS
Year Average 2008 100 2007 104 2006 109
1994 141 1993 145 1992 148 1991 150
The following table indicates the estimated reproduction cost new of the property using the maximum recommended index factor (1.41) and the index factor using the actual age (1.50). Application of the maximum recommended index factor results with an estimated reproduction cost new of $21,150 to reproduce the warehouse equipment purchased in 1991 for $15,000. Application of the index factor associated with the actual age of the property results with an estimated reproduction cost new of $22,500 to replace the warehouse equipment purchased in 1991 for $15,000. The example illustrates the difference in the estimate of reproduction cost new when the recommended maximum is not used.

Chapter 1
AH 581 5 January 2009
Example 1.3 -- continued
Year of Acquisition
Cost
Index Factor
Reproduction Cost New
Maximum 19941 $15,000 1.41 $21,150
Actual 1991 $15,000 1.50 $22,500
Use of the 125 percent limit is a recommendation. It is not intended to replace appraiser judgment. If the appraiser believes that using the 125 percent limit is inappropriate, the appraiser should provide a well-supported explanation of the reason for deviating from the recommendation.
SUMMARY
Examples 1.1, 1.2, and 1.3 illustrate the use of Tables 1 and 2. Table 3, Agricultural and Construction Equipment Index Factors, is used in the same manner. (See Chapter 2, Examples 2.2 and 2.3, for complete examples related to agricultural and construction equipment.)
Although this handbook section contains appropriate index factors for many types of taxable equipment found in California, better information is available from other sources in many cases. In situations where equipment has undergone minimal changes in technology, reproduction cost and replacement cost are likely to be similar. In industries where the equipment used is undergoing rapid changes in technology, it may be more appropriate to use actual current replacement prices for some types of equipment. Actual current replacement prices are nearly always better indicators of replacement value than indexed acquisition costs. Where actual current replacement prices are not available, the assessor should make adjustments to account for functional obsolescence based on reasonable evidence available.
As discussed in this chapter, the index factor is used to convert acquisition cost to an estimate of reproduction cost new. The next chapter discusses the use of percent good factors and tables. The percent good factor converts the reproduction cost new to reproduction cost new less normal depreciation.
1 Actual year of acquisition is 1991. The year 1994 represents the recommended maximum.

Chapter 2
AH 581 6 January 2009
CHAPTER 2: USE OF EQUIPMENT PERCENT GOOD FACTORS
MACHINERY AND EQUIPMENT PERCENT GOOD FACTORS
Table 4, Machinery and Equipment Percent Good Factors, presented in Chapter 4, is designed to assist the appraiser in estimating reproduction cost new less normal depreciation of commercial and industrial equipment in conjunction with index factors as discussed in Chapter 1.2 This table was derived using the "individual method" of computation. The rationale and the mathematics of the methods of computation are explained in Assessors' Handbook Section 582, Explanation of the Derivation of Equipment Percent Good Factors.
The rate of return used to compute the factors shown in Table 4 is calculated annually and is shown at the top of the table. The column headings represent the average service life expectancy of the equipment under consideration. Each column contains the percent good factor for the corresponding age.3 No minimum percent good factor is intended in this table. If the assessor utilizes a minimum percent good factor, it must be determined in a supportable manner.4
Example 2.1 carries forward the calculation shown in Chapter 1, Example 1.1, to illustrate use of the percent good factors found in Table 4.
Example 2.1: Estimating Reproduction Cost New Less Normal Depreciation
Continuing with the facts from Example 1.1, what is the reproduction cost new less normal depreciation on the 2009 lien date for office equipment purchased in 2005 at an acquisition cost of $1,000?
• Facts derived in Example 1.1: Index factor 1.13, reproduction cost new $1,130.
• Appraiser estimates average service life of 12 years.
• The appropriate percent good factor (73 percent) can be found in the 12 year life column at year 2005, in Table 4.
TABLE 4: MACHINERY AND EQUIPMENT PERCENT GOOD FACTORS INDIVIDUAL PROPERTIES—AVERAGE SERVICE LIFE
7% Rate of Return Year
Acquired
AGE 5
Years 10
Years 12
Years 15
Years
AGE Year
Acquired 2008 1 81 92 94 95 1 2008 2007 2 62 83 87 91 2 2007 2006 3 45 75 80 86 3 2006 2005 4 30 66 73 80 4 2005
2 Separate percent good tables are provided for construction mobile equipment (Table 5) and agricultural mobile equipment (Table 6). 3 Life expectancies are derived from the R-3 survivor curve. 4 Revenue and Taxation Code section 401.16(b). All section references in this section of the handbook refer to Revenue and Taxation Code sections unless otherwise noted.

Chapter 2
AH 581 7 January 2009
Example 2.1 -- continued
The percent good factor is applied to the reproduction cost new to compute the reproduction cost new less normal depreciation. (The factor, in Table 4, is shown as a percentage and must be converted to a decimal in order to do the computation.)
Year of
Acquisition
Cost
Index Factor
Reproduction
Cost New
Percent Good
Reproduction Cost Less Normal Depreciation
2005 $1,000 1.13 $1,130 .73 $825
To reiterate, applying the index factor and the percent good factor to office equipment purchased in 2005 for $1,000 results in an estimated value of $825 on lien date January 1, 2009. It is important to note that the percent good factor reflects only normal depreciation. Additional value adjustments may be necessary if the property has experienced above- or below-normal loss in value.
CONSTRUCTION AND AGRICULTURAL MOBILE EQUIPMENT PERCENT GOOD FACTORS
The percent good factors provided in Table 5 and Table 6, Chapter 4, are used when determining the loss of value for construction mobile equipment and agricultural mobile equipment, respectively. The factors presented were derived from used equipment sales data. Table 5 identifies a pattern of depreciation for construction mobile equipment, and Table 6 identifies a pattern of depreciation for two groups of equipment: (1) agricultural mobile equipment - except harvesters, and (2) agricultural mobile equipment - harvesters.
Within each group, three columns of percent good figures ("new," "used," and "average") are listed. The column labeled "new" should be used to measure depreciation if the subject property was acquired new; conversely, the column labeled "used" should be applied when the equipment was purchased used. In cases where the taxpayer does not indicate if the property was first acquired new or first acquired used, Tables 5 and 6 provide an average of the new and used factors. The assessor may not average the "new" and "used" factors unless the taxpayer does not indicate if the property was first acquired new or first acquired used.5
The following examples demonstrate the use of the construction index and percent good factors found in Table 3 and Table 5 respectively.
5 Section 401.16.

Chapter 2
AH 581 8 January 2009
Example 2.2: Estimating Reproduction Cost New Less Normal Depreciation for Construction Mobile Equipment Acquired New
On the 2009 lien date, what is the assessable value of a construction motor grader acquired new in 2005 for $100,000?
The first step is determining the appropriate index factor. As indicated below, the index factor is 110. The factor is shown in the table as a percentage and must be converted to a decimal (1.10).
TABLE 3: AGRICULTURAL AND CONSTRUCTION EQUIPMENT INDEX FACTORS
YEAR Agricultural Construction
2008 100 100 2007 105 103 2006 108 106 2005 111 110
The second step is determining the appropriate percent good factor. The percent good factor indicated below for construction mobile equipment purchased new in 2005 is 55 percent.
TABLE 5: CONSTRUCTION MOBILE EQUIPMENT PERCENT GOOD FACTORS
CONSTRUCTION MOBILE EQUIPMENT
Year Acquired
Age
New
Used
Average
2008 1 74 91 83 2007 2 66 81 74 2006 3 60 74 67 2005 4 55 68 62
The third step is to apply the factors to the acquisition cost of the construction mobile equipment to determine the reproduction cost new less normal depreciation, or estimated value.
Equipment Group
Year of Acquisition
Cost
Index Factor
Reproduction Cost New
Percent Good
Reproduction Cost Less Normal
DepreciationConstruction 2005 $100,000 1.10 $110,000 .55 $60,500
In other words, the estimated value of construction equipment acquired new in 2005 at an acquisition cost of $100,000 is $60,500 on lien date January 1, 2009.

Chapter 2
AH 581 9 January 2009
Example 2.3: Estimating Reproduction Cost New Less Normal Depreciation for Construction Mobile Equipment Acquired Used
What is the estimated value of a construction motor grader acquired used in 2005 for $100,000?
As in Example 2.2, the first step is determining the appropriate index factor. As indicated below, the index factor is 110, which is converted to a decimal (1.10).
TABLE 3: AGRICULTURAL AND CONSTRUCTION EQUIPMENT INDEX FACTORS
YEAR Agricultural Construction
2008 100 100 2007 105 103 2006 108 106 2005 111 110
The second step is determining the appropriate percent good factor. The percent good factor indicated below for construction mobile equipment purchased used in 2005 is 68 percent.
TABLE 5: CONSTRUCTION MOBILE EQUIPMENT PERCENT GOOD FACTORS
CONSTRUCTION MOBILE EQUIPMENT Year
Acquired
Age New Used Average
2008 1 74 91 83 2007 2 66 81 74 2006 3 60 74 67 2005 4 55 68 62
The third step is to apply the factors to the acquisition cost of the used construction equipment, to determine the reproduction cost new less normal depreciation, or estimated value.
Equipment Group
Year of Acquisition
Cost
Index Factor
Reproduction Cost New
Percent Good
Reproduction Cost Less Normal
DepreciationConstruction 2005 $100,000 1.10 $110,000 .68 $74,800

Chapter 2
AH 581 10 January 2009
In other words, the estimated value of construction equipment acquired used in 2005 at an acquisition cost of $100,000 is $74,800 on lien date January 1, 2009.
For construction mobile equipment and agricultural mobile equipment, where "new" or "used" status cannot be determined from appraisal data at hand, Tables 5 and 6 provide an average of the new and used factors.6
6 The "average" factors may not be used by the assessor unless the taxpayer does not indicate if the property was first acquired new or first acquired used, as specified in section 401.16(a).

Chapter 3
AH 581 11 January 2009
CHAPTER 3: USE OF VALUATION FACTORS
COMPUTER VALUATION FACTORS
Computer valuation tables were originally developed by the Board in 1995 and amended in 1997. The factors were developed by analyzing resale values of personal, mid-range, and mainframe computers as compared to original costs. These factors, provided in Table 7, Chapter 4, are intended to be applied directly to historical costs. As such, the tables include the effects of price changes (index or trend) and depreciation. Before using these tables, it is critically important to understand what types of equipment are intended to be valued using the tables.
First, the tables are intended to apply to non-production computers. Non-production computers are computers, including related equipment, designed for general business purposes. Non-production computers can be mainframe, mid-range, or personal computers (including networked personal computers). Related equipment includes monitors, printers, scanners, disk drives, cables, and other electronic peripherals commonly used as part of a non-production computer system.
The definition of non-production computers does not include computers embedded in machinery nor does it include equipment or computers specifically designed for use in any other application directly related to manufacturing. For example, equipment used for the manufacture of computers, semiconductors, or other computer components are production computers; therefore, the computer valuation factors are not appropriate for the valuation of such equipment. The following example demonstrates the use of the computer valuation factors.
Example 3.1: Estimating Replacement Cost New Less Normal Depreciation Using Valuation Factors
On the 2009 lien date, what is the estimated value of a mainframe computer acquired in 2006 for $525,000?
The first step is determining the valuation factor. As shown on the table below, the valuation factor is 35 percent.
TABLE 7: COMPUTER VALUATION FACTORS
Year
Acquired
Age
PERSONAL COMPUTERS
($25,000 or less)
MID-RANGE COMPUTERS
($25,000.01 to $500,000)
MAINFRAME COMPUTERS
($500,000.01 or more) 2008 1 66 73 79 2007 2 39 47 54 2006 3 24 30 35

Chapter 3
AH 581 12 January 2009
Example 3.1 -- continued
Since the valuation factor includes the effect of price changes (index or trend) and depreciation, the second step is to apply the valuation factor to the acquisition cost of the mainframe computer equipment.
Equipment
Group
Year of
Acquisition
Cost
Valuation Factor
Replacement Cost Less Normal Depreciation
Mainframe Computers
2006 $525,000 .35 $183,750
The replacement cost new less normal depreciation of mainframe computer equipment purchased in 2006 for $525,000 is $183,750 on lien date January 1, 2009.
SEMICONDUCTOR MANUFACTURING EQUIPMENT AND FIXTURE VALUATION FACTORS
The Semiconductor Manufacturing Equipment and Fixture Valuation table (Chapter 4, Table 8) was approved by the Board on October 1, 2008. Similar to the computer valuation factors, the semiconductor manufacturing equipment and fixture valuation factors are intended to be applied directly to historical costs. As shown in the example demonstrating the use of computer valuation factors (Example 3.1), only one factor is applied to the acquisition cost to determine the replacement cost new less normal depreciation.
The semiconductor machinery and equipment valuation factors are based on a 6-year economic life untrended. A minimum percent good factor of 8 percent applies to machinery and equipment. The semiconductor fixtures valuation factors are based on a 10-year economic life trended. A minimum percent good factor of 10 percent applies to the fixtures. The valuation factors include the minimum percent good and the trending.
DEFINITION
Semiconductor manufacturing equipment consists of (1) manufacturing equipment used in a clean room for the fabrication of semiconductor chips; (2) test equipment used in the manufacturing and research and development environment and to test semiconductor manufacturing equipment; and (3) fixtures in place to support a semiconductor fabrication facility. This definition is not limited by the size of a semiconductor facility or the technology of the chips produced.

Chapter 3
AH 581 13 January 2009
BIOPHARMACEUTICAL INDUSTRY EQUIPMENT AND FIXTURES VALUATION FACTORS
The valuation factor table pertaining to the assessment of specific property owned and/or used by the biopharmaceutical industry was adopted by the Board in July 2008, and became effective as of the lien date January 1, 2009. For mass appraisal purposes, these factors are intended to be applied directly to the historical costs of property for each category.
DEFINITION
Biopharmaceutical Industry Equipment and Fixtures consist of equipment and fixtures utilized in connection with, or in support of, research and/or manufacturing activities that use organisms, or materials derived from organisms, their cellular, subcellular, or molecular components, to discover and/or provide products for human or animal therapeutics, diagnostics, and/or vaccines.

Chapter 4
AH 581 14 January 2009
CHAPTER 4: EQUIPMENT INDEX FACTORS, PERCENT GOOD FACTORS, AND VALUATION FACTORS TABLES
(Use for Lien Date January 1, 2009)
INDEX FACTOR TABLES
Table 1: Commercial Equipment Index Factors
These factors are derived using data published by the Marshall & Swift Boeckh, LLC, Marshall Valuation Service. The indexes contained in Table 1 are an average of several classes of commercial equipment. See Chapter 5 for each class of equipment included in the average index.
Table 2: Industrial Machinery and Equipment Index Factors
These indexes are derived from data in the Bureau of Labor Statistics' Producer Price Indexes. The indexes contained in Table 2 are an average of several classes of industrial equipment. See Chapter 5 for detailed descriptions of each industry group in average index.
Table 3: Agricultural and Construction Equipment Index Factors
These indexes are derived from data in the Bureau of Labor Statistics' Producer Price Indexes.
PERCENT GOOD FACTOR TABLES
Table 4: Machinery and Equipment Percent Good Factors
These factors are derived from a system developed by the Iowa State University Engineering Research Center (see Assessors' Handbook Section 582). The rate of return used to compute these factors is calculated annually and is shown on the table.
Table 5: Construction Mobile Equipment Percent Good Factors
These factors were derived from a detailed analysis of used equipment sales data.
Table 6: Agricultural Mobile Equipment Percent Good Factors
These factors were derived from a detailed analysis of used equipment sales data.

Chapter 4
AH 581 15 January 2009
VALUATION FACTORS TABLES
Table 7: Computer Valuation Factors
These factors are intended to be applied directly to historical costs of non-production computers, including related equipment, designed for general business purposes.
Table 8: Semiconductor Manufacturing Equipment & Fixtures Valuation Factors
These factors are intended to be applied directly to historical costs of semiconductor manufacturing equipment and fixtures.
Table 9: Biopharmaceutical Industry Equipment & Fixtures Valuation Factors
These factors are intended to be applied directly to historical costs of specific property owned and/or used by the biopharmaceutical industry.

Chapter 4
AH 581 16 January 2009
TABLE 1: COMMERCIAL EQUIPMENT INDEX FACTORS
2008 COST = 100 Year Average 2008 1002007 1042006 1092005 1132004 1212003 1252002 1272001 1282000 1291999 1311998 1311997 1321996 1341995 1361994 1411993 1451992 1481991 1501990 1531989 1581988 1651987 1721986 1751985 1771984 1801983 1851982 1891981 1981980 2171979 2361978 2581977 2781976 2911975 3101974 3411973 3921972 4071971 4191970 4421969 469
This table is intended for use in the mass appraisal of equipment and fixtures when determining value for taxation purposes. However, relevant data pertinent to the assessment of a specific property should always be reviewed and considered.

Chapter 4
AH 581 17 January 2009
TABLE 2: INDUSTRIAL MACHINERY AND EQUIPMENT INDEX FACTORS
2008 COST = 100 Year Average 2008 1002007 1052006 1082005 1112004 1152003 1192002 1192001 1202000 1201999 1211998 1221997 1241996 1261995 1281994 1311993 1341992 1371991 1391990 1431989 1481988 1541987 1601986 1631985 1661984 1701983 1741982 1781981 1871980 2061979 2301978 2531977 2751976 2951975 3131974 3641973 4301972 4481971 4591970 478
This table is intended for use in the mass appraisal of equipment and fixtures when determining value for taxation purposes. However, relevant data pertinent to the assessment of a specific property should always be reviewed and considered.

Chapter 4
AH 581 18 January 2009
TABLE 3: AGRICULTURAL AND CONSTRUCTION EQUIPMENT INDEX FACTORS
2008 COST = 100 Year Agricultural Construction 2008 100 100 2007 105 103 2006 108 106 2005 111 110 2004 116 117 2003 120 121 2002 122 123 2001 124 124 2000 126 125 1999 127 126 1998 128 128 1997 130 130 1996 132 132 1995 135 135 1994 141 139 1993 145 140 1992 149 144 1991 154 148 1990 159 152 1989 164 158 1988 171 166 1987 176 170 1986 177 174 1985 178 176 1984 179 178 1983 184 181 1982 193 185 1981 208 198 1980 232 220 1979 259 249 1978 282 274 1977 304 298 1976 329 320 1975 356 344 1974 418 418 1973 477 487 1972 492 506 1971 511 523 1970 531 550
This table is intended for use in the mass appraisal of equipment and fixtures when determining value for taxation purposes. However, relevant data pertinent to the assessment of a specific property should always be reviewed and considered.

Chapter 4
AH 581 19 January 2009
TABLE 4: MACHINERY AND EQUIPMENT PERCENT GOOD FACTORS INDIVIDUAL PROPERTIES--AVERAGE SERVICE LIFE, 7 % Rate of Return
Year YearAcq'd AGE 3 4 5 6 7 8 9 10 11 12 13 14 15 17 18 20 22 25 30 35 40 AGE Acq'd2008 1 67 76 81 85 87 89 91 92 93 94 94 95 95 96 97 97 98 98 99 99 99 1 20082007 2 38 53 62 69 74 78 81 83 85 87 88 90 91 92 93 94 95 96 97 98 98 2 20072006 3 17 32 45 54 61 67 71 75 78 80 82 84 86 88 89 91 92 94 96 97 98 3 20062005 4 6 17 30 40 49 56 61 66 70 73 76 78 80 84 85 87 89 92 94 96 97 4 20052004 5 8 18 28 37 45 52 57 62 66 70 72 75 79 81 84 86 89 92 94 96 5 20042003 6 3 10 18 27 35 43 49 54 59 63 67 70 75 77 80 83 87 91 93 95 6 20032002 7 5 11 19 27 34 41 47 52 57 61 64 70 72 77 80 84 89 92 94 7 20022001 8 1 7 13 19 26 33 39 45 50 55 59 65 68 73 77 82 87 91 93 8 20012000 9 3 8 14 20 26 33 39 44 49 53 60 64 69 73 79 85 89 92 9 20001999 10 4 10 15 21 26 32 38 43 48 56 59 65 70 76 83 88 91 10 19991998 11 1 6 11 16 21 27 32 37 42 51 55 61 67 73 81 86 90 11 19981997 12 3 8 12 17 22 27 32 37 46 50 57 63 70 79 85 89 12 19971996 13 5 9 13 17 22 27 32 41 46 53 59 67 76 83 87 13 19961995 14 2 6 10 14 18 23 28 37 41 49 56 64 74 81 86 14 19951994 15 4 8 11 15 19 24 32 37 45 52 61 72 79 85 15 19941993 16 1 5 9 12 16 20 28 32 41 48 58 69 78 83 16 19931992 17 2 6 9 13 17 25 29 37 45 54 67 76 82 17 19921991 18 4 7 11 14 21 25 33 41 51 64 74 81 18 19911990 19 1 5 8 11 18 22 30 37 48 62 72 79 19 19901989 20 2 6 10 16 19 27 34 45 59 70 78 20 19891988 21 4 8 13 16 24 31 42 57 68 76 21 19881987 22 2 5 12 15 21 28 38 54 65 74 22 19871986 23 3 10 12 19 25 36 51 63 73 23 19861985 24 1 8 11 16 23 33 48 61 71 24 19851984 25 6 8 15 20 30 46 59 69 25 19841983 26 3 7 13 18 27 43 57 67 26 19831982 27 1 5 11 16 25 40 54 65 27 19821981 28 2 9 14 23 38 52 63 28 19811980 29 1 7 12 21 35 49 61 29 19801979 30 5 11 19 33 47 59 30 19791978 31 3 9 17 31 45 57 31 19781977 32 2 7 16 28 43 55 32 19771976 33 6 14 27 40 53 33 19761975 34 3 12 24 38 51 34 19751974 35 2 11 22 36 49 35 19741973 36 9 21 34 47 36 19731972 37 7 19 32 45 37 19721971 38 5 18 30 43 38 19711970 39 4 17 28 41 39 1970
NO MINIMUM PERCENT GOOD INTENDED
This table is intended for use in the mass appraisal of equipment and fixtures when determining value for taxation purposes. However, relevant data pertinent to the assessment of a specific property should always be reviewed and considered.

Chapter 4
AH 581 20 January 2009
TABLE 5: CONSTRUCTION MOBILE EQUIPMENT PERCENT GOOD FACTORS
CONSTRUCTION MOBILE EQUIPMENT Year Acquired Age New Used Average*
2008 1 74 91 83 2007 2 66 81 74 2006 3 60 74 67 2005 4 55 68 62 2004 5 51 62 57 2003 6 47 58 53 2002 7 42 52 47 2001 8 38 47 43 2000 9 35 43 39 1999 10 31 38 35 1998 11 28 34 31 1997 12 26 32 29 1996 13 24 29 27 1995 14 22 27 25 1994 15 20 25 23 1993 16 19 23 21 1992 17 16 20 18 1991 18 13 17 15 1990 19 12 13 13 1989 20 11 11 11 1988 21 9
NO MINIMUM PERCENT GOOD INTENDED
This table is intended for use in the mass appraisal of equipment when determining value for taxation purposes. However, relevant data pertinent to the assessment of a specific property should always be reviewed and considered.
USE OF TABLE 5 The percent good table is designed to assist the appraiser in determining total loss of value once reproduction cost new (RCN) has been determined for the captioned equipment. The table, derived from used equipment sales data, identifies a pattern of depreciation for construction mobile equipment. The column labeled "new" should be used to measure depreciation if the subject property was acquired new; conversely, the column labeled "used" should be applied when the equipment was purchased used. In cases where the taxpayer does not indicate if the property was first acquired new or first acquired used, Table 5 provides an average of the new and used factors. The "new" and "used" factors may not be averaged unless the taxpayer does not indicate if the property was first acquired new or first acquired used.7 *Starting with the 2005 lien date, average factors are provided to reflect the provisions of section 401.16 as to use of average percent good factors. 7 Section 401.16(a).

Chapter 4
AH 581 21 January 2009
TABLE 6: AGRICULTURAL MOBILE EQUIPMENT PERCENT GOOD FACTORS AGRICULTURAL MOBILE EQUIPMENT
EXCEPT HARVESTERS HARVESTERS Year
Acquired
Age New Used Average* New Used Average*
Age
2008 1 78 92 85 74 90 82 1 2007 2 70 82 76 64 78 71 2 2006 3 64 75 70 57 69 63 3 2005 4 58 68 63 50 60 55 4 2004 5 52 62 57 43 53 48 5 2003 6 47 56 52 38 46 42 6 2002 7 42 50 46 33 40 37 7 2001 8 38 45 42 29 35 32 8 2000 9 34 40 37 25 30 28 9 1999 10 30 36 33 21 26 24 10 1998 11 27 32 30 19 23 21 11 1997 12 25 30 28 17 21 19 12 1996 13 23 28 26 15 18 17 13 1995 14 22 26 24 16 14 1994 15 20 23 22 14 15 1993 16 18 21 20 14 16 1992 17 19 17 1991 18 17 18
NO MINIMUM PERCENT GOOD INTENDED
This table is intended for use in the mass appraisal of equipment when determining value for taxation purposes. However, relevant data pertinent to the assessment of a specific property should always be reviewed and considered.
USE OF TABLE 6
The percent good table is designed to assist the appraiser in determining total loss of value once reproduction cost new (RCN) has been determined for the captioned equipment.
The table, derived from used equipment sales data, identifies a pattern of depreciation for two groups of equipment. Within each group, three columns of percent good figures "new," "used," and "average" are listed. The column labeled "new" should be used to measure depreciation if the subject property was acquired new; conversely, the column labeled "used" should be applied when the equipment was purchased used. In cases where the taxpayer does not indicate if the property was first acquired new or first acquired used, Table 6 provides an average of the new and used factors. The "new" and "used" factors may not be averaged unless the taxpayer does not indicate if the property was first acquired new or first acquired used.8
*Starting with the 2005 lien date, average factors are provided to reflect the provisions of section 401.16 as to use of average percent good factors.
8 Section 401.16(a).

Chapter 4
AH 581 22 January 2009
TABLE 7: COMPUTER VALUATION FACTORS
Year
Acquired
Age
PERSONAL COMPUTERS
($25,000 or less)
MID-RANGE COMPUTERS
($25,000.01 to $500,000)
MAINFRAME COMPUTERS
($500,000.01 or more)
2008 1 66 73 79 2007 2 39 47 54 2006 3 24 30 35 2005 4 15 19 22 2004 5 10 12 14 2003 6 6 8 9 2002 7 4 5 6 2001 8 2 3 4 2000 9 2 2 2
This table is intended for use in the mass appraisal of equipment when determining value for taxation purposes. However, relevant data pertinent to the assessment of a specific property should always be reviewed and considered.
USE OF TABLE 7 Computer valuation tables were originally developed by the Board in 1995, and amended in 1997, by analyzing resale values of personal, mid-range, and mainframe computers as compared to original costs.9 These factors are intended to be applied directly to historical costs of non-production computers. Non-production computers are computers, including related equipment, designed for general business purposes. Non-production computers do not include computers embedded in machinery and do not include equipment or computers specifically designed for use in any other application directly related to manufacturing. No estimates of economic lives are stated or implied, since the tables were not derived by analyzing price indexes and economic life patterns.
9 Prior to January 2000, computer valuation tables were distributed via Letter To Assessors. For more information regarding the original study and development of these factors, please refer to Letters To Assessors 97/18, 96/27, and 96/19.

Chapter 4
AH 581 23 January 2009
TABLE 8: SEMICONDUCTOR MANUFACTURING EQUIPMENT & FIXTURES VALUATION FACTORS
Year Acquired
Age
MACHINERY AND EQUIPMENT
VALUATION FACTORS (Report on Schedule A-1)
FIXTURES VALUATION
FACTORS (Report on Schedule B-2)
2008 1 78 92 2007 2 61 87 2006 3 46 81 2005 4 34 73 2004 5 25 66 2003 6 18 58 2002 7 12 49 2001 8 8 40 2000 9 31 1999 10 25 1998 11 20 1997 12 15 1996 13 13 1995 14 13 1994 15 13 1993 16 13 1992 17 13
Pursuant to Revenue and Taxation Code section 401.20, values determined by use of the valuation factors contained in Table 8 are rebuttably presumed to be the full cash value for semiconductor manufacturing equipment and fixtures. A county assessor or taxpayer has the right to present evidence supporting values different from those determined by use of Table 8 in order to attempt to overcome the presumption.
USE OF TABLE 8
The Semiconductor Manufacturing Equipment and Fixture Valuation Factors table was approved by the Board on October 1, 2008. These factors should be applied directly to historical costs.
The semiconductor machinery and equipment valuation factors are based on a 6-year economic life untrended. A minimum percent good factor of 8 percent applies to machinery and equipment.

Chapter 4
AH 581 24 January 2009
The semiconductor fixtures valuation factors are based on a 10-year economic life trended. A minimum percent good factor of 10 percent applies to the fixtures. The valuation factors include the minimum percent good and the trending.
DEFINITION
Semiconductor manufacturing equipment consists of (1) manufacturing equipment used in a clean room for the fabrication of semiconductor chips; (2) test equipment used in the manufacturing and research and development environment and to test semiconductor manufacturing equipment; and (3) fixtures in place to support a semiconductor fabrication facility. This definition is not limited by the size of a semiconductor facility or the technology of the chips produced.
CLASSIFICATION—SEMICONDUCTOR MANUFACTURING EQUIPMENT AND FIXTURES
Following is a list to serve as guidance in classifying machinery and equipment and fixtures in the semiconductor industry. Machinery and equipment should be reported on Schedule A-1 of the Business Property Statement (BOE-571-L); fixtures should be reported on Schedule B-2.
Fixturization from the clean room or service bay wall or floor that is directly related to the installation of machinery and equipment should also be reported on Schedule A-1 and valued in the same manner as the machinery and equipment.
Machinery and Equipment (Schedule A-1) See next page
Fixtures (Schedule B-2) Acid Neutralization System Air Filtration System, HEPA Filters Air Handlers Air Recirculation Fans Central Utility Building (CUB)
for the Process Bulk Chemicals, Storage and Delivery System Bulk Gas, Storage and Delivery Systems Chillers Clean room HVAC Support system Compressed Air Systems Deionized Water Tanks and Piping Electrical Substations Gas and Chemical Vaults Gas Monitoring System Liquid Waste, Storage and Treatment System Nitrogen and Oxygen Lines Process Cooling Tower Process Cooling Water Scrubbers (Fume Scrubbers) Sodium Hydroxide Storage Tanks Specialty Gases, Storage and Delivery System Storage Bunkers for Corrosives, Flammables, and
Solvents Sulfuric Acid Storage Tanks Water Purification System

Chapter 4
AH 581 25 January 2009
Machinery and Equipment (Schedule A-1) Annealing Equipment Annealing Furnace Asher, Dry Resist Removal Atmospheric Pressure Chemical Vapor Deposition
(APCVD) Baking Chemical Mechanical Planarization Equipment
Post CMP Clean Tool Wafer Marking Mark Reader Back Grinder Bump Plating Tape Sticker/Peeler Backside Etcher
Coater (Spin, Spray, Extrusion) Columnated Sputtering Compound Semiconductor Epitaxial Equipment Contact Aligner Developer Diffusion Furnace Dry Residue Removal Drying Equipment (Spin Dryer, Spin Rinse Dryer)
(SRD) E-Beam Direct Write EUV Edge Bead Removal System Electroplating (ECD) Equipment Gas Etching Hardening System, Resist Stabilizing Equipment High Current High Density Plasma Chemical Vapor Deposition
(HDPCVD) High Energy and Plasma Immersion High Pressure Jet Cleaner Holographic Mask Aligner, and Other Exposure Tools
for Device Production Mask Aligner IPA Dryer Ion Beam Etching Ion Beam Milling Ion Milling Ionized Sputtering Laser Annealer Long Throw Sputtering Low Pressure Chemical Vapor Deposition (LPCVD) Magnetically Enhanced (RIE)
Machinery and Equipment (Cont.) Measuring and Analytical Instrumentation
AUGER EPMA ESCA Failure Analysis Equipment (E-beam, Laser, FIBS,
Atomic Force) IR Life-time Measurement Film Thickness Monitoring Liquid/Gas/Air/Dust Counter Particle Inspection Reflection Measuring Spectrophotometer
Medium Current Megasonic and Ultrasonic Cleaning System Metal Organic Chemical Vapor Deposition (MOCVD)
Oxidation Furnace Metal Organic Vapor Phase Epitaxy (MOVPE) Molecular Beam Epitaxy (MBE) Plasma Enhanced Chemical Vapor Deposition (PECVD) Plasma Etching Plasma Stripper Processing Equipment Projection Aligner Projection Exposure System Proximity Aligner Rapid Thermal Reactive Ion Etch (RIE) Resist Development Analyzer Resist Processing Tools for Device Production Resist Stabilizing Equipment SCALPEL Silicon Epitaxial Growing Equipment Spin-On Deposition Tools Spin Processor, Wafer (Photoresist) Track Step-and-
Scan Sputter Etching Stepping Projection Aligner Supercritical Cleaning System Surface Tension Dryer Synchrotron Radiation (SR) Aligner UV Photoresist Curing Vacuum Evaporation Equipment (Aluminum and Gold
Evaporators)Wafer Brush/Scrubber Wafer Peripheral Exposure Equipment Wet Bench (Immersion, Spray, Recirculators), Sink Wet Etching Equipment Wet Spin Etcher X-ray Aligner X-Ray Stepper

Chapter 4
AH 581 26 January 2009
TABLE 9: BIOPHARMACEUTICAL INDUSTRY EQUIPMENT & FIXTURES VALUATION FACTORS
SCHEDULE A
SCHEDULE B
Year Acquired
Age Machinery &
Equipment
(A-1)
Other Equipment
(A-3)
Tools, Molds, Dies,
Jigs (A-4)
Fixtures
(B-2)
2008 1 85 92 89 92 2007 2 72 87 82 87 2006 3 58 81 72 81 2005 4 44 73 62 73 2004 5 32 66 52 66 2003 6 21 58 42 58 2002 7 13 48 31 48 2001 8 12 40 23 40 2000 9 12 31 16 31 1999 10 12 24 12 24 1998 11 12 18 12 18 1997 12 12 14 12 14 Prior Prior Years 12 13 12 13
Pursuant to Revenue and Taxation Code section 401.20, values determined by use of the valuation factors contained in Table 9 are rebuttably presumed to be the full cash value for biopharmaceutical industry equipment and fixtures. A county assessor or taxpayer has the right to present evidence supporting values different from those determined by use of Table 9 in order to attempt to overcome the presumption.
USE OF TABLE 9
The valuation factor table pertaining to the assessment of specific property owned and/or used by the biopharmaceutical industry was adopted by the Board in July 2008 and became effective as of the lien date January 1, 2009. For mass appraisal purposes, these factors are intended to be applied directly to the historical costs of property for each category. As illustrated, a minimum percent good factor of 12 or 13 percent applies, depending on the classification.
DEFINITION
Equipment and fixtures utilized in connection with, or in support of, research and/or manufacturing activities that use organisms, or materials derived from organisms, their cellular, subcellular, or molecular components, to discover and/or provide products for human or animal therapeutics, diagnostics, and/or vaccines.

Chapter 4
AH 581 27 January 2009
CLASSIFICATION—BIOPHARMACEUTICAL INDUSTRY EQUIPMENT AND FIXTURES
Following is a sample listing of the equipment and fixtures included in these schedules and categories. Other types of equipment (office equipment, computers, etc.) should be valued using the index factors and percent good factors or the valuation factors presented in the remainder of the handbook as appropriate.
Machinery and Equipment (A-1) Lab Equipment
\
General Laboratory Equipment Analytical Balances Anesthetic Machines Animal Cages Autoclaves Autosamplers Bacteria Identification Systems Cameras used in research Centrifuges (and rotors) Chart Recorders Conductivity Monitors Control Valves (laboratory scale) Densitometers Digital Counters Evaporator Fermentors (< 100 liters) Fume Hoods (portable) Glass Handling Equipment Glassware Washers Glucose Analyzers Ice Machines Imaging Equipment Incubators Liquid Samplers Micromanipulators Microscopes Microtomes Optical Scanning Detectors Organic Synthesizers Osmometers Ovens pH Analyzers Pipettes Pumps (laboratory scale) Radiation Monitors Reactor Vessels (<100 liters) Refrigerators and Freezers Sample Handling Equipment Samplers Shakers Sterilizers Stirrers Ultrasonic Cleaning Systems Waterbaths
Hi-tech Analytical Instruments Cell Fusion Devices Cell Sorting Instruments – FACS Chemstations – computer controlled Cryostats Chromatography – Desktop Cytometry Instruments DNA Sequencers and Analyzers DNA Synthesizers and Purifiers Electrolyte Analyzers Electron Scanning Microscopes Electrophoresis – Gas or Liquid Mass Spectrometers – NMR, FTIR, AA, MALDI Molecular Imaging Equipment Particle Counters and Analyzers Peptide Synthesizers and Sequencers Protein Synthesizers Scintillation Counters Spectrometers Spectrophotometers Thermal Analysis Instruments Viscometers X-Ray Diffratometers Other unspecified equipment that is similar in character, scale, and technology

Chapter 4
AH 581 28 January 2009
Other Equipment (A-3) Commercial Manufacturing Equipment
Air Sampler Clean Room Monitor Commercial Scale Agitator Commercial Scale Control Devices Commercial Scale Fermentation Tanks and Controls Commercial Scale Glycol System Commercial Scale Mix Tanks, Stainless Steel Commercial Scale Mixers Commercial Scale Pumps Commercial Scale Purification Vessels and Devices Commercial Scale RO Water Unit and System
Commercial Scale Stainless Steel Tanks and Vessels Custom Roller Bottle Apparatus Equipment Skids Filter Housings, Stainless Steel Floor Scale Flow Meter Piping and tubing between Production Vessels Roller Bottle Machine Capper Roller Bottle Machine Unit Roller Racks Sanitary Valves (personal property) WFI Water Still Other Commercial Scale Control Devices Other Commercial Scale Tanks, Vessels, and Devices
Tools, Molds, Dies, Jigs (A-4)
Pilot Scale Manufacturing Equipment
Mobile Pilot Plants Pilot Scale Fermentation Control Pilot Scale Mixers Pilot Scale Pumps and Hose Apparatus Pilot Scale Purification Vessels and Devices
Skids Small Fermentors (< 500 liters) Small Scale Process Control Devices Individual components aggregated into pilot scale manufacturing equipment systems
Fixtures (B-2)
Fixtures and Process Piping
Benches and Counters, Built-in Cabinets, Built-in Casework, Metal Casework, Wood Clean In Place Equipment Clean Room Air Ducts/Handlers Clean Room Filter Units Clean Room Fixtures, not specified Clean Room Special Floor Surfaces Cleanrooms Electric supply systems unique to process Emergency Generators (for process) Feedwater System Fiber optic communication systems for process Fume Hoods (built-in)
HVAC systems and ductwork unique to process Individual components aggregated into fixtures Piping and plumbing related to process RO, DI, WFI Water Piping Safety Stations and First Aid Cabinets Clean Room Special Wall Surfaces Steam supply unique to process Walk-in freezers and refrigerator units Wall Cases, Built-in Waste disposal equipment unique to process Water supply systems unique to process (WFI) Water, electric, and gas hook-ups to lab stations Other items meeting the definition of a fixture as specified in Property Tax Rule 122.5

Chapter 5
AH 581 29 January 2009
CHAPTER 5: CLASS INFORMATION
COMMERCIAL CLASSES CONTAINED IN AVERAGE INDEX (TABLE 1)
• Bank
• Garage
• Hospital
• Hotel
• Laundry
• Library
• Office
• Restaurant
• Retail
• Theater
• Warehouse
Chapter 5
AH 581 30 January 2009
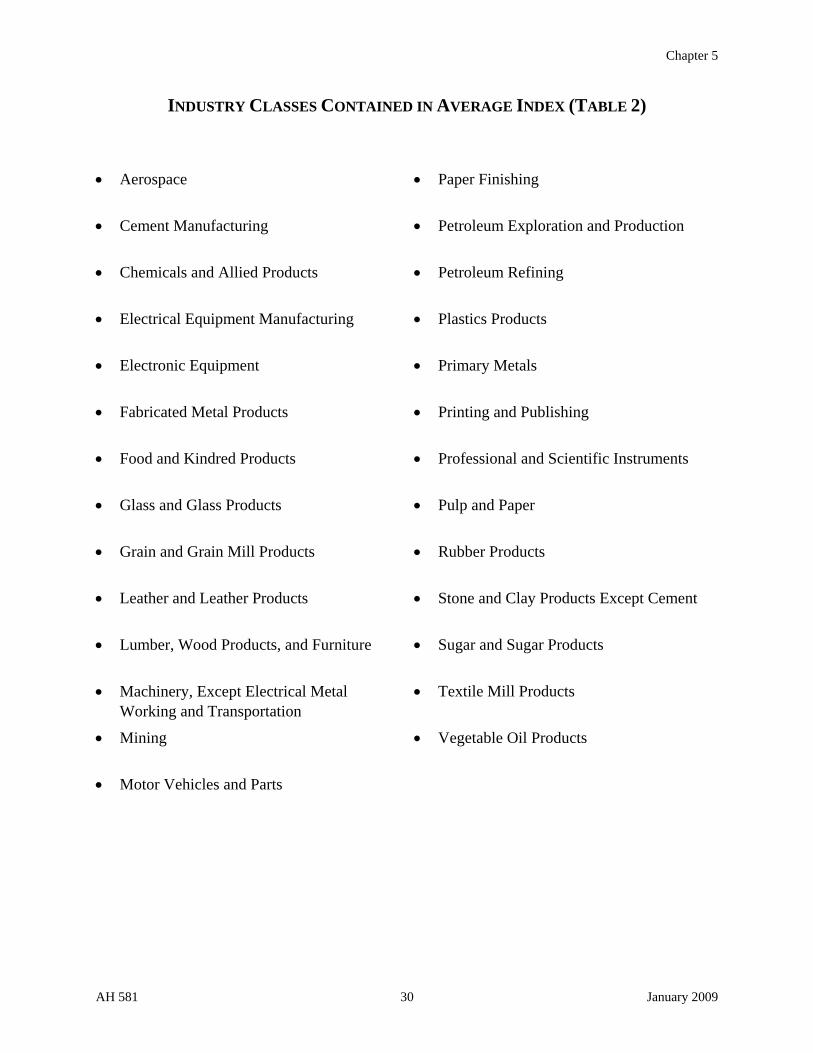
INDUSTRY CLASSES CONTAINED IN AVERAGE INDEX (TABLE 2)
• Aerospace • Paper Finishing
• Cement Manufacturing • Petroleum Exploration and Production
• Chemicals and Allied Products • Petroleum Refining
• Electrical Equipment Manufacturing • Plastics Products
• Electronic Equipment • Primary Metals
• Fabricated Metal Products • Printing and Publishing
• Food and Kindred Products • Professional and Scientific Instruments
• Glass and Glass Products • Pulp and Paper
• Grain and Grain Mill Products • Rubber Products
• Leather and Leather Products • Stone and Clay Products Except Cement
• Lumber, Wood Products, and Furniture • Sugar and Sugar Products
• Machinery, Except Electrical Metal Working and Transportation
• Textile Mill Products
• Mining • Vegetable Oil Products
• Motor Vehicles and Parts

Chapter 5
AH 581 31 January 2009
DESCRIPTION OF INDUSTRY CLASSES
Aerospace
Includes the manufacture of aircraft, spacecraft, rockets, missiles, and component parts.
Cement Manufacturing
Includes the manufacture of cement. Excludes the manufacture of concrete and concrete products.
Chemicals and Allied Products
Includes the manufacture of basic chemicals such as acids, alkalis, salts, organic and inorganic chemicals; chemical products to be used in further manufacture, such as synthetic fibers and plastics materials; and finished chemical products, such as pharmaceuticals, cosmetics, soaps, fertilizers, paints, varnishes, explosives, and compressed and liquefied gases.
Electrical Equipment Manufacturing
Includes the manufacture of electric household appliances, electronic equipment, batteries, ignition systems, and machinery used in the generation and utilization of electrical energy.
Electronic Equipment
Includes the manufacture of electronic communications, detection, guidance, control, radiation, computation, test, and navigation equipment, and components thereof. Excludes manufacturers that, in addition to electronic equipment, also produce other equipment included under electrical equipment.
Fabricated Metal Products
Includes the manufacture of fabricated metal products, such as cans, tinware, hardware, metal structural products, stampings, and a variety of metal and wire products.
Food and Kindred Products
Includes the manufacture of foods and beverages, such as meat and dairy products; baked goods; canned, frozen, and preserved products; confectionery and related products; and soft drinks and alcoholic beverages. Excludes the manufacture of grain and grain mill products, sugar and sugar products, and vegetable oils and vegetable oil products.
Glass and Glass Products
Includes the manufacture of flat, blown, or pressed glass products, such as plate, safety, and window glass, glass containers, glassware, and fiberglass. Excludes the manufacture of lenses.
Chapter 5
AH 581 32 January 2009
Grain and Grain Mill Products
Includes the manufacture of blended and prepared flours, cereals, feeds, and other grain and grain mill products.
Leather and Leather Products
Includes the manufacture of finished leather products, the tanning, currying, and finishing of hides and skins, and the processing of fur pelts.
Lumber, Wood Products, and Furniture
Includes the manufacture of lumber, plywood, veneers, furniture, flooring, and other wood products. Excludes the manufacture of pulp and paper.
Machinery, Except Electrical, Metal Working, and Transportation
Includes the manufacture of machinery, such as engines and turbines, farm machinery, construction and mining machinery, food products machinery, textile machinery, woodworking machinery, paper industry machinery, compressors, pumps, ball and roller bearings, blowers, industrial patterns, process furnaces and ovens, office machines, and service industry machines and equipment.
Mining
Includes the mining and quarrying of metallic and nonmetallic minerals and the milling, benefaction, and other primary preparation of such materials.
Motor Vehicles and Parts
Includes the manufacture of automobiles, trucks, buses, and their component parts. Excludes the manufacture of glass, tires, and stampings.
Paper Finishing
Includes paper finishing and conversion into cartons, bags, envelopes, and similar products.
Petroleum Exploration and Production
Includes the exploration, drilling, maintenance, and production activities of petroleum and natural gas producers. Includes gathering pipelines and related storage facilities of such producers. Excludes gathering pipelines and related storage facilities of pipeline companies.
Petroleum Refining
Includes the distillation, fractionation, and catalytic cracking of crude petroleum into gasoline and its other components.
Plastics Products
Includes the manufacture of processed, fabricated, and finished plastic products. Excludes the manufacture of basic plastic materials.

Chapter 5
AH 581 33 January 2009
Primary Metals
Includes the smelting, reducing, refining, and alloying of ferrous and nonferrous metals from ore, pig, or scrap, and the manufacture of castings, forgings, and other basic ferrous and nonferrous metals products.
Professional and Scientific Instruments
Includes the manufacture of mechanical measuring, engineering, laboratory, and scientific research instruments; optical instruments and lenses; surgical, medical, and dental instruments and equipment; ophthalmic equipment; photographic equipment; and watches and clocks.
Printing and Publishing
Includes printing, publishing, lithographing, and printing services, such as bookbinding, typesetting, photoengraving, and electrotyping.
Pulp and Paper
Includes the manufacture of pulp from wood, rags, and other fibers and the manufacture of paper and paperboard from pulp. Excludes paper finishing.
Rubber Products
Includes the manufacture of finished rubber products, and the recapping, retreading, and rebuilding of tires.
Stone and Clay Products, Except Cement
Includes the manufacture of structural clay products, such as brick, tile, and pipe; pottery and related products, such as vitreous-china, plumbing fixtures, earthenware, and ceramic insulating material; concrete; asphalt building materials; concrete, gypsum, and plaster products; cut and finished stone; and abrasive, asbestos, and miscellaneous nonmetallic mineral products.
Sugar and Sugar Products
Includes the manufacture of raw sugar, syrup, or finished sugar from sugar cane or sugar beets.
Textile Mill Products
Includes the manufacture of spun, woven, or processed yarns and fabrics from natural or synthetic fibers. Excludes finishing and dyeing.
Vegetable Oil Products
Includes the manufacture of vegetable oils and vegetable oil products.

Chapter 6
AH 581 34 January 2009
CHAPTER 6: CLASSIFICATION OF IMPROVEMENTS AS STRUCTURE ITEMS OR FIXTURES
The intent of the following listing is to classify property without regard to ownership. The listing does not necessarily indicate appraisal responsibility by a real property appraiser or an auditor–appraiser. It should be used as a guide for classifying improvements reported on Schedule B of the Business Property Statement.
Section 122.5 of Title 18 of the California Code of Regulations (Property Tax Rule 122.5) provides a definition of "fixtures" and is controlling. For ease of use, the general concepts used as a basis for the segregation of improvements to "structure item" or "fixtures" categories are as follows.10
Primary Test
Rule 122.5(d) states that "…Intent is the primary test of classification." To determine intent the appraiser should look to what is "reasonably manifested by outward appearance."
Structure Item
An improvement will be classified as a "structure item" when its primary use or purpose is for housing or accommodation of personnel, personalty, or fixtures; or when the improvement has no direct application to the process or function of the trade, industry, or profession.
Fixture
An improvement will be classified as a "fixture" if its use or purpose directly applies to or augments the process or function of a trade, industry, or profession.
Dual Purpose
Items that have a dual purpose will be classified according to their primary purpose.
Examples
The following pages list a variety of improvements and their typical classifications as structure items or fixtures. It must be emphasized that the listing is illustrative as a guide only. Proper classification as a fixture or structure item is determined according to the actual use or purpose of the property.
10 See also Assessors' Handbook Section 504, Assessment of Personal Property and Fixtures, for additional information.

Chapter 6
AH 581 35 January 2009
STRUCTURE ITEMS FIXTURES Air conditioning—office and building cooling Air conditioning—process cooling Auxiliary power generation equipment—for building purposes
Air lines
Awnings Auxiliary power generation equipment—for trade
or production purposes Batch plants—buildings, fences, paving, yard lights, and spur tracks
Back bars
Boilers—office and building heating Batch plant—scales, silos, hoppers, bins,
machinery Building renovations Boilers—for manufacturing process Butane and propane installations—used for heating buildings
Bowling lanes
Car washes—all buildings, canopies, interior and exterior walls, fences, paving, and normal plumbing
Burglar alarm systems
Carpets and floor coverings affixed to floor—wall-to-wall carpeting and specially installed strip or area carpeting, tile, terrazzo coverings
Butane and propane installations—used for trade or production purposes
Central heating and cooling plants Car washes—special plumbing, wiring, and car
washing equipment Chutes—built-in Compressors—air Coin-operated laundries—restroom, sanitary plumbing fixtures
Conveyors—for moving materials and products
Conveyors—for moving people Cooling towers—used in a trade or production
process Cooling towers—other than used in a trade or production process
Counters
Crane ways Cranes—traveling Dock elevators Environmental control devices—used in the
production process Elevators—including machinery and power wiring
Fans and ducts—used for processing
Chapter 6
AH 581 36 January 2009
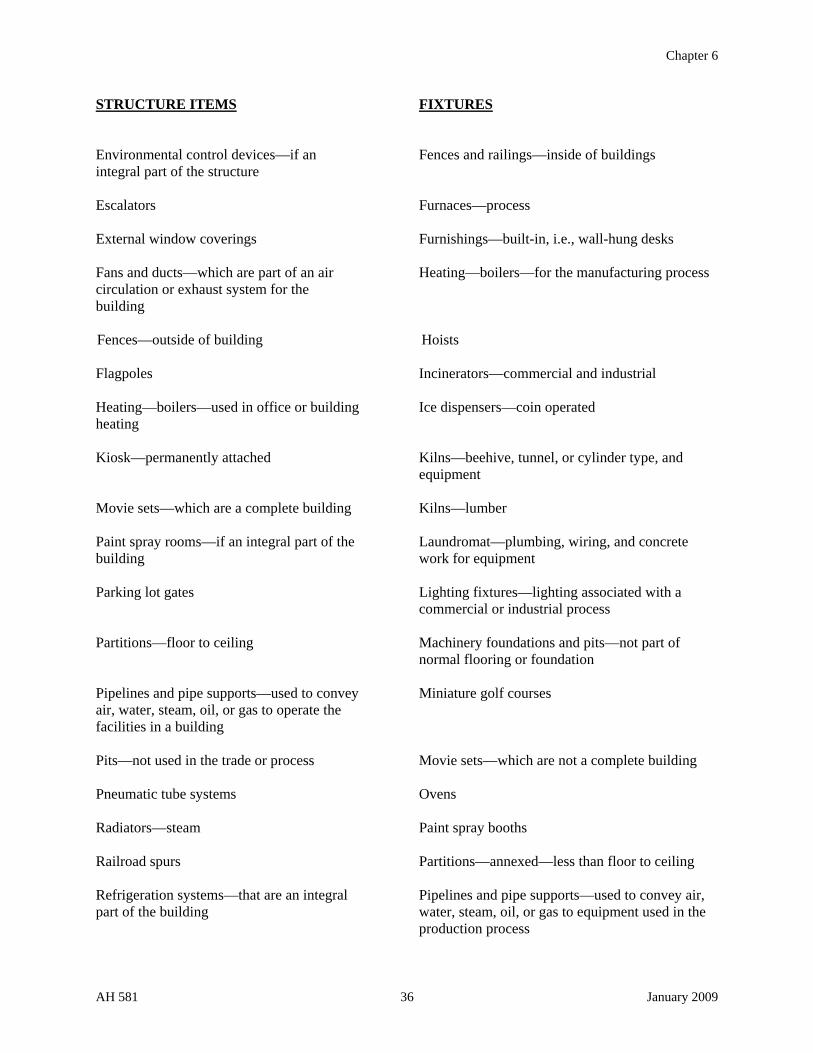
STRUCTURE ITEMS FIXTURES Environmental control devices—if an integral part of the structure
Fences and railings—inside of buildings
Escalators Furnaces—process External window coverings Furnishings—built-in, i.e., wall-hung desks Fans and ducts—which are part of an air circulation or exhaust system for the building
Heating—boilers—for the manufacturing process
Fences—outside of building Hoists Flagpoles Incinerators—commercial and industrial Heating—boilers—used in office or building heating
Ice dispensers—coin operated
Kiosk—permanently attached Kilns—beehive, tunnel, or cylinder type, and
equipment Movie sets—which are a complete building Kilns—lumber Paint spray rooms—if an integral part of the building
Laundromat—plumbing, wiring, and concrete work for equipment
Parking lot gates Lighting fixtures—lighting associated with a
commercial or industrial process Partitions—floor to ceiling Machinery foundations and pits—not part of
normal flooring or foundation Pipelines and pipe supports—used to convey air, water, steam, oil, or gas to operate the facilities in a building
Miniature golf courses
Pits—not used in the trade or process Movie sets—which are not a complete building Pneumatic tube systems Ovens Radiators—steam Paint spray booths Railroad spurs Partitions—annexed—less than floor to ceiling Refrigeration systems—that are an integral part of the building
Pipelines and pipe supports—used to convey air, water, steam, oil, or gas to equipment used in the production process

Chapter 6
AH 581 37 January 2009
STRUCTURE ITEMS FIXTURES Refrigerators—walk in—which are an integral part of the building—excluding operating equipment
Pits—used as wine and sugar clarifiers, skimming pits, grease pits, sump pits, and pits used to house machinery in the manufacturing
Restaurants—rough plumbing to fixtures Plumbing—special purpose Renovations to building structures Power wiring, switch gear, and power panels—for
manufacturing process Security—Banks and Financial
Fire alarm systems Safes-embedded Night depository –(if an integral part of the building) Teller cages Vault alarm system Vaults
Refrigeration systems—that are not an integral part of the building
Service stations—canopies, paving, sign, pylons
Refrigerators—walk in—unitized—including operating equipment
Shelving—originally designed as an integral part of the building
Restaurant equipment—plumbing fixtures, stainless steel or galvanized sinks in kitchens, bars, soda fountains, garbage disposals, dishwashers, hoods, etc.
Shielded or clean rooms—if an integral part of the building
Roller skating surface
Signs—include supporting structure, which forms an integral part of the building, including sign blades, pylons, or marquee structures serving as canopies. Exclude sign cabinet (face) and lettering
Scales—including platform and pit
Silos or tanks—whose primary function or intent is to store property for a time period, such as storage tank farms and grain and liquid petroleum storage facilities
Security—Banks and Financial Cameras (surveillance)—attached to walls or columns Drive-up and walk-up windows—unitized security type Night depository –(if not an integral part of the building) Man traps Vault doors
Smog control devices—when attached to incinerator or building heating plant
Service Stations—gasoline storage tanks, pumps, air and water wells

Chapter 6
AH 581 38 January 2009
STRUCTURE ITEMS FIXTURES Sprinkler systems—where primary function is the protection of a building or structure
Shelving—other than that which is an integral part of the building
Store fronts Shielded or clean rooms—if not an integral part of
the building Television and radio antenna towers Signs—sign cabinets and free standing signs,
including supports Trout ponds—concrete Silos or tanks—whose primary function is as part
of a process, including temporary process holding such as breweries or refineries
Theaters—drive-in—buildings, screen and structures, fencing, paving, lighting
Ski lifts, tows, trams
Water systems at golf courses Sky slides Smog control devices—attached to process device Theaters—auditorium equipment—seating,
screens, stage equipment, sound, lighting, and projection
Theaters—drive in—heater and speaker uprights,
wiring and units, projection equipment, signs Trash compactors and paper shredders Wash basins—special purpose water softeners for
commercial or industrial purposes

Chapter 7
AH 581 39 January 2009
CHAPTER 7: VALUATION GUIDES There are numerous valuation guides available that contain sale-derived market values of construction mobile equipment and agricultural mobile equipment. The appraiser should utilize these valuation guides in making the appraisal estimate when sufficient information regarding the equipment's make, model, etc., is available. The index factors from Table 3 and the percent good factors from Table 5 and Table 6 should be used when sufficient information cannot be obtained from value guides or other market information.
Valuation guides that we are aware of include the following: Agricultural Equipment
The Official Tractor Blue Book, Penton Media
Phone: (800) 654-6776 or (913) 967-7453 Internet Address: www.buypenton.com
Official Guide - Tractors and Farm Equipment, Iron Solutions
Phone: (877) 266-4766 Internet Address: www.ironsolutions.com
Farm Equipment Guide, Heartland Ag Business Group
Phone: (800) 673-4763 Internet Address: www.hotlineguides.com
Construction Equipment
Green Guide: Equipment Values, Penton Media
Phone: (800) 669-3282 Internet Address: www.equipmentwatch.com

Chapter 8
AH 581 40 January 2009
CHAPTER 8: VALUATION FACTOR STUDIES The factors contained in this handbook section are updated for each January 1 lien date when current market data becomes available that indicate that the factor(s) should be adjusted. Interested parties may provide data to Board staff via a petition11 in support of changing factors contained in this handbook.
OVERVIEW
Section 401.5 of the Revenue and Taxation Code requires that the Board issue to county assessors data relating to costs of property and other information to promote uniformity in appraisal practices and in assessed values throughout the state. In an effort to comply with section 401.5, the Board annually publishes Assessors' Handbook Section 581, Equipment Index and Percent Good Factors (AH 581). Currently, AH 581 contains tables of valuation factors for non-production computer equipment, semiconductor manufacturing equipment, and biopharmaceutical industry equipment and fixtures. In June 2008, the Board directed staff to develop further valuation factors for AH 581 by conducting valuation studies for various industries that petition Board staff for a study of their industry property/equipment.
The purpose of these procedures is to provide guidelines to interested parties in identifying, gathering, and verifying data to submit to Board staff for the purpose of conducting a valuation study of their tangible personal property/equipment. The goal of interested parties is to provide enough quality data to enable Board staff to develop valuation factors that the local county assessors can apply to the historical cost of property/equipment in determining the fair market value for property tax purposes. Depending on the type and scope of a study, the data and source participants will vary.
Generally, there are two types of valuation studies for ad valorem personal property tax purposes: industry group and assets specific. Industry group studies involve a group of assets that are deployed within a particular industry. Biopharmaceutical equipment and semiconductor manufacturing equipment are examples of industry group types. Asset specific studies have a very narrow scope and involve assets that are typically owned by a diverse set of property owners and can be found in many operational settings. Computers and copiers are examples of asset specific types.
The findings of a study will be determined by the analysis of market data and will not be influenced by opinions of either industry or counties. Once a study has begun and sufficient quality market data has been received by Board staff, the study will be completed, even in the event that the original petitioner decides to withdraw their petition.
11 The petition and procedures for property tax valuation factor studies were adopted by the Board on September 17, 2008.

Chapter 8
AH 581 41 January 2009
MARKET DATA
The successful outcome of a study will be completely dependent on the availability of good market data. The industry will be expected to provide verifiable market data in a sufficient quantity to be statistically representative of the property/equipment within the industry.
Market data submitted must include the following fields (see Table 1 below):
• Make
• Model name
• Model number
• Description
• Configuration
• Serial number
• Manufacture date, ship date, or acquisition date
• Price sold to end user and date of sale
• Discount price new
TABLE 1
MAKE
MODEL NAME
MODEL NUMBER
DESCRIPTION
CONFIGURATION
SERIAL NUMBER
DISCOUNT PRICE NEW
DATE1
DISCOUNT
PRICE NEW
DATE SOLD TO
END USER2
PRICE SOLD TO
END USER
1 The decision as to what date to provide for the purpose of establishing vintage age is driven by the available data and the source of the data. If, for example, you are receiving price sold to the end user along with a full description of the asset from an industry reseller and you have received cooperation from the manufacturer, the manufacturer can provide ship dates. Another example is where you are able to obtain the used sales prices to items listed on a fixed asset listing (FAL). (When using this method, take care to avoid items on a FAL that were purchased used.) In this case, you will provide the acquisition date listed on the FAL. 2 Enter the date of the related subsequent market transaction that corresponds to the price sold to the end user. Market data related to price sold to end user should be limited to a 12-month period. When your petition is approved, Board staff will provide you with the 12-month range.
If the reseller incurred refurbishing costs in readying equipment for sale to the end user, you should include a field for refurbishing costs and provide the refurbishing costs for the related market transactions.
Discount price new and price sold to end user should contain the same components (for example, installation cost, sales tax, and transportation cost). Ideally, discount price new and price sold to end user should only contain the price of the property/equipment.

Chapter 8
AH 581 42 January 2009
CONFIDENTIALITY OF DATA
Government Code section 15619 prohibits divulgence of information obtained by Board of Equalization employees. Section 15619 provides, in part:
Any member or ex-member of the State Board of Equalization, or any agent employed by it, or the Controller, or ex-Controller, or any person employed by him or her, or any person who has at any time obtained such knowledge from any of the foregoing officers or persons shall not divulge or make known in any manner not provided by law, any of the following items of information concerning the business affairs of companies reporting to the board:
(a) Any information concerning the business affairs of any company that is gained during an examination of its books and accounts or in any other manner, and is not required by law to be reported to the State Board of Equalization.
(b) Any information, other than the assessment and the amount of taxes levied, obtained by the State Board of Equalization in accordance with law from any company other than one concerning which that information is required by law to be made public.
(c) Any particular item of information relating to the disposition of its earnings contained in the report of a quasi-public corporation that the corporation, by written communication specifying the items and presented at the time when it files its report, requests shall be treated as confidential.
Accordingly, all data obtained from industry in the course of a valuation study will be held confidential and will not be made available to competitors or counties. When Board staff provides results of their analysis of data during and at the conclusion of a study, the data will be masked and/or arrayed in a manner that will preclude identification of the source of any specific data.
INDUSTRY GROUP STUDIES
MARKET DATA FOR GROUP STUDIES See the section Market Data above for an expanded discussion and required formatting parameters for market data. For an industry group type study, provide the most current FAL for the companies you listed in your petition (form BOE-401). The FAL will permit you and Board staff to identify classes of assets and to determine the distribution of investments over time. Only through this analysis can Board staff identify the classes, distribution, and volume of market data needed for your study. You should submit this item soon after your petition has been approved. The FAL should include the following fields:

Chapter 8
AH 581 43 January 2009
• General ledger account number
• Asset number
• Description
• Serial number
• Location code
• Acquisition date
• Acquisition cost
Additionally, you will be required to provide:
• Descriptions of each general ledger account
• A schedule describing the location codes
The FAL should correspond to the general ledger. These accounting records will be subject to audit by Board staff. Full cooperation of the industry group is a condition of your study’s success.
Once Board staff has analyzed your accounting records, you will be notified of the different asset classes and the amount of market data you must obtain. Board staff will provide you with specific information regarding the market data needed, which should eliminate the collection of unnecessary or redundant data.
ACCOUNTING RECORDS FOR ECONOMIC LIFING STUDY If you are requesting that Board staff conduct an economic lifing study, you should be prepared to provide FAL's for the most current seven years for each of the companies listed in your petition. Each of the FAL's should contain:
• General ledger account number
• Asset number
• Description
• Serial number
• Location code
• Acquisition date
• Acquisition cost
Additionally, you will be required to provide:
• Descriptions of each general ledger account
• A schedule describing the location codes
• End of year (whether fiscal or calendar) general ledger balances that correspond to the FAL

Chapter 8
AH 581 44 January 2009
ASSET SPECIFIC STUDIES
MARKET DATA FOR ASSET SPECIFIC STUDIES See the section Market Data above for an expanded discussion and required formatting parameters for market data. Market data for asset specific type studies should reflect the market (according to market share). Therefore, immediately after your petition is approved, the industry representative should submit to Board staff a schedule of market share according to manufacturer for each year dating back seven years. Sources of data should be representative of the users of the property/equipment in California.
Once Board staff has analyzed the market share information, you will be notified of the amount of market data that must be submitted to Board staff.
ACCOUNTING RECORDS FOR ECONOMIC LIFING STUDY If you are requesting that Board staff conduct an economic lifing study, you should be prepared to provide FAL's for the most current seven years from a wide variety of companies. Each of the FAL's should contain:
• General ledger account number
• Asset number
• Description
• Serial number
• Location code
• Acquisition date
• Acquisition cost
Additionally, you will be required to provide:
• Descriptions of each general ledger account
• A schedule describing the location codes
• End of year (whether fiscal or calendar) general ledger balances that correspond to the FAL
VERIFICATION OF DATA
ACCOUNTING RECORDS Prior to submitting a FAL, industry should verify that the FAL corresponds to the general ledger amounts. After Board staff reviews the accounting records submitted, Board staff may elect to audit the accounting records. The industry participants should be fully aware of this requirement and be prepared to cooperate in a timely manner. The lack of cooperation or delays in responding

Chapter 8
AH 581 45 January 2009
to Board staff requests can negatively impact the process and ultimately may lead to the termination of the study.
MARKET DATA Industry should be able to verify each field in the market data by way of a source document, such as an invoice. Price sold to the end user can be obtained from industry resellers and from companies within the industry that have sold directly to an end user. In each case, the invoice of the transaction should be available for inspection by Board staff. Discount price new may prove to be the most difficult to obtain. If, for example, you are able to match used price sold to the end user to discount price new reflected on a FAL, the invoice for that item listed on the FAL should be available. Make sure that the descriptions of your matches are of such detail to reasonably conclude that both items are the same make, model, and configuration. Matching configurations is the most difficult step of this task depending upon the sophistication of the equipment. When obtaining data on the price to the end user, ensure that you obtain all of the fields outlined in Table 1 above for each line item. Failure to secure the necessary fields may render your used price to the end user invalid.
TIMELINE FOR SUBMITTING DATA
Once a petition has been accepted, the industry will be provided with a timeline for their study which will include specific times to submit accounting records and, after analysis of the accounting records, when market data must be submitted. Generally, a maximum of six months will be allowed for industry to provide sufficient, quality data in order for the study to move forward. If industry does not produce the required data timely, the study will be terminated.
PETITION
A petition, BOE Form 401, Petition to Conduct Property Tax Valuation Study, may be downloaded from the Board's website at www.boe.ca.gov/proptaxes/proptax.htm.


![STATE BOARD OF EQUALIZATION · 2014. 11. 24. · 2016 Changes Janette OCE maps LINETYPE PARCELS- DLR] Plot-Sty les SCALES 6 ftms ... .xlsx, California State Board of Equalization](https://img.pdfslide.net/doc/110x75/5fdb27f9db2f7324206817ba/state-board-of-equalization-2014-11-24-2016-changes-janette-oce-maps-linetype.jpg)