Embed Size (px)
Citation preview

State of College Admission2011
David A. Hawkins Director of Public Policy and Research
NACAC
Presented November 10, 2011
CACNY Meeting, New York
Components of Report• Counseling Trends Survey• Admission Trends Survey• External Data
– US Department of Education IPEDS Data– US Census Bureau– College Board Annual Survey– Other Education Organizations

Chapter 1: The Flow of Students
• Number of HS Grads Peaked at 3.33 Million for 2008–09– 3.28 Million in 2010–11
• Wide Variations by State and Region; Race/Ethnicity; Age
• Total College Enrollment Will Increase At Least Through 2020
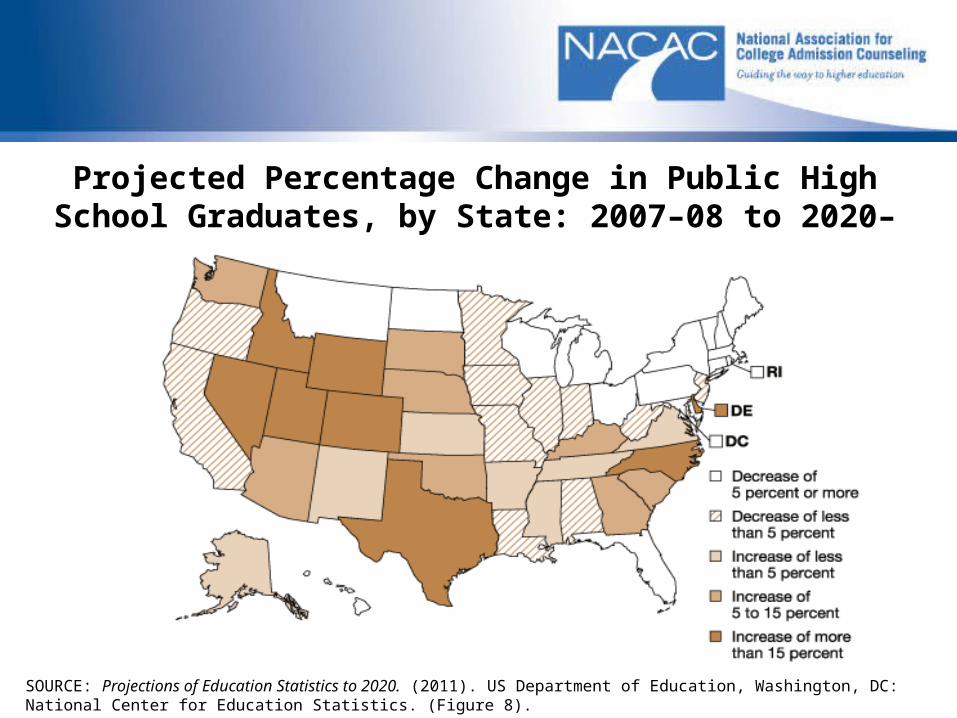
Projected Percentage Change in Public High School Graduates, by State: 2007–08 to 2020–21
SOURCE: Projections of Education Statistics to 2020. (2011). US Department of Education, Washington, DC: National Center for Education Statistics. (Figure 8).
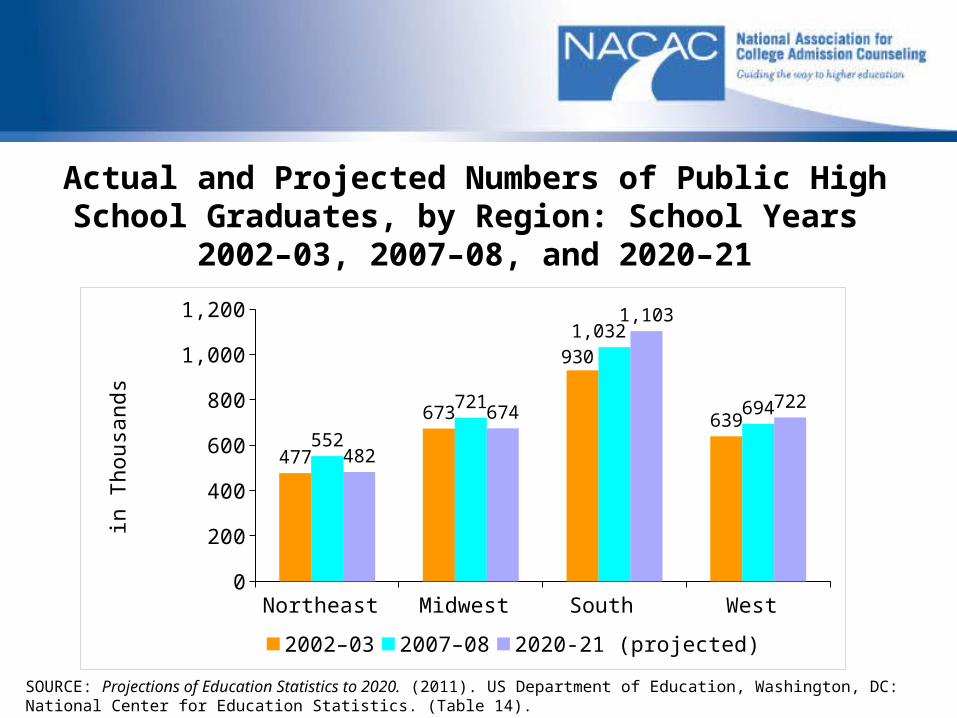
Actual and Projected Numbers of Public High School Graduates, by Region: School Years
2002–03, 2007–08, and 2020–21
SOURCE: Projections of Education Statistics to 2020. (2011). US Department of Education, Washington, DC: National Center for Education Statistics. (Table 14).
Northeast Midwest South West 0
200
400
600
800
1,000
1,200
477
673
930
639552
721
1,032
694
482
674
1,103
722
2002–03 2007–08 2020-21 (projected)
in T
ho
usa
nd
s

Actual and Projected Numbers of Public High School Graduates, by Race/Ethnicity: School Years
2002–03, 2007–08, and 2020–21
SOURCE: Projections of Education Statistics to 2020. (2011). US Department of Education, Washington, DC: National Center for Education Statistics. (Table 13).
Whi
teBla
ck
Hispan
ic
Asian/
Pacific
Isla
nder
Amer
ican
Indi
an/
Alask
a Nat
ive
0
500
1,000
1,500
2,000
2,500
1,858
359 340136 28
1,917
436 453161 32
1,707
426575
23533
2002–03 2007–08 2020–21 (projected)
in T
ho
usa
nd
s
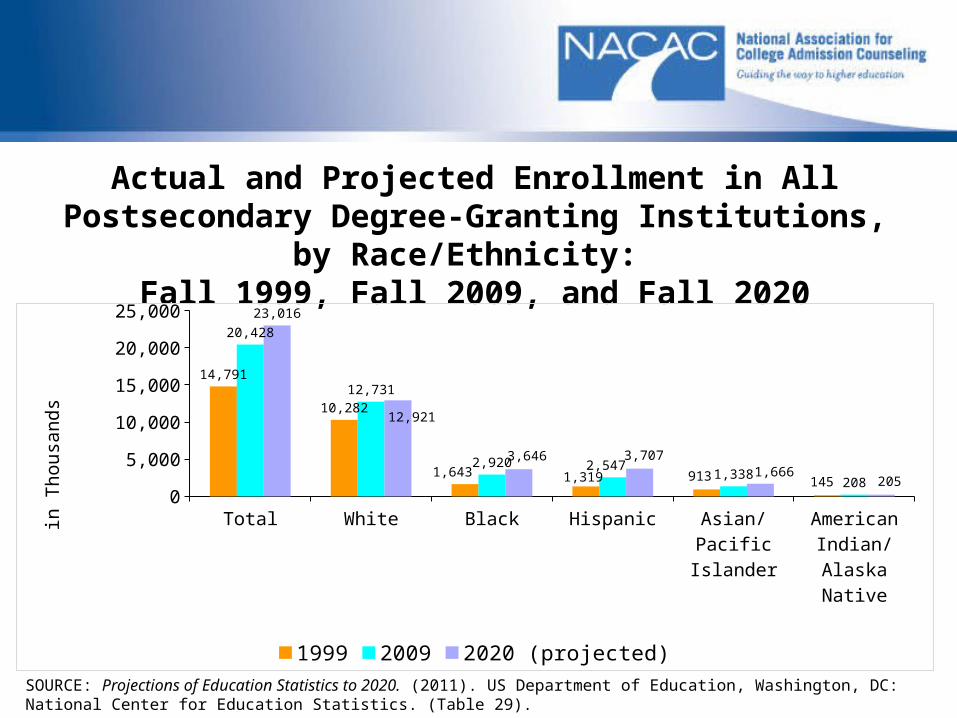
Actual and Projected Enrollment in All Postsecondary Degree-Granting Institutions, by Race/Ethnicity:
Fall 1999, Fall 2009, and Fall 2020
SOURCE: Projections of Education Statistics to 2020. (2011). US Department of Education, Washington, DC: National Center for Education Statistics. (Table 29).
Total
White
Black
Hispanic
Asian/P
acific
Isla
nder
Americ
an India
n/
Alask
a Nativ
e
0
5,000
10,000
15,000
20,000
25,000
14,791
10,282
1,643 1,319 913 145
20,428
12,731
2,920 2,5471,338 208
23,016
12,921
3,646 3,7071,666
205
1999 2009 2020 (projected)
in T
ho
usa
nd
s
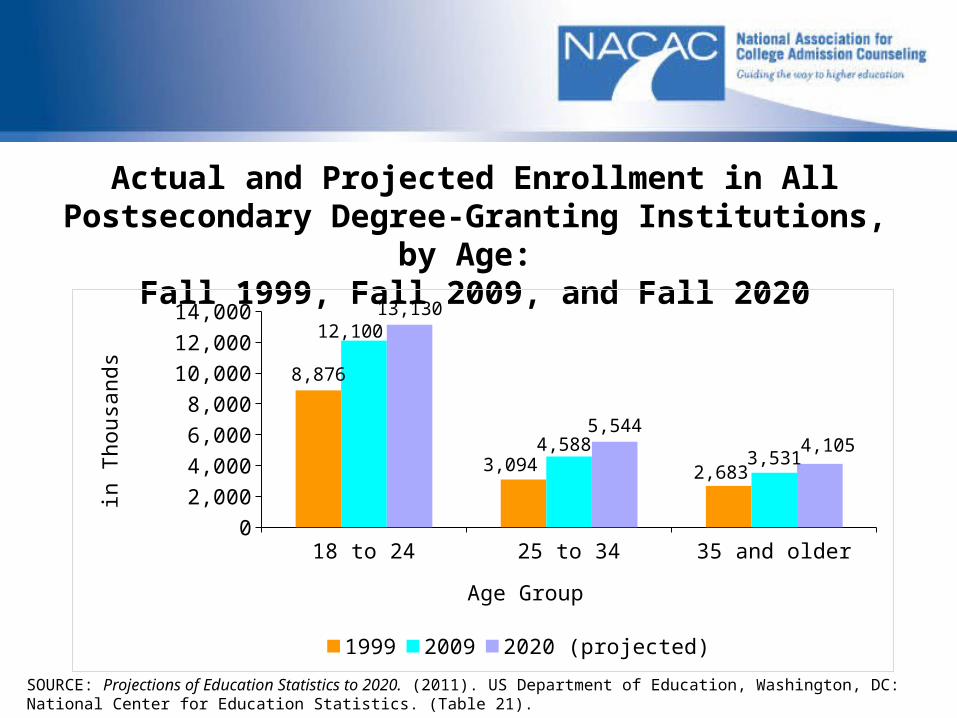
Actual and Projected Enrollment in All Postsecondary Degree-Granting Institutions, by Age:
Fall 1999, Fall 2009, and Fall 2020
SOURCE: Projections of Education Statistics to 2020. (2011). US Department of Education, Washington, DC: National Center for Education Statistics. (Table 21).
18 to 24 25 to 34 35 and older0
2,000
4,000
6,000
8,000
10,000
12,000
14,000
8,876
3,094 2,683
12,100
4,5883,531
13,130
5,5444,105
1999 2009 2020 (projected)
Age Group
in T
ho
usa
nd
s
Chapter 2. Applications and Selectivity
• Applications Per Student Continues to Increase
• Nearly Three-Quarters of Colleges Report Application Increases
• Average Acceptance Rate Down Slightly
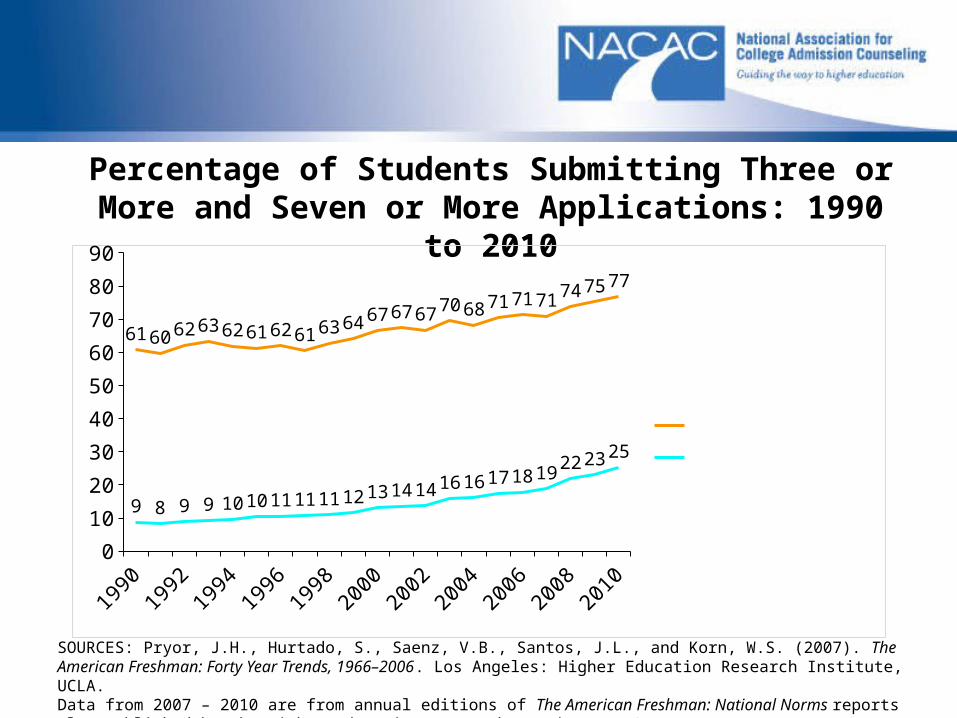
Percentage of Students Submitting Three or More and Seven or More Applications: 1990 to 2010
SOURCES: Pryor, J.H., Hurtado, S., Saenz, V.B., Santos, J.L., and Korn, W.S. (2007). The American Freshman: Forty Year Trends, 1966–2006. Los Angeles: Higher Education Research Institute, UCLA. Data from 2007 – 2010 are from annual editions of The American Freshman: National Norms reports also published by the Higher Education Research Institute, UCLA.
1990
1992
1994
1996
1998
2000
2002
2004
2006
2008
2010
0
10
20
30
40
50
60
70
80
90
61 60 6263 62 61 62 61 63
64 6767 67 70 68
71 71 7174 75
77
9 8 9 9 10 10 11 11 11 12 13 14 14 16 16 17 18 1922 23 25
Three or more Seven or more
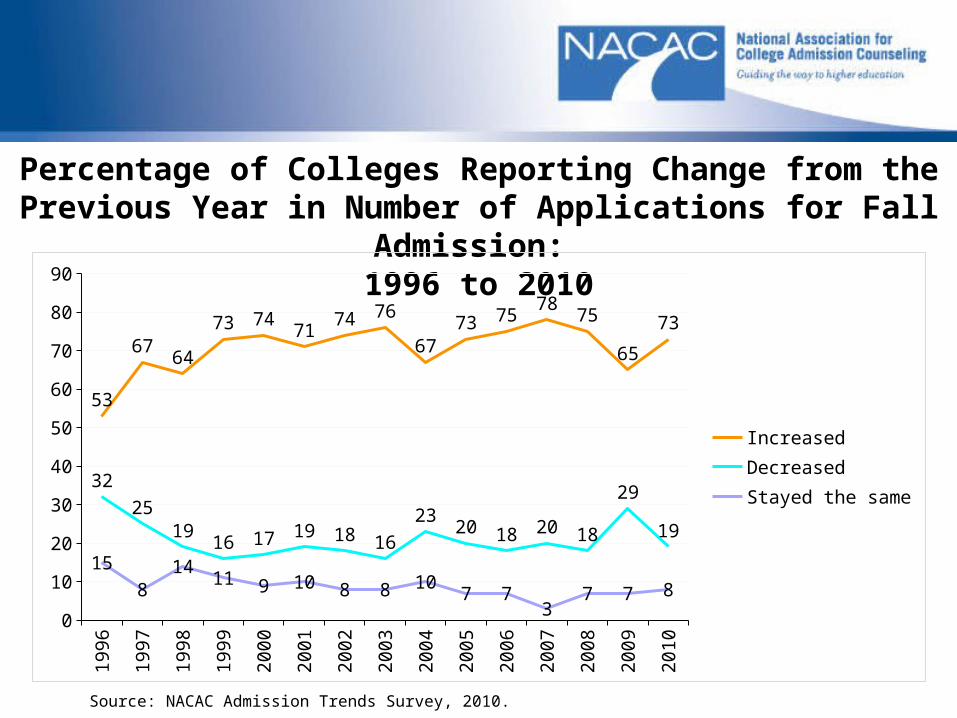
Percentage of Colleges Reporting Change from the Previous Year in Number of Applications for Fall Admission:
1996 to 2010
Source: NACAC Admission Trends Survey, 2010.
19
96
19
97
19
98
19
99
20
00
20
01
20
02
20
03
20
04
20
05
20
06
20
07
20
08
20
09
20
10
0
10
20
30
40
50
60
70
80
90
53
6764
73 7471
74 76
6773 75
7875
65
73
32
2519
16 17 19 18 16
2320 18 20 18
29
19
15
814
11 9 10 8 8 107 7
37 7 8
IncreasedDecreasedStayed the same
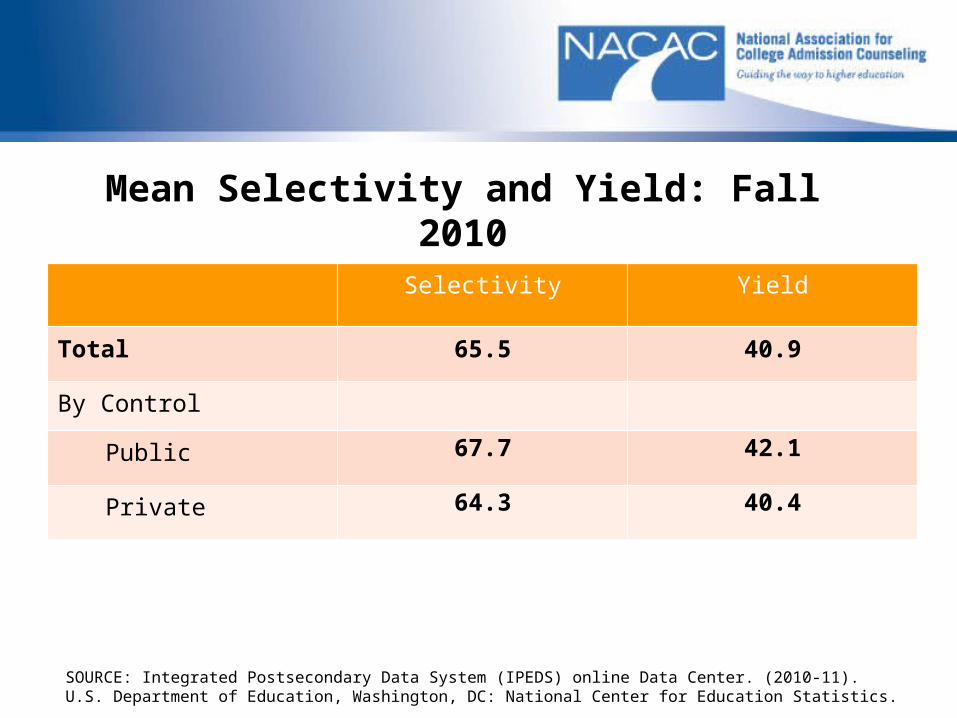
Mean Selectivity and Yield: Fall 2010
Selectivity Yield
Total 65.5 40.9
By Control
Public 67.7 42.1
Private 64.3 40.4
SOURCE: Integrated Postsecondary Data System (IPEDS) online Data Center. (2010-11). U.S. Department of Education, Washington, DC: National Center for Education Statistics.
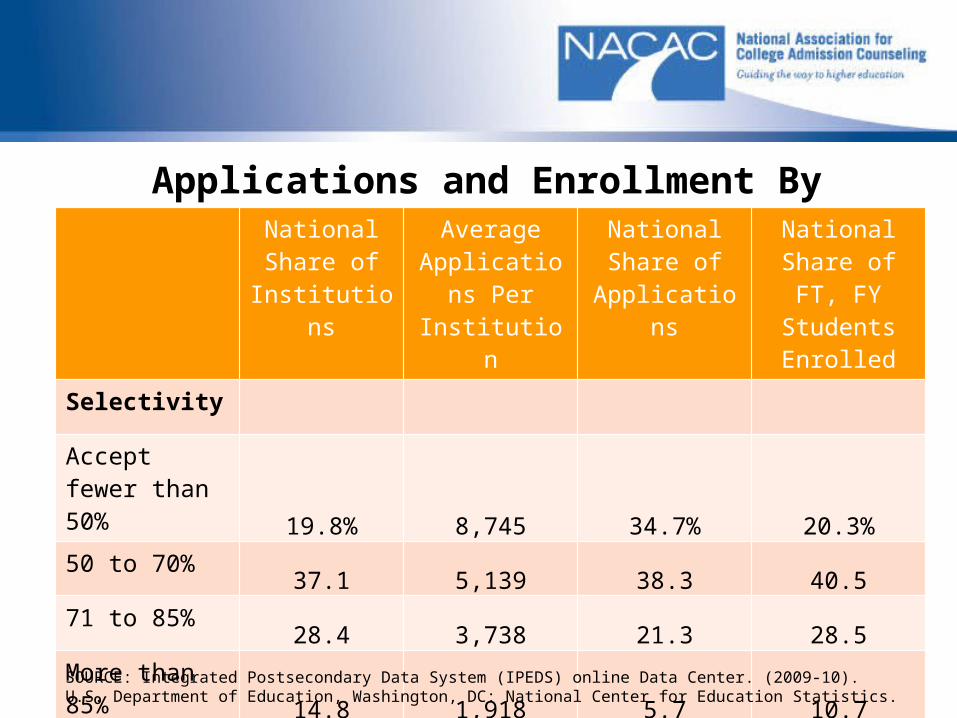
Applications and Enrollment By SelectivityNational Share of
Institutions
Average Applications
Per Institution
National Share of
Applications
National Share of FT, FY Students
Enrolled
Selectivity
Accept fewer than 50%
19.8% 8,745 34.7% 20.3%50 to 70%
37.1 5,139 38.3 40.571 to 85%
28.4 3,738 21.3 28.5More than 85%
14.8 1,918 5.7 10.7
SOURCE: Integrated Postsecondary Data System (IPEDS) online Data Center. (2009-10). U.S. Department of Education, Washington, DC: National Center for Education Statistics.

Chapter 3. Admission Strategies
• Decrease in Early Decision Apps and Admits–Only 38 Percent Reported Increases in ED Apps– 36 Percent Reported Increases in ED Admits
• Early Action Activity Holds– 72 Percent Reported Increases in EA Apps– 68 Percent Reported Increases in EA Admits
• More Colleges Use Wait Lists; Admission Chances Low– 48 Percent Used Wait List, Up From 39 Percent in 2009– 28 Percent Admitted, Down from 34 Percent in 2009

Early Decision Early Action Wait List
Total 21.6% 30.4% 47.7%
Control
Public 7.1 24.3 42.9
Private 26.3 32.4 49.3
Selectivity
Accept fewer than 50% of applicants 63.3 29.2 89.8
50 to 70% 11.6 32.8 43.5
71 to 85% 15.3 29.4 34.1
More than 85% 0.0 26.1 23.9
Yield
Enroll fewer than 30% of admitted students 26.4 42.9 57.5
30 to 45% 18.5 18.9 40.2
46 to 60% 5.7 17.1 25.7
More than 60% 35.7 28.6 50.0
Percentage of Colleges Using Early Decision, Early Action, and Wait Lists:Fall 2010
NOTE: Figures in italics should be interpreted with caution due to low sample size (fewer than 15 institutions per cell).SOURCE: NACAC Admission Trends Survey, 2010.
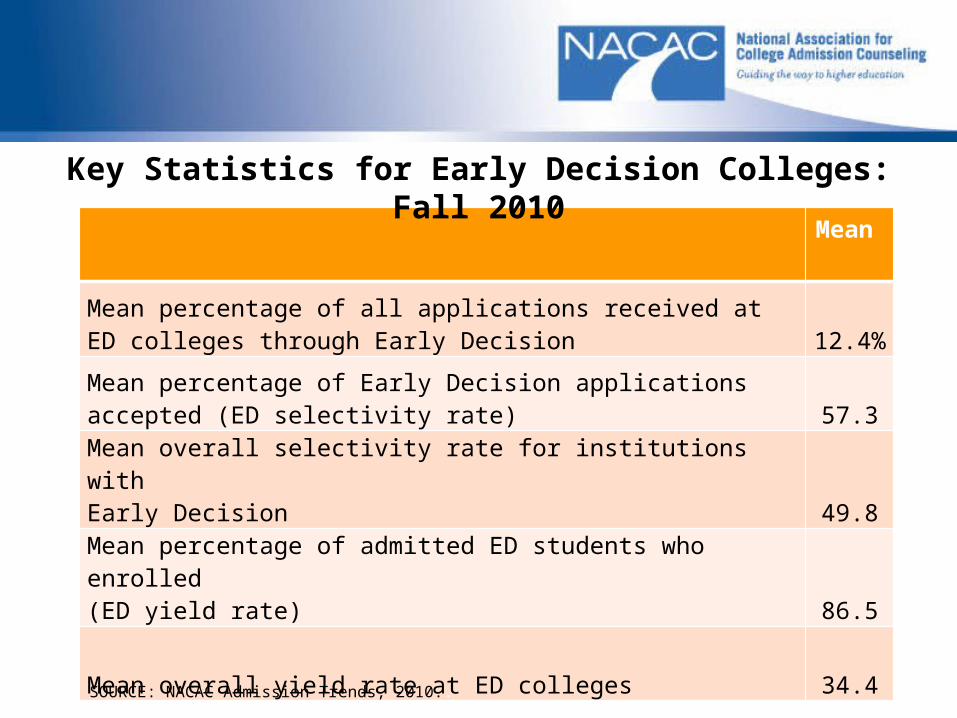
Mean
Mean percentage of all applications received at ED colleges through Early Decision 12.4%
Mean percentage of Early Decision applications accepted (ED selectivity rate) 57.3
Mean overall selectivity rate for institutions with Early Decision 49.8
Mean percentage of admitted ED students who enrolled (ED yield rate) 86.5
Mean overall yield rate at ED colleges 34.4
Key Statistics for Early Decision Colleges: Fall 2010
SOURCE: NACAC Admission Trends, 2010..
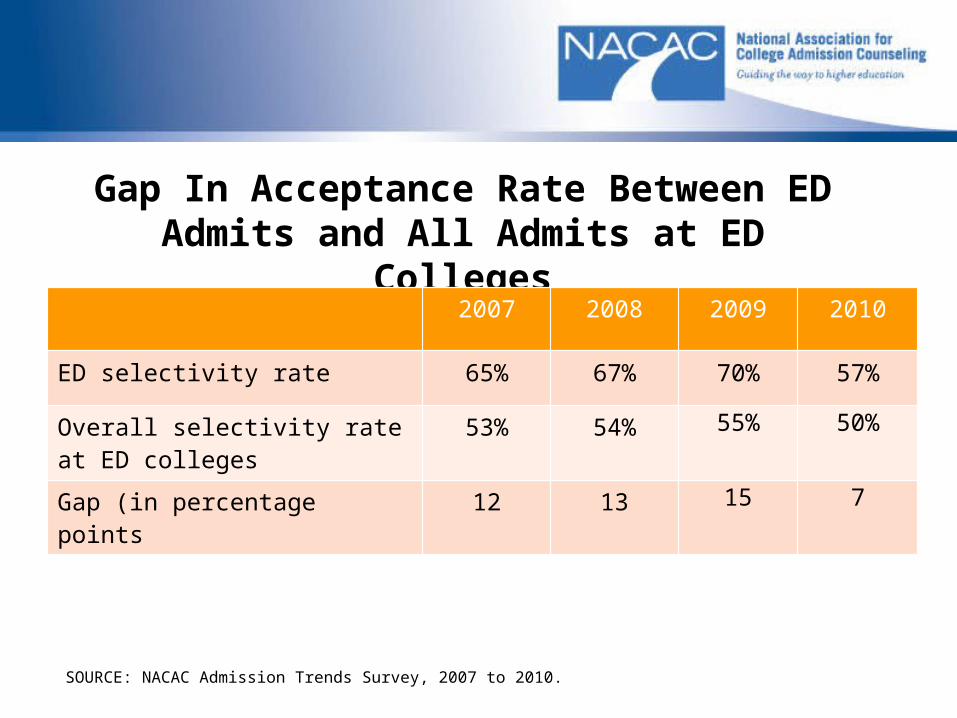
Gap In Acceptance Rate Between ED Admits and All Admits at ED Colleges
2007 2008 2009 2010
ED selectivity rate 65% 67% 70% 57%
Overall selectivity rate at ED colleges
53% 54% 55% 50%
Gap (in percentage points 12 13 15 7
SOURCE: NACAC Admission Trends Survey, 2007 to 2010.

SOURCE: NACAC Admission Trends Survey, 2010.
Mean
Mean percentage of all applications received at EA colleges through Early Action 43.7%
Mean percentage of Early Action applications accepted (EA selectivity rate) 66.3
Mean overall selectivity rate for institutionswith Early Action 66.9
Mean percentage of admitted EA students who enrolled (EA yield rate) 32.8
Mean overall yield rate at EA colleges 30.2
Key Statistics for Early Action Colleges: Fall 2010
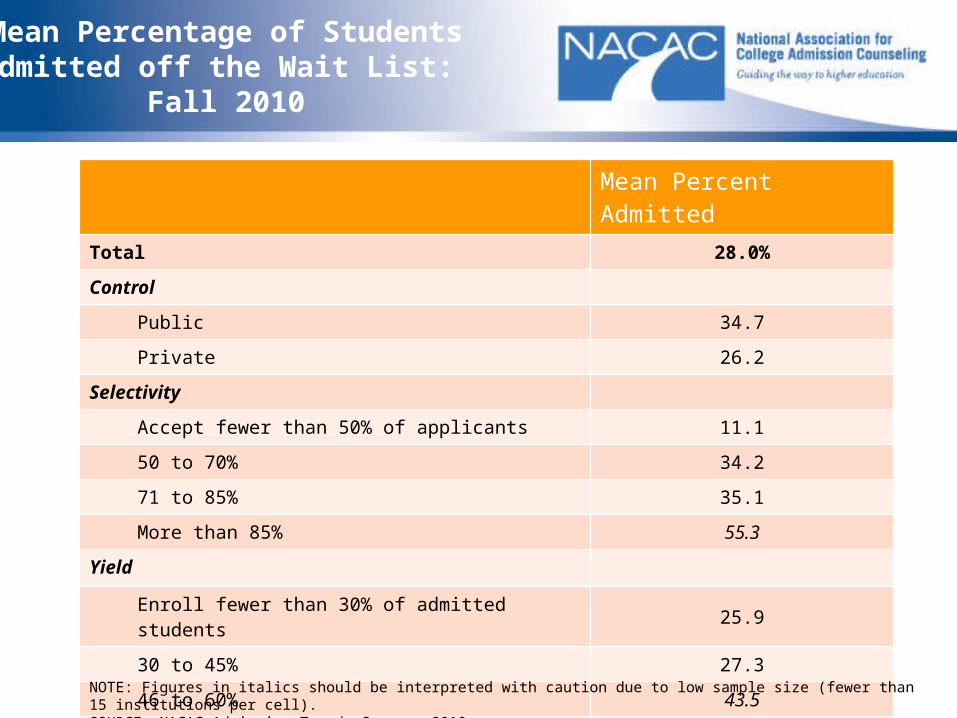
Mean Percentage of Students Admitted off the Wait List:
Fall 2010
Mean Percent AdmittedTotal 28.0%
Control
Public 34.7
Private 26.2
Selectivity
Accept fewer than 50% of applicants 11.1
50 to 70% 34.2
71 to 85% 35.1
More than 85% 55.3
Yield
Enroll fewer than 30% of admitted students 25.9
30 to 45% 27.3
46 to 60% 43.5
More than 60% 18.6
NOTE: Figures in italics should be interpreted with caution due to low sample size (fewer than 15 institutions per cell).SOURCE: NACAC Admission Trends Survey, 2010.

Chapter 4. Factors in the Admission Decision
• Top Factors Unchanged– Grades in College Prep Courses– Strength of Curriculum– Test Scores– Overall GPA
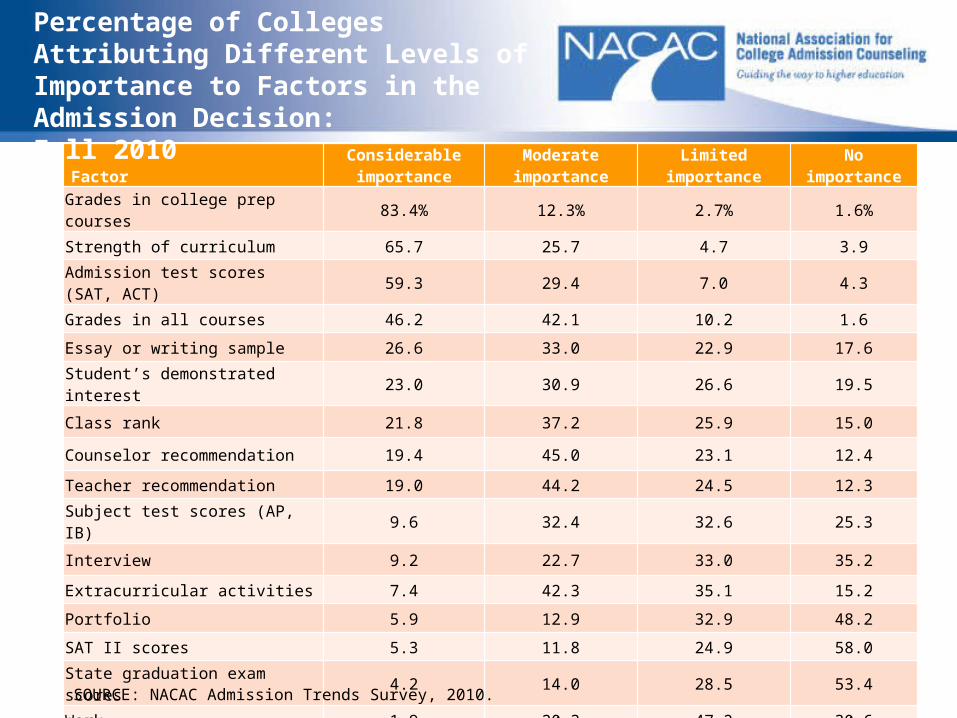
FactorConsiderable importance
Moderate importance
Limited importance No importance
Grades in college prep courses 83.4% 12.3% 2.7% 1.6%
Strength of curriculum 65.7 25.7 4.7 3.9
Admission test scores (SAT, ACT) 59.3 29.4 7.0 4.3
Grades in all courses 46.2 42.1 10.2 1.6
Essay or writing sample 26.6 33.0 22.9 17.6
Student’s demonstrated interest 23.0 30.9 26.6 19.5
Class rank 21.8 37.2 25.9 15.0
Counselor recommendation 19.4 45.0 23.1 12.4
Teacher recommendation 19.0 44.2 24.5 12.3
Subject test scores (AP, IB) 9.6 32.4 32.6 25.3
Interview 9.2 22.7 33.0 35.2
Extracurricular activities 7.4 42.3 35.1 15.2
Portfolio 5.9 12.9 32.9 48.2
SAT II scores 5.3 11.8 24.9 58.0
State graduation exam scores 4.2 14.0 28.5 53.4
Work 1.9 20.3 47.2 30.6
Percentage of Colleges Attributing Different Levels of Importance to Factors in the Admission Decision: Fall 2010
SOURCE: NACAC Admission Trends Survey, 2010.
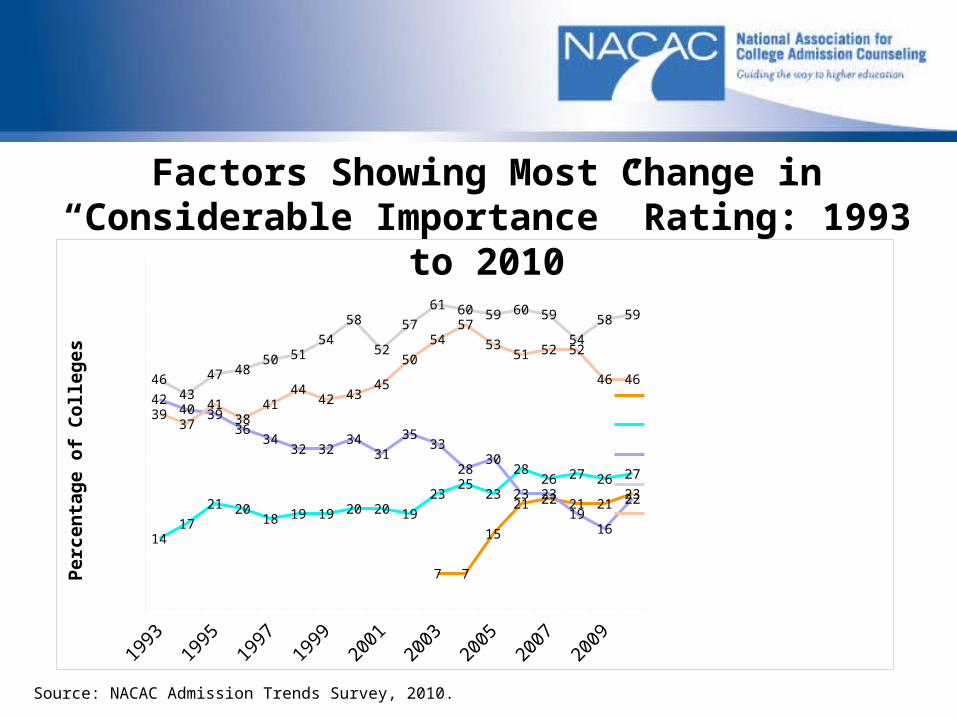
Factors Showing Most Change in “Considerable Importance” Rating: 1993 to 2010
19931995
19971999
20012003
20052007
20090
10
20
30
40
50
60
70
7 7
15
21 22 21 2123
1417
21 2018 19 19 20 20 19
2325
23
2826 27 26 27
4240 39
3634
32 3234
31
3533
2830
23 23
1916
22
4643
47 4850 51
54
58
52
57
61 60 59 60 59
54
58 59
3937
4138
4144
42 4345
50
5457
5351 52 52
46 46
Demonstrated InterestEssayClass rankAdmission test scoresGrades in all courses
Pe
rce
nta
ge
of
Co
lleg
es
Source: NACAC Admission Trends Survey, 2010.
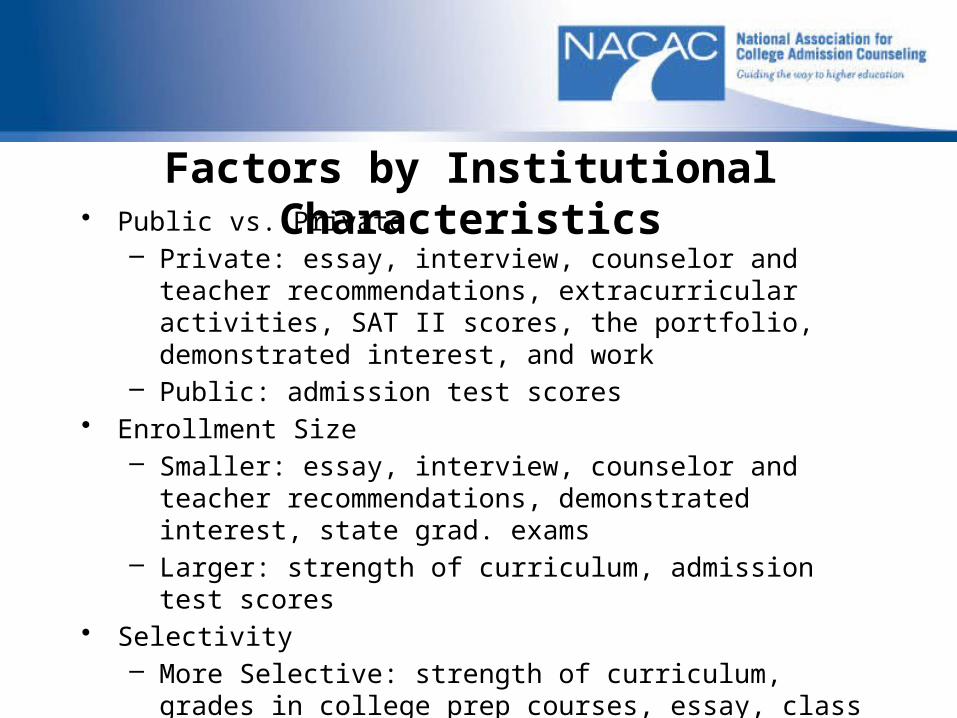
Factors by Institutional Characteristics• Public vs. Private
– Private: essay, interview, counselor and teacher recommendations, extracurricular activities, SAT II scores, the portfolio, demonstrated interest, and work
– Public: admission test scores• Enrollment Size
– Smaller: essay, interview, counselor and teacher recommendations, demonstrated interest, state grad. exams
– Larger: strength of curriculum, admission test scores• Selectivity
– More Selective: strength of curriculum, grades in college prep courses, essay, class rank, teacher and counselor recommendations, extracurricular activities, work, portfolios, subject test scores, and SAT II scores
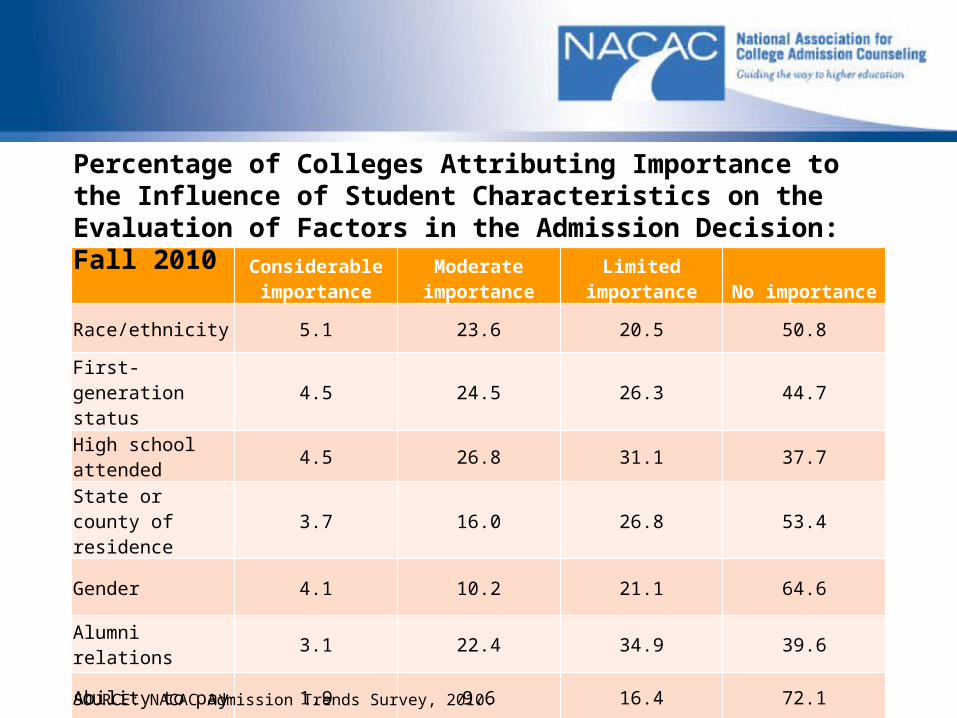
Considerable importance
Moderate importance
Limited importance No importance
Race/ethnicity 5.1 23.6 20.5 50.8
First-generation status
4.5 24.5 26.3 44.7
High school attended
4.5 26.8 31.1 37.7
State or county of residence
3.7 16.0 26.8 53.4
Gender 4.1 10.2 21.1 64.6
Alumni relations 3.1 22.4 34.9 39.6
Ability to pay 1.9 9.6 16.4 72.1
Percentage of Colleges Attributing Importance to the Influence of Student Characteristics on the Evaluation of Factors in the Admission Decision: Fall 2010
SOURCE: NACAC Admission Trends Survey, 2010.

Chapter 5. College Counseling In High Schools
• Student-to-Counselor Ratios
• Time Spent on College Counseling
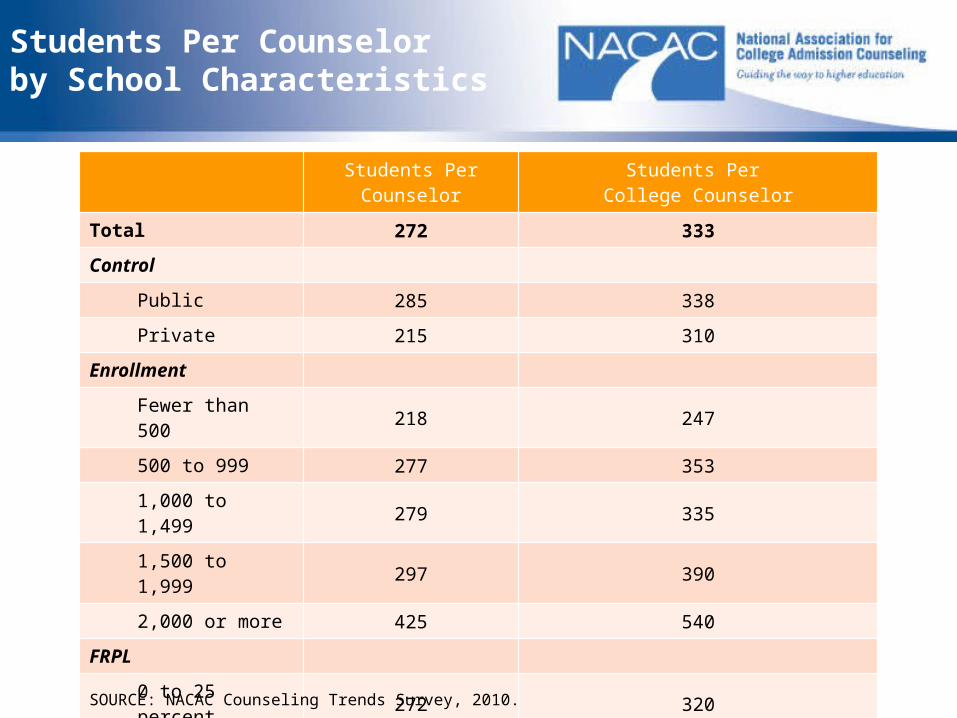
Students Per Counselor by School Characteristics
Students Per Counselor
Students Per College Counselor
Total 272 333
Control
Public 285 338
Private 215 310
Enrollment
Fewer than 500 218 247
500 to 999 277 353
1,000 to 1,499 279 335
1,500 to 1,999 297 390
2,000 or more 425 540
FRPL
0 to 25 percent 272 320
26 to 50 percent 287 327
51 to 75 percent 301 402
76 to 100 percent 237 309
SOURCE: NACAC Counseling Trends Survey, 2010.
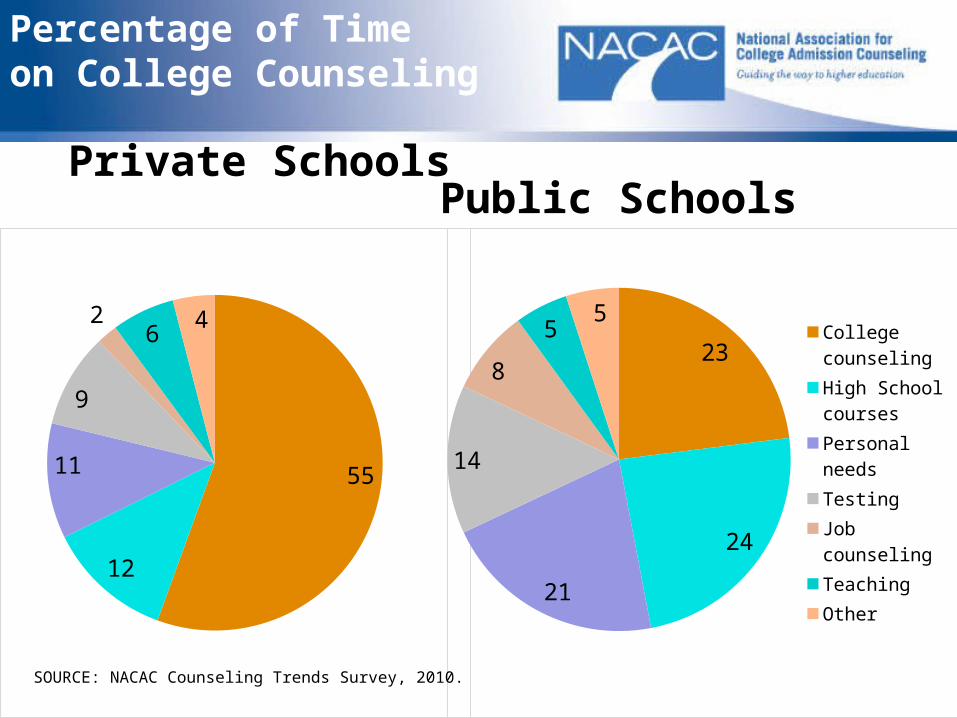
Percentage of Time on College Counseling
Private Schools
55
12
11
9
2 64
Public Schools
23
24
21
14
8
55
College counsel-ingHigh School coursesPersonal needsTestingJob counselingTeachingOther
SOURCE: NACAC Counseling Trends Survey, 2010.

Chapter 6. The Admission Office
• Applications Per Admission Officer
• Cost to Recruit
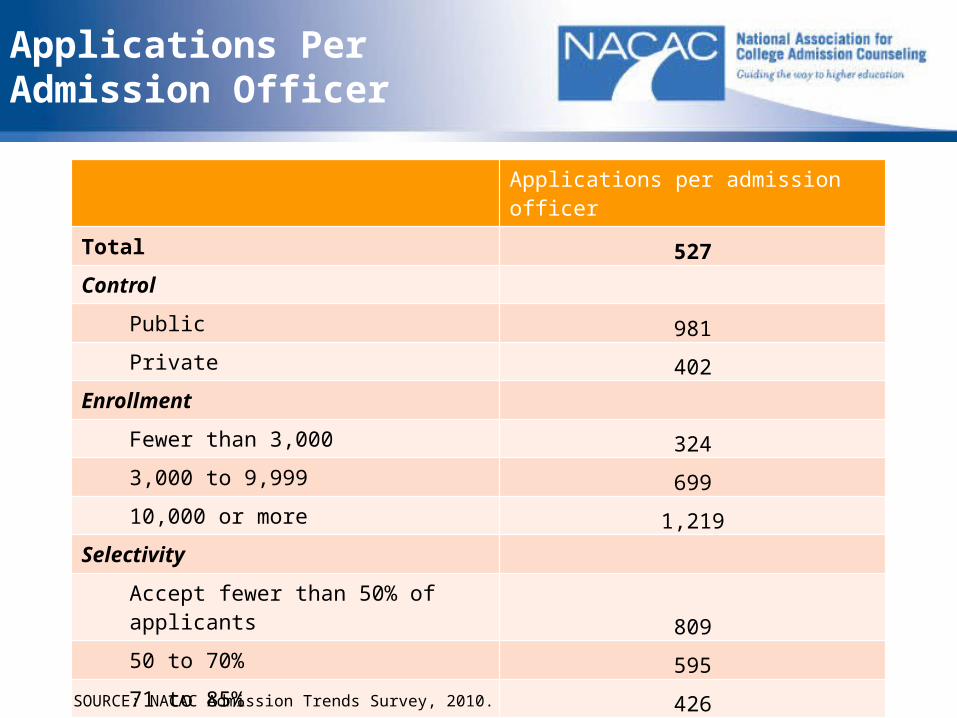
Applications Per Admission Officer
Applications per admission officer
Total 527Control
Public 981Private 402
Enrollment
Fewer than 3,000 3243,000 to 9,999 69910,000 or more 1,219
Selectivity
Accept fewer than 50% of applicants 80950 to 70% 59571 to 85% 426More than 85% 297
SOURCE: NACAC Admission Trends Survey, 2010.
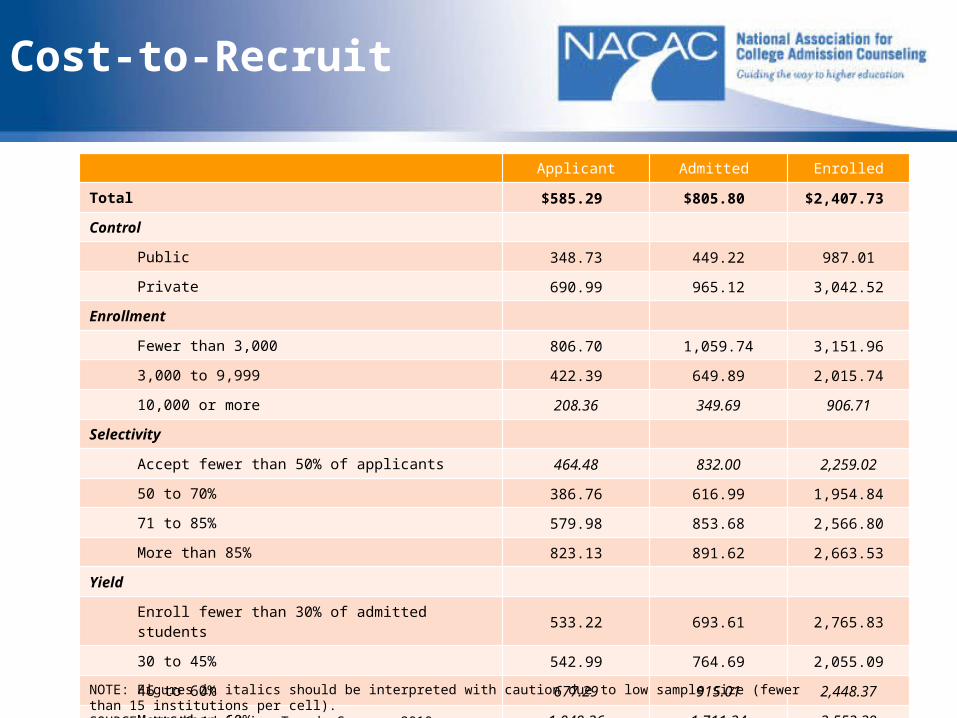
Cost-to-Recruit
Applicant Admitted Enrolled
Total $585.29 $805.80 $2,407.73
Control
Public 348.73 449.22 987.01
Private 690.99 965.12 3,042.52
Enrollment
Fewer than 3,000 806.70 1,059.74 3,151.96
3,000 to 9,999 422.39 649.89 2,015.74
10,000 or more 208.36 349.69 906.71
Selectivity
Accept fewer than 50% of applicants 464.48 832.00 2,259.02
50 to 70% 386.76 616.99 1,954.84
71 to 85% 579.98 853.68 2,566.80
More than 85% 823.13 891.62 2,663.53
Yield
Enroll fewer than 30% of admitted students 533.22 693.61 2,765.83
30 to 45% 542.99 764.69 2,055.09
46 to 60% 677.29 915.01 2,448.37
More than 60% 1,049.26 1,711.24 2,552.39
NOTE: Figures in italics should be interpreted with caution due to low sample size (fewer than 15 institutions per cell).SOURCE: NACAC Admission Trends Survey, 2010.