Embed Size (px)
Citation preview
State-of-the-art in fundamental frequency tracking
Stéphane Rossignol, Peter Desain and Henkjan Honing
Music, Mind, Machine Group, NICI, University of Nijmegen, The Netherlands, http://www.nici.kun.nl/mmm
{S.Rossignol, desain, honing}@nici.kun.nl
Abstract
Pitch-tracking has been an important topic of research in speech and music research. Several methods havebeen proposed to obtain reliable f0 trajectories from harmonic signals. The paper will review these. Someissues that are left are: how to evaluate and improve the quality and reliability of the pitch-tracking, and howto realize this in an automated method that can be use reliably and systematically on large data sets. In orderto address these issues, we will focus on an approach that takes advantage of the availability of knowledge intrying to obtain more reliable and precise f0 trajectories from monophonic and harmonic audio fragments.Two methods are compared that obtain reliable and precise f0 trajectories from monophonic audio fragments.These trajectories can be used for the analysis and modeling of vibrato (frequency modulation) in musicperformance. The pitch extraction methods take advantage of the fact that the score, the timing (theperformers synchronized with a piano accompaniment), the instrument and sometimes even the fingering isknown.
1. Introduction
1.1 Fundamental frequency extractionRobust systems that retrieve pitch information frommusical performances are still hard to design. A verylarge number of methods have been developed (seefor instance Hess 1983). We can classify pitchtrackers into five general categories: autocorrelation,adaptive filter, time domain, frequency domain andmodels of the human ears (see Roads 1996).Consider firstly the autocorrelation algorithms(Moorer 1975). These methods are most efficient atmid to low frequencies. In musical applications, thepitch range is broader.Considering the adaptive filter methods (see Lane1990), on pitch detector is based on the analysis of thedifference between the filter output and the filterinput. This difference must be close to zero. The band-pass filter center frequency is controlled by thisdifference. Another adaptive filter is based on theoptimum comb method (Lane 1990). The goal is tominimize the output signal.Considering the time domain methods, one type ofpitch detector is based of the analysis of the zero-crossing points (Moorer 1975, Hermes 1992).Preprocessing by filters has to be performed, in orderto solve the problem of the low-amplitude zero-crossings caused by high-frequency components.A few pitch detectors exist in the frequency domain.Most of them are based on the analysis of the FFT
spectrum, or of the cepstrum (Schafer and Rabiner1970).The methods based on auditory models combinefrequency and temporal methods.Most of the efforts have taken place in the frequencydomain (see Brown 1992). In this paper we presentmethods working in the temporal and in the frequencydomains (the FFT in the frequency domain; theAnalytic Signal and the Teager-Kaiser methods in thetemporal domain). It is shown that the frequencydomain method is more efficient.In order to obtain precise frequency trajectories, wemust use local strategies, that is to say we have to userelatively short frames length. However, using theFFT spectrum, we must use frames which length haveto be at least three times the period of the signal wewant to detect. For a sine with a frequency of 440 Hzthe frames length must be around 7 ms. That is to say,if the sampling rate is 11 kHz, 75 samples. Somealternatives to the FFT have been proposed in theliterature. One of them is based on the Analytic Signal(Hess, 1983; Boashash, 1992; Wang, 1994). Anotherone is based on the Teager-Kaiser energy algorithm(Maragos, 1993; Vakman, 1996). For the first oneonly two samples are needed to estimate theinstantaneous frequency and the instantaneousamplitude of a signal. For the second one, foursamples are needed. But, for both of them, the signalis assumed a pure sine, which frequency andamplitude vary slowly in time. As the musical soundsin use are composed (i.e. composed of a sum aharmonic sines) sounds, it is necessary to isolate eachharmonic by band-pass filtering.
In our case, the score of the music is known and canbe used as a guide. The pitch trackers described in thisarticle are therefore referred to as knowledge-basedpitch trackers.A pitch tracker using knowledge is described inScheirer (1995). One of the goals of the workpresented in this article is to solve the problem of thetranscription of polyphonic sounds. It is a score-aidedtranscription system. A comb-filter strategy, that is tosay a not local strategy, is used. In this article,Scheirer says: “It seems on the surface that using thescore to aid transcription is “cheating”, or worse,useless - what good is it to build a system whichextracts information you already know?”. In our case,as the amplitude of the frequency modulation isassumed to be great, the score does not follow thefrequency trajectory. The score-based pitch tracking isvery useful to solve our specific problem.
1.2 Current ResearchPitch-tracking has been an important topic of researchin speech and music research. Several methods havebeen proposed to obtain reliable f0-trajectories fromharmonic signals. The paper will review these. Someissues that are left are: how to evaluate and improvethe quality and reliability of the pitch-tracking, andhow to realize this in an automated method that can beuse reliably and systematically on large data sets.To address these issues, we will focus on an approachthat takes advantage of the availability of knowledgein trying to obtain more reliable and precise f0-trajectories from monophonic and harmonic audiofragments. It is a hard problem, especially, forinstance, when sympathetic resonance of open stringsin string instrument interfere with some harmonics ofthe main sound, or when transitions are so fast thattracks of different harmonics are connected. We willshow that knowledge about the instrument and musicplayed can be used to improve the results of thepresented methods.These methods are developed in the context of a largerproject on the analysis and modeling of vibrato inmusic performance (Desain and Honing 1996;Timmers and Desain 2000). In order to model thevibrato during notes and in note transitions accuratef0-trajectories are needed. For this a large systematicset of music performances was collected (see section1.3). The setup of the data collection provides twokinds of knowledge. Firstly, “score” information isused such as pitch information and the predicted onsettimes, using the known tempo, is used (the lattermakes it different from a score, hence the invertedcomma’s). f0
s is used for instance to fit the length ofthe frames used for the band-pass filtering and for thefn extraction (see Figures 2 and 4). During the datafusion stage, knowledge about the instrument can be
used, like its spectral characteristics. Since sometimesa frequency trajectory is too noisy to be used, causedby, for example, a missing harmonic (e.g., in windinstruments) or sympathetic resonance (e.g., in stringinstruments).We will examine here two alternative pitch extractionmethods. Both are made-up of three stages. In the firststage, for both methods, the audio signal is fedthrough a band-pass filter bank. For each of the first Nharmonics a time-varying band-pass filter is usedwhich adjusts its length and central frequencyaccording to the frequency information in the score,f0
s. Information from the instrument is used to adjustthe bandwidth to the pitch and to the speed oftransitions. Thus, each harmonic is isolated, and Nnew sounds signals are obtained. The two followingstages are not the same for the two methods.Considering the first method, in the second stage thefrequency and energy trajectories are computed foreach harmonic (peak tracking), using the signalsobtained in the previous stage. In the final stage the fi
and amplitude trajectories obtained are merged toprovide the optimal f0 trajectory. Considering theother method, in the second stage, portions of thespectrum, centered on the frequency given by thescore, are merged. In the third stage, the peak trackingis performed. During the data fusion stage, for bothmethods, instrument information is used to decide onthe correct interpretation in situations where a higherharmonic is known to be a louder or more reliablesource of f0 information than the fundamental itself, orwhere the tracks of certain harmonics of certainfundamental frequencies are known to be distorted bysympathetic resonance. For the second methodautomatic techniques to detect the bad tracks havebeen implemented.Next, we will describe the dataset that was used in theanalyses, followed by the two pitch extractionmethods (sections 2 and 3), completed by anevaluation and discussion of the results obtained(sections 4 and 5).
1.3 Data set of music performancesThe dataset used in this paper consists of a large andsystematically collected set of music performances ofa single fragment of music performances by a varietyof instruments. The fragment consists of the twentyfirst notes of “The Swan” of C. Saint-Saëns,performed along with a MIDI-controlled grand piano.This was used to control for the desired tempo, and assuch allows for studying, for example, how vibrato isadapted to note duration. Seven instruments (cello,oboe, tenor, theremin, violin, soprano, andshakuhachi) played the melody in ten different tempos(54.5, 55.8, 57.1, 58.5, 60.0, 61.5, 63.2, 64.9, 66.7 and68.8 beats per minute). And each performance was
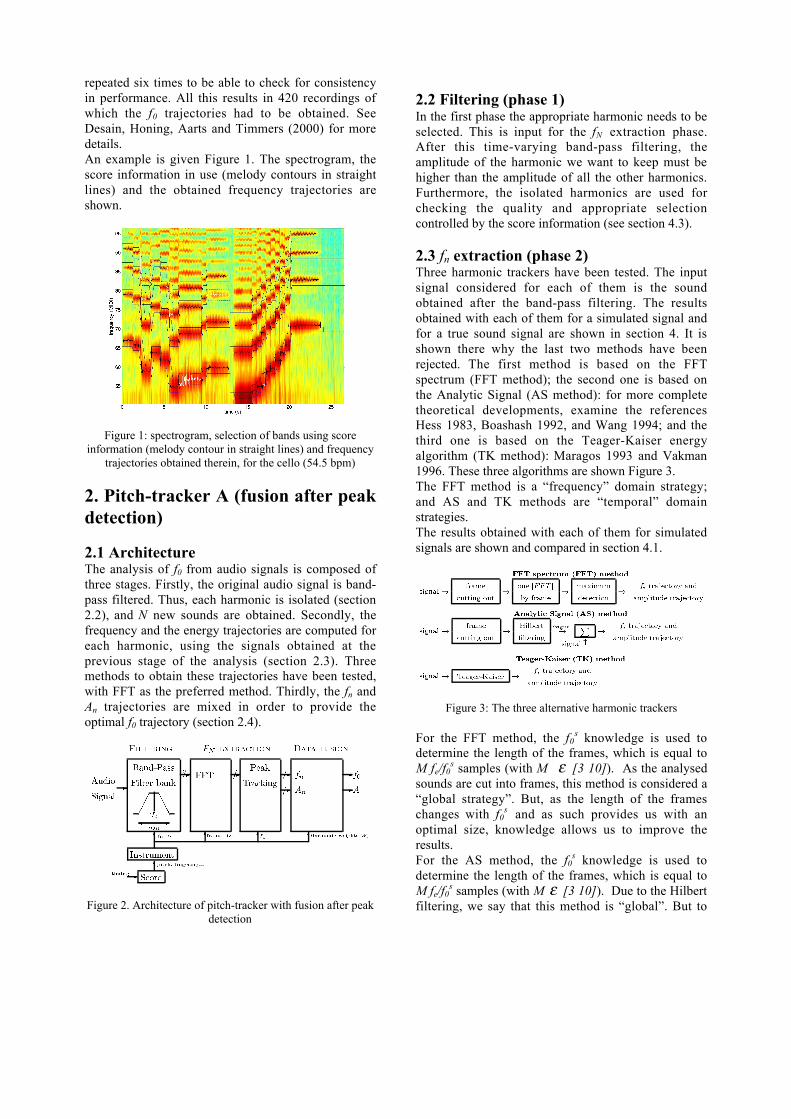
repeated six times to be able to check for consistencyin performance. All this results in 420 recordings ofwhich the f0 trajectories had to be obtained. SeeDesain, Honing, Aarts and Timmers (2000) for moredetails.An example is given Figure 1. The spectrogram, thescore information in use (melody contours in straightlines) and the obtained frequency trajectories areshown.
Figure 1: spectrogram, selection of bands using scoreinformation (melody contour in straight lines) and frequency
trajectories obtained therein, for the cello (54.5 bpm)
2. Pitch-tracker A (fusion after peakdetection)
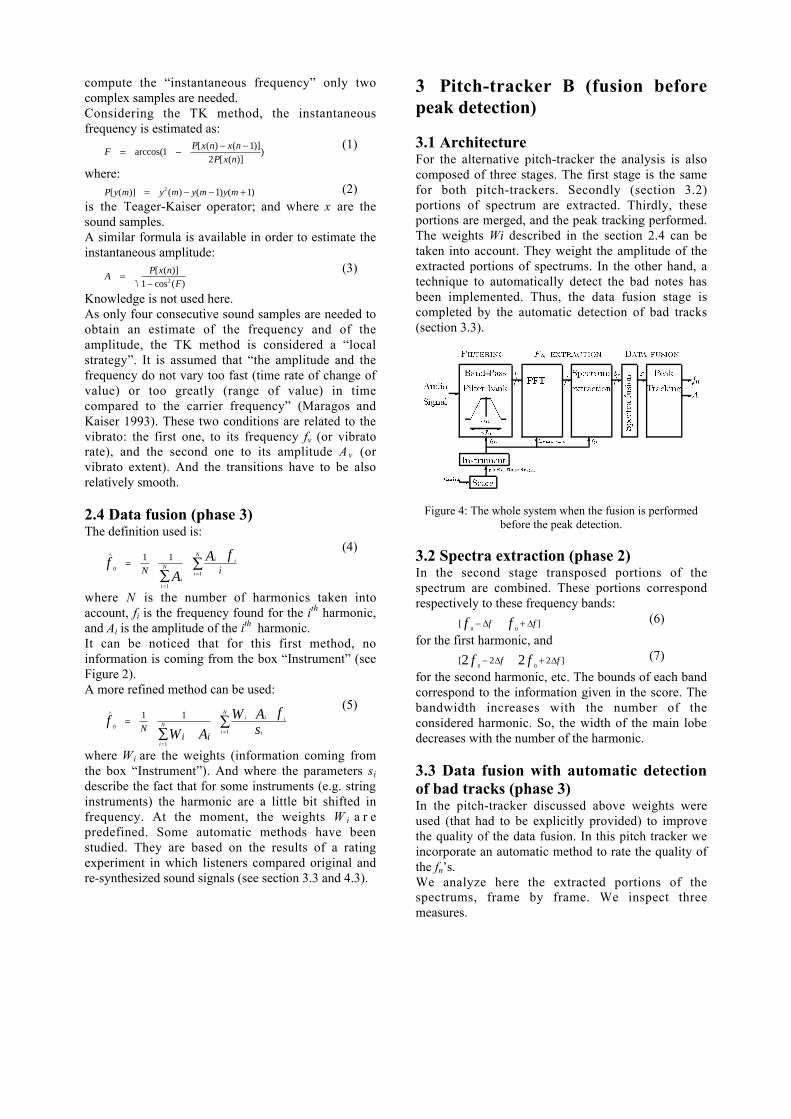
2.1 ArchitectureThe analysis of f0 from audio signals is composed ofthree stages. Firstly, the original audio signal is band-pass filtered. Thus, each harmonic is isolated (section2.2), and N new sounds are obtained. Secondly, thefrequency and the energy trajectories are computed foreach harmonic, using the signals obtained at theprevious stage of the analysis (section 2.3). Threemethods to obtain these trajectories have been tested,with FFT as the preferred method. Thirdly, the fn andAn trajectories are mixed in order to provide theoptimal f0 trajectory (section 2.4).
Figure 2. Architecture of pitch-tracker with fusion after peakdetection
2.2 Filtering (phase 1)In the first phase the appropriate harmonic needs to beselected. This is input for the fN extraction phase.After this time-varying band-pass filtering, theamplitude of the harmonic we want to keep must behigher than the amplitude of all the other harmonics.Furthermore, the isolated harmonics are used forchecking the quality and appropriate selectioncontrolled by the score information (see section 4.3).
2.3 fn extraction (phase 2)Three harmonic trackers have been tested. The inputsignal considered for each of them is the soundobtained after the band-pass filtering. The resultsobtained with each of them for a simulated signal andfor a true sound signal are shown in section 4. It isshown there why the last two methods have beenrejected. The first method is based on the FFTspectrum (FFT method); the second one is based onthe Analytic Signal (AS method): for more completetheoretical developments, examine the referencesHess 1983, Boashash 1992, and Wang 1994; and thethird one is based on the Teager-Kaiser energyalgorithm (TK method): Maragos 1993 and Vakman1996. These three algorithms are shown Figure 3.The FFT method is a “frequency” domain strategy;and AS and TK methods are “temporal” domainstrategies.The results obtained with each of them for simulatedsignals are shown and compared in section 4.1.
Figure 3: The three alternative harmonic trackers
For the FFT method, the f0s knowledge is used to
determine the length of the frames, which is equal toM fe/f0
s samples (with M ε [3 10]). As the analysedsounds are cut into frames, this method is considered a“global strategy”. But, as the length of the frameschanges with f0
s and as such provides us with anoptimal size, knowledge allows us to improve theresults.For the AS method, the f0
s knowledge is used todetermine the length of the frames, which is equal toM fe/f0
s samples (with M ε [3 10]). Due to the Hilbertfiltering, we say that this method is “global”. But to
compute the “instantaneous frequency” only twocomplex samples are needed.Considering the TK method, the instantaneousfrequency is estimated as:
FP x n x n
P x n= − − −
arccos([ ( ) ( )]
[ ( )])1
12
(1)
where:P y m y m y m y m[ ( )] ( ) ( ) ( )= − − +2 1 1 (2)
is the Teager-Kaiser operator; and where x are thesound samples.A similar formula is available in order to estimate theinstantaneous amplitude:
AP x n
F=
−[ ( )]cos ( )1 2
(3)
Knowledge is not used here.As only four consecutive sound samples are needed toobtain an estimate of the frequency and of theamplitude, the TK method is considered a “localstrategy”. It is assumed that “the amplitude and thefrequency do not vary too fast (time rate of change ofvalue) or too greatly (range of value) in timecompared to the carrier frequency” (Maragos andKaiser 1993). These two conditions are related to thevibrato: the first one, to its frequency fv (or vibratorate), and the second one to its amplitude Av (orvibrato extent). And the transitions have to be alsorelatively smooth.
2.4 Data fusion (phase 3)The definition used is:
0
1
1
1 1fA
A fN i
ii
Ni i
i
N∧
=
=
=∑
∑(4)
where N is the number of harmonics taken intoaccount, fi is the frequency found for the ith harmonic,and Ai is the amplitude of the ith harmonic.It can be noticed that for this first method, noinformation is coming from the box “Instrument” (seeFigure 2).A more refined method can be used:
0
1
1
1 1fW A
W A fsN
i ii
Ni i i
ii
N∧
=
=
=∑
∑(5)
where Wi are the weights (information coming fromthe box “Instrument”). And where the parameters si
describe the fact that for some instruments (e.g. stringinstruments) the harmonic are a little bit shifted infrequency. At the moment, the weights W i a r epredefined. Some automatic methods have beenstudied. They are based on the results of a ratingexperiment in which listeners compared original andre-synthesized sound signals (see section 3.3 and 4.3).
3 Pitch-tracker B (fusion beforepeak detection)
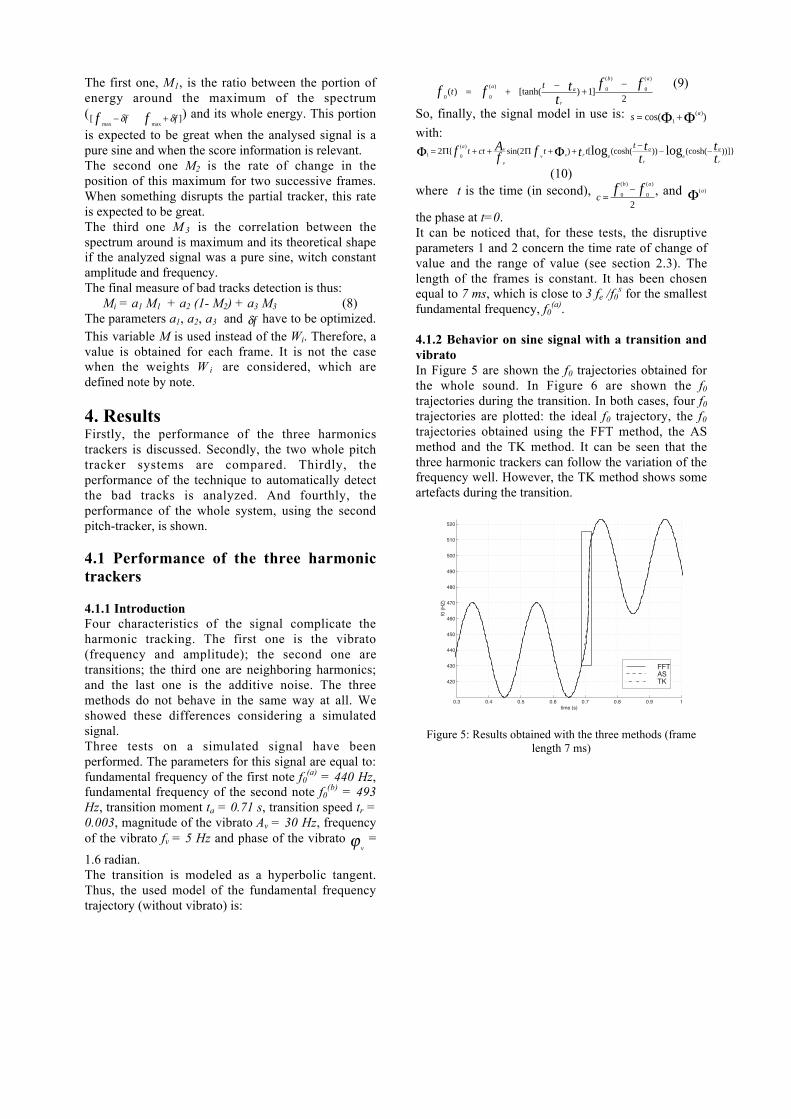
3.1 ArchitectureFor the alternative pitch-tracker the analysis is alsocomposed of three stages. The first stage is the samefor both pitch-trackers. Secondly (section 3.2)portions of spectrum are extracted. Thirdly, theseportions are merged, and the peak tracking performed.The weights Wi described in the section 2.4 can betaken into account. They weight the amplitude of theextracted portions of spectrums. In the other hand, atechnique to automatically detect the bad notes hasbeen implemented. Thus, the data fusion stage iscompleted by the automatic detection of bad tracks(section 3.3).
Figure 4: The whole system when the fusion is performedbefore the peak detection.
3.2 Spectra extraction (phase 2)In the second stage transposed portions of thespectrum are combined. These portions correspondrespectively to these frequency bands:
[ ]0 0
f ff f− +∆ ∆ (6)
for the first harmonic, and
[ ]0 0
2 22 2f ff f− +∆ ∆ (7)
for the second harmonic, etc. The bounds of each bandcorrespond to the information given in the score. Thebandwidth increases with the number of theconsidered harmonic. So, the width of the main lobedecreases with the number of the harmonic.
3.3 Data fusion with automatic detectionof bad tracks (phase 3)In the pitch-tracker discussed above weights wereused (that had to be explicitly provided) to improvethe quality of the data fusion. In this pitch tracker weincorporate an automatic method to rate the quality ofthe fn’s.We analyze here the extracted portions of thespectrums, frame by frame. We inspect threemeasures.
The first one, M1, is the ratio between the portion ofenergy around the maximum of the spectrum([ ]
max maxf ff f− +δ δ ) and its whole energy. This portion
is expected to be great when the analysed signal is apure sine and when the score information is relevant.The second one M2 is the rate of change in theposition of this maximum for two successive frames.When something disrupts the partial tracker, this rateis expected to be great.The third one M 3 is the correlation between thespectrum around is maximum and its theoretical shapeif the analyzed signal was a pure sine, witch constantamplitude and frequency.The final measure of bad tracks detection is thus:
Mi = a1 M1 + a2 (1- M2) + a3 M3 (8)The parameters a1, a2, a3 and δf have to be optimized.This variable M is used instead of the Wi. Therefore, avalue is obtained for each frame. It is not the casewhen the weights W i are considered, which aredefined note by note.
4. ResultsFirstly, the performance of the three harmonicstrackers is discussed. Secondly, the two whole pitchtracker systems are compared. Thirdly, theperformance of the technique to automatically detectthe bad tracks is analyzed. And fourthly, theperformance of the whole system, using the secondpitch-tracker, is shown.
4.1 Performance of the three harmonictrackers
4.1.1 IntroductionFour characteristics of the signal complicate theharmonic tracking. The first one is the vibrato(frequency and amplitude); the second one aretransitions; the third one are neighboring harmonics;and the last one is the additive noise. The threemethods do not behave in the same way at all. Weshowed these differences considering a simulatedsignal.Three tests on a simulated signal have beenperformed. The parameters for this signal are equal to:fundamental frequency of the first note f0
(a) = 440 Hz,fundamental frequency of the second note f0
(b) = 493Hz, transition moment ta = 0.71 s, transition speed tr =0.003, magnitude of the vibrato Av = 30 Hz, frequencyof the vibrato fv = 5 Hz and phase of the vibrato
vϕ =
1.6 radian.The transition is modeled as a hyperbolic tangent.Thus, the used model of the fundamental frequencytrajectory (without vibrato) is:
0 0
0 012
f f tt
f ft
ta a
r
b a
( ) [tanh( ) ]( )
( ) ( )
= +−
+− (9)
So, finally, the signal model in use is: s a= +cos( )( )
1Φ Φwith:
1 02 2Φ ΦΠ Π= + + + +
−− −{ sin( ) [ (cosh( )) (cosh( ))]}
( ) log loga v
vv v r e
a
re
a
r
f Af f t t
ttt
t ct t tt
(10)where t is the time (in second),
c
b af f=
−0 0
2
( ) ( )
, and ( )aΦthe phase at t=0.It can be noticed that, for these tests, the disruptiveparameters 1 and 2 concern the time rate of change ofvalue and the range of value (see section 2.3). Thelength of the frames is constant. It has been chosenequal to 7 ms, which is close to 3 fe /f0
s for the smallestfundamental frequency, f0
(a).
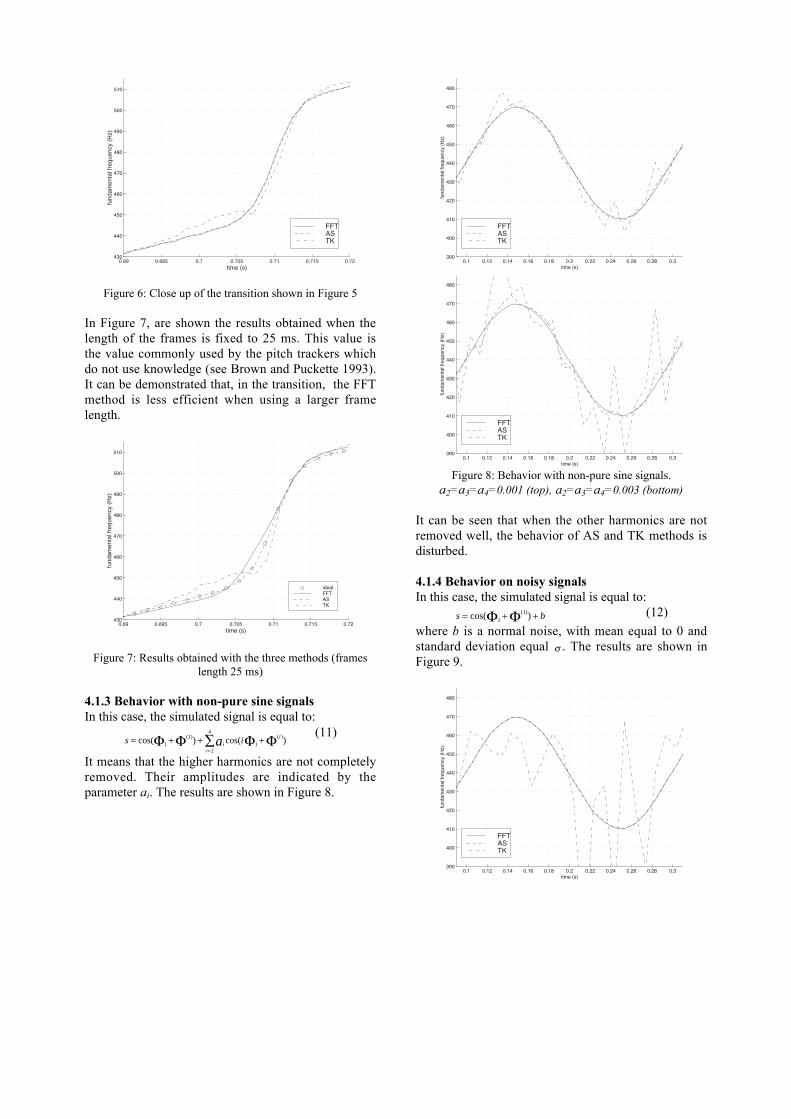
4.1.2 Behavior on sine signal with a transition andvibratoIn Figure 5 are shown the f0 trajectories obtained forthe whole sound. In Figure 6 are shown the f0
trajectories during the transition. In both cases, four f0
trajectories are plotted: the ideal f0 trajectory, the f0
trajectories obtained using the FFT method, the ASmethod and the TK method. It can be seen that thethree harmonic trackers can follow the variation of thefrequency well. However, the TK method shows someartefacts during the transition.
0.3 0.4 0.5 0.6 0.7 0.8 0.9 1
420
430
440
450
460
470
480
490
500
510
520
time (s)
f0 (
HZ
)
FFTASTK
Figure 5: Results obtained with the three methods (framelength 7 ms)
0.69 0.695 0.7 0.705 0.71 0.715 0.72430
440
450
460
470
480
490
500
510
time (s)
fund
amen
tal f
requ
ency
(H
z)
FFTASTK
Figure 6: Close up of the transition shown in Figure 5
In Figure 7, are shown the results obtained when thelength of the frames is fixed to 25 ms. This value isthe value commonly used by the pitch trackers whichdo not use knowledge (see Brown and Puckette 1993).It can be demonstrated that, in the transition, the FFTmethod is less efficient when using a larger framelength.
0.69 0.695 0.7 0.705 0.71 0.715 0.72430
440
450
460
470
480
490
500
510
time (s)
fund
amen
tal f
requ
ency
(H
z)
idealFFTASTK
Figure 7: Results obtained with the three methods (frameslength 25 ms)
4.1.3 Behavior with non-pure sine signalsIn this case, the simulated signal is equal to:
s ii
i
ia= + + +
=∑cos( ) cos( )( ) ( )
1
1
12
4
Φ Φ Φ Φ(11)
It means that the higher harmonics are not completelyremoved. Their amplitudes are indicated by theparameter ai. The results are shown in Figure 8.
0.1 0.12 0.14 0.16 0.18 0.2 0.22 0.24 0.26 0.28 0.3390
400
410
420
430
440
450
460
470
480
time (s)
fund
amen
tal f
requ
ency
(H
z)
FFTASTK
0.1 0.12 0.14 0.16 0.18 0.2 0.22 0.24 0.26 0.28 0.3390
400
410
420
430
440
450
460
470
480
time (s)
fund
amen
tal f
requ
ency
(H
z)
FFTASTK
Figure 8: Behavior with non-pure sine signals.a2=a3=a4=0.001 (top), a2=a3=a4=0.003 (bottom)
It can be seen that when the other harmonics are notremoved well, the behavior of AS and TK methods isdisturbed.
4.1.4 Behavior on noisy signalsIn this case, the simulated signal is equal to:
s b= + +cos( )( )
1
1Φ Φ (12)
where b is a normal noise, with mean equal to 0 andstandard deviation equal σ . The results are shown inFigure 9.
0.1 0.12 0.14 0.16 0.18 0.2 0.22 0.24 0.26 0.28 0.3390
400
410
420
430
440
450
460
470
480
time (s)
fund
amen
tal f
requ
ency
(H
z)
FFTASTK
0.1 0.12 0.14 0.16 0.18 0.2 0.22 0.24 0.26 0.28 0.3390
400
410
420
430
440
450
460
470
480
time (s)
fund
amen
tal f
requ
ency
(H
z)
FFTASTK
Figure 9: Behavior on noisy signals. σ = −1 5e , σ = −3 4e
Where there is noise, the AS and TK methods do notperform well.
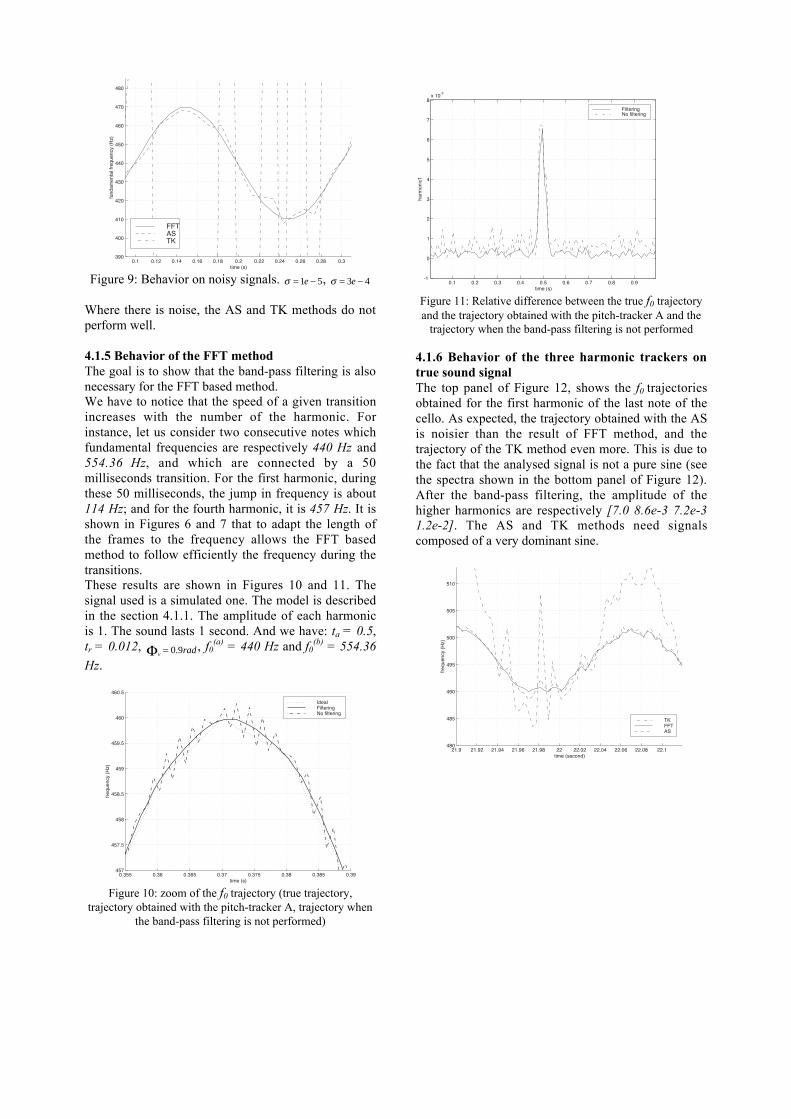
4.1.5 Behavior of the FFT methodThe goal is to show that the band-pass filtering is alsonecessary for the FFT based method.We have to notice that the speed of a given transitionincreases with the number of the harmonic. Forinstance, let us consider two consecutive notes whichfundamental frequencies are respectively 440 Hz and554.36 Hz, and which are connected by a 50milliseconds transition. For the first harmonic, duringthese 50 milliseconds, the jump in frequency is about114 Hz; and for the fourth harmonic, it is 457 Hz. It isshown in Figures 6 and 7 that to adapt the length ofthe frames to the frequency allows the FFT basedmethod to follow efficiently the frequency during thetransitions.These results are shown in Figures 10 and 11. Thesignal used is a simulated one. The model is describedin the section 4.1.1. The amplitude of each harmonicis 1. The sound lasts 1 second. And we have: ta = 0.5,tr = 0.012,
v radΦ = 0 9. , f0(a) = 440 Hz and f0
(b) = 554.36
Hz.
0.355 0.36 0.365 0.37 0.375 0.38 0.385 0.39457
457.5
458
458.5
459
459.5
460
460.5
time (s)
freq
uenc
y (H
z)
IdealFilteringNo filtering
Figure 10: zoom of the f0 trajectory (true trajectory,trajectory obtained with the pitch-tracker A, trajectory when
the band-pass filtering is not performed)
0.1 0.2 0.3 0.4 0.5 0.6 0.7 0.8 0.9-1
0
1
2
3
4
5
6
7
8x 10
-3
harm
onic
1
time (s)
FilteringNo filtering
Figure 11: Relative difference between the true f0 trajectoryand the trajectory obtained with the pitch-tracker A and the
trajectory when the band-pass filtering is not performed
4.1.6 Behavior of the three harmonic trackers ontrue sound signalThe top panel of Figure 12, shows the f0 trajectoriesobtained for the first harmonic of the last note of thecello. As expected, the trajectory obtained with the ASis noisier than the result of FFT method, and thetrajectory of the TK method even more. This is due tothe fact that the analysed signal is not a pure sine (seethe spectra shown in the bottom panel of Figure 12).After the band-pass filtering, the amplitude of thehigher harmonics are respectively [7.0 8.6e-3 7.2e-31.2e-2]. The AS and TK methods need signalscomposed of a very dominant sine.
21.9 21.92 21.94 21.96 21.98 22 22.02 22.04 22.06 22.08 22.1480
485
490
495
500
505
510
time (second)
freq
uenc
y (H
z)
TKFFTAS
0 1000 2000 3000 4000 5000 6000-160
-140
-120
-100
-80
-60
-40
-20
0
20
frequency (Hz)
ampl
itude
After filteringBefore filtering
Figure12. Top panel: f0 trajectories obtained with the threeharmonic trackers. Cello (54.5 bpm, last note, first
harmonic). Bottom panel: spectra of a frame of the originalsignal [21.9s 21.92s] and of the corresponding band-pass
filtered signal
4.1.7 DiscussionA very efficient band-pass filtering stage is absolutelynecessary for the AS and TK methods. For these twomethods, the signal given to the harmonic trackersmust be a pure sine with slowly varying amplitudeand frequency. The FFT method seems to be the best,as the use of knowledge allows us to improve itsperformance. We decided therefore to use this methodin our system.
4.2 Comparison of the two pitch trackers
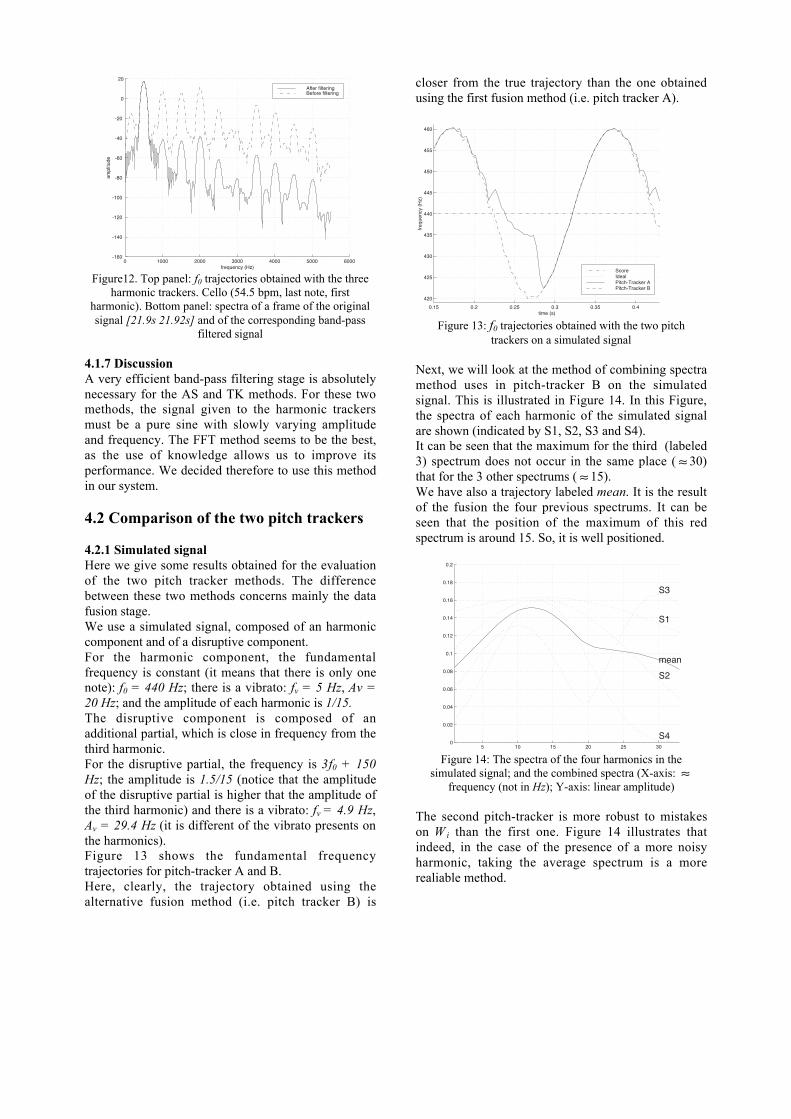
4.2.1 Simulated signalHere we give some results obtained for the evaluationof the two pitch tracker methods. The differencebetween these two methods concerns mainly the datafusion stage.We use a simulated signal, composed of an harmoniccomponent and of a disruptive component.For the harmonic component, the fundamentalfrequency is constant (it means that there is only onenote): f0 = 440 Hz; there is a vibrato: fv = 5 Hz, Av =20 Hz; and the amplitude of each harmonic is 1/15.The disruptive component is composed of anadditional partial, which is close in frequency from thethird harmonic.For the disruptive partial, the frequency is 3f0 + 150Hz; the amplitude is 1.5/15 (notice that the amplitudeof the disruptive partial is higher that the amplitude ofthe third harmonic) and there is a vibrato: fv = 4.9 Hz,Av = 29.4 Hz (it is different of the vibrato presents onthe harmonics).Figure 13 shows the fundamental frequencytrajectories for pitch-tracker A and B.Here, clearly, the trajectory obtained using thealternative fusion method (i.e. pitch tracker B) is
closer from the true trajectory than the one obtainedusing the first fusion method (i.e. pitch tracker A).
0.15 0.2 0.25 0.3 0.35 0.4
420
425
430
435
440
445
450
455
460
time (s)
freq
uenc
y (H
z)
ScoreIdealPitch-Tracker APitch-Tracker B
Figure 13: f0 trajectories obtained with the two pitchtrackers on a simulated signal
Next, we will look at the method of combining spectramethod uses in pitch-tracker B on the simulatedsignal. This is illustrated in Figure 14. In this Figure,the spectra of each harmonic of the simulated signalare shown (indicated by S1, S2, S3 and S4).It can be seen that the maximum for the third (labeled3) spectrum does not occur in the same place ( ≈ 30)that for the 3 other spectrums ( ≈ 15).We have also a trajectory labeled mean. It is the resultof the fusion the four previous spectrums. It can beseen that the position of the maximum of this redspectrum is around 15. So, it is well positioned.
5 10 15 20 25 300
0.02
0.04
0.06
0.08
0.1
0.12
0.14
0.16
0.18
0.2
S1
S2
S3
S4
mean
Figure 14: The spectra of the four harmonics in thesimulated signal; and the combined spectra (X-axis: ≈
frequency (not in Hz); Y-axis: linear amplitude)
The second pitch-tracker is more robust to mistakeson W i than the first one. Figure 14 illustrates thatindeed, in the case of the presence of a more noisyharmonic, taking the average spectrum is a morerealiable method.
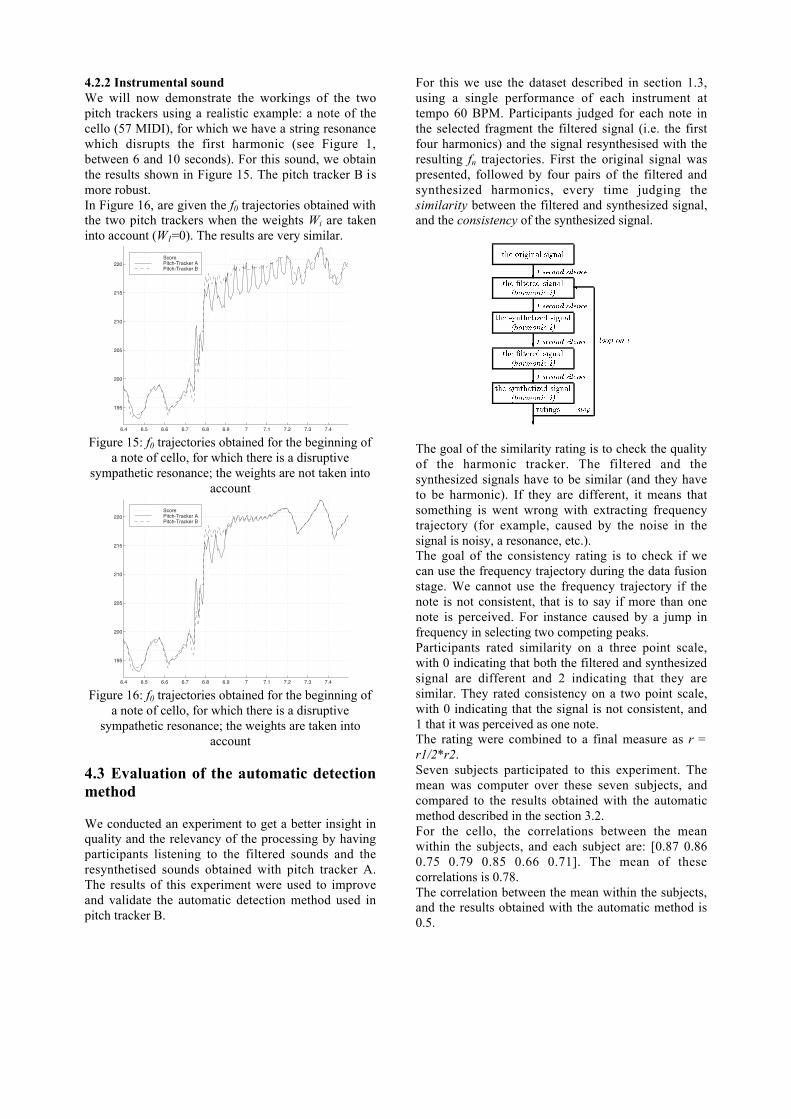
4.2.2 Instrumental soundWe will now demonstrate the workings of the twopitch trackers using a realistic example: a note of thecello (57 MIDI), for which we have a string resonancewhich disrupts the first harmonic (see Figure 1,between 6 and 10 seconds). For this sound, we obtainthe results shown in Figure 15. The pitch tracker B ismore robust.In Figure 16, are given the f0 trajectories obtained withthe two pitch trackers when the weights Wi are takeninto account (W1=0). The results are very similar.
6.4 6.5 6.6 6.7 6.8 6.9 7 7.1 7.2 7.3 7.4
195
200
205
210
215
220ScorePitch-Tracker APitch-Tracker B
Figure 15: f0 trajectories obtained for the beginning ofa note of cello, for which there is a disruptive
sympathetic resonance; the weights are not taken intoaccount
6.4 6.5 6.6 6.7 6.8 6.9 7 7.1 7.2 7.3 7.4
195
200
205
210
215
220ScorePitch-Tracker APitch-Tracker B
Figure 16: f0 trajectories obtained for the beginning ofa note of cello, for which there is a disruptive
sympathetic resonance; the weights are taken intoaccount
4.3 Evaluation of the automatic detectionmethod
We conducted an experiment to get a better insight inquality and the relevancy of the processing by havingparticipants listening to the filtered sounds and theresynthetised sounds obtained with pitch tracker A.The results of this experiment were used to improveand validate the automatic detection method used inpitch tracker B.
For this we use the dataset described in section 1.3,using a single performance of each instrument attempo 60 BPM. Participants judged for each note inthe selected fragment the filtered signal (i.e. the firstfour harmonics) and the signal resynthesised with theresulting fn trajectories. First the original signal waspresented, followed by four pairs of the filtered andsynthesized harmonics, every time judging thesimilarity between the filtered and synthesized signal,and the consistency of the synthesized signal.
The goal of the similarity rating is to check the qualityof the harmonic tracker. The filtered and thesynthesized signals have to be similar (and they haveto be harmonic). If they are different, it means thatsomething is went wrong with extracting frequencytrajectory (for example, caused by the noise in thesignal is noisy, a resonance, etc.).The goal of the consistency rating is to check if wecan use the frequency trajectory during the data fusionstage. We cannot use the frequency trajectory if thenote is not consistent, that is to say if more than onenote is perceived. For instance caused by a jump infrequency in selecting two competing peaks.Participants rated similarity on a three point scale,with 0 indicating that both the filtered and synthesizedsignal are different and 2 indicating that they aresimilar. They rated consistency on a two point scale,with 0 indicating that the signal is not consistent, and1 that it was perceived as one note.The rating were combined to a final measure as r =r1/2*r2.Seven subjects participated to this experiment. Themean was computer over these seven subjects, andcompared to the results obtained with the automaticmethod described in the section 3.2.For the cello, the correlations between the meanwithin the subjects, and each subject are: [0.87 0.860.75 0.79 0.85 0.66 0.71]. The mean of thesecorrelations is 0.78.The correlation between the mean within the subjects,and the results obtained with the automatic method is0.5.
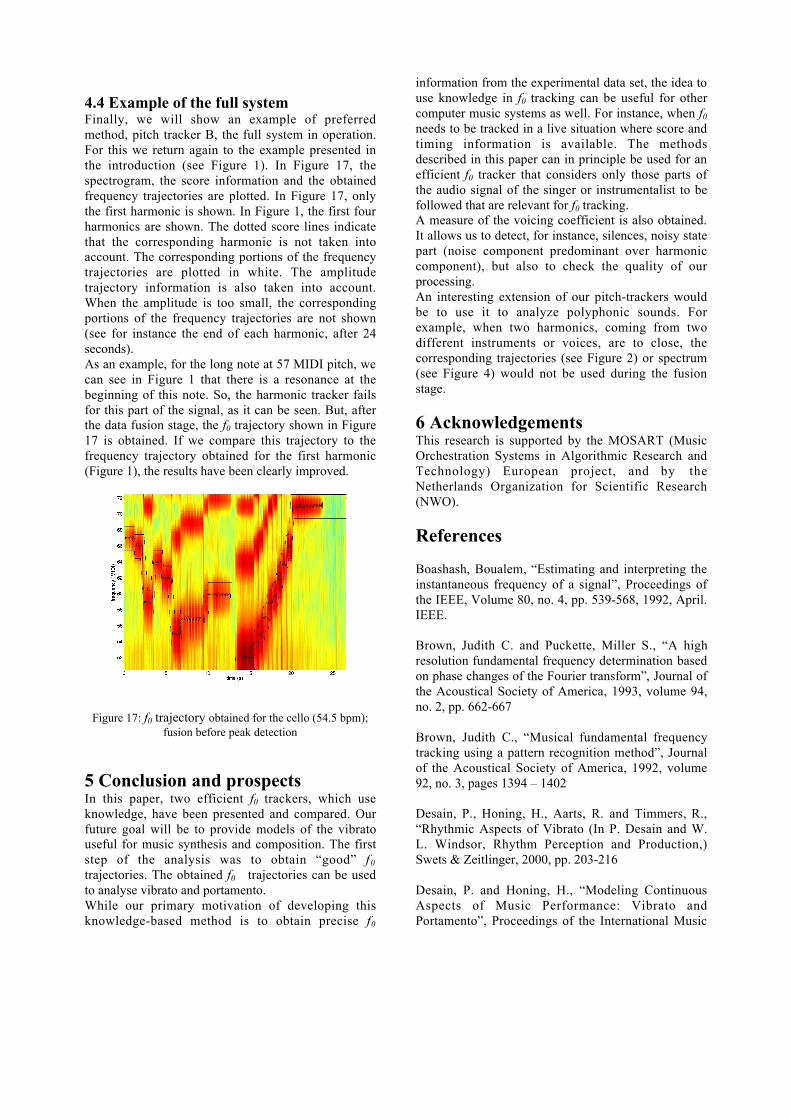
4.4 Example of the full systemFinally, we will show an example of preferredmethod, pitch tracker B, the full system in operation.For this we return again to the example presented inthe introduction (see Figure 1). In Figure 17, thespectrogram, the score information and the obtainedfrequency trajectories are plotted. In Figure 17, onlythe first harmonic is shown. In Figure 1, the first fourharmonics are shown. The dotted score lines indicatethat the corresponding harmonic is not taken intoaccount. The corresponding portions of the frequencytrajectories are plotted in white. The amplitudetrajectory information is also taken into account.When the amplitude is too small, the correspondingportions of the frequency trajectories are not shown(see for instance the end of each harmonic, after 24seconds).As an example, for the long note at 57 MIDI pitch, wecan see in Figure 1 that there is a resonance at thebeginning of this note. So, the harmonic tracker failsfor this part of the signal, as it can be seen. But, afterthe data fusion stage, the f0 trajectory shown in Figure17 is obtained. If we compare this trajectory to thefrequency trajectory obtained for the first harmonic(Figure 1), the results have been clearly improved.
Figure 17: f0 trajectory obtained for the cello (54.5 bpm);fusion before peak detection
5 Conclusion and prospectsIn this paper, two efficient f0 trackers, which useknowledge, have been presented and compared. Ourfuture goal will be to provide models of the vibratouseful for music synthesis and composition. The firststep of the analysis was to obtain “good” f0
trajectories. The obtained f0 trajectories can be usedto analyse vibrato and portamento.While our primary motivation of developing thisknowledge-based method is to obtain precise f0
information from the experimental data set, the idea touse knowledge in f0 tracking can be useful for othercomputer music systems as well. For instance, when f0
needs to be tracked in a live situation where score andtiming information is available. The methodsdescribed in this paper can in principle be used for anefficient f0 tracker that considers only those parts ofthe audio signal of the singer or instrumentalist to befollowed that are relevant for f0 tracking.A measure of the voicing coefficient is also obtained.It allows us to detect, for instance, silences, noisy statepart (noise component predominant over harmoniccomponent), but also to check the quality of ourprocessing.An interesting extension of our pitch-trackers wouldbe to use it to analyze polyphonic sounds. Forexample, when two harmonics, coming from twodifferent instruments or voices, are to close, thecorresponding trajectories (see Figure 2) or spectrum(see Figure 4) would not be used during the fusionstage.
6 AcknowledgementsThis research is supported by the MOSART (MusicOrchestration Systems in Algorithmic Research andTechnology) European project, and by theNetherlands Organization for Scientific Research(NWO).
References
Boashash, Boualem, “Estimating and interpreting theinstantaneous frequency of a signal”, Proceedings ofthe IEEE, Volume 80, no. 4, pp. 539-568, 1992, April.IEEE.
Brown, Judith C. and Puckette, Miller S., “A highresolution fundamental frequency determination basedon phase changes of the Fourier transform”, Journal ofthe Acoustical Society of America, 1993, volume 94,no. 2, pp. 662-667
Brown, Judith C., “Musical fundamental frequencytracking using a pattern recognition method”, Journalof the Acoustical Society of America, 1992, volume92, no. 3, pages 1394 – 1402
Desain, P., Honing, H., Aarts, R. and Timmers, R.,“Rhythmic Aspects of Vibrato (In P. Desain and W.L. Windsor, Rhythm Perception and Production,)Swets & Zeitlinger, 2000, pp. 203-216
Desain, P. and Honing, H., “Modeling ContinuousAspects of Music Performance: Vibrato andPortamento”, Proceedings of the International Music
Perception and Cognition Conference, B. Pennycook& E. Costa-Giomi, CD-ROM, 1996
Hermes, D., “Pitch analysis”, In M. Cooke and S.Beet, eds. Visual Representation of Speech Signals,New York, John Wiley and Sons, 1992
Hess, Wolfgang, “Pitch determination of speechsignals”, Springer-Verlag, 1983
Lane, J., “Pitch detection using a tunable IIR filter”,Computer Music Journal, Volume 14, no. 3, pp. 46-59
Maragos, Petros and Kaiser, James K., “Energyseparation in signal modulations with application tospeech analysis”, IEEE Transaction on SignalProcessing, Volume 41, no. 10, pp. 3024-3050, 1993,October
Moorer, J. A., “On the segmentation and analysis ofcontinuous musical sound”, Ph-D thesis, StanfordUniversity, Department of Music, 1975
Prame, Eric, “Measurements of the vibrato rate of tensingers”, Journal of the Acoustical Society ofAmerica, 1994, October, 1979 - 1984
Prame, Eric, “Vibrato extent and intonation inprofessional Western lyric singing”, Journal of theAcoustical Society of America, 1997, July, 616 - 621
Roads, Curtis, “The computer music tutorial”, TheMIT Press, Cambridge, Massachusetts, London,England, 1996
Rossignol, Stéphane, Desain, Peter and Honing,Henkjan, “Refined knowledge-based f 0 tracking:Comparing three frequency extraction methods”,International Computer Music Conference, 2001,September
Schafer, R., and Rabiner, L., “System for automaticformant analysis of voiced speech”, Journal of theAcoustical Society of America, Volume 47, no. 2, pp.634-644
Scheirer, Eric, “Using musical knowledge to extractexpressive performance information from audiorecordings”, IJCAI - Workshop on ComputationalAuditory Scene Analysis, 1995, August
Timmers, Renee and Desain, Peter, “Vibrato: thequestions and answers from musicians and science”,Proceedings of the International Conference on MusicPerception and Cognition, Keele University,Department of Psychology, CD-ROM, 2000
Vakman, David, “On the AS, the TK energyalgorithm and other methods for defining amplitudeand frequency”, IEEE Transaction on SignalProcessing, Volume 44, no. 4, pp. 791-797, 1996,April
Wang, Avery Li-Chun, “Instantaneous and frequency-warped signal processing techniques for auditorysource separation”, Ph. D. thesis, Stanford University,1994, August


![1 Multiple Fundamental Frequency Estimation by Modeling ...zduan/resource/Duan... · fundamental frequency, pitch estimation, spectral peaks, maximum likelihood. I. ... Klapuri [16],](https://img.pdfslide.net/doc/110x75/60d3914c0ae22457511314dd/1-multiple-fundamental-frequency-estimation-by-modeling-zduanresourceduan.jpg)