Embed Size (px)
Citation preview
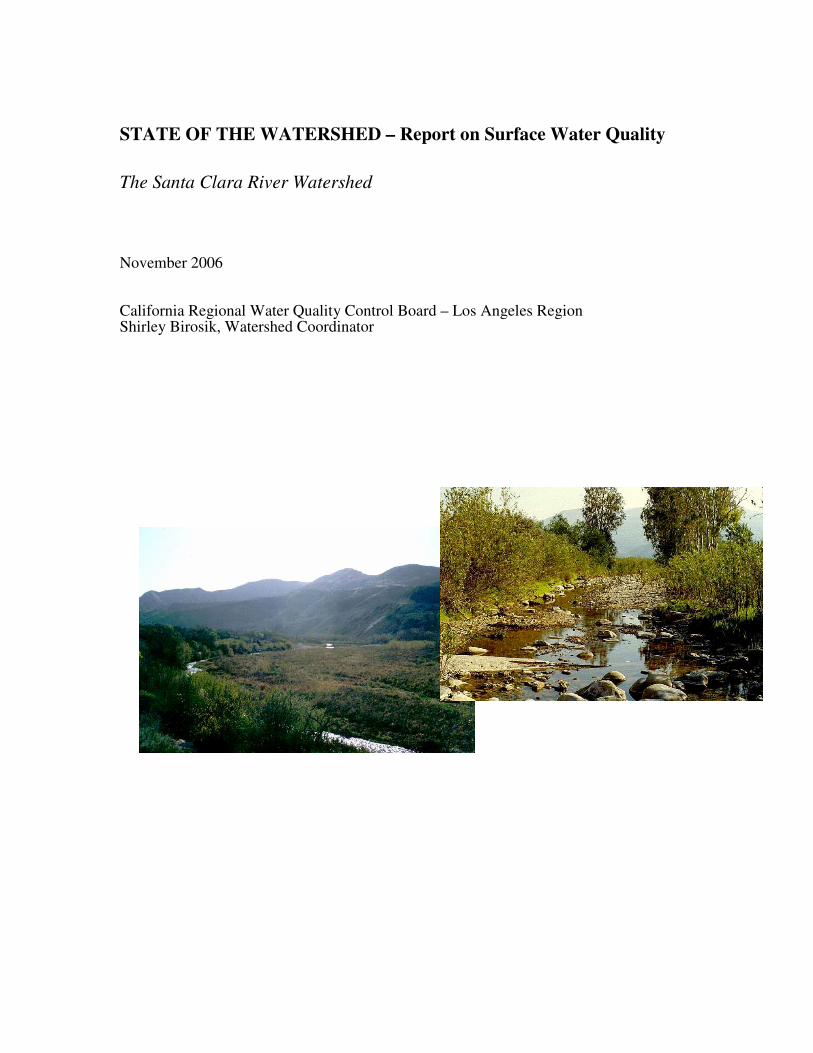
STATE OF THE WATERSHED – Report on Surface Water Quality
The Santa Clara River Watershed
November 2006
California Regional Water Quality Control Board – Los Angeles RegionShirley Birosik, Watershed Coordinator
PREFACE
This report is a descriptive document and no policy or regulation is either expressed or intended.It is one in a series written by the Regional Board’s watershed coordinator which summarizes andcharacterizes surface water quality data for the Region’s watersheds. These reports may servemany functions but they are primarily written to educate the public on the kinds of water qualitydata available and what the data are generally saying. The Regional Board is often asked verybasic questions about water quality in the Region and in many instances State of Watershedreports answer these questions. Some previous State of Watershed reports have been cited byother agencies in their environmental impact reports for various projects or have been used tojustify pursuing grant funding to address problems noted. Another major purpose of the reports isto show how effectively or ineffectively we are all collectively doing monitoring and sharing databy going through the process of acquiring and merging data (including much historic data) fromdifferent sources and making these data accessible. Some of the people accessing them in thefuture may be Total Maximum Daily Load (TMDL) staff at the Regional Board but these reportsare not pre-determining their conclusions, just reducing time spent on data/informationassemblage and organization.
Reference to groundwater quality is made due to the close linkage in this watershed betweensurface water and groundwater quality. However, this report is not meant to be a thoroughevaluation of groundwater quality or the interactions between surface and ground water. Muchwork by other Regional Board staff on the latter topic will be forthcoming in the near future.There is some discussion of the watershed’s natural resources due to their extensive nature andsince there are many wildlife-related beneficial uses sensitive to water quality problems;however, this report is not meant to be a complete documentation of these resources.
While a number of stakeholders in the watershed are currently involved in litigation on waterissues, this topic has not been addressed in the report which is focused on a description of thewatershed, descriptions of discharges and diversions of water, and an evaluation of surface waterquality data.
The report does contain an evaluation of data by stream Reach; however, this is not an officialWater Quality Assessment, merely a point of discussion. It should be noted that the Reachdesignations described here are as they appear in the Regional Board’s Basin Plan; some Reachesmay be described differently in the current 303(d) list. Hydrologic areas/subareas, andgroundwater basins/subbasins are based on California Department of Water Resourcesdescriptions as are the groundwater subbasin acreages.
An announcement of the draft report’s availability for review and comment was made to the E-mail list previously assembled by UC Cooperative Extension for the Santa Clara Watershed U.Comments were received from the City of Santa Clarita, Castaic Lake Water Agency, CountySanitation Districts of Los Angeles County, Friends of the Santa Clara River, United WaterConservation District, and Ventura County Watershed Protection District. Prior to release of thepublic draft, in-house comments were provided by Regional Board staff.
November 2006
Shirley Birosik [email protected] CoordinatorCalifornia Regional Water Quality Control Board, Los Angeles Region
ii
TABLE OF CONTENTS
EXECUTIVE SUMMARY........................................................................................................ iiiSTATE OF THE WATERSHED ................................................................................................ 1
Physical Description of Watershed ......................................................................................... 1Groundwater/Surface Water Interactions ................................................................................ 9Water Agencies and Water Use............................................................................................. 10Major Historical Events in Watershed .................................................................................. 13Biological Setting .................................................................................................................. 13The Watershed’s Designated Beneficial Uses....................................................................... 17Stakeholder Groups ............................................................................................................... 21Land Use Characteristics....................................................................................................... 23Discharges into the Watershed .............................................................................................. 24Water Quality Impairments ................................................................................................... 35Surface Water Quality Data Summaries from Previous Reports........................................... 36Discussion of Combined Surface Water Quality Dataset...................................................... 41Recommendations for Future Water Quality Monitoring ..................................................... 51Regional Board Activities Addressing Water Quality Issues................................................ 52References ............................................................................................................................. 54
iii
EXECUTIVE SUMMARY
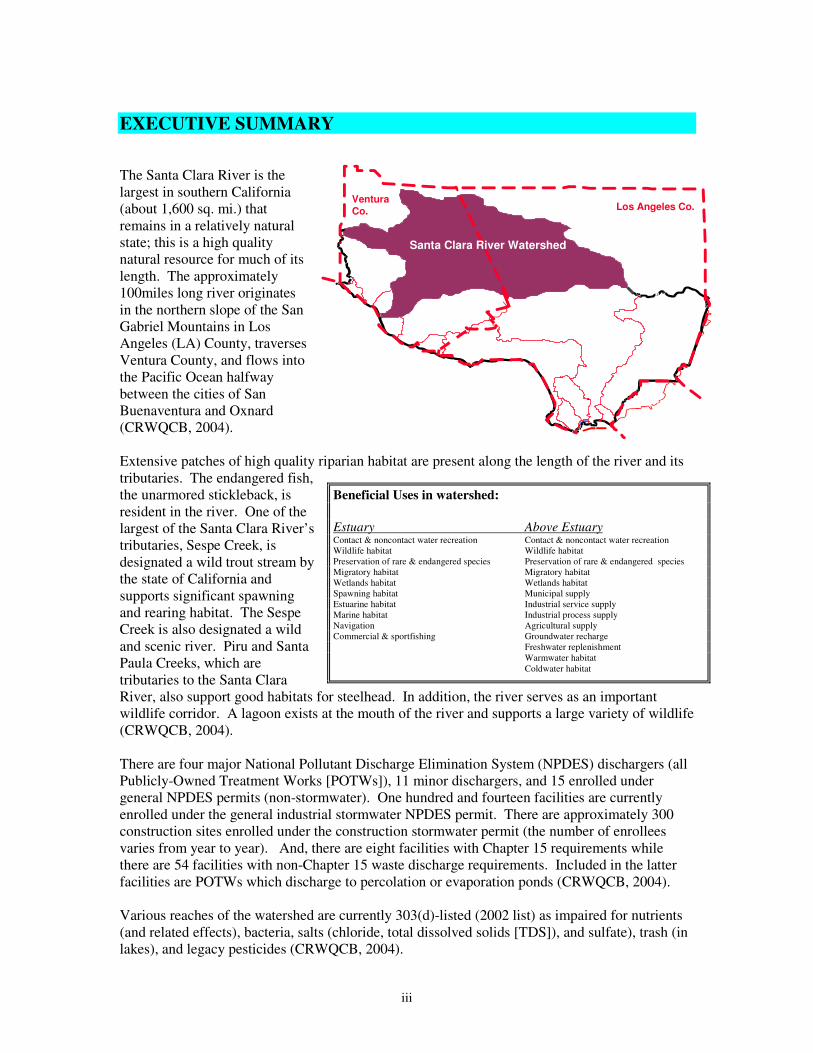
The Santa Clara River is thelargest in southern California(about 1,600 sq. mi.) thatremains in a relatively naturalstate; this is a high qualitynatural resource for much of itslength. The approximately100miles long river originatesin the northern slope of the SanGabriel Mountains in LosAngeles (LA) County, traversesVentura County, and flows intothe Pacific Ocean halfwaybetween the cities of SanBuenaventura and Oxnard(CRWQCB, 2004).
Extensive patches of high quality riparian habitat are present along the length of the river and itstributaries. The endangered fish,the unarmored stickleback, isresident in the river. One of thelargest of the Santa Clara River’stributaries, Sespe Creek, isdesignated a wild trout stream bythe state of California andsupports significant spawningand rearing habitat. The SespeCreek is also designated a wildand scenic river. Piru and SantaPaula Creeks, which aretributaries to the Santa ClaraRiver, also support good habitats for steelhead. In addition, the river serves as an importantwildlife corridor. A lagoon exists at the mouth of the river and supports a large variety of wildlife(CRWQCB, 2004).
There are four major National Pollutant Discharge Elimination System (NPDES) dischargers (allPublicly-Owned Treatment Works [POTWs]), 11 minor dischargers, and 15 enrolled undergeneral NPDES permits (non-stormwater). One hundred and fourteen facilities are currentlyenrolled under the general industrial stormwater NPDES permit. There are approximately 300construction sites enrolled under the construction stormwater permit (the number of enrolleesvaries from year to year). And, there are eight facilities with Chapter 15 requirements whilethere are 54 facilities with non-Chapter 15 waste discharge requirements. Included in the latterfacilities are POTWs which discharge to percolation or evaporation ponds (CRWQCB, 2004).
Various reaches of the watershed are currently 303(d)-listed (2002 list) as impaired for nutrients(and related effects), bacteria, salts (chloride, total dissolved solids [TDS]), and sulfate), trash (inlakes), and legacy pesticides (CRWQCB, 2004).
Beneficial Uses in watershed:
Estuary Above EstuaryContact & noncontact water recreation Contact & noncontact water recreationWildlife habitat Wildlife habitatPreservation of rare & endangered species Preservation of rare & endangered speciesMigratory habitat Migratory habitatWetlands habitat Wetlands habitatSpawning habitat Municipal supplyEstuarine habitat Industrial service supplyMarine habitat Industrial process supplyNavigation Agricultural supplyCommercial & sportfishing Groundwater recharge
Freshwater replenishmentWarmwater habitatColdwater habitat
Los Angeles Co.VenturaCo.
Santa Clara River Watershed
STATE OF THE WATERSHED
Physical Description of Watershed
The Santa Clara River is the largest river system in southern California remaining in a relativelynatural state. Its headwaters begin at Pacifico Mountain in the San Gabriel Mountains near Actonand it flows in a westerly direction toward the Oxnard Plain before discharging to the PacificOcean near the Ventura Marina. The watershed area is 1,634 square miles. Major tributariesinclude Castaic and San Francisquito Creeks in Los Angeles County and Sespe, Piru, and SantaPaula Creeks in Ventura County. About 40% of the watershed is located in Los Angeles Countyand 60% is in Ventura County. Much of the watershed is in mountainous terrain within either theAngeles or Los Padres National Forests (AMEC, 2005) (Figure 1).
The river exhibits some perennial flow in its eastern-most stretches within the Angeles NationalForest, then flows intermittently westward within Los Angeles County. The principal tributariesof the upper river are Castaic Creek, Bouquet Canyon Creek, San Francisquito Creek, and theSouth Fork of the Santa Clara River. Placerita Creek is a large tributary draining the westernmostend of the San Gabriel Mountains; it joins the South Fork which flows directly into the SantaClara River (CDWR, 1993). Castaic Creek is a south-trending creek originating near LiebreMountain that confluences with the Santa Clara River downstream of the City of Santa Clarita.The Castaic Lake Reservoir is located on Castaic Creek (CPUC website). San FrancisquitoCanyon Creek is an intermittent stream in the watershed adjacent to Bouquet Canyon to thesoutheast (CDWR, 1993).
Three small lakes are located in a normally enclosed valley in the northeastern portion of thewatershed. Lake Elizabeth and Lake Hughes are maintained by seasonal runoff and may also befed by subsurface flows trapped by the San Andreas Fault. Lake Elizabeth overflowsoccasionally through a meandering channel into Munz Lake and thence into Lake Hughes. MunzLake, an artificial lake, is maintained by ground water pumped into it from a nearby well. Abedrock sill prevents surface outflow from Lake Hughes to Elizabeth Lake Canyon (and thenceinto Castaic Lake), except during heavy storms (CDWR, 1993).
Prior to the 1960s, the upper Santa Clara River (east of the County line) was largelyrural/agricultural. By 1993, agricultural lands represented less than 7 percent of the developedlands. The city of Santa Clarita is the only incorporated city in the upper watershed (incorporatedin 1987). Approximately 75% of the land in the upper Santa Clara River is within the AngelesNational Forest (CDWR, 1993).
The braided streambed and floodplain of the Santa Clara River mainstem consists of sandy andgravelly material and is highly permeable over much of its length which results in large quantitiesof surface water infiltrating into the ground water (CDWR, 1993).
Because they are perennial, effluent discharges to the river may have a greater potential effect onground water quality, particularly during dry seasons and dry years, whereas flood flows maypass quickly through the basin. Conversely, the ground waters generally contain higherconcentrations of dissolved solids than surface waters at the same locality so greater discharge ofground water to the stream can greatly affect the quality of surface waters, particularly during lowflows (CDWR, 1993).
State of the Watershed – Report on Surface Water QualitySanta Clara River Watershed, November 2006
2
The Saugus WRP discharges to the river below Bouquet Canyon (Reach 6) and has a dry weatherdesign capacity of 6.5 millions of gallons per day (MGD). The Valencia WRP discharges to theriver further downstream (Reach 5), about 1/3 mile downstream from the Old Highway Bridgeand the Interstate-5 freeway near Rye Canyon Boulevard and has a dry weather capacity of 12.6MGD (CRWQCB, 2004). Some of the treated effluent from the facilities is recycled for use inlandscape irrigation. Ground water begins rising just upstream of the discharge, therefore, mostof the effluent remains as surface flow and can be a large component of surface flow at the countyline. Other sources of perennial flows besides rising groundwater and WRP effluent includetributary flows from Castaic Creek as well as agricultural return flows (CDWR, 1993).
The mainstem river continues to flow above-ground from the upper Santa Clara River untilupstream of the confluence with Piru Creek where it generally becomes dry due to highlypermeable soils. Perennial flow generally returns downstream of the confluence with HopperCanyon Creek and continues through Piru, Sespe, and Santa Paula Creeks, and into the OxnardPlain (Bachman, 2006). There are a total of eleven reaches defined in the Basin Plan by theRegional Board for the river and its tributaries (Figure 2) which very generally correspond tohydrologic areas (HAs) and subareas (HSAs) referenced frequently in documents produced by theDepartment of Water Resources (CRWQCB, 1994) (Figure 3).
Other wastewater treatment facilities in the lower reaches of the river which discharge to surfacewaters or to the ground include (CRWQCB, 2004):• The Piru Wastewater Treatment Plant which serves the community of Piru. It has a design
capacity of 260,000 gallons per day (gpd) and discharges secondary-treated effluent to twopercolation ponds located about 500 feet from the Santa Clara River (Reach 4).
• The Fillmore Wastewater Treatment Plant which discharges secondary-treated wastewater(1.33 MGD design flow) to percolation/evaporation ponds and/or to a subsurface percolationfield or to the Santa Clara River in Reach 3 if the groundwater table is high. The surfacewater discharge accounts for approximately 30% of the total effluent discharged annually.
• The Santa Paula Wastewater Reclamation Facility which discharges secondary-treatedwastewater (2.55 MGD design capacity) to the Peck Road storm drain which flows into anatural, unlined channel and thence to the Santa Clara River in Reach 3.
• The Saticoy Sanitary District Treatment Facility which discharges a design capacity of300,000 gpd treated municipal wastewater to evaporation/percolation ponds located on thenorth bank of the Santa Clara River (Reach 2).
• The Ventura Water Reclamation Facility which discharges tertiary-treated wastewater (14MGD design capacity) from domestic, commercial, and industrial sources into the SantaClara River Estuary.
Piru Creek
Piru Creek is a major tributary of the Santa Clara River that flows intermittently through portionsof the Angeles and Los Padres National Forests. Piru Creek has its headwaters at approximately5,200 feet above mean sea level (MSL) in Lockwood Valley located approximately 25 milesnortheast of the City of Ventura. The subwatershed is characterized by both highly erodible andhighly resistant rocks resulting in broad alluvial subbasins alternating with gorges incised inbedrock. The Piru Creek subwatershed encompasses approximately 318,000 acres (SCWRPwebsite).
State of the Watershed – Report on Surface Water QualitySanta Clara River Watershed, November 2006
3
Several drainages in the upper subwatershed supply Piru Creek with year-round flows includingLockwood, Alamo, Seymour, Amargosa, and San Guillermo Creeks. The surrounding mountainscontain metamorphic and granitic rocks. Historically, colemanite was mined in the headwatersystem and gold mines were established just south of Piru Creek. The creek meanders eastwardapproximately 30 miles while dropping 2,200 feet in elevation through a series of open valleysand steep gorges before reaching the Pyramid Lake Reservoir. Below the Pyramid Dam, themajor tributaries within the lower subwatershed include Agua Blanca and Fish Creek locatedapproximately a mile upstream from Blue Point Campground and 3 miles below Frenchman's Flatjust south of Pyramid Lake, respectively. Most flow becomes subsurface in the lower reaches ofthese creeks. The creek below Pyramid Dam has an average slope of approximately two percentand contains scattered riffle-pool formations until reaching Lake Piru, behind Santa Felicia Dam.The creek then continues downstream through Piru Canyon, eventually merging with the SantaClara River (SCWRP website).
Of the three major tributaries to the lower Santa Clara River, only Piru Creek has major structuralcontrols on its flows (CDWR website).
Sespe Creek
Sespe Creek is a major tributary of the Santa Clara River that flows through the southern portionof the Los Padres National Forest. Sespe Creek contributes approximately 40 percent of the totalnatural runoff in the Santa Clara River basin, which typically occurs from January through April.Flow in the upper portions of Sespe Creek and its tributaries may be intermittent at times butgenerally the majority of the Creek flows year-round (CDWR, 1989). Approximately 75 percentof the Sespe Creek subwatershed is characterized by rugged slopes and canyon walls of southernPine Mountains and the northern slopes of the Topatopa Mountains. Elevations range fromapproximately 2,500 to 7,510 feet above MSL. The Sespe Creek subwatershed encompassesapproximately 207,700 acres (SCWRP website).
The Sespe Creek headwaters originate near the Ventura/Santa Barbara County boundary withinthe Transverse Range of southern California. Numerous small tributaries located within the PineMountains ridges supply Sespe Creek with year-round flows including Abadi, Adobe, Cherry,Ladybug, and Burro Creeks. The tributaries range from low-gradient, small channels withmoderately dense riparian vegetation to steep, narrow, boulder-lined canyons with little or noriparian vegetation. The creek flows in an easterly direction through a narrow depression betweenthe Pine Mountain and Santa Ynez Faults before flowing southward. Major tributaries include theLion Canyon, Hot Springs Canyon, Timber, and West Fork (SCWRP website).
Sespe Creek supports a variety of land uses and vegetation types. Several campgrounds occuralong the drainage that provide limited access and recreational opportunities. The lower portionof the drainage near the Santa Clara River valley contains urban (the City of Fillmore) andagricultural development (SCWRP website).
The creek has several designations aimed at preserving its unique resources. The approximately219,700-acre Sespe Wilderness Area encompasses 31.5 miles of Sespe Creek. Established in1992, the Wilderness Area contains a 53,000-acre Sespe Condor Sanctuary. Approximately 10.5miles of upper Sespe Creek have been designated as Wild and Scenic. Furthermore, the stream isdesignated as a Wild Trout stream from the Lion Camp area in the upper subwatershed
State of the Watershed – Report on Surface Water QualitySanta Clara River Watershed, November 2006
4
downstream to the Los Padres National Forest boundary near the City of Fillmore (SCWRPwebsite).
Santa Paula Creek
Santa Paula Creek is another major tributary of the Santa Clara River Watershed. The SantaPaula Creek subwatershed occurs within the Transverse Ranges of southern California. The SanAndreas Fault zone lies approximately 30 miles north of the creek. The perennial creek is fed bysprings located on the southern slopes of the Topatopa Mountains within the Los Padres NationalForest. From its headwaters located near Hines Peak at an elevation of approximately 6,704 feetabove MSL, Santa Paula Creek flows in a southeasterly direction through extremely steep-walledcanyons for the first 12 miles until it reaches the coastal plain near Sulphur Springs just aboveSteckel Park. The creek flows through Steckel Park along a gentle gradient and is relativelyundisturbed. A series of riffles and pools occur in this area created by numerous granite bouldersand unique channel morphology. From there the creek is joined by Mud Creek before continuingdownstream approximately 5.5 miles to its confluence with the Santa Clara River. The drainagetransitions from a braided stream morphology to a channelized system within the last 1,800 feet.The Santa Paula Creek subwatershed encompasses approximately 75,050 acres (SCWRPwebsite).
The climate of the Santa Paula Creek subwatershed is typical of the moderately elevated interiorof southern California with mean seasonal precipitation ranging from approximately 36 inches inthe Topatopa Mountains to 18 inches near the mouth of the creek. Over 90 percent of theprecipitation occurs from November to April within this region (SCWRP website).
Surface water diversions occur within the Santa Paula Creek streambed. The Santa Paula WaterWorks Diversion diverts surface water from the creek approximately 1,000 feet south of SteckelPark just below a United States Geological Survey (USGS) gauging station and just upstream ofthe confluence with Mud Creek. Diversions are made to a storage facility and used as a source ofwater for the City of Santa Paula and for agricultural irrigation. Built in 1923, the dam has gonethrough several repairs and reconstructions. The fish ladder was extended in 1950 and rebuilt in2000 on the southern wall of the approximately 30-foot dam (however, the fish ladder wasdamaged during storms in 2005). Downstream of the dam, the creek is deeply eroded forapproximately one mile. Beyond this, the gradient is reduced and numerous boulders are presentthat have developed riffle-pool formations (SCWRP website).
The subwatershed contains roadside springs which release hydrogen sulfide and active oil seeps(CDWR, 1989).
Estuary
Much of the estuary lies within the northern portion of McGrath State Beach. It is now muchsmaller, at about 230 acres, than its estimated size of 870 acres 150 years ago. The mouth of theestuary is typically open to the ocean during the winter and spring due to high flows followingstorms. Lack of rainfall, lower river flows, and smaller surf result in the estuary closing duringthe summer and early fall (Greenwald, 1999). The Ventura Water Reclamation Facilitydischarges tertiary-treated wastewater into the estuary. An extensive re-examination of the effectthis discharge may be having on the estuary is currently underway (Nautilus, 2005).
State of the Watershed – Report on Surface Water QualitySanta Clara River Watershed, November 2006
5
Miscellaneous Information
• Santa Paula and Sespe have the most rainfall and drain into areas of lower rainfall (Downs,2005).
• El Nino years have a very great impact on floods (order of magnitude or larger which leads tovery spotty sediment transport) (Downs, 2005).
• There are higher rates of sediment production in the northwest part of watershed (Sespe andSanta Paula); over a 70 years period of time, this adds up to 1,400 metric tons/year (Downs,2005).
• The watershed has an active geology; about 7,000 landslides were mapped after the 1994Northridge earthquake, most occurred in mid-watershed (Downs, 2005).
• In March 1928 the St. Francis Dam collapsed; in addition to loss of life and large-scaleflooding, the event released a tremendous sediment load on the watershed with long-termeffects (Downs, 2005).
• Thirty-six percent of the watershed is controlled by dams; there’s a 21% reduction insediment discharge due to flood controls with the dams (Downs, 2005).
• The estuary is more a river mouth than an estuary (sediment drops out offshore) (Downs,2005).
• The hydrology is biased by large floods; the river responds to the last large flood event – nobankful floods – as discharge increases, sediment transport increases rapidly andcontinuously (no peak) (Downs, 2005).
Groundwater Basins, Subbasins, and their Characteristics (Figure 4)
Author’s note: There are brief discussions of groundwater at times in areas outside of and surrounding thebasins and subbasins.
ACTON VALLEY GROUNDWATER BASIN
The Acton Valley Groundwater Basin is bounded by the Sierra Pelona on the north and the SanGabriel Mountains on the south, east, and west; the community of Acton is located in the area. Ithas a surface area of 8,270 acres (12.9 square miles). The valley is drained by the Santa ClaraRiver. Groundwater in the basin is unconfined and found in alluvium and stream terrace deposits.The basin is recharged from deep percolation of precipitation on the valley floor and runoff in theriver and its tributaries. The basin is also recharged by subsurface inflow. Groundwater flowstoward the channel of the Santa Clara River and then westward. There are groundwaterextractions for municipal and some agricultural use and there is some subsurface water outflow.Groundwater in the basin is generally calcium bicarbonate in character although water from somewells north of Acton are calcium magnesium sulfate or calcium magnesium bicarbonate incharacter. Water sampled from five public supply wells in the basin show an average TDScontent of approximately 579 milligrams per liter (mg/l) with a range of 424 to 712 mg/l. Highconcentrations of TDS, sulfate, nitrate, and chloride in wells are an issue in some parts of thebasin (CDWR, 2004b).
State of the Watershed – Report on Surface Water QualitySanta Clara River Watershed, November 2006
6
SANTA CLARA RIVER VALLEY GROUNDWATER BASIN AND SUBBASINS
East Subbasin
The East Subbasin has a surface area of 66,200 acres (103 square miles). The surface is drainedby the Santa Clara River, Bouquet Creek, and Castaic Creek. Discharge from the subbasin isthrough pumping for municipal and irrigation uses, uptake by plants, and outflow to the SantaClara River in the western part of the subbasin. Groundwater flow in the subbasin is southwardand westward and follows the course of the Santa Clara River. The subbasin is comprised of twoaquifer systems, the Alluvium and the Saugus Formation. The Alluvium generally underlies theSanta Clara River and its several tributaries, and the Saugus Formation underlies virtually theentire Upper Santa Clara River area (Black & Veatch, 2005). Groundwater in the alluvialaquifer varies from calcium bicarbonate character in the east to calcium sulfate character in thewestern part of the subbasin. Nitrate content decreases to the west and TDS content increasesfrom about 550 to 600 mg/l in the east to about 1,000 mg/l in the west. Groundwater in theSaugus Formation aquifer is of calcium bicarbonate character in the southeast, calcium sulfate inthe central, and sodium bicarbonate in the western parts of the subbasin. TDS content in theSaugus Formation aquifer ranges from about 500 to 900 mg/l (CDWR website). Most localwells draw water from the Alluvial Aquifer. A smaller portion of the Valley’s water supply isdrawn from the Saugus Formation, a much deeper aquifer than the Alluvial Aquifer (Black &Veatch, 2005).
Groundwater within Bouquet Canyon is calcium bicarbonate whereas in San FrancisquitoCanyon, calcium sulfate dominates. In Castaic Creek, groundwater changes from calcium sulfatein the upper reaches near Castaic Dam to calcium-bicarbonate-sulfate in the middle reaches nearI-5 and then back to calcium sulfate in the lower reaches (Slade, 2002).
As with the Alluvium, the most notable groundwater quality issue in the Saugus Formation isperchlorate contamination. Perchlorate was originally detected in four Saugus wells operated bythe retail water purveyors in the eastern part of the Saugus Formation in 1997, near the formerWhittaker-Bermite industrial facility. Since then, the four Saugus municipal supply wells havebeen out of water supply service due to the presence of perchlorate as well as two Alluviumwells. Planning for remediation of the perchlorate and restoration of the impacted well capacity isunderway (Black & Veatch, 2005).
Piru Subbasin
The surface area of the Piru Subbasin is 8,900 acres (13.9 square miles) (CDWR, 2004c). Theboundary to the west is marked by a bedrock constriction near the Fillmore Fish Hatchery causingrising groundwater. The upstream extent of the groundwater subbasin is located 0.7 miles belowthe Blue Cut gauging station with its western boundary in the vicinity of Fillmore Fish Hatchery.Groundwater recharge to the subbasin is by percolation of runoff from Piru Creek, Hopper Creek,and the Santa Clara River (SCWRP website). Groundwater in this subbasin is generally calciumsulfate in character. TDS concentrations range from 608 to 2,400 mg/l, with an average ofapproximately 1,300 mg/l (CDWR, 2004c). The subbasin consists of recent and older alluviumthat is recharged by percolation of surface flows along the Santa Clara River channel and itstributaries, and small amounts of subsurface flow at the upper end of the subbasin. Thegroundwater flow gradient within the unconfined subbasin tends to be in a westerly direction.This is considered to be an unconfined groundwater subbasin. The subbasin is replenished by
State of the Watershed – Report on Surface Water QualitySanta Clara River Watershed, November 2006
7
rainfall, irrigation returns, and artificial recharge through spreading grounds and waterconservation releases by United Water Conservation District (UWCD) (SCWRP website). Theaverage annual artificial recharge at the Piru spreading grounds is quite variable in dry versus wetyears but has been as high as 6,600 acre-feet (AF) per year in the late 1990s during a wet year(AMEC, 2005).
In general, the quality of the groundwater has historically ranged from poor to good; poorquality waters are found east of Piru Creek and near the western boundary of the subbasin locatedon the north side of the Santa Clara River and result from agricultural return waters, dischargesfrom POTWs, or wells drilled into the Pico Formation. The character of the groundwater in theupper portion of the subwatershed (north of the Piru Subbasin) is either sodium bicarbonate orsodium-calcium sulfate. TDS, sulfate, fluoride, and nitrate concentrations are a problem in a fewwells. Groundwater in the Santa Felicia HSA contains concentrations of boron and sulfate thatexceed recommended state criteria but continue to be used in agricultural practices withoutsignificant crop damage. Further downstream, the quality of groundwater and local springs withinthe Hungry Valley HSA is very good. Only one parameter, fluoride, has historically exceeded thestate quality standards for Basin Plan beneficial uses (SCWRP website).
Fillmore Subbasin
The lower 5.5 miles of Sespe Creek is underlain by the Fillmore Subbasin which covers an areaof approximately 18,580 acres. The subbasin is located one mile upstream of the City ofFillmore. The eastern (upstream) boundary occurs at the Fillmore Fish Hatchery and the westernboundary is located approximately one mile east of the City of Santa Paula in an area of geologicand hydrologic constriction (SCWRP website). The Santa Clara River and Sespe Creek drain thesurface waters of the subbasin. Recharge to the subbasin is provided by percolation of surfaceflow in the Santa Clara River, Sespe Creek, underflow from the Piru Subbasin , direct percolationof precipitation, percolation of irrigation waters provide recharge, and releases by UWCD fromLake Piru. Groundwater in Fillmore Subbasin generally flows to the west, and the gradientdecreases westward. Like the Piru Subbasin to the east, the Fillmore Subbasin recharges rapidlyand fills to capacity in years of abundant precipitation. Water in this subbasin is calcium sulfatein character, although some groundwater in the Sespe Uplands area is calcium bicarbonate incharacter. TDS concentration ranges from 800 to 2,400 mg/l with an average of 1,100 mg/l. Datafrom nine public supply wells show a TDS content range of 660 to 1,590 mg/l, with an average of967 mg/l (CDWR, 2006a).
Two areas of the Fillmore Groundwater Subbasin have been identified to contain high nitrateconcentrations within the groundwater: the Bardsdale area near Fillmore and an area west ofFillmore on the west side of Sespe Creek (SCWRP website).
Groundwater in the Topatopa HSA (north of the subbasin) meet the state water qualityrequirements for existing and potential beneficial uses. However, concentrations of sulfate,chlorine, fluoride, boron, and TDS near Sespe Hot Springs (remote from the subbasin) generallyexceed recommended limits for drinking water and irrigation. Groundwater quality in the lowersubwatershed varies. High concentrations of TDS (greater than 1,000 mg/l) and sulfate (greaterthan 800 mg/l) were found in the Pole Creek Fan near the City of Fillmore. Recharge within thisarea is limited to the poor water quality of Pole Creek and urban runoff associated with the Cityof Fillmore. Elevated concentration of nitrate and fluoride may be associated with the nativewaters of the San Pedro Formation (SCWRP website).
State of the Watershed – Report on Surface Water QualitySanta Clara River Watershed, November 2006
8
This is considered an unconfined groundwater subbasin. The Santa Clara River and Sespe Creekare two major sources of recharge to the Fillmore subbasin, as is underflow from Piru subbasin.At the downstream end of the subbasin, there is some underflow into the Santa Paula Subbasin,although much of the water leaves the subbasin as rising groundwater which contributes to flowin the Santa Clara River (UWCD, unpublished records).
Santa Paula Subbasin
Santa Paula Creek is underlain by the Santa Paula Subbasin which has a surface area of 22,800acres (35.7 square miles). The eastern edge of the subbasin is marked by a bedrock constriction.The western boundary of the subbasin separates it from the Mound and Oxnard subbasins(CDWR, 2004d). The subbasin is considered to be in hydraulic connection with the FillmoreSubbasin to the east. Although there is general agreement that there is some hydraulic connectionbetween Santa Paula Subbasin and the Mound Subbasin, the degree of connection is uncertain(UWCD, 2001). Ground surface elevations range from 140 feet above sea level in the west toabout 1,000 feet above sea level along the Santa Paula Creek drainage. The Santa Clara Riverand Santa Paula Creek drain the valley westward toward the Pacific Ocean. Groundwater inSanta Paula Subbasin flows generally toward the southwest. TDS concentrations range from 870to 3,010 mg/l, with an average of 1,190 mg/l (CDWR, 2004d).
The subbasin encompasses an area along the Santa Clara River from the City of Saticoy to thewest, the City of Santa Paula to the east, the Sulphur Mountain foothills to the north, and SouthMountain to the south. The main water bearing formations are the San Pedro Formation, alluvialfan deposits, and recent river and stream sediments. Groundwater is unconfined in the westernportion of the subbasin . Groundwater occurs within approximately 50 feet of the surface and isextracted from the subbasin for agricultural, municipal, industrial, and domestic uses. Theprimary recharge to the subbasin is by percolation from the Santa Clara River, Santa Paula Creek,and other tributaries, and by underflow from the Fillmore Groundwater Subbasin (SCWRPwebsite). Recharge from the Santa Clara River is limited to reaches north of the Oak Ridge faultalong a two-mile stretch near the City of Santa Paula. Where the river flows south of the OakRidge fault, it overlies impermeable Santa Barbara formation and recharge cannot occur. Thelocation of the modern river channel severely restricts the amount of recharge the subbasin canreceive in any one year (UWCD, 2001).
Mound Subbasin
The surface area of the Mound Subbasin is 14,800 acres (23.1 square miles). It underlies thenorthern part of the Ventura coastal plain in the western part of the Santa Clara River Valley.The subbasin is bounded on the northeast by the Santa Paula Subbasin and on the west by thePacific Ocean. Depending on the relative groundwater levels, subsurface water may flow into orout of the subbasin across the border with Oxnard Subbasin. TDS concentrations range from 90to 2,088 mg/l (CDWR, 2006b). The principal fresh water-bearing strata of the Mound subbasinare the San Pedro Formation and overlying Pleistocene deposits that may be correlative with theMugu aquifer of the Oxnard Plain Subbasin. The subbasin extends several miles into the offshore(UWCD, 2001).
The majority of the recharge to the subbasin is likely from precipitation falling on the outcrops ofthe aquifer in the hills to the northeast of the Mound subbasin. When water levels are high in thesubbasin, outflow may occur to the ocean some miles offshore. Groundwater flow in the Mound
State of the Watershed – Report on Surface Water QualitySanta Clara River Watershed, November 2006
9
Subbasin is generally to the west and southwest. However, during periods of drought andincreased pumping, a pumping trough forms along the southern portion of the subbasin thatsignificantly modifies groundwater gradients (UWCD, 2001).
Oxnard Forebay and Oxnard Plain Subbasin
The surface area of the Oxnard Subbasin is 58,000 acres (90.6 square miles). The groundwatersystem in the Oxnard Subbasin includes a main recharge area termed the Forebay, and a confinedaquifer system that extends throughout the main part of the subbasin and under the Pacific Ocean(CDWR, 2006c).
The Oxnard Forebay is hydraulically connected with the aquifers of the Oxnard Plain Subbasin,which is overlain by a confining clay. Thus, the primary recharge to the Oxnard Plain Subbasin isfrom underflow from the Forebay rather than the deep percolation of water from surface sourceson the Plain. When groundwater levels are below sea level along the coastline, there may also besignificant recharge by seawater flowing into the aquifers (UWCD, 2001).
Three types of land use dominate the Forebay, agriculture, residential, and industrial (primarilygravel mining). Historically the Forebay was used for a large amount of citrus farming. Today,strawberry farming constitutes the majority of farming here. The Forebay has been extensivelymined for sand and gravel resources. This mining left a number of gravel pits in the area.Surface waters are diverted into some of these gravel pits in order to recharge groundwater(CRWQCB, 1999).
Groundwater flow direction in the Forebay is generally towards the southwest but shows a highdegree of local variation due to large-scale groundwater withdrawal and recharge operations(CRWQCB, 1999).
Groundwater/Surface Water Interactions
Just west of the LA-Ventura County line, is a geologic constriction called Blue Cut which formsthe outlet for the Upper Santa Clara River HA (CDWR, 1993). The mainstem river flowsabove-ground from the Upper Santa Clara River HA until upstream of the confluence with PiruCreek where it generally becomes dry (during dry weather) due to highly permeable soils.Perennial flow generally return downstream of the confluence with Hopper Canyon Creek andcontinues through the Piru, Sespe, Santa Paula, and Oxnard Plain HAs (Bachman, 2006). Thereis a hydraulic interconnection between the Santa Clara River and the ground waters of the SantaClara River Valley. There is also a hydraulic interconnection between the flows in the tributariesand the ground waters within the HSAs (CDWR, 1989). With a high water table, rising wateroccurs just east of the Fillmore fish hatchery at the western boundary of Piru Subbasin. Also,with a high water table, rising water is found along the reach of the Santa Clara River entering theeastern boundary of the Fillmore Subbasin (CDWR, 1989). Constrictions in the width of theunconsolidated deposits at these locations can cause ground water to resurface and becomesurface flow in the Santa Clara River (USGS, 1999). There is a tendency for the chemicalcharacter of waters to shift from bicarbonate to sulfate in these locations due to the chemicalcharacter of the rising groundwater. The groundwater component in the river can be quite largewhich results in a major presence of sulfate in surface waters. The duration of surface flow,rather than flow rate or volume, tends to control recharge and significant groundwater rechargeoccurs during flood events. This results in flood flows of water with lower concentrations of
State of the Watershed – Report on Surface Water QualitySanta Clara River Watershed, November 2006
10
sulfate passing through the subbasin rather than recharging and having a diluting effect on thegroundwater (CDWR, 1989).
Because they occur year-round, effluent discharges to the river may at times have a greaterpotential effect on ground water quality than does seasonal stream runoff. The concentrations ofTDS in the hydraulically interconnected surface and ground waters are different which suggestsother processes are occurring such as evaporation which concentrates salts in rising waters andagricultural return flows (CDWR, 1989).
Water Agencies and Water Use
WATER SUPPLIERS AND SUPPLIES
The water supply in the Upper Santa Clara River HA consists of a mix of local ground water andimported water. Local ground water is extracted by various water districts, companies, and byprivate wells. Water demands during 2005 in the Santa Clarita Valley were met by a combinationof local groundwater resources (slightly more than one-half of the demand), State Water Projectwater (slightly less than one-half), and the remaining small amount by recycled water forlandscape irrigation from the treatment plants operated by the County Sanitation Districts of LosAngeles County (Luhdorff & Scalmanini, 2006). Several hundred water wells have beenhistorically drilled in the Santa Clarita Valley for domestic, agricultural, industrial, or municipalusage. There are also about two dozen high production agriculture supply wells. There are alsopotentially a large number of private, low capacity domestic supply wells (Slade, 2002) .
Castaic Lake Water Agency (CLWA) distributes imported State Water Project water within itsservice area, primarily the Santa Clarita Valley in the Upper Santa Clara River HA (CDWR,1993). The CLWA is a public water agency that was originally formed in 1962 as the UpperSanta Clara Valley Water Agency. The agency covers the major areas of groundwater storageupstream of UWCD (Mann, 1968). The CLWA is a water wholesaler and services an area of195 square miles. This water is treated and delivered to the local water retailers: LA CountyWater District #36, Newhall County Water District, CLWA Santa Clarita Water Division, andValencia Water Company (Luhdorff & Scalmanini, 2006).
UWCD is the wholesale water district for the Ventura County portion of the Santa Clara RiverValley that encompasses about 214,000 acres (CDWR, 1989). The UWCD is a mix of agricultureand urban areas, with prime agricultural land supporting high-dollar crops such as lemons,oranges, avocados, strawberries, row crops, nursery stock, and flowers. Approximately 300,000people live within the District boundary, including those living in the cities of Oxnard, PortHueneme, Santa Paula, Fillmore, and in eastern Ventura (UWCD, 2001).
The original founding organization for UWCD was called the Santa Clara River ProtectiveAssociation. It was formed in 1925 to protect the runoff of the Santa Clara River from beingappropriated and exported outside the watershed. The Santa Clara Water Conservation Districtwas formed in 1927 to further the goals of the Association by protecting water rights andconserving the waters of the Santa Clara River and its tributaries. The District began a systematicprogram of groundwater recharge in 1928, primarily through constructing spreading groundsalong the Santa Clara River. Sand dikes were constructed on the Santa Clara River near Saticoyto divert river water into spreading grounds (UWCD, 2001).
State of the Watershed – Report on Surface Water QualitySanta Clara River Watershed, November 2006
11
As seawater intrusion on the Oxnard Plain was recognized in the 1940s, it was clear that theDistrict did not have the financial ability to raise money to construct the facilities necessary tocombat the problem. With the help of the City of Oxnard, a new district was organized in 1950under the Water Conservation Act of 1931. The new district was called United WaterConservation District for its unification of urban and agricultural concerns. UWCD thenconstructed a number of water conservation projects, including (UWCD, 2001):
• Santa Felicia Dam (1955) to capture and store winter runoff on Piru Creek to release incontrolled amounts during the dry season. The 200-foot high dam can store about 87,000acre-feet in Lake Piru.
• A pipeline to new spreading grounds at El Rio.• Wells at El Rio to produce water for the Oxnard-Hueneme (O-H) pipeline (1954) that
supplies drinking water to the cities of Oxnard and Port Hueneme, mutual water districts, andthe two Navy bases at the coast. The O-H system supplies water from the Oxnard Forebaysubbasin (the recharge area for the Oxnard Plain subbasin), rather than by pumping ofindividual wells in areas of the Oxnard Plain that could accelerate seawater intrusion.
The major issues of current concern for the District include groundwater overdraft and theintrusion of saline water in the Oxnard Plain and Pleasant Valley Subbasins, water quality of theOxnard Forebay Subbasin, adjudication of the Santa Paula Subbasin, concerns related togroundwater management of the Piru/Fillmore subbasin, and chloride impacts to the PiruSubbasin.
The main water quality concern in the Forebay is the presence of nitrate at varying locations andtimes, in concentrations that exceed drinking water standards (UWCD, 2001).
High chloride levels were first detected on the Oxnard Plain in the vicinity of the Hueneme andMugu submarine canyons in the early 1930s and became a serious concern in the 1950s (UWCD,2001).
Major strategies to combat saline intrusion include increased recharge and pipeline deliveries tolessen groundwater pumping to coastal areas (UWCD), reduced pumping overall in the coastalbasins (Fox Canyon Groundwater Management Agency), and switching pumping to less impactedaquifers (County of Ventura) (UWCD, 2001).
Following increasing intrusion of seawater from the 1950s to the 1980s, the UWCD built severalnew facilities to increase recharge to the aquifers and to decrease groundwater pumping in areasaffected by the intrusion. The Freeman Diversion (1991), which replaced the temporary diversiondikes in the Santa Clara River with a permanent concrete structure, allowed diversion of stormflows throughout the winter. In addition, the Freeman Diversion stabilized the riverbed after yearsof degradation caused by gravel mining in the river (UWCD, 2001).
The Pumping Trough Pipeline (PTP) was constructed in 1986 to convey diverted river water toagricultural pumpers on the Oxnard Plain, thus reducing the amount of groundwater pumping incritical areas. Lastly, the Noble spreading basins (1995) were constructed to store and rechargeadditional river water, particularly during wet periods (UWCD, 2001).
State of the Watershed – Report on Surface Water QualitySanta Clara River Watershed, November 2006
12
FACILITIES
The Castaic Lake Reservoir was completed in 1973 as part of the California State Water Projectand stores water transported from northern California for use by state water contractors insouthern California. It has a storage capacity of approximately 323,700 acre-feet (CPUCwebsite). In Bouquet Canyon and Dry Canyon, small regulating reservoirs are operated by theCity of LA Department of Water and Power (DWP) in conjunction with the LA Aqueduct(CDWR, 1993).
The Pyramid Dam was built in 1973 and impounds water from the State Water Project andsubwatershed runoff. Water releases maintained throughout the summer artificially support flowwithin the creek below Pyramid Dam (SCWRP website). Water flowing from Pyramid Lakethrough the 7.2-mile-long Angeles Tunnel spins the turbines in Castaic Powerplant. The 30-foot-diameter tunnel carries water on its way to coastal Southern California to Castaic Lake, the finalProject reservoir on the State Water Project’s West Branch. Castaic Powerplant generateselectricity during on-peak Periods (weekday daylight hours) when extra power is needed in LosAngeles (nights and Sundays) when local power is cheaper, the plant pumps water back intoPyramid Lake. The operation also reduces the cost of power required to move Project water fromNorthern to Southern California (CDWR website).
The Santa Felicia Dam was built in 1955 approximately eight kilometers (km) upstream of theconfluence with the Santa Clara River and impounds runoff from the subwatershed. The 200-foothigh dam was constructed by UWCD as part of a region-wide conservation project for the SantaClara River watershed. The dam was designed to capture and store winter runoff on Piru Creekfor controlled release during the dry season. Approximately 87,000 acre-feet of water are storedin Lake Piru (SCWRP website). Releases from Santa Felicia Dam may be diverted from PiruCreek via an earthen dike and screened intake structure located near the confluence of Piru Creekand the Santa Clara River to be recharged at the Piru Spreading Grounds, a 44-acre rechargebasin (UWCD, 2001).
Besides the Lake Piru facility, UWCD also operates the Freeman Diversion and related rechargeand conveyance facilities in the Oxnard Forebay groundwater subbasin. Santa Clara River wateris diverted at the Freeman Diversion and used for artificial recharge at the Saticoy and El RioSpreading Grounds in the Oxnard Plain and for direct delivery to waters users within the OxnardPlain and portions of the Pleasant Valley groundwater basin located along the lower reaches ofCalleguas Creek in the adjacent watershed (USGS, 1999). Water diverted from the river flowsvia canal and pipeline to a desilting basin, where water velocity slows, allowing sediment to settleout of the water column. From the desilting basin, water flows via pipe and canal to the Saticoyspreading grounds. From the main canal at the Saticoy spreading grounds, water can be directedto either percolation ponds or to the main supply pipeline. The main supply line transports waterto the El Rio spreading grounds and the Pleasant Valley and the Pumping Trough Pipelinedelivery systems (UWCD, 2001).
Average annual flow on Piru creek below Lake Piru during the previous 40 years has been 71 cfswhich includes spills. Controlled releases have ranged from 2.5 to 650 cfs. Mean annualstreamflow in the Santa Clara River at the Freeman Diversion has been 381 cfs for the previous40 years. The current permitted diversion capacity of the Freeman Diversion is 375 cfs, with anannual total not to exceed 144,000 acre-feet. A daily average diversion of 199 cfs can be divertedannually through the Freeman Diversion (UWCD, unpublished records).
State of the Watershed – Report on Surface Water QualitySanta Clara River Watershed, November 2006
13
During studies in the early 1990s, under a zero-release condition from Lake Piru, the only flow inthe river was from discharge of ground water at the Fillmore Narrows at the lower end of theFillmore subbasin. This water was characterized by high specific conductance (2,000microsiemens per centimeter [uS/cm]) and high sulfate (800 mg/l). Ground water discharge atFillmore Narrows increased with increasing release rates from Lake Piru. Flow studies doneduring the mid-1990s under dry conditions, mostly during releases from Lake Piru, showed thatall flow entering the Piru subbasin from Los Angeles County to the east infiltrates (or is diverted)before reaching the stretch just upstream of Piru Creek. During releases from Lake Piru, groundwater recharge occurs along lower Piru Creek and in the middle part of the Piru subbasin. In theFillmore subbasin there is some evidence of decreasing flow in the upper part of the subbasin butthere is an increasing flow between the upper and lower subbasins indicating ground water (lowsulfate) discharge associated with Sespe Creek (USGS, 1999).
Major Historical Events in Watershed
Pre-European inhabitation by Chumash and Tataviam (AMEC, 2005)1782 establishment of first Spanish mission (AMEC, 2005)1820s to 1860s cattle ranching a dominant land use (AMEC, 2005)1860s oil production began (USMMS website)1860s agriculture became a dominant land use (AMEC, 2005)1920s beginning of larger scale agricultural activities (AMEC, 2005)1928, March, St. Francis Dam broke1955, Santa Felicia Dam completed (SCWRP website)1973, Castaic Lake Reservoir and Pyramid Dam completed (SCWRP website)
Biological Setting
Mainstem
Prior to 1940, the Santa Clara was one of the largest steelhead runs in southern California, next tothe Santa Ynez River, numbering in the thousands at times. Fewer than 100 adult fish run eitherof these rivers’ waters now (Kelley, 2004).
A major difficulty during migrations are anthropogenic and natural barriers such as waterdiversions, road-crossings, and channel modifications for sand and gravel extraction or floodcontrol purposes. The tributaries provide the majority of spawning and rearing habitat, while themainstem of the Santa Clara River is primarily a migration corridor (Kelley, 2004).
The Santa Clara River estuary has been significantly altered, and these changes may be impactingsouthern California steelhead smolt survival. While it is unknown to what extent Santa ClaraRiver smolts used the estuary historically, it has been demonstrated that northern and centralcoast steelhead smolts use estuaries to gain size and acclimate to the higher concentrations of saltin ocean water. The impact of these changes on Santa Clara River steelhead smolt survival isunknown (Kelley, 2004).
A number of recommendations have been developed to address the above difficulties. A priorityaction relating to water flow and balance in the river is to conduct a water balance and assessmentof inflows and outflows to the Santa Clara surface and groundwater resources. Associated withthis would be a hydrological analysis with models to assess the amount of water flow necessary in
State of the Watershed – Report on Surface Water QualitySanta Clara River Watershed, November 2006
14
all lower segments of the river in order to provide sufficient water for steelhead passage duringthe winter months (Kelley, 2004).
Upper Watershed
Approximately 75% of the land in the Upper Santa Clara River HA is within the AngelesNational Forest. This open space and the relatively undisturbed riverine environment provideshabitat for three endangered species: California condor, unarmored threespine stickleback, andCalifornia least Bell’s vireo. The endangered slender-horned spineflower as also been identifiedas occurring in the area (CDWR, 1993).
The Castaic Ranges cover 404,000 acres and include Liebre Mountain, Sawmill Mountain, andthe Sierra Pelona. They lie northwest of the San Gabriel Mountains, between Soledad Canyon andPiru Creek in Los Angeles County. Geologically, they are considered part of the TransverseRanges. The area has rugged topography but is relatively low in elevation, climbing above 5,000feet only on Liebre and Sawmill mountains. The mountains and foothills north of Castaic aredominated by chaparral-covered hills, but they also contain several low elevation streams thathave high-quality riparian and aquatic habitats. In addition, the upper elevations of Liebre andSawmill mountains contain unique and important montane habitats. The geographic position ofthis region, which lies between the San Gabriel Mountains to the east, the Tehachapi Mountainsto the north, and the Los Padres ranges to the west, makes it a key wildland linkage (Stephenson,1999).
Although much of Castaic Creek is now covered by Castaic Lake, there are still areas ofimportant riparian habitat. Arroyo toads occur upstream and downstream of the lake. A pondturtle population also exists in the upper reaches of Castaic Creek. Streamflows below CastaicLake are controlled by releases from the dam. The lake contains a wide variety of non-nativespecies that can disperse both up and down stream. Bullfrogs and warm-water fish in particularare a threat to arroyo toads and pond turtles (Stephenson, 1999).
Elizabeth Lake Canyon contains some high-quality riparian and aquatic habitat. Swainson’sthrush and yellow-breasted chat are known to occur along this drainage. It is also a historiclocality for the Tehachapi white-eared pocket mouse and the foothill yellow-legged frog. Apaved road runs the length of this canyon and several campgrounds are located along it. Thestream flows into Castaic Lake, which makes it more susceptible to infestations of bullfrogs andwarm-water fish (Stephenson, 1999).
Soledad Canyon contains high-quality riparian and aquatic habitat. Portions of the upper SantaClara River in this canyon are designated as critical habitat for the unarmored threespinestickleback fish. Santa Ana suckers, southwestern willow flycatchers, and summer tanagers alsooccur in this area. Invasive, non-native species are also a problem, particularly arundo and warm-water fish (Stephenson, 1999).
Placerita Canyon State Park, in Los Angeles County, was created to preserve and protect the siteof the first discovery of gold in California, in 1842. Designated as a State Historic Landmark, thepark is situated in the transition zone between the San Gabriel Mountains and the Mojave Desert,and contains sandstone formations, seasonal streams and riparian oak woodlands, as well asstands of cottonwood and native sycamore trees. The park's location provides significant linkages
State of the Watershed – Report on Surface Water QualitySanta Clara River Watershed, November 2006
15
connecting the Angeles National Forest, the Santa Susana Mountains, the Simi Hills and theSanta Monica Mountains (CDPR website).
San Francisquito Creek contains high quality, low-elevation riparian and aquatic habitat. Theunarmored threespine stickleback, California red-legged frog, southwestern willow flycatcher,Swainson’s thrush, yellowbreasted chat, and Nevin’s barberry all occur along this drainage.The primary factors affecting ecological integrity in the area are water diversions, encroachmentof non-native species, and land uses associated with a major paved road that runs the length ofthis canyon (Stephenson, 1999).
Piru Creek Subwatershed
There is an abundance of wildlife in the Piru Creek subwatershed. Piru Creek historically was amajor spawning tributary for southern California steelhead but Santa Felicia Dam now blockssteelhead access (Kelley, 2004). Steelhead trout populations have declined dramatically since themid-1950s coincident with construction of dams and water diversions. Those portions of the PiruCreek subwatershed that occur within the National Forests include some of the most botanicallydiverse preserves in the United States. Most of the land experiences Mediterranean climatecharacterized by cool, wet winters and hot, dry summers. This climate coupled with elevationalchanges creates a unique assemblage of plant communities in which chaparral dominates. Oaks,pines, fir, and juniper species occur above 5,000 feet while cottonwood, and willow communitiesoccur within the streambed and near springs. Seasonal grasses are dominant on the soils formedon finer grained sedimentary rocks and alluvium. Adjacent upland terraces are relatively arid,supporting oaks, grassland and chaparral (SCWRP website).
Vegetation throughout lower Piru Creek consists of white alders, California sycamores, arroyowillows, coast live oak, and mule fat. The dominant overstory is alders and sycamores, with someportions being dominated by coast live oaks. The midstory is composed of smaller willows, mulefat, and poison oak, with and understory of the aforementioned species as well as California wildrose, California blackberry, cattails, and other herbaceous species. The subwatershed contains alimited distribution of rural communities and may remain free of nonnative, exotic species suchas Arundo donax or giant reed (SCWRP website).
The middle portion of Piru Creek (below the Pyramid Lake dam) is characterized by cobblyfloodplain terraces that support sporadic willow clumps within the streambed and stands of aldersalong the edges. Episodic channel forming flood events can result in the removal of borderingalders within this reach (SCWRP website).
Black bear populations have maintained their numbers at a relatively constant level over the pastfew decades. The Upper Piru and Agua Blanca areas of the Ojai District have the highest bearconcentrations within the subwatershed. This success is primarily a result of previousconservation actions taken to preserve the robust habitat of the upper subwatershed system(SCWRP website).
Sensitive species potentially occurring within the subwatershed include the southwestern willowflycatcher, least Bell's vireo, Cooper's hawk, arroyo toad, and California red-legged frog. Arroyotoads are known to occur on two short segments of Piru Creek, from lower Piru Gorgedownstream to the vicinity of Blue Point Campground, and between Bear Gulch and theheadwaters of Pyramid Lake. However, California red-legged frogs are believed to have been
State of the Watershed – Report on Surface Water QualitySanta Clara River Watershed, November 2006
16
eliminated in part by off-road vehicle activities in Piru Creek above Pyramid Lake (SCWRPwebsite).
Sespe Creek Subwatershed
The confluence of Sespe Creek with the Santa Clara River provides an important connection toupland systems and potential migration corridor for four endangered species: southwesternwillow flycatcher, least Bell's vireo, arroyo toad, and California red-legged frog (SCWRPwebsite).
As with Piru Creek, abundant and diverse wildlife occurs within the Sespe Creek subwatershed.The mountains of the Los Padres National Forest have created a unique assemblage of plantcommunities in which chaparral dominates. Southern coast live oak, southern cottonwood-willow, southern sycamore-alder, and southern mixed riparian forests dominate the drainagenetwork. Examples of other plant communities encountered within the upper subwatershedinclude southern riparian scrub and California walnut woodland. The Sespe Creek subwatershedcontains similar vegetation overstory and understory as the Piru Creek subwatershed including alimited distribution of rural communities and nonnative, exotic species such as Arundo donax orgiant reed. Common wildlife species observed within the subwatershed include black bears, deer,mountain lions, bobcats, coyotes, rattlesnakes, red-tailed hawks, and golden eagles. Black bearpopulations have maintained their numbers at a relatively constant level over the past few decadesand the Sespe Condor Sanctuary of the Ojai District has a high bear concentration. Sespe Creekalso supports remnants of the historically abundant southern steelhead (SCWRP website).
Sespe Creek is one of the main southern California steelhead spawning tributaries; there are nodams on the creek (Kelley, 2004). Due to the endangered status of southern California steelhead,Sespe Creek has been closed to fishing from Alder Creek downstream to the confluence with theSanta Clara River. Approximately 15 miles of Sespe Creek from the mouth of the Tule Creekdownstream to the Hot Springs Canyon vicinity supports the largest surviving populations ofarroyo toad. This upper half of the Sespe Creek drainage contains large areas of excellent adultand breeding habitats for the toad (SCWRP website).
Santa Paula Creek Subwatershed
Sensitive species within the Santa Paula Subwatershed include arroyo toads, California red-legged frogs, southern California steelhead trout, least Bell's vireo, and southwestern willowflycatcher (SCWRP website). Santa Paula Creek is one of the watershed’s main southernCalifornia steelhead spawning tributaries (Kelley, 2004). The natural communities present in theSanta Paula Creek subwatershed include riparian woodland, riparian scrub, coast live oak-walnutwoodland, coastal sage scrub-grassland, and chaparral. Chaparral is found on the higher slopes ofSanta Paula Canyon and mixed with coastal sage scrub and grassland along the drier, rockyslopes. Coniferous trees occur on the crests of the higher mountains. Riparian woodland andriparian scrub habitat are dominant in the upper portion of the subwatershed, but limited tonarrow strips of variable size along the drainage further downstream. Upstream of Steckel Park,the riparian habitat is relatively undisturbed and characterized by a mix of black cottonwood,western sycamore, white alder, Fremont cottonwood, willow species, and mule fat. Theunderstory is dominated by poison oak, mugwort, various brome grasses, cocklebur, wild celery,lotus, and locoweed (SCWRP website).
State of the Watershed – Report on Surface Water QualitySanta Clara River Watershed, November 2006
17
The portion of Santa Paula Creek which flows through Steckel Park is characterized by a mix ofriparian habitats and oak-walnut woodlands. One clump of giant reed is present at Steckel Park.Alluvial scrub habitat occurs on the upper terraces of the existing banks and is composedprimarily of shrubs including California sagebrush, laurel sumac, black sage, and buckwheat(SCWRP website).
In the alluvial valley below Steckel Park, the vegetation community is primarily agricultural.Citrus and avocado orchards occur along both banks of Mud Creek and a majority of the easternbank of Santa Paula Creek. The remaining portion of the alluvial valley contains terraced hillsidesthat have been urbanized (SCWRP website).
Sensitive plant species that may occur within the area include the slender-horned spineflower,Gambell's waters cress, and the Santa Paula buckwheat (SCWRP website).
Least Bell's vireo historically nested along a majority of the Santa Paula Creek according to theU.S. Fish & Wildlife Service (USFWS) in 1982. However, the lower portion of the Santa PaulaCreek does not currently contain suitable habitat for the least Bell's vireo or southwestern willowflycatcher (SCWRP website).
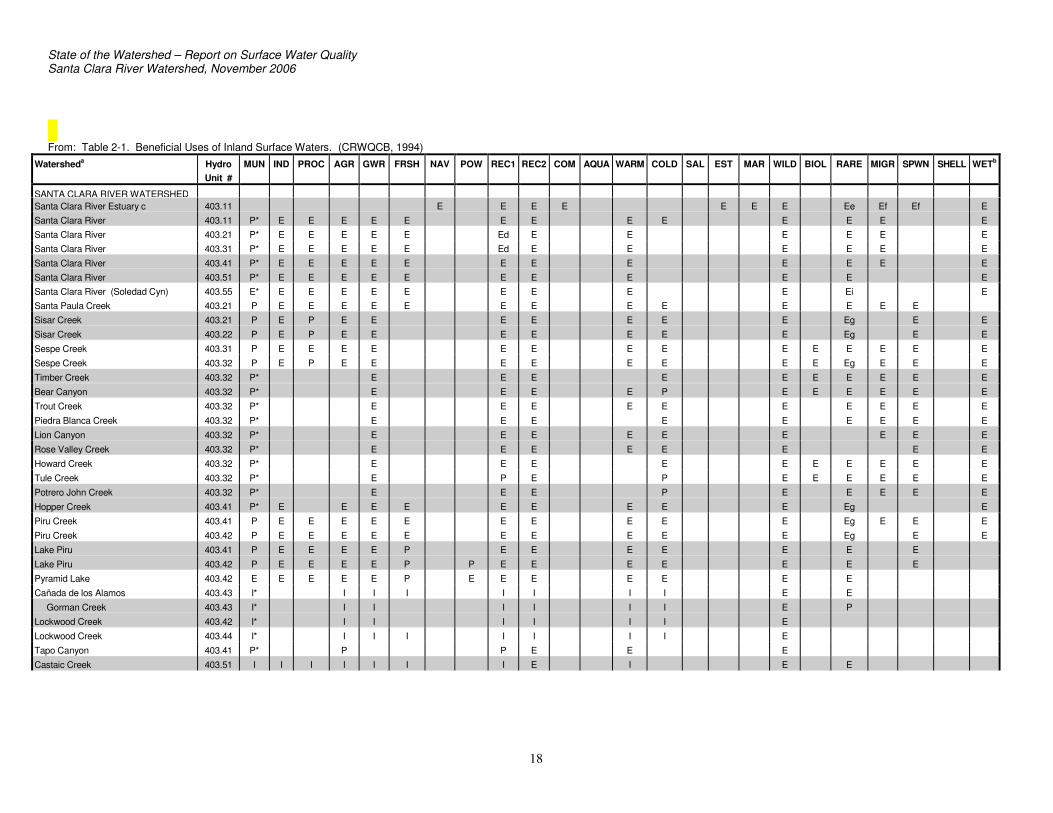
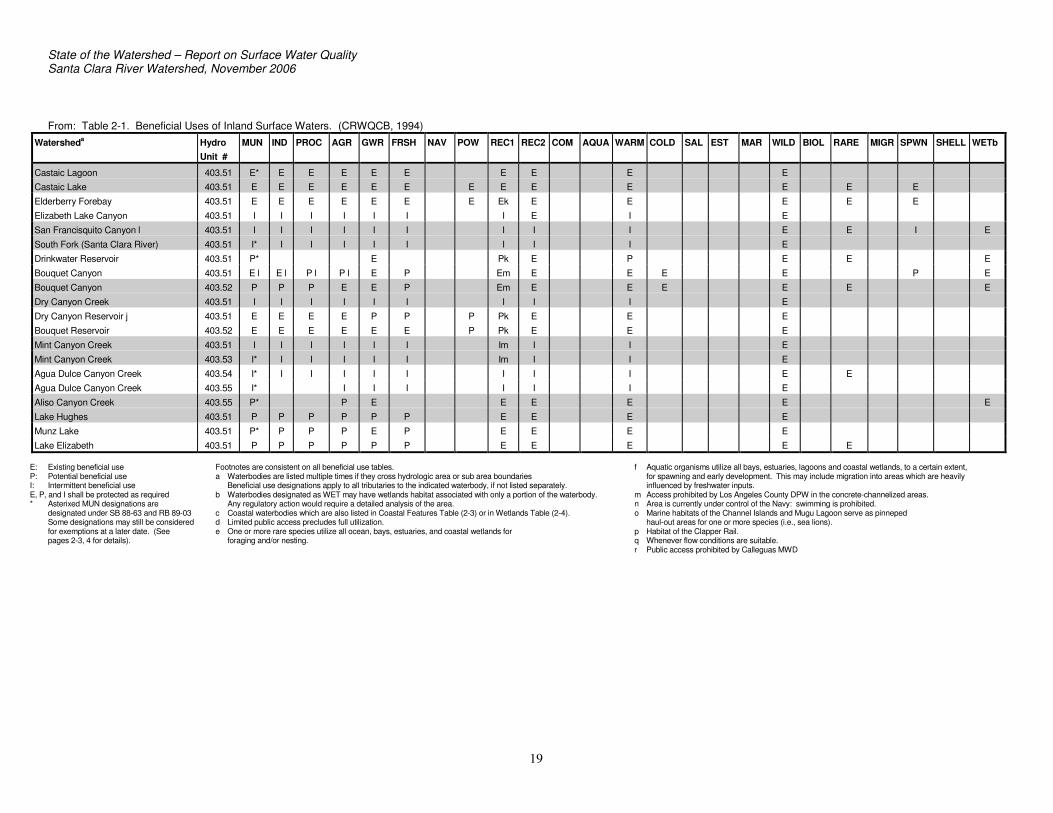
The Watershed’s Designated Beneficial Uses
The various uses of waters described above are referred to as beneficial uses. The RegionalBoard designates beneficial uses of all waterbodies in the Water Quality Control Plan for theVentura and Los Angeles Coastal Watersheds (usually referred to as Basin Plan). Thesebeneficial uses are the cornerstone of the State and Regional Board's efforts to protect waterquality, as water quality objectives are set at levels that will protect the most sensitive beneficialuse of a waterbody. Together, beneficial uses and water quality objectives form water qualitystandards (CRWQCB, 1994).
Twenty-one beneficial uses for waters in the Santa Clara River Watershed are designated in theRegional Board's Basin Plan. These beneficial uses are listed by waterbody and hydrologic unitin the table below. Certain site specific water quality objectives, namely TDS, sulfate, chloride,boron, and--for surface waters--nitrogen, reflect background levels of constituents in the mid-1970s, in accordance with the State Board's Antidegradation Policy. Water quality objectives forthese and for other constituents and parameters can be found in the Basin Plan (CRWQCB,1994).
State of the Watershed – Report on Surface Water QualitySanta Clara River Watershed, November 2006
18
From: Table 2-1. Beneficial Uses of Inland Surface Waters. (CRWQCB, 1994)Watersheda Hydro
Unit #MUN IND PROC AGR GWR FRSH NAV POW REC1 REC2 COM AQUA WARM COLD SAL EST MAR WILD BIOL RARE MIGR SPWN SHELL WETb
SANTA CLARA RIVER WATERSHEDSanta Clara River Estuary c 403.11 E E E E E E E Ee Ef Ef ESanta Clara River 403.11 P* E E E E E E E E E E E E ESanta Clara River 403.21 P* E E E E E Ed E E E E E ESanta Clara River 403.31 P* E E E E E Ed E E E E E E
Santa Clara River 403.41 P* E E E E E E E E E E E ESanta Clara River 403.51 P* E E E E E E E E E E ESanta Clara River (Soledad Cyn) 403.55 E* E E E E E E E E E Ei ESanta Paula Creek 403.21 P E E E E E E E E E E E E ESisar Creek 403.21 P E P E E E E E E E Eg E E
Sisar Creek 403.22 P E P E E E E E E E Eg E E
Sespe Creek 403.31 P E E E E E E E E E E E E E E
Sespe Creek 403.32 P E P E E E E E E E E Eg E E E
Timber Creek 403.32 P* E E E E E E E E E E
Bear Canyon 403.32 P* E E E E P E E E E E E
Trout Creek 403.32 P* E E E E E E E E E E
Piedra Blanca Creek 403.32 P* E E E E E E E E E
Lion Canyon 403.32 P* E E E E E E E E E
Rose Valley Creek 403.32 P* E E E E E E E E
Howard Creek 403.32 P* E E E E E E E E E E
Tule Creek 403.32 P* E P E P E E E E E E
Potrero John Creek 403.32 P* E E E P E E E E E
Hopper Creek 403.41 P* E E E E E E E E E Eg E
Piru Creek 403.41 P E E E E E E E E E E Eg E E E
Piru Creek 403.42 P E E E E E E E E E E Eg E E
Lake Piru 403.41 P E E E E P E E E E E E E
Lake Piru 403.42 P E E E E P P E E E E E E E
Pyramid Lake 403.42 E E E E E P E E E E E E E
Cañada de los Alamos 403.43 I* I I I I I I I E E
Gorman Creek 403.43 I* I I I I I I E P
Lockwood Creek 403.42 I* I I I I I I E
Lockwood Creek 403.44 I* I I I I I I I E
Tapo Canyon 403.41 P* P P E E E
Castaic Creek 403.51 I I I I I I I E I E E
State of the Watershed – Report on Surface Water QualitySanta Clara River Watershed, November 2006
19
From: Table 2-1. Beneficial Uses of Inland Surface Waters. (CRWQCB, 1994)Watersheda Hydro
Unit #MUN IND PROC AGR GWR FRSH NAV POW REC1 REC2 COM AQUA WARM COLD SAL EST MAR WILD BIOL RARE MIGR SPWN SHELL WETb
Castaic Lagoon 403.51 E* E E E E E E E E ECastaic Lake 403.51 E E E E E E E E E E E E E
Elderberry Forebay 403.51 E E E E E E E Ek E E E E E
Elizabeth Lake Canyon 403.51 I I I I I I I E I E
San Francisquito Canyon l 403.51 I I I I I I I I I E E I E
South Fork (Santa Clara River) 403.51 I* I I I I I I I I E
Drinkwater Reservoir 403.51 P* E Pk E P E E E
Bouquet Canyon 403.51 E l E l P l P l E P Em E E E E P E
Bouquet Canyon 403.52 P P P E E P Em E E E E E E
Dry Canyon Creek 403.51 I I I I I I I I I E
Dry Canyon Reservoir j 403.51 E E E E P P P Pk E E E
Bouquet Reservoir 403.52 E E E E E E P Pk E E E
Mint Canyon Creek 403.51 I I I I I I Im I I E
Mint Canyon Creek 403.53 I* I I I I I Im I I E
Agua Dulce Canyon Creek 403.54 I* I I I I I I I I E E
Agua Dulce Canyon Creek 403.55 I* I I I I I I E
Aliso Canyon Creek 403.55 P* P E E E E E E
Lake Hughes 403.51 P P P P P P E E E E
Munz Lake 403.51 P* P P P E P E E E E
Lake Elizabeth 403.51 P P P P P P E E E E E
E: Existing beneficial use Footnotes are consistent on all beneficial use tables. f Aquatic organisms utilize all bays, estuaries, lagoons and coastal wetlands, to a certain extent,P: Potential beneficial use a Waterbodies are listed multiple times if they cross hydrologic area or sub area boundaries for spawning and early development. This may include migration into areas which are heavilyI: Intermittent beneficial use Beneficial use designations apply to all tributaries to the indicated waterbody, if not listed separately. influenced by freshwater inputs.E, P, and I shall be protected as required b Waterbodies designated as WET may have wetlands habitat associated with only a portion of the waterbody. m Access prohibited by Los Angeles County DPW in the concrete-channelized areas.* Asterixed MUN designations are Any regulatory action would require a detailed analysis of the area. n Area is currently under control of the Navy: swimming is prohibited.
designated under SB 88-63 and RB 89-03 c Coastal waterbodies which are also listed in Coastal Features Table (2-3) or in Wetlands Table (2-4). o Marine habitats of the Channel Islands and Mugu Lagoon serve as pinnepedSome designations may still be considered d Limited public access precludes full utilization. haul-out areas for one or more species (i.e., sea lions).for exemptions at a later date. (See e One or more rare species utilize all ocean, bays, estuaries, and coastal wetlands for p Habitat of the Clapper Rail.pages 2-3, 4 for details). foraging and/or nesting. q Whenever flow conditions are suitable.
r Public access prohibited by Calleguas MWD
State of the Watershed – Report on Surface Water QualitySanta Clara River Watershed, November 2006
20
Beneficial Use Definitions
Beneficial uses in the Los Angeles Basin are listed as defined below. The uses are listed in nopreferential order.
Municipal and Domestic Supply (MUN)Uses of water for community, military, or individual water supply systems including, but not limited to,drinking water supply.
Agricultural Supply (AGR)Uses of water for farming, horticulture, or ranching including, but not limited to, irrigation, stock watering,or support of vegetation for range grazing.
Industrial Process Supply (PROC)Uses of water for industrial activities that depend primarily on water quality.
Industrial Service Supply (IND)Uses of water for industrial activities that do not depend primarily on water quality including, but notlimited to, mining, cooling water supply, hydraulic conveyance, gravel washing, fire protection, or oil wellre-pressurization.
Ground Water Recharge (GWR)Uses of water for natural or artificial recharge of ground water for purposes of future extraction,maintenance of water quality, or halting of saltwater intrusion into freshwater aquifers.
Freshwater Replenishment (FRSH)Uses of water for natural or artificial maintenance of surface water quantity or quality (e.g., salinity).
Navigation (NAV)Uses of water for shipping, travel, or other transportation by private, military, or commercial vessels.
Hydropower Generation (POW)Uses of water for hydropower generation.
Water Contact Recreation (REC-1)Uses of water for recreational activities involving body contact with water, where ingestion of water isreasonably possible. These uses include, but are not limited to, swimming, wading, water-skiing, skin andscuba diving, surfing, white water activities, fishing, or use of natural hot springs.
Non-contact Water Recreation (REC-2)Uses of water for recreational activities involving proximity to water, but not normally involving bodycontact with water, where ingestion of water is reasonably possible. These uses include, but are not limitedto, picnicking, sunbathing, hiking, beachcombing, camping, boating, tidepool and marine life study,hunting, sightseeing, or aesthetic enjoyment in conjunction with the above activities.
Commercial and Sport Fishing (COMM)Uses of water for commercial or recreational collection of fish, shellfish, or other organisms including, butnot limited to, uses involving organisms intended for human consumption or bait purposes.
Aquaculture (AQUA)Uses of water for aquaculture or mariculture operations including, but not limited to, propagation,cultivation, maintenance, or harvesting of aquatic plants and animals for human consumption or baitpurposes.
State of the Watershed – Report on Surface Water QualitySanta Clara River Watershed, November 2006
21
Warm Freshwater Habitat (WARM)Uses of water that support warm water ecosystems including, but not limited to, preservation orenhancement of aquatic habitats, vegetation, fish, or wildlife, including invertebrates.
Cold Freshwater Habitat (COLD)Uses of water that support cold water ecosystems including, but not limited to, preservation orenhancement of aquatic habitats, vegetation, fish, or wildlife, including invertebrates.
Inland Saline Water Habitat (SAL)Uses of water that support inland saline water ecosystems including, but not limited to, preservation orenhancement of aquatic saline habitats, vegetation, fish, or wildlife, including invertebrates.
Estuarine Habitat (EST)Uses of water that support estuarine ecosystems including, but not limited to, preservation or enhancementof estuarine habitats, vegetation, fish, shellfish, or wildlife (e.g., estuarine mammals, waterfowl,shorebirds).
Wetland Habitat (WET)Uses of water that support wetland ecosystems, including, but not limited to, preservation or enhancementof wetland habitats, vegetation, fish, shellfish, or wildlife, and other unique wetland functions whichenhance water quality, such as providing flood and erosion control, stream bank stabilization, and filtrationand purification of naturally occurring contaminants.
Marine Habitat (MAR)Uses of water that support marine ecosystems including, but not limited to, preservation or enhancement ofmarine habitats, vegetation such as kelp, fish, shellfish, or wildlife (e.g., marine mammals, shorebirds).
Wildlife Habitat (WILD)Uses of water that support terrestrial ecosystems including, but not limited to, preservation andenhancement of terrestrial habitats, vegetation, wildlife (e.g., mammals, birds, reptiles, amphibians,invertebrates), or wildlife water and food sources.
Preservation of Biological Habitats (BIOL)Uses of water that support designated areas or habitats, such as Areas of Special Biological Significance(ASBS), established refuges, parks, sanctuaries, ecological reserves, or other areas where the preservationor enhancement of natural resources requires special protection.
Stakeholder Groups
The term “stakeholder group” is subject to many different definitions. For the purposes of thisdocument, the term is considered to include those groups consisting of individuals and agencieswho meet on a fairly regular basis to address holistic watershed issues or who otherwise havecontributed as a group to the knowledge of the watershed. It is acknowledged that many othergroups address more focused activities relating to, in particular, water quality improvement andinvasive plants removal.
Santa Clara River Enhancement and Management Plan (SCREMP) Steering Committee Thisgroup no longer actively meets but its 26-member Project Steering Committee completed anEnhancement and Management Plan during the 1990s. The Committee consisted ofrepresentatives of the following individuals and agencies:
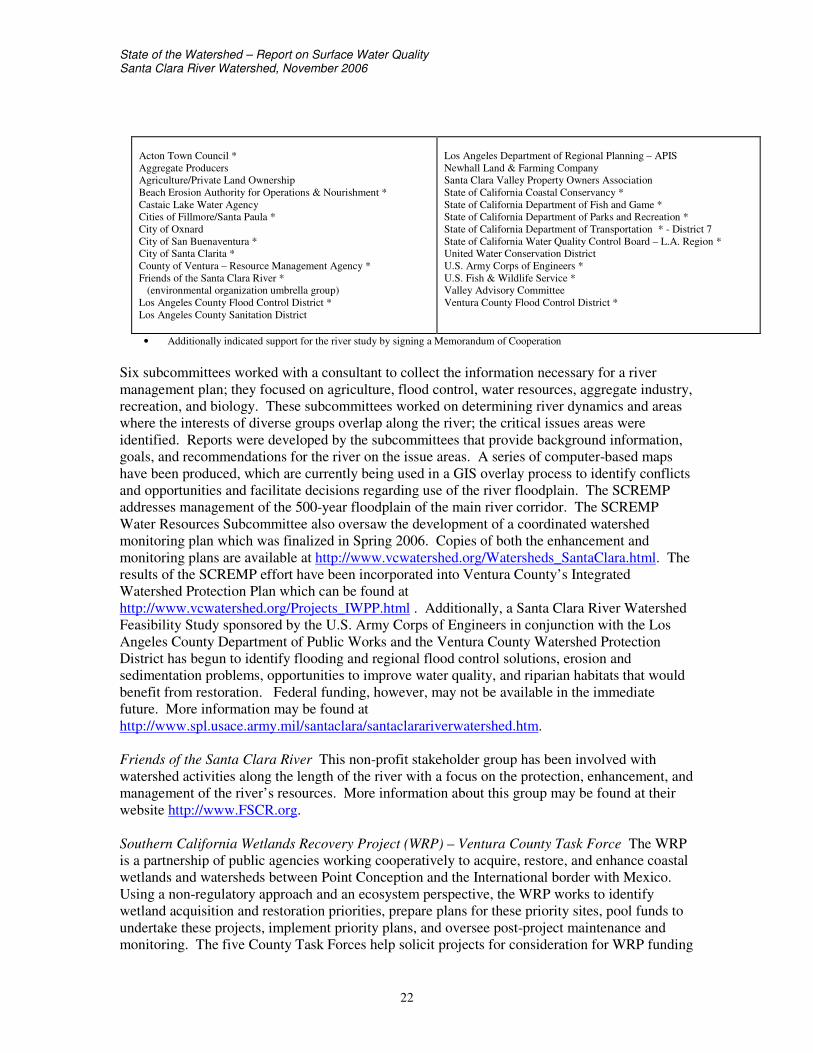
State of the Watershed – Report on Surface Water QualitySanta Clara River Watershed, November 2006
22
Acton Town Council *Aggregate ProducersAgriculture/Private Land OwnershipBeach Erosion Authority for Operations & Nourishment *Castaic Lake Water AgencyCities of Fillmore/Santa Paula *City of OxnardCity of San Buenaventura *City of Santa Clarita *County of Ventura – Resource Management Agency *Friends of the Santa Clara River * (environmental organization umbrella group)Los Angeles County Flood Control District *Los Angeles County Sanitation District
Los Angeles Department of Regional Planning – APISNewhall Land & Farming CompanySanta Clara Valley Property Owners AssociationState of California Coastal Conservancy *State of California Department of Fish and Game *State of California Department of Parks and Recreation *State of California Department of Transportation * - District 7State of California Water Quality Control Board – L.A. Region *United Water Conservation DistrictU.S. Army Corps of Engineers *U.S. Fish & Wildlife Service *Valley Advisory CommitteeVentura County Flood Control District *
• Additionally indicated support for the river study by signing a Memorandum of Cooperation
Six subcommittees worked with a consultant to collect the information necessary for a rivermanagement plan; they focused on agriculture, flood control, water resources, aggregate industry,recreation, and biology. These subcommittees worked on determining river dynamics and areaswhere the interests of diverse groups overlap along the river; the critical issues areas wereidentified. Reports were developed by the subcommittees that provide background information,goals, and recommendations for the river on the issue areas. A series of computer-based mapshave been produced, which are currently being used in a GIS overlay process to identify conflictsand opportunities and facilitate decisions regarding use of the river floodplain. The SCREMPaddresses management of the 500-year floodplain of the main river corridor. The SCREMPWater Resources Subcommittee also oversaw the development of a coordinated watershedmonitoring plan which was finalized in Spring 2006. Copies of both the enhancement andmonitoring plans are available at http://www.vcwatershed.org/Watersheds_SantaClara.html. Theresults of the SCREMP effort have been incorporated into Ventura County’s IntegratedWatershed Protection Plan which can be found athttp://www.vcwatershed.org/Projects_IWPP.html . Additionally, a Santa Clara River WatershedFeasibility Study sponsored by the U.S. Army Corps of Engineers in conjunction with the LosAngeles County Department of Public Works and the Ventura County Watershed ProtectionDistrict has begun to identify flooding and regional flood control solutions, erosion andsedimentation problems, opportunities to improve water quality, and riparian habitats that wouldbenefit from restoration. Federal funding, however, may not be available in the immediatefuture. More information may be found athttp://www.spl.usace.army.mil/santaclara/santaclarariverwatershed.htm.
Friends of the Santa Clara River This non-profit stakeholder group has been involved withwatershed activities along the length of the river with a focus on the protection, enhancement, andmanagement of the river’s resources. More information about this group may be found at theirwebsite http://www.FSCR.org.
Southern California Wetlands Recovery Project (WRP) – Ventura County Task Force The WRPis a partnership of public agencies working cooperatively to acquire, restore, and enhance coastalwetlands and watersheds between Point Conception and the International border with Mexico.Using a non-regulatory approach and an ecosystem perspective, the WRP works to identifywetland acquisition and restoration priorities, prepare plans for these priority sites, pool funds toundertake these projects, implement priority plans, and oversee post-project maintenance andmonitoring. The five County Task Forces help solicit projects for consideration for WRP funding
State of the Watershed – Report on Surface Water QualitySanta Clara River Watershed, November 2006
23
by the Managers Group and Board of Governors. The Ventura County Task Force also serves asan active forum for presentations on the many technical studies currently underway including theSanta Clara River Parkway Floodplain Restoration Feasibility Study. More information about theWRP may be found on their webpage at http://www.scwrp.org and about the parkway project athttp://www.santaclarariverparkway.org/wkb/projects/scrfeasibility.
Santa Clarita Organization for Planning the Environment (SCOPE) This group has beeninvolved with educating the public about planning and environmental issues, including thoseinvolving the river, particularly in the area around the Santa Clarita Valley. More informationabout this group may be found at their website http://www.scope.org.
Santa Clara Estuary Work Group This group includes staff from the Regional Board, CaliforniaDepartment of Fish and Game, California State Parks - Channel Coast District, and the VenturaWater Reclamation Plant. A Natural Resources Management Plan is being prepared for the StateParks land in and around the estuary.
Land Use Characteristics
The majority of the watershed is open space (Figure 5), most of which is National Forest orcondor sanctuary. Large numbers of waterfalls or springs are shown on topographic maps in theupper Sespe. Along the mainstem of the river on the Ventura County portion (lower and middlesections of the river), agriculture predominates interspersed with residential and some industrialdevelopment. Besides the predominant open space, the upper portion of the watershed ischaracterized by a mix of residential, mixed urban, and industrial land uses with low densityresidential more common in the uppermost areas of the watershed while high density is moreprevalent elsewhere. There are a number of cities and communities in the Santa Clarita Valley, inthe upper watershed, including the city of Santa Clarita (which includes the communities ofValencia, Saugus, Canyon Country, and Newhall). Communities outside of the city limitsinclude Castaic, Porter Ranch, Acton, Agua Dulce, Val Verde, and areas in unincorporated LosAngeles County. The cities and communities of the Santa Clara River Valley in Ventura Countyare, progressing westward, Piru, Fillmore, Santa Paula, Saticoy, and Ventura. A very largedevelopment of new homes has been proposed to be built on land owned by Newhall Land andFarming Company on the east side of the county line in unincorporated Los Angeles and VenturaCounties. A large number of new homes are also being constructed in the city of Fillmore alongthe river and in the city of Oxnard along the southern bank of the river.
Oil production is now a small part of the industrial land use compared to decades ago. Oilproduction in the watershed began in the late 1880s and only began to lag in the 1970s. Many oilproduction structures remain in place and are represented on topographic maps. These oil-producing sites, whether as natural seeps or as disused production wells, may be sources ofvisible oil and releases of brine. The eastern parts of the Sespe Creek Subwatershed, particularlyLittle Sespe and Tar Creeks, show oil wells and tanks on the topographic maps. Maps of theSanta Paula Creek Subwatershed also show large number of oil wells. Both Sespe and SantaPaula also show sulfur springs. The South Fork and its tributaries show a great many oil wells.Adams Canyon, just west of Santa Paula, also was known for its prolific oil production.Interestingly, a side canyon to Adams is called Salt Marsh Canyon. There is also a Salt Creekflowing into Castaic Creek. Hopper Canyon and Piru Creek are a few subwatersheds that do notshow oil wells on topographic maps.
State of the Watershed – Report on Surface Water QualitySanta Clara River Watershed, November 2006
24
Piru Creek supports a variety of land uses and vegetation types. Several campgrounds occur alongthe drainage in the upper subwatershed that provide limited access and recreational opportunities.Cattle grazing occurs in certain areas immediately adjacent to Lake Piru. The lower portion of thedrainage near the Santa Clara River valley contains urban and agricultural development along thecreek and adjacent foothills (SCWRP website).
The Santa Clara River Valley continues to support one of California's major citrus grove areas.Other crops and land uses in this valley include avocado, pasture, small grains, alfalfa, andindustries related to agriculture such as packing, processing, and trucking (SCWRP website).
The 500-year floodplain of the river has been the primary source of sand and gravel (aggregate)for several decades. The sand and gravel deposits are extracted for use as aggregate in theprocess that in California is generally referred to as surface mining. The last in-river miningactivity on the Los Angeles County side had occurred in 1993, but which is now active, and themajority of the in-river mining in its Ventura County segment ceased in the late 1980s (AMEC,2005). However, large-scale gravel mining operations have been proposed recently in the SantaClarita area.
Discharges into the Watershed
Historical Discharges/Permits Timeline
1950s/1960s large amounts of brine discharges from oil fields1957 first waste discharge requirements (WDRs) issued for Saticoy Sanitation DistrictWastewater Treatment Plant (WWTP)1971 first WDRs issued for Piru WWTP1977 first NPDES permit issued for Fillmore WWTP1979 first WDRs issued for Montalvo WWTP1979 first NPDES permit issued for Saugus WWRP1979 first NPDES permit issued for Valencia WWRP1980 first NPDES permit issued for Santa Paula WWRP1980 first NPDES permit issued for Ventura Wastewater Reclamation Plant (WWRP)1997 water softener ban lifted2003 June-Sept nitrification/denitrification requirements go into effect at Valencia and SaugusWRPs and modifications are implemented2003 residential water softener ban reinstated in Santa Clarita2004 residential water softener ban enacted in Fillmore
NPDES Permits (not general construction or industrial stormwater-related)(CRWQCB, 2004)
There are four major discharges (all POTWs), 11 minor discharges, and 15 discharges covered bygeneral permits. Of the five POTWs discharging to surface waters, one discharges into theestuary (San Buenaventura at 14 MGD design flow), two into Reach 3 (Santa Paula at 2.55 MGDdesign flow and Fillmore at 1.33 MGD design flow), one into Reach 5 (Valencia at 21.6 MGDdesign flow), and one into Reach 6 (Saugus at 6.5 MGD design flow).
Major discharges are defined as POTWs with a yearly average flow of over 0.5 MGD or anindustrial source with a yearly average flow of over 0.1 MGD and those with lesser flows butwith acute or potential adverse environmental impacts.
State of the Watershed – Report on Surface Water QualitySanta Clara River Watershed, November 2006
25
Minor discharges are defined as all other discharges that are not categorized as a Major. Minordischarges may be covered by a general permit, which are issued administratively, for those thatmeet the conditions specified by the particular general permit.
Twenty of the 30 NPDES discharges are to the mainstem of the Santa Clara River while the restdischarge to various tributaries or lakes.
Of the NPDES discharges under general permits:
• 10 are for miscellaneous wastes (dewatering, rec. lake overflow, swimming pool wastes,water ride wastewater, or groundwater seepage) that were nonhazardous prior to treatment,
• 5 are for domestic sewage and industrial wastes that were nonhazardous prior to treatment,• 4 are for contaminated groundwater that were nonhazardous prior to treatment,• 3 are for miscellaneous wastes that were inert prior to treatment,• 2 are for process waste (produced as part of industrial/manufacturing process) that were
nonhazardous prior to treatment, and• One each are for stormwater runoff (nonhazardous before treatment), miscellaneous wastes
(inert before treatment), contaminated groundwater (hazardous before treatment), andnoncontact cooling water (nonhazardous before treatment).
• 4 are covered by NPDES Permit No. CAG994004 – for discharges of groundwater (treated oruntreated) from construction and project dewatering to surface waters (threat/complexityrating to be determined)
• 3 each are covered by NPDES Permit No. CAG994005 – for discharges of groundwater frompotable water supply wells to surface waters (threat/complexity rating to be determined) andNPDES Permit No. CAG994001 (being replaced by CAG994004) – for groundwaterdischarges from construction and project dewatering to surface waters (threat/complexityrating 3C)
• 2 are covered by NPDES Permit No. CAG914001 – for discharges of volatile organiccompound contaminated groundwater to surface waters (threat/complexity rating 2B), and
• One each are covered by NPDES Permit No. CAG674001 – for discharges of hydrostatic testwater to surface waters (threat/complexity rating 3C), NPDES Permit No. CAG834001 – fortreated groundwater and other wastewaters from investigation and/or cleanup of petroleumfuel pollution to surface waters (threat/complexity rating 2B), and NPDES Permit No.CAG994003 – for discharges of nonprocess wastewaters not requiring treatment systems tosurface waters (threat/complexity rating 3C).
NPDES Permits (general construction or industrial stormwater-related) (CRWQCB, 2004)
Of the 114 dischargers enrolled under the general industrial storm water permit in the watershed,the largest numbers are located in the cities of Santa Clarita and Santa Paula. There is a widearray of businesses represented with many being involved with auto wrecking and food packing.A similar number of sites are located in the upper and lower watershed.
There are approximately 300 sites enrolled under the construction storm water permit; themajority of these sites are located in the upper watershed, especially within the city of SantaClarita and surrounding unincorporated Los Angeles County. About one-half of the sites areresidential and about two-thirds are five acres or greater in size with six sites being at least 1,000acres.
State of the Watershed – Report on Surface Water QualitySanta Clara River Watershed, November 2006
26
Non-NPDES Discharges (Chapter 15 and Non-Chapter 15) (CRWQCB, 2004)
There are eight facilities with Chapter 15 requirements (mostly landfills, some closed) while thereare 54 facilities with non-Chapter 15 waste discharge requirements. Included in the latterfacilities are POTWs which discharge to percolation or evaporation ponds. The Montalvo planthas a design capacity of 0.36 MGD and is located in Reach 1. The Saticoy plant has a designcapacity of 0.3 MGD and is located in Reach 2. The Piru facility has a design capacity of 0.2MGD and is located in Reach 5.
The following series of tables is a list of the facilities which discharge into the watershed.
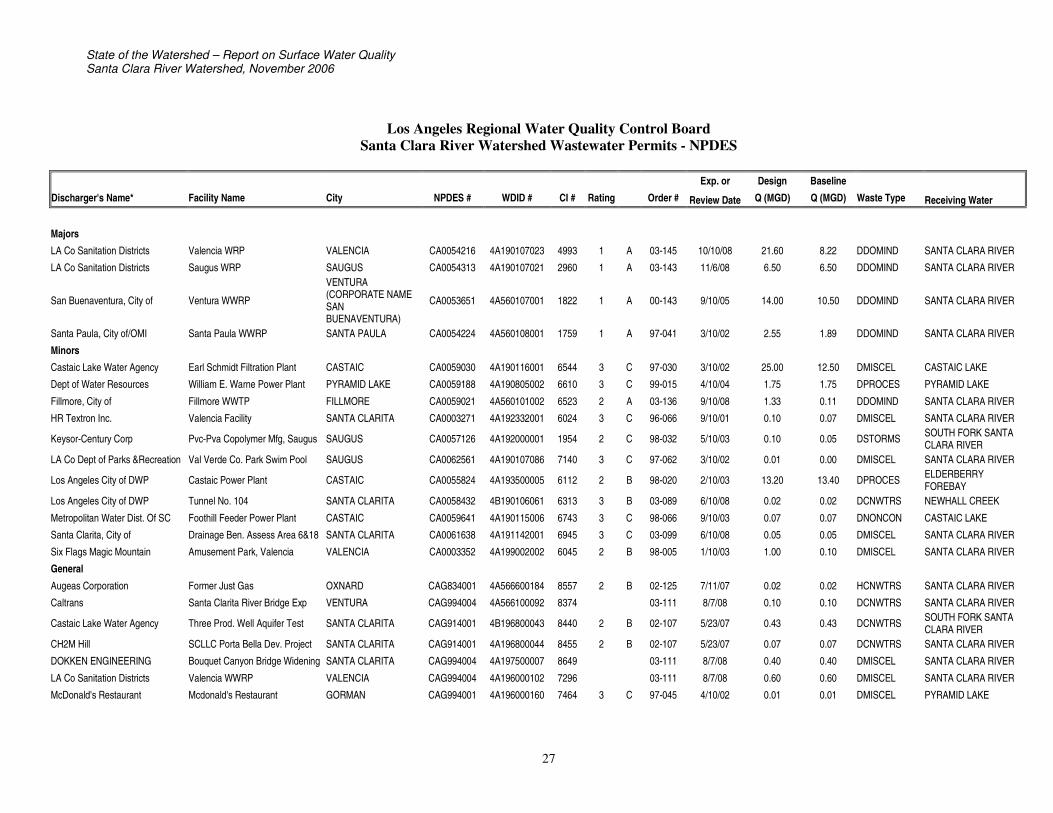
State of the Watershed – Report on Surface Water QualitySanta Clara River Watershed, November 2006
27
Los Angeles Regional Water Quality Control BoardSanta Clara River Watershed Wastewater Permits - NPDES
Exp. or Design BaselineDischarger's Name* Facility Name City NPDES # WDID # CI # Rating Order # Review Date Q (MGD) Q (MGD) Waste Type Receiving Water
MajorsLA Co Sanitation Districts Valencia WRP VALENCIA CA0054216 4A190107023 4993 1 A 03-145 10/10/08 21.60 8.22 DDOMIND SANTA CLARA RIVER
LA Co Sanitation Districts Saugus WRP SAUGUS CA0054313 4A190107021 2960 1 A 03-143 11/6/08 6.50 6.50 DDOMIND SANTA CLARA RIVER
San Buenaventura, City of Ventura WWRP
VENTURA(CORPORATE NAMESANBUENAVENTURA)
CA0053651 4A560107001 1822 1 A 00-143 9/10/05 14.00 10.50 DDOMIND SANTA CLARA RIVER
Santa Paula, City of/OMI Santa Paula WWRP SANTA PAULA CA0054224 4A560108001 1759 1 A 97-041 3/10/02 2.55 1.89 DDOMIND SANTA CLARA RIVER
MinorsCastaic Lake Water Agency Earl Schmidt Filtration Plant CASTAIC CA0059030 4A190116001 6544 3 C 97-030 3/10/02 25.00 12.50 DMISCEL CASTAIC LAKE
Dept of Water Resources William E. Warne Power Plant PYRAMID LAKE CA0059188 4A190805002 6610 3 C 99-015 4/10/04 1.75 1.75 DPROCES PYRAMID LAKE
Fillmore, City of Fillmore WWTP FILLMORE CA0059021 4A560101002 6523 2 A 03-136 9/10/08 1.33 0.11 DDOMIND SANTA CLARA RIVER
HR Textron Inc. Valencia Facility SANTA CLARITA CA0003271 4A192332001 6024 3 C 96-066 9/10/01 0.10 0.07 DMISCEL SANTA CLARA RIVER
Keysor-Century Corp Pvc-Pva Copolymer Mfg, Saugus SAUGUS CA0057126 4A192000001 1954 2 C 98-032 5/10/03 0.10 0.05 DSTORMS SOUTH FORK SANTACLARA RIVER
LA Co Dept of Parks &Recreation Val Verde Co. Park Swim Pool SAUGUS CA0062561 4A190107086 7140 3 C 97-062 3/10/02 0.01 0.00 DMISCEL SANTA CLARA RIVER
Los Angeles City of DWP Castaic Power Plant CASTAIC CA0055824 4A193500005 6112 2 B 98-020 2/10/03 13.20 13.40 DPROCES ELDERBERRYFOREBAY
Los Angeles City of DWP Tunnel No. 104 SANTA CLARITA CA0058432 4B190106061 6313 3 B 03-089 6/10/08 0.02 0.02 DCNWTRS NEWHALL CREEK
Metropolitan Water Dist. Of SC Foothill Feeder Power Plant CASTAIC CA0059641 4A190115006 6743 3 C 98-066 9/10/03 0.07 0.07 DNONCON CASTAIC LAKE
Santa Clarita, City of Drainage Ben. Assess Area 6&18 SANTA CLARITA CA0061638 4A191142001 6945 3 C 03-099 6/10/08 0.05 0.05 DMISCEL SANTA CLARA RIVER
Six Flags Magic Mountain Amusement Park, Valencia VALENCIA CA0003352 4A199002002 6045 2 B 98-005 1/10/03 1.00 0.10 DMISCEL SANTA CLARA RIVER
GeneralAugeas Corporation Former Just Gas OXNARD CAG834001 4A566600184 8557 2 B 02-125 7/11/07 0.02 0.02 HCNWTRS SANTA CLARA RIVER
Caltrans Santa Clarita River Bridge Exp VENTURA CAG994004 4A566100092 8374 03-111 8/7/08 0.10 0.10 DCNWTRS SANTA CLARA RIVER
Castaic Lake Water Agency Three Prod. Well Aquifer Test SANTA CLARITA CAG914001 4B196800043 8440 2 B 02-107 5/23/07 0.43 0.43 DCNWTRS SOUTH FORK SANTACLARA RIVER
CH2M Hill SCLLC Porta Bella Dev. Project SANTA CLARITA CAG914001 4A196800044 8455 2 B 02-107 5/23/07 0.07 0.07 DCNWTRS SANTA CLARA RIVER
DOKKEN ENGINEERING Bouquet Canyon Bridge Widening SANTA CLARITA CAG994004 4A197500007 8649 03-111 8/7/08 0.40 0.40 DMISCEL SANTA CLARA RIVER
LA Co Sanitation Districts Valencia WWRP VALENCIA CAG994004 4A196000102 7296 03-111 8/7/08 0.60 0.60 DMISCEL SANTA CLARA RIVER
McDonald's Restaurant Mcdonald's Restaurant GORMAN CAG994001 4A196000160 7464 3 C 97-045 4/10/02 0.01 0.01 DMISCEL PYRAMID LAKE
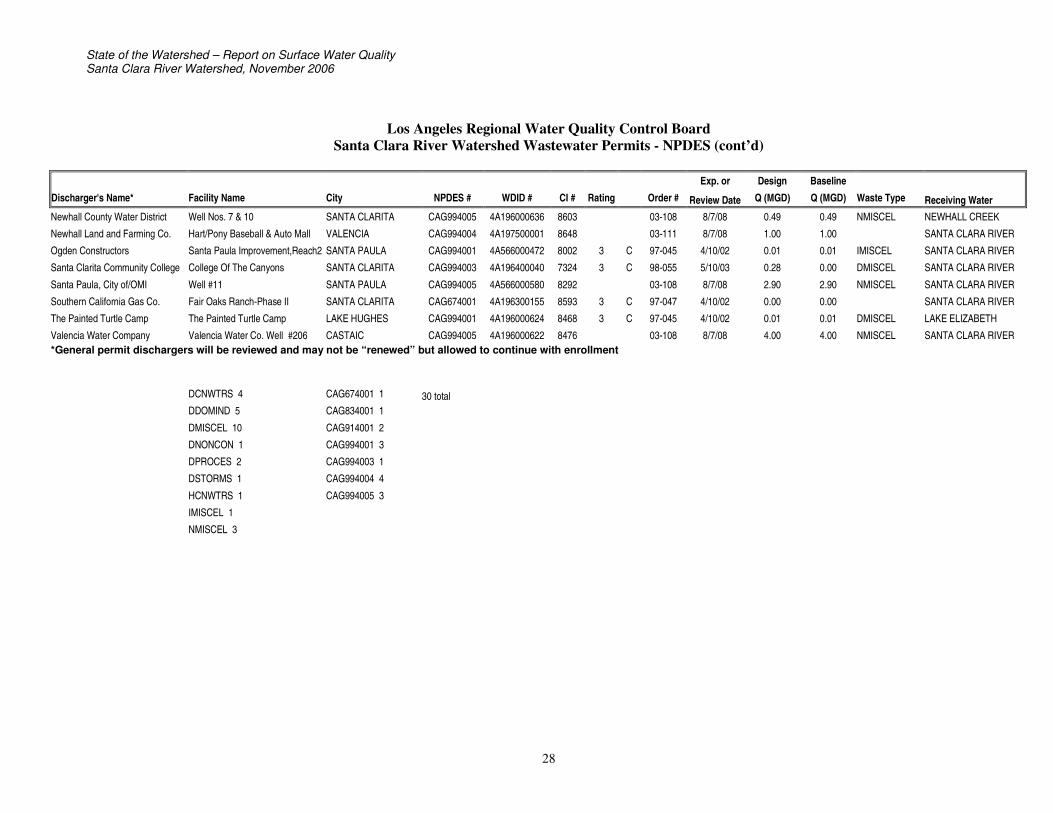
State of the Watershed – Report on Surface Water QualitySanta Clara River Watershed, November 2006
28
Los Angeles Regional Water Quality Control BoardSanta Clara River Watershed Wastewater Permits - NPDES (cont’d)
Exp. or Design BaselineDischarger's Name* Facility Name City NPDES # WDID # CI # Rating Order # Review Date Q (MGD) Q (MGD) Waste Type Receiving WaterNewhall County Water District Well Nos. 7 & 10 SANTA CLARITA CAG994005 4A196000636 8603 03-108 8/7/08 0.49 0.49 NMISCEL NEWHALL CREEK
Newhall Land and Farming Co. Hart/Pony Baseball & Auto Mall VALENCIA CAG994004 4A197500001 8648 03-111 8/7/08 1.00 1.00 SANTA CLARA RIVER
Ogden Constructors Santa Paula Improvement,Reach2 SANTA PAULA CAG994001 4A566000472 8002 3 C 97-045 4/10/02 0.01 0.01 IMISCEL SANTA CLARA RIVER
Santa Clarita Community College College Of The Canyons SANTA CLARITA CAG994003 4A196400040 7324 3 C 98-055 5/10/03 0.28 0.00 DMISCEL SANTA CLARA RIVER
Santa Paula, City of/OMI Well #11 SANTA PAULA CAG994005 4A566000580 8292 03-108 8/7/08 2.90 2.90 NMISCEL SANTA CLARA RIVER
Southern California Gas Co. Fair Oaks Ranch-Phase II SANTA CLARITA CAG674001 4A196300155 8593 3 C 97-047 4/10/02 0.00 0.00 SANTA CLARA RIVER
The Painted Turtle Camp The Painted Turtle Camp LAKE HUGHES CAG994001 4A196000624 8468 3 C 97-045 4/10/02 0.01 0.01 DMISCEL LAKE ELIZABETH
Valencia Water Company Valencia Water Co. Well #206 CASTAIC CAG994005 4A196000622 8476 03-108 8/7/08 4.00 4.00 NMISCEL SANTA CLARA RIVER*General permit dischargers will be reviewed and may not be “renewed” but allowed to continue with enrollment
DCNWTRS 4 CAG674001 1 30 totalDDOMIND 5 CAG834001 1
DMISCEL 10 CAG914001 2
DNONCON 1 CAG994001 3
DPROCES 2 CAG994003 1
DSTORMS 1 CAG994004 4
HCNWTRS 1 CAG994005 3
IMISCEL 1
NMISCEL 3
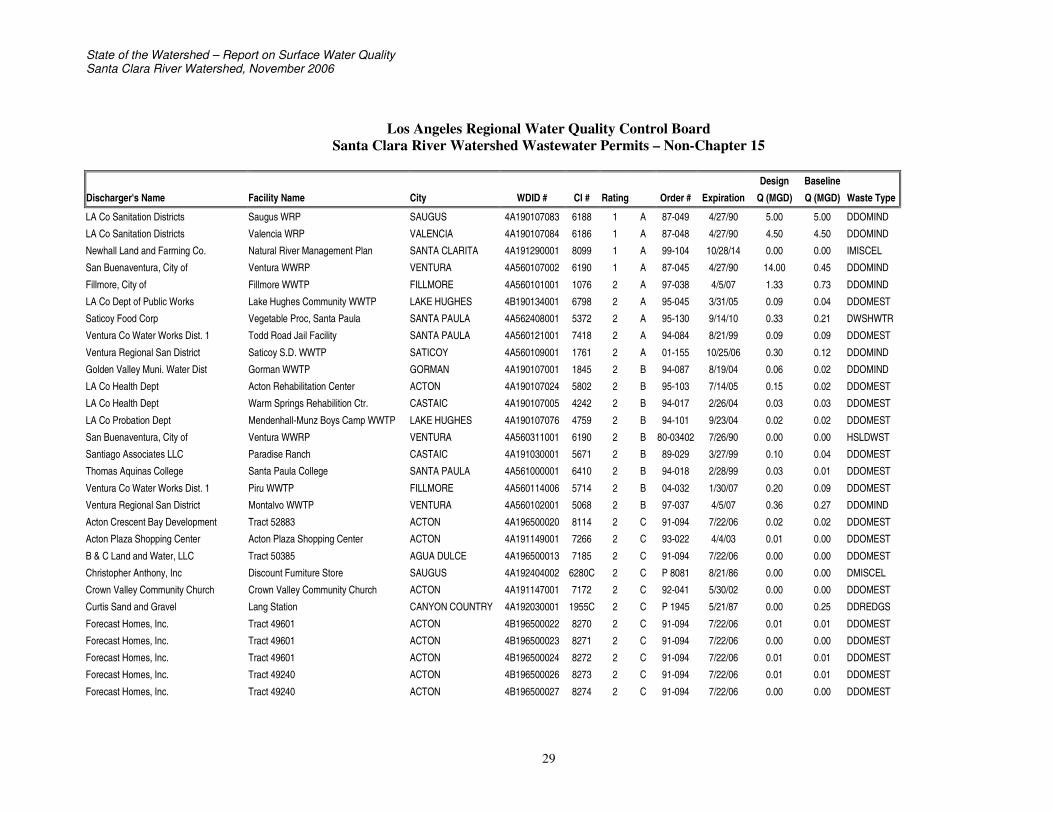
State of the Watershed – Report on Surface Water QualitySanta Clara River Watershed, November 2006
29
Los Angeles Regional Water Quality Control BoardSanta Clara River Watershed Wastewater Permits – Non-Chapter 15
Design BaselineDischarger's Name Facility Name City WDID # CI # Rating Order # Expiration Q (MGD) Q (MGD) Waste Type
LA Co Sanitation Districts Saugus WRP SAUGUS 4A190107083 6188 1 A 87-049 4/27/90 5.00 5.00 DDOMIND
LA Co Sanitation Districts Valencia WRP VALENCIA 4A190107084 6186 1 A 87-048 4/27/90 4.50 4.50 DDOMIND
Newhall Land and Farming Co. Natural River Management Plan SANTA CLARITA 4A191290001 8099 1 A 99-104 10/28/14 0.00 0.00 IMISCEL
San Buenaventura, City of Ventura WWRP VENTURA 4A560107002 6190 1 A 87-045 4/27/90 14.00 0.45 DDOMIND
Fillmore, City of Fillmore WWTP FILLMORE 4A560101001 1076 2 A 97-038 4/5/07 1.33 0.73 DDOMIND
LA Co Dept of Public Works Lake Hughes Community WWTP LAKE HUGHES 4B190134001 6798 2 A 95-045 3/31/05 0.09 0.04 DDOMEST
Saticoy Food Corp Vegetable Proc, Santa Paula SANTA PAULA 4A562408001 5372 2 A 95-130 9/14/10 0.33 0.21 DWSHWTR
Ventura Co Water Works Dist. 1 Todd Road Jail Facility SANTA PAULA 4A560121001 7418 2 A 94-084 8/21/99 0.09 0.09 DDOMEST
Ventura Regional San District Saticoy S.D. WWTP SATICOY 4A560109001 1761 2 A 01-155 10/25/06 0.30 0.12 DDOMIND
Golden Valley Muni. Water Dist Gorman WWTP GORMAN 4A190107001 1845 2 B 94-087 8/19/04 0.06 0.02 DDOMIND
LA Co Health Dept Acton Rehabilitation Center ACTON 4A190107024 5802 2 B 95-103 7/14/05 0.15 0.02 DDOMEST
LA Co Health Dept Warm Springs Rehabilition Ctr. CASTAIC 4A190107005 4242 2 B 94-017 2/26/04 0.03 0.03 DDOMEST
LA Co Probation Dept Mendenhall-Munz Boys Camp WWTP LAKE HUGHES 4A190107076 4759 2 B 94-101 9/23/04 0.02 0.02 DDOMEST
San Buenaventura, City of Ventura WWRP VENTURA 4A560311001 6190 2 B 80-03402 7/26/90 0.00 0.00 HSLDWST
Santiago Associates LLC Paradise Ranch CASTAIC 4A191030001 5671 2 B 89-029 3/27/99 0.10 0.04 DDOMEST
Thomas Aquinas College Santa Paula College SANTA PAULA 4A561000001 6410 2 B 94-018 2/28/99 0.03 0.01 DDOMEST
Ventura Co Water Works Dist. 1 Piru WWTP FILLMORE 4A560114006 5714 2 B 04-032 1/30/07 0.20 0.09 DDOMEST
Ventura Regional San District Montalvo WWTP VENTURA 4A560102001 5068 2 B 97-037 4/5/07 0.36 0.27 DDOMIND
Acton Crescent Bay Development Tract 52883 ACTON 4A196500020 8114 2 C 91-094 7/22/06 0.02 0.02 DDOMEST
Acton Plaza Shopping Center Acton Plaza Shopping Center ACTON 4A191149001 7266 2 C 93-022 4/4/03 0.01 0.00 DDOMEST
B & C Land and Water, LLC Tract 50385 AGUA DULCE 4A196500013 7185 2 C 91-094 7/22/06 0.00 0.00 DDOMEST
Christopher Anthony, Inc Discount Furniture Store SAUGUS 4A192404002 6280C 2 C P 8081 8/21/86 0.00 0.00 DMISCEL
Crown Valley Community Church Crown Valley Community Church ACTON 4A191147001 7172 2 C 92-041 5/30/02 0.00 0.00 DDOMEST
Curtis Sand and Gravel Lang Station CANYON COUNTRY 4A192030001 1955C 2 C P 1945 5/21/87 0.00 0.25 DDREDGS
Forecast Homes, Inc. Tract 49601 ACTON 4B196500022 8270 2 C 91-094 7/22/06 0.01 0.01 DDOMEST
Forecast Homes, Inc. Tract 49601 ACTON 4B196500023 8271 2 C 91-094 7/22/06 0.00 0.00 DDOMEST
Forecast Homes, Inc. Tract 49601 ACTON 4B196500024 8272 2 C 91-094 7/22/06 0.01 0.01 DDOMEST
Forecast Homes, Inc. Tract 49240 ACTON 4B196500026 8273 2 C 91-094 7/22/06 0.01 0.01 DDOMEST
Forecast Homes, Inc. Tract 49240 ACTON 4B196500027 8274 2 C 91-094 7/22/06 0.00 0.00 DDOMEST
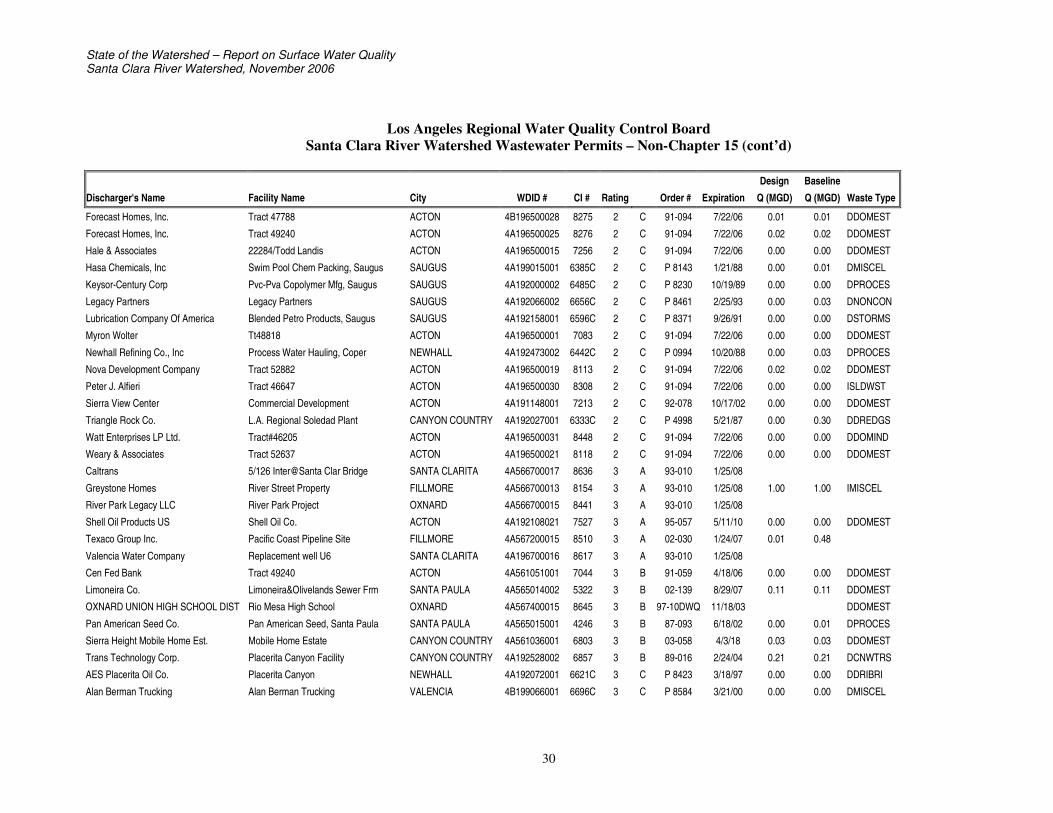
State of the Watershed – Report on Surface Water QualitySanta Clara River Watershed, November 2006
30
Los Angeles Regional Water Quality Control BoardSanta Clara River Watershed Wastewater Permits – Non-Chapter 15 (cont’d)
Design BaselineDischarger's Name Facility Name City WDID # CI # Rating Order # Expiration Q (MGD) Q (MGD) Waste Type
Forecast Homes, Inc. Tract 47788 ACTON 4B196500028 8275 2 C 91-094 7/22/06 0.01 0.01 DDOMEST
Forecast Homes, Inc. Tract 49240 ACTON 4A196500025 8276 2 C 91-094 7/22/06 0.02 0.02 DDOMEST
Hale & Associates 22284/Todd Landis ACTON 4A196500015 7256 2 C 91-094 7/22/06 0.00 0.00 DDOMEST
Hasa Chemicals, Inc Swim Pool Chem Packing, Saugus SAUGUS 4A199015001 6385C 2 C P 8143 1/21/88 0.00 0.01 DMISCEL
Keysor-Century Corp Pvc-Pva Copolymer Mfg, Saugus SAUGUS 4A192000002 6485C 2 C P 8230 10/19/89 0.00 0.00 DPROCES
Legacy Partners Legacy Partners SAUGUS 4A192066002 6656C 2 C P 8461 2/25/93 0.00 0.03 DNONCON
Lubrication Company Of America Blended Petro Products, Saugus SAUGUS 4A192158001 6596C 2 C P 8371 9/26/91 0.00 0.00 DSTORMS
Myron Wolter Tt48818 ACTON 4A196500001 7083 2 C 91-094 7/22/06 0.00 0.00 DDOMEST
Newhall Refining Co., Inc Process Water Hauling, Coper NEWHALL 4A192473002 6442C 2 C P 0994 10/20/88 0.00 0.03 DPROCES
Nova Development Company Tract 52882 ACTON 4A196500019 8113 2 C 91-094 7/22/06 0.02 0.02 DDOMEST
Peter J. Alfieri Tract 46647 ACTON 4A196500030 8308 2 C 91-094 7/22/06 0.00 0.00 ISLDWST
Sierra View Center Commercial Development ACTON 4A191148001 7213 2 C 92-078 10/17/02 0.00 0.00 DDOMEST
Triangle Rock Co. L.A. Regional Soledad Plant CANYON COUNTRY 4A192027001 6333C 2 C P 4998 5/21/87 0.00 0.30 DDREDGS
Watt Enterprises LP Ltd. Tract#46205 ACTON 4A196500031 8448 2 C 91-094 7/22/06 0.00 0.00 DDOMIND
Weary & Associates Tract 52637 ACTON 4A196500021 8118 2 C 91-094 7/22/06 0.00 0.00 DDOMEST
Caltrans 5/126 Inter@Santa Clar Bridge SANTA CLARITA 4A566700017 8636 3 A 93-010 1/25/08
Greystone Homes River Street Property FILLMORE 4A566700013 8154 3 A 93-010 1/25/08 1.00 1.00 IMISCEL
River Park Legacy LLC River Park Project OXNARD 4A566700015 8441 3 A 93-010 1/25/08
Shell Oil Products US Shell Oil Co. ACTON 4A192108021 7527 3 A 95-057 5/11/10 0.00 0.00 DDOMEST
Texaco Group Inc. Pacific Coast Pipeline Site FILLMORE 4A567200015 8510 3 A 02-030 1/24/07 0.01 0.48
Valencia Water Company Replacement well U6 SANTA CLARITA 4A196700016 8617 3 A 93-010 1/25/08
Cen Fed Bank Tract 49240 ACTON 4A561051001 7044 3 B 91-059 4/18/06 0.00 0.00 DDOMEST
Limoneira Co. Limoneira&Olivelands Sewer Frm SANTA PAULA 4A565014002 5322 3 B 02-139 8/29/07 0.11 0.11 DDOMEST
OXNARD UNION HIGH SCHOOL DIST Rio Mesa High School OXNARD 4A567400015 8645 3 B 97-10DWQ 11/18/03 DDOMEST
Pan American Seed Co. Pan American Seed, Santa Paula SANTA PAULA 4A565015001 4246 3 B 87-093 6/18/02 0.00 0.01 DPROCES
Sierra Height Mobile Home Est. Mobile Home Estate CANYON COUNTRY 4A561036001 6803 3 B 03-058 4/3/18 0.03 0.03 DDOMEST
Trans Technology Corp. Placerita Canyon Facility CANYON COUNTRY 4A192528002 6857 3 B 89-016 2/24/04 0.21 0.21 DCNWTRS
AES Placerita Oil Co. Placerita Canyon NEWHALL 4A192072001 6621C 3 C P 8423 3/18/97 0.00 0.00 DDRIBRI
Alan Berman Trucking Alan Berman Trucking VALENCIA 4B199066001 6696C 3 C P 8584 3/21/00 0.00 0.00 DMISCEL
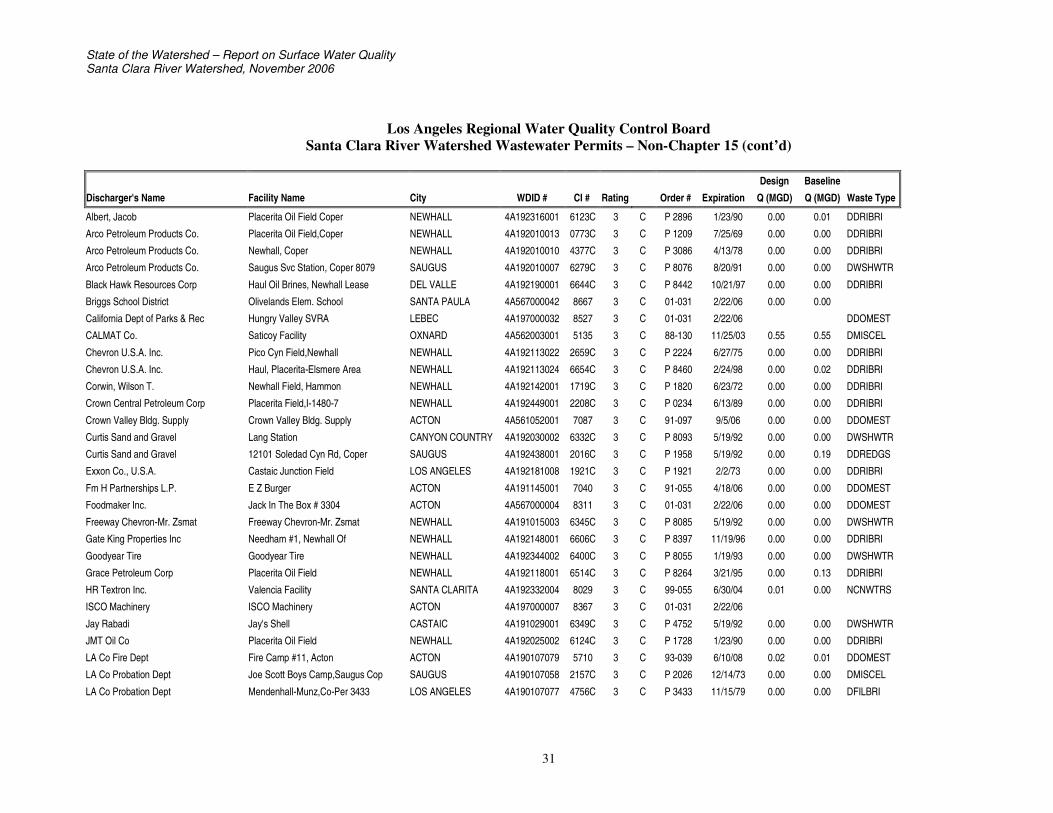
State of the Watershed – Report on Surface Water QualitySanta Clara River Watershed, November 2006
31
Los Angeles Regional Water Quality Control BoardSanta Clara River Watershed Wastewater Permits – Non-Chapter 15 (cont’d)
Design BaselineDischarger's Name Facility Name City WDID # CI # Rating Order # Expiration Q (MGD) Q (MGD) Waste Type
Albert, Jacob Placerita Oil Field Coper NEWHALL 4A192316001 6123C 3 C P 2896 1/23/90 0.00 0.01 DDRIBRI
Arco Petroleum Products Co. Placerita Oil Field,Coper NEWHALL 4A192010013 0773C 3 C P 1209 7/25/69 0.00 0.00 DDRIBRI
Arco Petroleum Products Co. Newhall, Coper NEWHALL 4A192010010 4377C 3 C P 3086 4/13/78 0.00 0.00 DDRIBRI
Arco Petroleum Products Co. Saugus Svc Station, Coper 8079 SAUGUS 4A192010007 6279C 3 C P 8076 8/20/91 0.00 0.00 DWSHWTR
Black Hawk Resources Corp Haul Oil Brines, Newhall Lease DEL VALLE 4A192190001 6644C 3 C P 8442 10/21/97 0.00 0.00 DDRIBRI
Briggs School District Olivelands Elem. School SANTA PAULA 4A567000042 8667 3 C 01-031 2/22/06 0.00 0.00
California Dept of Parks & Rec Hungry Valley SVRA LEBEC 4A197000032 8527 3 C 01-031 2/22/06 DDOMEST
CALMAT Co. Saticoy Facility OXNARD 4A562003001 5135 3 C 88-130 11/25/03 0.55 0.55 DMISCEL
Chevron U.S.A. Inc. Pico Cyn Field,Newhall NEWHALL 4A192113022 2659C 3 C P 2224 6/27/75 0.00 0.00 DDRIBRI
Chevron U.S.A. Inc. Haul, Placerita-Elsmere Area NEWHALL 4A192113024 6654C 3 C P 8460 2/24/98 0.00 0.02 DDRIBRI
Corwin, Wilson T. Newhall Field, Hammon NEWHALL 4A192142001 1719C 3 C P 1820 6/23/72 0.00 0.00 DDRIBRI
Crown Central Petroleum Corp Placerita Field,I-1480-7 NEWHALL 4A192449001 2208C 3 C P 0234 6/13/89 0.00 0.00 DDRIBRI
Crown Valley Bldg. Supply Crown Valley Bldg. Supply ACTON 4A561052001 7087 3 C 91-097 9/5/06 0.00 0.00 DDOMEST
Curtis Sand and Gravel Lang Station CANYON COUNTRY 4A192030002 6332C 3 C P 8093 5/19/92 0.00 0.00 DWSHWTR
Curtis Sand and Gravel 12101 Soledad Cyn Rd, Coper SAUGUS 4A192438001 2016C 3 C P 1958 5/19/92 0.00 0.19 DDREDGS
Exxon Co., U.S.A. Castaic Junction Field LOS ANGELES 4A192181008 1921C 3 C P 1921 2/2/73 0.00 0.00 DDRIBRI
Fm H Partnerships L.P. E Z Burger ACTON 4A191145001 7040 3 C 91-055 4/18/06 0.00 0.00 DDOMEST
Foodmaker Inc. Jack In The Box # 3304 ACTON 4A567000004 8311 3 C 01-031 2/22/06 0.00 0.00 DDOMEST
Freeway Chevron-Mr. Zsmat Freeway Chevron-Mr. Zsmat NEWHALL 4A191015003 6345C 3 C P 8085 5/19/92 0.00 0.00 DWSHWTR
Gate King Properties Inc Needham #1, Newhall Of NEWHALL 4A192148001 6606C 3 C P 8397 11/19/96 0.00 0.00 DDRIBRI
Goodyear Tire Goodyear Tire NEWHALL 4A192344002 6400C 3 C P 8055 1/19/93 0.00 0.00 DWSHWTR
Grace Petroleum Corp Placerita Oil Field NEWHALL 4A192118001 6514C 3 C P 8264 3/21/95 0.00 0.13 DDRIBRI
HR Textron Inc. Valencia Facility SANTA CLARITA 4A192332004 8029 3 C 99-055 6/30/04 0.01 0.00 NCNWTRS
ISCO Machinery ISCO Machinery ACTON 4A197000007 8367 3 C 01-031 2/22/06
Jay Rabadi Jay's Shell CASTAIC 4A191029001 6349C 3 C P 4752 5/19/92 0.00 0.00 DWSHWTR
JMT Oil Co Placerita Oil Field NEWHALL 4A192025002 6124C 3 C P 1728 1/23/90 0.00 0.00 DDRIBRI
LA Co Fire Dept Fire Camp #11, Acton ACTON 4A190107079 5710 3 C 93-039 6/10/08 0.02 0.01 DDOMEST
LA Co Probation Dept Joe Scott Boys Camp,Saugus Cop SAUGUS 4A190107058 2157C 3 C P 2026 12/14/73 0.00 0.00 DMISCEL
LA Co Probation Dept Mendenhall-Munz,Co-Per 3433 LOS ANGELES 4A190107077 4756C 3 C P 3433 11/15/79 0.00 0.00 DFILBRI
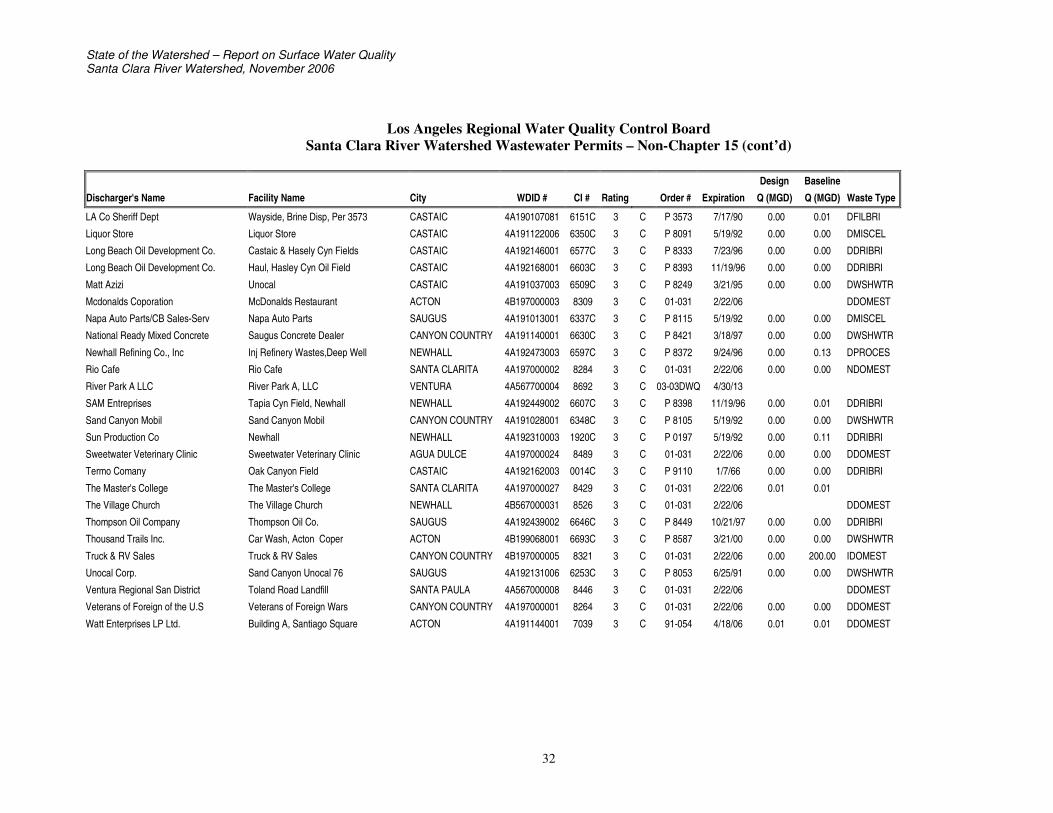
State of the Watershed – Report on Surface Water QualitySanta Clara River Watershed, November 2006
32
Los Angeles Regional Water Quality Control BoardSanta Clara River Watershed Wastewater Permits – Non-Chapter 15 (cont’d)
Design BaselineDischarger's Name Facility Name City WDID # CI # Rating Order # Expiration Q (MGD) Q (MGD) Waste Type
LA Co Sheriff Dept Wayside, Brine Disp, Per 3573 CASTAIC 4A190107081 6151C 3 C P 3573 7/17/90 0.00 0.01 DFILBRI
Liquor Store Liquor Store CASTAIC 4A191122006 6350C 3 C P 8091 5/19/92 0.00 0.00 DMISCEL
Long Beach Oil Development Co. Castaic & Hasely Cyn Fields CASTAIC 4A192146001 6577C 3 C P 8333 7/23/96 0.00 0.00 DDRIBRI
Long Beach Oil Development Co. Haul, Hasley Cyn Oil Field CASTAIC 4A192168001 6603C 3 C P 8393 11/19/96 0.00 0.00 DDRIBRI
Matt Azizi Unocal CASTAIC 4A191037003 6509C 3 C P 8249 3/21/95 0.00 0.00 DWSHWTR
Mcdonalds Coporation McDonalds Restaurant ACTON 4B197000003 8309 3 C 01-031 2/22/06 DDOMEST
Napa Auto Parts/CB Sales-Serv Napa Auto Parts SAUGUS 4A191013001 6337C 3 C P 8115 5/19/92 0.00 0.00 DMISCEL
National Ready Mixed Concrete Saugus Concrete Dealer CANYON COUNTRY 4A191140001 6630C 3 C P 8421 3/18/97 0.00 0.00 DWSHWTR
Newhall Refining Co., Inc Inj Refinery Wastes,Deep Well NEWHALL 4A192473003 6597C 3 C P 8372 9/24/96 0.00 0.13 DPROCES
Rio Cafe Rio Cafe SANTA CLARITA 4A197000002 8284 3 C 01-031 2/22/06 0.00 0.00 NDOMEST
River Park A LLC River Park A, LLC VENTURA 4A567700004 8692 3 C 03-03DWQ 4/30/13
SAM Entreprises Tapia Cyn Field, Newhall NEWHALL 4A192449002 6607C 3 C P 8398 11/19/96 0.00 0.01 DDRIBRI
Sand Canyon Mobil Sand Canyon Mobil CANYON COUNTRY 4A191028001 6348C 3 C P 8105 5/19/92 0.00 0.00 DWSHWTR
Sun Production Co Newhall NEWHALL 4A192310003 1920C 3 C P 0197 5/19/92 0.00 0.11 DDRIBRI
Sweetwater Veterinary Clinic Sweetwater Veterinary Clinic AGUA DULCE 4A197000024 8489 3 C 01-031 2/22/06 0.00 0.00 DDOMEST
Termo Comany Oak Canyon Field CASTAIC 4A192162003 0014C 3 C P 9110 1/7/66 0.00 0.00 DDRIBRI
The Master's College The Master's College SANTA CLARITA 4A197000027 8429 3 C 01-031 2/22/06 0.01 0.01
The Village Church The Village Church NEWHALL 4B567000031 8526 3 C 01-031 2/22/06 DDOMEST
Thompson Oil Company Thompson Oil Co. SAUGUS 4A192439002 6646C 3 C P 8449 10/21/97 0.00 0.00 DDRIBRI
Thousand Trails Inc. Car Wash, Acton Coper ACTON 4B199068001 6693C 3 C P 8587 3/21/00 0.00 0.00 DWSHWTR
Truck & RV Sales Truck & RV Sales CANYON COUNTRY 4B197000005 8321 3 C 01-031 2/22/06 0.00 200.00 IDOMEST
Unocal Corp. Sand Canyon Unocal 76 SAUGUS 4A192131006 6253C 3 C P 8053 6/25/91 0.00 0.00 DWSHWTR
Ventura Regional San District Toland Road Landfill SANTA PAULA 4A567000008 8446 3 C 01-031 2/22/06 DDOMEST
Veterans of Foreign of the U.S Veterans of Foreign Wars CANYON COUNTRY 4A197000001 8264 3 C 01-031 2/22/06 0.00 0.00 DDOMEST
Watt Enterprises LP Ltd. Building A, Santiago Square ACTON 4A191144001 7039 3 C 91-054 4/18/06 0.01 0.01 DDOMEST
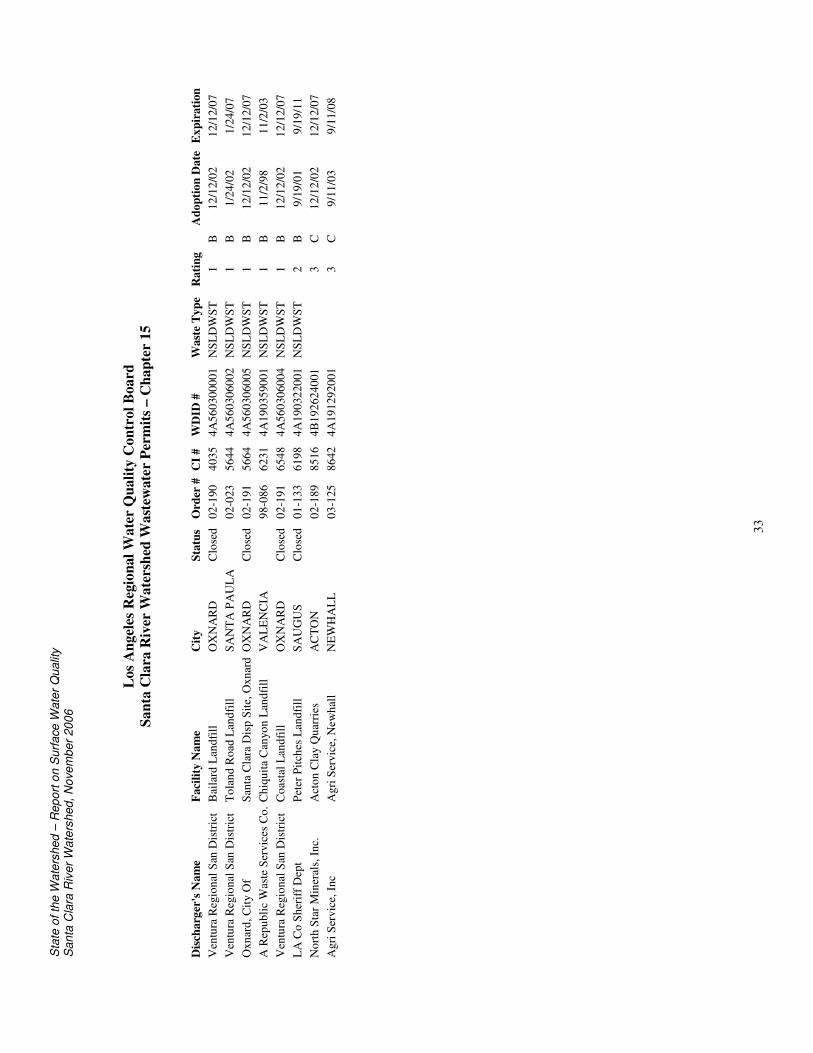
Sta
te o
f the
Wat
ersh
ed –
Rep
ort o
n S
urfa
ce W
ater
Qua
lity
San
ta C
lara
Riv
er W
ater
shed
, Nov
embe
r 200
6
33
Los
Ang
eles
Reg
iona
l Wat
er Q
ualit
y C
ontr
ol B
oard
Sant
a C
lara
Riv
er W
ater
shed
Was
tew
ater
Per
mits
– C
hapt
er 1
5
Dis
char
ger'
s Nam
eFa
cilit
y N
ame
City
Stat
usO
rder
#C
I #W
DID
#W
aste
Typ
eR
atin
gA
dopt
ion
Dat
eE
xpir
atio
nV
entu
ra R
egio
nal S
an D
istr
ict
Bai
lard
Lan
dfill
OX
NA
RD
Clo
sed
02-1
9040
354A
5603
0000
1N
SLD
WST
1B
12/1
2/02
12/1
2/07
Ven
tura
Reg
iona
l San
Dis
tric
tTo
land
Roa
d La
ndfil
lSA
NT
A P
AU
LA
02-0
2356
444A
5603
0600
2N
SLD
WST
1B
1/24
/02
1/24
/07
Oxn
ard,
City
Of
Sant
a C
lara
Dis
p Si
te, O
xnar
dO
XN
AR
DC
lose
d02
-191
5664
4A56
0306
005
NSL
DW
ST1
B12
/12/
0212
/12/
07A
Rep
ublic
Was
te S
ervi
ces
Co.
Chi
quita
Can
yon
Land
fill
VA
LEN
CIA
98-0
8662
314A
1903
5900
1N
SLD
WST
1B
11/2
/98
11/2
/03
Ven
tura
Reg
iona
l San
Dis
tric
tC
oast
al L
andf
illO
XN
AR
DC
lose
d02
-191
6548
4A56
0306
004
NSL
DW
ST1
B12
/12/
0212
/12/
07L
A C
o Sh
eriff
Dep
tPe
ter P
itche
s La
ndfil
lSA
UG
US
Clo
sed
01-1
3361
984A
1903
2200
1N
SLD
WST
2B
9/19
/01
9/19
/11
Nor
th S
tar M
iner
als,
Inc.
Act
on C
lay
Qua
rrie
sA
CTO
N02
-189
8516
4B19
2624
001
3C
12/1
2/02
12/1
2/07
Agr
i Ser
vice
, Inc
Agr
i Ser
vice
, New
hall
NE
WH
AL
L03
-125
8642
4A19
1292
001
3C
9/11
/03
9/11
/08
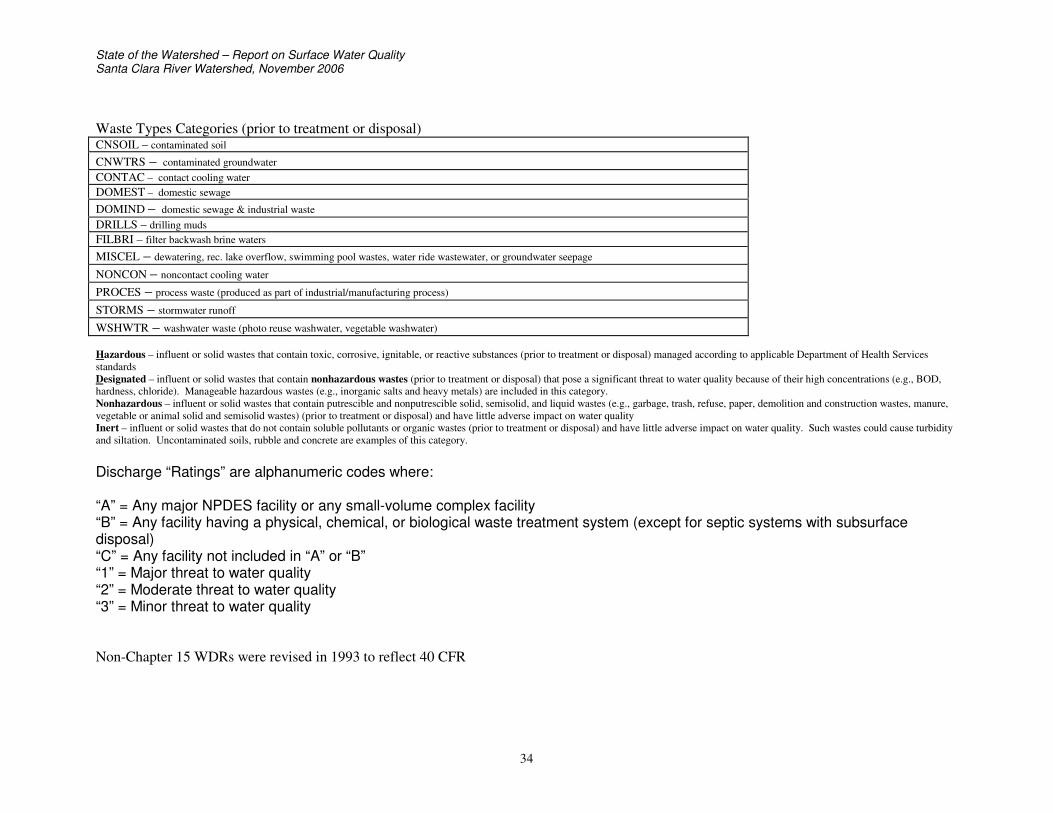
State of the Watershed – Report on Surface Water QualitySanta Clara River Watershed, November 2006
34
Waste Types Categories (prior to treatment or disposal)CNSOIL – contaminated soil
CNWTRS – contaminated groundwaterCONTAC – contact cooling waterDOMEST – domestic sewage
DOMIND – domestic sewage & industrial wasteDRILLS – drilling mudsFILBRI – filter backwash brine waters
MISCEL – dewatering, rec. lake overflow, swimming pool wastes, water ride wastewater, or groundwater seepage
NONCON – noncontact cooling water
PROCES – process waste (produced as part of industrial/manufacturing process)
STORMS – stormwater runoff
WSHWTR – washwater waste (photo reuse washwater, vegetable washwater)
Hazardous – influent or solid wastes that contain toxic, corrosive, ignitable, or reactive substances (prior to treatment or disposal) managed according to applicable Department of Health ServicesstandardsDesignated – influent or solid wastes that contain nonhazardous wastes (prior to treatment or disposal) that pose a significant threat to water quality because of their high concentrations (e.g., BOD,hardness, chloride). Manageable hazardous wastes (e.g., inorganic salts and heavy metals) are included in this category.Nonhazardous – influent or solid wastes that contain putrescible and nonputrescible solid, semisolid, and liquid wastes (e.g., garbage, trash, refuse, paper, demolition and construction wastes, manure,vegetable or animal solid and semisolid wastes) (prior to treatment or disposal) and have little adverse impact on water qualityInert – influent or solid wastes that do not contain soluble pollutants or organic wastes (prior to treatment or disposal) and have little adverse impact on water quality. Such wastes could cause turbidityand siltation. Uncontaminated soils, rubble and concrete are examples of this category.
Discharge “Ratings” are alphanumeric codes where:
“A” = Any major NPDES facility or any small-volume complex facility“B” = Any facility having a physical, chemical, or biological waste treatment system (except for septic systems with subsurfacedisposal)“C” = Any facility not included in “A” or “B”“1” = Major threat to water quality“2” = Moderate threat to water quality“3” = Minor threat to water quality
Non-Chapter 15 WDRs were revised in 1993 to reflect 40 CFR
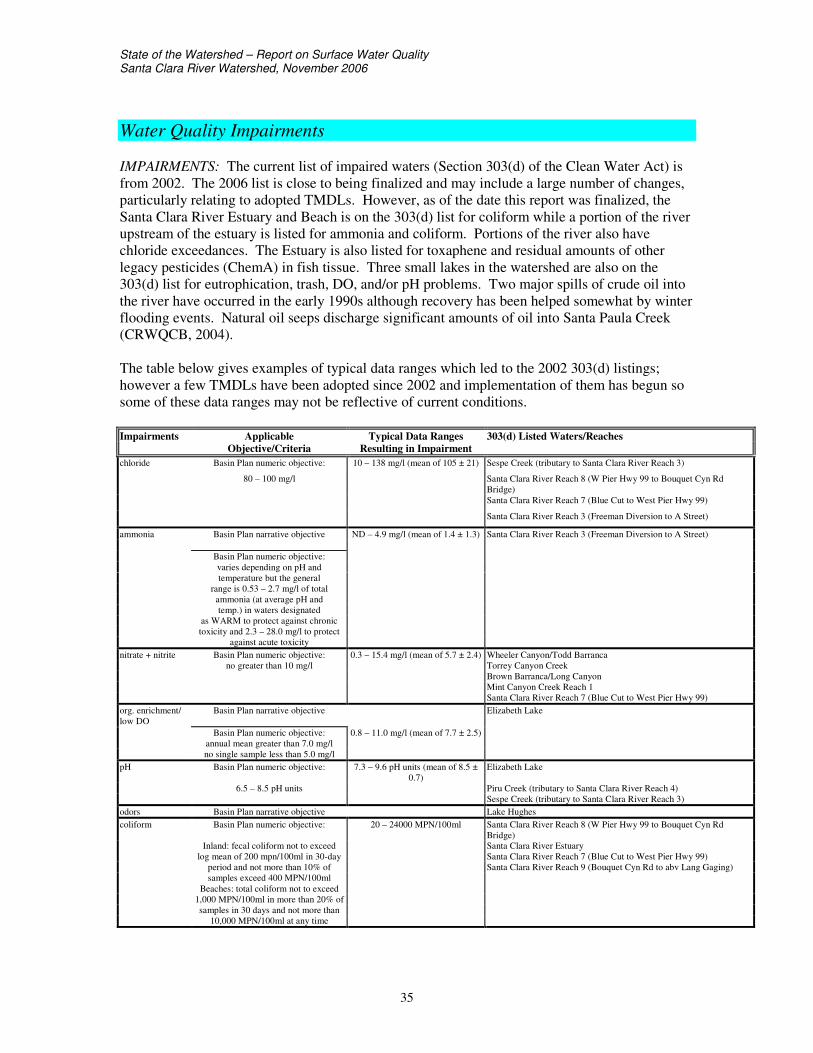
State of the Watershed – Report on Surface Water QualitySanta Clara River Watershed, November 2006
35
Water Quality Impairments
IMPAIRMENTS: The current list of impaired waters (Section 303(d) of the Clean Water Act) isfrom 2002. The 2006 list is close to being finalized and may include a large number of changes,particularly relating to adopted TMDLs. However, as of the date this report was finalized, theSanta Clara River Estuary and Beach is on the 303(d) list for coliform while a portion of the riverupstream of the estuary is listed for ammonia and coliform. Portions of the river also havechloride exceedances. The Estuary is also listed for toxaphene and residual amounts of otherlegacy pesticides (ChemA) in fish tissue. Three small lakes in the watershed are also on the303(d) list for eutrophication, trash, DO, and/or pH problems. Two major spills of crude oil intothe river have occurred in the early 1990s although recovery has been helped somewhat by winterflooding events. Natural oil seeps discharge significant amounts of oil into Santa Paula Creek(CRWQCB, 2004).
The table below gives examples of typical data ranges which led to the 2002 303(d) listings;however a few TMDLs have been adopted since 2002 and implementation of them has begun sosome of these data ranges may not be reflective of current conditions.
Impairments Applicable Typical Data Ranges 303(d) Listed Waters/ReachesObjective/Criteria Resulting in Impairment
chloride Basin Plan numeric objective: 10 – 138 mg/l (mean of 105 ± 21) Sespe Creek (tributary to Santa Clara River Reach 3)
80 – 100 mg/l Santa Clara River Reach 8 (W Pier Hwy 99 to Bouquet Cyn RdBridge)Santa Clara River Reach 7 (Blue Cut to West Pier Hwy 99)
Santa Clara River Reach 3 (Freeman Diversion to A Street)
ammonia Basin Plan narrative objective ND – 4.9 mg/l (mean of 1.4 ± 1.3) Santa Clara River Reach 3 (Freeman Diversion to A Street)
Basin Plan numeric objective:varies depending on pH andtemperature but the general
range is 0.53 – 2.7 mg/l of totalammonia (at average pH andtemp.) in waters designated
as WARM to protect against chronictoxicity and 2.3 – 28.0 mg/l to protect
against acute toxicitynitrate + nitrite Basin Plan numeric objective: 0.3 – 15.4 mg/l (mean of 5.7 ± 2.4) Wheeler Canyon/Todd Barranca
no greater than 10 mg/l Torrey Canyon CreekBrown Barranca/Long CanyonMint Canyon Creek Reach 1Santa Clara River Reach 7 (Blue Cut to West Pier Hwy 99)
org. enrichment/low DO
Basin Plan narrative objective Elizabeth Lake
Basin Plan numeric objective: 0.8 – 11.0 mg/l (mean of 7.7 ± 2.5)annual mean greater than 7.0 mg/lno single sample less than 5.0 mg/l
pH Basin Plan numeric objective: 7.3 – 9.6 pH units (mean of 8.5 ±0.7)
Elizabeth Lake
6.5 – 8.5 pH units Piru Creek (tributary to Santa Clara River Reach 4)Sespe Creek (tributary to Santa Clara River Reach 3)
odors Basin Plan narrative objective Lake Hughescoliform Basin Plan numeric objective: 20 – 24000 MPN/100ml Santa Clara River Reach 8 (W Pier Hwy 99 to Bouquet Cyn Rd
Bridge)Inland: fecal coliform not to exceed Santa Clara River Estuary
log mean of 200 mpn/100ml in 30-day Santa Clara River Reach 7 (Blue Cut to West Pier Hwy 99)period and not more than 10% of Santa Clara River Reach 9 (Bouquet Cyn Rd to abv Lang Gaging)samples exceed 400 MPN/100ml
Beaches: total coliform not to exceed1,000 MPN/100ml in more than 20% ofsamples in 30 days and not more than
10,000 MPN/100ml at any time
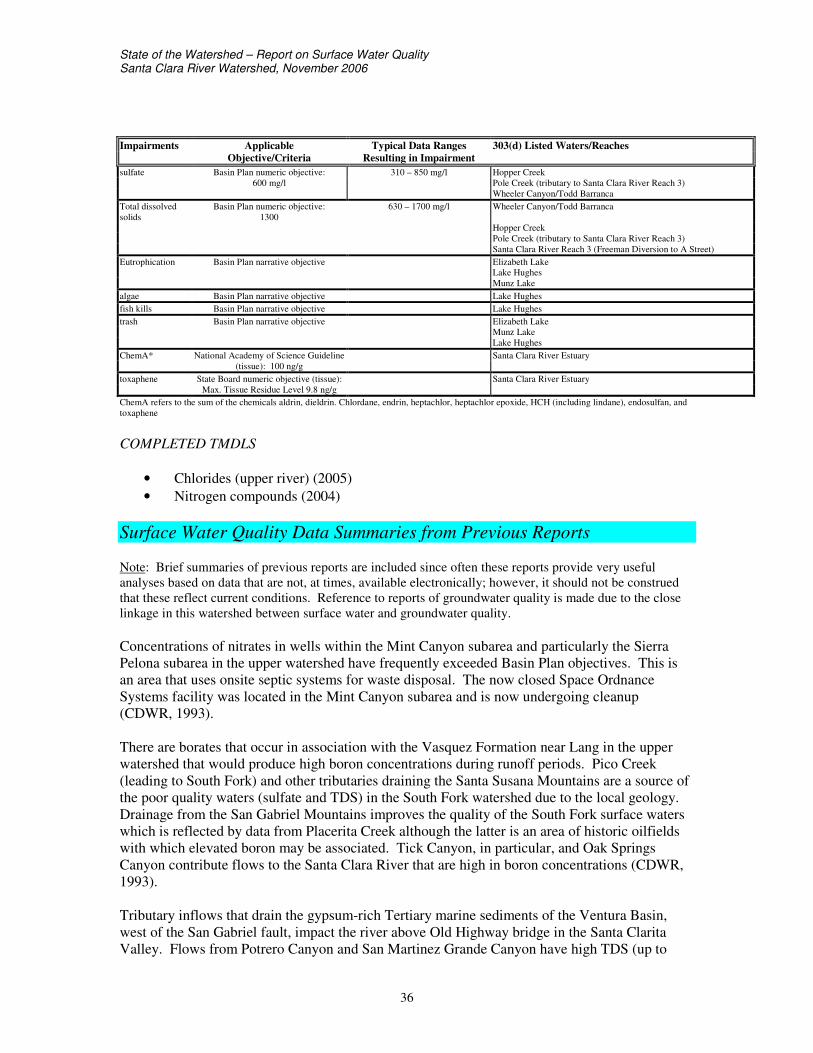
State of the Watershed – Report on Surface Water QualitySanta Clara River Watershed, November 2006
36
Impairments Applicable Typical Data Ranges 303(d) Listed Waters/ReachesObjective/Criteria Resulting in Impairment
sulfate Basin Plan numeric objective: 310 – 850 mg/l Hopper Creek600 mg/l Pole Creek (tributary to Santa Clara River Reach 3)
Wheeler Canyon/Todd BarrancaTotal dissolvedsolids
Basin Plan numeric objective:1300
630 – 1700 mg/l Wheeler Canyon/Todd Barranca
Hopper CreekPole Creek (tributary to Santa Clara River Reach 3)Santa Clara River Reach 3 (Freeman Diversion to A Street)
Eutrophication Basin Plan narrative objective Elizabeth LakeLake HughesMunz Lake
algae Basin Plan narrative objective Lake Hughesfish kills Basin Plan narrative objective Lake Hughestrash Basin Plan narrative objective Elizabeth Lake
Munz LakeLake Hughes
ChemA* National Academy of Science Guideline Santa Clara River Estuary(tissue): 100 ng/g
toxaphene State Board numeric objective (tissue): Santa Clara River EstuaryMax. Tissue Residue Level 9.8 ng/g
ChemA refers to the sum of the chemicals aldrin, dieldrin. Chlordane, endrin, heptachlor, heptachlor epoxide, HCH (including lindane), endosulfan, andtoxaphene
COMPLETED TMDLS
• Chlorides (upper river) (2005)• Nitrogen compounds (2004)
Surface Water Quality Data Summaries from Previous Reports
Note: Brief summaries of previous reports are included since often these reports provide very usefulanalyses based on data that are not, at times, available electronically; however, it should not be construedthat these reflect current conditions. Reference to reports of groundwater quality is made due to the closelinkage in this watershed between surface water and groundwater quality.
Concentrations of nitrates in wells within the Mint Canyon subarea and particularly the SierraPelona subarea in the upper watershed have frequently exceeded Basin Plan objectives. This isan area that uses onsite septic systems for waste disposal. The now closed Space OrdnanceSystems facility was located in the Mint Canyon subarea and is now undergoing cleanup(CDWR, 1993).
There are borates that occur in association with the Vasquez Formation near Lang in the upperwatershed that would produce high boron concentrations during runoff periods. Pico Creek(leading to South Fork) and other tributaries draining the Santa Susana Mountains are a source ofthe poor quality waters (sulfate and TDS) in the South Fork watershed due to the local geology.Drainage from the San Gabriel Mountains improves the quality of the South Fork surface waterswhich is reflected by data from Placerita Creek although the latter is an area of historic oilfieldswith which elevated boron may be associated. Tick Canyon, in particular, and Oak SpringsCanyon contribute flows to the Santa Clara River that are high in boron concentrations (CDWR,1993).
Tributary inflows that drain the gypsum-rich Tertiary marine sediments of the Ventura Basin,west of the San Gabriel fault, impact the river above Old Highway bridge in the Santa ClaritaValley. Flows from Potrero Canyon and San Martinez Grande Canyon have high TDS (up to
State of the Watershed – Report on Surface Water QualitySanta Clara River Watershed, November 2006
37
10,000 mg/l) and sulfate (up to 6,000 mg/l) and sodium, fluoride, and boron concentrations arealso high (CDWR, 1993). Author’s note: However, volumes of these inflows are likely relativelylow since sampling results for many decades at the Old Highway Bridge do not reveal high oreven greatly variable concentrations of salts (see later discussion on results at long-termstations).
Elizabeth and Hugh Lakes are essentially closed basin lakes subject to seasonal variations inrunoff; they may dry up during droughts and their quality may be very saline at times (CDWR,1993).
Castaic Lake and Lagoon has thermal stratification and biochemical process that stronglyinfluence the water chemistry. Castaic receives State Water Project water and is sodium chloridein chemical character. Bouquet and Dry Canyon Reservoirs both receive imported waters fromthe Los Angeles Aqueduct (Mono-Owens water). Dry Canyon is operated as a flow-throughreservoir and local sources are insignificant. Bouquet has ranged from sodium-calciumbicarbonate to sodium bicarbonate in character (CDWR, 1993).
Generally, the chemical character of Piru Creek waters has been calcium-magnesium sulfate. Asin the Santa Clara River, with some low flows, the predominant cation becomes sodium andcalcium become secondary. The high boron concentrations in the Piru Creek watershed arethought to be mainly from colemanite (a calcium borate mineral) deposits in Lockwood Valleyand from Agua Blanca Creek. The boron in Agua Blanca Creek may come from the Agua Blancathrust fault. The high sulfate concentrations are the result of the solution of sulfate mineralsfound in the sedimentary rocks that form the subarea (CDWR, 1989).
Further downstream near Gold Hill Road (Upper Piru HSA), concentrations of boron and sulfatecontinue to increase. Below Lake Piru, surface water quality within Piru Creek is affected by bothreleases from the dam and local runoff. Historically, concentrations of TDS ranged from 548 to1,610 mg/l); sulfate ranged from 211 to 924 mg/l, and boron ranged from 0.24 to 1.07 mg/l.These values represent an improvement in water quality as a result of inflows of the SWP flowsinto Lake Piru. However, the concentrations of sulfate, boron, and TDS sometimes exceed statewater quality criteria for beneficial uses. The high sulfate concentrations are attributed to theminerals found in the sedimentary rocks of the subwatershed. Minor tributaries within thesubwatershed that flow only during and after rains contribute additional calcium sulfate waters(SCWRP website).
The chemical character of Sespe Creek is typically calcium-magnesium-sodium sulfate tocalcium-sodium-magnesium sulfate. A distinctive feature of the Sespe HA is the Sespe Formationwhich contain petroleum resources. The source of boron in Sespe Creek appears to be, in part,inflows from Hot Springs Creek in the Topatopa HSA. The past practice of direct discharge ofoilfield brines to Sespe and Tar Creeks may also be a continuing source of boron and chloride.There is poor water quality in Little Sespe Creek which flows in an area of oilfields (CDWR,1989). Overall, surface water quality is usually of good quality and provides significant increasesto the Santa Clara River flows and recharge to the basin's groundwater (SCWRP website).Author’s note: In fact, review of data from a long-term sampling site on the lower Sespe Creek(see later discussion on long-term stations) shows considerable variability in boron and chlorideconcentrations over the decades-long dataset.
State of the Watershed – Report on Surface Water QualitySanta Clara River Watershed, November 2006
38
Nitrate is absent or occurs in very low concentrations in the undeveloped drainages north of theSanta Clara River. At the Freeman Diversion, nitrate concentrations are consistently low, with arange of 1-11 mg/l (as NO3) measured during 2000. Unlike a number of other constituents, nitrateconcentration correlates poorly with the rate of flow in the river. Elevated nitrate concentrationsare observed at a number of surface-water sampling sites downstream of developed areas withinthe watershed. Samples ranged from 9-35 mg/l nitrate at Blue Cut near the Los Angeles Countyline. During dry periods, effluent from the Saugus and Valencia WRPs are two consistentsources of surface flow in the Santa Clara River east of the County line. Author’s note: In 2003,nitrification/denitrification requirements were implemented at the Saugus and Valencia WRPswhich have reduced nitrogen concentrations in the effluent and receiving water. Elevated nitrateconcentrations were again documented in Todd Barranca, which converges with the Santa ClaraRiver just downstream of the Freeman Diversion. Mixed land uses exist in the Todd Barranca/Wheeler Canyon watershed, including citrus orchards, cattle and horses, and residences withseptic tanks (UWCD, 2001).
As with nitrate, chloride concentrations tend to be relatively low in undeveloped portions of thewatershed and elevated in other places due to human activities. Water reclamation plants areperhaps the best-documented source of chloride in the area. Water softeners, which are commonto the area, elevate chloride concentrations considerably, loading approximately 6 to 20 pounds ofsalt per unit per week to wastewater. The County Sanitation Districts of Los Angeles Countyoperate the Saugus and Valencia WRPs in Los Angeles County. The water supply in this area is ablend of local water and State Water Project supplies. The chloride concentration of water fromthe State Water Project is commonly higher than in local groundwater basins, and after beneficialuse and treatment, the effluent discharged to the river may be considerably higher in chloride thanlocal waters. Average chloride concentrations of effluent from the Saugus and Valencia WRPsduring the 2000 water year were 148 and 170 mg/l, respectively. Chloride concentrations rangingfrom 80 to 137 mg/l were observed at Blue Cut during the water year 2000. Author’s note:Average chloride concentrations in the effluent from the Saugus and Valencia WRPs during the2005 water year were 135 and 154 mg/l, respectively. Lower chloride concentrations have beenobserved at Blue Cut in recent years. High chloride concentrations were observed downstream ofthe Santa Paula WRP during low flows of the Santa Clara River. Santa Paula uses localgroundwater for its water supply, but water softeners in private homes are believed to be asignificant source of the chloride arriving at the City’s water reclamation plant. The averageconcentration of chloride in the city’s effluent was 154 mg/l, and concentrations ranging from 30to 122 mg/l were observed during the 2000 water year a short distance downstream of the plant’spoint of discharge (UWCD, 2001).
TDS is a measure of the total mineral content of a unit of water, and is commonly used to providea general indication of the quality of water. There is often a strong correlation between TDS andsulfate concentrations. Sulfate is often the dominant anion in local waters due in part to theprevalence of marine sediments within the watershed. In general, up to half the TDS of localwaters is from sulfate ions. Elevated TDS was observed in several of the smaller drainages thatare monitored during water year 2000, such as Hopper Creek, Pole Creek and Todd Barranca.The relative TDS contribution from natural sources versus the influence of agriculture and otherpractices in these small watersheds is undetermined. Water flowing from the larger drainages ofPiru, Sespe and Santa Paula Creeks have relatively low TDS concentrations (UWCD, 2001).Author’s note: TDS concentrations in Santa Paula Creek are at times a problem – see laterdiscussion of dataset reviewed for this report. Factors that may contribute to the lower waterquality at times in Santa Paula Creek include high amounts of suspended clays, presence of
State of the Watershed – Report on Surface Water QualitySanta Clara River Watershed, November 2006
39
natural oil and sulphur seeps (Sulphur Springs HSA), and high biological oxygen demandbelieved to originate from anthropogenic sources (septic system leacheate and recreational uses atSteckel Park) (SCWRP website). A summer 2000 sample from Santa Paula Creek was collectedunder low-flow conditions, and recorded a TDS value (1520 mg/l) higher than previouslydocumented in this water body. Total mineral content of surface water generally increases aswater flows down the Santa Clara River. However, the hydrology of the Santa Clara River iscomplex which complicates surface water quality analysis. Surface water recharges the upstreamportions of the groundwater basins of the Santa Clara River Valley, and older, more-mineralizedrising groundwater commonly discharges to the river near the downstream boundaries of thebasins (UWCD, 2001).
Mud Creek introduces a significant amount of suspended solids to Santa Paula Creek. Flowthrough the porous, sedimentary rock substrate characteristic of Mud Creek results in year-roundturbidity within Santa Paula Creek downstream of the confluence with Mud Creek. Land is alsoin agricultural use within the lower subwatershed (SCWRP website).
Thirty sites sampled under the State’s Surface Water Ambient Monitoring Program (SWAMP),were randomly selected to provide a broad baseline of the overall health of the watershed.Additionally, to evaluate the condition of specific tributaries, directed sampling was conducted atthe base of each tributary above its confluence with the mainstem of the river. A total of 38 siteswere sampled, comprised of 30 randomly selected sites and 8 directed sites. Sampling began in2001 with a second round in 2003. Some sites were sampled multiple times. The 30 random siteswere sampled for field measurements (DO, pH, depth, temperature, velocity, conductivity, andturbidity), conventional water chemistry: nutrients (ammonia, chlorophyll a, nitrate, nitrite, andphosphate), salts (sulfate, chloride, TDS, and boron), as well as, toxicity, and bioassessment. Thedirected sites were sampled for the previous parameters as well as trace organics,bioaccumulation, water column and sediment metals, sediment grain size, and enzyme-linkedimmunosorbent assays (ELISAs) for chlorpyrifos and diazinon. One of the directed sites, BouquetCanyon Creek, was sampled bi-weekly from August 2002 through August 2003 for chlorpyrifosand diazinon using ELISA (Kamer, 2005).
Concerns with conventional water quality parameters were seen at some sites. DO saturation was<90% at 15 of 38 sites, which were distributed throughout the watershed. pH was high at foursites. Inorganic N concentrations exceeded Basin Plan objectives at 7 sites, total and un-ionizedNH3-N at 3 sites, total NH3-N at one site, un-ionized NH3-N at one site, and NO3-N at two sites.Four of the 5 sites where NH3-N exceeded Basin Plan objectives were clustered along themainstem of the river; NO3-N concentrations exceeded 1 mg/l in the same area. Author’s note:as mentioned previously, the Saugus and Valencia WRPs started nitrification/denitrificationtreatment which has resulted in reduced levels of nitrogen within the river at Reaches 5 and 6.PO4-P concentrations exceeded USEPA recommended concentrations at 13 sites. TDSconcentrations exceeded Basin Plan objectives at 12 sites, many of which were in the Santa Paulaand Piru subwatersheds. Sulfate exceeded Basin Plan objectives at 10 of the 12 sites where TDSwas elevated. Chloride was elevated at 7 sites in the eastern half of the watershed and boron waselevated at three sites on Piru Creek (Kamer, 2005).
Metals in sediment, tissue and water were only measured at the tributary sites. However, if metalsare found in these matrices at the bottom of subwatersheds sites at levels exceeding criteria orguidelines, it suggests that metals pollution may occur throughout the subwatershed. Watercolumn aluminum concentrations exceeded USEPA criteria for toxicity to aquatic life at 4 sites
State of the Watershed – Report on Surface Water QualitySanta Clara River Watershed, November 2006
40
but aluminum was not present at elevated levels in sediments or tissues. Tissue samples showedbioaccumulation of arsenic at levels exceeding Office of Environmental Health HazardAssessment (OEHHA) screening values and USFWS guidelines at seven sites, and copper wasalso elevated at one of these sites (in Bouquet Canyon). Sediment metals were elevated abovesediment quality guidelines at three sites: cadmium in Piru Creek, copper and lead in CastaicCreek, and a suite of metals in San Francisquito Canyon. Compared to other samples andsediment quality guidelines, sediment metals were very high in San Francisquito Canyon, whichis downstream of a reservoir treated with metals to control biofouling. Sediment, tissue and watersamples each indicated different metals that may be of concern (Kamer, 2005).
Organic compounds were also only measured at tributary sites. Similar to metals, thepresence of organic compounds in water samples from tributary sites at levels exceedingestablished objectives suggests that organics pollution also occurs throughout the subwatershed.DDT and PCBs exceeded established criteria at all the integrator sites. Chlordane was elevated atthree sites. Chlorpyrifos and diazinon were elevated Bouquet Canyon along with azinphosmethyl, and they were elevated in Castaic Creek along with mirex. Chlorpyrifos was elevated atthe estuary site, and diazinon and PAHs were elevated at Blue Cut. Sediments were analyzed fororganics at only two sites: none were found in Bouquet Canyon, but DDE (p,p’) and DDT (p,p’)were elevated relative to sediment quality guidelines in the estuary. No organics in tissues wereelevated above OEHHA screening values (Kamer, 2005).
Toxicity occurred at thirteen of the randomly-selected sites in the watershed and was primarilylimited to two areas: the mainstem of the river and the northern portion of the Piru Creeksubwatershed. The cause of toxicity at many of these sites is unknown because metals andorganics were not sampled at the random sites. Toxicity was detected in samples from only twosubwatershed sites: Bouquet Canyon and estuary. A number of factors could have contributed totoxicity at Bouquet Canyon but the toxicity identification evaluation (TIE) indicated that diazinonwas the probable cause of toxicity. At the estuary, toxicity may have been caused by DDT, PCBs,chlorpyrifos, or arsenic (Kamer, 2005).
The bioassessment data indicate that ecological condition was at least fair at about half of thesites, with the condition at the other half being poor or very poor. Index of Biological Integrity(IBI) scores were Good at 6 sites, Fair at 13 sites, Poor at 11 sites and Very Poor at 7 sites. Onesite was not sampled for benthic invertebrates. At 41% of sites where IBI scores were low,chronic or acute toxicity was detected, however, toxicity was also detected at 37% of sites withFair and Good IBI scores. Toxicity is not a likely cause of poor benthic community condition atthe subwatershed sites, many of which had Very Poor or Poor IBI scores, because samples fromonly two of these 8 sites indicated toxicity. Other influences on benthic community structurethroughout much of the watershed are unknown because metals and organics were not sampled atthe random sites. It is also unlikely that decreased DO availability contributed to poor benthiccommunity structure because 6 of the randomly selected sites with DO < 90 % saturation had fairor good IBI scores (Kamer, 2005). Author’s note: Some of the bioassessment sampling occurredsoon after major winter storms which likely had some impact on the results. Additionally, someresearchers have found a link between poor benthic community condition and invasive plantssuch as Arundo and Tamarisk which are found in abundance within the mainstem of the river.
Los Angeles County sampled the benthic community in November 2003 in the unlined portion ofthe Santa Clara River at The Old Road as part of their stormwater monitoring program. The IBI
State of the Watershed – Report on Surface Water QualitySanta Clara River Watershed, November 2006
41
score for the site rated it as a poor site which is the same result found at the nearest SWAMPstation sampled both in spring of 2001 and 2003 (BonTerra Consulting, 2004).
Discussion of Combined Surface Water Quality Dataset
Note: This discussion is based on all readily available electronic data that could be acquired with areasonable amount of effort and that included locational information, preferably latitude and longitude,rather than simply descriptive station names. In some cases it includes datasets upon which some of theabove report summaries were based, but in most cases the data are not necessarily associated with formalreports. As is discussed further below, some datasets go back to the 1920s for a few constituents at a fewsites (mostly collected by water districts) while others are sporadic over a shorter period of time. Some ofthe more consistent and widespread data were collected by the California Department of Water Resourcesbut, presumably due to budget cuts, these data end at most sites in the late 1980s/early 1990s. TheRegional Board also had an extensive network of sampling locations in this watershed maintained into theearly 1990s when budget shortfalls resulted in similar reductions in sampling (eventually replaced by theSurface Water Ambient Monitoring Program which rotates between watersheds on a five-year cycle).Water districts and sanitation agencies have maintained focused sampling in their areas’ of interest formany years. This data collection effort co-occurred with that being conducted for development of theSanta Clara River Comprehensive Monitoring Plan. The two efforts resulted in databases that are similarbut not the same; however, since each effort was undertaken with different products as a desired end-point,the efforts should be viewed as complementary and additive.
Graph scales were set to display ranges of concentrations in a similar manner among graphs displaying thesame constituent (generally ranging around concentrations of interest such as water quality objectives)within a particular Reach or at a long-term sampling station. Since some graphs are based on dataexhibiting extreme variability, this has resulted in occasional excursions of graph lines outside of the mainbody of the graph. Not all of the graphs created are referenced in this report; they are, however, in theExcel data files which are available. All nitrate as NO3 data were converted to nitrate as N data using amultiplier of 0.226.
General Discussion
It is clear that the mainstem of the Santa Clara River has lower quality water than most of itslarge tributaries. For many constituents, concentrations increase from the top to the bottom of themainstem. Figure 6 shows the trend with sulfate as an example. The reverse is occurring,however with chloride and nitrate (Figures 7 And 8). Additionally, almost all of the SWAMPbioassessment sites in the mainstem exhibited poor quality benthic invertebrate communities (lowIndex of Biological Integrity (IBI) scores) while tributary sites were generally marginal or goodwith a few exceptions (Figure 9). However, some of the SWAMP sampling took place after amajor storm event and the benthic invertebrate communities may not have had a chance torecover, particularly in the mainstem which carries very large flows during storms. Limitedsampling has taken place in Todd Barranca, a smaller tributary, but what little data there areindicates potentially serious water quality problems (see Figure 6).
As mentioned previously, the groundwater component in the river can be quite large whichresults in a major presence of sulfate in surface waters in areas of rising groundwater; these occurabove Santa Paula Creek (Reach 9) and near Todd Barranca (Reach 2, downstream of FreemanDiversion) and may help explain the high TDS values and correspondingly high sulfate numbersin these areas, at times exceeding Basin Plan objectives (Figure 10).
State of the Watershed – Report on Surface Water QualitySanta Clara River Watershed, November 2006
42
Despite their comparatively good overall water quality, there are elevated levels of salts in somelarge tributaries which may be in some cases from natural sources or in others may be remnantdischarges of brine from abandoned oilfields. Chlorides are elevated in Sespe (Reach 10), forexample, and Sespe Creek is 303(d)-listed as impaired for chloride (Figure 11).
The SWAMP sampling found water column toxicity at sites sampled in the mainstem of the riverduring 2001 and 2003, the northern portion of the Piru Creek subwatershed, Bouquet Canyon,and in the estuary. Toxicity identification evaluations found that diazinon was the probablecause of toxicity in Bouquet Canyon while toxicity in the estuary may have been caused by DDT,PCBs, chlorpyrifos, or arsenic. DDT and PCBs would have been used historically in thewatershed but they are very persistent chemicals and the estuary will be a site of some depositionafter storms so their presence at that site would not be considered unusual. Diazinon andchlorpyrifos are both water-soluble pesticides used for ant/termite control around residential andagricultural areas; as of the end of 2004, diazinon can no longer be sold for residential use. Bothaluminum and arsenic may have anthropogenic sources but they are also natural in origin and arefound in the soil.
Although somewhat variable throughout the watershed, pH levels do not appear to be a problem.Supersaturation of oxygen may be occurring at some locations which may cause respiratoryproblems in aquatic organisms. Dissolved oxygen results are highly dependent on the time ofday sampling occurs so results may be quite variable due to the sampling approach. On the otherhand, it is clear that nitrate concentrations in the mainstem are higher than a USEPA guideline forunimpacted streams of 1.0 mg/l (NOAA, 1988) (Figure 12).
Discussion of Dataset by Basin Plan Reach
Mineral objectives are established by Reach and are a reflection of local geologic conditions.Data collected in each Reach since 1990 were evaluated against the objectives utilizing howevermany sample locations happened to be in each Reach. Some Reaches had much less data thanothers (for the most part, no sampling programs collected data with the goal of evaluating waterquality by Reach). Data available over a longer period of time were used to evaluate long-termtrends in Reaches. This, however, is not an official Water Quality Assessment, merely a point ofdiscussion. It should be noted that the Reach designations described here are as they appear inthe Basin Plan; some Reaches may be described differently in the current 303(d) list.
• Reach 2; includes Todd Barranca and mainstem below Freeman Diversion down to Highway101 bridge
o Sulfate (BP objective 600 mg/l)• 1997 to 2000 – all above objective; this Reach is currently listed as impaired
for sulfateo TDS (BP objective 1200 mg/l)
• 1997 to 2000 – all above objective; this Reach is currently listed as impairedfor TDS
o Nitrate (as N) (BP objective 10 mg/l)• 1993 to 2000 – highly variable with some samples over 10 mg/l; this Reach
is currently listed as impaired for nitrate + nitrite
State of the Watershed – Report on Surface Water QualitySanta Clara River Watershed, November 2006
43
• Reach 3; includes the mainstem from above Freeman Diversion to just above Sespe Creek aswell as the lower stretches of Santa Paula and Sespe Creeks
o Chloride (BP objective 100 mg/l)• 1990 to present – underlying trend line is below 100 mg/l but multiple spikes
over 100 mg/l in late 1990s and early 2000s; this Reach is currently listed asimpaired for chloride
• Longer-term – early 1980s below objective then generally an increasingtrend
o Sulfate (BP objective 650 mg/l)• 1990 to present – highly variable but mostly below objective; exceedances
mostly in summer; this Reach is currently listed as impaired for sulfateo TDS (BP objective 1300 mg/l)
• 1990 to present – highly variable; many above objective (Figure 13); thisReach is currently listed as impaired for TDS
o Nitrate (as N) (BP objective 5 mg/l)• 1990 to present - some high spikes over 5 mg/l in early 2000s, all in the
lower stretch of Santa Paula Creek (Figure 14)• Longer-term – underlying trend is gradual increase from 1950s to 1970s then
gradual decrease (mostly under 5 mg/l)
• Reach 4; includes the mainstem from just above Sespe Creek to just before the County Lineas well as Hopper Canyon Creek and the lower stretch of Piru Creek
o Chloride (BP objective 100 mg/l)• 1990 to present – some exceedances in early 1990s then low concentrations
until 2004 (Figure 15)• Longer-term - data exist from 1929; high concentrations start in 1950s
o Sulfate (BP objective 600 mg/l)• 1990 to present – highly variable but generally below objective; Hopper Cyn
Creek in this Reach is currently listed as impaired for sulfateo TDS (BP objective 1300 mg/l)
• 1990 to present – variable with a few over the objective; Hopper Cyn Creekin this Reach is currently listed as impaired for TDS
o Nitrate (as N) (BP objective 5 mg/l)• 1990 to present - low concentrations until higher spikes close to 5 mg/l
beginning in 2003 (Figure 16); Torrey Cyn Creek in this Reach is currentlylisted as impaired for nitrate + nitrite
• Longer-term – data exist from 1952; consistently low concentrations (mostlybelow 1 mg/l) throughout until 2003
State of the Watershed – Report on Surface Water QualitySanta Clara River Watershed, November 2006
44
• Reach 5; includes the mainstem from just west of the County Line to the I-5 freeway bridgeas well as the Castaic Creek subwatershed
o Chloride (BP objective 100 mg/l)• 1990 to present – gradual increase from some exceedances to mostly all
exceeding; this Reach is currently listed as impaired for chlorideo Sulfate (BP objective 400 mg/l)
• 1990 to present – variable but generally below objectiveo TDS (BP objective 1000 mg/l)
• 1990 to present – variable with a few over the objectiveo Nitrate (as N) (BP objective 5 mg/l)
• 1990 to present – highly variable with many spikes over 5 mg/l; the morerecent concentrations have been much lower (below 5 mg/l); this Reach iscurrently on the 2002 303(d) list for nitrate + nitrite
• Longer-term – data exist from 1951; highly variable, underlying trend isgradual increase starting in early 1960s until decrease starting in early 2000s;many high spikes in later years of over 5 mg/l
• Reach 6; includes a short section of the mainstem between San Francisquito and BouquetCanyon Creeks as well as those subwatersheds and the South Fork
o Chloride (BP objective 100 mg/l)• 1990 to present – gradual increase over time; now mostly exceedances
(Figure 17); this Reach is on the 2002 303(d) list as impaired for chlorideo Sulfate (BP objective 300 mg/l)
• 1990 to present – mostly below objective; more variable recently (past year)and more exceedances
o TDS (BP objective 1000 mg/l)• 1990 to present – mostly below objective
o Nitrate (as N) (BP objective 10 mg/l)• 1990 to present – all below 10 mg/l• Longer-term – data exist from 1951; gradual increase from 1950s into 1970s
when results became extremely variable, then gradual decrease beginning inearly 1980s; many samples over 10 mg/l in 1970s but below 10 mg/lbeginning in 1990s
• Reach 7; includes the mainstem from Bouquet Canyon Creek to the Lang gauging station aswell as Mint and Pole Canyon Creeks
o Sulfate (BP objective 150 mg/l)• 1997 to present – mainstem sites all exceed the objective while Pole Creek
sites are below objectiveo TDS (BP objective 800 mg/l)
• 1997 to present – mainstem stations mostly over objective while Pole Creekbelow objective
State of the Watershed – Report on Surface Water QualitySanta Clara River Watershed, November 2006
45
• Reach 9; includes the upper stretches of the Santa Paula Creek subwatershedo Chloride (BP objective 45 mg/l)
• 1990 to 1999 – few data, some exceedances• Longer-term – data exist from 1963; a lot of variability with many
exceedanceso TDS (BP objective 600 mg/l)
• 1990 to present – few samples; gradual decreasing trend but most samplesover 600 mg/l (Figure 18)
o Nitrate (as N) (BP objective 5 mg/l)• 1990 – 1999 – low concentrations throughout• Longer-term – data exist from 1963; low concentrations throughout,
generally below 1 mg/l
• Reach 10; includes the upper stretches of the Sespe Creek subwatershedo Chloride (BP objective 60 mg/l)
• 1990 to 2000 – few data, about half exceedances• Longer-term – data exist from 1962; a lot of variability, about half
exceedanceso TDS (BP objective 800 mg/l)
• 2001, 2003 – very few samples, some over 800 mg/lo Nitrate (as N) (BP objective 5 mg/l)
• 1990 to 2000 – very low concentrations throughout (below 1 mg/l) (Figure19)
• Reach 11; includes the Piru Creek subwatershed above Santa Felicia Damo Chloride (BP objective 60 mg/l)
• 1990 to present – few data points; decrease over time, few recentexceedances (Figure 20)
o Sulfate (BP objective 400 mg/l)• 1990 to present – variable and mostly below objective except for some
samples upstream of Pyramid Lakeo TDS (BP objective 800 mg/l)
• 1990 to present – mostly below objective except for some samples at sitesabove Pyramid Lake
o Nitrate (as N) (BP objective 5 mg/l)• 1990 to 2000 – generally low concentrations throughout (below 1 mg/l)
except for a few spikes
Discussion of Historical Trends in Constituents at Long-Term Stations
“Long-term” is generally defined here as a site started in the 1970s (or earlier) and sampled atleast yearly until present day or at least into the late 1990s. Some long-term sites were onlysampled for certain constituents long-term and the frequency may have been quite variable.Some mainstem sites appeared to be popular multi-agency sites due to jurisdictional boundaries,geologic conditions, or easy access (although with little apparent coordination between agencies).Data from these multi-agency sites were grouped together. DWR and UCWD maintained thelongest record of data at a very few long-term sites (some starting as early as the 1920s). Acaveat is that this analysis likely does not include all the electronically available data; in addition,
State of the Watershed – Report on Surface Water QualitySanta Clara River Watershed, November 2006
46
it is possible considerable amounts of older data are only available in paper copy; no attempt wasmade to locate any non-electronic copies of data. There are only about 9-10 stations in thewatershed that can be termed “long-term” as defined above. Many long-term stations are locatedadjacent to water diversions or at reservoir release points and, as might be expected, manyconstituents sampled are related to water supply protection. This positioning of sample sitescould of course skew the results due to a predominance of imported water in these areas. Anumber of these long-term stations are on the mainstem while a few are adjacent to waterfacilities on Piru and one each is on lower Sespe and Santa Paula. Only DWR and the RegionalBoard had sites in the upper parts of the subwatersheds and none of these were long-term orconsistent over time. Looking at long-term stations can be useful for gathering trend information,particularly with regards to salts and nutrients, and possibly establish some historical baselinesbut it is infeasible for comparing against water quality objectives due to the age of the data.However, looking at these results and the pattern of sampling may serve to demonstrate theextremely uncoordinated nature of sampling in this watershed over the years and the opportunityto assemble a more effective dataset in the future as is now being pursued through thedevelopment and implementation of a comprehensive monitoring plan for the watershed..
With regards to nitrates, it’s clear the major tributaries have maintained consistently lowconcentrations over the long-term with little variability; higher concentrations and considerablevariability are common to the mainstem stations. The salts in the watershed, however, have beenmuch more variable both in the tributaries and in the mainstem. This widespread variabilityappeared to decrease beginning in the late 1960s/early 1970s following the prohibition of thesurface discharge of industrial brines and passage of the federal Clean Water Act in 1972.
Nitrate (as N)
• At Old Highway 99 Bridge DWR Site Z2170200o Sampled from 1967 – 1998; monthly, then quarterly, and later semiannuallyo Extremely variable (many high spikes) in mid to late 1970so Much less variable and lower concentrations (below 10 mg/l) after early 1980s;
concentrations drop greatly in late 1990s (Figure 21)
• At County Line DWR Site Z3113500 and UWCD Site 4N17W29SW1 (04N17W29SW1)o Sampled from 1951 – 2005, mostly monthlyo Low concentrations early on then general increasing trend starting in early 1960s
with a decreasing trend beginning around 2002o A few high spikes close to 10 mg/l
• Above Lake Piru DWR Site Z2348000 and UWCD Site 5N18W10SW1 (but below PyramidLake)
o Sampled from 1957 – present, quarterlyo Generally low concentrations (below 1 mg/l) with little variability except for a few
high spikes in summer
• At Lake Piru DWR Site Z2337500 and UWCD Site 4N18W03SW1o Sampled from 1957 – 1998, monthly then quarterlyo Very low concentrations (below 1 mg/l) with little variability
State of the Watershed – Report on Surface Water QualitySanta Clara River Watershed, November 2006
47
• Below Lake Piru DWR Site Z2324000 and UWCD Site 4N18W03SW2o Sampled from 1952 – 2000, monthlyo Low concentrations (generally below 1 mg/l) with little variability
• Sespe Creek at Gage (Fillmore) DWR Site Z2215000 and UWCD Site 4N20W24SW1o Sampled from 1951 – present, monthly to quarterlyo Low concentrations (generally below 1 mg/l) with little variability
• Santa Paula Creek at Gage DWR Site Z2130000o Sampled from 1963 – 1991, monthly or quarterly until early 1970s then infrequentlyo Low concentrations (generally below 1 mg/l) with little variability
• Mainstem at Santa Paula 12th St Bridge DWR Site Z2136010 and UWCD Site3N21W14SW1 (latter site sampled by City of Santa Paula for NPDES permit)
o Sampled from 1951 – present, generally monthlyo Variable with concentrations increasing from the 1950s into the 1970s then
decreasing in the 1990so Mostly 1 – 4 mg/l
• At Freeman Diversion UWCD Site 3N21W32SW1 (03N21W32SW1)o Sampled from 1936 –present; biweekly, monthly, or quarterlyo Data mostly clumped in 1930s, 1960s, and 1990s to presento Concentrations trend somewhat higher over time but generally below 3 mg/l
Boron
• At Old Highway 99 Bridge DWR Site Z2170200o Sampled from 1967 – 2000, quarterly into early 1990s then semiannuallyo Somewhat variable but generally below 1.0 mg/l in recent years
• At County Line DWR Site Z3113500, UWCD Site 4N17W29SW1 (04N17W29SW1), andRegional Board Site 403SC76000
o Sampled from 1951 – 2005, monthly initially then quarterlyo Highly variable up to early 1970s with many samples over 1.0 mg/l, thereafter below
1.0 mg/l
• Below Lake Piru DWR Site Z2324000o Sampled from 1961 – 2000, quarterlyo Quite variable but in later years generally below 1.0 mg/l
• Sespe Creek at Gage (Fillmore) DWR Site Z2215000 and UWCD Site 4N20W24SW1o Sampled from 1951 – 2001, monthly to quarterlyo Very variable (near zero to over 3 mg/l) with no pattern
• Santa Paula Creek near gage DWR Site Z2130000 and UCWD Site 4N21W34SW1o Sampled from 1963 – 2003 (mostly in 1960s), monthly through early 1970s, then
infrequentlyo Less variable in recent years and below 0.5 mg/l
State of the Watershed – Report on Surface Water QualitySanta Clara River Watershed, November 2006
48
• Mainstem at Santa Paula 12th St Bridge DWR Site Z2136010o Sampled from 1951 – 2000, monthly then quarterly through 1991, then infrequento Somewhat variable but generally below 1.0 mg/l
• At Freeman Diversion UWCD Site 3N21W32SW1 (03N21W32SW1)o Sampled from 1984 – 2005, quarterlyo Some variability but lower concentrations recently (below 1.0 mg/l)
Total Dissolved Solids
• At Old Highway 99 Bridge DWR Site Z2170200 and Regional Board Site 403SC76000o Sampled from 1967 – 2000, quarterly until mid-1990s then infrequento Quite variable until early 1980s then in 750 mg/l range
• At County Line DWR Site Z3113500 and UWCD Site 4N17W29SW1 (04N17W29SW1)o Sampled from 1953 – 2005, monthly or quarterly at timeso Extremely variable until early 1970s then gradual downward trend of mostly below
1,000 mg/l (Figure 22)
• Below Lake Piru DWR Site Z2324000o Sampled from 1961 – 2000, quarterlyo Some variability but generally below 1,000 mg/l
• Sespe Creek at Gage (Fillmore) DWR Site Z2215000 and UWCD Site 4N20W24SW1o Sampled from 1951 – present, monthly to quarterlyo Variable in 1960s then less so (under 1000 mg/l generally)
• Santa Paula Creek near Gage DWR Site Z2130000 and UCWD Site 4N21W34SW1o Sampled from 1963 – 2000, quarterlyo Low variability; generally below 1000 mg/l
• Mainstem at Santa Paula 12th St Bridge DWR Site Z2136010 and UCWD Site3N21W14SW1 (latter site sampled by City of Santa Paula for NPDES permit)
o Sampled from 1951 –present, quarterlyo Extremely variable until early 1970so Then less variable and generally below 1500 mg/l
• At Freeman Diversion UWCD Site 3N21W32SW1 (03N21W32SW1)o Sampled from 1925 – present; biweekly, monthly, or quarterlyo Quite variable with no trend; concentrations tied to flowso Generally below 1500 mg/l
Sulfate
• At Old Highway 99 Bridge DWR Site Z2170200 and Regional Board Site 403SC76000o Sampled from 1967 – 2000 (one sample from 1951), monthly then quarterly to
infrequent in later yearso Quite variable until early 1980s then generally around 200 mg/l
State of the Watershed – Report on Surface Water QualitySanta Clara River Watershed, November 2006
49
• At County Line DWR Site Z3113500 and UCWD Site 4N17W29SW1 (04N17W29SW1)o Sampled from 1951 – 2005, monthly then quarterlyo Extremely variable until early 1970so Trending downward somewhat since theno Recently mostly below 400 mg/l
• Below Lake Piru DWR Site Z2324000 and UWCD Site 4N18W03SW2o Sampled from 1961 – 2000, monthly then quarterlyo Some variability but mostly below 300 mg/lo Downward trend (slight) since 1960s
• Sespe Creek at Gage (Fillmore) DWR Site Z2215000 and UWCD Site 4N20W24SW1o Sampled from 1951 – present, monthly to quarterlyo Fairly variable until early 1970s then below 400 mg/l
• Santa Paula Creek near Gage DWR Site Z2130000 and UWCD Site 4N21W34SW1o Sampled from 1963 – 2000, monthly then quarterly to semiannuallyo Low variability; generally around 300 mg/l
• Mainstem at Santa Paula 12th St Bridge DWR Site Z2136010 and UWCD Site3N21W14SW1 (03N21W12SW1) (latter site sampled by City of Santa Paula for NPDESpermit)
o Sampled from 1951 – present, generally monthlyo High variability with slight downward trendo Mostly 300 – 600 mg/l
• At Freeman Diversion UCWD Site 3N21W32SW1 (03N21W32SW1)o Sampled from 1925 – present, biweekly, monthly, or quarterlyo Data mostly clumped in 1930s, 1960s, and 1990s to presento High variability with slight downward trendo Mostly 300 – 600 mg/l
Chloride
• At Old Highway 99 Bridge DWR Site Z2170200o Sampled from 1967 – 2000, monthly then quarterlyo High variability until early 1980so Upward trend into early 1990s, then downward trendo Now mostly below 100 mg/l (Figure 23)
• At County Line and Near Blue Cut DWR Site Z3113500 and UCWD Site 4N17W29SW1(04N17W29SW1)
o Sampled from 1951 – 2005, mostly monthlyo Extreme variability and very high concentrations (over 300 mg/l) until early 1970so Upward trend since then; now mostly over 100 mg/l (Figure 24)
State of the Watershed – Report on Surface Water QualitySanta Clara River Watershed, November 2006
50
• Below Lake Piru DWR Site Z2324000 and UWCD Site 4N18W03SW2o Sampled from 1961 – 2000, monthly or quarterlyo Some variability over the long-term with a major peak in late 1980s/early 1990so Except for peak, generally below 50 mg/l
• Sespe Creek at Gage (Fillmore) DWR Site Z2215000 and UCWD Site 4N20W24SW1o Sampled from 1951 – present, quarterlyo High variability with no trendo From 20 – 200 mg/l (Figure 25)
• Santa Paula Creek near Gage Paula DWR Site Z2130000 and UWCD Site 4N21W34SW1o Sampled from 1963 – 2000, quarterlyo Some variability but generally below 50 mg/l
• Mainstem at Santa Paula 12th St Bridge DWR Site Z2136010 and UWCD Site3N21W14SW1 (03N21W12SW1) (latter site sampled by City of Santa Paula for NPDESpermit)
o Sampled from 1951 – present, generally monthlyo Some variability; mostly between 50 – 100 mg/l
• At Freeman Diversiono Sampled from 1925 – present; biweekly, monthly, or quarterlyo Data in clumps mostly from 1930s, 1960s, and 1990s to presento Slight upward trend over time with considerable variabilityo Mostly below 100 mg/l
Hardness
• At Old Highway Bridge 99 DWR Site Z2170200o Sampled from 1971 – 2000, monthly then quarterlyo High variability until early 1980s then mostly below 400 mg/l
• At County Line DWR Site Z3113500 and UCWD Site 4N17W29SW1 (04N17W29SW1)o Sampled from 1970 – 2000, quarterlyo High variability but mostly downward trend to a little above 400 mg/l
• Below Lake Piru DWR Site Z2324000o Sampled from 1970 – 2000, quarterlyo Some early variability but mostly around 400 mg/l
• Sespe Creek at Gage (Fillmore) DWR Site Z2215000o Sampled from 1970 – presento Little variability; around 400 mg/l
• Santa Paula Creek near Gage DWR Site Z2130000o Sampled from 1970 – 2000o Some variability; mostly around 300 mg/l
State of the Watershed – Report on Surface Water QualitySanta Clara River Watershed, November 2006
51
• Mainstem at Santa Paula 12th St Bridge DWR Site Z2136010o Sampled from 1970 – 2000, quarterlyo Considerable variability around 600 mg/l
• At Freeman Diversion UWCD Site 3N21W32SW1 (03N21W32SW1)o Sampled from 1984 – present, quarterlyo Considerable variability around 600 mg/l
Recommendations for Future Water Quality Monitoring
Figure 26 shows the sampling sites of multiple agencies. It is clear that sampling sites over theyears have been highly clumped in certain locations of the mainstem. Until recently, samplingsites have rarely been located in the tributaries except near water diversions. As mentionedpreviously, this is partly due to the greatly differing goals of the monitoring agencies, rangingfrom evaluating raw surface water destined to become drinking water after infiltration, to theneed to follow receiving water monitoring programs developed by the Regional Board that focuson compliance. The Regional Board had at one time a widespread network of fixed sites used toevaluate support of beneficial uses; the random sampling approach being taken by SWAMP nowtakes its place, albeit on a five-year rotating schedule.
A report prepared by AMEC Earth & Environmental, Inc. in March 2006 describes the spatialclustering of recent sampling locations largely due to requirements of various permits. Althoughnot utilizing exactly the same dataset as this report (since the purposes of the report weresomewhat different, including setting the stage for a recommended comprehensive monitoringprogram through identification of data gaps), the AMEC report also notes the widely disparatetypes, locations, and frequencies of data collected and similarly cautions against the dataset’s usein a detailed analysis. A preliminary sampling design of monthly sampling at 38 sites ispresented in the report which encourages the distribution of monitoring costs among a number ofagencies currently conducting monitoring. A group of agencies and organizations is currentlymeeting to develop a final sample design. It is hoped by combining the resources of multipleagencies to develop a monitoring program with agreed-upon goals, while eliminating duplicativemonitoring sites, the result will be a combined dataset more easily utilized for assessment andprotection of the watershed’s water resources (AMEC, 2006).
A tremendous amount of time and effort was needed to track down and consolidateelectronically-available data for this report and present it in such a way that surface water qualitytrends could be characterized despite the differing monitoring goals associated with the data.This effort has been only partially successful but clearly points out the great need for thecoordinated monitoring and consolidated reporting work which is underway.
As finalization of this report was occurring during September and into early October, a large partof the watershed in the Los Padres National Forest was burning from a massive brushfire. Waterquality will likely be dramatically altered in the near-term following storms. It is hopedcoordinated monitoring by the watershed’s interested parties will document what changes dooccur.
State of the Watershed – Report on Surface Water QualitySanta Clara River Watershed, November 2006
52
Regional Board Activities Addressing Water Quality Issues
Conditional Waiver for Irrigated Lands
The California Water Code authorizes State and Regional Water Quality Control Boards toconditionally waive waste discharge requirements (WDRs) if this is in the public interest. Overthe years, the Regional Water Boards issued waivers for over 40 categories of discharges. Although waivers are always conditional, the historic waivers had few conditions. In general,they required that discharges not cause violations of water quality objectives, but did not requirewater quality monitoring. Senate Bill 390, signed into law on October 6, 1999, required theRegional Water Boards to review their existing waivers and to renew them or replace them withWDRs. Under SB 390, waivers not reissued automatically expired on January 1, 2003. Tocomply with SB 390, the Regional Water Boards adopted revised waivers.
The Los Angeles Regional Water Quality Control Board adopted the Conditional Waiver forIrrigated Lands at its November 3, 2005, Board meeting.
Statewide monitoring has shown the presence of chemicals associated with agriculture operationsin waters of the state. And, in Ventura County, the Regional Board has observed water qualityimpairments related to agriculture. Under Section 13269 of the Porter Cologne Water QualityControl Act, waivers are appropriate when they are consistent with other water quality controlplans and are in the public interest and are not to exceed 5 years in duration. The overall goal ofthe Conditional Waiver program is to improve and protect water quality in the Region throughextensive water quality monitoring and implementation of Best Management Practices (BMPs). Ifthe monitoring results show an exceedance of a water quality benchmark, development of aWater Quality Management Plan (WQMP) is triggered which will include the implementation ofBMPs to mitigate the impairment.
The first year has focused on enrollment and initiation of the program and identified the locationof the Dischargers and monitoring sites. Once enrollment documents are reviewed, the RegionalBoard’s Executive Officer will issue the Notice of Applicability (NOA), which is the formalnotice that the enrollment documents are approved. The NOA will be issued to enrollees byDecember 31, 2006 and water quality monitoring will start in January 2007.
Dischargers can enroll in the program as an Individual or as a member of a Discharger Group.The majority of growers have enrolled as members of a Discharger group. The waiver programalso requires 8 hours of educational training for growers.
There are currently two established Discharger Groups participating in the Conditional Waiverprogram. The Group representing growers in Ventura County is the Ventura County AgricultureIrrigated Lands group which consists of 1,080 landowner members representing 73,697 acres.There are 27,000 acres enrolled in the Santa Clara River Watershed.
Seven monitoring sites have been selected to characterize agriculture inputs in the watershedwithin Ventura County. The monitoring locations are generally located at the lower end ofmainstem tributaries or agricultural drainages and were selected in areas that were primarilyinfluenced by irrigated agriculture and unlikely to receive inputs from other land uses.
State of the Watershed – Report on Surface Water QualitySanta Clara River Watershed, November 2006
53
The Nursery Growers Association – Los Angeles County Irrigated Lands Group is the DischargerGroup formed to represent growers in Los Angeles County.
TMDLs• Upper Santa Clara River Chloride TMDL – implementation plan underway• Nutrient (nitrogen compounds) TMDL - identified wastewater treatment facilities as the
major contributor of nitrogen compounds loadings with nonpoint sources and minor pointsources contributing a much smaller fraction of these loads.
• For more information seehttp://www.waterboards.ca.gov/losangeles/html/meetings/tmdl/tmdl_ws_santa_clara.html
Permits• Fillmore Wastewater Treatment Plant – Administrative civil liability assessed for
violations, some of which may go toward development of a constructed wetland usingeffluent from the facility. Surface water discharge will phase out by 2008 and become agroundwater discharge (percolation) or a reclamation plant treating nitrates to 3 ppm.
• Santa Paula Wastewater Reclamation Plant – Will become Title 22 compliant and go tofull reclamation some time after 2008, in the meantime, there is ongoing enforcementaction toward a consent decree.
• San Buenaventura Wastewater Reclamation Plant – Administrative civil liabilityassessed for metals and coliform effluent violations; cleanup and abatement order inplace. Reduced problem metals by 50% and now treats to tertiary standards. Facilitydischarges to the estuary, in the late 1970s the City demonstrated enhancement asrequired under the Bays and Estuaries Policy based on an original 5 MGD discharge.The facility now discharges 10 MGD and the City has been asked to re-evaluate theenhancement issue.
• Valencia Water Reclamation Plant – Administrative civil liability assessed in 2006 forcyanide, nitrate plus nitrite (as nitrogen), and chloride effluent violations. The matter willbe heard before the Regional Board at a future meeting in 2007.
State of the Watershed – Report on Surface Water QualitySanta Clara River Watershed, November 2006
54
References
AMEC Earth & Environmental, 2006. Comprehensive Water Quality Monitoring Plan For TheSanta Clara River Watershed. Prepared for Ventura County Watershed Protection District.
AMEC Earth & Environmental, 2005. Santa Clara River Enhancement and Management Plan.Prepared for Los Angeles County Department of Public Works, Ventura County WatershedProtection District and SCREMP Project Steering Committee,
Bachman, Steve and Daniel Detmer, 2006. Chloride in the Piru Basin. United WaterConservation District.
Black & Veatch, Nancy Clemm, Kennedy/Jenks Consultants, Jeff Lambert, Luhdorff &Scalmanini Consulting Engineers, Reiter/Lowry Consultants, Richard Slade and Associates, LLC,2005. 2005 Urban Water Management Plan. Prepared for Castaic Lake Water Agency,Newhall County Water District, CLWA Santa Clarita Water Division, Valencia Water Company,and Los Angeles County Water District #36. http://www.clwa.org/about/publications.cfm
BonTerra Consulting, San Marino Environmental Associates, and MEC Analytical Systems, Inc,2004. Bioassessment Monitoring Program in Los Angeles County. Prepared for Los AngelesCounty Department of Public Works.
California Department of Parks and Recreation websitehttp://www.stateparks.com/placerita_canyon.html.
California Department of Water Resources websitehttp://www.publicaffairs.water.ca.gov/information/pdf/pyramid-lake.pdf.
California Department of Water Resources, 2006a. California’s Groundwater, Bulletin 118,Santa Clara River Valley Groundwater Basin, Santa Clara River Valley, Fillmore Subbasin.http://www.groundwater.water.ca.gov/bulletin118/basin_desc/basins_t-y.cfm
California Department of Water Resources, 2006b. California’s Groundwater, Bulletin 118,Santa Clara River Valley Groundwater Basin, Santa Clara River Valley, Mound Subbasin.http://www.groundwater.water.ca.gov/bulletin118/basin_desc/basins_t-y.cfm
California Department of Water Resources, 2006c. California’s Groundwater, Bulletin 118,Santa Clara River Valley Groundwater Basin, Santa Clara River Valley, Oxnard Subbasin.http://www.groundwater.water.ca.gov/bulletin118/basin_desc/basins_t-y.cfm
California Department of Water Resources, 2004a. California’s Groundwater, Bulletin 118,Santa Clara River Valley Groundwater Basin, Santa Clara River Valley East Subbasin.http://www.groundwater.water.ca.gov/bulletin118/basin_desc/basins_t-y.cfm
California Department of Water Resources, 2004b. California’s Groundwater, Bulletin 118,Acton Valley Groundwater Basin.http://www.groundwater.water.ca.gov/bulletin118/basin_desc/basins_t-y.cfm
State of the Watershed – Report on Surface Water QualitySanta Clara River Watershed, November 2006
55
California Department of Water Resources, 2004c. California’s Groundwater, Bulletin 118,Santa Clara River Valley Groundwater Basin, Santa Clara River Valley, Piru Subbasin.http://www.groundwater.water.ca.gov/bulletin118/basin_desc/basins_t-y.cfm
California Department of Water Resources, 2004d. California’s Groundwater, Bulletin 118,Santa Clara River Valley Groundwater Basin, Santa Clara River Valley, Santa Paula Subbasin.http://www.groundwater.water.ca.gov/bulletin118/basin_desc/basins_t-y.cfm
California Department of Water Resources, 1993. Investigation of Water Quality and BeneficialUses – Upper Santa Clara River Hydrologic Area.
California Department Of Water Resources, 1989. Update of Basin Plan for Piru, Sespe, AndSanta Paula Hydrologic Areas.
California Public Utilities Commission websitehttp://www.cpuc.ca.gov/environment/info/aspen/antelopepardee/pea/pea04-09.pdf.
California Regional Water Quality Control Board – Los Angeles Region, 2004. WatershedManagement Initiative Chapter.http://www.waterboards.ca.gov/losangeles/html/programs/regional_programs.html - Watershed
California Regional Water Quality Control Board – Los Angeles Region, 1999. Staff Report.Proposed Amendment to the Water Quality Control Plan for the Los Angeles Region for aProhibition of Septic System Discharges in the Oxnard Forebay.
California Regional Water Quality Control Board – Los Angeles Region, 1994. Los AngelesRegional Water Quality Control Board. Water Quality Control Plan – Los Angeles Region. BasinPlan for the Coastal Watersheds of Los Angeles and Ventura Counties.http://www.waterboards.ca.gov/losangeles/html/meetings/tmdl/Basin_plan/basin_plan.html
Downs, Peter, 2005. Highlights From a Presentation by Peter Downs (Stillwater Sciences) on theHydrology Portion of the Santa Clara River Parkway Restoration Feasibility Study (at 5/12/05Ventura County Task Force – Southern California Wetlands Recovery Project meeting).
Greenwald, Glenn, et. al., 1999. Santa Clara River Estuary Ecological Monitoring Program1997-199. U.S. Fish & Wildlife Service. Prepared for California Department of Parks andRecreation.
Kamer, K. and R. Fairey. 2005. Water quality in the Calleguas Creek and Santa ClaraRiver Watersheds under the Surface Water Ambient Monitoring Program Fiscal Year2000-2001. Marine Pollution Studies Laboratory, Moss Landing Marine Laboratories,Moss Landing, California. 123 pp.
Kelley, Elise, 2004. Information Synthesis and Priorities Regarding Steelhead Trout(Oncorhynchus mykiss) on the Santa Clara River, UC Santa Barbara.
State of the Watershed – Report on Surface Water QualitySanta Clara River Watershed, November 2006
56
Luhdorff &Scalmanini Consulting Engineers, 2006. 2005 Santa Clarita Valley Water Report.For Castaic Lake Water Agency, Los Angeles County Water District #36, Newhall CountyWater District, CLWA Santa Clarita Water Division, and Valencia Water Company.
Mann, John F., 1968. Supplement to a Plan for Ground Water Management. For United WaterConservation District.
Nautilus Environmental, 2005. Environmental Study of the Santa Clara River Estuary:Toxicology, Ecology, and Hydrology, Final Report. Prepared for City of San Buenaventura.
National Ocean and Atmospheric Administration and US Environmental Protection Agency.1988. Strategic Assessment of Near Coastal Waters, Chapter 3, Susceptibility and ConcentrationStatus of Northeast Estuaries to Nutrient Discharges.
Slade, Richard C. & Associates, LLC, 2002. 2001 Update Report - Hydrogeologic Conditions inthe Alluvial and Saugus Formation Aquifer Systems, Volume I – Report Text. Prepared for SantaClarita Valley Water Purveyors.
Southern California Wetlands Recovery Project Information Station websitehttp://www.wrpinfo.scc.ca.gov/watersheds/sc/sc_subprofiles.html .
Stephenson, John R. and Gena M. Calcarone, 1999. Southern California Mountains and FoothillsAssessment: Habitat and Species Conservation Issues. General Technical Report GTR-PSW-175.Albany, CA: Pacific Southwest Research Station, Forest Service, U.S. Department of Agriculture;402 p.
U.S. Geological Survey with United Water Conservation District, 1999. Evaluation Of SurfaceWater/Ground Water Interactions in the Santa Clara River Valley, Ventura County, California.
U.S. Minerals Management Service website http://www.mms.gov/ .
United Water Conservation District, 2001. Surface and Groundwater Conditions Report WaterYear 2000 Supplement. http://www.unitedwater.org/report/adcr
United Water Conservation District, unpublished operations records.