Embed Size (px)
Citation preview
State of California
STATE WATER RESOURCES CONTROL BOARD
CONSOLIDATED TOXIC HOT SPOTS CLEANUP PLAN
VOLUME II: REGIONAL CLEANUP PLANS
DRAFT FUNCTIONAL EQUIVALENT DOCUMENTAPPENDIX B
April 1999
PREFACEThe Consolidated Toxic Hot Spot Cleanup Plan has two parts: (1) Volume I which contains the consolidated lists, policy statements and findings; and (2) Volume II which contains each of the Regional Toxic Hot Spot Cleanup Plans.
This is Volume II of the Consolidated Toxic Hot Spot Cleanup Plan contains each of the Regional Toxic Hot Spot Cleanup Plans. Regional Cleanup Plans are included for the following Regional Water Quality Control Boards:
· North Coast (Region 1)· San Francisco Bay (Region 2)· Central Coast (Region 3)· Los Angeles (Region 4)· Central Valley (Region 5)· Santa Ana (Region 8)· San Diego (Region 9)
Each Regional Cleanup Plan in this volume is divided into the following sections:
· Toxic Hot Spot List· Ranking Matrix· Characterization and planning for remediation of high priority
toxic hot spots· Future needs
TABLE OF CONTENTS
PREFACE..............................................................................................................................................................
TABLE OF CONTENTS.......................................................................................................................................
REGIONAL WATER QUALITY CONTROL BOARD, NORTH COAST REGION........................................
REGION DESCRIPTION...............................................................................................................................................CANDIDATE TOXIC HOT SPOT LIST...........................................................................................................................RANKING MATRIX....................................................................................................................................................HIGH PRIORITY CANDIDATE TOXIC HOT SPOT, G&R METALS FOOT OF H STREET BETWEEN FIRST STREET AND HUMBOLDT BAY EUREKA, CALIFORNIA (SCRAP YARD)..............................................................................................FUTURE NEEDS.........................................................................................................................................................SITES OF CONCERN (SITES THAT DO NOT QUALIFY AS CANDIDATE TOXIC HOT SPOTS)...............................................
Reference list......................................................................................................................................................
REGIONAL WATER QUALITY CONTROL BOARD, SAN FRANCISCO BAY REGION............................
REGION DESCRIPTION...............................................................................................................................................CANDIDATE TOXIC HOT SPOTS (EXCEPT FOR SAN FRANCISCO BAY, SITES ARE LISTED FROM NORTH TO SOUTH)..........
Reference list......................................................................................................................................................RANKING MATRIX (EXCEPT FOR SAN FRANCISCO BAY SITES WITHIN AN OVERALL RANK ARE LISTED FROM NORTH TO SOUTH).....................................................................................................................................................................HIGH PRIORITY CANDIDATE TOXIC HOT SPOT CHARACTERIZATION...........................................................................SITE A -- SAN FRANCISCO BAY.................................................................................................................................
Description of site/ Background..........................................................................................................................Reason for listing................................................................................................................................................Mercury..............................................................................................................................................................PCBs...................................................................................................................................................................Chlorinated Pesticides.........................................................................................................................................Dioxins................................................................................................................................................................Mercury..............................................................................................................................................................PCBs...................................................................................................................................................................Chlorinated Pesticides.........................................................................................................................................Dioxins................................................................................................................................................................Summary of actions by government agencies in response to health advisory........................................................References...........................................................................................................................................................
SITE B -- PEYTON SLOUGH........................................................................................................................................Description of site...............................................................................................................................................Reason for listing................................................................................................................................................CH2MHILL (1986)..............................................................................................................................................The MARK Group (1988a, 1988b, 1989a, 1989b)................................................................................................Bay Protection and Toxic Cleanup Program........................................................................................................
Pilot Regional Monitoring Program (Flegal et al., 1994)..................................................................................................Screening and Confirmation Studies (Hunt et al., 1998)...................................................................................................
Harding Lawson Associates (1998)......................................................................................................................References...........................................................................................................................................................
SITE C - CASTRO COVE.............................................................................................................................................Description of site...............................................................................................................................................Reason for listing................................................................................................................................................
E.V.S. investigations (1987).............................................................................................................................................Entrix Investigations (1990a, 1990b)................................................................................................................................E.V.S. study (1991)..........................................................................................................................................................
Mussel Watch Program (1988, 1990)...............................................................................................................................Bay Protection and Toxic Cleanup Program.....................................................................................................................
Pilot Regional Monitoring Program (Flegal et al., 1994).............................................................................................Reference site study (Hunt et al., 1998a).....................................................................................................................Screening/confirmation studies (Hunt et al., 1998b)....................................................................................................
References...........................................................................................................................................................SITE D - STEGE MARSH............................................................................................................................................
Description of site...............................................................................................................................................Reason for listing................................................................................................................................................
ICI Americas Investigations (1987)..................................................................................................................................The Mark Group Investigations (1990, 1991)...................................................................................................................URS Corporation Investigation (1991).............................................................................................................................Woodward-Clyde Consultants Investigation (1993)..........................................................................................................ICF Kaiser Investigation (1997).......................................................................................................................................Zeneca and RWQCB sediment sample (1997)..................................................................................................................Bay Protection and Toxic Cleanup Program (1998)..........................................................................................................Pacific Eco-Risk Laboratories..........................................................................................................................................
References...........................................................................................................................................................SITE E -- POINT POTRERO/RICHMOND HARBOR.........................................................................................................
Description of Site...............................................................................................................................................Reason for Listing...............................................................................................................................................References...........................................................................................................................................................
SITE F -- MISSION CREEK..........................................................................................................................................Description of site...............................................................................................................................................Reason for listing................................................................................................................................................References...........................................................................................................................................................
SITE G -- ISLAIS CREEK............................................................................................................................................Description of site...............................................................................................................................................Reason for listing................................................................................................................................................Recurrent Toxicity...............................................................................................................................................Elevated Chemicals.............................................................................................................................................Impacted Benthic Community..............................................................................................................................CSOs...................................................................................................................................................................Quint Street Outfall.............................................................................................................................................Other Potential Sources.......................................................................................................................................References...........................................................................................................................................................
FUTURE NEEDS.........................................................................................................................................................Sites of Concern..................................................................................................................................................
SITES OF CONCERN (THESE SITES DO NOT QUALIFY AS CANDIDATE TOXIC HOT SPOTS)..............................................SITES OF CONCERN (THESE SITES DO NOT QUALIFY AS CANDIDATE TOXIC HOT SPOTS)..............................................
Reference list......................................................................................................................................................
REGIONAL WATER QUALITY CONTROL BOARD, CENTRAL COAST REGION....................................
REGION DESCRIPTION...............................................................................................................................................CANDIDATE TOXIC HOT SPOT LIST...........................................................................................................................
References...........................................................................................................................................................RANKING MATRIX....................................................................................................................................................HIGH PRIORITY CANDIDATE TOXIC HOT SPOT CHARACTERIZATION...........................................................................MOSS LANDING AND TRIBUTARIES............................................................................................................................
River and Stream Maintenance Activities............................................................................................................Urban Activities..................................................................................................................................................Harbor Activities.................................................................................................................................................Issuance of Discharge Permits and CWA 401 Certifications................................................................................Harbor Dredging Activities.................................................................................................................................303(d) Listings of Water Quality Limited Water Bodies.......................................................................................Watershed Management Initiative.......................................................................................................................Salinas River Watershed Strategy........................................................................................................................
Nonpoint Source Program...................................................................................................................................Urban Runoff Management..................................................................................................................................Clean Water Act Section 319(h) and 205(j) Grants..............................................................................................Coordination with Existing Resource Protection Efforts......................................................................................Dredging.............................................................................................................................................................Control of Harbor Pollutants...............................................................................................................................Control of Urban Runoff......................................................................................................................................Implementation of Management Practices to Reduce Nonpoint Source Pollution from Agriculture......................
SUMMARY................................................................................................................................................................Environmental Benefits.......................................................................................................................................1. Regional Board Program costs........................................................................................................................2. Harbor implementation costs...........................................................................................................................3. Urban implementation costs............................................................................................................................4. Agricultural implementation costs...................................................................................................................Overall Agricultural Implementation Cost Estimate.............................................................................................Harbor................................................................................................................................................................Urban..................................................................................................................................................................Agricultural.........................................................................................................................................................
CANADA DE LA HUERTA – SHELL/HERCULES SITE.....................................................................................................Environmental Benefits.......................................................................................................................................
Commercial and Sport Fishing.........................................................................................................................................Aquaculture......................................................................................................................................................................Wildlife Habitat...............................................................................................................................................................Cold/Warm Freshwater Habitat........................................................................................................................................Rare, Threatened, and Endangered Species.......................................................................................................................
References...........................................................................................................................................................SITES OF CONCERN (SITES THAT DO NOT CURRENTLY QUALIFY AS CANDIDATE TOXIC HOT SPOTS)........................
Additional Comments on Sites of Concern...........................................................................................................Santa Maria River Estuary................................................................................................................................................Santa Cruz Harbor............................................................................................................................................................Pajaro River Estuary.........................................................................................................................................................Monterey Harbor..............................................................................................................................................................Other Sites.......................................................................................................................................................................
REGIONAL WATER QUALITY CONTROL BOARD, LOS ANGELES REGION..........................................
REGION DESCRIPTION...............................................................................................................................................CANDIDATE TOXIC HOT SPOT LIST...........................................................................................................................
Reference list......................................................................................................................................................HIGH PRIORITY CANDIDATE TOXIC HOT SPOT CHARACTERIZATION...........................................................................SANTA MONICA BAY/PALOS VERDES SHELF.............................................................................................................MUGU LAGOON/CALLEGUAS CREEK TIDAL PRISM....................................................................................................LOS ANGELES/LONG BEACH HARBORS.....................................................................................................................LOS ANGELES OUTER HARBOR/CABRILLO PIER.........................................................................................................LOS ANGELES INNER HARBOR/DOMINGUEZ CHANNEL, CONSOLIDATED SLIP..............................................................FUTURE NEEDS.........................................................................................................................................................SITES OF CONCERN (SITES THAT DO NOT QUALIFY AS CANDIDATE TOXIC HOT SPOTS)...............................................
Reference list......................................................................................................................................................
REGIONAL WATER QUALITY CONTROL BOARD, CENTRAL VALLEY REGION.................................
REGION DESCRIPTION...............................................................................................................................................CANDIDATE TOXIC HOT SPOT LIST...........................................................................................................................
References...........................................................................................................................................................RANKING MATRIX....................................................................................................................................................HIGH PRIORITY CANDIDATE TOXIC HOT SPOT CHARACTERIZATION...........................................................................MERCURY CLEAN UP PLAN.......................................................................................................................................
Background.........................................................................................................................................................
TABLE 1. ESTIMATE OF COST TO COLLECT INFORMATION TO DEVELOP A MERCURY CONTROL STRATEGY....................SAN JOAQUIN RIVER DISSOLVED OXYGEN CLEANUP PLAN........................................................................................
Background.........................................................................................................................................................TABLE 2. COST ESTIMATES FOR DEVELOPING A DISSOLVED OXYGEN TMDL IN THE LOWER SAN JOAQUIN RIVER AND AN ESTIMATE OF THE TIME REQUIRED TO COMPLETE EACH TASK.................................................................................
References...........................................................................................................................................................PESTICIDE VARIANCE FROM REGIONAL TOXIC HOT SPOT CLEANUP PLAN.................................................................
High Priority Candidate Toxic Hot Spot Characterization Variance for Diazinon Orchard Dormant Spray Cleanup Plan......................................................................................................................................................
Background......................................................................................................................................................................URBAN STORMWATER PESTICIDE CLEANUP PLAN......................................................................................................
Background.........................................................................................................................................................IRRIGATION RETURN FLOW PESTICIDE CLEANUP PLAN..............................................................................................
Background.........................................................................................................................................................References...........................................................................................................................................................
FUTURE NEEDS.........................................................................................................................................................SITES OF CONCERN (SITES THAT DO NOT QUALIFY AS CANDIDATE TOXIC HOT SPOTS)...............................................
REGIONAL WATER QUALITY CONTROL BOARD, SANTA ANA REGION..............................................
REGION DESCRIPTION...............................................................................................................................................CANDIDATE TOXIC HOT SPOT LIST...........................................................................................................................
References...........................................................................................................................................................RANKING MATRIX....................................................................................................................................................
Human Health Impacts........................................................................................................................................Water Quality Objectives.....................................................................................................................................
Natural Remediation Potential..........................................................................................................................................HIGH PRIORITY CANDIDATE TOXIC HOT SPOT CHARACTERIZATION...........................................................................LOWER NEWPORT BAY - RHINE CHANNEL................................................................................................................
Year 1..............................................................................................................................................................................Year 2..............................................................................................................................................................................
References...........................................................................................................................................................FUTURE NEEDS.........................................................................................................................................................SITES OF CONCERN (SITES THAT DO NOT QUALIFY AS CANDIDATE TOXIC HOT SPOTS)...............................................
REGIONAL WATER QUALITY CONTROL BOARD, SAN DIEGO REGION...............................................
REGION DESCRIPTION...............................................................................................................................................CANDIDATE TOXIC HOT SPOT LIST...........................................................................................................................
Reference list......................................................................................................................................................RANKING MATRIX....................................................................................................................................................HIGH PRIORITY CANDIDATE TOXIC HOT SPOT...........................................................................................................SEVENTH STREET CHANNEL, NATIONAL CITY...........................................................................................................
Year 1:................................................................................................................................................................Year 2:................................................................................................................................................................
FUTURE NEEDS.........................................................................................................................................................SITES OF CONCERN...................................................................................................................................................SITES OF CONCERN (SITES THAT DO NOT QUALIFY AS CANDIDATE TOXIC HOT SPOTS)...............................................
References...........................................................................................................................................................
REGIONAL WATER QUALITY CONTROL BOARD, NORTH COAST REGION 1
REGIONAL TOXIC HOT SPOT CLEANUP PLAN
Region DescriptionThe North Coast Region is defined in Section 13200(a) of the Porter-Cologne Water Quality Control Act as follows:
“North Coast Region, which comprises all basins including the Lower Klamath Lake and Lost River Basins draining into the Pacific Ocean from the California-Oregon state line southerly to the southerly boundary of the watershed of the Estero de San Antonio and Stemple Creek in Marin and Sonoma Counties.”
The Region is divided into two natural drainage basins, the Klamath River Basin and the North Coastal Basin. The North Coast Region covers all of Del Norte, Humboldt, Trinity, and Mendocino Counties, major portions of Siskiyou and Sonoma Counties, and small portions of Glenn, Lake and Marin Counties.
The Region encompasses a total area of approximately 19,390 square miles, including 340 miles of scenic coastline and remote wilderness areas, as well as urbanized and agricultural areas.
The Region is characterized by distinct temperature zones. Along the coast, the climate is moderate and foggy and the temperature variation is not great. For example, at Eureka, the seasonal variation in temperature has not exceeded 63°F for the period of record. Inland however, seasonal temperature ranges in excess of 100°F have been recorded.
Precipitation over the North Coast Region is greater than any other part of California, and damaging floods are a fairly frequent hazard. Particularly devastating floods occurred in the North Coast area in December of 1955, December of 1964, and in February of 1986.
Ample precipitation in combination with the mild climate found over most of the North Coast Region has provided a wealth of fish, wildlife, and scenic resources. The mountainous nature of the Region, with its dense coniferous forests interspersed with grassy or chaparral covered slopes, provides shelter and food for deer, elk, bear, mountain lion, fur-bearers and many upland bird and mammal species. The numerous streams and rivers of the Region contain anadromous fish, and the reservoirs, although few in number, support both cold-water and warm-water fish.
Tidelands, and marshes too, are extremely important to many species of waterfowl and shore birds, both for feeding and nesting. Cultivated land and pasture lands also provide supplemental food for many birds, including small pheasant populations. Tideland areas along the north coast provide important habitat for marine invertebrates and nursery areas for forage fish, game fish and crustaceans. Offshore coastal rocks are used by many species of seabirds as nesting areas. Major components of the economy are tourism and recreation, logging and timber milling, aggregate mining, commercial and sport fisheries, sheep, beef and dairy production, and vineyards and wineries.
In all, the North Coast Region offers a beautiful natural environment with opportunities for scientific study and research, recreation, sport and commerce. To ensure their perpetuation, the resources must be used wisely.
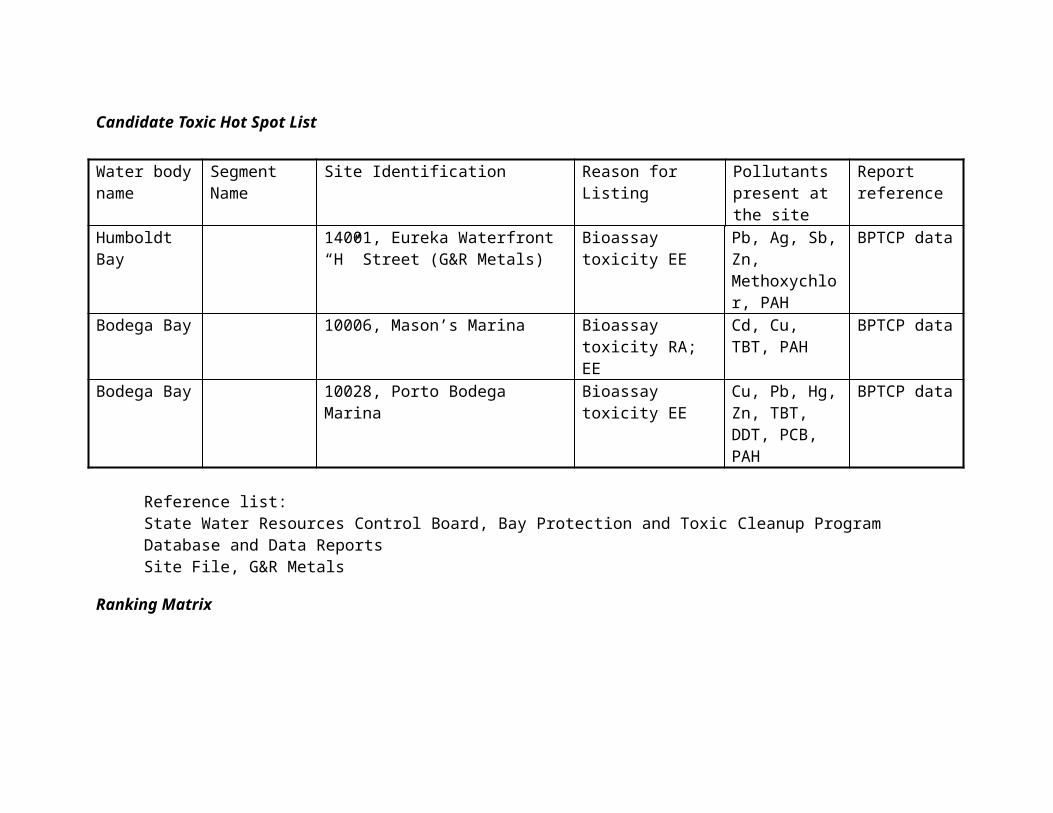
Candidate Toxic Hot Spot List
Water body name
Segment Name Site Identification Reason for Listing Pollutants present at the site
Report reference
Humboldt Bay 14001, Eureka Waterfront “H” Street (G&R Metals)
Bioassay toxicity EE Pb, Ag, Sb, Zn, Methoxychlor, PAH
BPTCP data
Bodega Bay 10006, Mason’s Marina Bioassay toxicity RA; EE
Cd, Cu, TBT, PAH
BPTCP data
Bodega Bay 10028, Porto Bodega Marina Bioassay toxicity EE Cu, Pb, Hg, Zn, TBT, DDT, PCB, PAH
BPTCP data
Reference list:State Water Resources Control Board, Bay Protection and Toxic Cleanup Program Database and Data ReportsSite File, G&R Metals
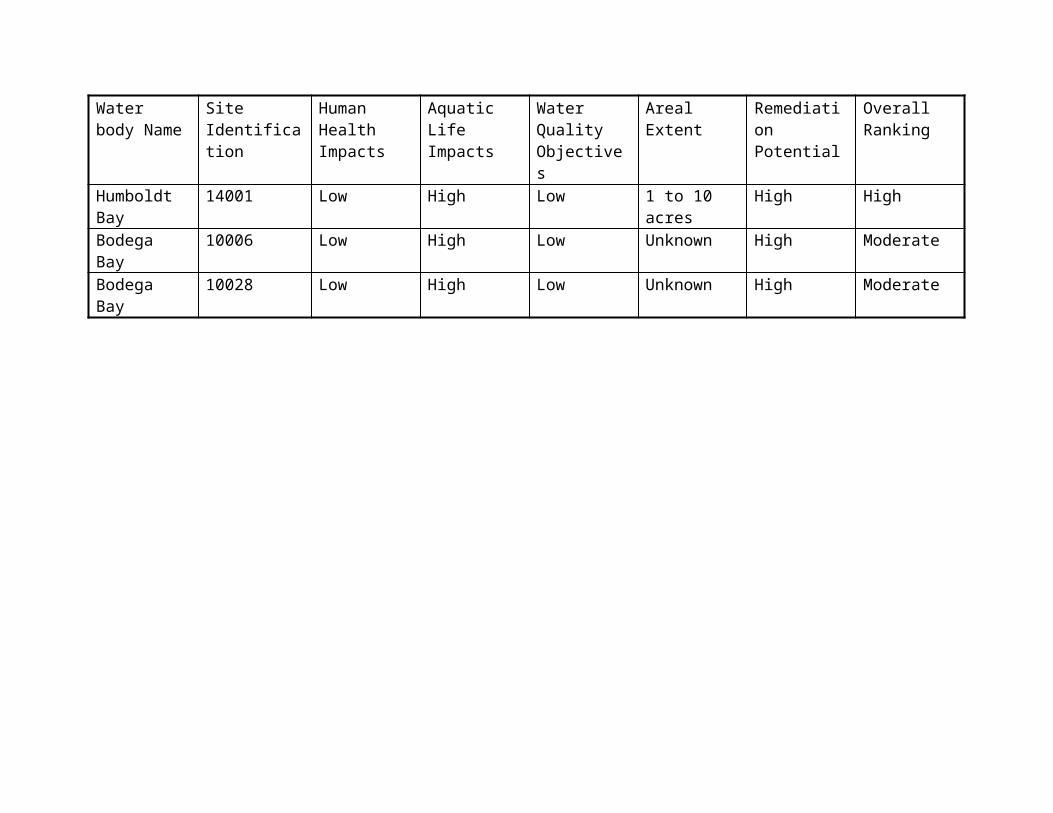
Ranking Matrix
Water body Name
Site Identification
Human Health Impacts
Aquatic Life Impacts
Water Quality Objectives
Areal Extent Remediation Potential
Overall Ranking
Humboldt Bay 14001 Low High Low 1 to 10 acres High High
Bodega Bay 10006 Low High Low Unknown High ModerateBodega Bay 10028 Low High Low Unknown High Moderate
High Priority Candidate Toxic Hot Spot, G&R Metals Foot of H Street Between First Street and Humboldt Bay Eureka, California (scrap yard)
A. Areal extent of the Toxic Hot Spot:
The areal extent of the toxic hot spot has been estimated to be 3.5 acres with an average depth of contamination of 2 feet. The total contaminated soil quantity is about 10,000 cubic yards. The constituents of concern are lead, arsenic, chromium, cadmium, cobalt, copper, mercury, zinc, and PCBs.
B. Most likely Sources of Pollutants:
The site is located on the shore of Humboldt Bay and has been used for industrial activities since the early part of the century. It has been operated as a scrap metal facility since the early 1950s. Operations at the site included disassembly, incineration, and crushing
of automobiles, storage of metals, batteries, radiators, metals reclamation from electrical transformers, and miscellaneous refuse. These operations occurred across the site. All industrial activities have ceased at the site but the historic uses have resulted in an area contaminated with PCBs, PAHs, metals and Methoxychlor. Cleanup and abatement activities remain to be performed at this site. These activities include: a.) performing an ecological and human
health risk assessment, b.) conducting a feasibility study assessing remedial alternatives, and c.) performing appropriate cleanup and abatement activities.
C. Summary of actions that have been initiated by the Regional Water Board to reduce the accumulation of pollutant at existing Toxic Hot Spots and to prevent the creation of new Toxic Hot Spots:
The site has not been used since 1980. On-going activity is limited to site assessment work to determine the extent of the contamination and the appropriate remediation needed to clean up the site. The Regional Water Board issued a draft Cleanup and Abatement Order on June 4, 1998 requiring cleanup of the site.
5
The final order will be issued sometime in fiscal year 1998/99.
D. Preliminary Assessment of Actions required to remedy or restore a THS to an unpolluted condition including recommendations for remedial actions.
The cleanup alternatives are limited to the removal of highly contaminated soils and capping of the site to prevent migration of metals to ground and surface waters. Dredging of the offshore area may be necessary for a complete cleanup.
E. An estimate of the total cost to implement the Cleanup Plan.
It is estimated that the cost to implement the chosen cleanup plan will be between $500,000 and $5 million dollars. These costs are based on a $500.00 per ton cost for hauling and tipping fees at a hazardous waste disposal site. The exact amount of material that will
be removed from the site will be determined at a later date when the assessment work is completed.
F. An estimate of recoverable costs from potential Dischargers.
The responsible parties will be required to pay for the cleanup. It appears that the responsible parties have the ability to pay for the entire cleanup effort.
G. A two-year expenditure schedule identifying funds to implement the plans that are not recoverable from potential dischargers.
Not applicable.
H. Benefits.
The cleanup plan, when implemented, will restore the beneficial uses that have been impacted on and around the site. The beneficial uses of Humboldt Bay are: Navigation; Commercial and Sport Fishing; Wildlife Habitat; Rare, Threatened or Endangered Species; Marine Habitat; Migration of Aquatic Organisms;
6
Spawning, Reproduction, and Development; Shellfish Harvesting; Estuarine Habitat; and Aquaculture. The benefits will include the general improvement of the ecosystem which will result in more abundant benthic life and lower concentrations of pollutants in fish and shellfish.
Future Needs
A number of sites have shown toxicity, sediment chemistry problems or other indications of pollutants, but insufficient evidence is currently available to consider them “candidate toxic hot spots”. Additional data and information is needed to confirm them as Toxic Hot Spots or remove them from further consideration. Sites of Concern are listed in a later Section in this report.
Four sites are listed as Candidate Toxic Hot Spots. Three do not include a cleanup plan. Additional information is necessary to determine the areal extent of the contamination and the need for cleanup or mitigation at those sites.
7
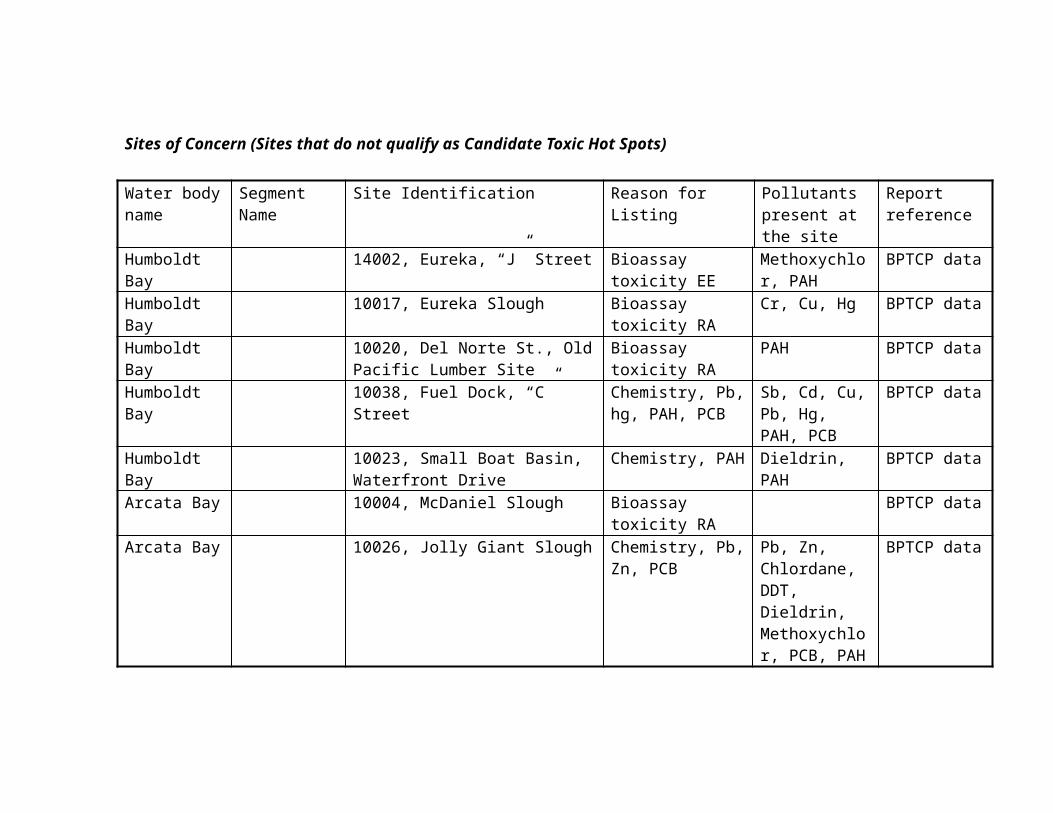
Sites of Concern (Sites that do not qualify as Candidate Toxic Hot Spots)
Water body name
Segment Name Site Identification Reason for Listing Pollutants present at the site
Report reference
Humboldt Bay 14002, Eureka, “J” Street Bioassay toxicity EE Methoxychlor, PAH
BPTCP data
Humboldt Bay 10017, Eureka Slough Bioassay toxicity RA
Cr, Cu, Hg BPTCP data
Humboldt Bay 10020, Del Norte St., Old Pacific Lumber Site
Bioassay toxicity RA
PAH BPTCP data
Humboldt Bay 10038, Fuel Dock, “C” Street Chemistry, Pb, hg, PAH, PCB
Sb, Cd, Cu, Pb, Hg, PAH, PCB
BPTCP data
Humboldt Bay 10023, Small Boat Basin, Waterfront Drive
Chemistry, PAH Dieldrin, PAH BPTCP data
Arcata Bay 10004, McDaniel Slough Bioassay toxicity RA
BPTCP data
Arcata Bay 10026, Jolly Giant Slough Chemistry, Pb, Zn, PCB
Pb, Zn, Chlordane, DDT, Dieldrin, Methoxychlor, PCB, PAH
BPTCP data
Reference list
State Water Resources Control Board, Bay Protection and Toxic Cleanup Program Database and Data Reports
2
REGIONAL WATER QUALITY CONTROL BOARD, SAN FRANCISCO BAY REGION
REGIONAL TOXIC HOT SPOT CLEANUP PLAN
Region DescriptionThe San Francisco Bay Region is comprised of most of the San Francisco estuary up to the mouth of the Sacramento-San Joaquin Delta (Figure 1). The San Francisco estuary conveys the waters of the Sacramento and San Joaquin rivers into the Pacific Ocean. Located on the central coast of California, the Bay system functions as the only drainage outlet for waters of the Central Valley. It also marks a natural topographic separation between the northern and southern coastal mountain ranges. The region’s waterways, wetlands and bays form the centerpiece of the fourth largest metropolitan area in the United States, including all or major portions of Alameda, Contra Costa, Marin, Napa, San Francisco, San Mateo, Santa Clara, Solano and Sonoma counties.
The San Francisco Bay Regional Water Quality Control Board (RWQCB) has jurisdiction over the part of the San Francisco estuary which includes all of the San Francisco Bay segments extending east to the Delta (Winter Island near Pittsburg). Coastal embayments including Tomales Bay and Bolinas Lagoon are also located in this Region. The Central Valley RWQCB has jurisdiction over the Delta and rivers extending further eastward.
The Sacramento and San Joaquin rivers, which enter the Bay system through the Delta at the eastern end of Suisun Bay, contribute almost all of the freshwater inflow to the Bay. Many smaller rivers and streams also convey fresh water to the Bay system. The rate and timing of these freshwater flows are among the most important factors influencing physical, chemical and biological conditions in the estuary. Flows in the region are highly seasonal, with more than 90 percent of the annual runoff occurring during the winter rainy season between November and April.
The San Francisco estuary is made up of many different types of aquatic habitats that support a great diversity of organisms. Suisun Marsh in Suisun Bay is the largest brackish-water marsh in the United States. San Pablo Bay is a shallow embayment strongly influenced by runoff from the Sacramento and San Joaquin Rivers. The Central Bay is the portion of the Bay most influenced by oceanic conditions. The
South Bay, with less freshwater inflow than the other portions of the Bay, acts more like a tidal lagoon. Together these areas sustain rich communities of aquatic life and serve as important wintering sites for migrating waterfowl and spawning areas for anadromous fish.
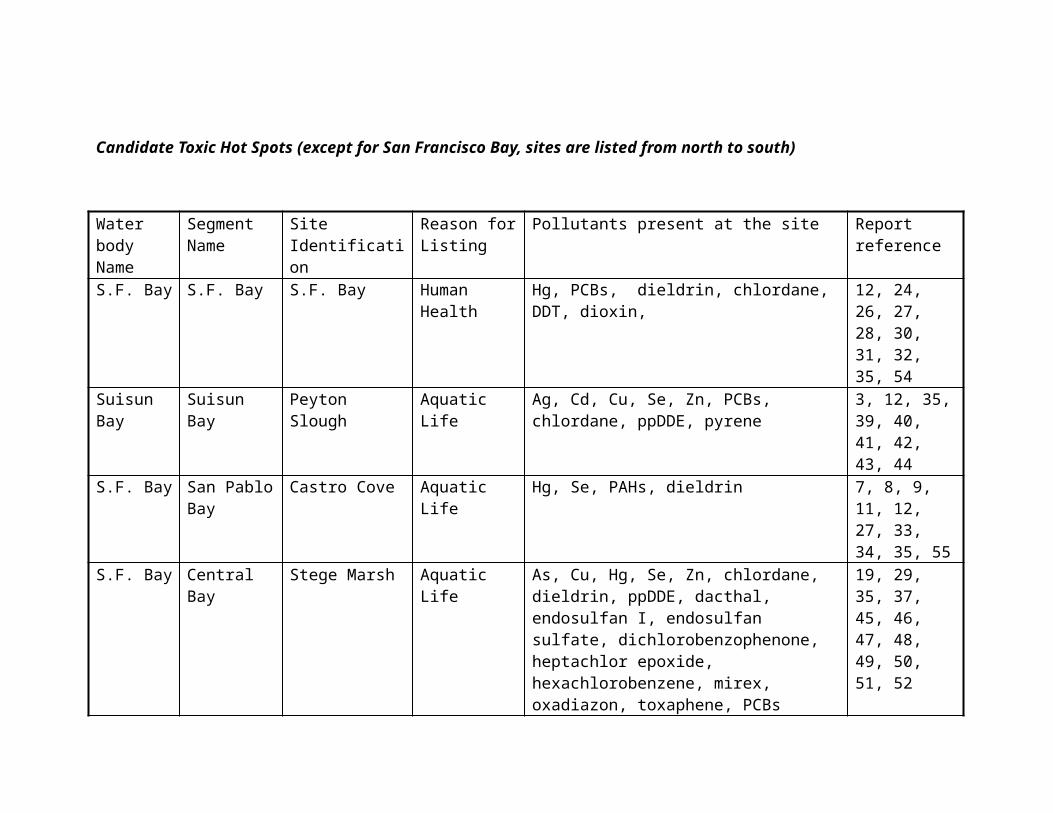
Candidate Toxic Hot Spots (except for San Francisco Bay, sites are listed from north to south)
Water body Name
Segment Name
Site Identification Reason for Listing
Pollutants present at the site Report reference
S.F. Bay S.F. Bay S.F. Bay Human Health
Hg, PCBs, dieldrin, chlordane, DDT, dioxin, 12, 24, 26, 27, 28, 30, 31, 32, 35, 54
Suisun Bay Suisun Bay Peyton Slough Aquatic Life Ag, Cd, Cu, Se, Zn, PCBs, chlordane, ppDDE, pyrene
3, 12, 35, 39, 40, 41, 42, 43, 44
S.F. Bay San Pablo Bay
Castro Cove Aquatic Life Hg, Se, PAHs, dieldrin 7, 8, 9, 11, 12, 27, 33, 34, 35, 55
S.F. Bay Central Bay Stege Marsh Aquatic Life As, Cu, Hg, Se, Zn, chlordane, dieldrin, ppDDE, dacthal, endosulfan I, endosulfan sulfate, dichlorobenzophenone, heptachlor epoxide, hexachlorobenzene, mirex, oxadiazon, toxaphene, PCBs
19, 29, 35, 37, 45, 46, 47, 48, 49, 50, 51, 52
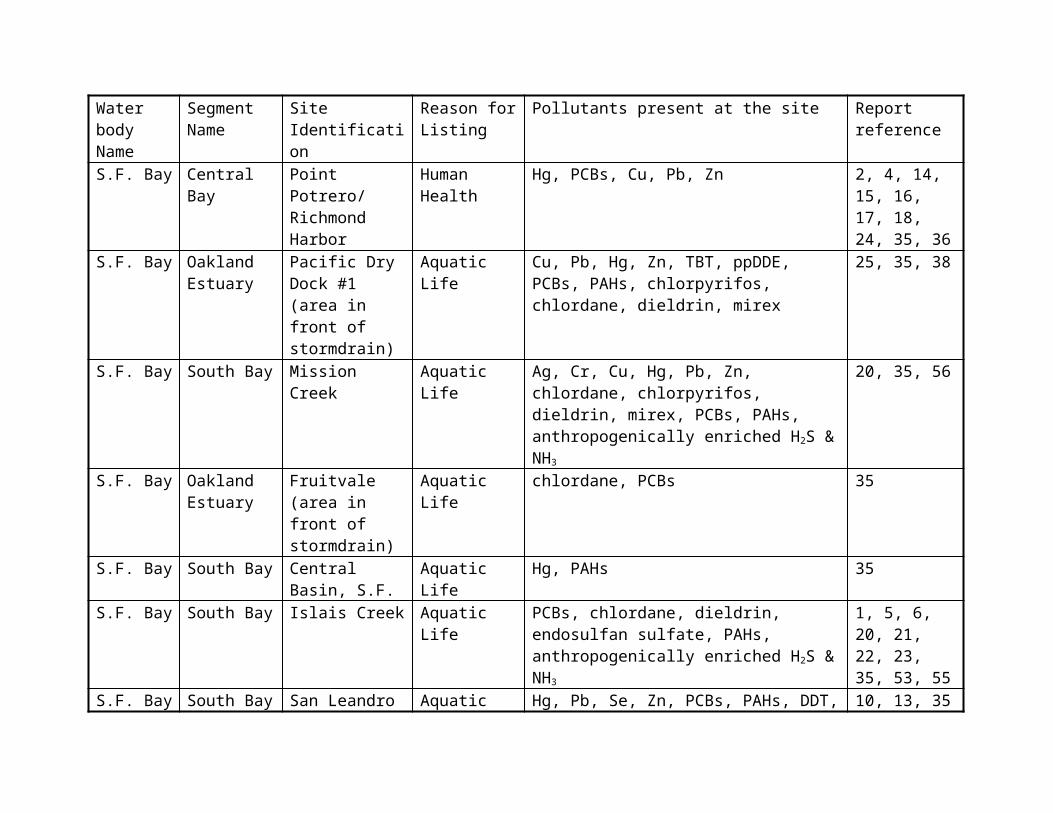
S.F. Bay Central Bay Point Potrero/ Richmond Harbor
Human Health Hg, PCBs, Cu, Pb, Zn 2, 4, 14, 15, 16, 17, 18, 24, 35, 36
S.F. Bay Oakland Estuary
Pacific Dry Dock #1 (area in front of stormdrain)
Aquatic Life Cu, Pb, Hg, Zn, TBT, ppDDE, PCBs, PAHs, chlorpyrifos, chlordane, dieldrin, mirex
25, 35, 38
S.F. Bay South Bay Mission Creek Aquatic Life Ag, Cr, Cu, Hg, Pb, Zn, chlordane, chlorpyrifos, dieldrin, mirex, PCBs, PAHs, anthropogenically enriched H2S & NH3
20, 35, 56
S.F. Bay Oakland Estuary
Fruitvale (area in front of
Aquatic Life chlordane, PCBs 35
Water body Name
Segment Name
Site Identification Reason for Listing
Pollutants present at the site Report reference
stormdrain)S.F. Bay South Bay Central Basin,
S.F.Aquatic Life Hg, PAHs 35
S.F. Bay South Bay Islais Creek Aquatic Life PCBs, chlordane, dieldrin, endosulfan sulfate, PAHs, anthropogenically enriched H2S & NH3
1, 5, 6, 20, 21, 22, 23, 35, 53, 55
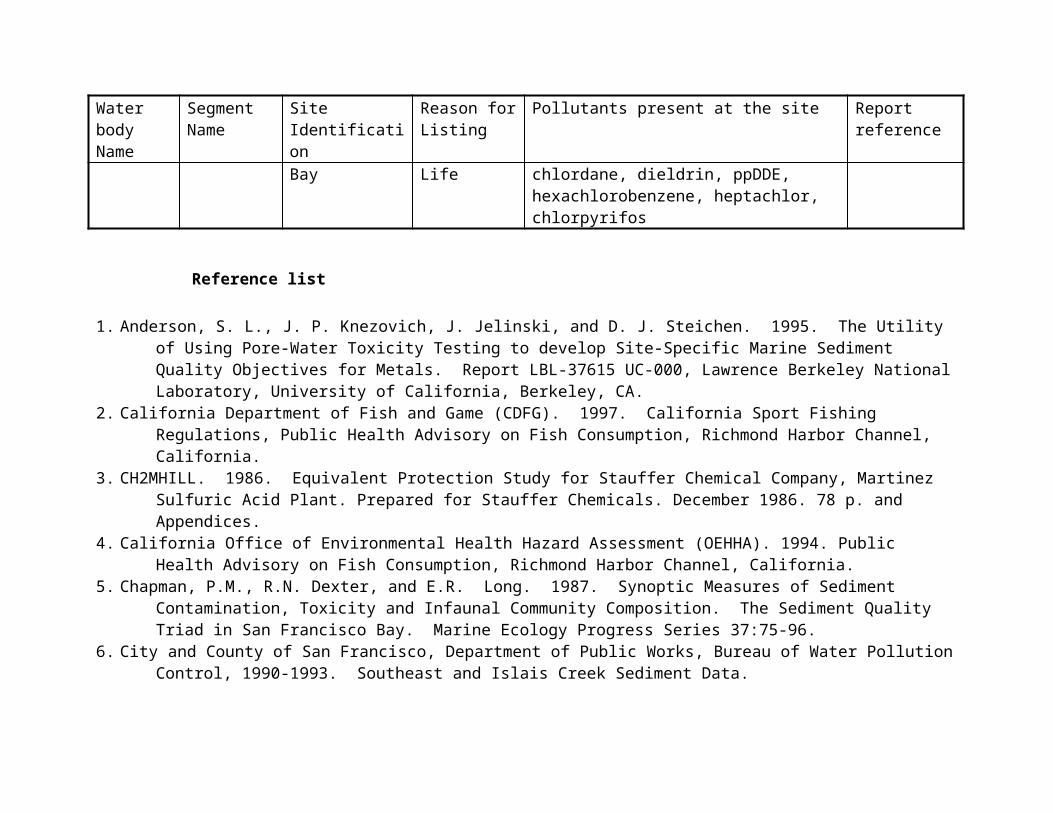
S.F. Bay South Bay San Leandro Bay Aquatic Life Hg, Pb, Se, Zn, PCBs, PAHs, DDT, chlordane, dieldrin, ppDDE, hexachlorobenzene, heptachlor, chlorpyrifos
10, 13, 35
Reference list
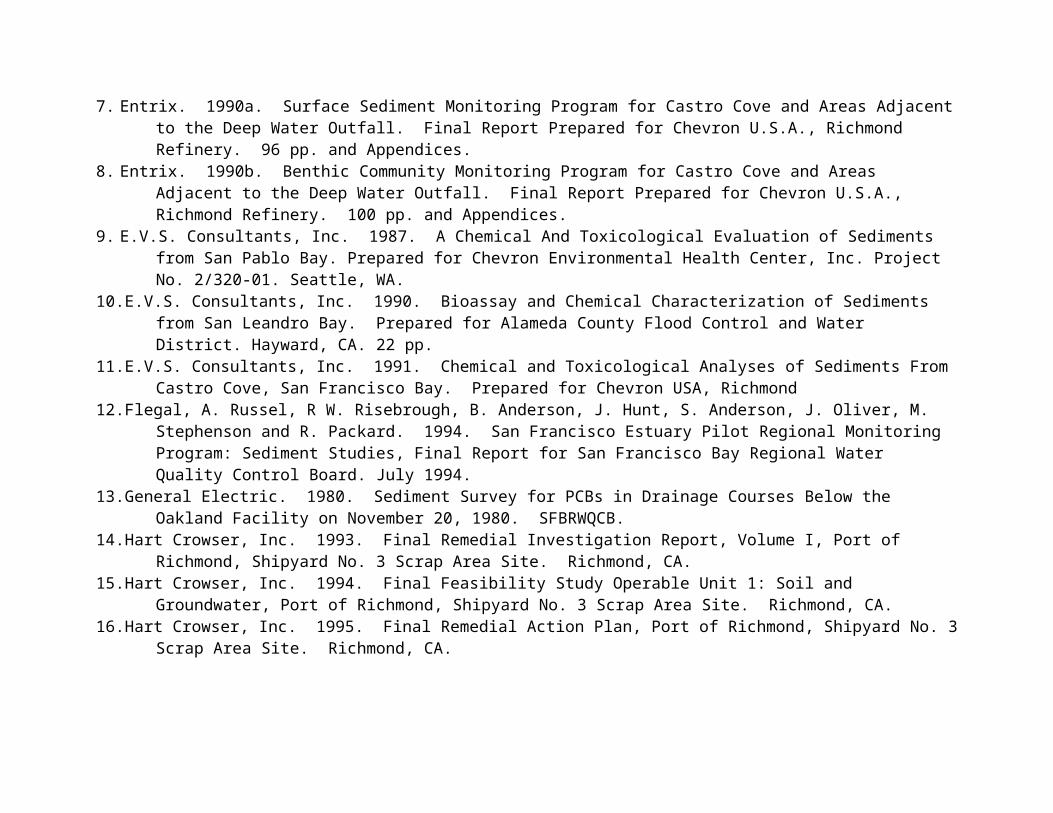
1. Anderson, S. L., J. P. Knezovich, J. Jelinski, and D. J. Steichen. 1995. The Utility of Using Pore-Water Toxicity Testing to develop Site-Specific Marine Sediment Quality Objectives for Metals. Report LBL-37615 UC-000, Lawrence Berkeley National Laboratory, University of California, Berkeley, CA.
2. California Department of Fish and Game (CDFG). 1997. California Sport Fishing Regulations, Public Health Advisory on Fish Consumption, Richmond Harbor Channel, California.
3. CH2MHILL. 1986. Equivalent Protection Study for Stauffer Chemical Company, Martinez Sulfuric Acid Plant. Prepared for Stauffer Chemicals. December 1986. 78 p. and Appendices.
4. California Office of Environmental Health Hazard Assessment (OEHHA). 1994. Public Health Advisory on Fish Consumption, Richmond Harbor Channel, California.
5. Chapman, P.M., R.N. Dexter, and E.R. Long. 1987. Synoptic Measures of Sediment Contamination, Toxicity and Infaunal Community Composition. The Sediment Quality Triad in San Francisco Bay. Marine Ecology Progress Series 37:75-96.
6. City and County of San Francisco, Department of Public Works, Bureau of Water Pollution Control, 1990-1993. Southeast and Islais Creek Sediment Data.
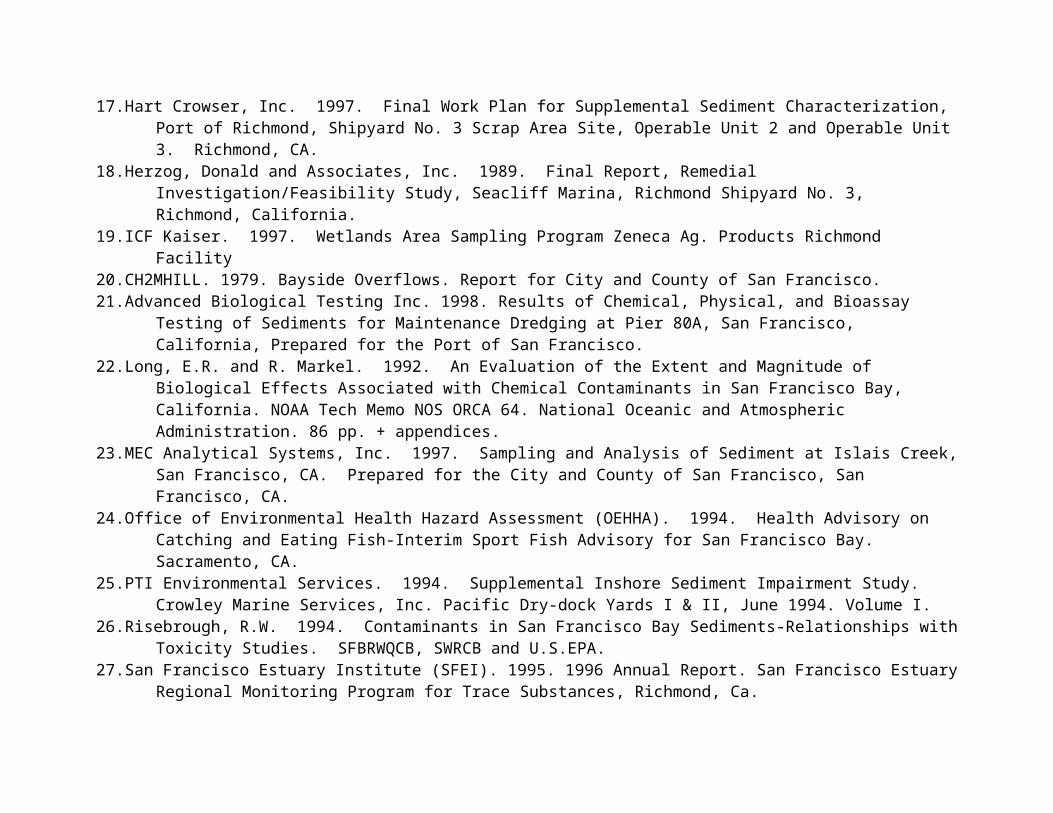
7. Entrix. 1990a. Surface Sediment Monitoring Program for Castro Cove and Areas Adjacent to the Deep Water Outfall. Final Report Prepared for Chevron U.S.A., Richmond Refinery. 96 pp. and Appendices.
8. Entrix. 1990b. Benthic Community Monitoring Program for Castro Cove and Areas Adjacent to the Deep Water Outfall. Final Report Prepared for Chevron U.S.A., Richmond Refinery. 100 pp. and Appendices.

9. E.V.S. Consultants, Inc. 1987. A Chemical And Toxicological Evaluation of Sediments from San Pablo Bay. Prepared for Chevron Environmental Health Center, Inc. Project No. 2/320-01. Seattle, WA.
10. E.V.S. Consultants, Inc. 1990. Bioassay and Chemical Characterization of Sediments from San Leandro Bay. Prepared for Alameda County Flood Control and Water District. Hayward, CA. 22 pp.
11. E.V.S. Consultants, Inc. 1991. Chemical and Toxicological Analyses of Sediments From Castro Cove, San Francisco Bay. Prepared for Chevron USA, Richmond
12. Flegal, A. Russel, R W. Risebrough, B. Anderson, J. Hunt, S. Anderson, J. Oliver, M. Stephenson and R. Packard. 1994. San Francisco Estuary Pilot Regional Monitoring Program: Sediment Studies, Final Report for San Francisco Bay Regional Water Quality Control Board. July 1994.
13. General Electric. 1980. Sediment Survey for PCBs in Drainage Courses Below the Oakland Facility on November 20, 1980. SFBRWQCB.
14. Hart Crowser, Inc. 1993. Final Remedial Investigation Report, Volume I, Port of Richmond, Shipyard No. 3 Scrap Area Site. Richmond, CA.
15. Hart Crowser, Inc. 1994. Final Feasibility Study Operable Unit 1: Soil and Groundwater, Port of Richmond, Shipyard No. 3 Scrap Area Site. Richmond, CA.
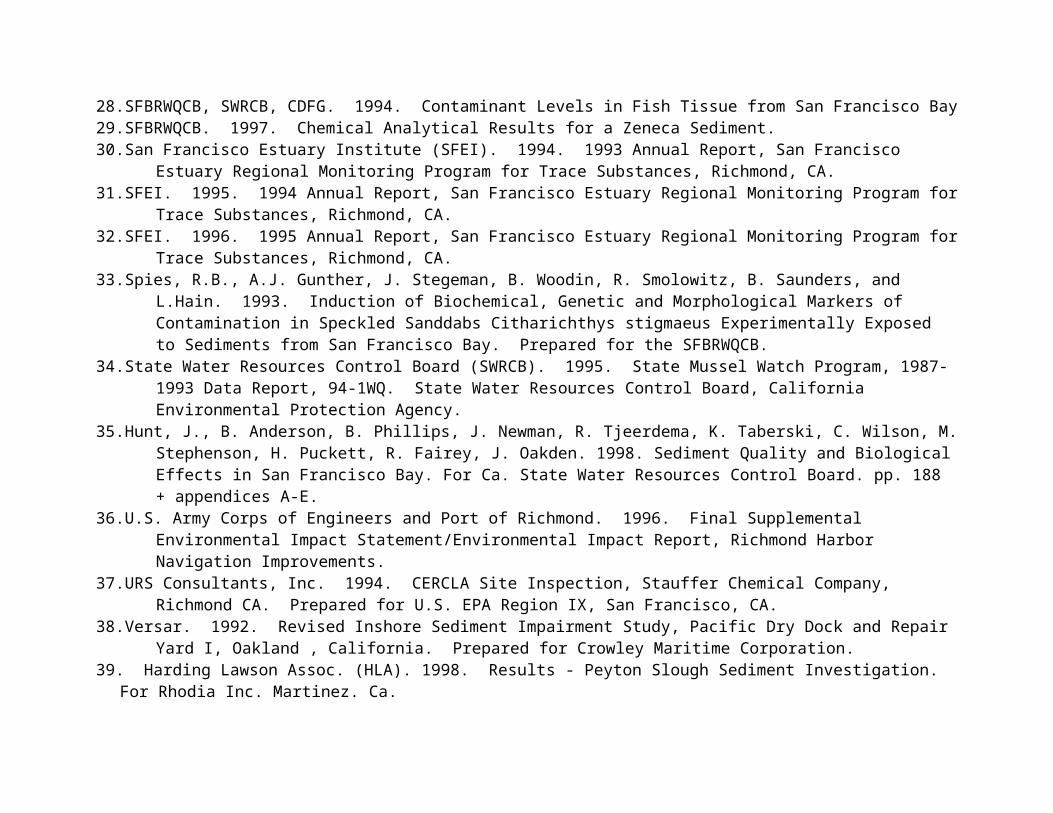
16. Hart Crowser, Inc. 1995. Final Remedial Action Plan, Port of Richmond, Shipyard No. 3 Scrap Area Site. Richmond, CA.17. Hart Crowser, Inc. 1997. Final Work Plan for Supplemental Sediment Characterization, Port of Richmond, Shipyard No. 3 Scrap
Area Site, Operable Unit 2 and Operable Unit 3. Richmond, CA.18. Herzog, Donald and Associates, Inc. 1989. Final Report, Remedial Investigation/Feasibility Study, Seacliff Marina, Richmond
Shipyard No. 3, Richmond, California.19. ICF Kaiser. 1997. Wetlands Area Sampling Program Zeneca Ag. Products Richmond Facility20. CH2MHILL. 1979. Bayside Overflows. Report for City and County of San Francisco.21. Advanced Biological Testing Inc. 1998. Results of Chemical, Physical, and Bioassay Testing of Sediments for Maintenance
Dredging at Pier 80A, San Francisco, California, Prepared for the Port of San Francisco.22. Long, E.R. and R. Markel. 1992. An Evaluation of the Extent and Magnitude of Biological Effects Associated with Chemical
Contaminants in San Francisco Bay, California. NOAA Tech Memo NOS ORCA 64. National Oceanic and Atmospheric Administration. 86 pp. + appendices.
23. MEC Analytical Systems, Inc. 1997. Sampling and Analysis of Sediment at Islais Creek, San Francisco, CA. Prepared for the City and County of San Francisco, San Francisco, CA.
24. Office of Environmental Health Hazard Assessment (OEHHA). 1994. Health Advisory on Catching and Eating Fish-Interim Sport Fish Advisory for San Francisco Bay. Sacramento, CA.
25. PTI Environmental Services. 1994. Supplemental Inshore Sediment Impairment Study. Crowley Marine Services, Inc. Pacific Dry-dock Yards I & II, June 1994. Volume I.
26. Risebrough, R.W. 1994. Contaminants in San Francisco Bay Sediments-Relationships with Toxicity Studies. SFBRWQCB, SWRCB and U.S.EPA.
27. San Francisco Estuary Institute (SFEI). 1995. 1996 Annual Report. San Francisco Estuary Regional Monitoring Program for Trace Substances, Richmond, Ca.
28. SFBRWQCB, SWRCB, CDFG. 1994. Contaminant Levels in Fish Tissue from San Francisco Bay29. SFBRWQCB. 1997. Chemical Analytical Results for a Zeneca Sediment.30. San Francisco Estuary Institute (SFEI). 1994. 1993 Annual Report, San Francisco Estuary Regional Monitoring Program for
Trace Substances, Richmond, CA.31. SFEI. 1995. 1994 Annual Report, San Francisco Estuary Regional Monitoring Program for Trace Substances, Richmond, CA.32. SFEI. 1996. 1995 Annual Report, San Francisco Estuary Regional Monitoring Program for Trace Substances, Richmond, CA.33. Spies, R.B., A.J. Gunther, J. Stegeman, B. Woodin, R. Smolowitz, B. Saunders, and L.Hain. 1993. Induction of Biochemical,
Genetic and Morphological Markers of Contamination in Speckled Sanddabs Citharichthys stigmaeus Experimentally Exposed to Sediments from San Francisco Bay. Prepared for the SFBRWQCB.
34. State Water Resources Control Board (SWRCB). 1995. State Mussel Watch Program, 1987-1993 Data Report, 94-1WQ. State Water Resources Control Board, California Environmental Protection Agency.
35. Hunt, J., B. Anderson, B. Phillips, J. Newman, R. Tjeerdema, K. Taberski, C. Wilson, M. Stephenson, H. Puckett, R. Fairey, J. Oakden. 1998. Sediment Quality and Biological Effects in San Francisco Bay. For Ca. State Water Resources Control Board. pp. 188 + appendices A-E.
36. U.S. Army Corps of Engineers and Port of Richmond. 1996. Final Supplemental Environmental Impact Statement/Environmental Impact Report, Richmond Harbor Navigation Improvements.
37. URS Consultants, Inc. 1994. CERCLA Site Inspection, Stauffer Chemical Company, Richmond CA. Prepared for U.S. EPA Region IX, San Francisco, CA.
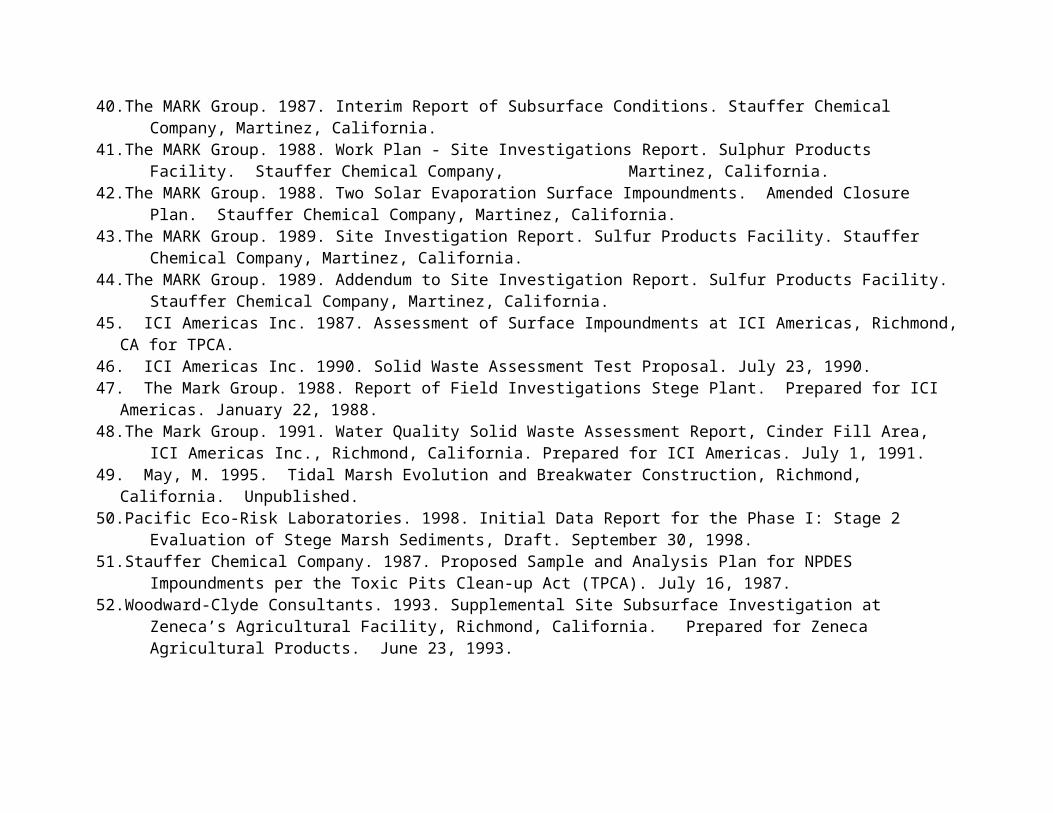
38. Versar. 1992. Revised Inshore Sediment Impairment Study, Pacific Dry Dock and Repair Yard I, Oakland , California. Prepared for Crowley Maritime Corporation.
39. Harding Lawson Assoc. (HLA). 1998. Results - Peyton Slough Sediment Investigation. For Rhodia Inc. Martinez. Ca.40. The MARK Group. 1987. Interim Report of Subsurface Conditions. Stauffer Chemical Company, Martinez, California.41. The MARK Group. 1988. Work Plan - Site Investigations Report. Sulphur Products Facility. Stauffer Chemical Company,
Martinez, California.42. The MARK Group. 1988. Two Solar Evaporation Surface Impoundments. Amended Closure Plan. Stauffer Chemical Company,
Martinez, California.43. The MARK Group. 1989. Site Investigation Report. Sulfur Products Facility. Stauffer Chemical Company, Martinez, California.44. The MARK Group. 1989. Addendum to Site Investigation Report. Sulfur Products Facility. Stauffer Chemical Company,
Martinez, California.
45. ICI Americas Inc. 1987. Assessment of Surface Impoundments at ICI Americas, Richmond, CA for TPCA.46. ICI Americas Inc. 1990. Solid Waste Assessment Test Proposal. July 23, 1990.47. The Mark Group. 1988. Report of Field Investigations Stege Plant. Prepared for ICI Americas. January 22, 1988.48. The Mark Group. 1991. Water Quality Solid Waste Assessment Report, Cinder Fill Area, ICI Americas Inc., Richmond,
California. Prepared for ICI Americas. July 1, 1991.49. May, M. 1995. Tidal Marsh Evolution and Breakwater Construction, Richmond, California. Unpublished.50. Pacific Eco-Risk Laboratories. 1998. Initial Data Report for the Phase I: Stage 2 Evaluation of Stege Marsh Sediments, Draft.
September 30, 1998.51. Stauffer Chemical Company. 1987. Proposed Sample and Analysis Plan for NPDES Impoundments per the Toxic Pits Clean-up
Act (TPCA). July 16, 1987.52. Woodward-Clyde Consultants. 1993. Supplemental Site Subsurface Investigation at Zeneca’s Agricultural Facility, Richmond,
California. Prepared for Zeneca Agricultural Products. June 23, 1993.53. Advanced Biological Testing Inc. 1998. Results of Chemical, Physical, and Bioassay Testing of Sediments for Maintenance
Dredging at Pier 80A, San Francisco, California. Prepared for the Port of San Francisco.54. Hornberger, M.I., S.N. Luoma, A. van Geen, C. Fuller, R. Anima. 1999. Historical Trends of Metals in the Sediments of San
Francisco Bay, California. Mar. Chem. 64: 39-55. 55. Hunt, J.W., B. Anderson, B. Phillips, J. Newman, R. Tjeerdema, M. Stephenson, M, Puckett, R. Fairey, R. Smith, K. Taberski.
1998. Evaluation and Use of Sediment Reference Sites and Toxicity Tests in San Francisco Bay. For Ca. State Water Resources Control Board. pp. 132. Appendix A-D.
56. S.R. Hansen & Assoc. 1996. Development and Application of Estuarine Sediment Toxicity Identification Evaluations. Prepared for San Jose State Foundation. pp. 79. Appendix A&B.
Ranking Matrix (except for San Francisco Bay sites within an overall rank are listed from north to south)
Water body Name
Site Identification Human Health Impacts 1
Aquatic Life Impacts
Water Quality Objectives
Areal Extent
Remediation Potential
Overall Rank
S.F. Bay S.F. Bay High NA NA > 10 acres Moderate HighSuisun Bay Peyton Slough High High NA 1-10 acres High HighS.F. Bay Castro Cove High High NA > 10 acres High HighS.F. Bay Stege Marsh High High NA > 10 acres High HighS.F. Bay Point Potrero/
Richmond Harbor
High Low NA 1-10 acres High High 2
S.F. Bay Mission Creek High High NA 1-10 acres High HighS.F. Bay Islais Creek High High NA 1-10 acres Moderate HighS.F. Bay Pacific Drydock High Moderate NA <1 acre High ModerateS.F. Bay Fruitvale High Moderate NA <1 acre High ModerateS.F. Bay San Leandro Bay High Moderate NA unknown 3 Moderate ModerateS.F. Bay Central Basin High Moderate NA <1 acre High Moderate
1. All sites within San Francisco Bay were ranked high in this category because a health advisory on fish consumption applies to the entire Bay and elevated levels of mercury and PCBs are found throughout the Bay.
2. This site was ranked high because it is in the area where the health advisory on fish consumption applies, the health advisory is based on PCBs and mercury and this site had the highest PCB and mercury concentrations in over 600 samples collected statewide in the BPTCP. In addition, this site ranked high in other ranking criteria.
3. A study is currently being conducted through the San Francisco Estuary Institute to define the areal extent of contamination at this site.

High Priority Candidate Toxic Hot Spot Characterization
Site A -- San Francisco Bay
Description of site/ BackgroundSan Francisco Bay is part of an estuarine system which conveys the waters of the Sacramento and San Joaquin rivers to the Pacific Ocean. This is a highly complex system that includes large brackish marshes, tidal lagoons and freshwater rivers and creeks. The diversity of these ecosystems support a wide variety of organisms. While the upper part of the estuary has been widely used for mining and agricultural activities the San Francisco Bay region has been heavily urbanized and is the site of many industrial activities and ports.
The San Francisco estuary has high concentrations of metals due to contributions from numerous sources, both natural and anthropogenic. Natural sources include drainage of water from formations that are naturally enriched in some metals, such as the Franciscan Formation that is exposed throughout the Bay area, and the rocks that make up the Sierra Nevada Mountains. This drainage flows into the streams that empty into the Bay. Localized concentrations of these metals were exploited in a great wave of mining activity from the 1820’s continuing, in some cases, into the 1970s.
Mercury was mined at numerous locations in the Coastal Range and then transported to the Sierra Nevada foothills to be used in the amalgamation of gold in placer and hydraulic mining. Drainage from natural mercury deposits, mine tailings, and directly from mining activities have had a major impact on the San Francisco Bay and estuary.
San Francisco Bay is an extremely dynamic depositional environment. Sediments flow from the major river systems and are deposited in the Bay. Strong winds and tidal currents resuspend and redeposit these sediments resulting in a system where sediments are well mixed. Bioaccumulative contaminants attach to sediments and are distributed and mixed by the same physical processes. Therefore, the sediment acts as a sink for contaminants. The sediment, however, is also a source of contaminants to organisms in the aquatic food chain and ultimately to humans.

Although the San Francisco estuary extends from the ocean up through the river systems, the jurisdiction of the San Francisco Bay RWQCB only extends to the area just west of Antioch. The Central Valley RWQCB includes the Delta and extends through the river systems. Since the health advisory on fish consumption effects both Regions, it is important that a coordinated strategy is developed, especially in regard to mercury contamination.
Reason for listingIn 1994, the BPTCP conducted a study to measure the levels of contaminants in fish in San Francisco Bay (SFBRWQCB, 1995). Results from the study indicated that six chemicals exceeded the screening levels based on U.S. EPA guidance (U.S. EPA, 1993, 1995) that were established prior to the study. These chemicals were PCBs, mercury, DDT, chlordane, dieldrin and dioxins. In response to the results of the study, the Office of Environmental Health Hazard Assessment (OEHHA) issued a health advisory on consuming fish caught in San Francisco Bay and the Delta. The health advisory was primarily based on elevated levels of PCBs and mercury in fish tissue and the human health risk related specifically to these chemicals. While, DDT, dieldrin, chlordane and dioxins were also listed as chemicals of concern as a result of exceedance of screening values, OEHHA determined that the available data was insufficient to establish an advisory based on these other four chemicals. Therefore, while the general discussion in Part B will include DDT, dieldrin, chlordane and dioxins, the remediation plan (Part D) for San Francisco Bay will focus on mercury and PCBs.
A. Assessment of the areal extent of the THS
The San Francisco Bay and Delta cover approximately 1631 square miles.
B. Assessment of the most likely sources of pollutants
MercuryMercury was mined in the Coast Range from the early 1800s through the mid-1900s. Initially most of the mercury was used in the amalgamation of gold in placer and hydraulic mining operations. Mining activity introduced mercury into the San Francisco Estuary system in a number of ways. Runoff from mercury mines within the region transported sediment rich in mercury to the Bay and estuary. In the Sierra, mercury was added to sediment to aid in the separation of gold from waste in placer and hydraulic mining operations. Most of this mercury ended up in
the aquatic system, becoming attached to sediment particles flushing downstream. The mining of gold and silver ores may also expose surrounding rock that was enriched in mercury by the same geologic processes that created the gold and silver deposits, again introducing sediment enriched in mercury to the stream systems that drain into San Francisco Bay. Ongoing drainage from these mines has introduced mercury and other metals into the streams that drain into the estuary.
Core samples of Bay sediment indicate background concentrations of mercury of 0.06 +/- 0.02 ppm dw (Hornberger et al., 1999). Superimposed upon these background levels are concentrations that reflect historic and ongoing loadings. Core samples of Bay sediment indicate that an historic gradient of contaminated sediment (up to 0.9 ppm Hg) entered the Bay from the Sacramento- San Joaquin Delta during the Gold Rush, then diffused into cleaner sediment as it moved seaward towards the Golden Gate. These core samples indicate a contaminated (0.5-0.9 ppm Hg) layer buried in the sediment, the depth of which varies from location to location, with the most concentrated levels of mercury in the upper estuary. Surficial sediments throughout the Bay system generally contain 0.3 to 0.4 ppm mercury, except in areas of the lower South Bay affected by drainage from the New Almaden mining area. Mixing between these two sediment layers is a key factor in determining the concentration of mercury in surficial sediments, the mass balance of mercury in the Bay and the rate at which concentrations can change.
The estuary, therefore, has become a sink for sediments rich in mercury and an ongoing source for the bioaccumulation of mercury up the food chain. Monitoring data from the BPTCP shows that mercury concentrations in the estuary are elevated and highly dispersed. There are a number of individual sites around the margins of the Bay where mercury concentrations higher than these generally elevated levels are found. These are usually due to past industrial practices such as the smelting of ore.
Although there is very little active mining in the San Francisco Bay drainage system, runoff from abandoned mines and mine tailings continue to be an ongoing source of mercury to the estuary. Data from the Sacramento River indicate that the Cache Creek drainage and the Sacramento drainage above the Feather River are major, ongoing sources to the lower watershed. In the southern part of San Francisco Bay, the major ongoing source is the drainage from New Almaden mining region. Other less significant sources include urban runoff, POTWs, industrial
discharges and aerial deposition. Recent pollution prevention audits indicate that human waste, water supplies, laundry waste, household products, thermometers, and waste from hospitals and dental facilities are the most significant sources to POTWs. Known industrial discharges of mercury are from raw materials used in the facilities. About half the aerial deposition appears to come from global fuel combustion and the other half from local fuel combustion.
The key environmental concern about mercury in the San Francisco Bay system is the extent to which it bioaccumulates in the food chain. Bioaccumulation, in turn, is governed by the level of methyl mercury in the aquatic environment. Methyl mercury is formed primarily by microbial activity, and only under certain physical and chemical conditions. A complex set of factors influence the rate and net production of methyl mercury by bacteria. These include chemical factors that change the oxidation state of mercury in the aquatic system; “habitat” characteristics that promote the growth of methylating bacteria such as the availability of sulfur compounds used as food and the presence of anoxic zones conducive to these bacteria; and much larger scale processes such as wind, tide, and runoff patterns that serve to mix and transport particle bound mercury throughout the estuary. Significant changes in any of these factors may potentially change the rate of mercury methylation. These processes must be better understood in order to appropriately manage environmental risks associated with the existing reservoir of mercury, as well as to regulate ongoing sources. A particular concern is to prevent the creation of environments, that is some subset of these physical and chemical factors, that may increase the rate of mercury methylation.
PCBs PCBs have also accumulated in the sediments of the estuary due to historic use. This class of chemicals is comprised of 209 compounds called congeners. Mixtures of congeners have been manufactured in the U.S. since 1929 and sold under the trade name Aroclor. These mixtures were used extensively in the U.S. prior to 1979 when their manufacture, processing, use and application was banned, except in totally enclosed applications such as transformers. PCBs were used for industrial applications requiring fluids with thermal stability, fire and oxidation resistance, and solubility in organic compounds. PCBs have proven to be extremely persistent in the environment. RMP monitoring data indicate that in the water column PCBs exceed non-promulgated U.S.EPA water quality criteria throughout the estuary. This is
most probably due to resuspension from the sediments, although ongoing sources may still contribute a significant amount of PCBs. BPTCP monitoring has shown that, except for a few areas (see Sites of Concern and Candidate Toxic Hot Spots), PCBs are fairly well mixed in the sediments of the estuary where they provide an ongoing source to organisms in the food chain.
Although the use of PCBs has been banned there are historic deposits in the sediment and on land. Point Potrero, at the Port of Richmond, had ten times the PCB concentration (19.9 ppm) of any other sample collected under this region’s BPTCP and the highest concentration of any BPTCP sample in the state. Stormwater events can mobilize PCBs deposited on land and transport them into the estuary. Recent monitoring by the RMP has shown that there seems to be current sources contributing to PCB loads in the South Bay from Coyote Creek. In addition, a recent RMP workgroup evaluating PCBs has come to the preliminary conclusion that there are probably significant ongoing sources of PCBs to the Bay. Increased monitoring is necessary to identify and cleanup any ongoing sources.
Chlorinated Pesticides Three chlorinated pesticides exceeded screening levels in the BPTCP fish study: DDTs, chlordanes and dieldrin. All three have similar properties in that they are extremely persistent in the environment and highly lipid soluble. Since these lipid soluble compounds are not easily metabolized or excreted, they are stored in fatty tissue and can readily bioaccumulate in fish tissue with high lipid content.
Although all three of these chemicals have been banned for use in the U.S. for approximately 20 years they are still commonly detected in sediments and in tissue. These compounds are dispersed in the sediments throughout the estuary. One large historic source of DDT, Lauritzen Canal in Richmond Harbor, has been recently cleaned up. Other sources may be detected through increased monitoring of stormwater.
DioxinsDioxins are released into the environment as by-products of thermal and chemical processes. These chemicals are not intentionally manufactured. Stationary sources include the incineration of municipal, hospital and chemical wastes, paper
pulp chlorine bleaching, oil refining and the manufacturing of pesticides and PCBs. Mobile sources include combustion engines in cars, buses and trucks, particularly those that use diesel fuel. Since the great majority of dioxins are emitted directly to the air, their primary source to the aquatic environment is through aerial deposition and runoff. The Bay Area Air Quality Management District has estimated that 69% of the current dioxin emissions in the Bay area is from on and off road mobile sources and 15% from residential wood burning. The San Francisco Bay RWQCB staff has estimated that greater than 90% of dioxins entering the Bay are transported by stormwater runoff or result from direct deposition from the air to the Bay.
C. Summary of actions that have been initiated by the Regional Board to reduce the accumulation of pollutants at existing THS and to prevent the creation of new THSs
MercuryThe Regional Board has developed a draft regulatory policy and program for mercury in the Region. The proposed strategy would, in the long term, reduce mercury concentrations in the estuary. It is not feasible to clean up the diffuse, historic sink of mercury in Bay sediments. Natural processes such as outflow through the Golden Gate and capping by the natural deposition of cleaner sediments may effectively isolate this mercury. Therefore, the proposed mercury strategy emphasizes the need to control all controllable sources. The two goals of the strategy are to: (1) reduce the inflow of controllable sources so that natural cleanup rates will be maximized and (2) identify human activities that may increase the rate of mercury methylation in the system and to prevent the creation of environments that may increase that rate.
To ensure that controllable sources are controlled, the strategy sets up a process to focus on the most cost-effective measures first. A preliminary evaluation indicates that the most cost-effective measures are to: (1) remediate abandoned mine sites on the western side of the Central Valley and the New Almaden district in the South Bay, (2) step up recycling programs for mercury users such as miners on the east side of the Central Valley, dentists and hospitals, (3) improve household product substitution such as laundry bleach and thermometers and (4) verify the status of the use of scrubber systems on sludge incinerators. Many permitted entities in the San Francisco and Sacramento Regions have already implemented these measures. In addition, as part of the mercury strategy, dischargers are implementing clean sampling and
analytical techniques. This will result in improved loading estimates and improve the evaluation of the most cost-effective remedial alternatives.
The RWQCB has worked with dischargers to set up programs for pollution prevention and source control of mercury and other chemicals of concern. The Palo Alto Regional Water Quality Control Plant and the City and County of San Francisco have devoted significant resources in their service areas into identifying sources of these contaminants and determining methods of decreasing loads to their facilities.
In addition to these control measures, the draft strategy includes a provision for a pilot offset program for point source dischargers. If successful, the pilot offset program would create an administrative tool that can help direct regulatory efforts toward cost-effective measures first.
The second goal of the proposed mercury strategy, to minimize the environmental risk associated with existing levels of mercury in the Bay system, requires a better understanding of the processes that control mercury methylation and the subsequent bioavailability of mercury to the food chain. This understanding is necessary in order to determine whether methylation can be managed. The proposed regional pollutant policy includes provisions for defining water quality based effluent limits for point source discharges, and a series of actions to be taken by nonpoint source control agencies and entities. These provisions may serve as a TMDL for all segments of San Francisco Bay except possibly the extreme South Bay where a separate TMDL may be developed. Adequate funding to complete both the TMDL Basin Planning process and the methylation research and management efforts has not been identified. In order to identify and cleanup mercury sources under the jurisdiction of the Central Valley RWQCB, interregional coordination is necessary. Because these sources contribute such a high proportion of the load to the estuary, control of these sources as part of the San Francisco Bay Region’s mercury strategy is essential. However, due to liability issues the State and interested private parties are limited in their ability to clean up mines in which there are no responsible parties. An amendment to the Federal Clean Water Act is needed in order to resolve this issue.In April 1998, the RWQCB completed a survey of all of the region’s abandoned mines. In total, 41 mines were surveyed and mines that had actual or potential impacts to water quality were
identified. The survey documented conditions at the mines through field inspections, photographs and chemical analyses. Five mercury mines with drainages to the San Francisco estuary were identified as having actual or potential impacts to water quality. The New Almedan mine was one of these mines and was by far the largest with the highest water quality impact. Recommendations were made for monitoring or controlling waste in these mines. The RWQCB is currently monitoring all of the North Bay tributaries to the Bay to identify areas with elevated mercury concentrations. The New Almaden mercury mine was the second largest mercury mine in the world during its operation. The mine consists of several mines: those located within Santa Clara Almaden Quicksilver Park and those located outside the Park. Those mines located within Santa Clara County Almaden Quicksilver Park are currently being remediated under CERCLA. The Department of Toxic Substances Control is the lead agency, while the RWQCB provides input on water quality issues on this project. Remediation of the mines within Santa Clara Almaden Quicksilver Park was divided into two phases: Phase 1: remediation of Hacienda Furnace Yard, and Phase 2: remediation of the rest of the Park. The Hacienda Furnace Yard was identified as the highest priority area, from a water quality perspective, of six areas in need of cleanup. In this location mine tailings were eroding directly into Los Alamitos Creek, a tributary to San Francisco Bay. Cleanup of this area began in the spring of 1996 and was completed in December 1997. Phase 2 of the project, which includes remediation of Mine Hill, San Francisco Open Cut, Enriquita Mine, San Mateo Mine, and Senator Mine was started in August 1998 and is scheduled to be completed January 1999. Mine Hill, San Francisco Open Cut and Enriquita Mine were identified as potential sources of mercury laden sediment that flow directly to Guadalupe and Almaden Reservoirs with surface runoff. Because mercury strongly binds to particulates, these reservoirs may be serving as a sink for mercury, therefore minimizing fluxes to the Bay. However, these reservoirs are currently posted with a health advisory on consuming fish because of mercury contamination.
With the completion of Phase 2 of the project, all known mine waste piles located within Santa Clara County Almaden Quicksilver Park will be either capped in place or moved to somewhere else in the Park and capped. However, other remaining sources of potential mercury contamination, i.e. those
mines located outside the Park and mercury laden sediment from the overburden natural formations within the greater watershed areas of Guadalupe and Almaden Reservoirs, are yet to be addressed.
PCBsPCBs are ubiquitous and diffuse in the sediments throughout San Francisco Bay. Although several areas have been identified that have elevated sediment concentrations (see Sites of Concern and Candidate Toxic Hot Spots), these levels do not approach sediment concentrations that have been measured in the Great Lakes or many East Coast harbors. Yet, the mass of PCBs in the estuary’s sediment and possible ongoing sources have contributed to levels in fish that are a potential threat to human health. Sites with historically elevated levels of PCBs should be evaluated for cleanup (see Cleanup Plan for Point Potrero/Richmond Harbor), however, identification and cleanup of ongoing sources is extremely important.
The RWQCB has been working with dischargers, both point and nonpoint, and the RMP to identify sources of PCBs to the estuary. An article in the 1996 RMP annual report (SFEI, 1997) indicates that ongoing sources of PCBs are discharging to the Bay. To further this evaluation a RMP workgroup has been set up to evaluate PCB data from the Bay, perform a preliminary model of loadings and come up with conclusions and recommendations for future monitoring and studies. Preliminary results indicate that there may be significant ongoing sources. Results of a 1997 RMP fish pilot study indicate that fish from Oakland Harbor have distinctly higher levels of contaminants than at other areas monitored in the Bay. This was particularly true for mercury, PCBs, DDTs and dieldrin. Additional monitoring needs to be conducted in Oakland Harbor, particularly of stormwater runoff, to identify sources of these contaminants. A study was recently conducted by SFEI, with funds from an ACL from the Port of Oakland, in San Leandro Bay, a toxic hot spot just south of Oakland Harbor. Contaminants from San Leandro Bay may accumulate in the fish from Oakland Harbor that were sampled. The purpose of the study was to identify the extent and general sources of contamination. The results of this study are not yet available.
Chlorinated PesticidesLauritzen Canal is an area in Richmond Harbor that had extremely elevated levels of DDT. This site was recently cleaned up under CERCLA. Although U.S.EPA was the lead agency, the RWQCB
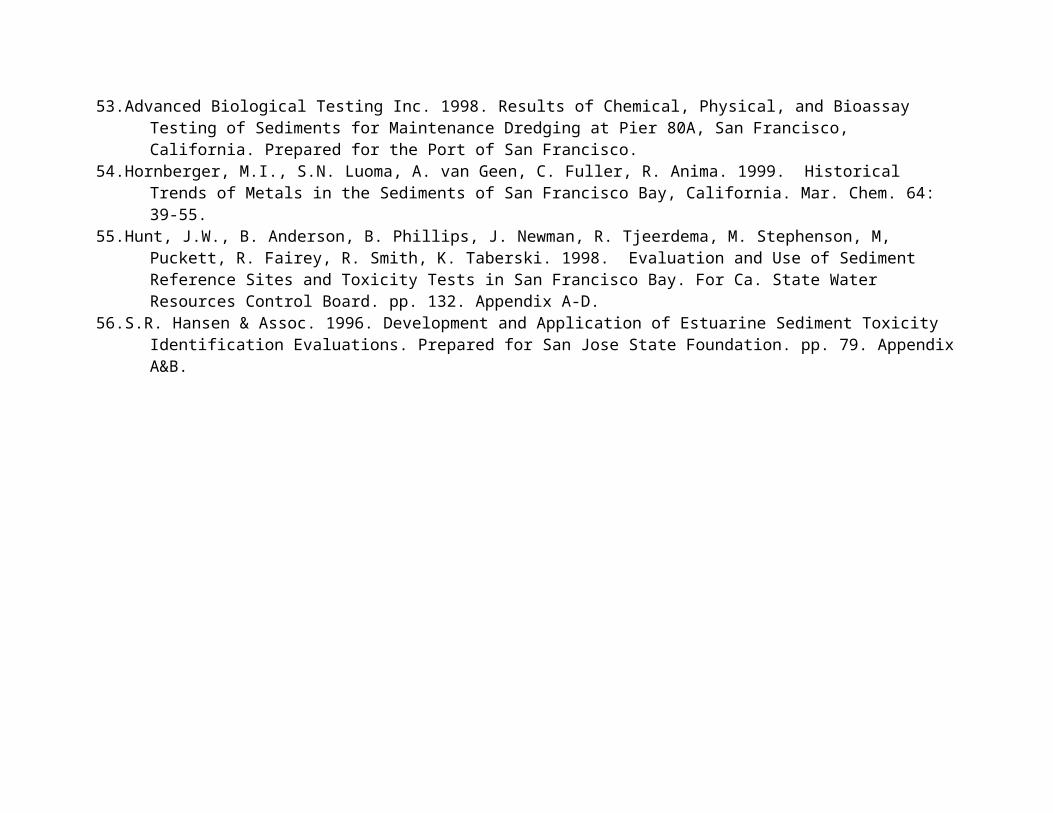
coordinated with U.S.EPA and other agencies to implement the cleanup.
As with the other chemicals previously discussed, it is important to monitor discharges (both point and nonpoint) to the estuary for the identification and cleanup of sources of chlorinated pesticides. The Regional Board is working with dischargers and the RMP to identify sources of these contaminants. However, as was discussed under Future Needs, increased resources for watershed monitoring and assessment are needed to address this issue in a significant manner.
DioxinsThe Regional Board has requested the assistance of the California Environmental Protection Agency in addressing the problem of dioxin contamination, due to the cross-media issues that are involved in identifying and controlling any ongoing dioxin sources. Coordination with the Bay Area Air Quality Management District and the State Air Resources Board is essential in addressing this issue since the predominant source of this contaminant is through aerial deposition. A meeting was held in 1997 for scientists to present information on dioxin to the Regional Water Quality Control Board. Since the majority of dioxins in the Bay Area is likely generated by fixed and mobile combustion of diesel fuel and emission into the air, regulation of point source discharges into the Bay is unlikely to have an impact on the concentration of dioxin in sediment or organisms. Since even areas removed from sources contain background levels of dioxins that are potentially harmful to humans and other organisms, and since this group of contaminants are very persistent and can be spread great distances through aerial deposition, a global strategy is truly needed. This will probably require that the U.S. EPA take the lead in cooperation with the California Environmental Protection Agency in addressing this problem including instituting any additional control measures.
Summary of actions by government agencies in response to health advisoryDue to the large reservoir of mercury and PCBs in the estuary it may take decades for contaminant levels in fish to reach acceptable levels, even with full implementation of the cleanup plan. Therefore, interim measures should be taken to: (1) determine the rate of change in chemical concentrations in fish to determine if natural processes and required cleanup measures are having an effect, and over what time scale, (2) determine the risk of consuming fish from the Bay and identify high risk populations
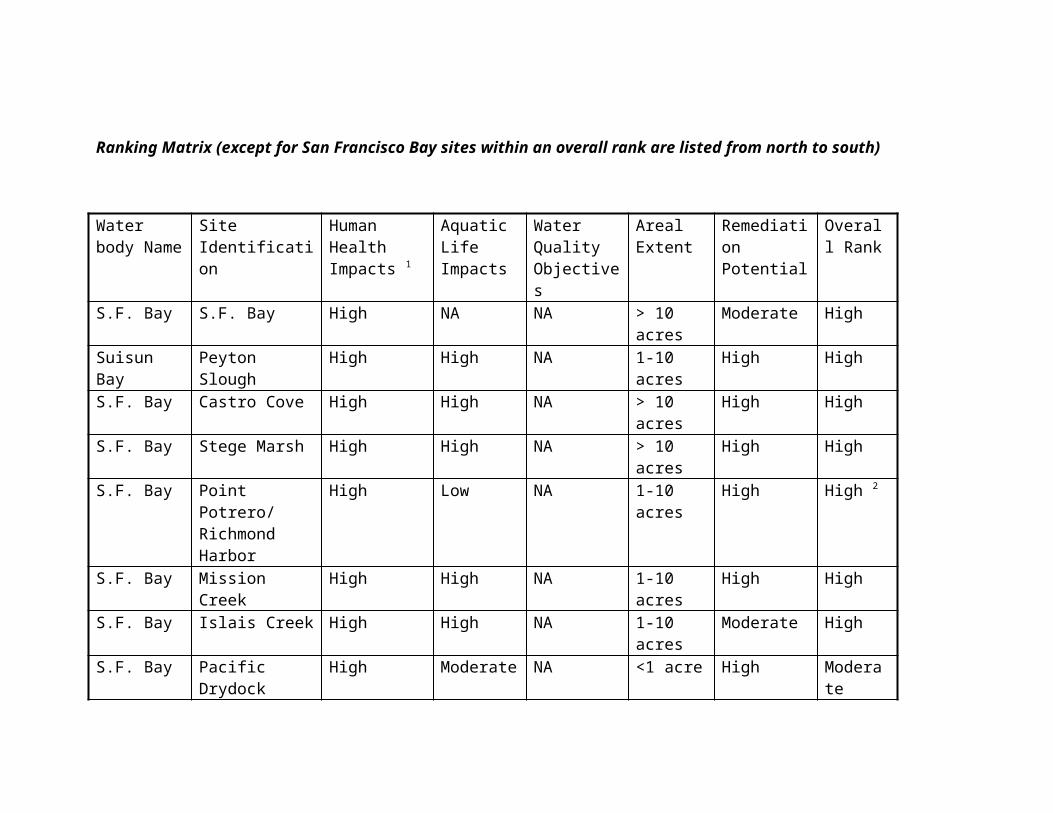
and (3) conduct public outreach and education programs, especially to high risk populations, in order to minimize their risk.
The RWQCB has been leading an effort through the RMP to conduct studies to address the first two issues. Several committees have been put together with representatives from State and Federal agencies, environmental groups and dischargers (who fund the program). A five year plan has been developed to: 1) measure contaminant levels in fish throughout the Bay every three years, 2) conduct special studies on specific species, organs or chemicals of concern and 3) conduct a consumption study to quantify the parameters that would go into a risk assessment for San Francisco Bay and to identify high risk populations for public outreach and education.
The second monitoring study of contaminant levels in fish tissue in the Bay, after the BPTCP study, was carried out through the RMP in the summer of 1997 by the Department of Fish and Game. Results will be published in the RMP’s 1997 Annual Report. A special study was conducted in the spring of 1998 to measure contaminant levels in resident clams that are collected by clammers. A special study will be conducted in the spring of 1999 to measure contaminant levels in crabs. The State Department of Health Services has been hired to conduct the consumption study and this study is currently underway.
The Department of Health Services has been chairing a committee for Public Outreach and Education on Fish Contamination. As a result, County Health Departments and the East Bay Regional Parks District have posted signs at public fishing areas in six different languages describing the advisory. Currently, the committee is developing a strategy to more effectively educate the public on this issue. This strategy, however, is limited due to the lack of funding for this effort and the fact that there is no legal mandate that requires any agency to address this issue. Environmental groups have been using various forums to educate people who eat Bay fish on how to decrease their risk, but their funding is also very limited.
D. Preliminary assessment of actions required to remedy or restore a THS to an unpolluted condition including recommendations for remedial actions
1. Finish the cleanup of the New Almaden Mine.
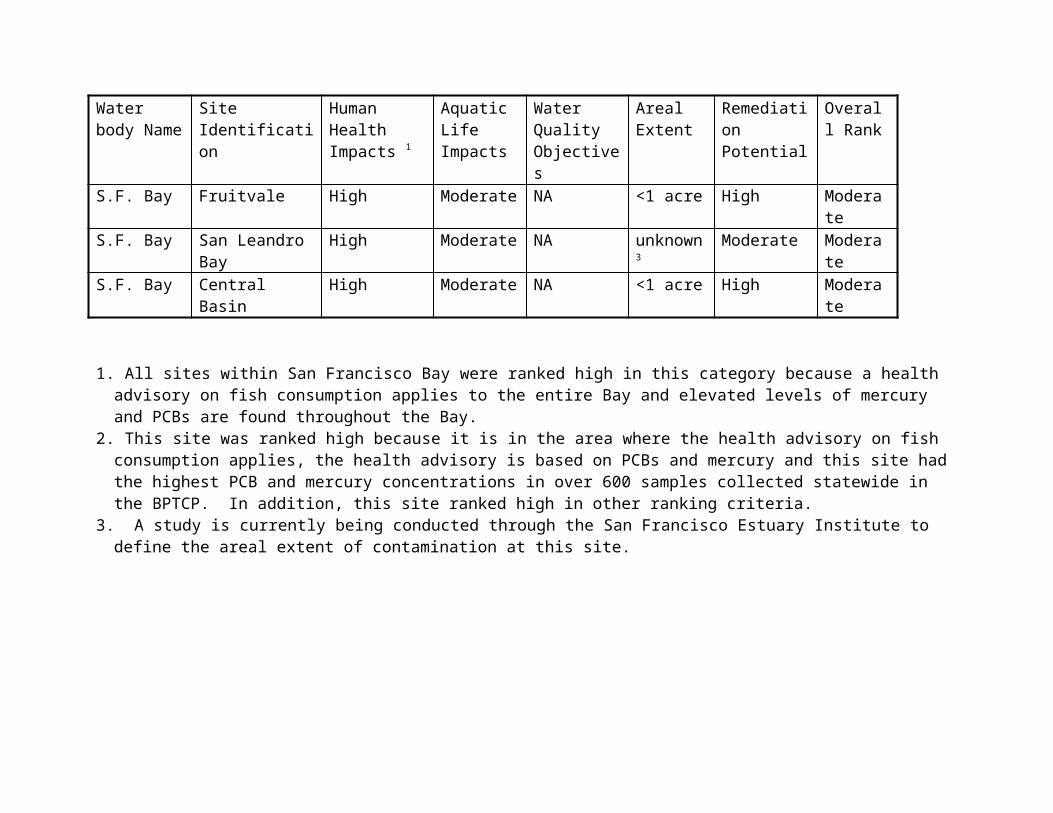
2. Clean up sediment at Point Potrero that is high in PCBs (see Cleanup Plan Site B).
3. Finalize the Basin Plan amendment process to add the proposed TMDL, pilot permit offset program, and regional requirements for ongoing mercury sources. Once adopted, implement the two main components of the Region-wide Mercury Strategy. The first component is controlling ongoing, controllable sources, thereby enhancing the natural cleanup process and accelerating mine remediation work. The second component involves developing new technical information about mercury methylation and sediment fate and transport within different zones of the estuary. This information is needed to enable the Regional Board to manage methylation and bioaccumulation to the greatest extent possible.
4. Increase investigations into ongoing sources of mercury and PCBs and develop remediation plans for those sources. This action would require an increase in watershed monitoring and assessment (see Future Needs) and in the case of mercury would require coordination with the Central Valley RWQCB. PCBs should be fingerprinted to distinguish the difference between historic and ongoing sources. Biomarker methods could be used to more inexpensively screen for PCBs. The highest priority for monitoring should be in areas where fish contain higher levels of contaminants (Oakland Harbor), areas where sources of PCBs or mercury have been identified, and areas where these chemicals are or were used or produced.
5. Continue RMP studies on fish contamination issues.
6. Increase public education to:
a. Inform people who consume San Francisco Bay fish, especially high risk populations, about the health advisory and ways to decrease their risk and,
b. Inform the public on product use and replacement in order to decrease concentrations of chemicals of concern. This could include the use of dioxin free paper, the substitution or conservation of diesel fuel, limiting the use of fireplaces and wood stoves and the substitution of mercury containing products such as thermometers.
Endangered species consultations will take place for any part of this plan for which it is required.
E. Estimate of the total cost to implement the cleanup plan
1. Cleanup of New Almaden Mine - $10 million (includes the amount already spent for cleanup, $5 million, and the additional amount expected to be needed to complete the cleanup).
2. Point Potrero cleanup - $ 800,000 - $3,000,000
3. Implement Mercury Strategy - $10-20 million
a. Finalize and implement Basin Plan amendmentb. Technical studies including:
Fate and transport of particle-bound mercury in Bay system Mercury methylation studies
4. Ongoing sources
a. Watershed investigations to identify ongoing sources of thechemicals of concern in the San Francisco Bay and Central Valley Regions - $4 million over 5 years
b. Costs of cleanup once sources are identified - Unknown
5. RMP studies (including monitoring of contaminant levels in fish every three years and special studies) - Average $75,000/year (1998-99 special studies and consumption study are already funded)
6. Public Education
a. Outreach and education to people consuming fish from the Bay to reduce their health risk (including DHS staff, translations, training and educational materials) - $150,000 for first two years then $50,000/year
b. Educational efforts on source control and product substitution - $50,000
Total to Implement Plan - Approximately $25 to $45 million (not including cleanup of ongoing sources that have not yet been identified)
Although there are costs to implementing this plan there are also benefits. Currently, beneficial uses are being impacted by high
concentrations of mercury and PCBs in San Francisco Bay that are accumulating in fish. These concentrations have lead to a human health advisory on consuming fish but probably also impact other higher trophic organisms, such as marine mammals and birds that have a much higher consumption rate than humans, as well as possibly the fish themselves. The beneficial uses that are impacted are OCEAN, COMMERCIAL AND SPORTFISHING (COMM), MARINE HABITAT (MAR), ESTUARINE HABITAT (EST), WATER CONTACT RECREATION (REC1), NONCONTACT WATER RECREATION (REC2) and probably WILDLIFE (WILD) and SHELLFISH HARVESTING (SHELL). Implementation of this plan is intended to lower concentrations of these chemicals in fish and minimize or eliminate the impacts on beneficial uses. For a more thorough description of the benefits to restoring beneficial uses see Table 1 in Volume I.
F. Estimate of recoverable costs from potential dischargers
Ongoing RMP studies are currently funded by dischargers at approximately $75,000/year. Cleanup of the New Almaden Mine in Santa Clara Almaden Quicksilver Park ($5 million) and Point Potrero ($0.8 - $3.0 million) will be paid for in full by the responsible parties. The total equals approximately $5.8 million to $8 million plus $75,000/year for RMP studies.
G. Two-year expenditure schedule identi fying funds to implement the plans that are not recoverable from potential dischargers
Although funding is available for continuation of the RMP studies and the cleanup of Point Potrero and the part of New Almaden Mine in Santa Clara Almaden Quicksilver Park there is little or no funding for the other parts of the cleanup plan.
References
Flegal, A.R., R.W. Riseborough, B. Anderson, J. Hunt, S. Anderson, J. Oliver, M. Stephenson and R. Packard. 1994. San Francisco Estuary Pilot Regional Monitoring Program: Sediment Studies. Final Report for San Francisco Bay Regional Water Quality Control Board. July, 1994.
Hornberger, M.I., S.N. Luoma, A. van Geen, C. Fuller, R. Anima. 1999. Historical Trends of Metals in the Sediments of San Francisco Bay, California. Mar. Chem. 64: 39-55.
Hunt, J., B. Anderson, B. Phillips, J. Newman, R. Tjeerdema, K. Taberski, C. Wilson, M. Stephenson, H. Puckett, R. Fairey and J. Oakden. 1998. Sediment Quality and Biological Effects in San Francisco Bay. pp.188 + Appendices A-E.
Office of Environmental Health Hazard Assessment (OEHHA). 1994. Health Advisory on Catching and Eating Fish-Interim Sport Fish Advisory for San Francisco Bay. Sacramento, CA.
San Francisco Bay Regional Water Quality Control Board (SFBRWQCB), SWRCB, CDFG. 1995. Contaminant Levels in Fish Tissue from San Francisco Bay.
SFBRWQCB. 1998. Mines Report. pp.75.
San Francisco Estuary Institute (SFEI). 1994. 1993 Annual Report, San Francisco Estuary Regional Monitoring Program for Trace Substances. Richmond, CA.
SFEI. 1995. 1994 Annual Report, San Francisco Estuary Regional Monitoring Program for Trace Substances. Richmond, CA.
SFEI. 1996. 1995 Annual Report, San Francisco Estuary Regional Monitoring Program for Trace Substances. Richmond, CA
SFEI. 1997. 1996 Annual Report, San Francisco Estuary Regional Monitoring Program for Trace Substances. Richmond, CA
U.S. EPA. 1993. Guidance for Assessing Chemical Contaminant Data for Use in Fish Advisories. Volume 1. Fish Sampling and Analysis. EPA 823-R-93-002. Office of Water. Washington, D.C.
U.S. EPA. 1995. Guidance for Assessing Chemical Contaminant Data for Use in Fish Advisories. Volume 1. Fish Sampling and Analysis. Second Edition. EPA 823-R-95-007. Office of Water. Washington, D.C.
Site B -- Peyton Slough
Description of sitePeyton Slough is located in Martinez, northern Contra Costa County, California. The slough discharges into the San Francisco estuary at the confluence of Suisun Bay and the Carquinez strait, near Bull Head Point, just east of the Benicia Bridge (Figure B-1).
Sediments in Peyton Slough are comprised of firm clays that do not appear to erode easily (CH2MHILL, 1986). Sediments from Peyton Slough appear to have been dredged in the past with the dredge spoils deposited on the east and west shore forming levees. There are openings in the east levee downstream of the tidal gate that provide exchange between Peyton Slough and a large brackish wetland to the east of the slough.
During the winter, Peyton Slough receives fresh water discharge from the Contra Costa Canal and storm water runoff from the surrounding area. During the dry weather months, Peyton Slough receives fresh water discharge primarily from a waste water treatment plant (Mountain View Sanitary District) through a tidal gate. Some minor flow from the Contra Costa Canal may also occur during the dry months. A tidal gate had been configured such that fresh water from upstream can be released when the water level is greater on the upstream side of the gate. In 1998, this tidal gate was replaced with a newer gate which will allow water to flow from the bay into a wetland area situated upstream from Peyton Slough.
Two major historical industrial activities have taken place in the vicinity of Peyton Slough on a site currently owned and operated by Rhodia: sulfuric acid production and the smelting of copper. Currently, treated waste water is discharged into Carquinez Straits via Peyton Slough by Mountain View Sanitary District. Historically, the first recorded industrial use near Peyton Slough was by the Mountain Copper Company (MOCOCO). This company used the site for a copper smelting operation from the early 1900s until 1966 at which time it was purchased by Stauffer Chemical Company. During the smelting of copper, a fused
silicate slag was generated which was discharged over the north and south sides of the hillside housing the smelter. MOCOCO also roasted pyrite ore to recover its sulfur. Resulting cinders remain on site.
Cinder and slag, classified as Class B Mining Waste, from the smelting operations were stored in large piles on the site. The north cinder/slag area covers 8.3 acres, while the south cinder/slag covers 7.1 acres. Due to their weights, the cinder and slag piles subsided 30 to 35 feet into the softer bay mud below the existing ground surface. Stauffer Chemical Company bought the site from MOCOCO and removed the cinder/slag piles to the depth of the water table, but it is estimated that over 500,000 tons of waste material remains below the surface. The remaining north and south cinder/slag piles have been capped with a minimum of two feet of low permeability soil in 1978 and 1980 respectively.
In 1972, a leachate removal and containment system (LRCS) was installed in response to a cease and desist order No. 71-21 issued by the RWQCB (The MARK Group, 1988b). The LRCS prevented leachate from moving to Carquinez Strait and Peyton Slough by a cut-off wall consisting of compacted bay mud along the bay shoreline. Prior to 1988, the leachate from the north cinder/slag area was pumped to a north solar evaporation pond. Leachate from the south cinder/slag piles was pumped from two deep sumps to the south solar evaporation pond. Starting in 1988, the Process Effluent Purification (PEP) system was installed and began treating this leachate prior to discharge to a deep water outfall. Cutoff walls were not constructed along Peyton Slough. However, to date there is no evidence that leachate is being discharged into the slough.
Currently, the Contra Costa Mosquito Vector Control District (CCMVCD) is planning a restoration project in Shell marsh. This project intends to restore the marsh south of Peyton Slough back to a brackish marsh with regular inputs of salt water from San Francisco Bay. As part of this project, the CCMVCD has replaced the tidal gate in Peyton Slough and is proposing to dredge Peyton Slough to allow for higher flows of saline water up the slough into Shell marsh. This project is partially funded by Caltrans to mitigate for discharge from Route 680 and to prevent flooding of the highway. Rhodia is also working with CCMVCD to coordinate the dredging of Peyton Slough. Regional Board staff has been helping to coordinate completion of the marsh restoration
project in order to remediate the toxic hot spot, restore Shell marsh and alleviate flooding on Route 680.
Reason for listingMultiple investigations have shown that sediments from Peyton Slough have elevated concentrations of metals, especially copper and zinc. Copper and zinc concentrations (Table B-1) in Peyton Slough were the highest from over 600 samples analyzed statewide by the BPTCP. The metal contamination can be traced to past activities at a nearby industrial site, and perhaps also to the continued presence of slag and cinder below the water table. The contaminated sediment was shown to exhibit recurrent toxicity over time to two different aquatic organisms (Table B-2), and the Toxicity Identification Evaluation (TIE) points to metals as the source of toxicity (Table B-3). In addition, although benthic community indices categorized this site as transitional, the upper and end stations rated only slightly higher than the cutoff of 0.3(Table B-4).
CH2MHILL (1986)This study was conducted to determine the chemical constituents of the effluent discharged from Stauffer Chemical Company (SCC). Since 1988, this discharge has been released to the deepwater outfall in Carquinez Strait. The potential impacts of the effluent discharge on the aquatic habitat in Peyton Slough was also analyzed. As part of this study, the following components were examined: water quality, benthic organisms, plankton and fish larvae, fish, and mussel bioaccumulation.
The mean metal concentrations in effluent were greater than the chronic marine Ambient Water Quality Criteria (AWQC) for lead and zinc and the acute AWQC for copper and zinc. Sediment metals also had elevated concentrations of copper and zinc. Although the abundance and diversity of benthic infauna varied more in Peyton Slough than in Carquinez strait, this report concluded that benthic infauna do not seem to be impacted by SCC discharge. No significant bioaccumulation of copper and zinc in mussel tissue was detected in Peyton Slough.
The MARK Group (1988a, 1988b, 1989a, 1989b)The MARK Group conducted several investigations at the former Stauffer Chemical Co. site. The studies on the cinder/slag area and the solar evaporation ponds relate to potential sources of metals released to Peyton Slough. The results of these investigations are described below.
The sludge in both solar evaporation ponds had elevated zinc concentrations. Cadmium, chromium, copper, lead and mercury were released by the WET procedure from both pond sludges at concentrations greater than the, Title 22, STLC (The MARK Group, 1988b).
The concentrations of metals were measured in both north and south cinder piles. Cinders in the north area had elevated copper and zinc concentrations of 3150 mg/kg and 6600 mg/kg respectively. Cinders from the south area had elevated copper, lead and zinc concentrations of 1580, 1030 and 1190 mg/kg respectively.
Bay Protection and Toxic Cleanup Program
Pilot Regional Monitoring Program (Flegal et al., 1994)
As part of the Pilot Regional Monitoring Program (PRMP), two marsh sediment samples were collected in Peyton Slough on July 24, 1991: one from the mouth and the other at the south end. Both samples were analyzed for chemical constituents (Table B-1). The sample from the south end of Peyton Slough had the greatest concentrations of cadmium (19.5 mg/kg), copper (2960 mg/kg), and zinc (4390 mg/kg) detected in San Francisco estuary marsh sediments as part of the PRMP. In toxicity tests, mortality of Eohaustorius estuarius for the sediment sample collected from the south end of Peyton slough was significantly higher than a home sediment from Monterey Bay (Table B-2).
Screening and Confirmation Studies (Hunt et al., 1998)
Under the Bay Protection and Toxic Cleanup Program, the RWQCB collected two screening and three confirmation samples from Peyton Slough (Figure B-1). Sampling location 21006 (1995 and 1997) is located in the upper portion of Peyton Slough. Sample location 21305 (1997) is located mid-gradient in the slough. Sample locations 21306 (1997) and 21005 (1995) are located end-gradient and at the mouth of the slough respectively.
One 1995 sample (21006) and all three 1997 samples were analyzed for chemical constituents. Table B-1 compares analytical results to ambient concentrations in San Francisco Bay and to NOAA’s Effects Range Median (ERMs) values. Elevated concentrations of cadmium, copper, lead, silver and zinc were
detected in these sediments. Copper and zinc concentrations of 7800 mg/kg and 6000 mg/kg were the highest detected in over 600 samples collected statewide in the BPTCP. Mean ERM quotients of 3.58 and 2.35 were measured in the 1995 and 1997 upper site samples (21006). Mean ERM quotients greater than 0.5 are believed to represent elevated concentrations of mixtures of chemicals.
The sediments collected at the upper portion of the site, location 21006, exhibited recurrent toxicity in the 10-day solid phase amphipod test in 1995 and 1997 (Table B-2). Toxicity to Eohaustorius estuarius was also found in the mid and end-gradient sediments (21305 and 21306) collected in 1997. Sea urchins, Strongylocentrotus purpuratus, also exhibited recurrent toxicity in porewater and sediment-water interface exposures.
Toxicity Identification Evaluations (TIEs) were performed on porewater from the upper Peyton Slough site. Reduction of toxicity was shown for the treatments that remove metals from solution, such as EDTA and STS. The evidence from the TIE results indicate that toxicity to aquatic organisms could be linked to metals such as copper and zinc, which are present at elevated concentrations in these sediments (Table B-3).
Benthic community analyses of the three confirmation samples showed transitional aquatic communities. However, at the upper and end stations, the Relative Benthic Index (RBI) was just greater than the BPTCP cutoff of 0.3 for significantly impacted benthic communities. The RBI is a calculated value considering the total fauna, total mollusk species, crustacean species and indicator species at a site. A RBI of less than or equal to 0.3 is an indicator that pollutants or other factors are negatively impacting the benthic community (Table B-4). The RBI ranges from 0 - 1.0.
Harding Lawson Associates (1998)Under direction from the RWQCB, Rhodia asked Harding Lawson Associates (HLA) to conduct a site investigation in Peyton Slough. HLA collected sediment cores of varying depths at eight sampling locations in Peyton Slough. Multiple depth intervals from each core were analyzed for selected metals. Elevated concentrations of cadmium, copper, lead and zinc were detected throughout Peyton Slough (Table B-5). In specific locations, vertical extent of contamination could not be determined as the deepest sample, 8 feet below the sediment surface, still showed elevated concentrations of one or more metals.
Table B-1. Selected Concentrations of Analytes in Peyton Slough SedimentsA BPTCP Studies (Pilot RMP and Screening/Confirmation Studies)
ANALYTE Ambient Valuesa
ERMb Sampling Location
MF22(7/24/91)
MF23(7/24/91)
21006(5/1/95)
21006(4/2/97)
21305(4/2/97)
21306(4/2/97)
METALS (mg/kg)Arsenic 15.3 70 NA NA 53.5 32.1 36.3 20.5Cadmium 0.33 9.6 19.5 0.32 27.9 19.6 2.14 0.82Chromium 112 370 124 78.5 277 127 141 76.8Copper 68.1 270 2,960 92.2 7,800 3,780 386 132Lead 43.2 218 62.6 14.2 214 1,140 63.1 23.8Mercury 0.43 0.71 NA NA 0.568 0.268 0.31 0.258Nickel 112 51.6 101 79.4 145 NA NA NASelenium 0.64 NA NA NA 2.27 0.623 1.16 0.536Silver 0.58 3.7 1.76 0.53 3.81 5.85 2.02 0.23Tin NA NA NA NA 45.2 72.7 3.84 2.95Zinc 158 410 4,390 234 6,000 4,680 741 718CHLORINATED ORGANICS (ug/kg)Chlordanes, total 1.1 NA 7.17 0.985 20.9 5.8 1.3 1.8PCBs, total 14.8 180 80.3 14.5 217 41.9 59.8 54.0DDTs, total of 6 isomers 7 46.1 22.1 3.5 95.7 23.4 16.4 19.5POLYNUCLEAR AROMATIC HYDROCARBONS (ug/kg)PAHs, total 3,390 44,792 1727 469 9,251 1,027 691 2,744High molecular weight PAHs, total 434 9,600 1,537 429 8,115 887 578 1,192Low molecular weight PAHs, total 3,060 3,160 40.9 40 1,137 140 113 1,552
a) San Francisco Bay Ambient Concentrations (SFB-RWQCB, 1998)b) NOAA Effects Range-Medium (Long et al., 1995)NA Not Available
Table B-2. BPTCP Bioassay Results for Sediments from Peyton Slough
Species End Point Medium Duration a Sampling Location
MF22(7/24/91)
MF23(7/24/91)
21005(5/1/95)
21006(5/1/95)
21006(4/2/97)
21305(4/2/97)
21306(4/2/97)
Strongylocentrotus p.
Percent normal development
100% Pore Water
96 hours NA NA 63 0* 0* NA NA
Strongylocentrotus p.
Percent normal development
50% Pore Water 96 hours NA NA 84 0* 0* NA NA
Strongylocentrotus p.
Percent normal development
25% Pore Water 96 hours NA NA 89 1* 0* NA NA
Strongylocentrotus p.
Percent normal development
Sediment-water interface
96 hours NA NA NA NA 1* 0* 81
Eohaustorius e. Percent survival Bulk sediment 10 days 60* 80 87 1* 69* 59* 14*
NA - Not Applicable - Test not performed* Samples toxic
Table B-3 Toxicity Identification Evaluation (TIE) for Upper Site Sediment Peyton Slough
Percent Normal Development Effective Treatment
TIE Treatment Porewater Concentration (%)0 3 5 15
Baseline 87 98 69 0EDTA 96 97 97 97 YesSTS 76 98 96 79 Yes
Aeration 98 85 79 0Filtration 95 72 96 94 Yes
C18 Column 95 95 100 94 YesMethanol
Eluate99 98 96 99 Yes
pH 7.9 97 45 52 0pH 8.1 97 94 84 0pH 8.4 95 96 51 0PBO 97 95 79 0
Table B-4. Community Analysis Results for Sediments from Peyton Slough BPTCP Study
Sampling Location
Station Total Individuals
Number of Species
Benthic Index
Upper (#1) 21006 250 4.3 0.36Mid (#2) 21305 1,296 7.7 0.51End (#3) 21306 29 3.0 0.34
Table B-5. Concentration of Selected metals in Peyton Slough Sediments HLA Study (1998)
Sampling Location
Sample Depth
Analyte
Cadmium Copper Lead Zinc1 0' to 1' 7 817 55 1,700
1' to 2' 8 1,610 72 2,1202' to 3' 15 3,200 54 2,5304' to 5' NA 455 NA 852
2 0' to 1' 3 278 62 1,6401' to 2' 2 501 65 1,1802' to 3' ND (1) 97 43 5813' to 5' NA 29 NA 112
3 0' to 2' 19 3,980 72 2,8302' to 3' 32 6,540 73 3,9203' to 4' 6 1,250 70 1,8605' to 6' NA 341 NA 1,330
4 0' to 3' 47 10,300 77 7,2603' to 4' 40 7,630 75 5,3004' to 5' 17 3,660 59 3,7005' to 6' NA 1,800 NA 2,760
5 0' to 4' 133 61,100 400 21,7004' to 5' 118 28,400 115 15,4005' to 6' 63 18,600 93 11,0007' to 8' NA 12,200 NA 7,130
6 0' to 2' 6 2,980 67 1,2202' to 3' 6 3,700 61 1,3003' to 4' 3 2,530 32 6675' to 6' NA 70 NA 97
7 0' to 4' 25 49,900 201 6,3600' to 2' NA 121,000 NA 7,6802' to 4' NA 6,280 NA 5,4804' to 5' ND (1) 131 ND (20) 1015' to 6' ND (1) 64 ND (20) 88
8 0' to 1' ND (1) 51 ND (20) 711' to 2' ND (1) 35 ND (20) 812' to 3' ND (1) 33 ND (20) 79
Culvert Site NA 2 245 ND (20) 52240 Pole Site NA 3 73 ND (20) 427
A. Assessment of areal extent of the THS
Elevated metal concentrations were detected from the mouth of Peyton Slough all the way to the tidal gate. Toxicity to aquatic organisms was found at all BPTCP locations, but recurrent toxicity was only measured at the upper sampling location. The areal extent of the channel is approximately 1.25 acres.
B. Assessment of the most likely sources of pollutants
The most likely source of contaminants in Peyton Slough is the historical industrial activity associated with the creation of the cinder/slag piles. Potential current subsurface transport of metals in groundwater from the buried cinder piles to Peyton Slough is not known.
C. Summary of actions that have been initiated by the Regional Board to reduce the accumulation of pollutants at existing THS and to prevent the creation of new THSs
In 1972, a leachate removal and containment system (LRCS) was installed in response to a cease and desist order No. 71-21 issued by the RWQCB (The MARK Group, 1988b). The LRCS prevented leachate from moving to Carquinez Strait and Peyton Slough by a cut-off wall consisting of compacted bay mud along the bay shoreline. Prior to 1988, the leachate from the north cinder/slag area was pumped to a north solar evaporation pond. Leachate from the south cinder/slag piles was pumped from two deep sumps to the south solar evaporation pond. Starting in 1988, the Process Effluent Purification (PEP) system was installed and began treating this leachate prior to discharge to a deep water outfall. Cut-off walls were not constructed along Peyton Slough, however, to date there is no evidence that leachate is being discharged in to the slough.
Waste Discharge Requirements for Rhodia have been regulated under the National Pollution Discharge Elimination System (NPDES) Permit No. CA 0006165 and Order 93-060 in June 1993, which was amended by order 96-033 in March 1996. Recently, the SFB-RWQCB reissued Waste Discharge Requirements, under Order No. 97-121, which rescinded previous Orders. Leachate from the onsite cinder and slag piles are mixed with the treated process waste water. Until recently, this discharge was located in the tidal section of Peyton Slough about 800 yards upstream of its confluence with
Carquinez Strait and 200 feet downstream of the tidal gate. Currently, this discharge goes to a deepwater outfall located in the Carquinez Strait. Another source of discharge from the Rhodia site originates from storm water runoff from the Caltrans I-680 and Benecia bridge, and from the western highlands drain collection system located on this property. This runoff flows via a pipeline into a usually submerged discharge point in Peyton Slough.
As part of the reissuance of Waste Discharge Requirements in Order No. 97-121, Rhone Poulenc, now Rhodia, was asked to submit a workplan, including a detailed schedule, for investigation of metal contamination in Peyton Slough sediments. The workplan has been submitted, and a site investigation is being completed. Results of this site investigation are provided in a previous section (Reason for Listing). The RWQCB has asked Rhodia to provide a remedial workplan based on these results.
Mountain View Sanitary District (MVSD) discharges an average of 1.47 million gallons per day MGD to 21 acres of intensively managed marsh ponds at a location 1,000 yards upstream of the tidal gate under NPDES Permit No. CA 0037770, Order 93-001. Wet weather flows have been approximately 3.5 MGD, with wet weather peaks of 11.1 MGD allowed. Effluent in Peyton Slough backs up onto 68 acres of wetland also managed by the discharger.
D. Preliminary assessment of actions required to remedy or restore THS to an unpolluted condition including recommendations for remedial actions
The CCMVCD Shell marsh restoration project needs to deepen Peyton Slough in order to enhance salt water flow into Shell marsh. Rhodia is currently coordinating their remediation plan for Peyton Slough with this project, and is studying the feasibility of various other activities. Dredging of contaminated sediments to three feet below needed depth and back filling with clean materials has been proposed for Peyton Slough since contamination has been shown to extend to at least 8 feet below the sediment surface. Dredging and capping with clean compatible fill seem to be the most feasible alternative since contamination is so deep and the slough is so narrow removal of all contaminated sediment would cause instability of the sidewalls. Follow-up monitoring would be required to make sure that the cap stays in place and is
effective. Contaminated sediments to be dredged are estimated at 12,000 cubic yards and will be disposed at a regulated off site landfill. An endangered species consultation with all appropriate agencies is currently in progress.
E. Estimate of the total cost to implement the cleanup plan
Based on the proposed remediation, the estimated cost is for 12,000 cubic yards of sediments to be dredged and disposed, and for a three-foot cap to be put in place in the entire slough. The range of costs are approximately $400,000 to $1,200,000 depending on the methodology followed for the cleanup, and other potential activities such as building a subsurface cut-off wall or a cap on the sidewall along the slough to control groundwater discharge. Follow-up monitoring would cost approximately $5,000 -$10,000/year. RWQCB staff costs are estimated at $10,000 to $50,000 over the entire course of the project.
Although there are costs to implementing this plan there are also benefits. Currently, beneficial uses are being impacted by high concentrations of chemicals at this site. The beneficial use that is impacted is ESTUARINE HABITAT (EST). Sediments from this site cause toxicity to test organisms and may have an impact on the benthos. Since Peyton Slough will be the main conduit of water from Carquinez Straits to the restored Shell marsh, cleanup of this site will prevent other marsh organisms from being exposed to chemicals from the slough. Implementation of this plan will minimize or eliminate this impact on the beneficial use. For a more thorough description of the benefits to restoring beneficial uses see Table 1 in Volume I.
F. Estimate of recoverable costs from potential dischargers
The responsible party or parties are accountable for all costs incurred as a result of site cleanup at Peyton Slough as well as the cost for RWQCB and other regulatory staff oversight. However, Caltrans has budgeted $300,000 toward the CCMVCD restoration project which can be partially used to defray the cost of dredging.
G. Two-year expenditure schedule identifying funds to implement the plans that are not recoverable from potential dischargers
The responsible party or parties are accountable for all costs incurred as a result of site investigations and cleanup at Peyton Slough as well as the cost of RWQCB and other regulatory staff oversight.
References
CH2MHILL. 1986. Equivalent Protection Study for Stauffer Chemical Company, Martinez Sulfuric Acid Plant. Prepared for Stauffer Chemicals. December 1986. 78 p. and Appendices.
Flegal, A. R., R. W. Risebrough, B. Anderson, J. Hunt, S. Anderson, J. Oliver, M. Stephenson and R. Packard. 1994. San Francisco Estuary Pilot Regional Monitoring Program, Sediment Studies, Final Report, July, 1994.
Harding Lawson Associates (HLA). 1998. Results-Peyton Slough Sediment Investigation-Rhodia Inc. Martinez, CA.
Hunt J.W., B.S. Anderson, J. Newman, R.S. Tjeerdema, K. Taberski, C.J. Wilson, M. Stephenson, H.M. Puckett, R. Fairey and J. Oakden. 1998. Sediment Quality and Biological Effects in San Francisco Bay. Final Technical Report. Pp. 118. Appendices A-E.
The MARK Group. 1987. Interim Report of Subsurface Conditions. Stauffer Chemical Company, Martinez, California. August 1987.
The MARK Group. 1988a. Work Plan-Site Investigations Report. Sulphur Products Facility. Stauffer Chemical Company, Martinez, California. May 1988.
The MARK Group. 1988b. Two Solar Evaporation Surface Impoundments. Amended Closure Plan.
The MARK Group. 1989a. Site Investigation Report. Sulfur Products Facility. Stauffer Chemical Company, Martinez, California. March 1989.
The MARK Group. 1989b. Addendum to Site Investigation Report. Sulfur Products Facility. Stauffer Chemical Company, Martinez, California. May 1989.
San Francisco Bay Regional Water Quality Control Board (SFBRWQCB). Ambient Concentrations of Toxic Chemicals in San Francisco Bay Sediments. May 1998.
Site C - Castro Cove
Description of siteCastro Cove is a protected embayment located in the southern portion of San Pablo Bay in Richmond, CA (Figure C-1). Castro Cove is defined as the cove enclosed by a line drawn from the Point San Pablo Yacht Club breakwater to the northwest corner of the West Contra Costa Sanitary Landfill. The embayment is protected by diked margins on the west, south and most of its eastern margin. The southeastern portion, where Castro Creek enters the cove, is a salt marsh. Castro Cove is shallow with extensive mudflats and marshlands that are subject to tidal action. Castro Creek empties into a channel that is about 30 to 75 feet wide and about three to six feet deep at mean lower low water.
Reason for listingSince studies started in 1987 for Chevron’s deep water outfall, petroleum hydrocarbons have been detected in Castro Cove. Several studies showed high levels of PAHs in the southwest portion of Castro Cove, the area where an historic outfall was located. The last surface sample collected in Castro Cove by the BPTCP, in 1995, had the highest concentration of PAHs measured in over 600 samples analyzed for PAHs statewide. The concentration of PAHs in this sample (227,800 ppb) was over four times the ERM and was collected in the top five centimeters of sediment. This was the highest concentration of PAHs ever collected at this site. Individual PAHs also exceeded ERMs. Several studies, including the BPTCP, also showed levels of mercury exceeding the ERM. In the last BPTCP sampling, chlordane was measured at levels exceeding the ERM and selenium and dieldrin were measured at elevated concentrations.
Toxicity tests have been conducted on sediments from Castro Cove on five separate occasions. Significant toxicity has been observed in several species of amphipods and in urchin and bivalve development tests during the five sampling events. The southwest portion of the cove always showed toxicity when sampled. The last samples collected by the BPTCP, in 1995, had 0% amphipod survival and 0% normal urchin development.
For three years, from 1988 to 1990, the State Mussel Watch Program deployed mussels in Castro Cove. Their results showed increasing concentrations of PAHs over these three years. In addition, the last sample collected had the second highest PAH
concentration (40,210 ppb dry weight) of any sample measured statewide in the 20 year history of the program.
The benthic community at Castro Cove has been sampled three times, in 1989, 1990 and 1991. All three sampling events identified species in Castro Cove that were indicative of stressed or frequently disturbed environments. An evaluation of the 1991 data in the 1996 RMP Annual Report categorized this site as a moderately contaminated sub-assemblage due to the presence of species indicative of stressed environments.
As part of the PRMP gradient study conducted in Castro Cove in 1991, speckled sanddabs were exposed to Castro Cove sediment in the laboratory. Results showed increasing effects with increasing PAH concentrations. The most significant effects were seen in fish exposed to sediment from the area of the old outfall. Fish exposed to sediments collected at stations in Castro Cove showed statistically significant gill histopathology. Gill histopathology was significantly correlated with PAH concentration of the sediment, as well as with P4501A content in the gills and hepatic EROD activity, both indicators of exposure to PAHs. These studies are described in more detail below.
E.V.S. investigations (1987)This study was performed in order to comply with State Order 86-4 and an NPDES permit requiring an investigation of sediment quality along a deep-water outfall. The 1987 E.V.S. study was undertaken to determine the quality of deep sediments at sites along the location of the deepwater outfall. As part of this investigation, three replicate cores from five stations in San Pablo Bay, including a reference site, were collected. Two of these stations were in Castro Cove. The three replicate cores from each station were composited and homogenized.
All five samples were analyzed for grain size, percent moisture, total organic carbon, total petroleum hydrocarbons, biochemical oxygen demand, and total and dissolved sulfides. Additionally, two sediment toxicity tests, a ten-day amphipod survival bioassay and a 48-hour suspended phase bivalve larvae development test, were performed for all five composite samples.
Figure C-1. Castro Cove
Oil and grease and petroleum hydrocarbons were detected at one location just outside Castro Cove. The results of the amphipod survival test showed lower survival rates with sediments from stations in Castro Cove. For the bivalve larvae bioassay, all five test samples had significantly lower rates of normal development than the sediment control.
Entrix Investigations (1990a, 1990b)Entrix conducted a three-year monitoring program at Castro Cove and the adjacent portions of San Pablo Bay to monitor potential changes in sediment chemistry, benthic organisms, and eelgrass chemistry after relocation of the effluent discharge. The monitoring activity results are presented in two reports (Entrix, 1990a, 1990b). Ten surface sediment locations within Castro Cove were sampled six times over a three-year period. Sediment and tissue samples were also collected at offshore and shoal locations. Sediment samples were analyzed for chemical and physical parameters, as well as for benthic organisms. Tissue samples were analyzed for metals only.
Castro Cove sediments were finer than those from Castro Creek and from San Pablo Bay. Oil and grease was detected both in Castro Cove and in offshore sediments. The greatest concentrations of oil and grease within Castro Cove were usually detected where Castro Creek enters Castro Cove. Mercury was detected at concentrations greater than the ERM in Castro Cove.
The Benthic Community Monitoring Program Report (Entrix, 1990b) presented the results of the October 1989 and May 1990 sediment sampling and analysis. In both sampling events, the number of benthic taxa was greatest in Castro Cove followed by the area around the deep water outfall diffuser. The Castro Creek sampling locations had lower numbers of benthic taxa then the Castro Cove stations. The top four species detected in Castro Cove in both surveys were the same and are considered indicators of stressed or frequently disturbed environments.
E.V.S. study (1991)This study was undertaken to complement the previous EVS study (EVS, 1987) to complete the requirements of State Order 86-4. An NPDES permit also required Chevron to monitor sediments for metals, organic compounds and benthic organisms in Castro Cove and offshore areas. Core and grab samples were collected at 11 stations within Castro Cove and at two reference locations in San Pablo Bay. The sediment analyses included physical and chemical parameters, and two toxicity tests. Physical parameters consisted
of grain size and percent solids. Chemical parameters consisted of oil and grease, total organic carbon, total sulfide, eight metals, SVOCs, phenols and organochlorine pesticides. A 10-day amphipod survival test and a 48-hour bivalve larvae development test were performed on the top 0.5-foot section of each core sample.
Most sediment samples had detected concentrations of oil and grease. Elevated concentrations of oil and grease were detected in the southwest portion, the area of the historic discharge, and at the entrance of Castro Cove. SVOCs were detected in surface sediments in the southwest of Castro Cove.
The surface sediments showed significantly decreased amphipod survival at both stations in Castro Creek and at five of nine stations in Castro Cove compared to that for reference and control sediments. Sediments from the southwest and northeast portions of Castro Cove exhibited the highest amphipod mortality. Sediments from the northeast and southern portion of Castro Cove exhibited significantly higher abnormal development in bivalves when compared to a control.
Mussel Watch Program (1988, 1990)As part of the State Mussel Watch Program, bioaccumulation of contaminants was measured in Castro Cove (SWRCB, 1995). Mussels were deployed on three separate sampling events. They were collected on January 18, 1988, December 29, 1988, and on March 21, 1990. PAHs were detected in mussel tissues at concentrations of 12,530, 24,960 and 40,210 ppb dry weight, for those respective dates. The concentration of PAHs from mussels collected on March 21, 1990 was the second highest concentration measured statewide in the 20 year history of the State Mussel Watch Program.
Bay Protection and Toxic Cleanup ProgramCastro Cove was sampled three different times under the BPTCP to determine if sediments were being naturally capped. Chemical analyses and toxicity tests were performed to determine if concentrations of contaminants or the levels of toxicity were decreasing. Samples were collected in Castro Cove under the Pilot Regional Monitoring Program, the Reference Site Study and the Screening/ Confirmation Studies.
Pilot Regional Monitoring Program (Flegal et al., 1994)As part of the PRMP, sediment quality was assessed along a contamination gradient in Castro Cove in May 1991. The gradient
study objectives were to evaluate sediment sampling, chemistry and toxicity test methods for the BPTCP and the RMP. Several different sediment toxicity tests were evaluated for a series of sampling stations for which previous studies had shown a gradient of chemical contamination. Three stations located in the southwest, middle and northeast of Castro Cove were sampled along with a reference site. The southwest station was located near the historic outfall. Shallow and subsurface sediments were collected. Subsurface sediments had a noticeable smell of petroleum hydrocarbons. The sediments were analyzed for selected trace metals, PCBs, chlorinated pesticides, and PAHs. Toxicity tests performed were a 10-day amphipod survival test and elutriate and porewater bivalve larval development tests. Some experimental tests were also performed.
All sediment samples had mean metal concentrations less than their respective ERM. In this study selenium, arsenic and mercury were not measured. The southwest sediment station, which was closest to the old outfall, had a PAH concentration greater than the ERM at depth and greater than the ERL on the surface.
In the amphipod test, all stations from Castro Cove, in both shallow and deep samples, showed toxicity when compared to control and reference sediment. However, amphipod mortality was greatest in the samples from the southwest and northeast stations. In a dilution series experiment, sediment from the southwest station had to be mixed with over 80% reference sediment in order to increase amphipod survival to acceptable levels. Porewater and elutriate tests on bivalve larvae showed no discernible trends for the shallow layers. Porewater development tests for the deep core layers indicated significant toxicity at three of the four Castro Cove sites, including the southwest station, relative to the reference site. Only the southwest station exhibited toxicity in the deep core elutriate urchin larvae development test.
The benthic infauna displayed similar number of taxa at all stations within Castro Cove with the highest diversity at the northeast location and the lowest at the southwest location. Faunal assemblages were similar for all stations, with one or two species dominant in each of the three major taxonomic groups (amphipod, crustacean and polychaete). A reevaluation of the benthic assemblages concluded that the benthic community at Castro Cove was representative of a moderately contaminated sub-assemblage due to the presence of species indicative of stressed environments (SFEI, 1996).
As part of this same study, the effects of exposure to sediments on speckled sanddabs was investigated (Spies et al., 1993). This study compared sediments from three stations in Castro Cove with reference and control samples. The results showed increased biological effects with increasing PAH concentrations in the sediments. The most significant biological effects were seen at the station closest to the historic outfall. This station also had the highest concentration of PAHs. All sediments collected at stations in Castro Cove caused slight but statistically significant alteration of gills of speckled sanddabs. Gill histopathology was significantly correlated with PAH concentration of the sediment, as well as with P4501A content in the gills and hepatic EROD activity, both indicators of exposure to PAHs.
Reference site study (Hunt et al., 1998a)Under the BPTCP’s reference site study, samples were collected in the southwest corner of Castro Cove in 1994. Ten-day amphipod survival tests were performed with two species, Ampelisca abdita and Eohaustorius estuarius. Echinoderm larvae development tests were performed on the sediment with two different exposures, porewater and sediment-water interface. In both amphipod species there was a statistically significant increase in mortality in the Castro Cove sediment as compared to reference and control sediments.
Screening/confirmation studies (Hunt et al., 1998b)Under the BPTCP’s screening/ confirmation studies, samples were collected from the top 5 cm. of sediment in southwest Castro Cove in 1995. The sediment was analyzed for chemical parameters including metals, PAHs, PCBs and pesticides. Both the 10-day amphipod survival test and the urchin development test in porewater were performed on the sediment. Grain size and total organic carbon were measured in the sample. Ammonia and hydrogen sulfide were measured at the beginning and end of the toxicity tests.
This 1995 sample had the highest total PAH concentration (227,800 ppb) of the more than 600 sediment samples analyzed for PAHs statewide in the BPTCP. This was the highest level of PAHs ever collected in sediments at this site. Mercury and chlordanes were detected at concentrations greater than the ERM. Selenium and dieldrin also had elevated concentrations. Toxicity test results showed 100% amphipod mortality and 100% abnormal development in the urchin development test.
A. Assessment of areal extent of the THS
Based on the distribution of oil and grease and PAHs, two main areas of contamination can be delineated: the south/southwest and the north/northeastern portions of Castro Cove. Similar patterns in the surface distribution of mercury are also evident. The distribution of biological effects is slightly more extensive than the chemical distribution, but overlays the spatial area delineated by detection of oil and grease and PAHs. Although horizontal extent has not been bounded, the contaminated area is estimated to range between 10 and 100 acres based on past studies and the established boundaries of Castro Cove. The depth of contamination has not been determined, but in one set of core samples the depth of visible petroleum hydrocarbons seemed to extend from the surface to approximately three feet below the sediment surface, the maximum depth of the cores.
B. Assessment of the most likely sources of pollutants
The Chevron refinery and the San Pablo Sanitary District discharged effluent directly into Castro Cove until the 1980s. Currently, the refinery and San Pablo Sanitary District discharge their waste effluent into San Pablo Bay via two separate deep-water outfalls. Contaminants may have also entered Castro Cove via Castro Creek due to urban runoff. From the turn of the century, Chevron discharged wastewater which was only treated by an oil water separator into Castro Creek up to a rate of 50 MGD. The Chevron U.S.A. refinery discharged treated effluent into Castro Cove from 1972 until 1987. San Pablo Sanitary District discharged untreated sewage into Castro Creek near the confluence with Wildcat Creek until 1955 when construction of a municipal treatment plant was completed. From 1955 to 1981, the district discharged treated effluent directly into the cove through a channel running along the southern end of the West Contra Costa Landfill. In 1981, the district relocated its outfall to a deep-water site offshore of Point Richmond. These discharges were not associated with the Chevron Refinery effluent discharges.
Based on the historical discharge of untreated waste by the Chevron refinery and the presence of petroleum related contaminants (oil and grease and PAHs), Chevron is the most likely source of the contamination in Castro Cove.
C. Summary of actions that have been initiated by the Regional Board to reduce the accumulation of pollutants at existing THS and to prevent the creation of new THSs
RWQCB actions regarding Castro Cove have been to control the sources of contamination through NPDES permitting and ACLs. All municipal and industrial point source discharges to Castro Cove were eliminated by 1987. Process effluent discharge from the Chevron refinery into Castro Cove was prohibited after July 1, 1987 under NPDES permit CA0005134, thereby eliminating the source of contaminated effluent into Castro Cove. This NPDES permit regulates discharges from the deep-water outfall. Discharges regulated by this NPDES permit include: thermal waste, cooling tower blowdown, gas scrubber blowdown from an incinerator, treated process wastewater, cooling water, and storm water. As stated previously, the San Pablo Sanitary District discharge was relocated to an offshore deep-water site which is also under permit. The City of Richmond is required by its municipal stormwater permit to implement and document the effectiveness of best management practices to reduce or prevent pollutant discharge through the city’s stormwater runoff collection system.
The RWQCB has also conducted sampling and analysis of sediments in Castro Cove as discussed in the previous section. State Order 86-4 required Chevron to evaluate the quality of the sediments in Castro Cove resulting in the Entrix and EVS studies. In June 1998, RWQCB staff requested, under section 13267 of the California Water Code, that Chevron submit a workplan and schedule for characterization of sediment contamination in Castro Cove due to sources from the refinery. Specific items that RWQCB staff requested the workplan to address included: (1) a delineation of sediment contamination gradients originating from refinery-related source areas, (2) an evaluation of the effects of the bioavailable layer of sediment on aquatic organisms by means of concurrent toxicity and chemistry testing, (3) a characterization of the vertical extent of sediment contamination in conjunction with an estimation of sediment deposition and erosion rates, and (4) an evaluation of the bioaccumulation/biomagnification potential for contaminants in the sediment.
Chevron submitted a workplan in August 1998 that proposed a tiered ecological risk assessment consisting of a new round of surficial sediment sampling and chemical analysis with subsequent comparison of the resulting chemical concentrations to established ecological benchmarks. If chemicals likely associated with

refinery releases exceed the proposed benchmarks and complete exposure pathways exist, Chevron proposed conducting a second tier risk assessment to address specific ecological concerns. This second tier may contain bioassays and a bioaccumulation/biomagnification evaluation in addition to a refined predictive risk assessment. The workplan also proposed conducting a bathymetric survey and comparing the results to a previous survey made in 1989 to evaluate sediment accretion or erosion rates in Castro Cove. RWQCB staff conditionally approved the workplan in September 1998 with the provision that additions would be made to the plan. RWQCB staff collected five core samples in Castro Cove in November 1998 to begin characterization of the vertical contaminant profile. In December 1998 Chevron took deep core samples in Castro Cove.
D. Preliminary assessment of actions required to remedy or restore THS to an unpolluted condition including recommendations for remedial actions
Corrective actions for Castro Cove sediments will require the following phases:
1. Preparation of a Sampling and Analysis Plan (SAP) in order to
delineate vertical and horizontal extent of contamination,2. Completion of a Site Investigation to complete goals of SAP,3. Preparation of a Feasibility Study (FS) based on the findings
of the Site Investigation (at a minimum the following cleanup options will be considered: natural recovery, in-place containment, dredging with various disposal options and dredging and capping),
4. Sediment clean up following option(s) selected from the FS and,
5. Follow-up monitoring to make sure that the site has been cleaned up.
An endangered species consultation with all appropriate agencies will be conducted before remediation plans are finalized.
E. Estimate of the total cost to implement the cleanup plan
The uncertainty regarding the horizontal and vertical extent of sediment contamination results in a range of potential cleanup costs. All options including natural recovery, dredging, dredging with upland disposal and capping will be considered for
remediation. The cost is estimated based on a contaminated area ranging from a minimum of 10 acres to a maximum of 100 acres. Sediments will be assumed to be contaminated to a depth of at least three feet below the sediment surface. The cost of performing a full site investigation and feasibility study is estimated at $2,000,000. The cost of remediating Castro Cove, depending on the chosen remedial alternative, and follow-up monitoring is estimated at $1,000,000 to $20,000,000. Follow-up monitoring will be required regardless of the chosen remedial alternative. RWQCB staff costs are estimated at $200,000 over the entire course of the project.
Although there are costs to implementing this plan there are also benefits. Currently, beneficial uses are being impacted by high concentrations of chemicals at this site. The beneficial use that is impacted is ESTUARINE HABITAT (EST). Implementation of this plan will minimize or eliminate this impact on the beneficial use. For a more thorough description of the benefits to restoring beneficial uses see Table 1 in Volume I.
F. Estimate of recoverable costs from potential dischargers
The responsible party or parties are accountable for all costs incurred as a result of site investigation and cleanup at Castro Cove as well as the cost for RWQCB and other regulatory staff oversight.
G. Two-year expenditure schedule identifying funds to implement the plans that are nor recoverable from potential dischargers
The responsible party or parties are accountable for all costs incurred as a result of site investigation and cleanup at Castro Cove as well as the cost for RWQCB and other regulatory staff oversight.
ReferencesCalifornia Department of Fish and Game (CDFG). 1995. State Mussel Watch Program, 1987-1993 Data Report, 94-1WQ. State Water Resources Control Board.
Entrix. 1990a. Surface Sediment Monitoring Program for Castro Cove and Areas Adjacent to the Deep Water Outfall. Final Report
Prepared for Chevron U.S.A., Richmond Refinery. 96 pp. and Appendices.
Entrix. 1990b. Benthic Community Monitoring Program for Castro Cove and Areas Adjacent to the Deep Water Outfall. Final Report Prepared for Chevron U.S.A., Richmond Refinery. 100 pp. and Appendices.
E.V.S. Consultants, Inc. 1987. A Chemical And Toxicological Evaluation of Sediments From San Pablo Bay. Prepared for Chevron Environmental Health Center, Inc. Project No. 2/320-01. Seattle, WA.
E.V.S. Consultants, Inc. 1991. Chemical and Toxicological Analyses of Sediments From Castro Cove, San Francisco Bay. Vol. 1. For Chevron USA, Richmond
Flegal, A. R., R. W. Risebrough, B. Anderson, J. Hunt, S. Anderson, J. Oliver, M. Stephenson and R. Packard. 1994. San Francisco Estuary Pilot Regional Monitoring Program,: Sediment Studies, Final Report, July, 1994.
Hunt, J., B. Anderson, B. Phillips, J. Newman, R. Tjeerdema, M. Stephenson, M. Puckett, R. Fairey, R. Smith, K. Taberski. 1998a. Evaluation and Use of Sediment Reference Sites and Toxicity Tests in San Francisco Bay. For Ca. State Water Resources Control Board. pp. 133 + Appendices A-D.
Hunt, J., B. Anderson, B. Phillips, J. Newman, R. Tjeerdema, K. Taberski, C. Wilson, M. Stephenson, H. Puckett, R. Fairey and J. Oakden. 1998b. Sediment Quality and Biological Effects in San Francisco Bay. pp.188 + Appendices A-E.
SFEI. 1996. Annual Report: San Francisco Estuary Regional Monitoring Program for Trace Substances. Prepared by the San Francisco Estuary Institute, Richmond, CA. 324 p.
Spies, R.B., A.J. Gunther, J. Stegeman, B. Woodin, R. Smolowitz, B. Saunders and L.Hain. 1993. Induction of Biochemical, Genetic and Morphological Markers of Contamination in Speckled Sanddabs Citharichthys stigmaeus Experimentally Exposed to Sediments from San Francisco Bay. Prepared for the SFBRWQCB.
Site D - Stege Marsh
Description of siteStege marsh occupies approximately 23 acres on the western margin of San Francisco Bay in the City of Richmond, California (Figure D-1). Eastern Stege marsh is located on property currently owned by Zeneca Agricultural Products. Western Stege marsh is currently owned by the University of California Richmond Field Station. The cinder landfill separates east and west Stege marsh (Figure D-1). The East Bay Parks District currently owns the land south of the historic railroad track which is now a hiking trail.
Eastern Stege marsh rests directly on the alluvial fan-deltaic deposits of Carlson Creek interspersed with Bay mud. Bedrock at the site is likely to be Franciscan Formation rocks, cretaceous and younger in age, consisting of an assemblage of marine sedimentary and volcanic, and some metamorphic rocks (The Mark Group, 1988). Western Stege Marsh is fed by Meeker Creek. Between 1947 and 1969, a railroad track was constructed just south of Stege marsh resulting in siltation and thus the extension of the tidal marsh into a previously subtidal area (May, 1995).
Stauffer Chemical Company is the prior owner of the Zeneca industrial facility and associated marsh. Stauffer Chemical Company utilized the site to roast pyrite ores for the production of sulfuric acid from about 1919 until 1963. This industrial process resulted in the production of cinders, which were placed on the site surface. Elevation at the bottom of the cinders is at mean sea level throughout the facility, which indicates past placement of cinders at ground level. The presence of a layer of peaty silt under the base of the cinders also supports that cinders were disposed of on the site surface. The cinder pile extends along the north and east sides of eastern Stege marsh (Figure D-1). The cinders were covered with a one-foot clay layer, with a permeability of 10-7 cm/sec or less, that was itself covered by a one-foot layer of topsoil to comply with RWQCB Order No. 73-12 and its 1974 amendment.
Besides pyrite cinders, other products that have been generated or utilized on the site include fuels, sulfuric acid, ferric sulfate, proprietary pesticides, solvents and alum. Until recently, Zeneca produced proprietary agricultural chemicals on the
Figure D-1. Stege Marsh
industrial portion of the site. Currently, Zeneca uses the site solely as a research laboratory. The discharges resulting from past industrial activities were treated through a series of settling, neutralization and alum mud ponds ending in two evaporation ponds situated just north of the marsh. Effluent from the evaporation ponds was discharged into the marsh southeast of the evaporation ponds (discharge 001). Another discharge (002) consists of untreated storm water from building roofs, parking lots and streets. Most of the ponds were closed in the early 1970s and replaced with new lined ponds. The discharge of stream waste to the marsh ended in the 1980s. Since then, treated effluent has been discharged from the evaporation ponds into the Richmond sanitary sewer system. Under wet weather conditions, when the city of Richmond cannot handle inflow and the holding capacity of the Zeneca Facility are exhausted, discharges to the marsh are permitted. Contaminated groundwater from the industrial portion of the site is being removed by an intercept trench, treated and discharged with the treated industrial effluent.
In western Stege marsh several explosives manufacturing companies had been in production since the 1840s. During this time various areas were used for the production of mercury fulminate, manufacturing of ammunition shells and blasting caps, and storage and testing of explosives (Jonas and Associates 1990).
Reason for listingIn 1991, URS Corporation performed a site investigation for U.S.EPA and found elevated concentrations of metals and metalloids (arsenic, copper, lead, mercury, selenium, and zinc) and organic contaminants (DDTs and PCBs) (Table D-2). A follow up sediment investigation by ICF Kaiser also found elevated concentrations of metals and metalloids (arsenic, copper, lead, and zinc) (Table D-4). Organic contaminants were not detected by ICF Kaiser, but were reported with elevated detection limits due to analytical interferences. Zeneca and the RWQCB independently analyzed a split sediment sample from the north-western section of the eastern marsh and found elevated concentrations of metals, metalloid and organic contaminants (Table D-5).
The BPTCP collected screening sediment samples at three locations: 21401 in the Richmond field station, 21402 in the north-west section of eastern Stege marsh and 21403 near outfall 002, as well as a reference sample in Carlson Creek (21404). All three marsh samples had elevated concentrations of metals, metalloids and organic compounds (Table D-6), and resulted in 100%
mortality of Eohaustorius estuarius. Locations 21401 and 21402 were resampled as part of the BPTCP confirmation sampling. Both sediment samples were toxic to Eohaustorius estuarius with 99 and 100 % mortality respectively. The Relative Benthic Indices of 0 were measured at these two sampling locations, indicating the lack of living organisms present at the time of the sampling. Stege marsh falls in the high priority toxic hot spot category due to elevated chemistry (including the highest concentrations of arsenic, selenium and several pesticides measured by the BPTCP statewide), recurrent sediment toxicity, and impairment to in-situ benthic organisms.
A summary of investigations conducted at Stege marsh is presented in the following sections.
ICI Americas Investigations (1987)In 1987, ICI Americas sampled 10 foot cores of sludge and the underlying soil in the neutralization pond, surge pond, carbon column pond, agriculture yard pond and both evaporation ponds. The sludge samples were analyzed for total and WET extractable metals. Elevated concentrations of arsenic, copper and zinc were found in samples from the two evaporation ponds. Soluble threshold limit concentrations (STLC) were also exceeded for arsenic and lead in samples from the evaporation ponds. Effluent from these two evaporation ponds was regularly discharged to the marsh in the past. Samples from other ponds had elevated concentrations of copper, lead, selenium and zinc. These samples also had detected concentrations greater than STLCs for copper and zinc. Metal contaminated soil below the sludge in the ponds may contribute to these concentrations since both soil and sludge were sampled and homogenized. Relevant analytical results are listed in Table D-1. This study indicates that the evaporation ponds may have been a source of contaminants to Stege marsh.
The Mark Group Investigations (1990, 1991)These two reports present the results of an underground site investigation of the cinder area next to Stege marsh. Hydrologic data are also reported but are not discussed in this report.
These investigations resulted in the production of cross-sections depicting the horizontal and vertical extent of the cinders in upland soils. Potential presence of cinders in the marsh was not investigated, although the presence of subsurface cinders was mapped in upland soils up to the edges of Stege marsh. Also, the chemical constituents of the cinders were not reported as part of
this site investigation. Cinders may have been and/or remain a potential source of contamination in or near Stege marsh.
URS Corporation Investigation (1991)URS Corporation performed an investigation of the chemistry of the marsh sediments in 1992 for the U.S. EPA. The relevant data obtained in this investigation are listed in Table D-2. Elevated concentrations of arsenic, copper, lead, mercury, selenium, zinc, DDTs and PCBs were detected in samples throughout Stege marsh during this investigation. Results are presented in Table D-2. This investigation indicated that Stege marsh is contaminated with multiple chemicals.
Woodward-Clyde Consultants Investigation (1993)Woodward-Clyde Consultants performed a subsurface investigation next to Stege marsh of the extent of cinders and groundwater hydrology and chemistry. Cinders were found next to the marsh, but the marsh was not investigated for the presence of cinders. Groundwater chemistry results showed low pH and elevated solution concentrations of metals and metalloids in some monitoring wells next to Stege marsh (Table D-3). This investigation suggests that subsurface transport of chemicals was and/or remains a pathway for contamination in Stege marsh.
ICF Kaiser Investigation (1997)In 1997, ICF Kaiser undertook a follow-up investigation to that by URS Corporation. Arsenic, copper, lead and zinc were again detected with elevated concentrations (Table D-4). Mercury and selenium concentrations were detected but at lower concentrations than in the URS Corp. investigation. Since chemical concentrations were reported on a wet weight basis in this study, comparisons to other analytical results and to screening guidelines are not possible. DDTs, DDEs and DDDs were not detected in sediment samples in this investigation likely due to the elevated detection limits reported for these compounds. Mercury concentrations were not as elevated as in the URS investigation, but the areas with elevated mercury concentrations were not sampled by ICF Kaiser. As with the URS Corporation investigation, contamination of Stege marsh by metals and metalloids was evident in these data.
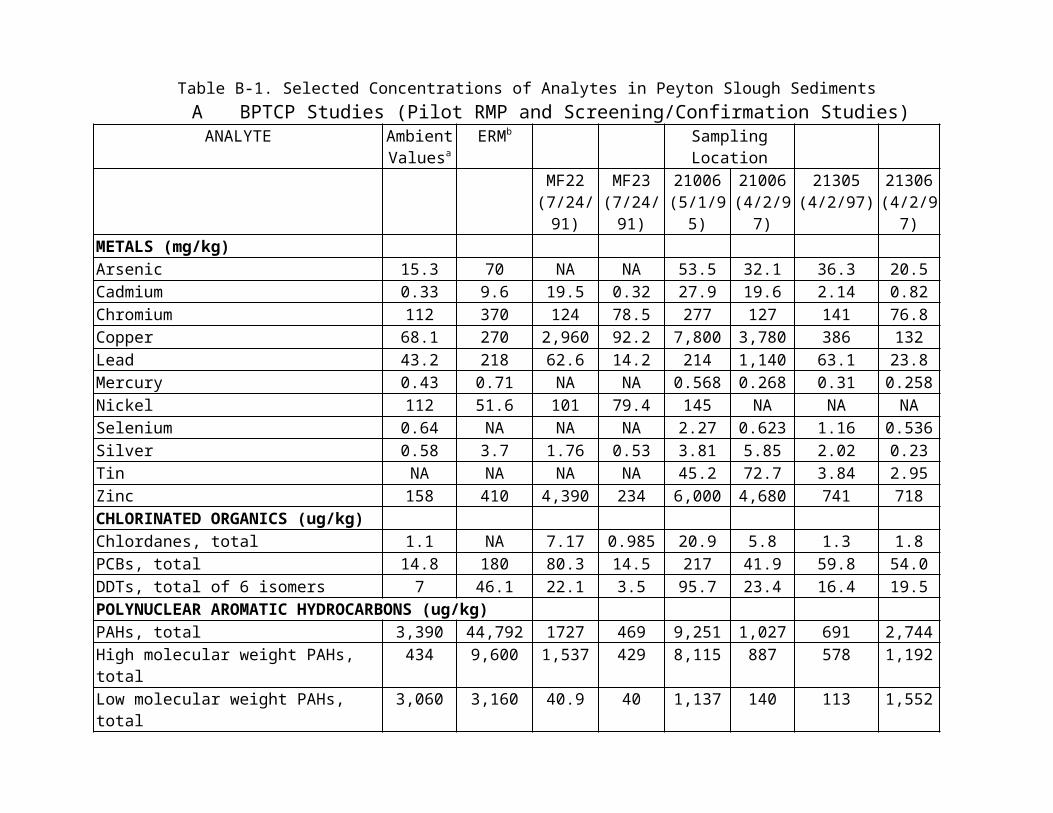
Zeneca and RWQCB sediment sample (1997)In 1997, Zeneca and SFB-RWQCB jointly collected a sediment sample in the northwest corner of Stege marsh based on a complaint received by the SFB-RWQCB of a barren area in this location. Split samples were sent to two independent laboratories for chemical analyses. Metal results show elevated concentrations of arsenic, cadmium, copper, lead, selenium and zinc. Organic compounds detected at concentrations above San Francisco Bay ambient sediment concentration include chlordanes, dieldrin, hexachlorohexanes, DDTs and PCBs. Analytical results are presented in Table D-5. Again note that the results from the Zeneca split sample are reported on a wet weight basis. Contamination of Stege marsh is evident by the elevated concentration of chemicals reported.
Bay Protection and Toxic Cleanup Program (1998)Under the Bay Protection and Toxic Clean-up Program, the RWQCB collected three screening and two confirmation samples from Stege marsh, as well as a reference sample from Carlson Creek. Sampling location 21401 is located in the Richmond field station in the vicinity of the cinder pile. Sampling location 21402 is situated in the barren portion of the Stege marsh on Zeneca property. This is in the vicinity of the SFB-RWQCB sample discussed in the previous section. Sample location 21403 is situated in Stege marsh south of evaporation pond 1 near outfall 002. Reference samples (location 21404) were also collected from Carlson Creek during both screening and confirmation sampling events.
The three screening samples were analyzed for chemical constituents. As with the URS Corp. study, elevated concentrations of arsenic, copper, mercury, selenium, zinc and DDTs were detected at concentrations much greater than both ERM and ambient concentrations (Table D-6). Arsenic and selenium concentrations were the highest measured in 544 samples collected statewide in the BPTCP. In these samples, PCBs were also detected at concentrations much greater than both ERM and ambient concentrations. Also, multiple chlorinated pesticides were detected at elevated concentrations. Dieldrin, endosulfan sulfate, mirex, oxadiazon and toxaphene were detected in Stege marsh at the highest concentrations from over 600 samples collected statewide by the BPTCP. The mean ERM quotients were 2.7 (21401), 0.61 (21402) and 2.59 (21403). Mean ERM quotients greater than 0.5 are believed to represent elevated concentrations of mixtures of chemical compounds. These chemicals are detected
at concentrations in Stege marsh that are believed to pose a threat to waters of the state.
Exposure to all three sediment samples from Stege marsh resulted in 100 percent mortality to Eohaustorius estuarius in the 10-day solid phase bioassay (Table D-7). The two confirmation samples also exhibited high mortality (99 and 100 percent) for the same bioassay. Urchin development bioassays using a sediment-water interface exposure resulted in 100 percent abnormal development for the two sediment screening samples. These results denote a significant impact of the sediments to these test species.
Benthic community analysis of the two confirmation samples from Zeneca marsh found no living individuals (Table D-8). The measured Relative Benthic Index was zero denoting the total absence of benthic organisms in these sediments. This represents a significant impact to the marsh biota.
Pacific Eco-Risk LaboratoriesIn 1998, Zeneca Agricultural performed a site investigation in sloughs and the northwest corner of eastern Stege marsh. The results showed elevated concentrations of arsenic, copper, lead, mercury, selenium and zinc in the sediments (Table D-9). Toxicity to the bivalve embryo Mytilus edulis was found at multiple locations in the sloughs and in the northwest corner of eastern Stege marsh (Table D-10). Toxicity to Eohaustorius estuarius was found at all locations sampled in Stege marsh (Table D-10). The pH of sediment and porewater samples at this site was, in general, unusually low. The pH of several highly acidic sediment and porewater samples was adjusted to a normal pH and toxicity tests were repeated. Although pH adjustment lowered the toxicity of most samples, high levels of toxicity remained in all undiluted porewater samples and in 1 out of the 2 sediment samples in which pH was successfully adjusted. In addition, there was toxicity at stations with normal pH. Low pH seems to contribute to toxicity at some stations at this site, however, it is clear that other factors play a significant role. Benthic community analyses showed decreased populations in the northwest corner of eastern Stege marsh.
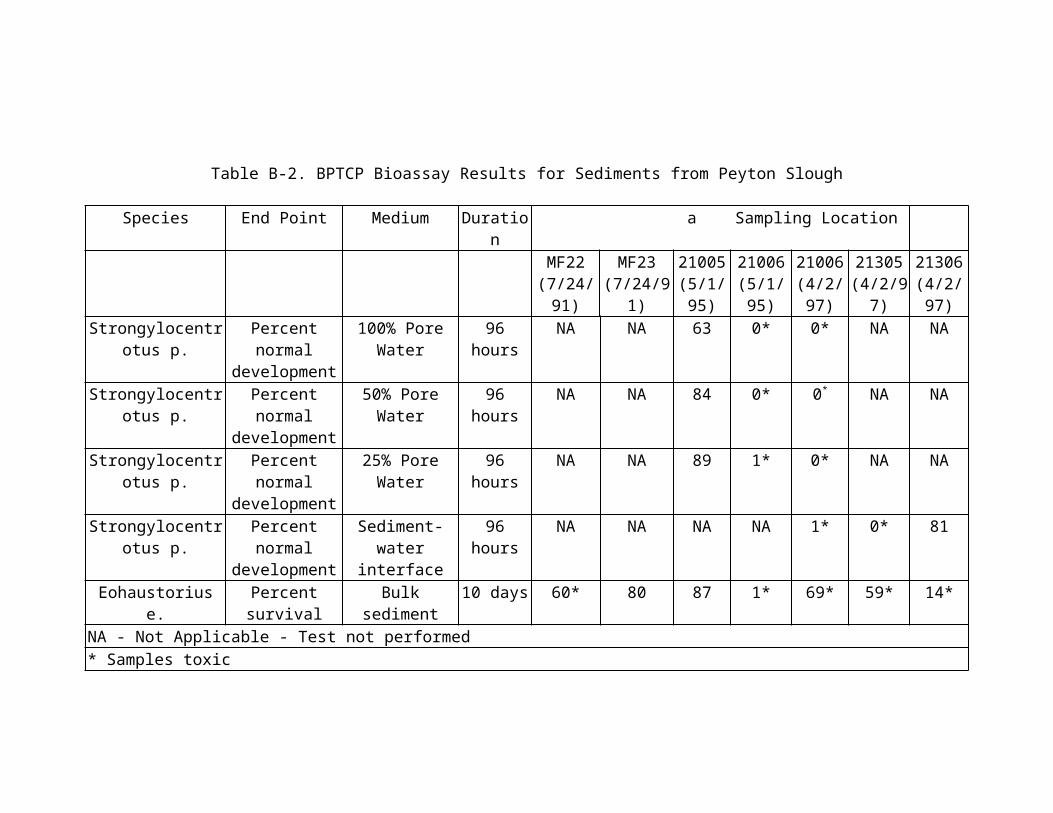
Table D-1. Selected Maximum and Total Soluble Metal Concentration in Sludges from Various Stauffer Chemical Company Field Investigations
Pond Total SolubleArsenic Copper Lead Selenium Zinc Arsenic Copper Lead Selenium Zincmg/kg dry weight mg/L
Neutralization 60 429 522 67 448 1.6 0.06 18.2 0.5 NASurge 15 456 134 24 832 NA 11.4 0.9 0.7 23Carbon Column 7.4 999 193 20 7,275 NA ND (0.04) 0.04 0.6 106Agricultural Yard 8.8 10,631 72 44 10,099 NA 600 0.2 1.1 279Evaporation 1 208 649 143 36 1,235 7.8 11 3.4 0.4 NAEvaporation 2 159 570 130 28 654 9 0.14 55 0.5 NA
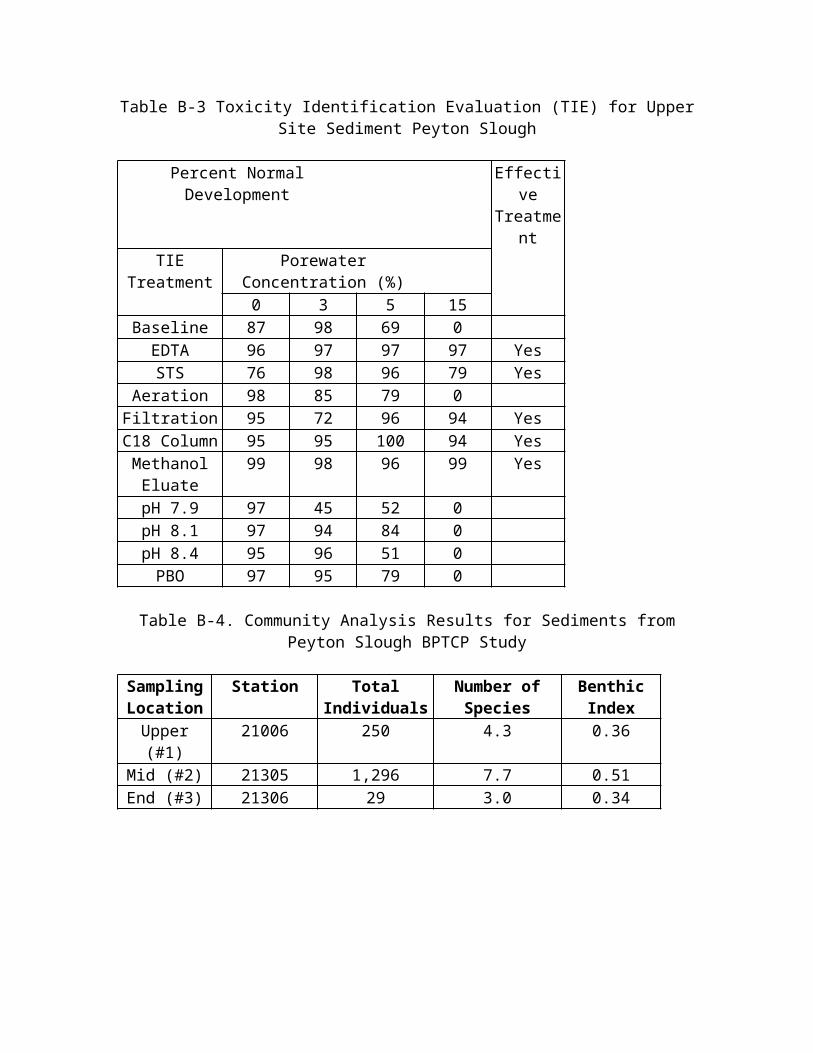
Table D-2. Selected Concentration of Analytes in Stege Marsh Sediments URS Corporation Field Investigation
Sampling Location
Analyte
Metals (mg/kg dry weight) Organics (g/kg dry weight)Arsenic Copper Lead Mercury Selenium Zinc DDTs
(total)HCH alpha
HCH beta
HCH delta
HCH gamma
PCBs total
E-1 496 315 310 10.9 60.7 957 212 57 16 ND 11 160E-2 749 239 563 5.8 124 863 521 300 66 ND 14 NDE-3 96.3 169 145 5.3 ND 215 31 ND ND ND ND 140E-4 20.3 88.7 74.8 0.89 ND 231 28 ND ND ND ND 120E-5 104 649 69.2 1.9 ND 431 294 ND ND ND ND NDE-6 20.6 ND 10 ND ND 31.6 58 200 46 70 12 NDE-7 146 34.4 54.7 0.88 ND 150 321 5 2 2 1 NDE-8 294 600 192 4.5 7.3 1,250 374 ND ND ND ND NDE-9 27.3 149 116 1.2 ND 354 147 ND ND ND ND NDE-10 1,660 189 78.4 1.6 5.7 348 311 3 9 ND ND NDE-11 177 170 55.6 0.8 ND 457 98 ND 7 ND ND NDE-12 32.1 111 75.1 0.83 ND 286 72 ND ND ND ND NDE-13 12.6 942 64.7 1.7 7.2 490 181 38 20 ND ND NDE-15 12.3 116 75.1 3 ND 296 140 ND ND ND ND NDE-16 60.1 816 84.1 1.6 4.5 440 273 ND ND ND ND NDE-17 65 87.2 157 0.88 ND 270 13 ND ND ND 0.8 NDE-20 810 1,930 210 9.3 5,490 269 ND ND 4 ND NDE-21 651 104 202 2.3 16.3 4,820 332 ND ND 39 ND ND
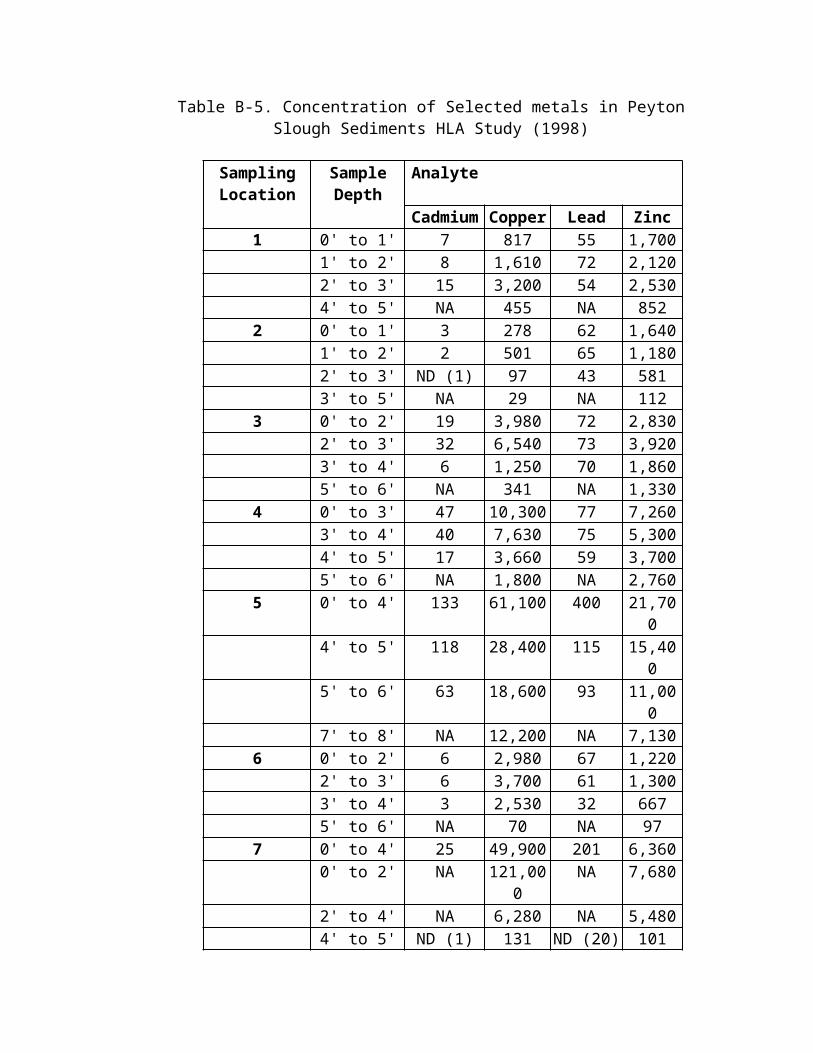
Table D-3. Selected Concentrations in Groundwater near Stege MarshWoodward-Clyde Consultants
Well Cluster
Sampling Location
Analyte
pH Sulfate Aluminum Arsenic Cadmium Copper Iron Lead Zincmg/L
A H-38 3.7 4430 109 3.91 0.127 11.6 1370 0.138 84.6H-39 6.2 2610 0.568 ND(0.006) 0.012 ND(0.033) 0.468 ND(0.001) 0.043H-59 7.3 244 7.68 ND(0.006) ND(0.011) ND(0.033) 5.26 0.001 0.023
B H-40 5.8 3190 2.33 0.085 ND(0.011) 0.039 630 ND(0.001) 0.093H-41 7.1 3080 0.849 ND(0.002) ND(0.011) ND(0.033) 0.864 ND(0.001) ND(0.022)H-42 7 2960 3.12 0.006 ND(0.011) ND(0.033) 2.23 ND(0.001) ND(0.022)
C H-46 3.6 3310 162 0.053 0.017 0.812 587 0.013 14.7H-47 4.5 2240 17.9 0.031 ND(0.011) 0.139 403 0.004 12.3H-48 6.8 3580 0.917 ND(0.006) ND(0.011) ND(0.033) 0.769 ND(0.001) 0.052
D H-49 6.2 421 3.39 0.029 ND(0.011) 0.039 21 0.006 0.142H-60 6.7 2670 0.687 ND(0.006) ND(0.011) ND(0.033) 0.409 ND(0.001) 0.401
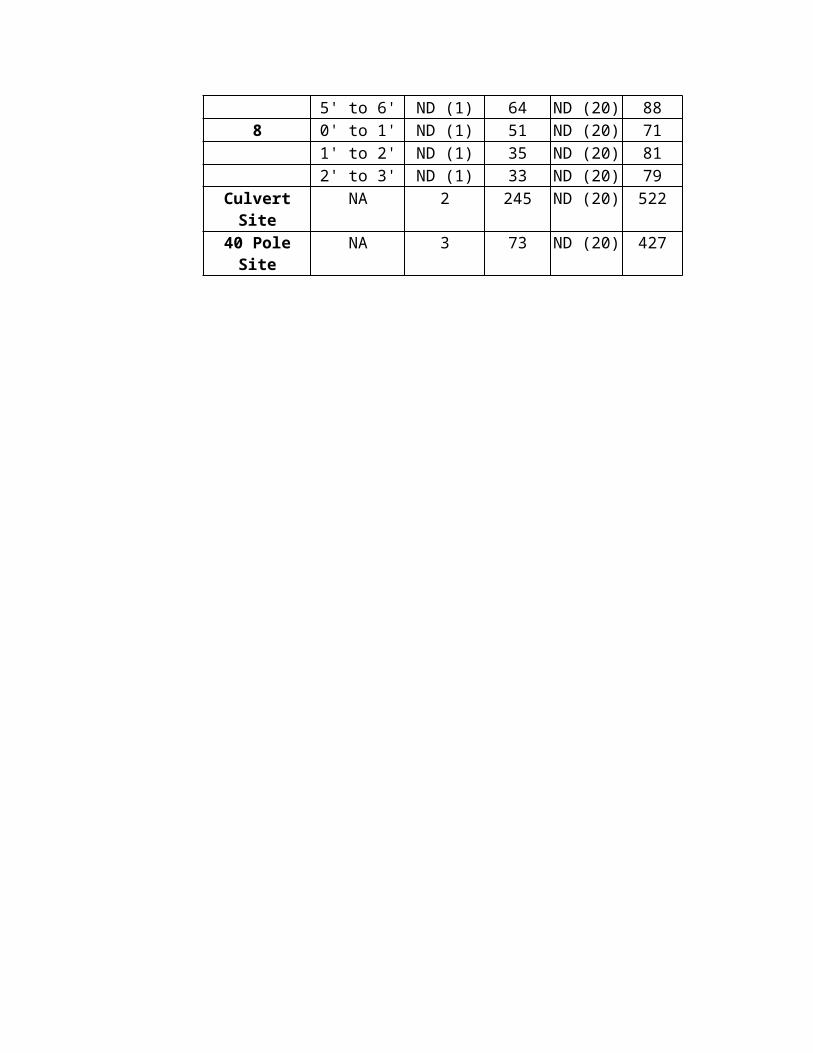
Table D-4 Selected Concentrations of Metals in Stege Marsh SedimentsICF-Kaiser Field Investigation
Sampling Location AnalyteArsenic Copper Lead Mercury Zinc
mg/kg wet weightMSM-1 26 97 72 0.69 230MSM-6 570 300 84 ND (0.44) 550MSM-8 71 300 63 ND (0.6) 1,400MSM-9 10 23 8.6 ND (0.25) 21MSM-10 400 5.7 35 0.65 50MSM-11 16 ND (1.3) 12 ND (0.24) ND (2.6)MSM-12 240 350 120 ND (0.53) 720
Table D-5. Selected Concentrations in Stege Marsh Sediment RWQCB and Zeneca Split Sample
RWQCB (dry weight)
ZENECA (wet weight)
Metals (mg/kg)
Arsenic 570 210Copper 11,000 11,000Lead 340 110
Mercury 9.1 1.5Selenium 20.0 14.0
Zinc 2,100 1,300Organics (g/kg)
Chlordane, total 165 ND (80)Dieldrin 17 ND (10)
HCH, alpha 50 30HCH, beta 40 ND (20)
HCH, gamma (Lindane) 14.0 ND (10)HCH, delta 24 ND (10)DDT, total 287 110PCBs, total 335 400
* total HCHNA-Not Available
Table D-6. Selected Concentrations of Analytes in Stege marsh SedimentsBPTCP Field Investigation
Analyte Sampling Locations ERM Ambient Concentrations
21401 21402 2140306-Oct-97 06-Oct-97 06-Oct-97
Metals (mg/kg dry weight)
Arsenic 1,140 61.8 343 70 15.3Copper 373 624 450 270 68.1Lead 180 72.2 102 218 43.2
Mercury 5.5 1.1 2.2 0.71 0.43Selenium 35.7 7.9 3.8 NA 0.64
Zinc 2,500 434 1,020 410 158Organics (g/kg dry weight)
Chlordane, total 14.6 7.1 32.3 NA 1.1Dieldrin 10.6 5.93 62.6 NA 0.44
Endosulfan Sulfate 7.0 0.9 163 NA NAHexachlorobenzene 19.9 7.5 6.0 NA 0.48
HCH, alpha 292 26.1 ND (0.1) NA 0.78*HCH, beta 56.8 9.8 ND (0.5) NA
HCH, gamma (Lindane) 8.4 6.3 ND (0.1) NAHCH, delta 99.4 14.4 0.25 NA
Mirex ND (0.25) ND (0.25) 103 NAtrans- Nonachlor 1.8 1.2 1.6 NA NA
Oxadiazon ND (1) ND (1) 114 NA NAToxaphene ND (5) ND (5) 15,700 NA NADDT, total 472 304 542 46.1 7PCBs, total 758 122 2,546 180 21.6
PAH, low molecular weight 1,468 598 583 3,160 434PAH, high molecular weight 6,734 2,508 2,123 9,600 3,060
PAH, total 8,203 3,106 2,706 44,792 3,390
* total HCHNA-Not Available
Table D-7. Bioassay Results for Sediments from Stege MarshBPTCP Field Investigation
SCREENING
Sampling Location Sampling Date 96 hr.-Sediment-Water Interface Test
10 day-Bulk sediment
Strongylocentrotus p. Eohaustorius e.Percent normal-development Percent survival
21401 06-Oct-97 0 021402 06-Oct-97 0 021403 06-Oct-97 19 021404 06-Oct-97 24 54
CONFIRMATION
Sampling Location Sampling Date 10 day-Bulk sediment
Eohaustorius e.Percent survival
21401 03-Dec-97 121402 03-Dec-97 021404 03-Dec-97 85
Table D-8. Benthic Community Analysis Results for Sediments from Stege Marsh BPTCP Field Investigation
Sampling Location
Total Individuals
Number of Species
Benthic Index
21401 0 0 021402 0 0 021404 557 18 0.51
Table D-9 Selected Concentrations of Analytes in Stege MarshPacific Eco-Risk Laboratories Field Investigation
Sampling Location
Metals (mg/kg dry weight)
Arsenic Copper Lead Mercury Selenium Zinc
SM1 33 166 93.4 1.5 ND(1) 549SM2 77 187 71.3 1.2 ND(1) 582SM3 60 254 102 1.9 2 721SM4 91 292 106 2.4 4 1,030SM5 124 309 111 2 3 1,170SM6 260 483 232 10.9 25 1,240SM7 62.1 131 45.4 0.6 3 681SM8 47 75 15.7 0.3 4 864SM9 38 109 64.7 1 ND(1) 432SM10 170 536 152 2.4 6 1,260SX1 45 723 35.5 0.8 8 2,510SX2 24 20 3.4 ND(0.2) ND(1) 201SX3 214 24 6.1 ND(0.2) ND(1) 1,330SX4 56 50 9.4 ND(0.2) 3 1,340SX5 31 84 8.3 ND(0.2) 4 2,070
Table D-10 Selected Toxicity Results for Sediments from Stege Marsh Pacific Eco-Risk Laboratories Field Investigation
Sampling Location
Sediment Porewater Test (100%)
Bulk Sediment Test Sediment Water Interface Test
Mytilus e. Eohaustorius e. Atherinops a.Percent Normal
DevelopmentPercent Survival Percent Hatchability
SM1 90 0 100SM2 NR 0 NRSM3 96.8 0 22SM4 NR 0 NRSM5 19.2 0 18SM6 90.9 0 84SM7 1 0 76SM8 0 0 0SM9 66.8 1.2 98SM10 0 15 90SX1 0 0 0SX2 NR NR NRSX3 NR NR NRSX4 0 0 0SX5 NR NR NR
A. Assessment of areal extent of the THS
Based on the distribution of elevated concentrations of metals, metalloids and organic compounds, three areas of contamination can be seen. The first is near evaporation pond 1 and outfall 2. This area has elevated concentrations of arsenic, mercury, zinc and DDTs. The second area is in the north-west corner of eastern Stege marsh and is characterized by low pH measurements, elevated concentrations of arsenic, copper, zinc and DDTs, aquatic toxicity, and is devoid of benthic organisms. The third area is located in the U.C. Richmond Field Station. This location is characterized by elevated concentrations of arsenic, mercury, selenium, zinc, DDTs and aquatic toxicity, and is devoid of benthic organisms. Further study may show that these areas are continuous rather than discrete. Regardless, the areal extent of the
THS is greater than 10 acres. The entire marsh encompasses an area of 23 acres.
B. Assessment of the most likely sources of pollutants
Oxidation of pyrite cinders in the presence of sulfides is the most likely source of the low pH at the site. Leaching of metal at this low pH is a probable source of toxicity. Subsurface transport of metals from upland cinders may also be a source of contaminants to Stege marsh. Effluent discharge from the two evaporation ponds is also a likely source of contaminants to Stege marsh. Contaminants may have also entered Stege marsh via Carlson or Meeker Creeks in urban runoff or from upland industrial facilities. In western Stege marsh munitions manufacturing is a possible source.
C. Summary of actions that have been initiated by the Regional Board to reduce the accumulation of pollutants at existing THS and to prevent the creation of new THSs
RWQCB actions regarding Stege marsh have been to control the sources of contamination through NPDES permitting. NPDES permit No. CA0006157 (Order No. 95-008) requires that wastewater from the evaporation ponds be discharged into the City of Richmond sanitary sewer. Discharge to Stege marsh is only allowed during storm events when the sanitary sewer capacity and on-site storage capacity have been exhausted. A prior NPDES permit requested that the cinders be capped and that an interceptor trench be built to limit discharges from the pyrite cinders.
Other actions by the RWQCB have included a request to Zeneca Agricultural products for sampling and analyses of sediments. In December 1996, the RWQCB requested, under section 13267 of the California Water Code, that Zeneca Agricultural Products perform sediment studies in order to propose a conceptual site model to evaluate potential impacts of contaminants including ecological and human health impacts. The studies by ICF Kaiser and Pacific Eco-Risk Laboratories were in response to this request. However, these studies are just the beginning of studies that will be required to develop a full conceptual site model.
D. Preliminary assessment of actions required to remedy or restore THS to an unpolluted condition including recommendations for remedial actions
1. Completion of a Sampling and Analysis Plan (SAP) in order to finish delineating vertical and horizontal extent of contamination (in progress);
2. Completion of a Site Investigation to complete goals of SAP including development of a conceptual site model and ecological and human health risk assessments (in progress);
3. Preparation of a Feasibility Study (FS) based on the findings of the Site Investigation (at a minimum the following cleanup options will be considered: natural recovery, in-place containment, dredging with various disposal options, and dredging and capping);
4. Sediment clean up following option(s) selected from the FS and,
5. Follow-up monitoring to ensure that the site has been cleaned up to agreed levels.
An endangered species consultation with all appropriate agencies will be conducted before remediation plans are finalized.
E. Estimate of the total cost to implement the cleanup plan
The uncertainty regarding the horizontal and vertical extent of sediment contamination, the potentially varied nature of the sources of contamination and the cleanup options results in a range of potential clean-up costs. The cost is estimated based on a minimum of 10 acres and a maximum of 23 acres being remediated. The estimated range of costs are $1,500,000 to $10,000,000 depending on the range of clean-up options selected and the areal extent remediated. RWQCB staff costs are estimated at $100,000 to $200,000 over the entire course of the project.
Although there are costs to implementing this plan there are also benefits. Currently, beneficial uses are being impacted by high concentrations of chemicals at this site. The beneficial use that is impacted is ESTUARINE HABITAT (EST) at a minimum. Due to high concentrations of bioaccumulative compounds, such as selenium, WILDLIFE HABITAT (WILD) and PRESERVATION OF RARE AND ENDANGERED SPECIES (RARE) may also be impacted. Implementation of this plan will minimize or eliminate these impacts on beneficial uses. For a more thorough description of the benefits to restoring beneficial uses see Table 1, Volume I.
F. Estimate of recoverable costs from potential dischargers
The responsible party or parties are accountable for all costs incurred as a result of site investigation and cleanup at Stege marsh as well as the cost for RWQCB and other regulatory staff oversight.
G. Two-year expenditure schedule identifying funds to implement the plans that are not recoverable from potential dischargers
The responsible party or parties are accountable for all costs incurred as a result of site investigation and cleanup at Stege marsh as well as the cost for RWQCB and other regulatory staff oversight.
ReferencesHunt J.W., B.S. Anderson, J. Newman, R.S. Tjeerdema, K. Taberski, C.J. Wilson, M. Stephenson, H.M. Puckett, R. Fairey and J. Oakden. 1998. Sediment Quality and Biological Effects in San Francisco Bay. Final Technical Report. Pp. 118. Appendix A-E.
ICF Kaiser. 1997. Wetlands Area Sampling Program, Zeneca Ag Products, Richmond Facility. November 1997.ICI Americas Inc. 1987. Assessment of Surface Impoundments at ICI Americas, Richmond, CA for TPCA. November 2, 1987.
ICI Americas Inc. 1990. Solid Waste Assessment Test Proposal. July 23, 1990.
Jonas and Associates. 1990. Sampling and Analysis Report. Richmond Field Station. Report submitted to University of California, Richmond Field Station.
The Mark Group. 1988. Report of Field Investigations Stege Plant. Prepared for ICI Americas. January 22, 1988.
The Mark Group. 1991. Water Quality Solid Waste Assessment Test Report, Cinder Fill Area, ICI Americas Inc., Richmond, California. Prepared for ICI Americas. July 1, 1991.
May, M. 1995. Tidal Marsh Evolution and Breakwater Construction, Richmond, California. Unpublished.
Pacific Eco-Risk Laboratories. 1998. Initial Data Report for the Phase I: Stage 2 Evaluation of Stege Marsh Sediments, Draft. September 30, 1998.
SFBRWQCB. 1997. Chemical Analytical Results for a Stege marsh Sediment.
San Francisco Bay Regional Water Quality Control Board (SFBRWQCB). Ambient Concentrations of Toxic Chemicals in San Francisco Bay Sediments. May 1998.
Stauffer Chemical Company. 1987. Proposed Sample and Analysis Plan for NPDES Impoundments per the Toxic Pits Clean-up Act (TPCA). July 16, 1987.
URS Consultants. 1994. CERCLA Site Inspection, Stauffer Chemical Company.
Woodward-Clyde Consultants. 1993. Supplemental Site Subsurface Investigation at Zeneca’s Agricultural Facility, Richmond, California. Prepared for Zeneca Agricultural Products. June 23, 1993.
Site E -- Point Potrero/Richmond Harbor
Description of SiteThe site designated Point Potrero/Richmond Harbor is a 400 foot long intertidal embayment, the Graving Inlet, on the western side of the Shipyard #3 Scrap Area at the Port of Richmond (Figure E-1). Shipyard #3 is currently used as a parking lot, but in the past the site has been used for shipbuilding, ship scrapping, sand blasting and metal recycling. The geographic feature identified with the site is Point Potrero, although the original configuration of the point has been modified by quarrying of a bedrock hillside and filling of intertidal mudflats.
The embayment known as the Graving Inlet (Inlet) was excavated in 1969 to allow ships to be beached in shallow water for final scrapping operations. Site investigations have shown that the sediments in the Inlet have the same levels and types of contaminants found on the adjacent Shipyard #3, including heavy metals, PCBs and PAHs. While the most heavily contaminated sediments are in the intertidal zone and shallow subtidal zone within the inlet, elevated levels of PCBs and metals are also found in the subtidal zone outside of the inlet.
Reason for ListingPoint Potrero has been listed as a candidate toxic hot spot due to the extremely high levels of bioaccumulative contaminants, including the highest levels of PCBs (19.9 mg/kg) and mercury (9.1 mg/kg) found by the BPTCP in over 600 samples collected statewide. These two contaminants are listed in the San Francisco Bay/Delta Fish Advisory as primary chemicals of concern to human health due to fish consumption (OEHHA, 1994; RWQCB, 1995). In addition, there is a site-specific health advisory for the Richmond Harbor Channel area based on PCBs and DDTs that was issued by the Office of Environmental Health Hazard Assessment (OEHHA, 1994) and published by California Department of Fish and Game (1997). Lauritzen Canal, the source of the DDT was cleaned up, under CERCLA, by the summer of 1997.
The levels of contaminants found in the Inlet are shown in Table E-1. Also included are Effects Range Median (ERM) guidelines; NOAA derived values which are the 50th percentile value associated with adverse biological effects for any particular chemical. Levels of PCBs have been measured up to 19.9 ppm and


levels of mercury have been measured up to 7.5 ppm. The table shows that PCBs exceed ERMs by up to 110 times and mercury by over 10 times. Metals such as copper, lead and zinc have been measured at levels exceeding ERMs by 6, 10 and 5 times, respectively. Attempts have been made to associate sediment concentrations with unacceptable concentrations of particular contaminants in fish tissue. The Washington State Dept. of Ecology has proposed a human health based sediment quality criteria for PCBs of 0.012 ppm based on 1% TOC (WA. State Dept. of Ecology, 1997). Concentrations of PCBs at Point Potrero are more than 3 orders of magnitude over this value. Ambient levels of PCBs and mercury in S.F. Bay are, in general, below 0.015 ppm and 0.5 ppm respectively (SFEI, 1993, 1994, 1995, 1996; SFBRWQCB, 1998).
A. Assessment of the areal extent of the THS
Estimated area: At least 1 acre.
The area that has the highest levels of contaminants (Graving Inlet) has a well-characterized boundary and comprises about one acre. This area is surrounded on three sides by land and the open end of the inlet has been defined by five cores with subsamples at 0 to 0.5 feet, 0.5 to 2.5 feet and 2.5 to 4.5 feet. Other areas along the waterfront have elevated levels of metals (including mercury), PCBs and PAHs, but there is conflicting data on the concentrations and extent of contamination. It is possible that contaminants may extend over one or two additional acres.
B. Assessment of the most likely sources of pollutants
The contaminants found in the sediments near Point Potrero are the same as those found on the adjacent upland: metals, PCBs and PAHs. These areas were the site of shipbuilding operations during World War II and later ship scrapping activities. The sediments with the highest chemical concentrations are found in the Graving Inlet.
Industrial activities that have taken place at the site in the past include: shipbuilding, ship scrapping, and metal scrap recycling. Prior to 1920 the site consisted of unimproved marshland and tidal flats at the foot of the Point Potrero hills. During World War II, the U.S. government appropriated much of the waterfront for wartime ship construction. The two finger piers on the west side of the site were constructed
between 1942 and 1949. From the end of World War II until 1964 the site was leased to Willamette Iron and Steel for use as a ship repair, construction, scrapping and steel fabrication facility. After 1964 the shipbuilding and steel fabrication ended when Levin Metals took over the site, but scrapping and recycling continued until 1987. In 1969, the Graving Inlet was excavated into the northwest shoreline of the property to allow final dismantling of the keels of scrapped ships. These activities are the most probable source of sediment contamination at the Graving Inlet and around Point Potrero.
Regulatory agencies became involved with the onshore portion of the site in 1984, starting with investigations of leaking and/or unlabeled drums. PCBs, metals and oil and grease were identified in the soils and sandblast waste at the site. Between 1987 and 1988, preliminary remedial actions occurred onshore (removal of drums, sand blast waste and underground storage tanks), the site was graded, storm drains were installed and up to two feet of road base aggregate was added to the site.
C. Summary of actions that have been initiated by the Regional Boards to reduce the accumulation of pollutants at existing THSs and to prevent the creation of new THSs
Regional Board staff, in cooperation with staff of the Department of Toxic Substances Control, have overseen the design and implementation of a Remedial Investigation (Hart Crowser, 1993) and a Feasibility Study (Hart Crowser, 1994) for the onshore area that recommended capping of the upland source of the contaminated sediments. Placement of dredged material on the site was completed in December 1997 and the dredged material will be capped with asphalt when it has completed drying (projected for the summer of 1999).
Regional Board staff have written Waste Discharge Requirements (WDRs) for the onshore portion of the site. The WDRs serve to regulate the placement of dredged material on top of the upland source material to isolate it from human contact and provide a base for an asphalt surface.
Staff approved Supplemental Sediment Characterization in January 1997 and the preliminary results were made available in December 1997. The results provided better documentation of the horizontal and vertical extent of contamination at the mouth of the Graving Inlet. The data indicates that the areas of greatest contamination are limited to the Inlet and a smaller
area at the southern extent of the property. Regional Board staff have provided comments on a draft Remedial Action Workplan (Terra Verde, 1998) that described five remedial action alternatives and participated in meetings with the Port of Richmond, Bay Conservation and Development Commission, and Department of Toxic Substances Control.
D. Preliminary assessment of actions required to remedy or
restore a THS to an unpolluted condition including recommendations for remedial actions
Actions at this site to date have defined the horizontal and vertical extent of contaminants and shown that beneficial uses of waters of the state are impaired by the levels of contaminants in the Graving Inlet. A draft Remedial Action Workplan (RAP) has been submitted and is being finalized by the Port. Remedial action alternatives described in the RAP include: (1) No action, (2) Sheetpile Bulkhead, Capping and Institutional Controls, (3) Rock Dike Bulkhead, Capping and Institutional Controls, (4) Excavation and Off-Site Disposal, and (5) Excavation and Reuse or Disposal Onsite. Excavation or capping would require restoration of the site or restoration of an offsite location to mitigate for the loss of intertidal habitat.
Alternative 2: Sheetpile Bulkhead, Capping and Institutional Controls, is the alternative preferred by the Port, since it has a relatively low cost and would provide additional flat property that can be used by the Port. While this would provide a financial benefit to the landowner, it would require mitigation for loss of habitat and for filling of the Bay. This mitigation would probably require more than one acre of habitat restoration and/or public access improvements to be acceptable to the San Francisco Bay Regional Water Quality Control Board and the San Francisco Bay Conservation and Development Commission. Any requirement for endangered species consultation will be completed before finalization of the remediation plan.
E. Estimate of the total cost to implement the cleanup plan
Preliminary cost estimates for the remedial action alternatives described in the RAP include: (1) No action ($0), (2) Sheetpile Bulkhead, Capping and Institutional Controls ($792,000), (3) Rock Dike Bulkhead, Capping and Institutional Controls ($1,344,000), (4) Excavation and Off-Site Disposal
($3,010,000), and (5) Excavation and Reuse or Disposal Onsite ($881,000). Regional Board staff costs are estimated at $30,000 ($10,000/yr for 3 years). There may be additional costs for mitigation of wetlands.
Although there are costs to implementing this plan there are also benefits. Currently, beneficial uses are being impacted by high concentrations of mercury and PCBs in San Francisco Bay that are accumulating in fish. These concentrations have lead to a human health advisory on consuming fish but probably also impact other higher trophic organisms, that have a much higher consumption rate than humans, as well as possibly the fish themselves. The beneficial uses that are impacted are OCEAN COMMERCIAL AND SPORTFISHING (COMM), MARINE HABITAT (MAR), ESTUARINE HABITAT (EST), NONCONTACT WATER RECREATION (REC 1), WATER CONTACT RECREATION and possibly WILDLIFE HABITAT (WILD). Point Potrero has the highest concentrations of mercury and PCBs in over 600 samples collected statewide in the BPTCP. Implementation of this plan would contribute to lowering concentrations of these chemicals in fish and minimize the impacts on beneficial uses. For a more thorough description of the benefits to restoring beneficial uses see Table 1 in Volume I.
F. Estimate of recoverable costs from potential dischargers
The responsible party or parties are accountable for all costs incurred as a result of site investigation and cleanup at Point Potrero, as well as cost for RWQCB staff oversight.
G. Two-year expenditure schedule identi fying funds to implement the plans that are not recoverable from potential dischargers
The responsible party or parties are accountable for all costs incurred as a result of site investigation and cleanup at Point Potrero, as well as cost for RWQCB staff oversight.
Table E-1. Contaminant Levels in Point Potrero Graving Inlet (all units are mg/kg)
Data Source Sample Location
Depth Cadmium Chromium Copper Lead Mercury Nickel Zinc PCBsAr-1254
PAHs
ERM 9.6 370 270 218 0.71 51.6 410 0.180 44.8
Herzog(1986)
D1/2 NR 20 340 1600 2300 10 U 270 400 1.8 NA
Hart Crowser (1992)
SD-1 0-10 cm 4.4 190 870 840 7.5 84 2100 7.2 24
Hart Crowser (1992)
SD-1 11-18 cm 3.4 220 1000 560 6.3 110 1500 4.1 43
Hart Crowser (1997)
SD-1-s 0-15 cm 0.92 45 160 200 2.9 28 450 2.1 >1.0
BPTCP (1997)
21013.0 0-5 cm NA NA NA NA 4.6 NA NA 19.9* NA
ERM = NOAA’s Effects Range Median; NA = Not Analyzed; NR = Not Reported; U = Below Detection Limit< = Less than, data below detection limits counted as one half of the detection limit; * PCBs measured as total congeners
ReferencesCalifornia Department of Fish and Game (CDFG). 1997. California Sport Fishing Regulations, Public Health Advisory on Fish Consumption, Richmond Harbor Channel, California
California Office of Environmental Health Hazard Assessment (OEHHA). 1994. Health Advisory on Catching and Eating Fish-Interim Sport Fish Advisory for San Francisco Bay. Sacramento, CA.
California Office of Environmental Health Hazard Assessment (OEHHA). 1994. Public Health Advisory on FishConsumption , Richmond Harbor Channel, California. Hart Crowser, Inc. 1993. Final Remedial Investigation Report, Volume I, Port of Richmond, Shipyard No. 3 Scrap Area Site. Richmond, CA.
Hart Crowser, Inc. 1994. Final Feasibility Study Operable Unit 1: Soil and Groundwater, Port of Richmond, Shipyard No. 3 Scrap Area Site. Richmond, CA.
Hart Crowser, Inc. 1995. Final Remedial Action Plan, Port of Richmond, Shipyard No. 3 Scrap Area Site. Richmond, CA.
Hart Crowser, Inc. 1997. Final Work Plan for Supplemental Sediment Characterization, Port of Richmond, Shipyard No. 3 Scrap Area Site, Operable Unit 2 and Operable Unit 3. Richmond, CA.
Herzog, Donald and Associates, Inc. 1989. Final Report, Remedial Investigation/Feasibility Study, Seacliff Marina, Richmond Shipyard No. 3, Richmond.
Hunt J.W., B.S. Anderson, J. Newman, R.S. Tjeerdema, K. Taberski, C.J. Wilson, M. Stephenson, H.M. Puckett, R. Fairey and J. Oakden. 1998. Sediment Quality and Biological Effects in San Francisco Bay. Final Technical Report. Pp. 118. Appendix A-E.San Francisco Bay Regional Water Quality Control Board, SWRCB, CDFG. 1995. Contaminant Levels in Fish Tissue from San Francisco Bay.
San Francisco Bay Regional Water Quality Control Board (SFBRWQCB). Ambient Concentrations of Toxic Chemicals in San Francisco Bay Sediments. May 1998.
San Francisco Estuary Institute (SFEI). 1994. 1993 Annual Report, San Francisco Estuary Regional Monitoring Program for Trace Substances. Richmond, CA.
SFEI. 1995. 1994 Annual Report, San Francisco Estuary Regional Monitoring Program for Trace Substances. Richmond, CA.
SFEI. 1996. 1995 Annual Report, San Francisco Estuary Regional Monitoring Program for Trace Substances. Richmond, CA.
SFEI. 1997. 1996 Annual Report, San Francisco Estuary Regional Monitoring Program for Trace Substances. Richmond, CA.
Terra Verde. 1998. Draft Remedial Action workplan, Operable Units 2 and 3, Port of Richmond, Shipyard No. 3 Scrap Area Site, Richmond, California. April 9, 1998.
Washington State Department of Ecology. 1997. Developing Health Based Sediment Quality Criteria for Cleanup Sites: A Case Study Report. Ecology Publication 97-114.
U.S. Army Corps of Engineers and Port of Richmond. 1996. Final Supplemental Environmental Impact Statement/ Environmental Impact Report, Richmond Harbor Navigation Improvements.
Site F -- Mission Creek
Description of siteMission Creek is a 0.75 mile long arm of the Bay in the eastern side of the San Francisco waterfront (Figure F-1 and F-2). Formerly, the estuary of Mission Creek reached back a couple of miles. It was filled to roughly its present dimension before the turn of the century. Currently, the creek is 100 to 200 feet wide in most sections and narrower at the two bridges at 3rd and 4th Streets. Concrete rip rap and isolated bands of vegetation line Mission Creek’s banks.
Ten to fifteen houseboats are docked at the Mission Creek Harbor located between 5th and 6th Streets along the south shore of the creek. Many of the houseboats have year round on-board residents.
The City and County of San Francisco operates seven combined sewer overflow structures in Mission Creek from 3rd Street to the upper end at 7th Street. Light industrial and urban development line the shores of Mission Creek. A new baseball stadium will soon open on the north shore at the mouth of Mission Creek near 2nd Street in China Basin. Currently, demolition debris cover the remainder of the north shore. According to City plans, new retail development will occupy this area in the near future. Along the south shore, there is a golf driving range near 6th Street, warehouse facilities, and a sand and gravel operation near the mouth of the Creek. Finally, Interstate Freeway 280 crosses over Mission Creek between 6th and 7th Streets.
Reason for listingThe upper end of Mission Creek in the vicinity of 6th Street meets the definition of a toxic hot spot due to impacts on aquatic life resulting from contaminated sediment. This is definition number 2 in the SWRCB’s Guidance on Development of Toxic Hot Spot Cleanup Plans. Definition number 2 defines a toxic hot spot as exhibiting recurrent toxicity associated with pollutants that is significantly different compared to reference site conditions (see Definition of a Toxic Hot Spot, Volume I). The primary basis
for the determination is the BPTCP data. Also, data from a 1979 study the City and County of San Francisco commissioned support the determination. Below is a summary of these data and the specific reason for listing.
According to the State Board Guidance Document, a site is ranked high in aquatic life impact if 1) recurrent toxicity testing, 2) chemical analysis, and 3) benthic community analysis combine to provide a weight-of-evidence determination in the commonly used “sediment quality triad” described by Chapman et al. (1987).
The BPTCP data show that the upper end of Mission Creek has recurrent sediment toxicity, elevated concentrations of chemicals, and an impacted benthic community. The report, Sediment Quality and Biological Effects in San Francisco Bay (Hunt et al., 1998a), contain details of these data. Also, the 1979 study the City and County of San Francisco commissioned to assess the impacts of their wastewater overflows (CH2M Hill, 1979) provides support that there are elevated metals and an impaired benthic community at this site. Below are summaries of each of the three factors.
The BPTCP results show recurrent toxicity to both the amphipod and sea urchin tests at a station located in the upper end of Mission Creek. The BPTCP collected sediment samples from this station (number 21030) during a screening phase in 1995, and two years later during a confirmation phase. The amphipod survival was 5 and 19 percent, in the screening and confirmation phases, respectively. Sea urchin larvae development was zero percent normal in the pore water and 11 percent normal in the sediment-water interface exposure. All of these results were lower than the respective reference envelope limits for that test, less than 90% the appropriate minimum significant difference (MSD), and significantly different than controls.
This toxicity is associated with mean ERM quotients of 0.51 for the screening phase and 3.93 for the confirmation phase. The value of 3.93 is the highest of all the BPTCP stations in the Bay. The chemicals consistently found above the ERM values are chromium, lead, and chlordane. Mercury, copper, silver, zinc, dieldrin, PCBs, phenanthrene, and PAHs were also found above the ERM values during confirmation sampling. In addition, chlorpyrifos and mirex levels were in the top 10% of samples in the statewide BPTCP database.
The 1979 study supports the conclusion that there are elevated metals in the sediments at this site. Data from a station 20 yards upstream of 6th Street show metals in the sediment above the ERM levels for copper, lead, mercury, nickel, silver, and zinc.
The BPTCP benthic community analysis for station 21030 shows a Relative Benthic Index (RBI) of zero. A RBI of less than or equal to 0.3 is an indicator that pollutants or other factors are negatively impacting the benthic community.
The 1979 study found no benthic organisms with the exception of one invertebrate, an oligochaeta, in one out of five sampling events between February and April.
During the reference site study a large composite sediment sample was collected from Mission Creek for a Phase I Toxicity Identification Evaluation (TIE). This sample was toxic to the amphipod Eohaustorius. There were high levels of unionized ammonia and hydrogen sulfide in the sample. After the ammonia and hydrogen sulfide were removed toxicity remained. This residual toxicity had to be due to toxicants other than ammonia and sulfide, since those two compounds were reduced to non-toxic levels. However, the residual cause of the toxicity could not be determined (S.R. Hansen & Assoc., 1996).
A. Assessment of areal extent of the toxic hot spot
Our best estimate of the areal extent of the toxic hot spot at this time is approximately 9 acres. This includes the entire width of Mission Creek from its upper end at 7th Street down to the 4th Street bridge. This is a rough estimate based on data from the BPTCP, as discussed below. The precise areal extent is unknown at this time because there are insufficient sampling locations. Additional sampling is necessary to define the actual areal extent, however, it is estimated that it may range from 5 to 12 acres.
The BPTCP collected samples at three stations along Mission Creek: one at the upper end near 6th Street, another near the mouth and a third (added during the confirmation phase) located midway between the two near 4th street. It is data from the upper end station that forms
the primary basis for determining that this area is a toxic hot spot.
For the western boundary of the toxic hot spot, we assumed that the upper end station is representative of the sediments upstream to the end at 7th Street. This is a conservative assumption and accurate if the primary source of pollutants is from the combined sewage overflow discharge points located at 6th and 7th Streets. Data from a 1979 study also supports this assumption. The data show elevated metals and impaired benthic community in sediment collected upstream of 6th Street (CH2M Hill, 1979).
We believe the eastern boundary of the toxic hot spot may extend to the 4th Street bridge based on data from the BPTCP midway station (number 21301). The data show that the sediments here are somewhat impacted though not as impacted as at the upper end station. There was toxicity to amphipods with 58% survival, and elevated metals with a mean ERM quotient of 1.0 and three chemicals above the ERM (chlordane, PCBs, and PAH).
B. Assessment of the most likely sources of pollutants
The most likely source of pollutants are the combined sewer overflows (CSO) operated by the City and County of San Francisco. Other sources may include deposition from air emissions from vehicles traveling the Interstate 280 overpass and surrounding streets. PAHs are associated with fossil fuel combustion and mercury along with other metals are a contaminant in diesel exhaust. However, compared to the CSO contribution, these are expected to be minor sources.
The City and County of San Francisco operates seven CSO discharge points into Mission Creek. The largest one is located at the upper end near 7th Street (often referred to as the Division Street overflow structure). The City reports that this CSO structure receives approximately 95% of the overflows. Other CSO structures are located along Mission Creek at 6th, 5th, 4th and 3rd Streets.CSO discharges consist of sanitary sewage, industrial wastewaters, and storm water runoff from the City’s combined sewer system. Currently, CSO discharges occur when storm water and wastewater flows exceed the
treatment capacity of the City’s treatment plants. The City is currently permitted to overflow an average of ten times per year to the structures in Mission Creek. Before about 1988, the overflows were untreated and occurred anytime rainfall exceeded 0.02 inches per hour. After 1988, newly constructed storage and consolidation facilities provided treatment of the overflows equivalent to primary treatment standards. Primary treatment involves removal of a significant portion of settleable and floatable solids from the wastewaters.
Although there is sparse data on the quality of the historic overflows to Mission Creek, data from recent discharges and other similar sources support the conclusion that the CSOs are the most likely source of the pollutants. These data show that most if not all the pollutants exceeding ERMs in the sediment at this site are also present in urban runoff and/or sewage. Additionally, a 1979 study commissioned by San Francisco concluded that the accumulative impact of the CSOs on the sediments was evident (CH2M Hill, 1979).
C. Summary of actions that have been initiated by the Regional Board to reduce the accumulation of pollutants at existing THS and to prevent the creation of new THSs
Since 1967, the Regional Board has issued resolutions and orders prescribing requirements on the discharges from the CSO structures. One of the more significant ones is Cease and Desist Order No. 79-119 in 1979 requiring San Francisco to construct overflow consolidation structures to reduce wet weather overflow frequencies to allowable levels. San Francisco completed the consolidation structures for the CSOs into Mission Creek around 1988. These consolidation structures also provided settleable and floatable solids removal treatment for the overflows.
More recently in June 1998, the Regional Board issued a draft Water Code Section 13267 letter requiring San Francisco to define the extent of the sediment contamination, and determine if the CSOs are continuing to cause the contamination or acting to resuspend contaminated sediments already there. Section 13267 is a legal administrative tool with enforcement powers for the Regional Board to require collection of technical
information. The Regional Board followed up with three more letters in August and September 1998 and March 1999 to further define and formalize the requirements of the investigation. San Francisco submitted a Sampling and Analysis Plan, and in October 1998 started the investigation.
D. Preliminary assessment of actions required to remedy or restore THS to an unpolluted condition including recommendations for remedial actions
Corrective actions for Mission Creek sediments will require the following phases:
1. Completion of a site investigation that delineates the vertical and horizontal extent of contamination, and whether and to what extent the CSOs are continuing to contribute pollutants.
2. Preparation of a Feasibility Study based on the findings of the Site Investigation. At a minimum the following cleanup options will be considered, if the CSOs are not contributing pollutants:a. natural recovery,b. dredging with disposal and capping, andc. dredging with disposal of sediments.
If the CSOs are continuing to contribute pollutants, the cleanup options will include those listed above plus, at a minimum, the following:d. reduce or eliminate the number of overflows by changing the operation or the storage and treatment capacity of the current system, and/ore. implement upstream measures that reduce the volume or intensity of runoff. An example of this would be a program to encourage increasing permeable cover.
3. Implement the remediation option(s) selected from the Feasibility Study.
4. Follow-up monitoring to make sure that the site has been cleaned up and remains clean.
An endangered species consultation with all appropriate agencies will be conducted before remediation plans are finalized.
E. Estimate of the total cost to implement the cleanup plan
We estimate that the cost of performing a full site investigation and feasibility study will be $1 million; the cost of remediation and follow-up monitoring will be $800,000 to $1,800,000 with dredging options; if option (d) is added and significant structural changes are needed the cost would increase to approximately $75 million. Regional Board staff costs will be $100,000 to $200,000 over the entire course of the project.
In estimating the remediation cost, we used an areal extent of 5 acres as a minimum and 12 acres as a maximum, and contamination to a depth of at least 3 feet below the sediment surface. Furthermore, we used dredging as the preferred option for cleanup, with sediment disposal in an upland facility, either a Class I landfill or a reuse site based on the degree of contamination. Following dredging, we also assume that the area would be backfilled with clean sediment.
Although there are costs to implementing this plan there are also benefits. Currently, beneficial uses are being impacted by high concentrations of chemicals at this site. The beneficial uses that are impacted are ESTUARINE HABITAT (EST), WATER CONTACT RECREATION (REC 1) AND NONCONTACT WATER RECREATION (REC 2). Implementation of this plan will minimize or eliminate these impacts on beneficial uses. For a more thorough description of the benefits to restoring beneficial uses see Table 1 in Volume I.
F. Estimate of recoverable costs from potential dischargers
The responsible party or parties are accountable for all costs for the site cleanup. Costs for Regional Board and other regulatory staff oversight are recoverable from the responsible party after the Regional Board issues a Cleanup and Abatement Order to that party.
G. Two-year expenditure schedule identifying funds to implement the plans that are not recoverable from potential dischargers
In the next two years, we estimate the expenditure will be $1,100,000. This includes the completion of the site investigation and feasibility study with Regional Board staff oversight.
Currently, the City and County of San Francisco is funding the site investigation. The plan is for the Regional Board to issue a Cleanup and Abatement Order to the responsible party or parties subsequent to completion of the site investigation, at which point, staff oversight costs and the feasibility study will be recoverable from that party.
ReferencesChapman, P.M., Dexter, R.N., and Long, E.R. 1987. Synoptic Measures of Sediment Contamination, Toxicity and Infaunal Community Composition. The Sediment Quality Triad in San Francisco Bay. Marine Ecology Progress Series 37:75-96.
CH2M Hill. 1979. Bayside Overflows. Report for City and County of San Francisco.
Hunt, J.W., Anderson, B.S., Phillips, B.M., Newman, J., Tjeerdema, R.S., Taberski, K.M., Wilson, C.J., Stephenson, M., Puckett, H.M., Fairey, R., and Oakden, J. 1998a. Sediment Quality and Biological Effects in San Francisco Bay. Prepared for Ca. State Water Resources Control Board. pp. 188 + appendices A-E.
SFBRWQCB. 1996. Fact Sheet. Prepared by staff of the California Regional Water Quality Control Board, San Francisco Bay Region for Amendment of Waste Discharge Requirements for Order No. 94-149 for City and County of San Francisco, Southeast Water Pollution Control Plant.
S.R. Hansen & Assoc. 1996. Development and Application of Estuarine Sediment Toxicity Identification Evaluations. Prepared for San Jose State Foundation. pp. 79 Appendix A&B.
Site G -- Islais Creek
Description of siteIslais Creek is a one mile long channel of the Bay running east-west on the San Francisco waterfront near the foot of Potrero Hill and Caesar Chavez Street (Figure G-1 and G-2). Formerly, the estuary of Islais Creek reached back a couple of miles as far as Bayshore Boulevard, and was fed by a creek that ran down what is now Alamany Boulevard. Before the turn of the century, the area was filled to roughly its present size.
A bridge at Third Street forms a narrow 100-foot wide constriction that physically divides the channel into two segments. The eastern segment is approximately 400 to 500 feet wide; the western, 250 to 300 feet wide.
The City and County of San Francisco operates four wet weather overflow structures that discharge into the western segment. San Francisco also operates a sewage treatment plant effluent outfall that discharges into the western segment at Quint Street.
The banks of Islais Creek are covered with concrete rip-rap with narrow bands of vegetation in small isolated areas. Long stretches of creek bank in the eastern segment are under pier structures. Old pier pilings dot the southern shore of the western segment.
Light industrial and urban development surround Islais Creek. On the shores of the eastern segment are a sand and gravel facility, grain terminal, oil and grease rendering facility, warehouse, and container cargo terminal. Auto dismantlers and auto parts dealers, scrap metal recyclers, and warehouses make up the bulk of the current activities surrounding the western segment. Interstate 280 passes over the western end of Islais Creek.

Reason for listingThe western segment of Islais Creek meets the definition of a toxic hot spot due to impacts on aquatic life resulting from contaminated sediment. This is definition number 2 in the
SWRCB’s Guidance on Development of Toxic Hot Spot Cleanup Plans. Definition number 2 defines a toxic hot spot as exhibiting recurrent toxicity associated with pollutants that is significantly different compared to reference site conditions (see Part I Specific Definition of a Toxic Hot Spot). The primary basis for our determination is the BPTCP data. Data from various other studies also support our determination. Below is a summary of these data and the specific reasons for listing.
According to the State Board Guidance Document, a site has a high ranking in aquatic life impact if (1) recurrent toxicity testing, (2) chemical analysis, and (3) benthic community analysis combine to provide a weight-of-evidence determination in the commonly used “sediment quality triad” described by Chapman et al. (1987). The BPTCP data show that the western segment of Islais Creek has sediment toxicity, elevated concentrations of chemicals, and an impacted benthic community. The report Sediment Quality and Biological Effects in San Francisco Bay (Hunt et al., 1998a) contain these data. The BPTCP report Evaluation and Use of Sediment Reference Sites and Toxicity Tests in San Francisco Bay (Hunt et al., 1998b) contain additional details. Also, a research study in 1987 and a study MEC conducted for San Francisco provide supporting data for our determination that this site is a toxic hot spot. Below are summaries of the data related to each of the three factors.
Recurrent ToxicityThe BPTCP results show recurrent toxicity to both the amphipod and sea urchin tests at a station located in the western segment of Islais Creek. The BPTCP collected sediment samples from this station (number 20011) during the reference site study in 1995 (which served as the screening for this site), and two years later during a confirmation phase.
The amphipod survival was 57% and 0%, in the screening and confirmation phase, respectively. The sea urchin larvae development was 0% normal in the pore water and sediment-water interface during the screening phase. In the confirmation phase, there was only 8% normal development. All of these results were lower than the respective reference envelope limits for that test, less than 90% of the appropriate minimum significant difference (MSD), and significantly different than controls.
During the reference site study, a large composite sediment sample was collected for a Phase I Toxicity Identification Evaluation (TIE). The results of the Phase I Characterization procedures indicated that the sediments from Islais Creek were toxic to the urchin Strongylocentrotus p. and contained 20 TUs (toxic units). Sediments were high in unionized ammonia and hydrogen sulfide. When the ammonia and hydrogen sulfide were removed there were still 10 TUs remaining. The residual toxicity had to be due to toxicants other than ammonia and hydrogen sulfide since those two compounds were reduced to non-toxic levels. The cause of the remaining toxicity was not identified but may have been due to polar organics (S.R. Hansen & Assoc., 1996).
Data from a research study in 1987 supports the finding of toxicity in sediments in the western segment of Islais Creek. This study found toxicity to amphipods and mussel larvae (Chapman et al., 1987).
A study MEC conducted for the City and County of San Francisco in 1996 shows toxicity to amphipods compared to controls in four out of fifteen samples in the western segment (MEC, 1996). Although this study did not find toxicity at all locations in the western segment, the results still support recurrent toxicity and may suggest sediment quality is dynamic in this segment.
Elevated ChemicalsThe toxicity described above is associated with a mean ERM quotient of 1.18 for the confirmation phase. This quotient is calculated from the concentrations of a list of metals and organic compounds divided by an average of sediment quality guideline values (ERMs) for those compounds. Sediments with a quotient of greater than 0.5 are considered to have elevated chemical concentrations. The chemicals found above the ERM values are chlordane, dieldrin, PCBs, and low molecular weight PAHs. In addition, endosulfan sulfate was in the top 10% of samples in the statewide BPTCP database.
Data from a 1979 study by CH2M Hill and another research study in 1987 support the conclusion that there are elevated PCBs in the sediments in the western segment. The 1979 study found a mean of 500 ug/kg total Aroclor (CH2M Hill, 1979); the 1987 study found total PCBs at 255 ug/kg (Chapman et al., 1987). Furthermore, the 1987 study found
sediments with elevated low and high molecular weight PAHs (Chapman et al., 1987).
These studies also found metals in the western segment sediments above ERM values (Chapman et al., 1987; CH2MHill, 1979). The metals include lead, mercury, and silver. Sediment monitoring in the western segment of Islais Creek by the City and County of San Francisco from 1990 to 1993 show levels of mercury exceeding the ERM in every year except 1990. The ERM value for lead was also exceeded in 1991 (CCSF, 1990-1993).
Impacted Benthic CommunityThe BPTCP benthic community analysis of the western segment of Islais Creek shows a Relative Benthic Index (RBI) of 0.22. A RBI of less than or equal to 0.3 is an indicator that pollutants or other factors are negatively impacting the benthic community.
The 1979 study found few to no benthic organisms in five sampling events between February and April in the western segment of Islais Creek. There were a total of only eleven species, six of which the report’s authors noted as being unusual because they were freshwater organisms or fly larvae common at sewage treatment plants.
A 1987 research study concluded that this area of Islais Creek was the most depauperate compared to other sites in the study, in terms of taxa richness and total abundance (Chapman et al., 1987).
A. Assessment of areal extent of the toxic hot spot
At this time, our best estimate of the areal extent of the hot spot is approximately 11 acres, comprising the entire width of Islais Creek from its upper end at Selby Street down to Third Street. This is a rough estimate based on data from the BPTCP, as discussed below. The precise areal extent is unknown at this time because there are insufficient sampling locations. Additional investigation is necessary to determine the actual areal extent which may range from 5 to 35 acres.
The BPTCP collected samples at three stations along Islais Creek: one at the upper end near Selby Street, and the other two down stream about 200 feet west (mid-gradient)
and 400 feet east (lower end) of the Third Street Bridge. The last two were added during the confirmation phase. It is data from the upper end station that forms the primary basis for determining that that area is a toxic hot spot. Therefore, the western boundary for the toxic hot spot is the upper end of Islais Creek at Selby Street.
The eastern boundary of the toxic hot spot extends out to the Third Street Bridge and probably farther east towards the Bay. The BPTCP data show that the sediments at the mid-gradient station are impacted though not as highly impacted as at the upper end station. The sediment at this station was toxic to sea urchin larvae with 47% normal development, had elevated chemicals with an ERM quotient of 0.6, and had a Relative Benthic Index (RBI) of 0.25.
Support for the statement that the toxic hot spot extends farther east of the Third Street Bridge comes from the last BPTCP station and other studies. These other studies show that the quality of sediments in the eastern segment of Islais Creek has high variability either spatially or temporally. These studies include one by the National Oceanic and Atmospheric Administration in 1992 (Long et al., 1992), another by the Lawrence Berkeley National Laboratory in 1995 (Anderson et al., 1995), and two others by Advanced Biological Testing in 1998 (ABT, 1998a and 1998b).
In 1997, the sediments at the BPTCP lower end station appear impacted. The sediment was toxic to amphipods
with 49% survival, and had elevated chemicals with an ERM quotient of 0.62. However, the benthos was less impacted than the other two BPTCP stations with a RBI of 0.43.
A 1992 study collected sediments from Islais Creek at stations further east of the BPTCP stations. These data show mercury, PAHs, and PCBs at concentrations above ERM levels (Long et al., 1992). There was also observed cytogenetic effects on mussel and sea urchin larvae exposed to sediments at these stations compared to controls (Long et al. 1992). The 1995 study also found sediment in this vicinity to be toxic to sea urchins and mussels compared to a reference site (Anderson et al., 1995).
Studies conducted in 1998 for the Port of San Francisco sampled sediments midway along the north shore of the eastern segment of Islais Creek (ABT 1998a and 1998b). The purpose of the studies was to characterize the sediments for maintenance dredging. The data did not show elevated concentrations of chemicals although several samples were toxic to mussel larvae and one sample was toxic to amphipods.
B. Assessment of the most likely sources of pollutants
The most likely source of pollutants are the combined sewer overflows (CSO) operated by the City and County of San Francisco. Another likely source is San Francisco’s treatment plant discharge outfall at Quint Street. Because of recent improvements in the quality of the discharges from these sources in the past two years, historic discharges are probably more of a factor. Other sources may also contribute. Additional description of all these sources and potential sources are below.
CSOsThe City and County of San Francisco operates four CSO discharge points into Islais Creek. Two are at the upper end near Selby Street (referred to as the Selby Street andMarin Street overflow structures). The other two CSO structures are at Third Street.
CSO discharges consist of sanitary sewage, industrial wastewaters, and storm water runoff from the City’s combined sewer system. CSO discharges occur when storm
water and wastewater flows exceed the treatment capacity of the City’s treatment plants. The City is currently permitted to overflow an average of four times per year to the structures in Islais Creek. Newly constructed storage and consolidation facilities provide treatment of the overflows equivalent to primary treatment standards. Primary treatment involves removal of a significant portion of settleable and floatable solids from the wastewaters. However, prior to the completion of these consolidation facilities in 1996, the overflows were untreated and occurred anytime rainfall exceeded 0.02 inches per hour.
Although there is sparse data on the quality of the historic overflows to Islais Creek, data from recent discharges and other similar discharges support the conclusion that the CSOs are the most likely source of the pollutants. Most if not all the pollutants exceeding ERMs in the sediment at this site are or were pollutants in urban runoff and/or sewage. Additionally, a 1979 study commissioned by San Francisco concluded that the accumulative impact of the CSOs on the sediments was evident (CH2M Hill, 1979).
Quint Street OutfallThis outfall is at the south shore of Islais Creek at Quint Street just west of the Third Street Bridge. San Francisco uses this outfall when wastewater flows from the Southeast Wastewater Treatment Plant exceed the capacity of the main deep water discharge outfall to the Bay. The capacity of the deep water outfall is 100 million gallons per day.
After completing a re-piping project and increasing the secondary treatment capacity of the plant in 1997, San Francisco discharges only secondary treated wastewater to the outfall. Prior to 1997, the Quint Street outfall received a blend of primary and secondary treated wastewaters from the treatment plant.
Secondary treatment is a higher level of treatment than primary. Primary treatment relies on physical separation and removal of settleable and floatable solids. Secondary involves using biological treatment technologies which can remove dissolved pollutants. Secondary treatment standards require removal of at least 80% of the suspended solids and oxygen consuming matter from the sewage.
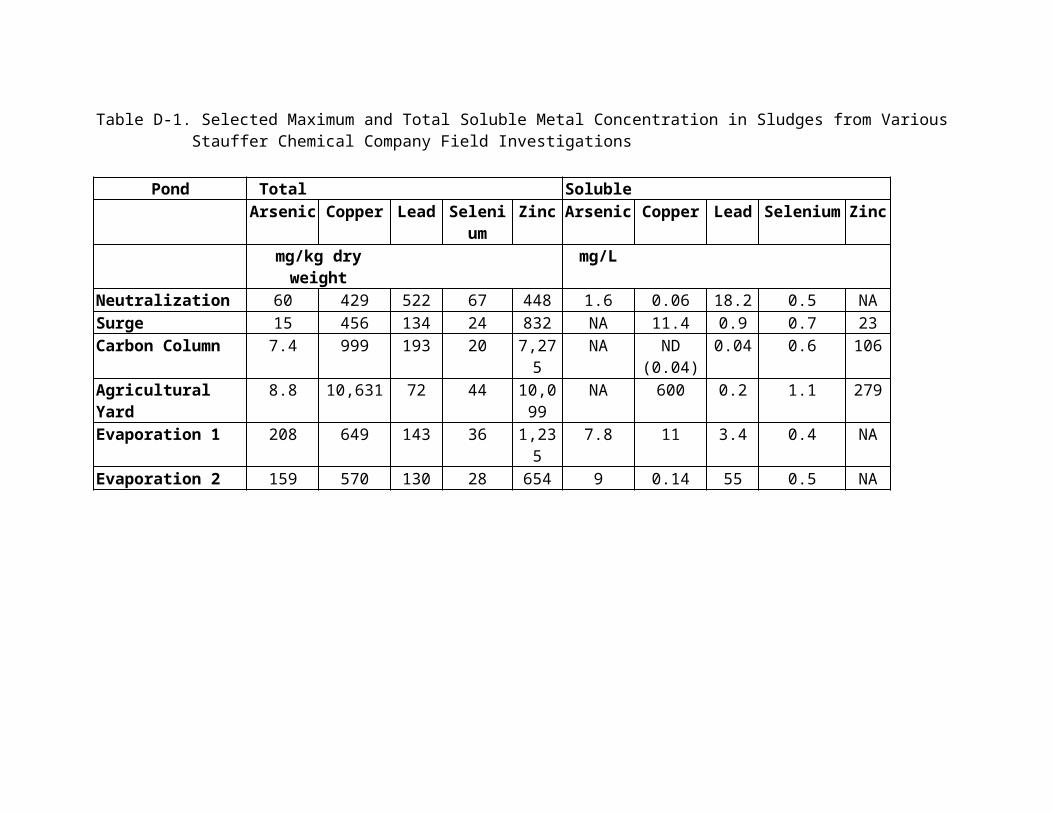
As is the case for the CSO, most if not all the pollutants exceeding the ERMs in the sediment at this site are or were pollutants in treated sewage. Therefore, the discharges from the Quint Street Outfall are or were a likely source.
Other Potential SourcesOther sources of pollutants to Islais Creek may include sheet runoff or any past discharges from auto dismantlers and metal recycling facilities bordering Islais Creek. Deposition from air emissions from vehicles traveling the Interstate 280 overpass and surrounding streets may also contribute. PAHs are associated with fossil fuel combustion. Mercury and other metals are contaminants in diesel exhaust. However, compared to the CSO and Quint Street outfall contributions, these are estimated to be minor sources.
C. Summary of actions that have been initiated by the Regional Board to reduce the accumulation of pollutants at existing THS and to prevent the creation of new THSs
Since 1967, the Regional Board has issued numerous resolutions and orders prescribing requirements on the discharges from the CSO structures. One of the more significant ones is Cease and Desist Order No. 79-119 in 1979 requiring San Francisco to construct overflow consolidation structures to reduce wet weather overflow frequencies to allowable levels throughout the city. For Islais Creek, San Francisco completed the consolidation structures in 1996. These consolidation structures also provided settleable and floatable solids removal treatment for the overflows.
Order No. 79-119 also required the City to develop alternatives to address the discharge from the Quint Street outfall. The outcome of this order was improvement in the quality of the discharge to the outfall. Starting in 1997, the Quint Street outfall received only secondary treated wastewater. San Francisco accomplished this by a major re-piping project and increasing the secondary treatment capacity of their Southeast Treatment Plant.
More recently in June 1998, the Regional Board issued a draft Water Code Section 13267 letter requiring San Francisco to define the extent of the sediment contamination, and determine if the CSOs and Quint Street outfall are continuing to cause the contamination or
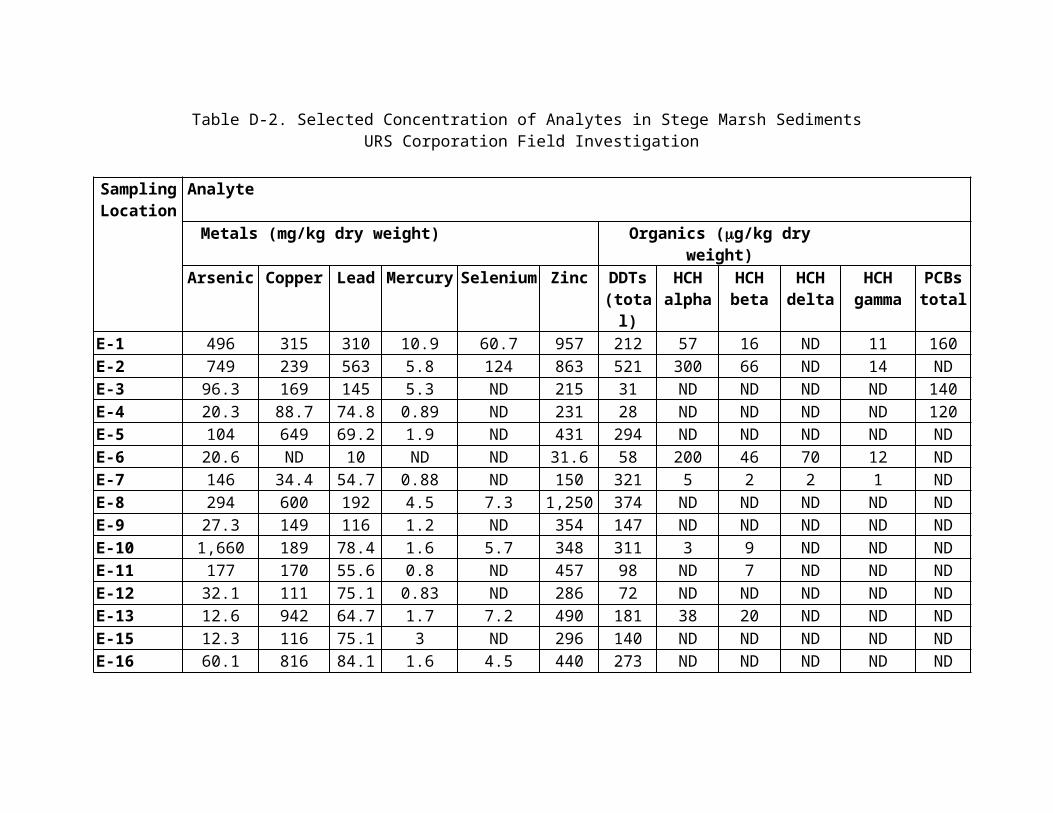
may act to resuspend contaminated sediments already there. Section 13267 is a legal administrative tool with enforcement powers for the Regional Board to require collection of technical information. The Regional Board followed up with three more letters in August and September 1998 and March 1999 to further define and formalize the requirements of the investigation. San Francisco submitted a Sampling and Analysis Plan, and in October 1998 started the investigation.
D. Preliminary assessment of actions required to remedy or restore THS to an unpolluted condition including recommendations for remedial actions
Corrective actions for Islais Creek sediments will require the following phases:
1. Completion of a Site Investigation that delineates the vertical and horizontal extent of contamination, and whether and to what extent the CSOs and Quint Street outfall are continuing to contribute pollutants.
2. Preparation of a Feasibility Study based on the findings of the Site Investigation. At a minimum the following cleanup options will be considered, if the CSOs and Quint Street outfall are not contributing pollutants:a. natural recovery,b. partial dredging with disposal and capping, andc. dredging with disposal of sediments.If the CSOs and Quint Street outfall are continuing to contribute pollutants, the cleanup options will include those listed above plus at a minimum the following:
d. reduce or eliminate the number of overflows by changing the operation or increasing the storage and treatment capacity of the current system, and/or e. implement upstream measures that reduce the volume or intensity of runoff. An example of this would be a program to encourage increasing
permeable cover.
3. Implement the remediation option(s) selected from the Feasibility Study.
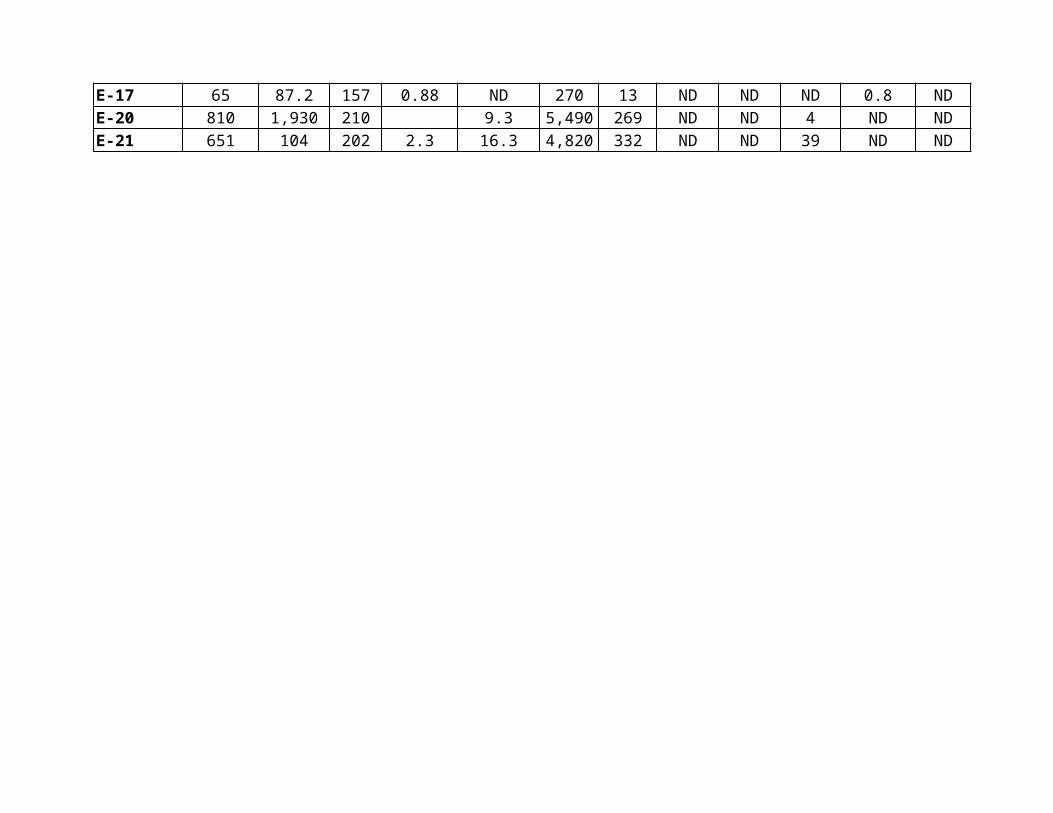
4. Follow-up monitoring to make sure that the site has been cleaned up and remains clean.
An endangered species consultation with all appropriate agencies will be conducted before remediation plans are finalized.
E. Estimate of the total cost to implement the cleanup plan
We estimate that the cost of performing a full site investigation and feasibility study will be $1 million; the cost of remediation and follow-up monitoring will be $800,000 to $5,200,000 with dredging options; if option (d) is added and significant structural changes are needed the costs would increase to approximately $75 million. Regional Board staff costs will be $100,000 to $200,000 over the entire course of the project.
In estimating the remediation cost, we used an areal extent of 5 acres as a minimum and 35 acres as a maximum, and contamination to a depth of at least 3 feet below the sediment surface. Furthermore, we used dredging as the preferred option for cleanup, with sediment disposal in an upland facility, either a Class I landfill or a reuse site based on the degree of contamination. Following dredging, we also assume that the area would be backfilled with clean sediment.
Although there are costs to implementing this plan there are also benefits. Currently, beneficial uses are being impacted by high concentrations of chemicals at this site. The beneficial use that is impacted is ESTUARINE HABITAT(EST) and NONCONTACT WATER RECREATION (REC 2). Implementation of this plan will minimize or eliminate these impacts on beneficial uses. For a more thorough description of the benefits to restoring beneficial uses in Table 1 in Volume I.
F. Estimate of recoverable costs from potential dischargers
The responsible party or parties are accountable for all costs for the site cleanup. Costs for Regional Board and other regulatory staff oversight are recoverable from the responsible party after the Regional Board issues a Cleanup and Abatement Order to that party.
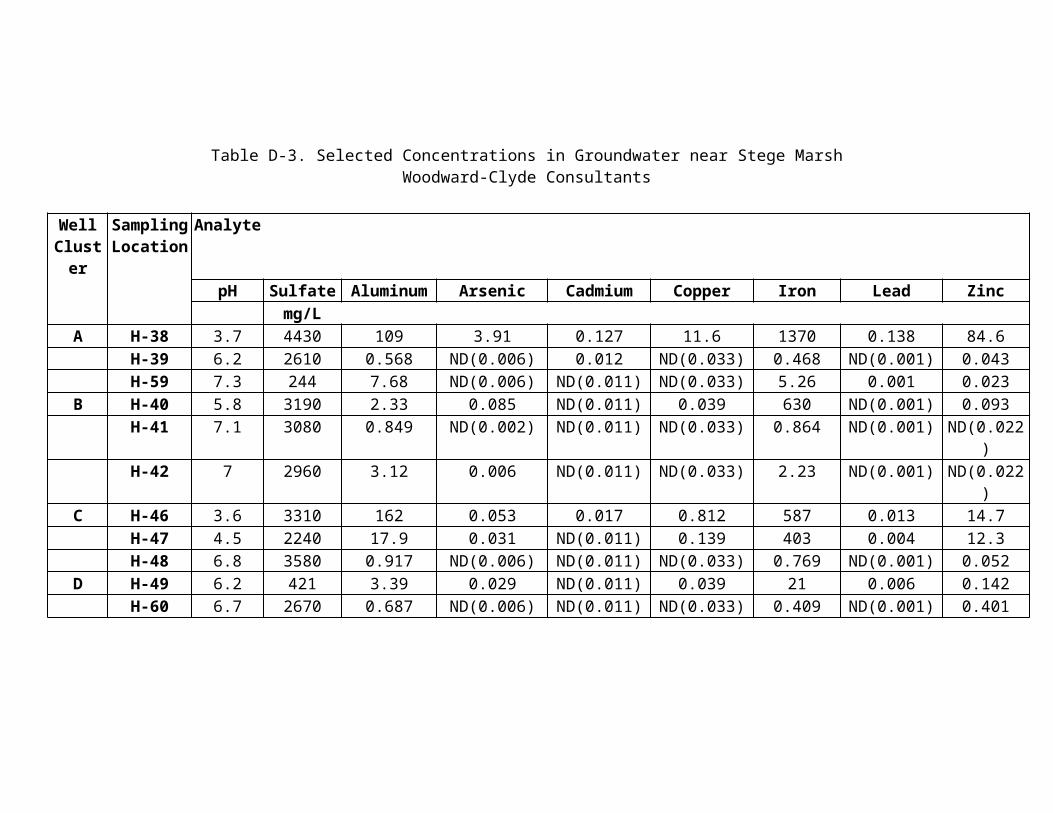
G. Two-year expenditure schedule identifying funds to implement the plans that are not recoverable from potential dischargers
In the next two years, we estimate the expenditure will be $1,100,000. This includes the completion of the site investigation and feasibility study with Regional Board staff oversight.
Currently, the City and County of San Francisco is funding the site investigation. The plan is for the Regional Board to issue a Cleanup and Abatement Order to the responsible party or parties subsequent to completion of the site investigation, at which point staff oversight costs and the feasibility study will be recoverable from that party.
ReferencesAdvanced Biological Testing Inc. 1998a. Results of Chemical, Physical, and Bioassay Testing of Sediments for Maintenance Dredging at Pier 80A, San Francisco, California. Prepared for the Port of San Francisco.
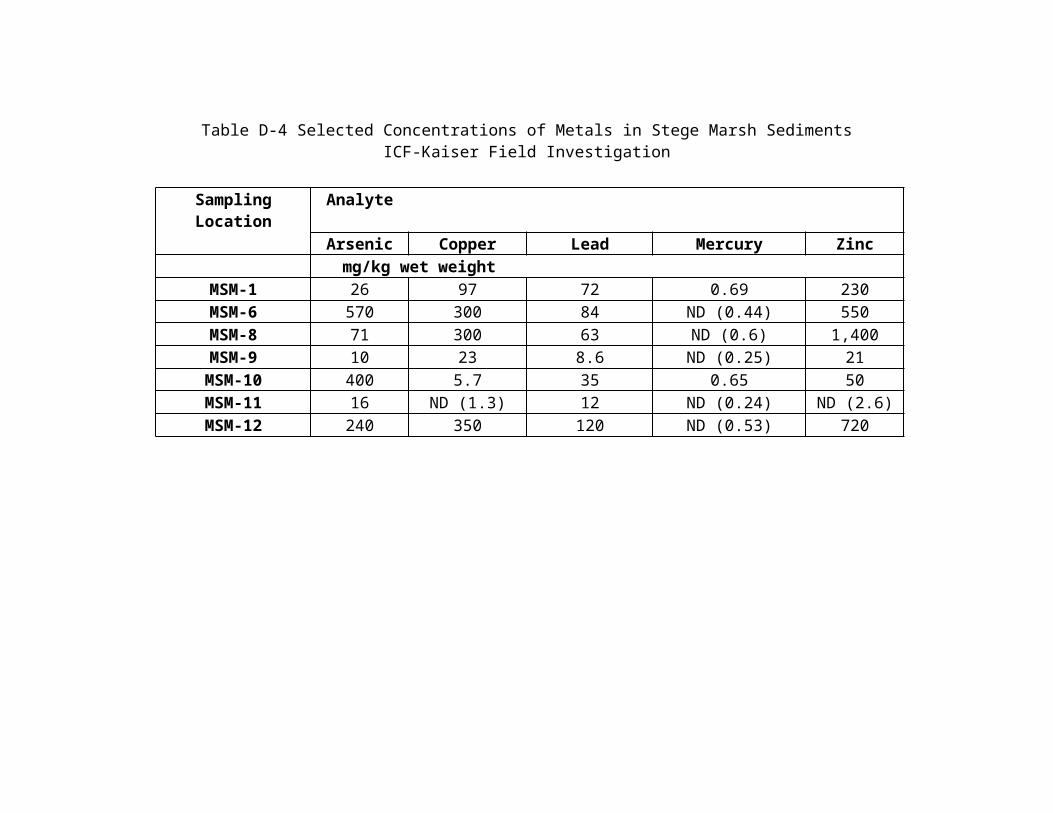
Advanced Biological Testing Inc. 1998b. Results of Chemical, Physical, and Bioassay Testing of Sediments for Maintenance Dredging at Pier 80B, San Francisco, California. Prepared for the Port of San Francisco.
Anderson, S.L., Knezovich, J.P., Jelinski, J., and Steichen, D.J. 1995. The Utility of Using Pore-Water Toxicity Testing to develop Site-Specific Marine Sediment Quality Objectives for Metals. Final Report. LBL-37615 UC-000. Lawrence Berkeley National Laboratory, University of California, Berkeley, California.
Chapman, P.M., Dexter, R.N., and Long, E.R. 1987. Synoptic Measures of Sediment Contamination, Toxicity and Infaunal Community Composition. The Sediment Quality Triad in San Francisco Bay. Marine Ecology Progress Series 37:75-96.
City and County of San Francisco, Department of Public Works, Bureau of Water Pollution Control. 1990-1993. Tabulated data on Southeast and Islais Creek Sediment submitted by Jim Salerno to the California Regional Water Quality Control Board, San Francisco Bay Region.
CH2M Hill. 1979. Bayside Overflows. Report for City and County of San Francisco.
Hunt, J.W., Anderson, B.S., Phillips, B.M., Newman, J., Tjeerdema, R.S., Taberski, K.M., Wilson, C.J., Stephenson, M., Puckett, H.M., Fairey, R., and Oakden, J. 1998a. Sediment Quality and Biological Effects in San Francisco Bay. pp. 118 + Appendices A-E.
Hunt, J., B. Anderson, B. Phillips, J. Newman, R. Tjeerdema, M. Stephenson, M. Puckett, R. Fairey, R. Smith, K. Taberski. 1998b. Evaluation and Use of Sediment Reference Sites and Toxicity Tests in San Francisco Bay. For Ca. State Water Resources Control Board. pp. 133 + Appendices A-D.
Long, E.R. and Markel. 1992. An Evaluation of the Extent and Magnitude of Biological Effects Associated with Chemical Contaminants in San Francisco Bay, California. NOAA Technical Memorandum NOS ORCA 64. National Oceanic and Atmospheric Administration.
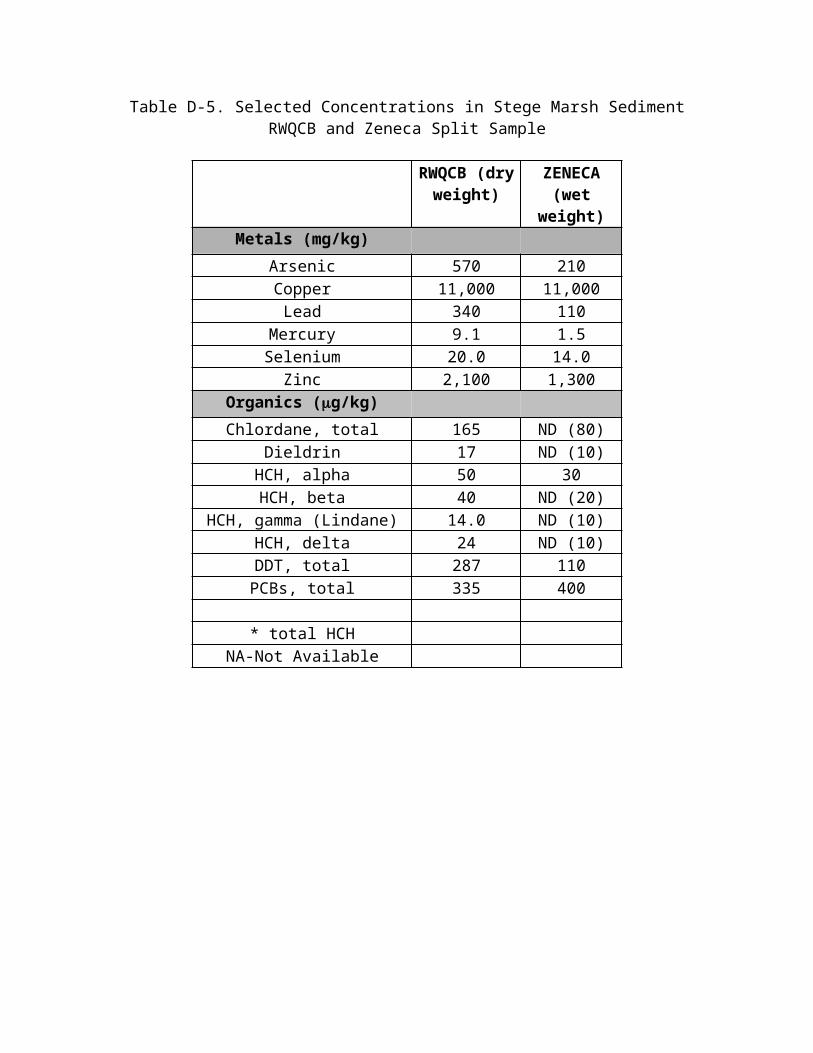
MEC Analytical Systems Inc. 1996. Sampling and Analysis of Sediment at Islais Creek, San Francisco, CA. Report prepared for the City and County of San Francisco, Department of Public Works, Water Quality Planning.
San Francisco Bay Regional Water Quality Control Board (SFBRWQCB). 1996. Fact Sheet. Prepared by staff of the California Regional Water Quality Control Board, San Francisco Bay Region for Amendment of Waste Discharge Requirements for Order No. 94-149 for City and County of San Francisco, Southeast Water Pollution Control Plant.
SFBRWQCB. Ambient Concentrations of Toxic Chemicals in San Francisco Bay Sediments. May 1998.
S.R. Hansen & Assoc. 1996. Development and Application of Estuarine Sediment Toxicity Identification Evaluations. Prepared for San Jose State Foundation. pp. 79 + Appendices A&B.
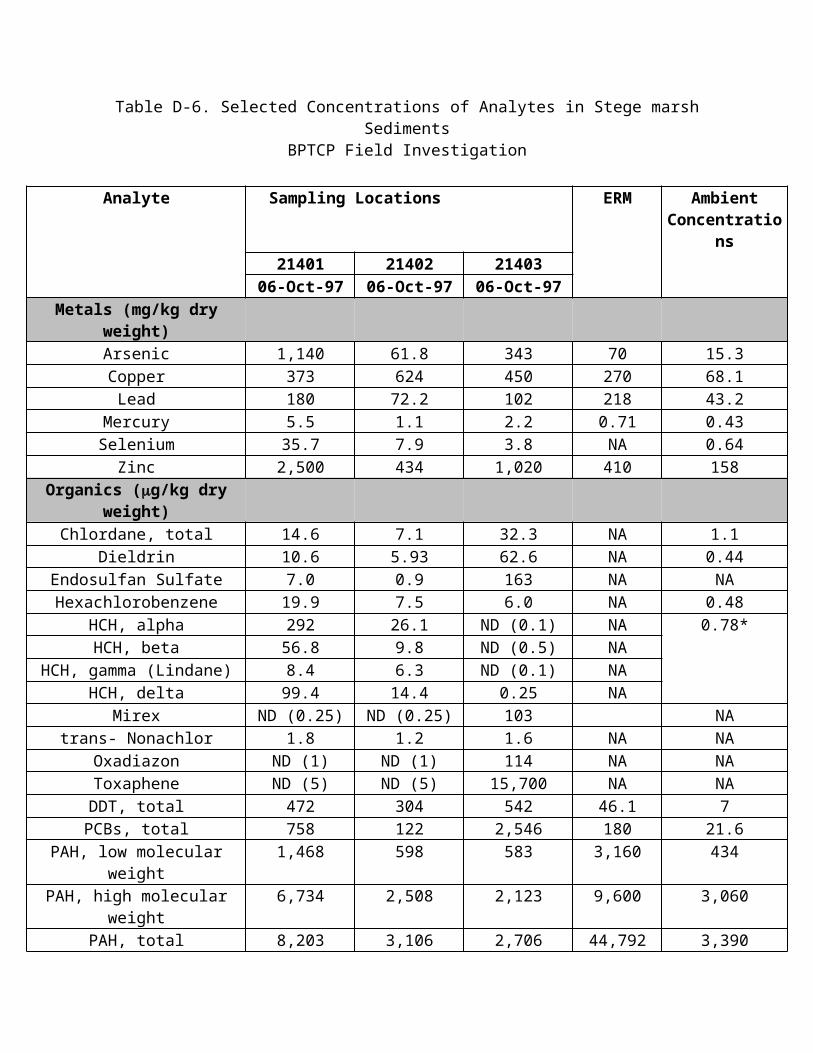
Future NeedsThis document is primarily oriented to the cleanup of specific sites that have contaminated sediments. However, the goals of the Bay Protection and Toxic Cleanup Program are not only to clean up toxic hot spots but also to prevent them from occurring. U.S. EPA and the State Board are strongly encouraging the development of watershed management plans to protect watersheds. However, to develop watershed management plans there must be watershed monitoring and assessment in order to identify and prioritize current or potential problems. Watershed monitoring is also important for the calculation of Total Maximum Daily Loads (TMDLs) and the development of implementation plans, which are required when water bodies are listed as impaired under section 303(d) of the Clean Water Act. Currently, approximately 500 water bodies in the state are 303(d) listed yet the resources needed to calculate TMDLs and develop meaningful implementation plans are almost totally lacking.
Stormwater runoff is currently the major source of mass loading of contaminants that accumulate in the food chain and pesticides that cause acute toxicity to aquatic organisms. In the past several years, the RMP and the Bay Area Stormwater Management Agencies Association (BASMAA) have been conducting some monitoring of runoff from urban creeks. Through this monitoring Coyote Creek has been identified as a source of PCBs and chlorinated pesticides to the estuary. In other urban creeks, high levels of toxicity have been identified during runoff events. Toxicity Identification Evaluations (TIEs) have shown that in most of the samples tested toxicity was due to the pesticides diazinon and/or chlorpyrifos. A recent RMP workgroup on PCBs that is using a model to conduct a preliminary calculation of loadings has determined that there are probably significant ongoing sources of PCBs to the estuary. Identification of the sources and an evaluation of the loadings of these contaminants are necessary to develop TMDLs and implementation plans, as well as watershed management plans to protect the beneficial uses of the estuary. Remediation might take the form of cleanup, the implementation of best management practices or pollution prevention. Yet, to solve watershed problems and plan for their prevention, a solid program of watershed monitoring and assessment is needed. At this time, the funding for the monitoring and assessment of watersheds is extremely

inadequate and needs to be substantially increased if TMDLs and watershed management plans are to be meaningful.
Sites of ConcernThere are additional sites of concern in the San Francisco Bay Region that don’t technically qualify as candidate toxic hot spots under the definition used in this program. Most of these sites are military bases slated for closure or redevelopment properties. Many of these sites are undergoing large scale investigations, including environmental risk assessments. Lauritzen Canal, which was previously listed as a potential toxic hot spot in 1993, went through a $2 million investigation under CERCLA and was cleaned up by the summer of 1997.
At military bases sediment pollution is evaluated in the larger context of determining the risk to human and ecological receptors. Ecological risk assessments are generally rigorous and are required under CERCLA, the primary regulatory authority driving environmental investigations at military bases. Jurisdictions other than the Regional Board, including the U.S. EPA, the U.S. Fish and Wildlife Service, the National Oceanic and Atmospheric Administration, the Ca. Department of Fish and Game and the Ca. Department of Toxic Substances Control also participate in designing and determining the scope of the characterization. Although efforts were made at these sites to follow methods and protocols being used by the BPTCP, and in the beginning of the program were visited by the BPTCP, the study designs and the scale of the investigations were distinctly different.
Some military facilities were identified for investigation due to suspected use or disposal practices, or elevated levels of contaminants identified upland. Therefore, full characterization of these sites was conducted. Study designs at these sites were driven by various programmatic requirements. Characterization included defining the nature and extent of chemical contaminants, conducting synoptic toxicity tests and determining the risk to vertebrate species in proximity to the sites by conducting ecological risk assessments. The fact that samples were taken at deeper depths toxicity tests were not recurrent and benthic community analyses were not conducted made data collected at these sites difficult to compare to BPTCP criteria. In addition, the limited number of surficial sediment samples that the BPTCP took at these sites exhibited no toxicity and relatively low levels of chemicals of concern. Subsequent
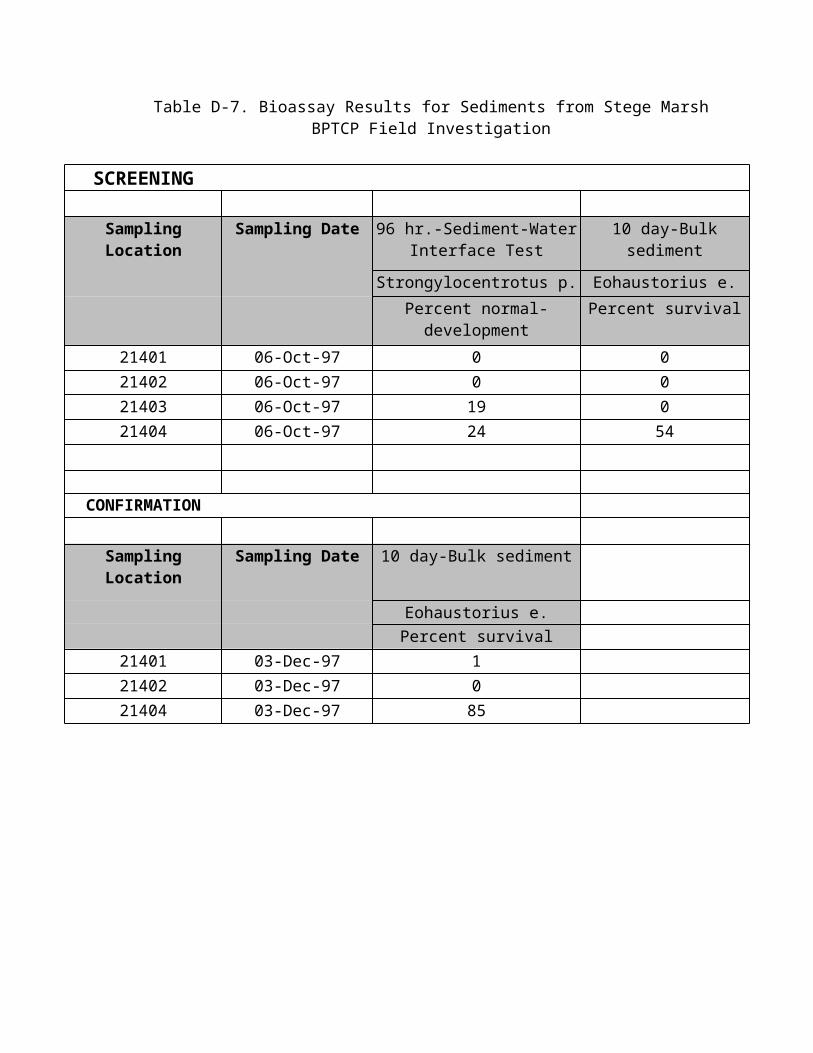
studies at some military bases have identified toxicity in areas not sampled by the BPTCP and elevated levels of chemical contaminants at deeper depths that may potentially be a risk to human and/or environmental health. However, since the cost of investigating one of these sites dwarfed the entire BPTCP budget, the BPTCP decided to concentrate on sites that were not already undergoing extensive investigations. Limited funding and the desire to avoid regulatory overlap at sites already in the process of remedial investigations focused the BPTCP on performing sediment screening at 127 locations in the Bay. For the aquatic life definition, candidate toxic hot spots are those with recurrent toxicity and associated high chemistry. To be a “high priority” site they must have another biological measurement such as impacted benthic communities, high bioaccumulation or TIEs that associate the contaminants at the site with toxicity. For the human health definition, “high priority” candidate toxic hot spots are sites which have a human health advisory on consuming aquatic non-migratory species and which have high levels of the chemicals of concern established in the advisory. High priority sites will be required to conduct a site investigation, develop a feasibility study and remediate, as appropriate. Environmental risk assessments may also be conducted.
Several of the sites that were sampled by the BPTCP contained high levels of compounds, such as PAHs, that are known to cause chronic effects but do not cause acute effects, unless at very high concentrations, in the toxicity tests being used for screening. These sites should be resampled in the future when tests are developed that are more sensitive to the chronic effects of these compounds. These sites are also listed in the following table.
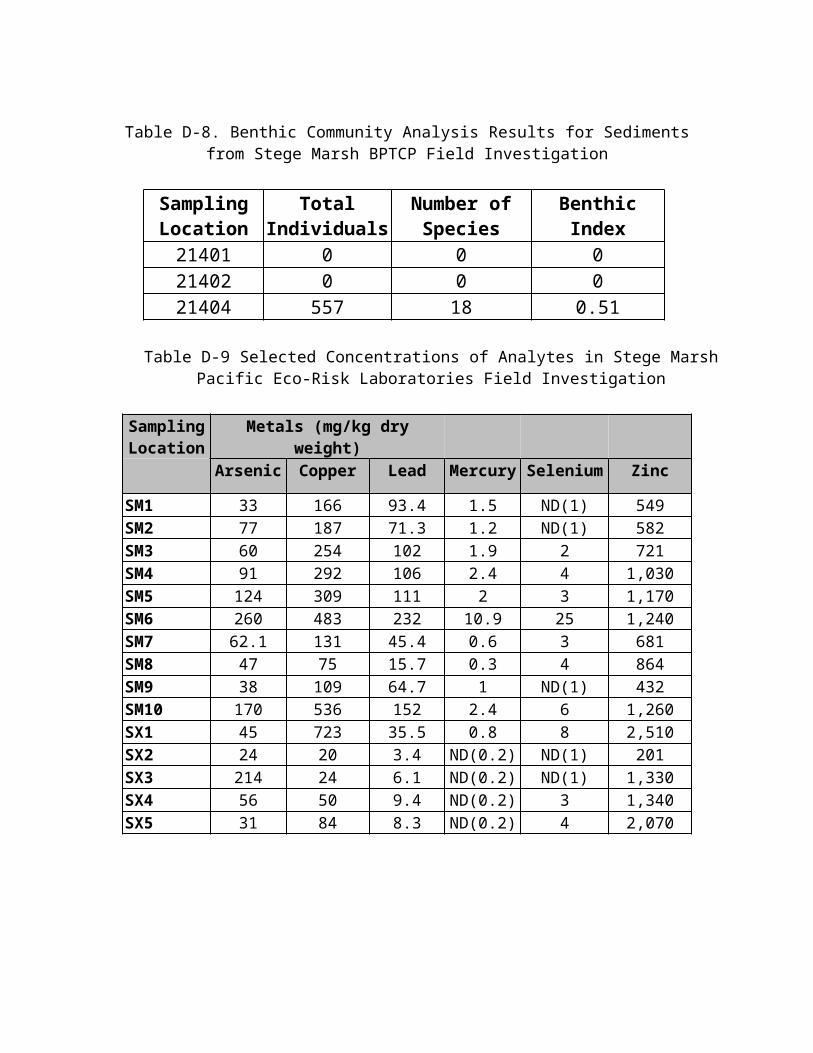
Sites of Concern (These sites do not qualify as Candidate Toxic Hot Spots)
Water body Name
SegmentName
Site Identification Pollutants Present Status/Comments Report reference
San Francisco Bay
South Bay Hunters Point Shipyard /Yosemite Creek & South Basin
PCBs, PAHs, DDT, chlordane, dieldrin, endrin, TBT, metals
Offshore Feasibility Study submitted in April 1998; studies in Yosemite Creek ongoing
6, 8, 15, 16, 23, 28, 30
San Francisco Bay
South Bay Alameda Naval Air Station Cr, Hg, PAHs, DDT, PCBs, TBT
Field work and analysis ongoing
11, 16, 19, 22, 35
San Francisco Bay
Central Bay Treasure Island Naval Station fuels, Ag, As, Cu, Hg, Pb, Zn
Offshore Remedial Investigation report submitted in June 1998
1, 3, 10, 16, 17, 18, 30, 36
Napa River Mare Island Straits
Mare Island Naval Shipyard As, Ag, Cr, Cu, Hg, Zn, TBT, PAHs, PCBs, dieldrin, endrin toxaphene
Risk characterization in progress
12, 16, 30, 37
Suisun Bay Suisun Bay Concord Naval Weapons Station
As, Cd, Cu, Pb, Zn Most contaminated area cleaned up, rest undergoing investigation
14, 16, 21, 24, 25, 38, 39, 40
San Francisco Bay
South Bay Moffett Naval Air Station Hg, Pb, Zn, PCBs, DDT, chlordane, PAHs
Finalizing Feasibility Study for cleanup at Eastern Diked Marsh and channels. Developing ecological monitoring program.
9, 13, 16, 20, 26, 27
Sites of Concern (These sites do not qualify as Candidate Toxic Hot Spots)
Water body Name
Segment Name Site Identification Pollutants present Status/Comments Report reference
San Francisco Bay
San Pablo Bay Hamilton Army Airfield Cr, Hg, Pb, PAHs, PCBs, DDT, petroleum
Currently validating ecological risk assessment
7, 16, 33, 34, 41
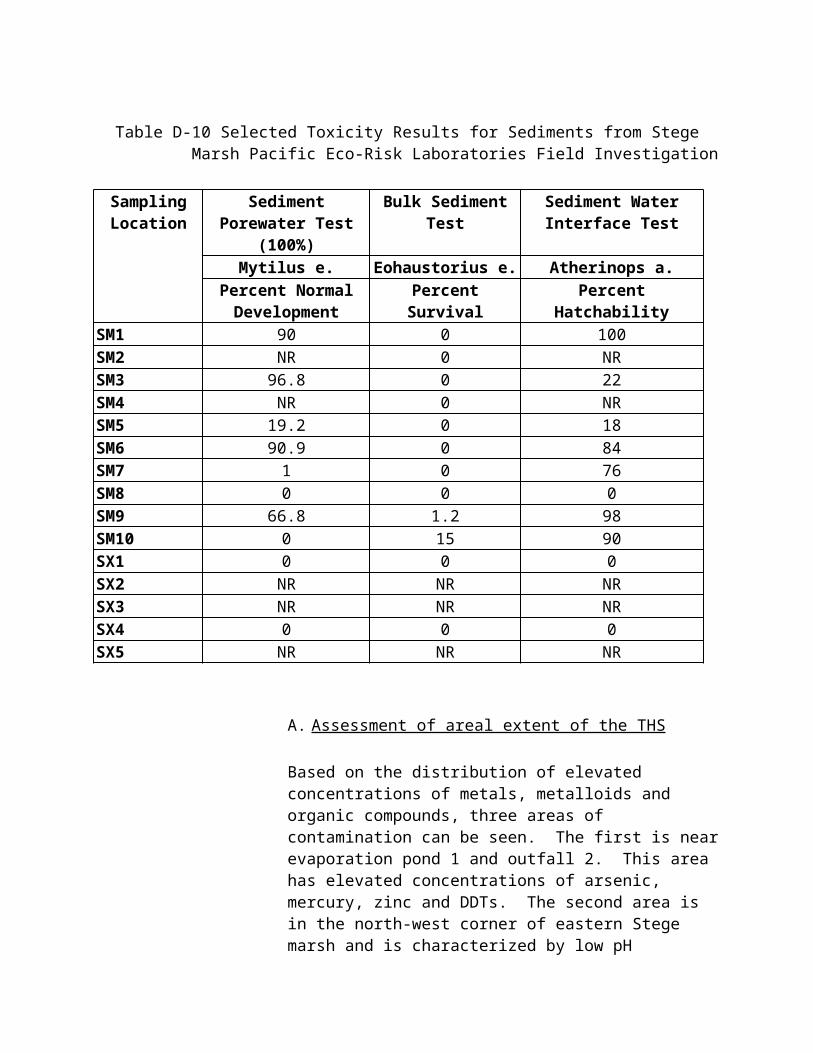
Water body Name
Segment Name Site Identification Pollutants present Status/Comments Report reference
San Francisco Bay
South Bay Shearwater/ U.S. Steel Pb, PCBs Regional Board approved remediation plan , Bay Area Conservation and Development Commission (BCDC) denied approval
16, 29, 30, 31, 32
San Francisco Bay
South Bay Warmwater Cove PAHs No toxicity in screening despite high levels of PAHs
4, 16, 30
San Francisco Bay
Central Bay Gashouse Cove PAHs Finished report on study to characterize aerial extent of contamination
2, 16, 30
San Francisco Bay
Richardson Bay Waldo Point PCBs, PAHs EIR released 5, 16, 30
Reference list
1. Anderson, S. L., J. P. Knezovich, J. Jelinski, and D. J. Steichen. 1995. The Utility of Using Pore-Water Toxicity Testing to develop Site-Specific Marine Sediment Quality Objectives for Metals. Report LBL-37615 UC-000, Lawrence Berkeley National Laboratory, University of California, Berkeley, CA.
2. Advanced Biological Testing (ABT). 1997. Results of Investigation of Sediments from Gashouse Cove in San Francisco Marina, San Francisco, CA.
3. Aqua Terra Technologies (ATT). 1991. Environmental Sampling and Analysis Plan for Naval Station, Treasure Island, Hunters Point, San Francisco, CA.
4. Dames & Moore. 1992. Data Report, Offshore Sediment Sampling, Army Street Site, San Francisco, California for Union Pacific Realty Co., Job No. 16515-015-043 GN-O-111.006 , Project #96231.
5. EDAW. 1997. Draft Environmental Impact Report for Waldo Point Harbor, Marin County. 6. EMCON Associates. 1987. Confirmation Study Verification Step, Hunters Point Naval Shipyard. Volumes 1-IV. San
Francisco, CA.
7. Engineering-Science, Inc. (ESI). 1993. Final Environmental Investigation Report, Hamilton Army Airfield, California. Prepared for the U.S. Army.
8. Environmental Science Associates (ESA). 1987. Final Environmental Impact Statement: Homeporting Battleship Battle Group/Cruiser Destroyer Group, Volumes 1,2 and 3. San Francisco, CA.
9. ESA. 1988. Dredge Sediment Evaluation, Naval Air Station, Moffett Field, Sunnyvale, CA.10. Hunt, J.W., B. Anderson, B. Phillips, J. Newman, R. Tjeerdema, M. Stephenson, M, Puckett, R. Fairey, R. Smith, K.
Taberski. 1998. Evaluation and Use of Sediment Reference Sites and Toxicity Tests in San Francisco Bay. For Ca. State Water Resources Control Board. pp. 132. Appendix A-D.
11. Harding Lawson Associates (HLA). 1988. Sediment Evaluation Alameda Naval Air Station, Piers 2 and 3, Alameda, CA. Concord, CA. Santina and Thompson, Inc.
12. IT Corp. 1992. Distribution and Environmental Fate of Metals and Organotin in Mare Island Strait near Building 900. Prepared for the Department of the Navy, San Bruno, CA.
13. Larry Walker and Associates & Kinnetic Laboratories. 1991. Summary Data Report: Toxicity Testing of Sediment Collected in the Vicinity of the Sunnyvale Water Pollution Control Plant (1989-1990). Prepared for the City of Sunnyvale.
14. Lee, C.R., L.J. O’Neil, D.L. Brandon, R.G. Rhett, J.G. Skogerboe, A.S. Portzer, and R.A. Price. 1988. Remedial Investigation of Contaminant Mobility at Naval Weapons Station, Concord, California. Subtitle Appendix 2.5 - 1986/87 Data, Miscellaneous Paper EL-86-3 (Draft Final Report), US Army Engineer Waterways Experiment Station, Vicksburg, MS.
15. O'Connor T. P. and B. Beliaeff. 1994. Recent Trends in Coastal Environmental Quality: Results from the Mussel Watch Project. National Status and Trends Program. Marine Environmental Quality. NOAA, NOS, ORCA, Coastal Monitoring and Bioeffects Division, Silver Spring, MD.
16. Office of Environmental Health Hazard Assessment (OEHHA). 1994. Health Advisory on Catching and Eating Fish-Interim Sport Fish Advisory for San Francisco Bay. Sacramento, CA.
17. PRC EMI Inc. 1993. Draft Phase I Remedial Investigation Report for Naval Station Treasure Island, California. Prepared for the Department of the Navy, San Bruno, CA.
18. PRC EMI Inc. 1993. Naval Station Treasure Island, California, Draft Ecological Risk Assessment Report. Prepared for the Department of the Navy, San Bruno, CA.
19. PRC EMI Inc. 1994. Draft Naval Air Station Alameda Draft Ecological Assessment. Prepared for the Department of the Navy, San Bruno, CA.
20. PRC EMI Inc. 1996. Final Station-Wide Remedial Investigation Report, Moffett Federal Airfield, California. Prepared for the Department of the Navy, San Bruno, CA.
21. PRC EMI Inc. 1996. After Remediation (Year 1) Monitoring Remedial Action Report, Litigation Area, Naval Weapons Station Concord, California. Prepared for the Department of the Navy, San Bruno, CA.
22. PRC EMI, Inc. 1996. Naval Air Station Alameda, California. Operable Unit 4 Ecological Risk Assessment Revision 2 Draft. Prepared for the Department of the Navy, San Bruno, CA.
23. PRC EMI, Inc. 1996. Phase 1B Ecological Risk Assessment Draft Report Hunters Point Shipyard, San Francisco, CA. 24. PRC EMI Inc. 1997a. After Remediation (Year 2) Monitoring Remedial Action Report, Litigation Area, Naval Weapons
Station Concord, California. Prepared for the Department of the Navy, San Bruno, CA.
25. PRC EMI Inc. 1997b. Qualitative Ecological Assessment Report, Litigation Area, Naval Weapons Station Concord, California. Prepared for the Department of the Navy, San Bruno, CA.
26. PRC EMI Inc. and Montgomery Watson. 1995. Final Phase I Site-Wide Ecological Assessment Report, Moffett Federal Airfield, California. Prepared for the Department of the Navy, San Bruno, CA.
27. PRC EMI Inc. and Montgomery Watson. 1997. Final Phase II Site-Wide Ecological Assessment Report, Moffett Federal Airfield, California. Prepared for the Department of the Navy, San Bruno, CA.
28. Parcel F Feasibility Study Draft Report, Hunters Point Shipyard, San Francisco, CA. 1998. Prepared by Tetra Tech EM Inc., and Levine-Fricke-Recon Inc.
29. San Francisco Bay Regional Water Quality Control Board (SFBRWQCB). 1996. Order No. 96-102. Adoption of Site Cleanup Requirements for USX Corporation and Bay West Cove LLC for the Property :Located at Shearwater Site, Oyster Point Blvd., South San Francisco, CA.
30. Hunt, J., B. Anderson, B. Phillips, J. Newman, R. Tjeerdema, K. Taberski, C. Wilson, M. Stephenson, H. Puckett, R. Fairey, J. Oakden. 1998. Sediment quality and biological effects in San Francisco Bay. For Ca. State Water Resources Control Board. pp. 188 + appendices A-E.
31. Treadwell and Rollo. 1995. Draft Workplan for Onshore Investigative, Bay West Cove, South San Francisco, California. Prepared for Bay West Cove LLC, San Francisco, CA.
32. Treadwell and Rollo. 1997. Workplan for Offshore Remediation and Wetland Mitigation, Bay West Cove, South San Francisco, California. Prepared for Bay West Cove LLC, San Francisco, CA.
33. United States Army Corps of Engineers (USACE). Supplement to the Final Environmental Investigation Report, Hamilton Army Airfield, California. Prepared for the U.S. Army.
34. Woodward-Clyde, Inc. 1996. Draft Additional Environmental Investigation Report, BRAC Property, Hamilton Army Airfield, California.
35. Chemical Data Summary Report for Offshore Sediment and Wetland Areas at Alameda Point, Alameda, CA. 1998. Prepared by Tetra Tech Em Inc. for EFA West, San Bruno, CA.
36. Remedial Investigation, Offshore Sediments Operable Unit, Naval Station Treasure Island, San Francisco, CA. 1998. Prepared by Tetra Tech EM Inc.
37. Draft Offshore Areas Ecological Risk Assessment, Mare Island, Vallejo, CA. 1998. Prepared by Tetra Tech EM Inc.38. After Remediation (Year 1) Monitoring Report, Litigation Area Sites, Concord Naval Weapons Station. 1996. Prepared by
Tetra Tech EM Inc.39. After Remediation (Year 2) Monitoring Report, Litigation Area Sites, Concord Naval Weapons Station. 1997. Prepared by
Tetra Tech EM Inc.40. After Remediation (Year 3) Monitoring Report, Litigation Area Sites, Concord Naval Weapons Station. 1998. Prepared by
Tetra Tech EM Inc.41. Draft Comprehensive Remedial Investigation Report, BRAC property, Hamilton Army Airfield, Novato, CA. 1998.
Prepared by IT Corporation for the Department of the Army, United States Army Corps of Engineers.
3
REGIONAL WATER QUALITY CONTROL BOARD, CENTRAL COAST REGION
REGIONAL TOXIC HOT SPOT CLEANUP PLAN
1
Region DescriptionThe Central Coast Regional Board has jurisdiction over a 300-mile long by 40-mile wide section of the State’s central coast. Its geographic area encompasses all of Santa Cruz, San Benito, Monterey, San Luis Obispo, and Santa Barbara Counties as well as the southern one-third of Santa Clara County, and small portions of San Mateo, Kern, and Ventura Counties. Included in the region are urban areas such as the Monterey Peninsula and the Santa Barbara coastal plain; prime agricultural lands as the Salinas, Santa Maria, and Lompoc Valleys; National Forest lands, extremely wet areas like the Santa Cruz mountains; and arid areas like the Carrizo Plain.
Historically, the economic and cultural activities in the basin have been agrarian. Livestock grazing persists, but it has been combined with hay cultivation in the valleys. Irrigation, with pumped local ground water, is very significant in intermountain valleys throughout the basin. Mild winters result in long growing seasons and continuous cultivation of many vegetable crops in parts of the basin.
2
Candidate Toxic Hot Spot List
These waterbodies warrant consideration as Toxic Hot Spots because they meet criteria for Candidate status described earlier in this report. Specific site information provides supporting documentation for the designation of the water body. “Pollutants present at each site” includes information from the Bay Protection and Toxic Cleanup Program, State Mussel Watch Program, Toxic Substances Monitoring Program, RWQCB sampling activities, and others. Chemicals which exceeded ERMs or PEL for sediment; EPA Screening Levels, NAS or FDA Action levels for tissue; or Basin Plan or Ocean Plan water quality violations are indicated in bold print.
Water body name
Segment Name
a Reason for Listing Pollutants present at the site Report reference
Moss Landing Harbor & Tributaries
Moss Landing Harbor
Sandholdt Bridge - Station #30007.0
Aquatic Life Concerns - Sediment Chemistry, Sediment Toxicity (multiple visits), bioaccumulation
Dieldrin, Chlordane, Total DDT, Toxaphene, PCBs, Endosulfan, Chlorpyrifos, Dacthal, Aldrin, HCH, Nonachlor, Diazinon, Endosulfan, Endrin, Ethion, Ethylparathion, gamma-chlordene, heptachlor epoxide, hexachlorobenzene, methoxychlor, chlorbenside
1, 3, 5, 6
Moss Landing Harbor
Moss Landing Yacht Harbor - Station #30004.0, Moss Landing South Harbor - Station #30005.0
Aquatic Life Concerns - Sediment Toxicity (single visit), Sediment Chemistry, bioaccumulation
Tributyltin, Dieldrin, PCBs, Total DDT, Toxaphene, Nickel, Dacthal, Endosulfan, Endrin, Heptachlor epoxide
1, 3, 5
Moss Landing Harbor & Tributaries
Elkhorn Slough
Andrews Pond - Station #31003.0, Egret’s Landing - Station # 31001.0,
Aquatic Life Concerns - Sediment Toxicity (multiple visits except Potrero Rd.), Sediment Chemistry,
Dieldrin, Nickel, Endosulfan, Endosulfan sulfate, Chemical Group A, Chromium, Dacthal, Heptachlor epoxide, PCBs,
1, 2, 5, 6
Water body name
Segment Name
a Reason for Listing Pollutants present at the site Report reference
Moss Landing Harbor & Tributaries
Potrero Rd - Station #30028.0
bioaccumulation (multiple exceedances of NAS and/or FDA guidelines)
Toxaphene, Endrin, Hexachlorocyclohexane (HCH)
Bennett Slough
Bennett Slough - Station #30023.0
Aquatic Life Concerns - Sediment Toxicity (multiple visits), Sediment Chemistry
Dieldrin, Nickel, Chromium 1
Tembladero Slough
Upper Tembladero (Alisal) – downstream of Salinas City - Station #36004.0, Tembladero - Station #36002.0
Aquatic Life Concerns, Human Health Concerns - Sediment Toxicity associated with Sediment Chemistry (single visit), bioaccumulation (multiple exceedances of NAS and/or FDA guidelines)
Chlordane, Dieldrin, Total DDT, Toxaphene, PCBs, Lindane, PAH, Endosulfan, Endosulfan sulfate, Chemical Group A, Aldrin, Chlorpyrifos, Dacthal, Endrin, Heptachlor epoxide, Hexachlorobenzene,Oxadiazon
1, 2, 6
Old Salinas River
Old Salinas River Channel - Station #36007.0
Aquatic Life Concerns - Sediment Toxicity associated with Sediment Chemistry (single visit), bioaccumulation
Dieldrin, Total DDT, Toxaphene, PCBs, gamma HCH, Aldrin, Chlorpyrifos, Dacthal, Endrin, Heptachlor epoxide, Hexachlorobenzene, Methoxychlor, oxydiazinon, Endosulfan
1, 5, 6
Espinosa Slough
Espinosa Slough - Station #36005.0
Aquatic Life Concerns, Human Health Concerns - Sediment Toxicity associated with Sediment Chemistry (single visit), bioaccumulation (multiple exceedances of NAS and/or
Dieldrin, DDT, Toxaphene, PCBs, Chlordane, Endosulfan, Endosulfan sulfate, Endrin, Heptachlor Epoxide, Chemical Group A
1, 2
Water body name
Segment Name
a Reason for Listing Pollutants present at the site Report reference
FDA guidelines)Moro Cojo Slough
Moro Coho Slough - Station #30019.0
Aquatic Life Concerns - Sediment Toxicity associated with Sediment Chemistry (single visit), bioaccumulation
Nickel, Dieldrin, Total DDT, Toxaphene, PCBs, Dacthal, Endosulfan, Heptachlor epoxide
1, 5
Salinas Reclamation Canal
Salinas Reclamation Canal – State Mussel Watch Sites #408.8, 408.9, 409.0
Human Health and Aquatic Life Concerns - bioaccumulation (multiple exceedances of NAS and/or FDA guidelines)
Chlordane, Total DDT, PCBs, Dieldrin, Chemical Group A, Endrin, Toxaphene, Endosulfan, Endosulfan sulfate, Heptachlor Epoxide, Diazinon, Aldrin, Dacthal, Hexachlorobenzene, Methoxychlor, Chlorpyrifos, alpha-Chlordene, gamma HCH, gamma-Chlordene, nonachlor
2, 5, 6
Blanco Drain State Mussel Watch Sites #407.4, 407.5, 407.8
Human Health and Aquatic Life Concerns - Bioaccumulation (multiple exceedances of NAS and FDA guidelines)
Chlordane, Total DDT, Dieldrin, PCBs, Toxaphene, Chemical Group A, Endrin, nonachlor, Aldrin, Hexachlorobenzene, Chlorpyrifos, Dacthal, Alpha-chlordene, gamma-chlordene
3, 4, 5, 6
Moss Landing Harbor & Tributaries
Salinas River Lagoon
State Mussel Watch Sites #405.6, 405.7, 405.8
Human Health and Aquatic Life Concerns - Bioaccumulation (multiple exceedances of NAS and FDA guidelines)
Total DDT, Dieldrin, PCBs, Toxaphene, Chlorpyrifos, Hexachlorobenzene, Aldrin, Dacthal, methoxychlor, Endrin, Endosulfan sulfate, Alpha-chlordene, Chlorbenzide, gamma HCH, Heptachlor epoxide
1, 5
Water body name
Segment Name
a Reason for Listing Pollutants present at the site Report reference
Canada de la Huerta
Shell Hercules Gas Plant, Santa Barbara County
Multiple Sites Aquatic Life Concerns - Sediment and water toxicity, sediment chemistry, bioaccumulationWater Quality Concerns – violation of Basin Plan and Ocean Plan standards
PCBs 8, 9, 10, 11, 12

References
1. State Water Resources Control Board, Central Coast Regional Water Quality Control Board California Department of Fish and Game, Moss Landing Marine Laboratories, University of California Santa Cruz. 1998. Chemical and Biological Measures of Sediment Quality in the Central Coast Region.
2. Rasmussen, D. and H. Blethrow. 1991. Toxic Substances Monitoring Program 1988-89 Data Report. State Water Resources Control Board, California Environmental Protection Agency. 91-1WQ
3. Rasmussen, D. 1992. Toxic Substances Monitoring Program 1990 Data Report. State Water Resources Control Board, California Environmental Protection Agency. 92-1WQ.
4. Rasmussen, D. 1993. Toxic Substances Monitoring Program 1991 Data Report. State Water Resources Control Board, California Environmental Protection Agency. 93-1WQ.
5. Rasmussen, D. 1995a. State Mussel Watch Program 1987-1993 Data Report (94-1WQ). State Water Resources Control Board, California Environmental Protection Agency.
6. Rasmussen, D. 1996. State Mussel Watch Program 1993-1995 Data Report (96-2WQ). November. State Water Resources Control Board, California Environmental Protection Agency.
7. Hunt, J. W., B.A. Anderson, B. M. Phillips, R.S. Tjeerdema, H. M. Puckett, and V. deVlaming. In press. Patterns of aquatic toxicity in an agriculturally dominated coastal watershed in California. Agriculture, Ecosystems and Environment.
8. Regional Water Quality Control Board Central Coast Region. October 1997. Post-Remediation Monitoring Report, Canada de la Huerta, Gaviota, Santa Barbara County.
9. Dames & Moore Consultants. January 15, 1998 “September 1997 Quarterly Sampling, Hercules Gas Plant Site, Area Energy LLC. Prepared for Area Energy LLC.
10. Dames & Moore Consultants. March 12, 1998. December 1997 Quarterly Sampling, Hercules Gas Plant Site, Area Energy LLC. Prepared for Area Energy LLC.
11. Dames & Moore Consultants. July 1, 1998. March 1998 Quarterly Sampling, Hercules Gas Plant Site, Area Energy LLC. Prepared for Area Energy LLC.
12. Dames & Moore Consultants. October 5, 1998. June 1998 Quarterly Sampling, Hercules Gas Plant Site, Area Energy LLC. Prepared for Area Energy LLC.
Ranking Matrix
A water body was ranked as a high priority candidate toxic hot spot if data collected to evaluate any of the first three categories (Human Health Impacts, Aquatic Life Impacts, or Water Quality Objectives) suggested that a "high" was merited. Information on aerial extent, and natural remediation potential are also included in the ranking matrix, when available, to help describe the problem. "No Action" indicates that no data is available for consideration (see Section IV).
Water body Name
Human Health Impacts
Aquatic Life Impacts
Water Quality Objectives
Areal Extent Remediation Potential
Overall Ranking
Moss Landing Harbor & Tributaries
Moderate High No Action >10 acres Moderate High
Canada de la Huerta
Moderate High High >10 acres High High
High Priority Candidate Toxic Hot Spot Characterization
Moss Landing and Tributaries
Moss Landing Harbor and associated drainages appear to meet the Bay Protection and Toxic Cleanup Program’s criteria for a “high priority toxic hot spot”. Moss Landing and the surrounding vicinity has special importance for both the State and Nation. Because of the unique nature of the marine environment within the area, the National Oceanographic and Atmospheric Administration (NOAA) established the Monterey Bay National Marine Sanctuary in 1992. Elkhorn Slough is a NOAA National Estuarine Research Reserve. These designations reflect the high resource values found within the area. Figure 1 shows the location of the Moss Landing area and associated subwatersheds of interest within Region 3.
Because of a “high” ranking for impacts to aquatic life due to sediment toxicity with confirming chemistry and tissue bioaccumulation, the areal extent of the problem, and the sensitive nature of the area, "high priority toxic hot spot" status is warranted for the Moss Landing area. The area was given a moderate ranking for Human Health because of pesticide levels in tissue repeatedly exceeding federal standards. It was not give a "high" ranking for Human Health because health advisories have not been issued recently.
Sediments from Moss Landing Harbor have been shown for a number of years to contain high levels of pesticides, in some cases at levels which cause concern for human and aquatic life. Concentrations of a number of pesticides in fish and shellfish tissue have exceeded National Academy of Sciences (NAS) Guidelines, USEPA Screening Values, and Food and Drug Administration (FDA) Action Levels.
In addition to pesticides, PCBs have also been identified as a concern in the Harbor and its watershed; they have been detected in shellfish tissue by the State Mussel Watch Program at elevated concentrations for many years.
High levels of tributyltin exceeding EPA Screening Values have been detected in mussel tissue at several locations in the Harbor. The Harbor’s watershed supports substantial agricultural and urban activities, which are sources of pesticides and other chemicals. Several chemicals detected by the program have been banned for many years (Figure 2). Although chemical types and usages have changed, banned chemicals, particularly chlorinated hydrocarbons, are still mobilized through eroding sediments. Actions to alleviate this problem consist of proper disposal of dredged materials, source control management measures for the chemicals of concern, and management of erosion of associated sediment.
AldrinChlordaneDDT (Total DDT)DieldrinEndrinHeptachlorToxaphenePCBsTributlytin ChlorpyrifosDacthalDiazinonEndosulfan
No longer in use No longer in use No longer in use No longer in use No longer in useNo longer in use No longer in use No longer in useNo longer in useCurrently in useCurrently in useCurrently in useRestricted
Figure 2. Use Status of Some of the Chemicals Found in Moss Landing Harbor and its Watershed.
Moss Landing was given a moderate "remediation potential" ranking according to BPTCP guidelines, since improvements may or may not occur over time without intervention. Although concentrations of persistent chemicals which have been banned will eventually decrease without action in aquatic systems, the time involved in significant reductions in the Harbor would have to be measured in decades. Reducing land erosion and implementing Best Management Practices in urban, agricultural and harbor areas will remediate the problem more rapidly and provide other benefits for both the land
and Harbor. Both chemical concentrations and the volumes of sediment which must be dredged from the Harbor will be reduced, improving aquatic habitat and reducing problems with dredge spoil disposal. Implementation of appropriate erosion control practices will serve to restore and protect the status of beneficial uses including navigation, aquatic life, and human health.
A. Assessment of areal extent. (Greater than 10 acres)
Moss Landing Harbor receives drainage water from Elkhorn Slough watershed, Moro Cojo Slough watershed, Tembladero Slough watershed, the Old Salinas River, and the Salinas River. Figure 3 shows the location of these water bodies. Elevated levels of chemicals were found associated with all of these water bodies.
The watershed areas include only the lower portions of the Salinas watershed. Some Salinas River water drains to the Old Salinas River and then to Moss Landing Harbor. A slide gate near the mouth of the Salinas River permits approximately 250 cubic feet per second to pass to the Old Salinas River (Gilchrist, et al., 1997). Other watercourses such as the Blanco Drain and the Salinas Reclamation Canal also drain either directly or indirectly to Moss Landing Harbor. The size of water bodies of immediate concern and their associated watershed subareas are indicated in Figure 4.
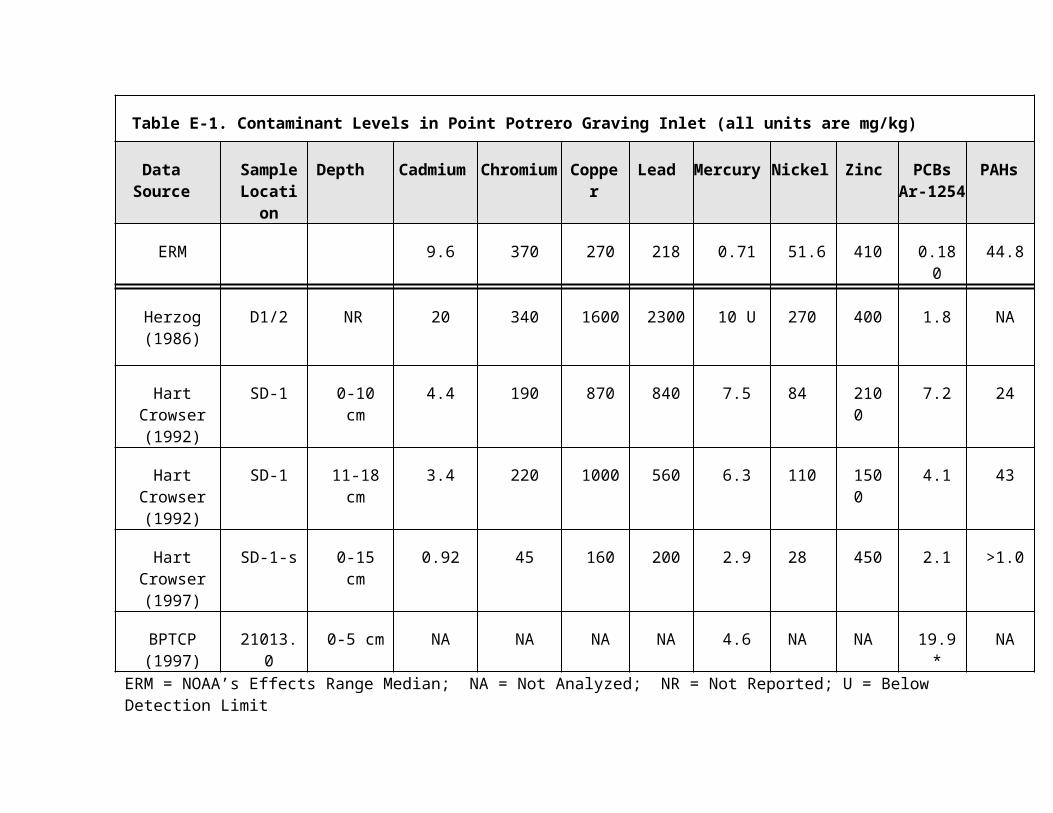
B. Assessment of most likely sources of pollutants.
The majority of chemicals found at excessive concentrations in the Harbor and its tributaries are pesticides, and most have already been banned. Figure 5 shows a summary of chemical exceedances of various guideline values for State Mussel Watch and Toxic Substances Monitoring Program data collected within the Moss Landing watershed in the past ten years in fish and shellfish data (Rasmussen, 1991, 1992, 1993, 1995a, 1995b, 1995c, 1996, 1997).
Tissue data (Rasmussen, 1995, 1996, 1997) shows that total DDT values in the southern Harbor increased dramatically after the end of the drought of the mid and late 1980’s. Other pesticides follow a similar trend (Figure 6). Nesting failure of the Caspian Tern (a bird species of special interest) in Elkhorn Slough in the heavy rain year of 1995 was attributed to high tissue levels of DDT resulting from storm-driven sediments (Parkin, 1998). High flow events carry large amounts of chemical-laden sediments into sensitive aquatic habitats and the Moss Landing Harbor. Soil erosion from numerous sources is a major transport mechanism for a variety of chemicals impacting the Harbor (Kleinfelder, 1993).
Figure 5. Number of exceedances of EPA Screening Levels, FDA Action Levels, and/or NAS levels for protection of Human Health and Wildlife for various chemicals in the Moss Landing Watershed (compiled from the State Mussel Watch and Toxic Substances Monitoring Program (1988 – 1996), and Bay Protection and Toxic Cleanup Program (1998).
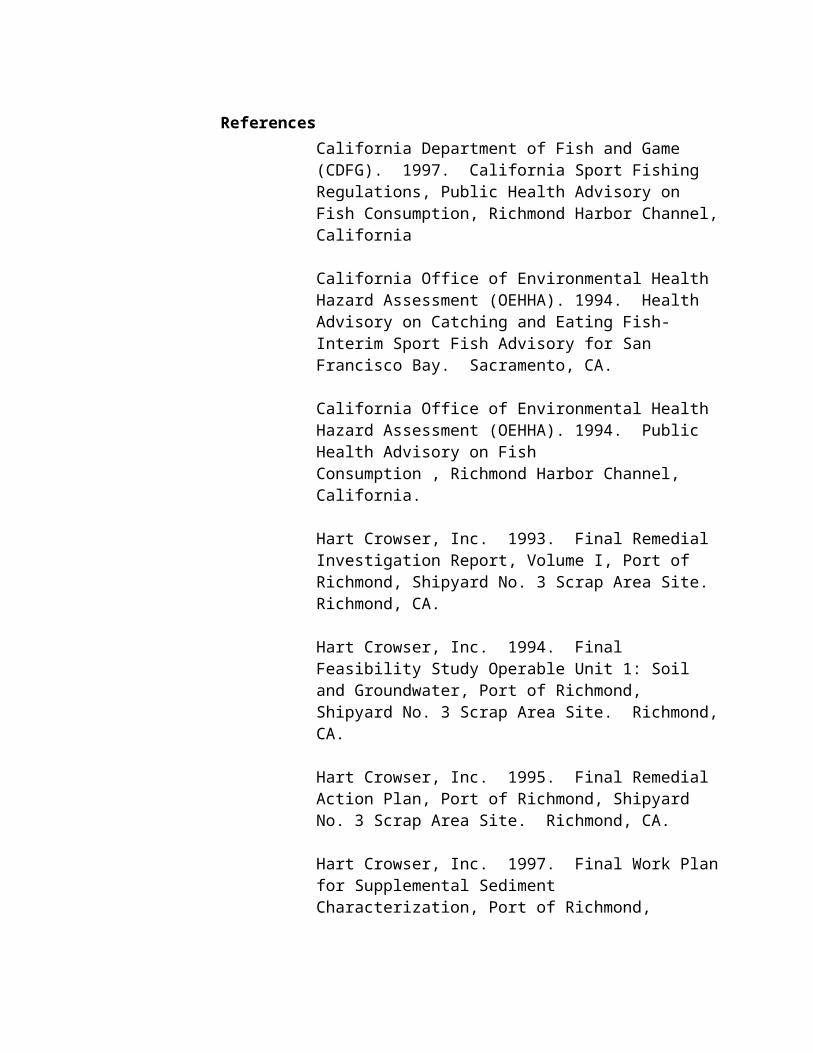
DDT
0200400600800
1000
02/8
2
11/8
3
02/8
5
11/8
5
03/8
6
11/8
7
12/8
8
02/9
1
03/9
4
Toxaphene
0100200300400500600
02/8
2
11/8
3
02/8
5
11/8
5
03/8
6
11/8
7
12/8
8
02/9
1
03/9
4
Dieldrin
01020304050
02/8
201
/85
02/8
509
/85
01/8
603
/86
02/8
702
/88
12/8
802
/90
01/9
203
/94
Endrin
05
101520
02/8
201
/85
02/8
509
/85
01/8
603
/86
02/8
702
/88
12/8
802
/90
01/9
203
/94
Chlorpyrifos
02468
02/8
2
11/8
3
02/8
5
11/8
5
03/8
6
11/8
7
12/8
8
02/9
1
03/9
4
Dacthal
050
100150200
02/8
2
11/8
3
02/8
5
11/8
5
03/8
6
11/8
7
12/8
8
02/9
1
03/9
4
Figure 6. Tissue levels of six pesticides in mussels at Sandholdt Bridge, 1982 - 1995. Measured in parts per billion, wet weight (of these, only Chlorpyrifos and Dacthal are still in use).
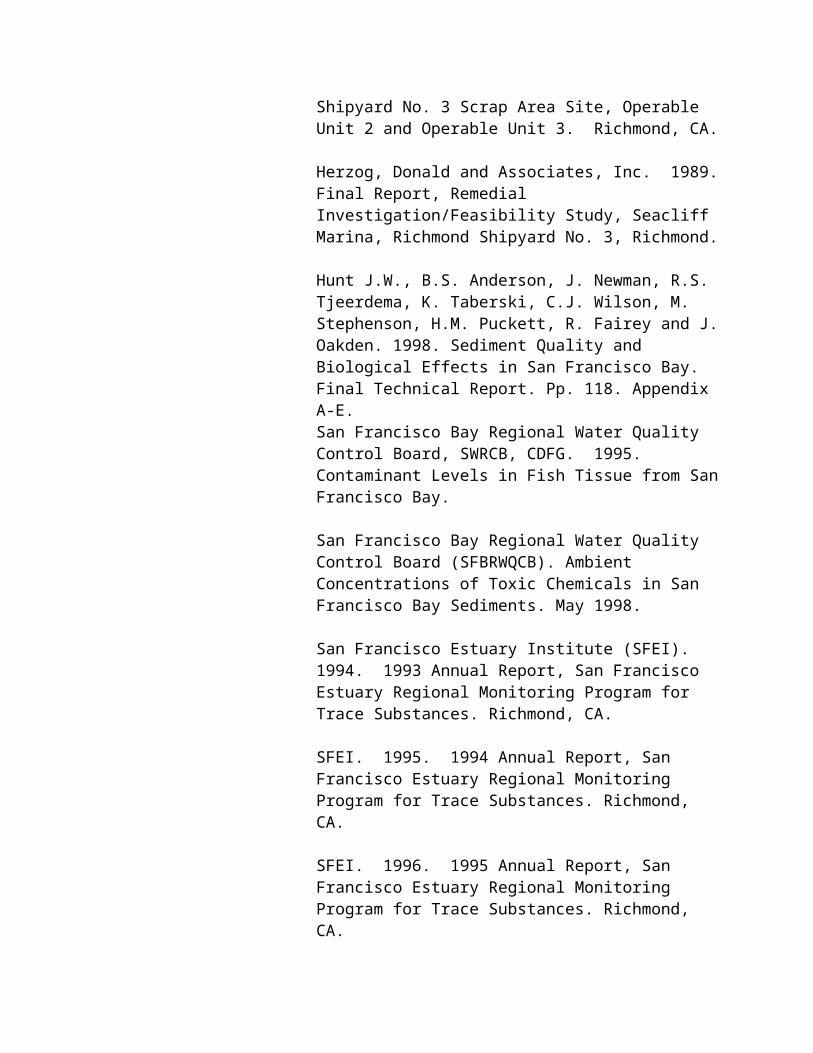
Agricultural Activities - Past and present storage and use of agricultural biocides is a primary source of chemicals found in Moss Landing Harbor. Fine sediment in runoff from agricultural land is the primary transport mechanism for many chemicals (Kleinfelder, 1993; NRCS, 1994; AMBAG, 1997). Erosion from farm land is a concern for private landowners and the public alike. Though most of the chemicals of concern are no longer applied to agricultural land, they are still present in soils. Banned chemicals found in soils tested on agricultural land in the Elkhorn Slough watershed include DDT and its breakdown products, Dieldrin, Endrin, Chlordane and Heptachlor Epoxide ( Kleinfelder, 1993, RWQCB, raw data 1998). Though PCBs were used extensively in industrial applications, prior to 1974 they were also components of pesticide products and may originate from agricultural as well as industrial sources (U.S. EPA Envirofacts, 1998). Several currently applied chemicals have been detected at various sites in the watershed, including Chlorpyrifos, Diazinon, Dimethoate and Endosulfan (Ganapathy, et al., draft). Amounts of a few of the pesticides applied during 1994-95 in the Salinas watershed are shown in Figure 7.
MethomylDiazinon ChlorpyrifosMalathionDimethoateCarbofuranEndosulfan
63,149 lbs. (Aug 94-July 95)62,000 lbs. (Aug 94–July 95)52,095 lbs. (Aug 94-July 95)42,519 lbs. (Aug 94-July 95)33,024 lbs. (Aug 94–July 95)19,982 lbs. (Aug 94-July 95)2,953 lbs. (Aug 94-July 95)
Figure 7. Examples of annual application rates of some pesticides in the Salinas Watershed (from Ganapathy, et al., draft).
River and Stream Maintenance ActivitiesLocal agency personnel indicate DDT was used for mosquito control in the sloughs draining to Moss Landing in past years (Stillwell, pers. comm., 1997). This must have introduced large amounts of DDT and its breakdown products directly into the river and estuarine systems.
River systems in the area have been treated for riparian plant control for a number of years in order to increase water supply and channel capacity (Anderson-Nichols & Co., 1985). Vegetation removal, which increases flow velocities and consequent sediment transport, may exacerbate erosion and transport of chemicals of concern.
Urban ActivitiesLarge amounts of certain pesticides are used in the urban environment. These have included chlordane and dieldrin for treatment of termites and other wood boring insects, and diazinon and other chemicals for household and garden use.
PCBs were widely used in industrial applications prior to 1974, when their use was confined to transformers and capacitors. They have not been used in any application since 1979. Because of their diverse past use and extreme persistence, they are still present at many sites throughout the watershed.
Polyaromatic Hydrocarbons (PAHs) are petroleum related chemicals. These are common pollutants in urban runoff, from improperly handled waste oil, street and parking lot runoff, and other sources.
Sampling conducted in Tembladero Slough for BPTCP found highest levels of dieldrin below the City of Salinas, exceeding Effects Range Median (ERM) values by six-fold. Concentrations of this chemical generally decreased with distance below the City. Other concentrations for nearly all measured pesticides and PAHs were higher here than anywhere else measured in the drainage. Both sediment and water toxicity were found at this site. (SWRCB et al., 1998). Because agricultural activity occurs above the City of Salinas and no sampling site was placed upstream of the City, it is not possible to discriminate between agricultural and urban sources at this time. However, the decrease in concentrations in downstream agricultural areas indicate that urban sources may be significant contributors and should be the subject of further study.
Harbor ActivitiesTributyltin has been documented over the years at several sites in Moss Landing Harbor. This chemical was the active ingredient in
antifouling paint for boat bottoms. Its use has been banned for many years, but it is persistent in the environment. Other chemicals associated with Harbor activities include PAHs, copper, zinc, and other metals.
C. A summary of actions that have been initiated by the Regional Board to reduce the accumulation of pollutants at Moss Landing Harbor and to prevent the creation of new THSs.
The Regional Board has long been involved in activities to address water quality issues in the Moss Landing area. The following are some of the Regional Board activities which either directly or indirectly address pollution at Moss Landing Harbor and its tributaries:
Issuance and enforcement of Discharge Permits and CWA 401 Certifications 303(d) listings of water quality limited water bodies Watershed Management Initiative activities
Issuance of Discharge Permits and CWA 401 CertificationsExisting RWQCB Waste Discharge Requirements for the Moss Landing Harbor District, U.S. Army of Corps of Engineers, National Refractories, and Pacific Gas and Electric Co. (now Duke Energy), contain prohibitions and limitations on the quality of effluent discharges to the ocean. These limitations are for the protection of beneficial uses. RWQCB staff also review Army Corps permitted activity, pursuant to the Clean Water Act Section 401 Water Quality Certification Program.
Harbor Dredging Activities The Moss Landing Harbor has suffered from severe sedimentation for a number of years; this has been exacerbated by high flows during the winter of 1997/98 which have made the Harbor nearly unusable for many vessels and landlocked some at their moorings. The Harbor District requested an increase of up to 150,000 cubic yards for 1998 and 1999 to address the current sedimentation problems.
Recent results of sediment sampling and analysis (Harding, Lawson, & Assoc., July 7, 1998 Draft) indicate that sediment quality in Moss Landing Harbor varies with depth and location,
with some sediments showing significant toxicity and high chemical concentrations, and others suitable for unconfined aquatic disposal.
Suitable dredge material has been used for beach replenishment, or is disposed offshore at one of two areas. The disposal areas are located within the Monterey Bay National Marine Sanctuary and authorization to dispose of material at these sites is allowed under a grandfather clause. Dredging activities have occurred since the early 1950’s, but there have been no focused studies of unconfined aquatic disposal of inner harbor material, and ultimate impacts are unknown.
Because of the long history of monitoring data indicating elevated levels of pesticides in inner harbor sediments, several regulatory agencies, including the U.S. Environmental Protection Agency and the Monterey Bay National Marine Sanctuary, expressed concerns in recent years regarding the suitability of the material for unconfined aquatic disposal. Dredging of inner harbor fine grain sediments has been limited during the past five years as a result of these concerns. Dredged materials which do not meet certain quality standards must be disposed of using sites located on land. The cost of upland disposal is considerably more expensive than unconfined aquatic disposal (Jim Stillwell, pers. comm., 1997).
The Regional Board has worked with other regulatory agencies in an effort to develop a sediment sampling and disposal suitability plan for the Monterey area. The basis of Board approval is a determination of beneficial use protection. The Board is currently involved in a dialog with the U.S. EPA, U.S. Army Corps of Engineers, California Dept. of Fish and Game, the California Coastal Commission, and Monterey Bay National Marine Sanctuary, regarding sampling and disposal of dredge spoils in the Moss Landing area. Moss Landing Harbor District has recently obtained several million dollars in Federal Emergency Management Act funding for dredging the Harbor, securing an upland disposal site, and possibly conducting a ecological risk assessment on contaminated sediments in the Harbor.
303(d) Listings of Water Quality Limited Water BodiesCurrently, the Regional Board has listed Moss Landing Harbor, Elkhorn Slough, Espinosa Slough, Moro Cojo Slough, Old Salinas River Estuary, Salinas River Lagoon, Salinas River Reclamation Canal, and Tembladero Slough on the 303(d) list of water quality limited water bodies. All of these water bodies are listed for pesticides and other problems. A Total Maximum Daily Load analysis for pesticides, which assesses sources and allocates loadings appropriately, must be developed for all of these waters. Once developed, management activities will be prioritized to best address various sources. The Regional Board will coordinate development of Total Maximum Daily Loads for pesticides with

interested and responsible landowners, organizations and agencies. Coordination will occur through meetings, workshops, preparation and review of written documentation and implementation of existing memorandums of understanding or management agency agreements. For example, in the case of currently registered pesticides, the Regional Board will coordinate with DPR through the State Water Resources Control Board’s Management Agency Agreement.
Watershed Management InitiativeIn order to more effectively utilize limited resources, the Regional Board is implementing the Watershed Management Initiative (WMI), the purpose of which is to direct State and federal funds to the highest priority activities needed to protect water quality. The WMI is attempting to achieve water quality goals in all of California's watersheds by supporting development of local solutions to problems with full participation of all affected parties (this constitutes a “watershed management approach”).
One objective of the Regional Board’s WMI effort is to integrate and coordinate permitting, enforcement, implementation of the Coastal Zone Act Reauthorization Amendments, basin planning, monitoring and assessment, total maximum daily load (TMDL) analysis, groundwater protection and nonpoint source (NPS) pollution control activities within watersheds.
As part of the WMI effort, the Regional Board has identified several target watersheds in the region, based on severity of water quality impacts. The Salinas River Watershed is currently the Region’s top priority watershed.
Salinas River Watershed Strategy In 1996, the Central Coast Regional Board established the Salinas River Watershed Team to develop a pilot watershed management approach to address water resource issues in the Salinas River watershed. The Team has outlined a two-year Salinas River Watershed Team Strategy (1996) to develop a Watershed Management Action Plan, which is scheduled to be completed by December 1998. The Team's goal is to promote integrated/coordinated water resource protection, enhancement,

and restoration in the Salinas River Watershed. The general steps to accomplish this goal include the following:
1. Implement Existing Regulatory Responsibilities within the Watershed
2. Implement Watershed Activities3. Characterize the Watershed4. Identify and Evaluate Water Resource Issues/Areas5. Develop a Watershed Management Action Plan6. Implement the Plan7. Evaluate Progress
Staff is currently implementing watershed activities by facilitating grant funding, supporting and participating in activities of the Water Quality Protection Program of the Monterey Bay National Marine Sanctuary, coordinating with the Central Coast Regional Monitoring Program, participating and supporting education and outreach efforts, and coordinating with other agencies on permit streamlining and resource protection activities. The Regional Board has committed staff time and resources towards watershed management in the Salinas River watershed. The Regional Board has also given the Salinas River Watershed priority for receipt of grant funding under Sections 205(j) and 319(h) of the Clean Water Act.
Nonpoint Source Program The Regional Water Quality Control Board has been implementing its nonpoint source program in the tributaries to Moss Landing for a number of years and is continuing to do so as part of its WMI effort. The Regional Board’s nonpoint source program incorporates a tiered strategy for obtaining control of nonpoint source pollution. Consistent with the 1988 State Board Nonpoint Source Management Plan, Region 3 advocates three approaches for addressing nonpoint source management in the tributaries to Moss Landing Harbor (from the Central Coast Basin Plan, 1996).
1. Voluntary implementation of Best Management Practices
Property owners or managers may volunteer to implement Best Management Practices.
2. Regulatory Encouragement of Best Management Practices
Although the California Porter-Cologne Water Quality Control Act constrains Regional Boards from specifying the manner of compliance with water quality standards, there are two ways in which Regional Boards can use their regulatory authorities to encourage implementation of Best Management Practices.
First, the Regional Board may encourage Best Management Practices by waiving adoption of waste discharge requirements on condition that dischargers utilize Best Management Practices. Alternatively, the Regional Board may encourage the use of Best Management Practices indirectly by entering into management agreements with other agencies which have the authority to enforce the use of Best Management Practices.
3. Adoption of Effluent Limitations
The Regional Board can adopt and enforce requirements on the nature of any proposed or existing waste discharge, including discharges from nonpoint sources. Although the Regional Board is constrained from specifying the manner of compliance with waste discharge limitations, in appropriate cases, limitations may be set at a level which, in practice, requires the implementation of Best Management Practices.
In general, the Regional Board’s approach to addressing sediment and its associated pollutants follows this three tiered approach. The voluntary approach is predominantly utilized, with resources committed to planning, educational outreach, technical assistance, cost-sharing and BMP implementation.
Urban Runoff ManagementRegional Board has been reviewing phases of the application for an NPDES Municipal Storm Water Permit from the City of Salinas. The city of Salinas is developing and implementing management practices and will be conducting monitoring of urban discharges as part of that permit.
Regional Board staff participated in development of The Model Urban Runoff Guide with the Cities of Monterey and Santa Cruz and the Monterey Bay National Marine Sanctuary. This project was funded under a 319(h) grant.
Implementation of strategies contained in the MBNMS Action Plan for Implementing Solutions to Urban Runoff (1996) are currently in progress. Seven strategies are identified in this plan:
Public Education and OutreachTechnical TrainingRegional Urban Runoff ManagementStructural and Nonstructural ControlsSedimentation and ErosionStorm Drain InspectionCEQA Additions
Clean Water Act Section 319(h) and 205(j) Grants A number of projects have been undertaken in the affected area using Clean Water Act (CWA) funding, provided by the United States Environmental Protection Agency and administered by the State and Regional Boards. Some of these projects are described in more detail below.
The Elkhorn Slough Agricultural Watershed Demonstration Program was developed by the State Coastal Conservancy and the Elkhorn Slough Foundation. This project included implementation of a series of BMP's on agricultural lands in Elkhorn Slough watershed, including filter strips, sediment basins, farm road revegetation and realignment, and riparian corridor restoration. The project also included developing a characterization of agricultural activities in the watershed in cooperation with U.C. Santa Cruz, the Elkhorn Slough Foundation and the Nature Conservancy, developing a demonstration project and associated agricultural/environmental education outreach program, and coordinating with activities of various agencies.
A 205(j) grant was obtained by the Association of Monterey Bay Area Governments (AMBAG) to develop the "Northern Salinas Valley Watershed Restoration Plan”. The Watershed Restoration Plan discusses pesticide pollution entering Moss Landing Harbor through its southern tributaries, including the Salinas River, Tembladero Slough, and Moro Cojo Slough, and recommends Best Management Practices to help alleviate this problem. The program emphasizes the use of "wet corridors" as a means of reducing sediment delivery to waterways. A number of Best Management Practices have been implemented associated with this plan. Several wet corridors have been installed by the Watershed Institute (California State University at Monterey Bay). Several other project sites for wet corridors have been identified in need of funding.
The Moro Cojo Slough Management and Enhancement Plan, prepared for the State Coastal Conservancy and Monterey County, was funded by a number of agencies, including the State Board. This document examines several alternative plans for management of the lower slough and recommends Best Management Practices for implementation in the entire watershed. As part of plan implementation, two hundred acres in the lower slough have recently been acquired through Coastal Conservancy funds for restoration as wetland and floodplain.
The Elkhorn Slough Uplands Water Quality Management Plan, developed for AMBAG, examined the effectiveness of Best Management Practices at reducing pesticide runoff from strawberry fields on study sites in the Elkhorn Slough watershed, and makes recommendations for Land Use Policies and implementation of Best Management Practices.
The Model Urban Runoff Program, developed under a 319(h) contract, is a pilot project by the cities of Monterey and Santa Cruz which has produced a user’s guide for small municipalities to help them develop effective storm water management programs.
There are currently five new 319(h) contracts awarded in the Salinas River Watershed. These projects will demonstrate the use of restored wetlands as filters for pollutants and as ground water recharge areas; reduce nitrate loading to ground water through demonstrating and promoting agricultural best management practices; promote citizen monitoring in the watersheds of the Monterey Bay National Marine Sanctuary; reduce erosion and sedimentation on the east side of the Salinas Valley; and develop an expedited permitting process to encourage implementation of agricultural best management practices for reduction of erosion and sedimentation.
Coordination with Existing Resource Protection Efforts A number of other programs have been initiated in the past decade to address erosion and pesticide problems impacting Moss Landing Harbor and its watershed. The Regional Board has been involved in funding or providing technical support for many of these programs. Numerous land management plans have been developed for the various watersheds and tributaries within the Moss Landing watershed, and extensive effort has been dedicated to education, outreach, and technical assistance to agricultural landowners and operators.
The Water Quality Protection Program for the Monterey Bay National Marine Sanctuary (WQPP) is a cooperative effort of many agencies and entities working in the watersheds of the Sanctuary to protect the water quality of the Sanctuary. The Regional Board is a signatory of a Memorandum of Agreement between agencies which deals with water quality activities within the Sanctuary and its watersheds. The Regional Board participates in a number of programs related to Sanctuary efforts, including the WQPP. Regional Board staff are members of the WQPP Water Quality Council. Staff attend meetings and have worked with other Council members in developing and reviewing strategies to address problems facing the Sanctuary.
The WQPP has developed Action Plans to address water quality needs related to Urban Runoff and Boating and Marinas within the Sanctuary. These documents contain information pertinent to problems identified at Moss Landing Harbor. Full implementation of these plans will help address problems related to tributyltin, PCBs, PAHs, and other pollutants found in the Harbor and downstream of the City of Salinas.
The WQPP is currently involved in work with the agricultural community to develop an Agricultural Action Plan to better protect water quality. A number of meetings have been held with the agricultural community to acquire its input during the plan development process. The Regional Board has been an active participant in these meetings. The Action Plan focuses on a variety of ways to encourage the adoption of management measures to reduce sedimentation, pesticide and nitrate runoff through improvements in technical training, education, demonstration projects, economic incentives, regulatory coordination, etc.
The plan will be linked with the State Farm Bureau Federation’s new Nonpoint Source Initiative which proposes that Farm Bureaus take a leadership role in establishing landowner committees and active projects to address nonpoint pollution. Six county Farm Bureaus on the Central Coast have developed an intercounty agreement to work together as an agricultural implementation arm of the WQPP, and to establish Farm Bureau-led pilot projects which will evaluate and implement management measures and track success over time. The local and state Farm Bureaus will work with the various WQPP members, particularly with the Regional Board as a key player, to ensure that their nonpoint efforts can help meet the water quality goals of a variety of agencies and sustain the agricultural economy.
The Natural Resources Conservation Service (NRCS) and Monterey County Resource Conservation District have been involved in technical assistance and bilingual educational outreach to the growers in the Elkhorn and Moro Cojo Slough watersheds, through the Elkhorn Slough Watershed Project (1994). This project focuses particularly on outreach to ethnic minority farmers and strawberry growers. Its goal is to produce a fifty percent reduction in erosion, sediment, and sediment-borne pesticides. It strives to reconcile some of the socio-economic factors hindering adoption of BMPs, including high land rental and production costs, leasing arrangements and unfamiliarity with technical services and opportunities. Funding has been provided to this program through the SWRCB Cleanup and Abatement Fund.
The U.S. Army Corps of Engineers has issued a regional, watershed permit to the NRCS and the Resource Conservation District for activities in and around streams associated with restoration efforts in the Elkhorn Slough area. This is a pilot permit streamlining effort to encourage landowners to implement management practices which protect water quality. Landowners working with the NRCS on approved management practices and meeting specific design conditions can be included in a regional watershed permit held by NRCS and the Resource Conservation District rather than applying for individual permits or agency approvals.
The Farm Services Agency and the Natural Resources Conservation Service of the U.S. Department of Agriculture have designated Elkhorn Slough and the Old Stage Road area on the East Side of the Salinas Valley as priority areas for cost sharing under the Environmental Quality Incentive Program (EQIP). Decisions on priority areas and other aspects of the EQIP program are made by local work groups, whose members include landowners, and staff from NRCS, resource conservation districts, Regional Boards, county planning departments and UC Cooperative Extension.
The State Coastal Conservancy and the County of Monterey funded the Elkhorn Slough Wetlands Management Plan (1989). This document describes problems in Elkhorn Slough resulting from erosion, pesticides, bacteria and sea water intrusion, describes enhancement plans for five major wetlands in the Slough, plans for public access, and proposed implementation for management problem areas. It includes a lengthy discussion of pesticide use in Elkhorn Slough and the Salinas River area.
Monterey County Water Resources Agency and the Salinas River Lagoon Task Force, with funding provided by a number of agencies, developed the Salinas River Lagoon Management and Enhancement Plan (MCWRA, 1997). This document describes natural resources of the area, as well as some land management issues of concern associated with this lagoon. The document encourages the participation of Task Force members in the WQPP planning process, and recommends that an Interagency/Property Owners Management Committee be formed to ensure implementation of the Management Plan. Funds have recently been obtained to begin implementation of portions of this plan related to bank revegetation.
Monterey County Water Resources Agency has also developed a Nitrate Management Program as part of the Salinas Valley Water Project (formerly the Basin Management Plan). This long-term program will address reduction of the transport of toxic pollutants, specifically nitrate, through implementation of “on-farm management” outreach and education programs, as recommended by the Salinas Valley Nitrate Technical Advisory Committee in October 1997. Additionally, the Water Conservation Section of the Agency has promoted and fostered water conservation and fertilizer management programs since the early 1990s. These efforts have been focused on reducing the transport of toxic pollutants, specifically nitrate to ground water. Simultaneously, they have resulted in reducing the transport of toxic pollutants to surface waters as well.
D. Preliminary Assessment of Actions required to remedy or restore Moss Landing Harbor to an unpolluted condition
Actions necessary to restore Moss Landing Harbor to an unpolluted condition include both removal of contaminated sediments through dredging and control of the sources of pollutants in the watersheds tributary to the harbor.
As discussed previously, the pollutants of concern in Moss Landing Harbor and its tributaries include sediment, pesticides, tributyltin and several metals. Sources include urban runoff, runoff from agricultural fields and activities associated with boating and marinas.
Listed below are recommended actions, followed by a more detailed description of each item:
Dredging and appropriate disposal of sediments Control of Harbor Pollutants: Implementation of the Marinas and Boating Action Plan developed by WQPPControl of Urban Runoff:Implementation of the Urban Runoff Action Plan developed by WQPP
Implementation of an approved storm water management plan for the City of Salinas
Use of the Model Urban Runoff Guide by small municipalitiesImplementation of management practices to reduce nonpoint source pollution from agriculture
Dredging It is not the intent of this cleanup plan to originate new requirements or actions associated with the dredging of the Harbor. The problems associated with dredging projects are well known and are the topic of continuing interagency discourse. The gravity of the problems facing the Moss Landing Harbor caused the United State Congress to seek funding specifically for this purpose. In addition, several million dollars in Federal Emergency Management Act money have been acquired by the Harbor District to address dredging issues.
Sediment originating in upland watershed areas will continue to be deposited in the harbor and disrupt navigation. This material will continue to present a dredging and disposal problem, as long as it contains pesticides and other pollutants. An upland site for drying and processing dredge spoils has been established in the North Harbor area, but upland disposal is significantly more expensive and labor intensive than offshore disposal. The sedimentation itself, and the financial burden of dredge spoil disposal, create adverse impacts to the Harbor District, marine research community, fishing industry and other harbor interests. The best long term solution is source control of sediment within the watershed.
The current dredging activities are expected to deal with much of the excess sediment in the Harbor area itself. However, dredging will provide only a partial solution to an ongoing problem of sediment and pollutants entering the harbor from the watershed. This plan focuses cleanup efforts at the sources of sediment and associated pollutants.
Control of Harbor PollutantsA number of activities are generated at harbors as a result of boat maintenance and other activities. Tributyltin, one of the chemicals of major concern, has long since been banned. However, other problem chemicals, including PAHs, copper, zinc, and other metals, can still create pollution problems in poorly flushed Harbor areas.
Implementation of the Boating and Marinas Action Plan Developed by the WQPP will contribute to reduction of pollutants resulting from harbor activities. Seven strategies are identified in this plan:
Public Education and OutreachTechnical TrainingBilge Waste Disposal and Waste Oil RecoveryHazardous and Toxic Materials ManagementTopside and Haul-out Vessel MaintenanceUnderwater Hull MaintenanceHarbor Pollution Reduction Progress Review
A position has recently been created to address the various water quality issues in the Harbors and Marinas of the Sanctuary.
Control of Urban Runoff Urban runoff from the city of Salinas is a probable source of some of the contamination in the Moss Landing Harbor watershed. The city of Salinas is in the process of obtaining an NPDES Municipal Storm Water Permit through the RWQCB, and will implement management practices and conduct monitoring of urban discharges as part of that permit.
Other smaller cities will soon be required to develop municipal storm water programs as well. The Model Urban Runoff Guide developed by the Cities of Monterey and Santa Cruz and the Monterey Bay National Marine Sanctuary under a 319(h) grant will be promoted for use by small municipalities throughout the area.
Continued and increased implementation of strategies contained in the MBNMS Action Plan for Implementing Solutions to Urban Runoff (1996) will also reduce urban
pollution discharges. Seven strategies are identified in this plan:
Public Education and OutreachTechnical TrainingRegional Urban Runoff ManagementStructural and Nonstructural ControlsSedimentation and ErosionStorm Drain InspectionCEQA Additions
The State Water Resources Control Board’s management agency agreement with the Department of Pesticide Regulation (DPR) provides another mechanism for developing strategies for reducing problems associated with runoff of pesticides into urban waters. The Regional Board will coordinate with DPR in developing and implementing such strategies.
Implementation of Management Practices to Reduce Nonpoint Source Pollution from Agriculture
There are currently many activities taking place within upland areas which can potentially reduce the movement of sediments containing pesticides from agricultural lands. In order to ensure increased implementation of management practices, the following actions are recommended:
Implement the Regional Board’s Watershed Management Initiative. To further the restoration process in the tributaries to Moss Landing Harbor the Regional Board will continue with implementation of the Salinas River Watershed Team Strategy and development of a watershed management action plan for the Salinas River Watershed. The scope of this effort should be expanded to include all tributaries to Moss Landing Harbor. This expansion will not be feasible without the addition of another staff person. Funding for this person is included in the estimates of cleanup costs in Section E of this Cleanup Plan.
Increase support for education and outreach. Many activities and planning efforts are already underway by other agencies in the tributaries to Moss Landing Harbor, and have been described in this report. The Regional Board supports many of these activities through funding, technical support, or other means. It is important that implementation activities be continued and whenever possible, accelerated. The importance of education and outreach can not be overemphasized. Providing and facilitating funding for these efforts is a priority action of this cleanup plan.
Develop and promote a variety of tools to control agricultural nonpoint source pollution. Agricultural nonpoint source pollution is diffuse by nature and is generated from a variety of
crop types and land use configurations. Landowner attitudes towards government involvement in private property management vary considerably. It is important that a number of tools be available for implementing solutions and that a wide variety of approaches be applied by various agencies. These may include development of land management plans, cost sharing programs, educational programs, technical support programs, demonstration projects, land easement acquisition programs, purchase of critical areas for floodplain restoration and wetland buffer development, and so on. The Regional Board will work with state and local Farm Bureaus and the WQPP to develop effective strategies.
Coordinate implementation of existing land management plans. A number of agencies and landowners have developed land management plans and are already actively involved in erosion control activities in the tributaries to Moss Landing. Many of these documents list Best Management Practices and make recommendations for site specific implementation projects. To ensure that the numerous management plans developed for this area are implemented in a coordinated and effective fashion, it is recommended that an agency and landowner task force or other coordinating body be designated to assume a lead role in prioritizing and implementing actions.
Build on existing plans and programs. Work with the Natural Resources Conservation Service and other agricultural extension agencies to develop resource management plans which address both economic and environmental concerns.
Increase effective use of land use policies and local ordinances. Local agencies can utilize land use policies and ordinances to provide incentives for retirement of marginal or highly erodible agricultural lands which are sources of sediment and pollutants, such as those on steep slopes. Local agencies should utilize erosion control policies and ordinances to discourage activities which create excessive soil erosion. Local agencies, however, are often underfunded. Investigation of means of increasing the ability of local agencies to effectively enforce ordinances would be of benefit.
Increase technical assistance and outreach to landowners. Most private landowners are concerned with soil loss and pesticide use, for both environmental and economic reasons. Excessive or inappropriate use of pesticides can increase operating costs. Excessive soil erosion can increase land maintenance costs and result in irreversible impacts to land productivity. It has been estimated that strawberry farmers in the Elkhorn Slough watershed lose $1.7 million per year as a result of soil erosion (NRCS, 1994). Many landowners are familiar with Integrated Pest Management and basic erosion
control practices and have worked with the Natural Resources Conservation Service and other technical agencies on land management issues. However, many farmers are uncomfortable or unfamiliar with the use of government assistance, and are unsure how to obtain such assistance (NRCS, 1994). This effort could be facilitated through development of short courses for row crops and vineyards, similar to the Ranch Water Quality Planning courses being offered statewide the University of California Cooperative Extension.
Support joint efforts of the California Farm Bureau Federation’s Nonpoint Source Initiative and the Water Quality Protection Program. The California Farm Bureau Federation has developed a statewide nonpoint source initiative to address water quality concerns. The initiative is based on a voluntary watershed planning process to be developed by landowners and coordinated through local farm bureaus. Farm bureaus in three watersheds tributary to Monterey Bay National Marine Sanctuary, including the Salinas River Watershed, will be working with the Water Quality Protection Program of the Sanctuary to develop pilot projects. Work with the WQPP and the Farm Bureau to ensure that the action plans developed for protection of water quality in the Sanctuary reflect agricultural needs and issues as well as regulatory requirements.
Encourage broad implementation of management practices to solve multiple problems. Many practices exist which can reduce the delivery of pesticides to waterways. It is not the intent of this document to present a comprehensive list of practices that should be implemented. Many sources of guidance are available which address this issue. Also, these practices must be selected and tailored to the specific conditions at each site, combining the expertise of the grower/rancher and technical outreach by agencies as necessary. Some of the major approaches which can be utilized by the agricultural community are summarized below:
· Maintain a vegetative buffer area between creek drainages and agricultural activities. Wider buffer areas should be utilized adjacent to larger creeks.
· Revegetate drainageways with grass or suitable wetland vegetation.
· If levees are utilized, set them back from creek channels to provide a flood plain within the area of channelized flow.
· Restore channelized areas wherever possible to a more natural flood plain condition.
· Seek funding for riparian enhancement and easement development to offset financial losses from land conversion immediately adjacent to creek areas.

· Utilize cover crops and grassed field roads during winter months to reduce soil erosion and pesticide runoff during rain events.
· Utilize low till and no till farming practices wherever feasible.
· Monitor land for evidence of soil loss; implement control measures as needed.
· Use sediment basins and other detention or retention devices to help capture sediment before it leaves the property.
· Reduce overall use of pesticides; utilize integrated pest management practices.
· Time application of pesticides to minimize runoff.
· Avoid overspraying and spraying when wind can transport chemicals.
· Make use of cost sharing programs and available technical assistance to address erosion control problems and pesticide application issues.
· Wherever possible, retire steeply sloped farmland to grazing or other, less erosive uses.
· Utilize irrigation/runoff management such as underground outlets and irrigation tailwater return systems.
10. Coordinate with the Department of Pesticide Regulation. The State Water Resources Control Board’s management agency agreement with DPR establishes a unified and cooperative program to protect water quality related to the use of pesticides. The State Water Resources Control Board and DPR have produced the California Pesticide Management Plan which provides for outreach programs, compliance with water quality standards, ground and surface water protection programs, self-regulatory and regulatory compliance, and interagency communication. The Regional Board will coordinate with DPR and implementation efforts of the California Pesticide Management Plan.
Summary
A large number of planning and implementation activities have been undertaken in the tributaries to the Moss Landing Harbor to specifically address erosion control and chemical management issues. Some of these have been done at a "demonstration" scale on public lands, but other projects have been on private lands working with the cooperation of local landowners. All of these plans identify erosion and pesticide movement as a major problem, and all recommend various land treatments to help ameliorate the problem. These activities are an extremely important component of watershed restoration. The implementation of these plans should be continued, in order to achieve the long-term improvements which are needed in the watershed. Increased effort should be aimed at coordinating and implementing recommendations of existing plans, including those of the Regional Board’s Watershed Management Initiative and Salinas River Watershed Strategy, and the Water Quality Protection Program of the Monterey Bay National Marine Sanctuary.
Environmental BenefitsThe actions described above will result in reduction of total sediment and smaller percentages of polluted sediment. These environmental benefits will impact a wide variety of beneficial uses throughout the watershed. Benefits of the plan in terms of Beneficial Uses designated in the Region 3 Basin Plan for Moss Landing Harbor, adjacent waters, and tributaries, include the following:
· Navigation· Reduction of impairments to navigation resulting from siltation
in the Harbor area.· Reduction of complications and cost of dredging the harbor. Shellfish Harvesting· Reduction of elevated levels of pollutants found in shellfish. Commercial and Sport Fishing· Reduction of elevated levels of pollutants found in finfish and
the benthic invertebrates which serve as food for a number of species.
· Aquaculture· Reduction of elevated levels of pollutants found in shellfish. Wildlife Habitat· Reduction of elevated levels of pollutants found in the food
chain and evidenced by bioaccumulation in fish and shellfish. Warm Freshwater Habitat· Reduction of elevated levels of pollutants found in the food
chain and evidenced by bioaccumulation in fish and shellfish. Cold Freshwater Habitat
· Reduction of elevated levels of pollutants found in the food chain and evidenced by bioaccumulation in fish and shellfish.
Estuarine Habitat· Reduction of elevated levels of pollutants found in the food
chain and evidenced by bioaccumulation in fish and shellfish.
· Preservation of Biological Habitats of Special Significance· Reduction of elevated levels of pollutants found in the food
chain in special habitats:· Elkhorn Slough National Estuarine Research Reserve· Monterey Bay National Marine Sanctuary · Salinas River Wildlife Refuge Rare, Threatened, and Endangered Species· Reduction of elevated levels of pollutants found in the food
chain and evidenced by bioaccumulation in birds, fish and shellfish.
Industrial Service Supply· Reduction of sediment and turbidity in power plant cooling
water intake, resulting in increased plant efficiency.
E. An estimate of the total costs to implement the cleanup plan
Cost estimates for implementation of this Cleanup Plan are partitioned into four general categories:
1) Regional Board Program Coordination costs2) Harbor implementation costs3) Urban implementation costs4) Agricultural implementation costs
1. Regional Board Program costsThe Watershed Management Initiative Chapter (1997) for Region 3 states “Although the state has had a Nonpoint Source (NPS) Program for many years, funding has been extremely limited and inadequate to address NPS problems in the Region, and in the Salinas River watershed in particular, which has relatively few point source discharges.” In the WMI, for FY 99/00, a staffing deficit of 1.6 Personnel Years (PYs) has been identified related to implementation of the Watershed Management Action Plan, Nonpoint Source activities, and this Cleanup Plan in the Salinas and Elkhorn watersheds. Because only a portion of the Salinas Watershed is considered in this cleanup plan, 1.0 PY is recommended for funding to implement this cleanup effort.
In addition to an allocation for this PY, an allocation has been made to cover other expenses expected to be incurred by the Regional Board in connection with its administration of the plan and in connection with water and habitat monitoring in support of the implementation of this plan. First year expenses include provisions for a monitoring program and equipment to aid in selection of implementation sites and for collecting baseline data
to be used during subsequent years in the performance evaluation phase of monitoring the BMP installations.
2. Harbor implementation costsCost estimates for this aspect of the Cleanup Plan were developed using Action Plan III, Marinas and Boating, Water Quality Protection Program for Monterey Bay National Marine Sanctuary, May 1996. This plan dealt with the entire Sanctuary area and involved a broad range of agency and private sector stakeholder involvement in its development. Cost estimates included in the document were prorated to provide estimates for use in this Cleanup Plan in Moss Landing Harbor only.
Strategy First Year Second YearLow
EstimateHigh
Estimate
Low Estimate
High Estimate
Public Education and Outreach 5,000 6,667 10,000 15,000Technical Training 4,000 5,000 6,667 11,667Bilge Waste Disposal and Waste Oil Recovery
5,000 8,333 18,333 21,667
Hazardous and Toxic Materials Management
1,667 3,000 11,667 16,667
Topside and Haulout Maintenance 1,667 1,667 13,333 16,333Underwater Hull Maintenance 1,667 3,000 4,000 6,333Harbor Pollution Reduction Review 1,667 1,667 3,333 6,667
Overall Harbor Costs 20,667 29,334 67,333 94,333

3. Urban implementation costsCost estimates for this aspect of the Cleanup Plan were developed using Action Plan I, Implementing Solutions to Urban Runoff, Water Quality Protection Program for Monterey Bay National Marine Sanctuary, May 1996. This plan dealt primarily with the coastal urban areas of the Sanctuary and involved a broad range of agency and private sector stakeholder involvement in its development. Cost estimates included in the document were used as guidelines to provide estimates for use in this Cleanup Plan.
Strategy First Year Second YearLow Estimate
High Estimate
Low Estimate
High Estimate
Education and Outreach 22,500 22,500 10,000 10,000Technical Training 10,500 10,500 6,500 6,500Regional Urban Runoff Mgmt Program
134,000 134,000 75,500 85,500
Structural/Non-Structural Controls
30,000 40,000 30,500 67,500
Sedimentation / Erosion 7,500 12,500 15,000 32,500Stormdrain Inspection 17,500 20,000 27,500 35,000CEQA additions 3,500 4,500 3,500 3,500
Overall Urban Costs 225,500 244,000 168,500 240,500
4. Agricultural implementation costsThe overall area of the Moss Landing watershed used for this cost estimate is approximately 210,000 acres. The cost estimates were derived by evaluating several local land improvement plans and prorating costs contained in those plans to the area under consideration in this plan. Some elements of these plans are already being implemented, and recalculations based on these activities will reduce overall clean up cost estimates.

Primary source documents evaluated to provide a basis for the estimates contained in this document are:
1. Elkhorn Slough Uplands Water Quality Management Plan (Kleinfelder, 1993)
This plan estimates that implementation of Best Management Practices in the area will cost between $1,000 and $1,500 per acre of land treated.
2. Elkhorn Slough Watershed Project (SCS, 1994)
This plan includes the Elkhorn Slough and Moro Cojo Slough watersheds. It estimates implementation costs at about $650 per acre. It proposes to reduce erosion and the resulting transport of sediment and sediment borne pesticides by 50%. The plan encompasses a 44,900 acre portion of the Moss Landing watershed, of which approximately 10,000 acres are agricultural land and 5,450 acres are proposed for treatment. The plan emphasizes agricultural land treatment measures, and gives special attention to strawberry growing operations in the area.
In addition to providing remediation for some of the problems in Moss Landing, this plan estimates that its implementation would reduce the cost of erosion damage on strawberry lands by an average of $1,100,000 per year, public road cleanup costs by $64,000 per year and traffic delay costs by $9,000 per year.
3. Guidance Specifying Management Measures For Sources of Nonpoint Pollution in Coastal Waters (USEPA, Jan 1993).
While this guidance document is general in nature, it provides cost estimates for a wide variety of land treatment measures and offers a framework for comparison of the cost benefit ratios for various management measures.
For the purposes of this Cleanup Plan, the acreage of irrigated agricultural land being considered for treatment was roughly estimated at 100,000 acres, using Association of Monterey Bay Area Governments(AMBAG) Geographic Information System data layers which employed satellite imagery as a basis for land cover classification. Only a portion of this total acreage is targeted for implementation efforts.
Documented cost estimates for the types of treatment deemed suitable and feasible range from $650/acre (NRCS 1994) to $1,500/acre (Kleinfelder 1993). Though
Kleinfelder cites a higher treatment cost per acre than NRCS, the variability appears to be based on the topography and actual cropping practices in their respective study areas. Further inquiry into cost estimates indicates that because of the flatter overall topography of the Tembladero and lower Salinas area the costs will actually be lower. NRCS indicates that estimates of $500/acre are reasonable (D. Mountjoy, pers. comm. 1997). The use of a focused, results-oriented implementation management approach, which gives high priority to projects at sites which produce maximum benefits, will have a significant impact on overall costs.
The cost estimates below are based on implementation of Best Management Practices on 10 to 15% of the estimated 100,000 acres of agricultural land addressed by this Cleanup Plan.
Overall Agricultural Implementation Cost Estimate
Strategy First Year Second YearLow Estimate
High Estimate
Low Estimate
High Estimate
Education and Outreach 75,000 100,000 40,000 50,000Technical Training 50,000 75,000 40,000 40,000Sedimentation / Erosion Control Projects
100,000 500,000 1,300,000 1,400,000
Land Use Practice BMP Assistance
100,000 300,000 100,000 100,000
Overall Agricultural Costs 325,000 975,000 1,480,000 1,590,000
F. An estimate of recoverable costs from potential dischargers
Harbor
Moss Landing Harbor District currently bears the financial burden of dredging sediment from the Harbor. Providing funding for regular maintenance dredging of the harbor will continue to be the responsibility of the harbor department. Federal funding for the large dredging project required by recent extreme sedimentation has been appropriated through the Federal Emergency Management Act (FEMA).
Urban
Urban stormwater control activities by municipalities in the area are currently underway and the cost of administering and implementing these activities is being borne by municipalities, the State, and Federal government. The majority of funding for the urban stormwater component of this plan will be borne by the cities as part of their implementation of stormwater management plans.
Agricultural
Implementation of management measures to control erosion is most frequently carried out by a combination of public and private sector funds. A variety of cost sharing programs exist which will be employed as a part of the overall funding strategy. These cost sharing programs generally require a project proponent share of 25% to 50% of the overall project cost. Many of the needed management measures produce continuing economic benefits to landowners and land users in general. Accordingly, a portion of the land treatment cost is expected to be absorbed by individuals and organizations which receive direct benefit from the land treatment measures.
The cleanup plan implementation program will incorporate inducements for private and public sector investment, and will include a spectrum of grants, fees, tax incentives, and public-private partnerships. In the case of management measures which produce a predictable return on investment, State Revolving Funds may be considered as temporary financing to encourage private and public sector investment by amortizing implementation costs. Other mechanisms, such as conservation banking and mitigation banking, can combine many small sources of funding into an asset pool capable of supporting larger scale projects.
Currently, there is no plan to issue waste discharge requirements or otherwise regulate agricultural land uses in the tributaries to Moss Landing Harbor. Consequently, no directly recoverable costs are anticipated from agricultural land owners. However, if voluntary compliance continues to be inadequate to address pollution problem in the Harbor, regulatory action may be considered at some point, particularly for individual landowners whose actions are shown to cause significant impact. The RWQCB has existing authority to initiate such action, under the Porter Cologne Act Water Quality Control Act.
G. A five-year expenditure schedule identifying funds to implement the plans that are not recoverable from potential dischargers
Expenditures in the first year of the program will be largely committed to identifying and prioritizing specific implementation measures and target sites. First year expenses would include the addition of one full time position for Region 3 staff, and staff time expenditures by several other agencies. The Region 3 staff position would be dedicated to “land treatment implementation management”. The individual would initially be charged with the creation of a prioritized candidate project list for focused remediation of the Moss Landing sedimentation and pesticide problems. This list would include financing and performance monitoring options for each project. This effort will require and result in an increase in coordination and assistance with existing projects and programs.
Second year funding, as well as funding for following years will emphasize implementation activities and monitoring for success.
YEAR 1 YEAR 2 YEAR 3 YEAR 4 YEAR 5 5 YEAR TOTALS
Harbor 25,001 80,833 80,833 80,833 80,833 348,334Urban 234,750 204,500 204,500 204,500 204,500 1,052,750Agricultural 650,000 1,535,000 1,535,000 1,535,000 1,535,000 6,790,000Program Management 185,000 185,000 185,000 185,000 185,000 925,000Monitoring 198,000 110,000 110,000 110,000 150,000 678,000
Total Program 1,292,751 2,115,333 2,115,333 2,115,333 2,155,333 9,794,084
Canada de la Huerta – Shell/Hercules SiteThe Shell Western/Hercules Gas Plant site (now owned by Aera Energy LLC (Aera)) is located adjacent to Canada de la Huerta, approximately 18 miles west of Goleta in Santa Barbara County. In 1986 soils at the site were discovered to contain PCBs and other chemicals, as a result of operation and maintenance of the plant, and storage of a heat transfer fluid onsite.
In 1988, a remedial investigation was initiated, as a result of a Consent Agreement between Shell Western and the Department of Toxic Substances Control. As a result of that investigation, soil containing PCBs in concentrations exceeding 50 parts per million (ppm) was excavated from the site and removed to a landfill for disposal. A Human Risk Assessment comprised a large part of the analysis associated with the Remedial Action Plan. The analysis only considered individuals in direct contact with the site. Cleanup at 50 ppm was deemed appropriate to protect Human Health given a “Reasonable Maximum Exposed “ individual. This corresponds to the Toxic Substances Control Act Protection Level for PCBs, but is considerably less protective than other suggested protection levels as published in the National Sediment Quality Survey (U.S. EPA, 1997).
Data collected as part of the post-remediation monitoring program in 1997- 98 indicate that PCB levels at the site still violate EPA, Ocean Plan, and Basin Plan standards in both surface and ground water by orders of magnitude (Figures 8 and 9). Toxicity has been documented in both water and sediment. Sediment PCB levels from post-remediation sampling have ranged at some sites between 3,000 and 20,000 ppb (wet weight). These values are orders of magnitude higher than numerous protective levels referenced in the 1997 U.S. EPA document which are intended to provide protection for various beneficial uses. A number of different species still show elevated tissue levels of PCBs, with many exceedances of EPA Screening levels (10 ppb), FDA Action Levels (2,000 ppb), and/or NAS Guidelines for protection of wildlife (500 ppb). Worm tissue collected at the site is particularly high in PCBs. Tissue from marine species, including mussels and shore crabs, are also elevated above EPA Screening levels and Maximum Tissue Residual Levels. Average values of mussels collected at the marine sites in 1997 and 1998 are compared to averages from Regions 1 and 3 State Mussel Watch data in Figure 10. Data are averaged over both regions and in the nonurbanized areas only, for comparison purposes. A summary of data collected, a map of sampling locations during the first year of monitoring, and a timeline of important events are shown in Appendix A.
Figure 10. Average concentrations of total PCB (ppb, wet weight) from State Mussel Watch data (1988 – 1996) for the North Coast and Central Coast Regions. Data from non-urbanized areas has excluded major harbors, urban areas, and areas with known pollution problems. This data is representative of relatively undeveloped open coast in California.
It was assumed at the onset of post-remediation monitoring that the site could take a year or more to stabilize following treatment. The first year of monitoring data indicates both water quality violations and tissue bioaccumulation concerns. In spite of prior remediation efforts, the site appears to qualify at this time as a high priority toxic hot spot based on Bay Protection and Toxic Cleanup Program guidelines; we recommend that it be included as a “known toxic hot spot”.
A. Assessment of areal extent (Greater than 10 acres)
The Shell Hercules Gas Plant site is approximately 25 miles west of the City of Santa Barbara. The plant was constructed in 1963 and operated until 1988. It processed natural gas from offshore wells for pipeline transport. The site is located in a canyon (known as Canada de la Huerta) that is approximately 3600 feet in length (from the headwaters of the canyon to the ocean) and approximately 1200 feet wide (from ridge to ridge). This canyon can be divided into four zones described as follows:
Total PCBs In Mussel Tissue
0.00
5.00
10.00
15.00
20.00
25.00
30.00
35.00
40.00
Region 1 and Region 3Average
Region 3 Non Urban Average Canada De la Huerta M1/B Canada De la Huerta M3 Canada De la Huerta M4
Sea Cliff - This zone is approximately 400 feet in length and includes the canyon’s point of discharge from a three-foot diameter culvert to the sea wall and into the ocean. The culvert inlet is located on the north side of Highway 101 and runs beneath the highway and the Union-Pacific Railroad right-of-way. Lower Canyon – This zone is approximately 700 feet in length and includes a riparian area with a perennial surface water flow fed by groundwater seepage.Fill Pad – This zone is approximately 600 feet in length and was the former location of Shell Western E&P Inc.’s gas plant. Shell constructed a terraced fill pad, involving three levels, through this zone. The Fill Pad was constructed from soils excavated at the head of this canyon. A four-foot diameter culvert is located beneath and along the full length of this zone. The culvert’s inlet is located in a sediment retention basin, described below, and terminates at the head of the Lower Canyon.Upper Canyon – This zone is approximately 1500 feet in length and includes riparian areas along an ephemeral stream. There is a sediment retention basin at the south end of this zone. As indicated, the head of the Upper Canyon was the borrow site for constructing the Fill Pad.
Aera (formerly Shell) owns 56 acres of this canyon (a portion of the Lower Canyon, the Fill Pad and Upper Canyon). Four acres of Aera’s property was used as the gas plant site area (essentially the Fill Pad zone). Kennedy/Jenks (1994) described the pollution prior to the 1997 remediation efforts as follows:
“PCB-impacted soils have been detected in localized areas throughout the Site. The plant site area was determined to be the most impacted by small leaks and spills over time. Impacted soils in the upper canyon area (immediately north of the Plant Site) resulted from discarding of drums containing residual oils with PCBs and subsequent erosion and deposition of impacted soils down the canyon during storm events. Impacted soils in the lower canyon area (immediately south of the Plant Site) resulted from erosion of impacted soils in the upper canyon and the plant site area. In addition, PCBs were detected in the Seacliff area, where the canyon meets the coastline. It is likely that PCBs were transported to the Seacliff area in stormwater runoff from the Site.”
The Kennedy/Jenks report indicated that approximately 13 acres of the 51-acre site had detectable levels of PCBs in studies from the late 1980’s. Though the site was excavated and capped as a result of the remediation effort in Winter 1997, data still indicates toxicity, contamination of surface and ground water, and bioaccumulation in a number of resident organisms.
It is unclear to what extent the remediation effort has reduced the areal extent of contamination at the site, but it is likely that the areas remediated are still a source of contamination (e.g., soils were taken from a sediment retention basin onsite to fill the excavated area in the lower canyon). At least ten acres may still require additional remediation in order to fully protect beneficial uses. We are proposing amending the Post-Remediation Monitoring Program to address this issue.
B. Assessment of most likely sources of pollutants
The Shell Western E & P Inc. Hercules Gas Plant used a heat transfer fluid, Therminol oil, as part of the treatment process while in operation from 1963 to 1989. This fluid contained Polychlorinated biphenyls (PCB). PCBs were released to site soils, ground waters and surface waters from Shell’s various practices at this site. In addition to PCBs, activities at the plant caused releases to the environment of benzene, toluene, xylenes, ethylbenzene, total petroleum hydrocarbons and polynuclear aromatic hydrocarbons, along with many other chemicals and some metals.
Some contamination, though probably minimal, may possibly also originate from Highway 101 and railroad right-of-way stormwater runoff, which discharges to the seawall culvert onsite.
C. A summary of actions that have been initiated by the Regional Board to reduce the accumulation of pollutants at the Shell Hercules site and to prevent the creation of new THSs
During the Fall of 1996 and Winter of 1997, the site was excavated and capped, per a remedial action plan (RAP) approved by the Department of Toxic Substances Control (DTSC). The excavation was based on removing PCB contaminated soils to 50 ppm, to a depth of five feet and a site average concentration of 10-ppm. This Regional Board and other local and state agencies, prior to RAP approval, advised DTSC that water quality and the environment were not adequately assessed by the plan. Further, Regional Board staff indicated that the 50-ppm standard would not sufficiently protect water quality or the environment. DTSC disagreed with the other agencies and the Regional Board and approved the RAP on June 15, 1994. The time period between June of 1994 and the summer of 1997 was spent negotiating with DTSC and Aera over the inclusion and details of a post-remediation monitoring program.
It was agreed that the post-remediation monitoring plan would continue for a minimum of five years. Data collected from the first year of monitoring are shown in Appendix A. Also in this appendix is a time-line of events, along with a rainfall record. A few post-remediation monitoring results are described as follows:
Mean PCB-Arochlors and Benzene concentrations have been found at 100 times and 1300 times drinking water and ground water standards, respectively.PCB-Arochlors concentrations in surface waters are 300 times higher than USEPA’s guidelines for protecting fresh water aquatic organisms. Total PCB-congeners, at 23 parts per million (ppm), in the Lower Canyon sediments, exceed the 10-ppm remediation cleanup criteria described above.Some invertebrate marine organisms are bioaccumulating PCBs at 11,000 times the USEPA’s guideline for protection of saltwater organisms and 30 times the USEPA’s recommended toxicity limit.Laboratory bioaccumulation studies using worm tissue show toxic levels of total PCBs at 43 ppm.Laboratory toxicity tests show PCBs are at toxic levels for water and sediment dwelling organisms located in the lower riparian area.
D. Preliminary Assessment of Actions required to remedy or restore Canada de la Huerta to an unpolluted condition
The following actions are planned for this site. The success of implementing these actions depends on the cooperation of Aera, the Department of Toxic Substances Control, Department of Fish and Game, Santa Barbara County Planning and Protection Services, and this Regional Board.
Continue the post-remediation monitoring program for minimum of five years after remediation (one year has already past). Aera has taken the position time is needed to allow the site to stabilize, and that once stable, there will be a significant reduction in releases of constituents of concern to the environment. The above agencies have generally agreed with this position provided there is a substantial reduction in concentrations for constituents of concern within a very short period of one or two years.Within this five-year monitoring period, particularly during the period of site stabilization, the implemented remedial action plan’s effectiveness at protecting water quality and the environment will be evaluated. If it is determined that water quality or the environment are not being protected, the monitoring program will be modified to assess the source of the contamination and the RAP will be amended to eliminate the source of contamination.
An ecological risk assessment may be appropriate to determine to what extent this site is impacting the environment.
Deed restriction on groundwater use should remain in place on the property until monitoring data demonstrate beneficial uses are being protected.
Environmental Benefits A number of environmental benefits will result from action taken to fully remediate the Shell Hercules site. Benefits of cleanup, in terms of existing and foreseeable Beneficial Uses designated in the Region 3 Basin Plan, include the following:
Commercial and Sport FishingReduction of elevated levels of pollutants found in finfish and the benthic invertebrates which serve as food for a number of species.
AquacultureReduction of elevated levels of pollutants found in shellfish.
Wildlife HabitatReduction of elevated levels of pollutants found in the food chain evidenced by bioaccumulation in various species.
Cold/Warm Freshwater HabitatReduction of elevated levels of pollutants found in the food chain evidenced by bioaccumulation in various species.
Rare, Threatened, and Endangered SpeciesReduction of elevated levels of pollutants found in the food chain and evidenced by bioaccumulation in various species which may serve as prey for rare, threatened or endangered species.
E. An estimate of the total costs to implement the cleanup plan
At this time the amount of excavation and/or groundwater extraction needed to fully protect beneficial uses is unknown. Assuming additional excavation is required to remedy the contamination problem once the site has stabilized, estimates of cost can be estimated from past remediation efforts.
The Remedial Action Plan for the first cleanup effort estimated that 6,600 cubic yards of material would need to be excavated and disposed of properly. The plan determined that offsite disposal would be the most cost effective alternative. The total preliminary estimate for offsite disposal was $2,945,200. This estimate included clearing and grubbing, excavating, transportation, disposal, filling, grading and revegetating the site. Assuming that as much material must be removed and disposed of as was in the initial project, the total cost would probably be similar to the cost of the initial remediation effort. Obviously, this estimate will be
highly dependent on the outcome of monitoring efforts directed at determining the areal extent and specific nature of the remaining problems.
Costs may be approximated as follows:
Monitoring ($30,000/yr for 10 years)
$300,000Additional Site Assessment
$250,000Amended Remedial Action Plan $50,000Implement Remediation Alternative
$2,000,000
Total
$2,600,000
An estimate of recoverable costs from potential dischargers
The Remediation Action Plan provides a non-binding preliminary allocation of financial responsibility. The document states that Shell Western E & P, Inc. (Aera) is allocated 100 percent financial responsibility for cleanup of this site.
G. A two-year expenditure schedule identifying funds to implement the plans that are not recoverable from potential dischargers
This schedule assumes that continued monitoring shows insufficient improvement in water, sediment and biological measures.
Year 1 – Continued Monitoring and Assessment$30,000
Regional Board staff time(160 hrs @ $70/hr) $11,200
Year 2 – Continued Monitoring and Assessment$30,000
Detailed assessment and RAP revision to address $250,000 cleanup needs Regional Board staff time
(160 hrs @ $70/hr) $11,200
Estimated costs for first two years $332,400
All funds to be recovered from discharger.
ReferencesABA Consultants, 1989. Elkhorn Slough Wetland Management Plan. Prepared for the California State Coastal Conservancy and the Monterey County Planning Department.
Action Plan 1: Implementing Solutions to Urban Runoff. 1996. Water Quality Protection Program for the Monterey Bay National Marine Sanctuary.
Action Plan III: Marinas and Boating. 1996. Water Quality Protection Program for the Monterey Bay National Marine Sanctuary.
AMBAG, 1997. Northern Salinas Valley Watershed Restoration Plan: Final Report of AMBAG’s Water Quality Planning Project entitled Nonpoint Source Pollution in Coastal Harbors & Sloughs of the Monterey Bay Region: Problem Assessment and Best Management Practices.
Anderson-Nichols & Co., 1985. Salinas River Study Phase 3 Report: Phreatophyte Water Use.
Boggs, Melissa. California Department of Fish and Game. Telephone conversation on July 31, 1998.
Central Coast Basin Plan, 1996. Central Coast Regional Water Quality Control Board.
Central Coast Regional Water Quality Control Board, Region 3. Watershed Management Initiative Chapter. May, 1998. Prepared for the U.S Environmental Protection Agency.
Coastlinks: News from the Water Quality Protection Program for the Monterey Bay National Marine Sanctuary. Winter, 1997.
Cotter, P. and L. Strnad. 1997. Compilation of Monitoring Data for the Elkhorn Slough Watershed and the Lower Salinas River Drainage Area. California Coastal Commission.
Dames & Moore Consultants. January 15, 1998 “September 1997 Quarterly Sampling, Hercules Gas Plant Site, Area Energy LLC. Prepared for Area Energy LLC.
Dames & Moore Consultants. March 12, 1998. December 1997 Quarterly Sampling, Hercules Gas Plant Site, Area Energy LLC. Prepared for Area Energy LLC.
Dames & Moore Consultants. July 1, 1998. March 1998 Quarterly Sampling, Hercules Gas Plant Site, Area Energy LLC. Prepared for Area Energy LLC.
Dames & Moore Consultants. October 5, 1998. June 1998 Quarterly Sampling, Hercules Gas Plant Site, Area Energy LLC. Prepared for Area Energy LLC.
EDAW, Inc. 1998. Draft Environmental Impact Report: Salinas River Vegetation Management Program. State Clearinghouse No. 98021039.
Ganapathy, C., C. Nordmark, K. Bennett, A. Bradley, H. Feng, J. Hernandez, J. White, in draft. Temporal Distribution of Insecticide Residues in Four California Rivers. Environmental Hazards Assessment Program, Environmental Monitoring and Pest Management Branch, California Dept. of Pesticide Regulation, Sacramento.
Habitat Restoration Group, 1996. Moro Cojo Slough Management and Enhancement Plan. Prepared for the Monterey County Planning and Building Inspection Department and the State Coastal Conservancy.
Harding Lawson & Associates (1997). Amphipod toxicity and sediment chemistry testing for the Moss Landing Harbor District.
Hunt, J. W., B.A. Anderson, B. M. Phillips, R.S. Tjeerdema, H. M. Puckett, and V. deVlaming. In press. Patterns of aquatic toxicity in an agriculturally dominated coastal watershed in California. Agriculture, Ecosystems and Environment.
Kennedy/Jenks Consultants. April 1994. Final Remedial Action Plan, Hercules Gas Plant Site, Santa Barbara County, California. Prepared for Shell Western E&P Inc. K/J 920042.00.
Kleinfelder, 1993. Uplands Water Quality Management Plan for Elkhorn Slough. Prepared for the Association of Monterey Bay Area Governments.
Model Urban Runoff Program – A How-To Guide For Developing Urban Runoff Programs for Small Municipalities. April, 1998 Draft. MBNMS, Calif. Coastal Commission, RWQCB, City of Monterey, City of Santa Cruz, AMBAG.
National Academy of Sciences. 1973. Water Quality Criteria, 1972.
Oakden, J.M. and J.S. Oliver (1988). Pesticide Persistence in Fields and Drainages of the Central Monterey Bay Area. Prepared for the Regional Water Quality Control Board.
Parkin, J. L. 1998. Ecology of Breeding Caspian Terns (Sterna caspia) in Elkhorn Slough, California. Thesis presented to the Faculty of Moss Landing Marine Laboratories, San Jose State University.
Rasmussen, D. and H. Blethrow. 1991. Toxic Substances Monitoring Program 1988-89 Data Report. State Water Resources Control Board, California Environmental Protection Agency. 91-1WQ
Rasmussen, D. 1992. Toxic Substances Monitoring Program 1990 Data Report. State Water Resources Control Board, California Environmental Protection Agency. 92-1WQ.
Rasmussen, D. 1993. Toxic Substances Monitoring Program 1991 Data Report. State Water Resources Control Board, California Environmental Protection Agency. 93-1WQ.
Rasmussen, D. 1995a. State Mussel Watch Program 1987-1993 Data Report (94-1WQ). State Water Resources Control Board, California Environmental Protection Agency.
Rasmussen, D. 1995b. Toxic Substances Monitoring Program 1993-94 Data Report. State Water Resources
Control Board, California Environmental Protection Agency. 95-1WQ.
Rasmussen, D. 1996. State Mussel Watch Program 1993-1995 Data Report (96-2WQ). November. State Water Resources Control Board, California Environmental Protection Agency.
Rasmussen, D. 1997. Toxic Substances Monitoring Program 1994-95 Data Report. State Water Resources Control Board, California Environmental Protection Agency.
Regional Water Quality Control Board, Central Coast Region. January 1997. Pre-Remediation Monitoring Report, Canada de la Huerta, Gaviota, Santa Barbara County.
Regional Water Quality Control Board Central Coast Region. October 1997. Post-Remediation Monitoring Report, Canada de la Huerta, Gaviota, Santa Barbara County.
Regional Water Quality Control Board, Central Coast Region. November 6, 1998. Position Paper, Shell Hercules Gas Plant, Canada de la Huerta, Santa Barbara County.
Salinas River Watershed Team Strategy, 1996. Central Coast Regional Water Quality Control Board.
Salinas River Lagoon Management and Enhancement Plan (March, 1997). Prepared by John Gilchrist & Assoc., the Habitat Restoration Group, Philip Williams and Associates, Wetlands Research Associates, and the staff of the Monterey County Water Resources Agency for the Salinas River Lagoon Task Force.
State Water Resources Control Board. 1998. Final Functional Equivalent Document – Water Quality Control Policy for Guidance on the Development of Regional Toxic Hot Spot Cleanup Plans. Division of Water Quality.
State Water Resources Control Board, Central Coast Regional Water Quality Control Board California Department of Fish and Game, Moss Landing Marine
Laboratories, University of California Santa Cruz. 1998. Chemical and Biological Measures of Sediment Quality in the Central Coast Region.
Stillwell, Jim. Moss Landing Harbor District. Telephone conversation in November, 1997.
Sustainable Conservation. 1996. Partners in Restoration: Creating Model Incentives and Access for Watershed Restoration. Grant No. 95-8694. Final Report to the David and Lucille Packard Foundation.
U.S. Environmental Protection Agency, 1990. Guidance Specifying Management Measures for Sources of Nonpoint Pollution in Coastal Waters. USEPA Office of Water. 840-B-92-002.
U.S. EPA Envirofacts, 1998. U.S. EPA World Wide Web Site.
U.S. EPA. 1993. Guidance Specifying Management Measures For Sources of Nonpoint Pollution in Coastal Waters (6217(g)). Issued under the Authority of the Coastal Zone Act Reauthorization Amendments of 1990.
U.S. EPA. 1993b. Guidance for assessing chemical contaminant data for use in fish advisories. Volume 1. EPA 823-R-93-002. Office of Water. Washington, D.C.
U. S. EPA, 1997. The incidence and severity of sediment contamination in surface waters of the United States. Volume 1, National Sediment Quality Survey. Document No. EPA 823-R-97-006.
U.S. Food and Drug Administration. 1984. Shellfish Sanitation Interpretation: Action Levels for Chemical and Poisonous Substances.
Sites Of Concern (Sites That Do Not Currently Qualify As Candidate Toxic Hot Spots)
The sites described below showed indications of toxicity or other related problems, but insufficient evidence was available to rank them as candidate hot spots. They are listed here for consideration as targets of future monitoring or analysis efforts. Chemicals which exceeded ERMs or PEL for sediment; EPA Screening Levels, NAS or FDA Action levels for tissue are indicated in bold print. (* See references listed under Candidate Sites)
Water body name
Segment Name Site Identification Reason for Listing Pollutants present at the site
Report reference *
Santa Maria River
Santa Maria Estuary
Santa Maria Estuary – Station #30020
Aquatic Life Concerns, Human Health Concerns - Only one sample taken by BPTCP, but high values of some chemicals, sediment toxicity, bioaccumulation
DDT, Dieldrin, Nickel, Toxaphene, Endrin
1, 3
Santa Cruz Harbor
Santa Cruz Yacht Harbor
Santa Cruz Yacht Basin – Station #30001.0, #35001.0, #35002.0
Aquatic Life Concerns – Sediment Chemistry, bioaccumulation; limited toxicity data
PAHs, PCBs, Copper, Mercury, Chlordane, Tributyltin
1, 5
Monterey Harbor
Monterey Yacht Harbor Marina
Monterey Yacht Club - #30002.0
Aquatic Life Concerns – Sediment Toxicity, Sediment Chemistry, bioaccumulation (multiple visits)
PAHs, Copper, Zinc, Toxaphene, PCBs, Tributyltin
1, 5
Monterey Boatyard
Monterey Boatyard - Station #35003.0, #30012.0
Aquatic Life Concerns - Sediment Toxicity with
PAHs 1
Water body name
Segment Name Site Identification Reason for Listing Pollutants present at the site
Report reference *
associated Sediment Chemistry (single visit)
Monterey Harbor - Mid Harbor
Monterey Stormdrain #3 - Station #30014.0
Aquatic Life Concerns - Sediment toxicity with associated Sediment Chemistry (single visit)
PAHs 1
Pajaro River Pajaro River Estuary
Pajaro River Estuary – Station #30006.0
Aquatic Life Concerns - Limited sediment toxicity data with associated sediment chemistry, bioaccumulation
Nickel, Chromium, Dieldrin, PCB, Toxaphene, DDT (upstream sites also show endosulfan, chlordane, endrin, heptachlor epoxide)
1, 6, 7
Additional Comments on Sites of Concern
Santa Maria River Estuary Though insufficient data was collected to designate the Santa Maria Estuary as a candidate Toxic Hot Spot, the single visit to this site showed high levels of some chemicals, as well as high toxicity. DDT values were the highest in the Region, exceeding guideline values even after organic carbon normalization.
The Department of Fish and Game has collected toxicity data on the lower Santa Maria River, as part of the Guadalupe Natural Resources Damage Assessment for the cleanup effort at Unocal’s Guadalupe Oil Field site. The Santa Maria River site was selected as a reference site in one study for the Damage Assessment, but showed high toxicity (Melissa Boggs, pers. comm.). The final results of these studies have not yet been released for public use, but once available should provide additional insight into the problems at the Santa Maria site. Additional monitoring of this site is warranted.
Santa Cruz Harbor Santa Cruz Harbor had a wide variety of chemical exceedances, including mercury, copper, PCBs, PAHs, and chlordane, resulting in the highest ERM and PEL quotient values in the Region 3 BPTCP dataset. Quotient values are used to characterize overall pollution content, when more than one pollutant is present at a site. Toxicity was only detected from one of multiple visits at the Yacht Harbor, but was not conducted at other sites in the Harbor. Additional monitoring of this site is warranted.
Pajaro River Estuary BPTCP identified elevated levels of nickel and chromium in the single sample analyzed for this site. These two metals are widespread throughout the Region and are thought to be geological in origin. In addition, low confidence is placed in the ERM and PEL values for these metals (Long et al., 1998 in SWRCB et al., 1998). Tissue data from the State Mussel Watch Program indicates elevated levels of a wide variety of chemicals in the lagoon, particularly banned organochlorine pesticides. A focused study of this area by the University of Santa Cruz revealed toxicity in 78% of agricultural drainage ditch
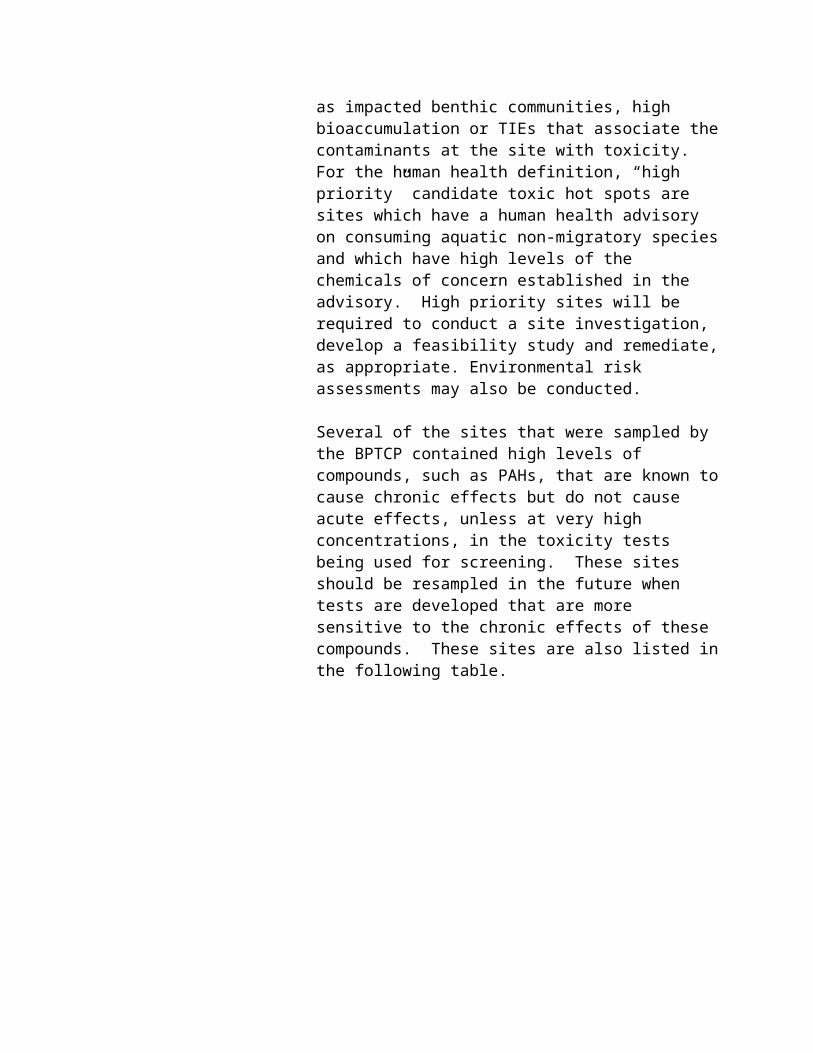
samples, 14% of tributary slough samples, and 19% of river and estuary samples. Temporal patterns indicated that agricultural ditches and the upper river may be more important sources of toxic runoff to the estuary than were the freshwater sloughs (Hunt et al, in press). Additional monitoring of this site is underway as part of a joint AMBAG/RWQCB effort and should further characterize the problem. Initial results from this effort did not detect sediment toxicity at the four sites monitored in the watershed.
Monterey HarborRecent data submitted by the City of Monterey to the RWQCB indicate that levels of PAHs in sediments in the Harbor taken as a result of dredge spoil testing and other activities show minimal impact from the chemicals of concern identified by BPTCP in previous years.
Benthic assemblages showed no significant impacts at Monterey Boatyard where a lead slag heap had been cleaned up in the late 1980s, nor did associated lead values exceed ERM or PEL guideline values. The patterns of species abundance and distribution showed no clear pattern as distance increased from the cleanup site, and in fact was most complex near the site, but this may be attributable to differences in habitat (SWRCB et al., 1998). The Monterey Yacht Harbor had pollutants present typical of marinas, including copper, zinc, PAHs and tributyltin. Multiple toxicity was shown from two visits, with associated chemistry. However, toxicity was also seen at “reference” sites outside the Harbor mouth. This confounds interpretation of toxicity data within the Harbor.
Mussel Watch data showed bioaccumulation values at the Marina exceeding EPA Screening Levels for Toxaphene, PCBs, and Tributyltin in 1991, 1992, and 1993 (SMW, 1995). However, no FDA or NAS standards were exceeded. The Harbor is relatively well flushed.
Because the pollutants of concern in Monterey Harbor are typical of those found in harbor and urban areas, it is recommended that existing efforts by the Monterey Bay National Marine Sanctuary and local agencies to address nonpoint pollution in the Sanctuary continue to be supported by State and federal funding mechanisms. The Sanctuary has developed Action Plans to address urban and
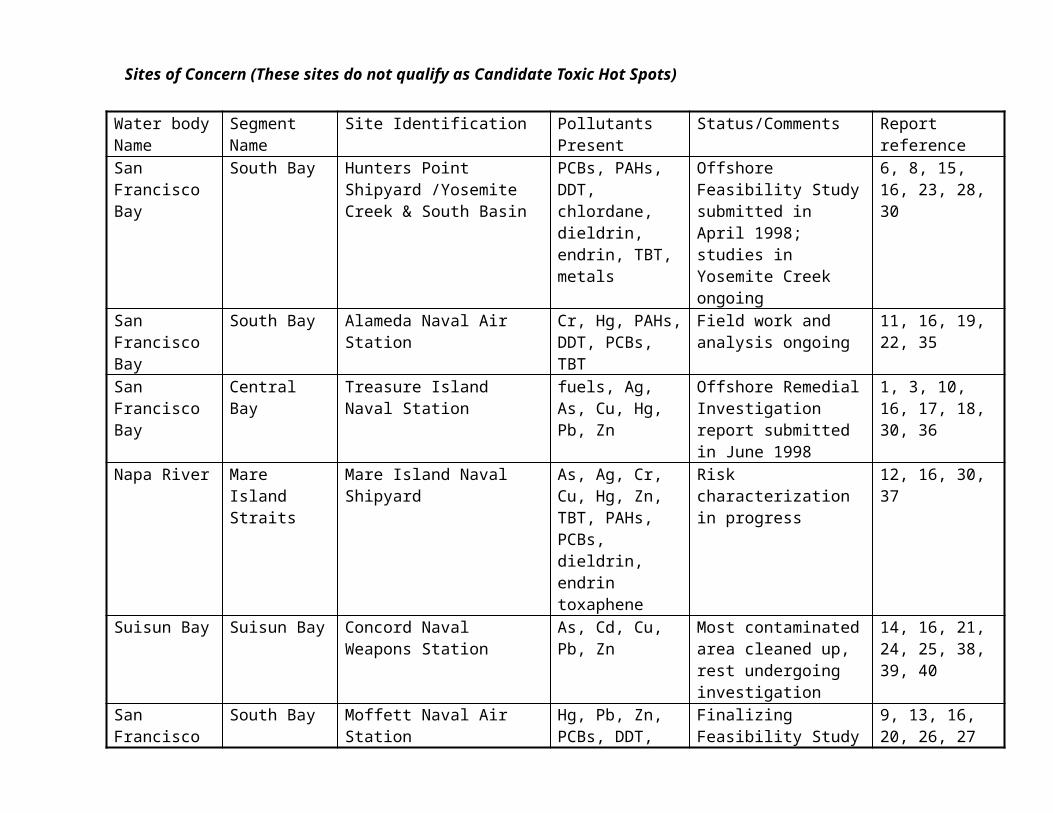
harbor nonpoint source pollution. The City of Monterey is one of the collaborators in recent development of a Model Urban Runoff Program for the Sanctuary.
The aggressive and continuing implementation of Best Management Practices in the Harbor by the City, new stormwater programs being developed in the area, and the recent announcement of a new contract position for Harbor Water Quality Project Manager in the Monterey Bay National Marine Sanctuary ensure that Monterey Harbor will continue to benefit from water quality improvements in the future.
Other Sites Samples from Morro Bay either were toxic but had no associated chemistry analysis, or had exceedances of chromium and nickel but did not prove to be toxic. Other sites in the Region which showed toxicity from a single visit, but for which associated sediment chemistry testing was not conducted include Santa Barbara Harbor, Goleta Slough, Scott Creek, Soquel Lagoon, and San Luis Harbor. All of these sites warrant further investigation for sediment chemistry and toxicity, and will be assessed as part of the Central Coast Ambient Monitoring Program coastal confluences assessment.
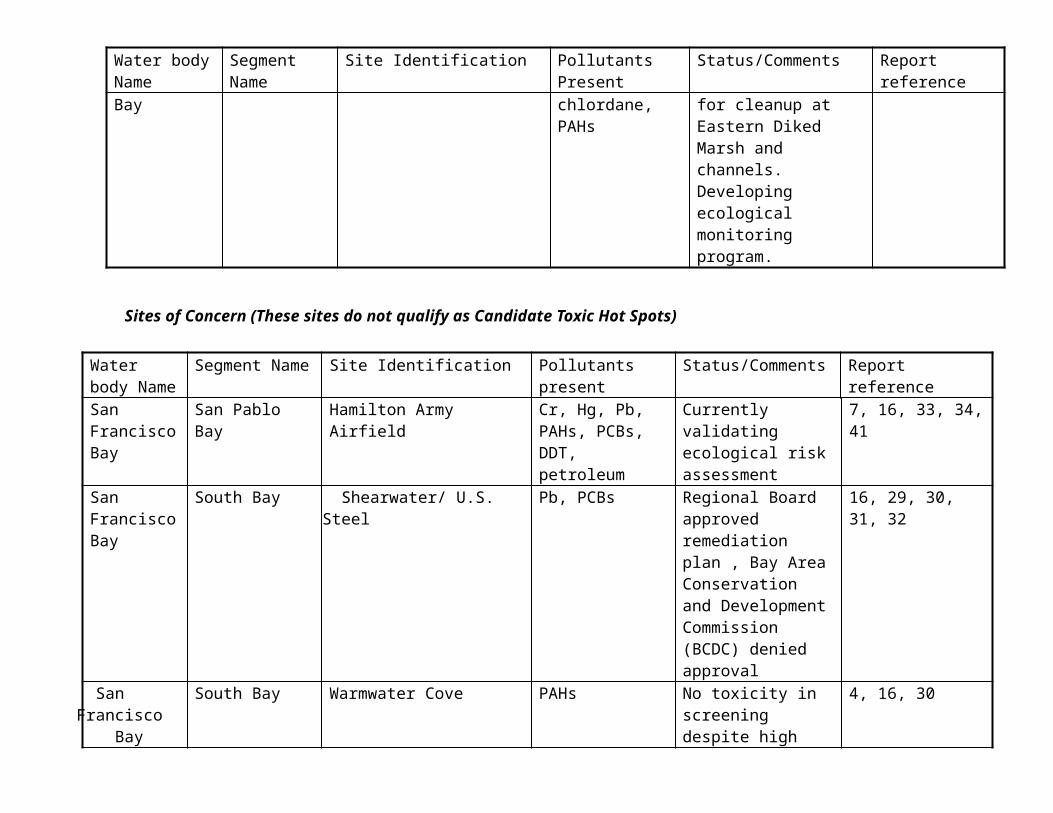
APPENDIX A – Compilation of Data Collected by the California Department of Fish and Game (pre-treatment, 1996) and Dames and Moore (post-treatment, 1997-98) at the Canada de la Huerta Site
Shell Hercules Gas Plant, Canada de la Huerta, Santa Barbara County
Sampling Site StandardsDate MW-2 MW-3 MW-3S MW-4 LC3 R1/LC2 R2/LC1 M1/B COP CTR BP ERL
PCB, ug/l (ppb) in GroundwaterJan-89 12.0 66.0 0.000019 0.00017 0.3Sep-89 79.0 0.000019 0.00017 0.3Oct-90 45.0 NA 0.000019 0.00017 0.3
Aug-96 11.8 ND Dry 0.000019 0.00017 0.3Mar-97 22.0 ND Dry 0.000019 0.00017 0.3Jun-97 6.2 ND Dry 0.000019 0.00017 0.3Sep-97 19.0 ND Dry 0.000019 0.00017 0.3Dec-97 210.0 ND Dry 0.000019 0.00017 0.3Mar-98 14.0 ND ND 0.000019 0.00017 0.3
Benzene, ug/l (ppb) in GroundwaterJan-89 30000.
00.9 5900 1.2 1
Sep-89 8900.0 5900 1.2 1Oct-90 1600.0 ND 5900 1.2 1
Aug-96 4400.0 ND Dry 5900 1.2 1Mar-97 2300.0 ND Dry 5900 1.2 1Jun-97 1700.0 ND Dry 5900 1.2 1Sep-97 850.0 ND Dry 5900 1.2 1Dec-97 160.0 ND Dry 5900 1.2 1Mar-98 1500.0 ND ND 5900 1.2 1
Toluene, ug/l (ppb) in GroundwaterJan-89 1900.0 ND 85000 6800Sep-89 380.0 85000 6800Oct-90 47.0 ND 85000 6800
Aug-96 52.0 ND Dry 85000 6800
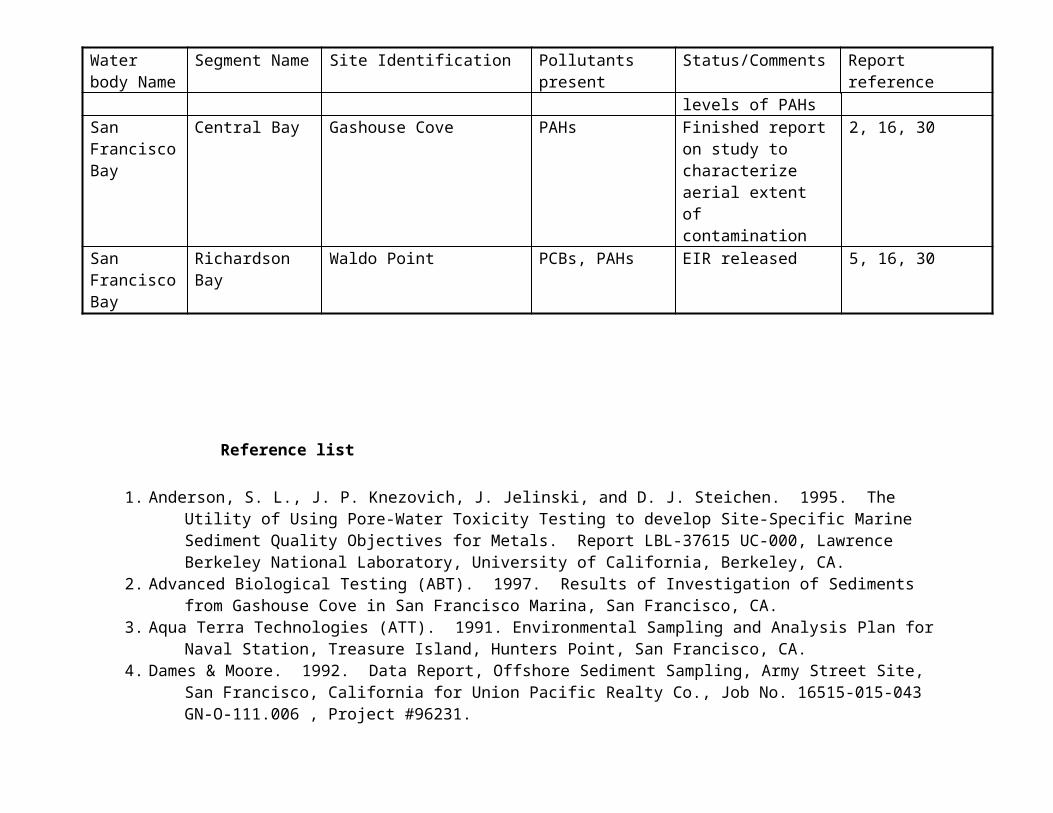
Mar-97 240.0 ND Dry 85000 6800Jun-97 ND ND Dry 85000 6800Sep-97 ND ND Dry 85000 6800Dec-97 5.0 ND Dry 85000 6800Mar-98 11.0 ND ND 85000 6800
Ethylbenzene, ug/l (ppb) in GroundwaterJan-89 390.0 3.0 4100 680Sep-89 60.0 4100 680Oct-90 ND ND 4100 680
Aug-96 ND ND Dry 4100 680Mar-97 ND ND Dry 4100 680Jun-97 25.0 ND Dry 4100 680Sep-97 ND ND Dry 4100 680Dec-97 9.0 ND Dry 4100 680Mar-98 ND ND ND 4100 680
Total Xylenes, ug/l (ppb) in GroundwaterJan-89 100.0 ND 1750Sep-89 60.0 1750Oct-90 2.0 ND 1750
Aug-96 200.0 ND Dry 1750Mar-97 ND ND Dry 1750Jun-97 ND ND Dry 1750Sep-97 19.0 ND Dry 1750Dec-97 6.0 ND Dry 1750Dec-97 34.0 ND ND 1750
TPH, ug/l (ppb) ijn GroundwaterAug-96 2300.0 ND DryMar-97 2600.0 ND Dry
PCB, ug/l (ppb) in Surface WaterJan-89 3.6 0.000019 0.00017 0.3Sep-89 12.0 0.000019 0.00017 0.3Oct-90 120. 0.000019 0.00017 0.3
0Apr-93 0.5 0.000019 0.00017 0.3Jun-96 2.7 4.3 1.4 0.000019 0.00017 0.3
Aug-96 2.6 1.2 1.2 0.000019 0.00017 0.3Mar-97 14.0 2.9 0.000019 0.00017 0.3Mar-97 6.5 3.3 3.1 0.000019 0.00017 0.3Jun-97 2.3 2.3 1.2 0.000019 0.00017 0.3Sep-97 4.7 1.0 1.0 9.5 0.000019 0.00017 0.3Dec-97 4.7 6.2 4.5 5.3 0.000019 0.00017 0.3Mar-98 1.2 1.2 1.2 0.5 0.000019 0.00017 0.3
TPH, ug/l (ppb) in Surface WaterJun-96 1900.0 1000.0
Aug-96 410.0
370.0 280.0
Mar-97 ND 230.0Mar-98 240.
0240.0 180.0
PCB, ug/kg (ppb) in SedimentPre-90 6600000.
038000.0 180.
Jun-96 6700.0 24000.0
2800.0 180.
Mar-97 180.0 280.0 180.Mar-98 320 960 230 4100 180.
TPH, ug/kg (ppb) in SedimentPre-90 3500000Jun-96 81000.0 92000 110000
Mar-97 28000 51000.0
COP = California Ocean Plan – Objectives for Protection of Human Health (30-day average)CTR = USEPA California Toxics Rule – For Protection of Human Health in water or organisms – 40 CFR, vol. 62, no. 150. August 5, 1997
BP = Central Coast Regional Water Quality Control Board Basin Plan – General Objectives for PCBs, Protection of Domestic or Municipal Supply for Benzene, Ethylbenzene, and XyleneERM = NOAA Effects Range Median
Shell Hercules Gas Plant, Canada de la Huerta, Santa Barbara County
Sampling Site StandardsDate LC3 R1/LC2 R2/LC1 M1/B M2 M3 M4 MTR
LEPA NAS FDA ERL
PCB - Congeners, ng/g (ppb) In SedimentDry WeightAug-96 20111 16484 35253
Mar-97
26204 37252 5395
Wet WeightAug-96 13118 10731 20440 180.
Mar-97
13927 21453 3364 180.
PCB - Congeners, ng/g (ppb) (Bioaccumulation)Tadpoles
Dry WeightJun-96 97450 56485Wet WeightJun-96 8283 5310 0.6 10 500 2000
Shore CrabsDry WeightJun-96 497.3Wet WeightJun-96 140.7 0.6 10 500 2000
MusselsDry WeightJun-96 37.7
Mar- 347.6 61.0 230.
97 7Wet WeightJun-96 4.5 0.6 10 500 2000
Mar-97
36.8 7.7 29.1 0.6 10 500 2000
Sand CrabsDry WeightJun-96 20.7 10.5
Mar-97
328.8 261.3
256.4
Wet WeightJun-96 3.2 1.7 0.6 10 500 2000
Mar-97
61.2 49.1 48.6 0.6 10 500 2000
Fish Tissue, Rubberlip Surfperch
Dry WeightMar-
9716.6
Wet WeightMar-
971.8 0.6 10 500 2000
Fish Tissue, Barred SurfperchDry Weight
Mar-97
35.2
Wet WeightMar-
973.9 0.6 10 500 2000
Liver Tissue, Rubberlip Surfperch
Dry WeightMar-
97197.
6Wet Weight
Mar- 64.0 0.6 10 500 2000
97Liver Tissue, Barred Surfperch
Dry WeightMar-
97232.
1Wet Weight
Mar-97
100.2
0.6 10 500 2000
Worm Tissue
Dry WeightAug-96 42882
31135240 428823
Mar-97
91646 17285 19729
Wet WeightAug-96 27972
1739041 248632 0.6 10 500 2000
Mar-97
11217 2116 2415 0.6 10 500 2000
Sediment Toxicity (% Survival)Jun-96 TOXIC TOXIC TOXICAug-96 TOXI
CTOXIC NON-
TOXICMar-
97NA NON-
TOXICNON-TOXIC
Mar-97
TOXIC
TOXIC NON-TOXIC
Mar-98
NON-TOXIC
NON-TOXIC
Sediment Toxicity (Growth)Jun-96 NON-
TOXICNON-TOXIC
TOXIC
Aug-96 Toxic NON-TOXIC
NON-TOXIC
Mar-97
NA TOXIC TOXIC
Mar-98
NON-TOXIC
TOXIC
Water Toxicity (Growth)Jun-96 NA NA NAAug-96 Toxic TOXIC TOXIC
Mar-97
NA TOXIC TOXIC
Mar-97
TOXIC TOXIC
Mar-98
Water Toxicity (Survival)Mar-
98TOXIC TOXIC
MTRL = California Ocean Plan Maximum Tissue Residual LevelEPA = USEPA Screening LevelNAS = US National Academy of Sciences Screening LevelFDA = US Food and Drug Administration Action LevelERL = NOAA Effects Range Median Level
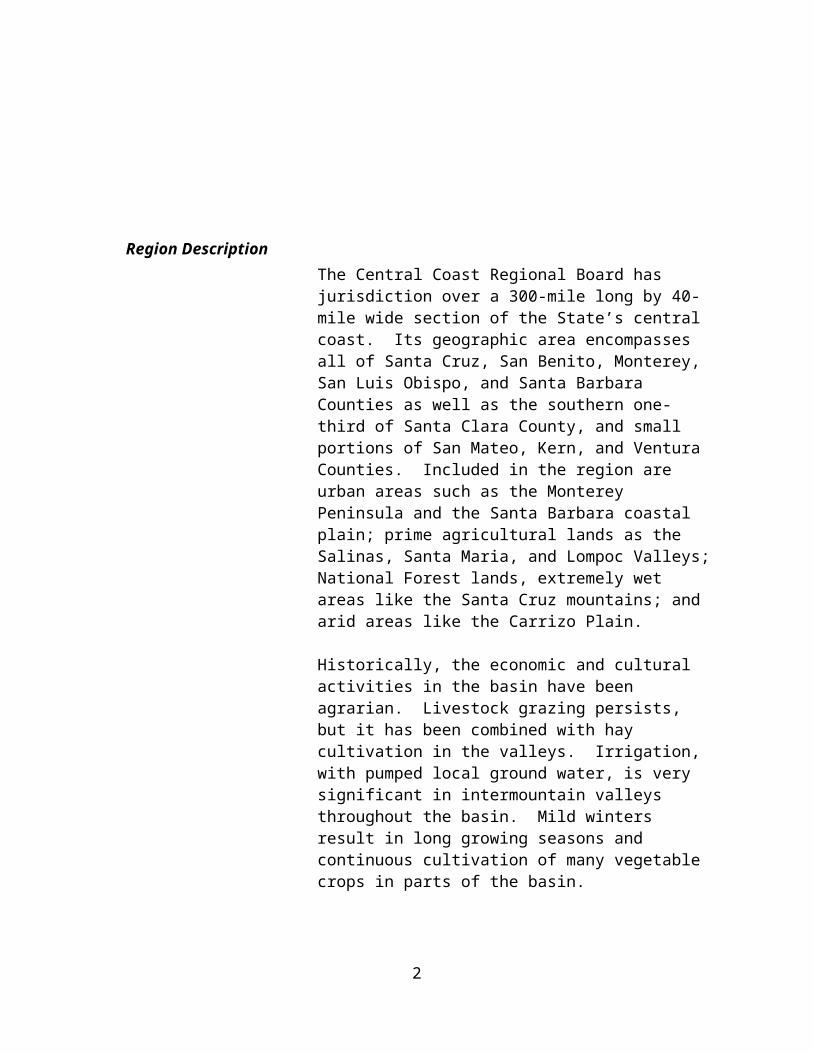
73
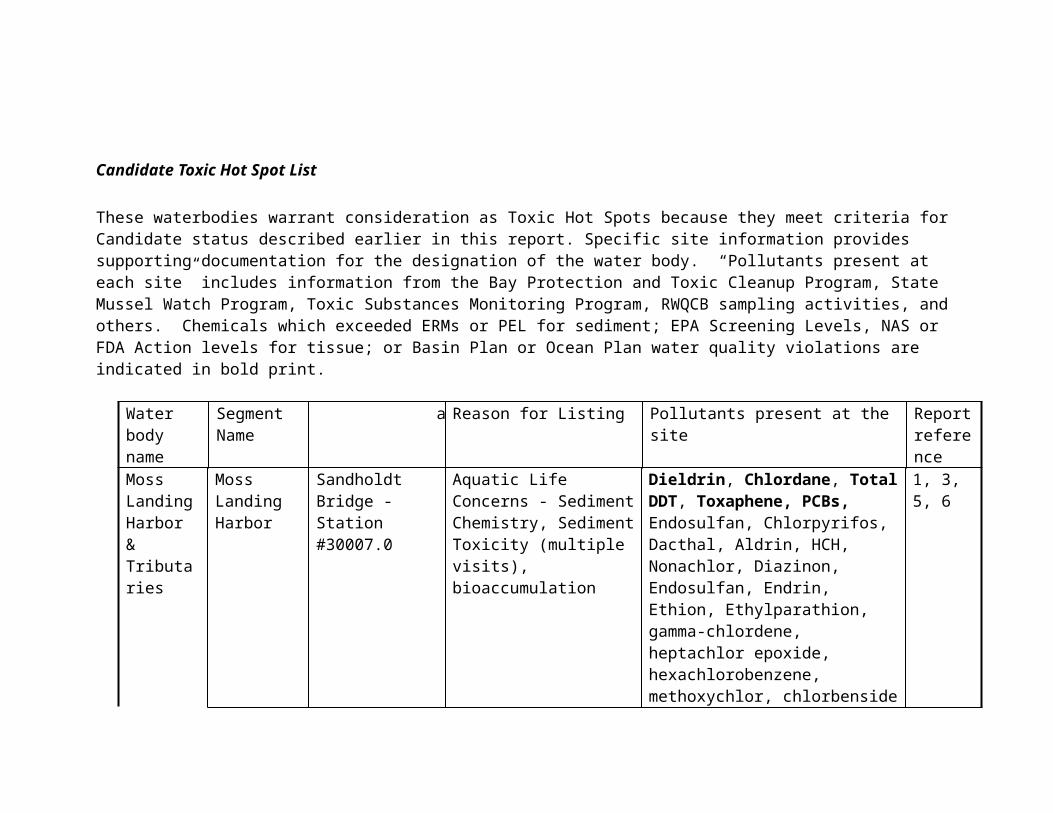
4
REGIONAL WATER QUALITY CONTROL BOARD, LOS ANGELES REGION
REGIONAL TOXIC HOT SPOT CLEANUP PLAN
Region DescriptionThe Los Angeles Region encompasses all coastal drainages flowing to the Pacific Ocean between Rincon Point (on the coast of western Ventura County) and the eastern Los Angeles County line, as well as the drainages of five coastal islands (Anacapa, San Nicolas, Santa Barbara, Santa Catalina and San Clemente). In addition, the region includes all coastal waters within three miles of the continental and island coastlines.
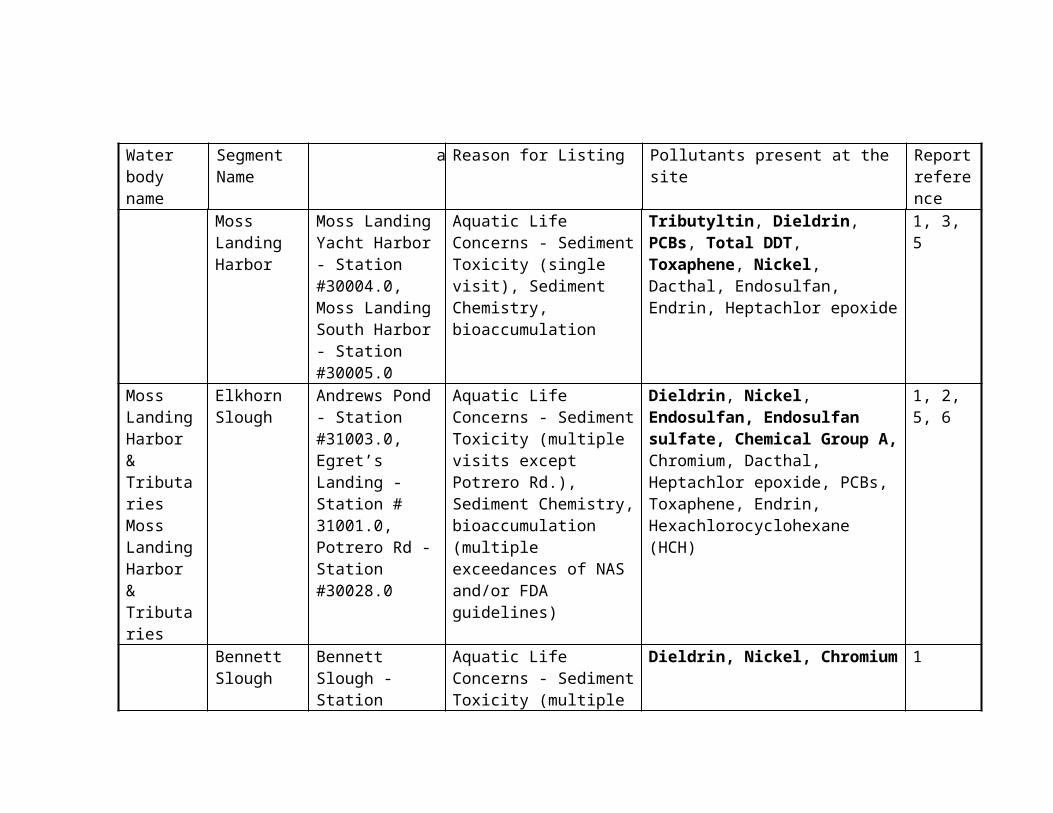
The enclosed bays, estuaries and coastal waters of the Los Angeles Region subject to the provisions of the Bay Protection and Toxic Cleanup Program are listed in Table 1). The region contains two large deepwater harbors (Los Angeles and Long Beach Harbors) and one smaller deepwater harbor (Port Hueneme). There are small craft marinas within the harbors, as well as tank farms, naval facilities, fish processing plants, boatyards, and container terminals. Several small-craft marinas also occur along the coast (e.g., Marina del Rey, King Harbor, Ventura Harbor); these contain boatyards, other small businesses and dense residential development.
Several large, primarily concrete-lined rivers (e.g., Los Angeles River, San Gabriel River) lead to unlined tidal prisms which are influenced by marine waters. Salinity may be greatly reduced following rains since these rivers drain large urban areas composed of mostly impermeable surfaces. Some of these tidal prisms receive a considerable amount of freshwater throughout the year from publicly-owned treatment plants discharging tertiary-treated effluent. Lagoons are located at the mouths of other rivers draining relatively undeveloped areas (e.g., Mugu Lagoon, Malibu Lagoon, Ventura River Estuary, Santa Clara River estuary). There are also a few isolated coastal brackish water bodies receiving runoff from agricultural or residential areas.
Santa Monica Bay, which includes the Palos Verdes Shelf for the purposes of the Bay Protection and Toxic Cleanup
TABLE 1. LOS ANGELES REGION - WATERBODIES COVERED UNDER BAY PROTECTION AND TOXIC CLEANUP PROGRAM
WATER BODY OR SEGMENT NAME HYDROLOGIC UNIT TOTAL AREAL EXTENTESTUARIESOrmond Beach Wetlands 400.00 20 acresVentura River Estuary 402.10 10 acresSanta Clara River Estuary 403.00 60 acresCalleguas Creek Tidal Prism 403.11 10 acresMcGrath Lake Estuary 403.11 40 acresMugu Lagoon-East & West Arms 403.11 1500 acresMalibu Lagoon 404.31 29 acresColorado Lagoon 405.12 13 acresDominguez Channel Tidal Prism 405.12 8 milesLos Angeles River Tidal Prism/Queensway Bay 405.12 3 milesLos Cerritos Channel Tidal Prism/Wetland 405.12 5 acresSim’s Pond 405.12 1 acreBallona Wetlands 405.13 150 acresVenice Canals 405.13 20 acresSan Gabriel River Tidal Prism 405.15 3 miles
ENCLOSED BAYSChannel Islands Harbor 403.11 220 acresPort Hueneme 403.11 121 acresVentura Harbor 403.11 423 acres
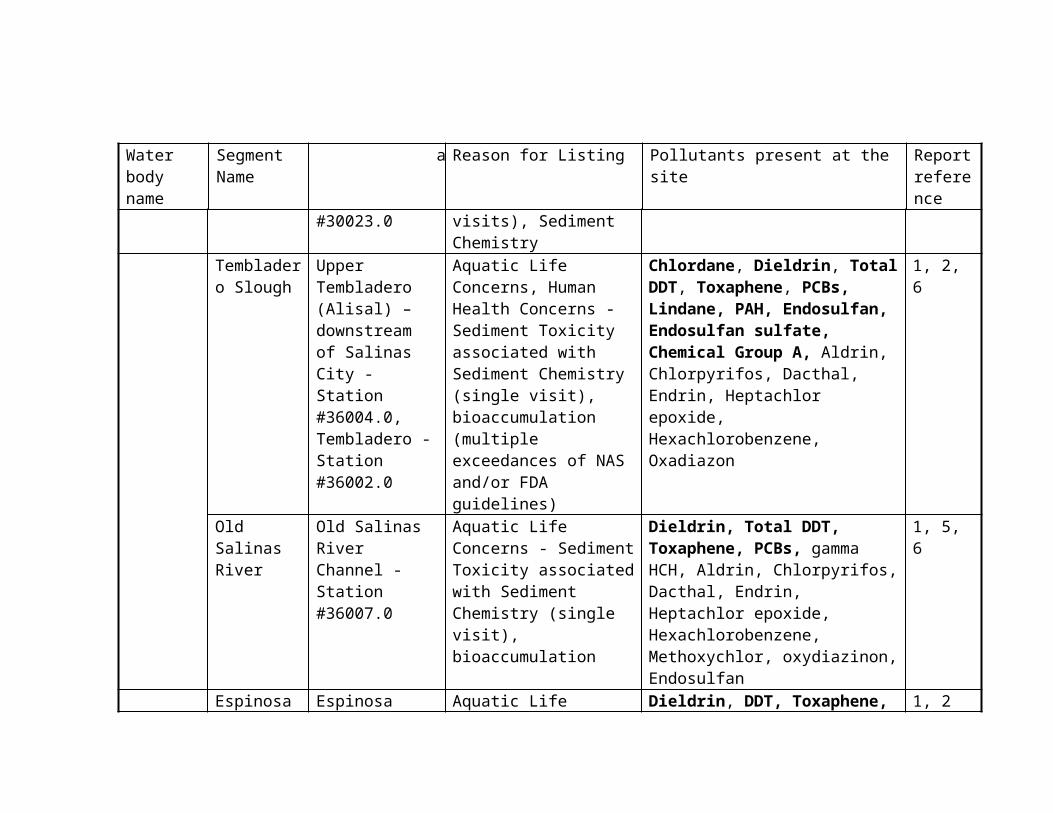
Alamitos Bay 405.12 285 acresKing Harbor 405.12 90 acresLong Beach Harbor (Inner) 405.12 840 acresLong Beach Marina 405.12 100 acresLos Angeles Harbor (Inner) 405.12 1,260 acresSan Pedro Bay 405.12 10,700 acresShoreline Marina 405.12 25 acresMarina Del Rey Harbor 405.13 354 acres
OPEN BAYS/OCEANNearshore - Point Mugu to Latigo Point 400.00 11,710 acresSanta Monica Bay (L.A. County Line to Pt. Fermin) 405.13 256,000 acresAnacapa Island ASBS 406.10 21,280 acresSan Nicolas Island/Begg Rock ASBS 406.20 102,528 acresSanta Barbara Island ASBS 406.30 14,000 acresSanta Catalina Island ASBS 406.40 17,936 acresSan Clemente Island ASBS 406.50 80,512 acres
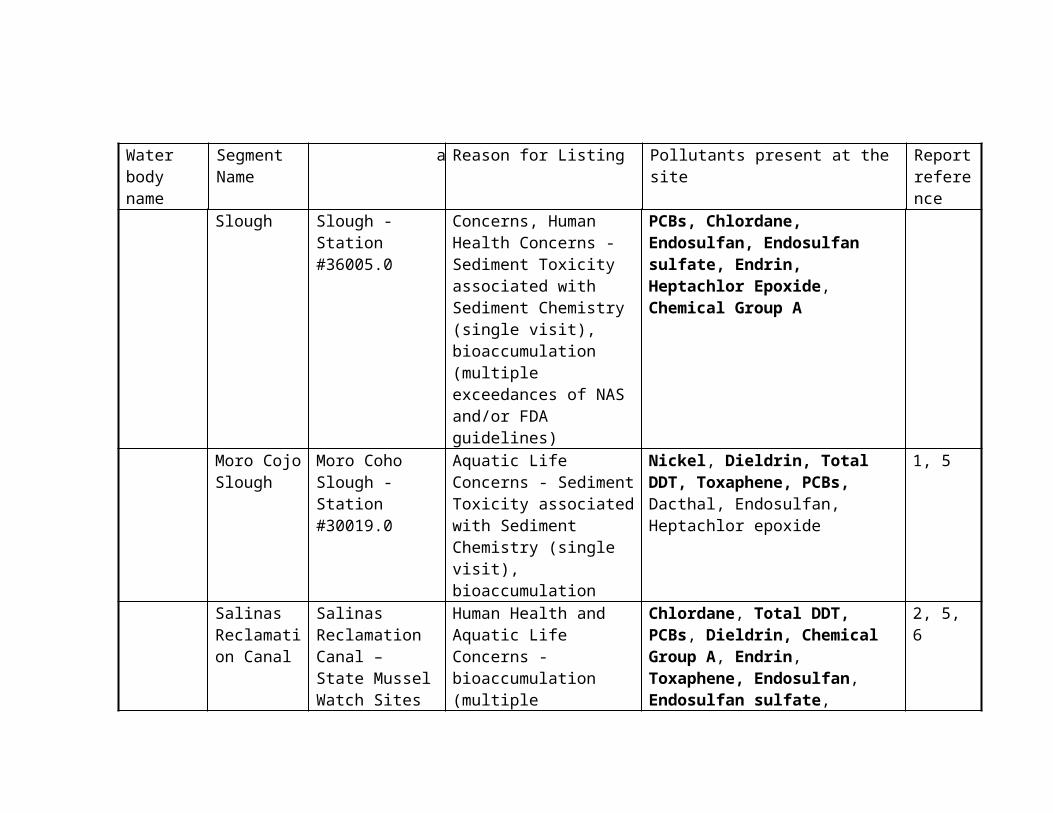
Figure 1: Sampling Stations in Outer Los Angeles and Long Beach Harbor, Port Hueneme, and Palos Verdes.
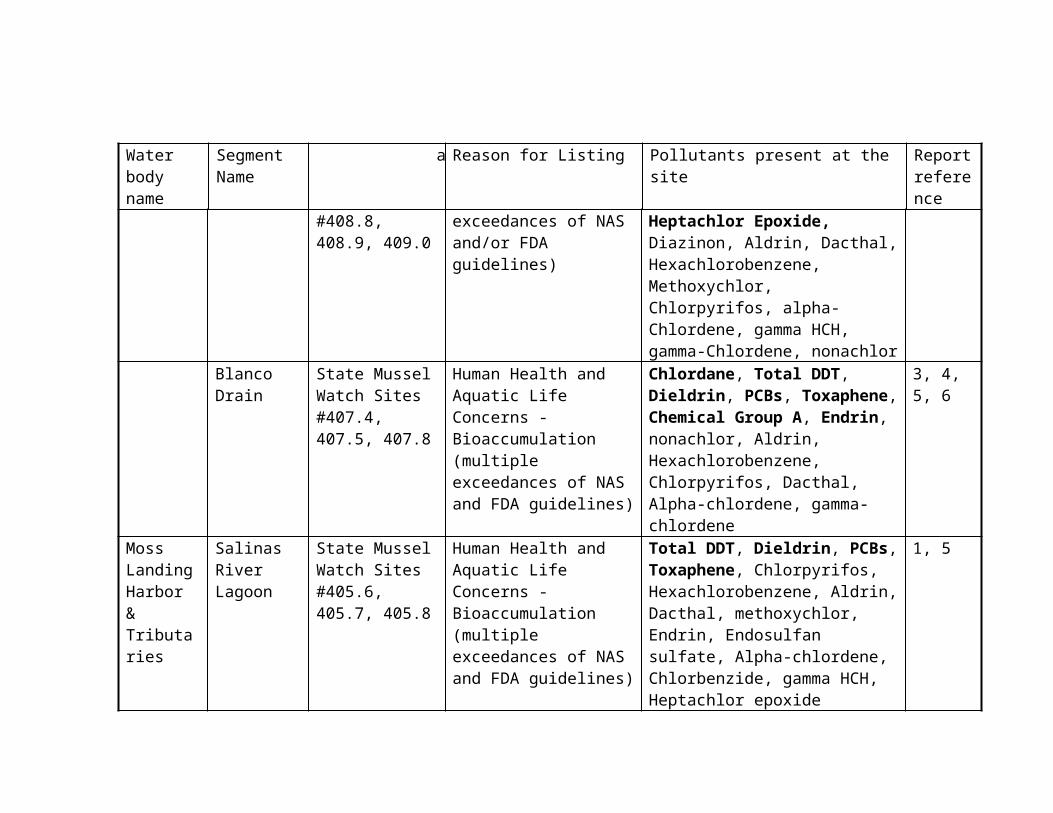
Figure 2: Sampling Stations in Inner Los Angeles and Long Beach Harbor and Consolidated Slip.
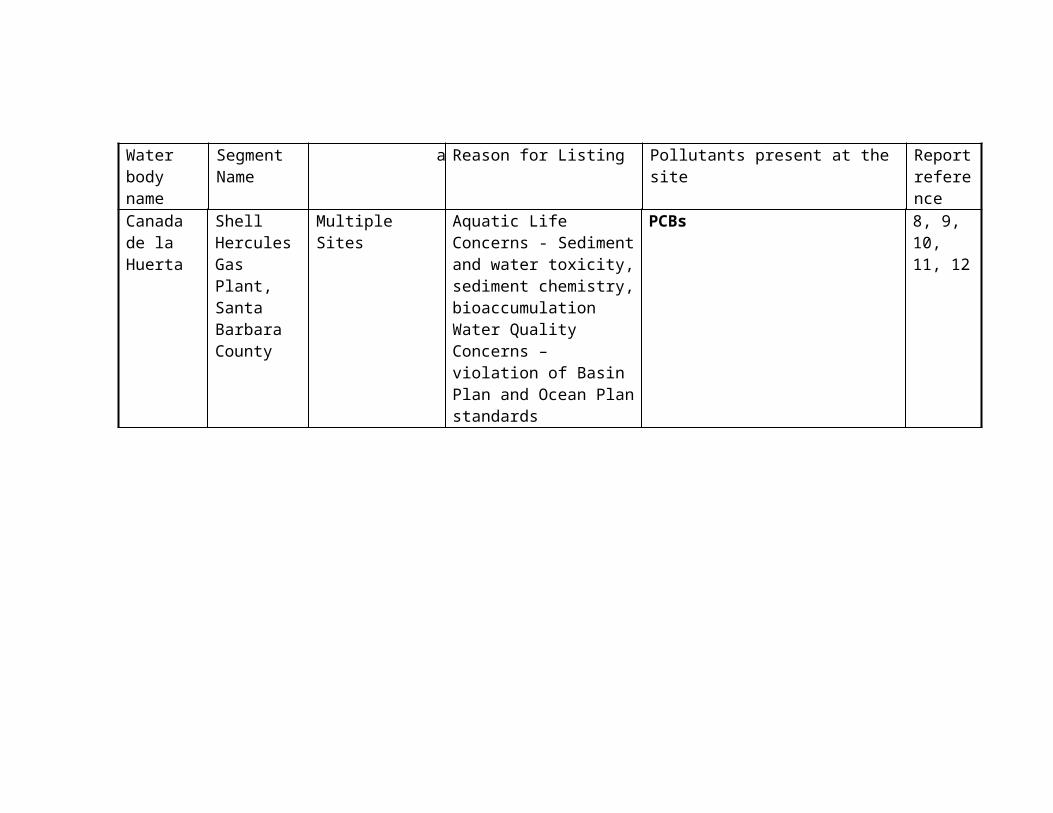
Figure 3: Sampling Stations in Shoreline Marina and Los Alamitos Bay.
Figure 4: Sampling Stations in King Harbor and Marina del Ray.
Figure 5: Sampling Stations in Ventura Marina and Channel Islands Harbor.
Figure 6: Sampling Stations in Mugu Lagoon.
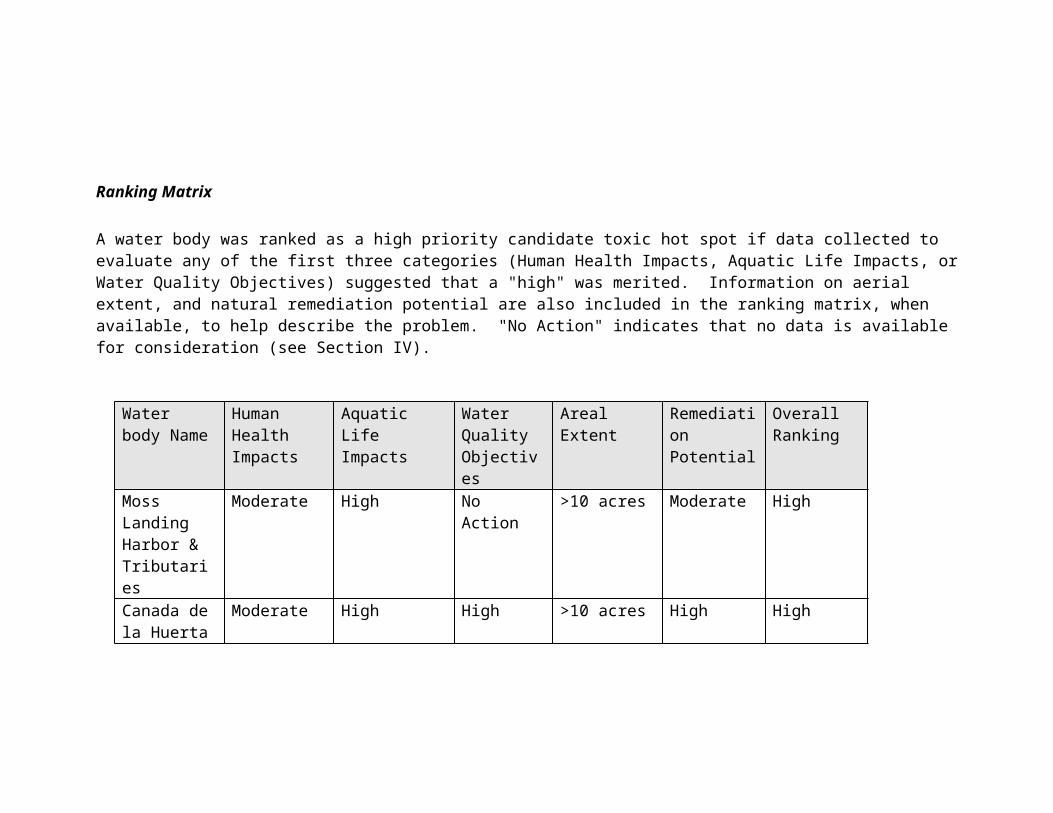
Figure 7: Sampling Stations in McGrath Lake, Ballona Creek and Colorado Lagoon/ Sims Pond.
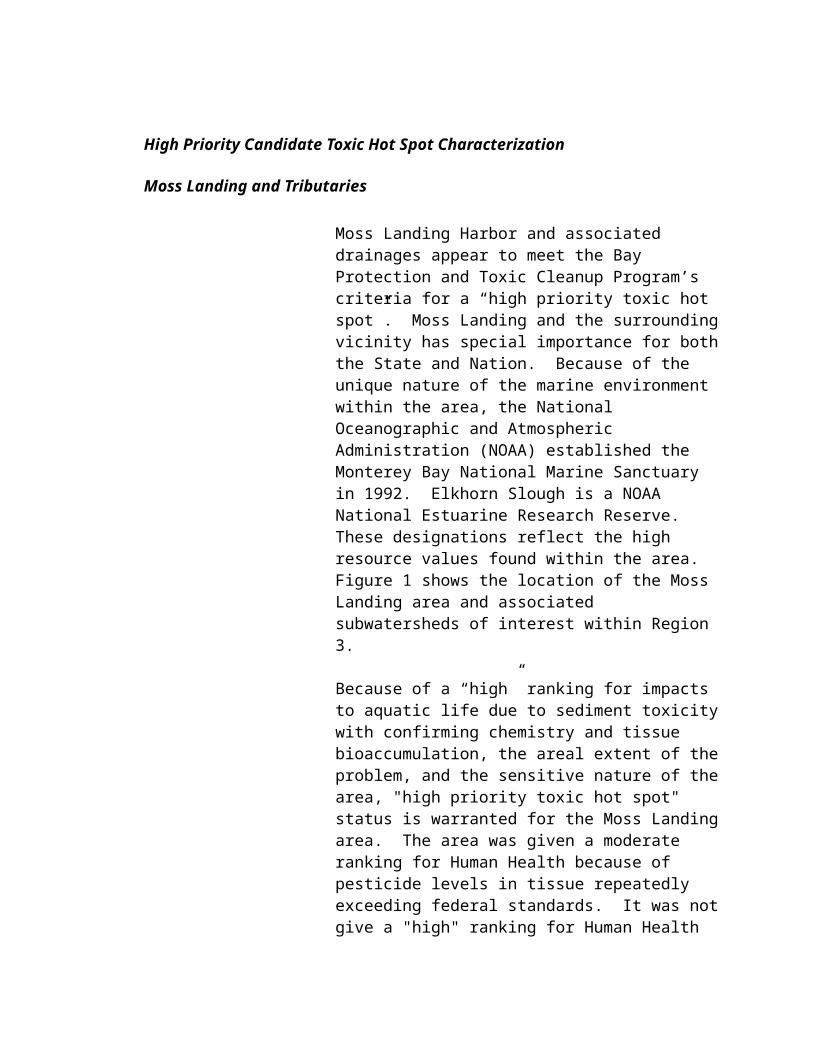
Figure 8: Sampling Stations in Ventura River Estuary, Santa Clara River Estuary and Malibu Lagoon.
Program, dominates a large portion of the open coastal waters in the region. The region's coastal waters also include the areas along the shoreline of Ventura County and the waters surrounding the five offshore islands in the region Sites of Concern
Candidate Toxic Hot Spot ListWater body name
Segment Name
Site Identification Reason for Listing Pollutants present at the site
Report reference
Santa Monica Bay
Palos Verdes Shelf
BPTCP 40031.1, 40031.2, 40031.3
Human health advisory; NAS level exceeded for DDT; sediment concentrations + sediment toxicity; degraded benthic community
DDT, PCB [1], [2], [3], [4]
Mugu Lagoon/Calleguas Creek Tidal Prism
Eastern Arm, Main Lagoon, Western Arm/Tidal Prism
BPTCP 44050.0, 44052.0, 44053.0, 44054.0; 44016.0, 48013.0, 48014.0, 48015.0, 48016.0, 48017.0, 48018.0, SMW 507.8; TSM 403.11.04, 403.12.06
Reproductive impairment; OEHHA level exceeded for Hg; NAS level exceeded for DDT; sediment concentrations + sediment toxicity; degraded benthic community
DDT, PCB, metals, Chlordane, Chlorpyrifos
[4], [5], [6], [7]
Los Angeles Inner Harbor
Dominguez Channel/Consolidated Slip
BPTCP 40006.1, 40006.2 Human health advisory; NAS level exceeded for DDT; sediment concentrations + sediment toxicity; degraded benthic community
DDT, PCB, PAH, metals (Cd, Cu, Pb, Hg, Zn), dieldrin, chlordane
[4], [8], [9], [10]
Los Angeles Outer Harbor
Cabrillo Pier BPTCP 40010.1, 40010.2, 40010.3
Human health advisory; NAS level exceeded for DDT; sediment concentrations + sediment toxicity
DDT, PCB, Cu [2], [4], [10]
Los Angeles River
Estuary BPTCP 40013.1 Sediment concentrations + sediment toxicity
DDT, PAH, Chlordane
[4]
Ballona Creek Entrance Channel
BPTCP 44024.0, COE Sediment concentrations + sediment toxicity
DDT, metals (Zn, Pb), Chlordane, Dieldrin, Chlorpyrifos
[4]
Marina del Rey
BPTCP 44014.0, 48001.0, 48002.0, 48003.0, 48004.0, 48005.0
Sediment concentrations + sediment toxicity
DDT, PCB, Metals (Cu, Hg, Ni, Pb, Zn), Chlordane
[4]
11

Reference list
[1] Los Angeles Regional Water Quality Control Board. Santa Monica Bay: State of the Watershed. June, 1997.[2] California Department of Fish and Game. 1996 California Sport Fishing Regulations.[3] Santa Monica Bay Restoration Project, Comprehensive Conservation and Management Plan, 1996.[4] Anderson, B. et al. 1998. Sediment chemistry, toxicity and benthic community conditions in selected water
bodies of the Los Angeles Region. Final Report to State Water Resources Control Board, Bay Protection and Toxic Cleanup Program Monitoring.
[5] Ledig, D. Preliminary report on the ecology of the light-footed clapper rail at Mugu Lagoon, Ventura Co., California.
[6] Final report to California Department of Fish and Game FG 8555, 1990.[7] Los Angeles Regional Water Quality Control Board. Calleguas Creek Watershed. June, 1996.[8] Malins, D.C. et al. Toxic chemicals, including aromatic and chlorinated hydrocarbons and their derivatives, and
liver lesions in white croaker (Genyonemus lineatus) from the vicinity of Los Angeles. Environ. Sci. and Tech., August 1987, pp. 765-770.
[9] MEC Analytical Systems, Inc. Biological baseline and ecological evaluation of existing habitats in Los Angeles Harbor and adjacent waters, Vol. II, Final Report. Page 4-74. Sept. 1988. Prepared for Port of Los Angeles, Environmental Management Division.
[10] Cross, J.N. et al. Contaminant concentrations and toxicity of sea-surface microlayer near Los Angeles, California. Mar. Environ. Research: 23 (1987) 307-323.
12
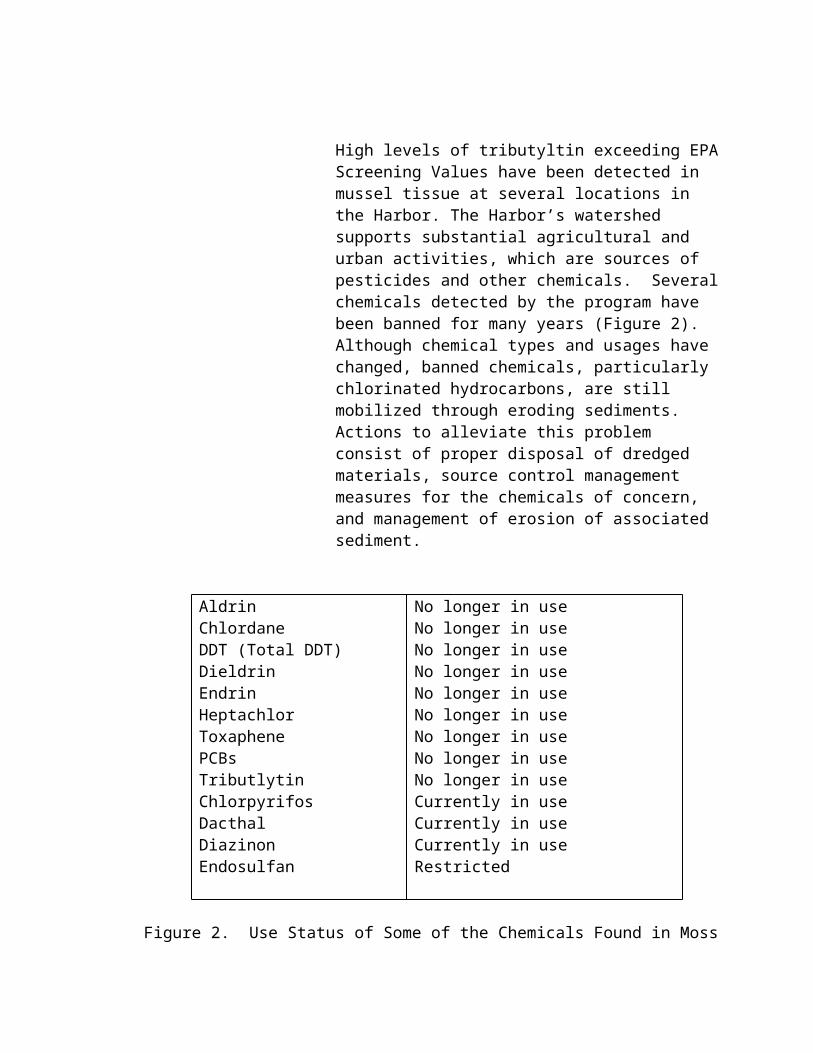
Ranking Matrix
Water body Name
Site Identification
Human Health Impacts
Aquatic Life Impacts
Water Quality Objectives
Areal Extent Remediation Potential
Overall Ranking
Santa Monica Bay
Palos Verdes Shelf
High High Low > 10 acres High High
Mugu Lagoon Eastern Arm, Main Lagoon, Western Arm/Tidal Prism
Moderate High Low > 10 acres High High
Los Angeles Inner Harbor
Dominguez Channel/Consolidated Slip
High High Low 1 - 10 acres High High
Los Angeles Outer Harbor
Cabrillo Pier High Moderate Low 1 - 10 acres High High
Los Angeles River
Estuary Moderate Moderate Low 1-10 acres High Moderate
Marina Del Rey
Entrance Channel
Low Moderate Low < 1 acre High Moderate
Marina del Rey Moderate Moderate Low 1-10 acres High Moderate
13
High Priority Candidate Toxic Hot Spot Characterization
This section of the cleanup plan contains a characterization of the four high priority candidate toxic hot spots identified (Santa Monica Bay/Palos Verdes Shelf, Mugu Lagoon/Calleguas Creek Tidal Prism, Los Angeles Outer Harbor/Cabrillo Pier, Los Angeles Inner Harbor/Dominguez Channel, Consolidated Slip). This section also contains a preliminary assessment of actions to address the problems identified at these sites.
Candidate Toxic Hot Spot Areal Extent Estimated Remediation Cost
Palos Verdes Shelf 9 million cubic meters $13 - 67 millionMugu LagoonCalleguas Creek Tidal Prism
725,000 cubic yards50,000 - 100,000 cubic yards
$72.5 million$1-5 million
Cabrillo Pier 25,000 - 50,000 cubic yards
$0.5 - 50 million
Consolidated Slip 50,000 cubic yards $1 - 50 million
Three areas were designated as moderate priority candidate toxic hot spots (Los Angeles River Estuary, Marina del Rey Entrance Channel, Marina del Rey), based on lower ratings for human health impacts and aquatic life impacts (refer to ranking matrix). The Cleanup Plan is not required to contain a detailed characterization report and preliminary assessment of remediation actions for “moderate” candidate toxic hot spots. However, these needs would be addressed in the future after remediation plans have been initiated at the high priority sites.
Santa Monica Bay/Palos Verdes Shelf
The contaminated sediments on the Palos Verdes Shelf appear to significantly impact the marine community and may pose a serious risk to individuals who regularly consume fish from the area. Currently, elevated levels of DDT and PCBs are found in the organisms that live in the area of the contaminated sediments, including bottom feeding fish such as white croaker, and water column feeders such as kelp bass. Marine mammals and birds could be affected through the consumption of contaminated fish [Draft Ecological Risk Evaluation Report for the Palos Verdes Shelf, U.S. Environmental Protection Agency, September 1998].
The ongoing release of these hazardous substances from the sediment into the environment and the resulting accumulation of DDT and PCB in food chain organisms may persist if no action is taken. Commercial fishing and recreational fishing have been affected by the contamination. The State of California has issued a health advisory warning against the consumption of white croaker and kelp bass and closed commercial fishing for white croaker on the Palos Verdes Shelf.
A. Areal Extent of Toxic Hot Spot
In July 1996, the United States Environmental Protection Agency initiated a response action under Superfund site and began an evaluation to address the large deposit of DDT and PCB contaminated sediments on the Palos Verdes Shelf. The contaminated sediment footprint identified as the study area for this evaluation was defined as the boundary for one part-per-million (mg/kg) sediment DDT concentration described by the United States Geological Survey (USGS), covering portions of the continental shelf and continental slope between Point Vicente in the northwest and Point Fermin to the southeast (Figure 9). This entire area is proposed as a candidate know toxic hot spot.
Studies by the USGS in 1992 and 1993 indicated that this layer of contaminated sediments is about two inches to two feet thick and covers an area of more than 15 square miles, with the highest concentrations located in a 3-square mile band near the outfall pipes. The total volume of contaminated sediments on the Palos Verdes Shelf is approximately 9 million cubic meters and covers a surface area of approximately 40 square kilometers, with approximately 70% of this volume present on the continental slope in water depths less than 100 meters. The total mass of p,p’-DDE in the contaminated sediments is estimated to be greater than 67 metric tons.

Figure 9: Areal extent of toxic hot spot on the Palos Verdes Shelf.
In addition to the large volume of monitoring data evaluated as part of the Superfund evaluation, limited sampling was conducted as part of the Bay Protection and Toxic Cleanup Program. BPTCP monitoring data showed that on September 10, 1992, sediment concentrations at stations 40031.1, 40031.2 and 40031.3 exceeded
the ERM thresholds for Total DDT and Total PCB. Samples collected on August 17-19, 1993, and February 3. 1994, at station 40031.2 (Replicates 1, 2 and 3) also exceeded the ERM thresholds for Total DDT and Total PCB. Amphipod toxicity was recorded with whole sediments at station 40031.2 on February 3, 1994. Porewater toxicity to abalone was recorded at station 40031.2 on September 10, 1992. A degraded benthic community was observed at station 40031.2 on August 17-19, 1993.
Palos Verdes Shelf BPTCP Stations With Sediment Chemistry Concentrations Exceeding ERM Threshold
BPTCP Station Sampling Date Total DDT (ppb) Total PCB (ppb)40031.1 9/10/92 2729.3 268.740031.2 9/10/92 3337.5 271.340031.3 9/10/92 2520.7 204.1
40031.2 Rep 1 8/17-19/93 2525.8 259.540031.2 Rep 2 8/17-19/93 3569.3 301.440031.2 Rep 3 8/17-19/93 2604.6 302.540031.2 Rep 1 2/3/94 3344.2 271.340031.2 Rep 2 2/3/94 3331.5 312.840031.2 Rep 3 2/3/94 2063.9 221.8
B. Sources of Pollutants
From 1947 to 1983, the Montrose Chemical Corporation of California, Inc., manufactured the pesticide dichloro-diphenyl-trichloroethane (DDT) at its plant at 20201 Normandie Avenue in Los Angeles. Wastewater containing significant concentrations of DDT was discharged from the Montrose plant into the sewers, flowed through the Los Angeles County Sanitation Districts' wastewater treatment plant and was discharged to the Pacific Ocean waters on the Palos Verdes Shelf through subsurface outfalls offshore of Whites Point. Montrose's discharge of DDT stopped around 1972, and the plant was shut down and dismantled in 1983.
Polychlorinated biphenyls (PCBs) also were present in the wastewater discharged from the LACSD wastewater treatment plant and are found along with DDT in the effluent-affected deposits on the ocean floor along the Palos Verdes Shelf. Historically, PCB contamination entered the sewer system as the result of discharges from several industrial sources.
Although DDT and PCBs were banned in the early 1970s, release of contaminants from historically deposited sediments continues to be a source of these toxic chemicals. Concentrations of total DDT and p,p'-DDE (the predominant metabolite of DDT) in the surface sediments have remained relatively high since the late 1980s. This suggests that historical deposits are brought to the sea floor surface by a combination of natural physical, chemical or biological processes.
Besides DDT and PCB, there has been little evidence that the concentrations of other toxic organic compounds, such as PAHs and heavy metals (including copper, cadmium, chromium, nickel, silver, zinc and lead), discharged from the LACSD wastewater treatment plant have caused impacts to marine organisms. However, the concentrations of heavy metals in the sediments on the Palos Verdes Shelf are significantly higher than the background levels found in most parts of Santa Monica Bay and other parts of the Southern California Bight.
C. Actions by Regional Board
The Los Angeles Regional Board's Water Quality Assessment identifies the Palos Verdes Shelf as an impaired water body. The aquatic life beneficial use was listed as impaired due to sediment toxicity, tissue bioaccumulation of pollutants (DDT, PCBs, silver, chromium, lead), sediment contamination (DDT, PCBs, cadmium, copper, lead, mercury, nickel, zinc, PAHs, chlordane), and a health advisory warning against consumption of fish (white croaker). The Regional Board believes that the impairment is due to the effects of historical discharges of these pollutants, since the concentrations presently discharged are very low.
The Santa Monica Bay Restoration Project (SMBRP) was formed in 1988 under the National Estuary Program in response to the critical problems facing Santa Monica Bay. The Los Angeles Regional Board has been an active participant in this program. The SMBRP was charged with the responsibility for assessing the Bay's problems, developing solutions and putting them into action. The scientific characterization of the Bay is described in the SMBRP's "State of the Bay, 1993" report and other technical investigations. This report, along with the Project's recommendations for action, comprises the Bay Restoration Plan which was approved in 1995. With over 200 recommended actions (74 identified as priorities), the plan addresses the need for pollution prevention, public health protection, habitat restoration and comprehensive resource management throughout Santa Monica Bay, including the Palos
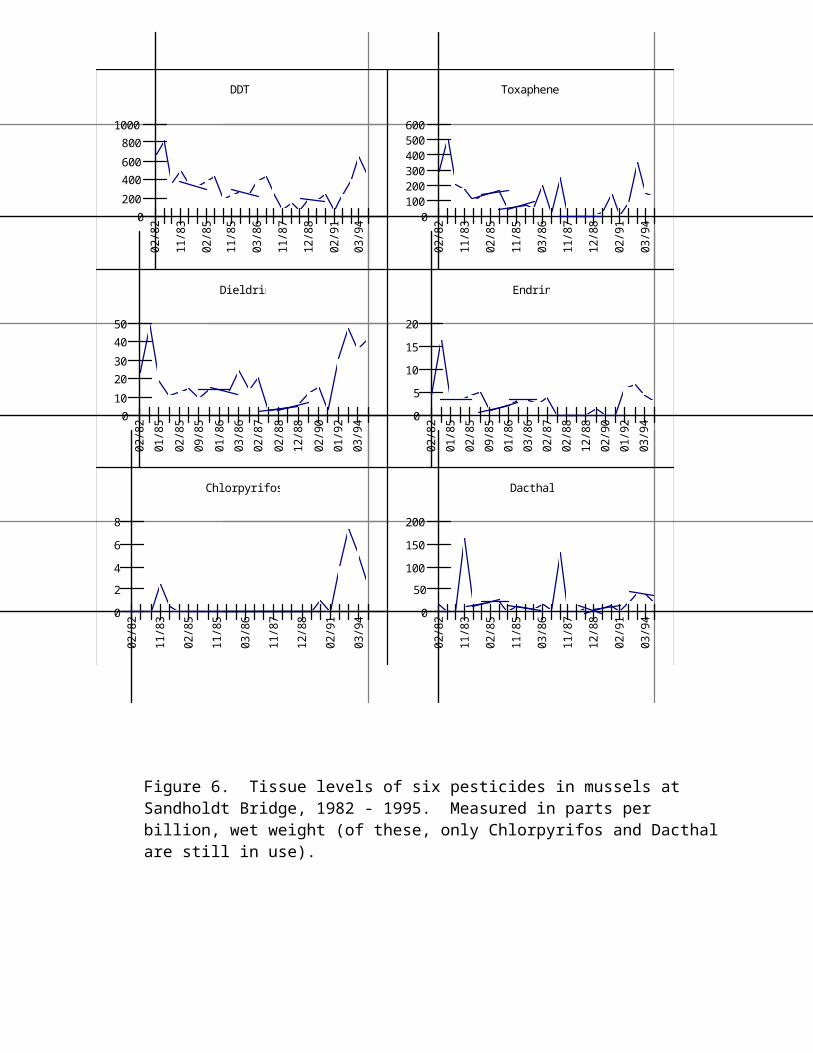
Verdes Shelf area. The Los Angeles Regional Board is the lead agency responsible for implementation of several recommended actions.
The Los Angeles Regional Board has adopted a watershed management approach, which is expected to regulate pollutant loads from point sources through permits that better focus on issues relevant to each watershed. The Regional Board also expects that pollutant loads from nonpoint sources can be better controlled through the participation of the public in the management of their watersheds. During the 1996-97 Fiscal Year, the watershed management approach was used to renew selected NPDES permits within the Santa Monica Bay Watershed. The NPDES permit for the Los Angeles County Sanitation Districts’ Joint Water Pollution Control Plant, which discharges a mixture of advanced primary and secondary effluent through an ocean outfall onto the Palos Verdes Shelf, was renewed with appropriate limits, performance goals and mass emission caps to limit the discharge of pollutants of concern.
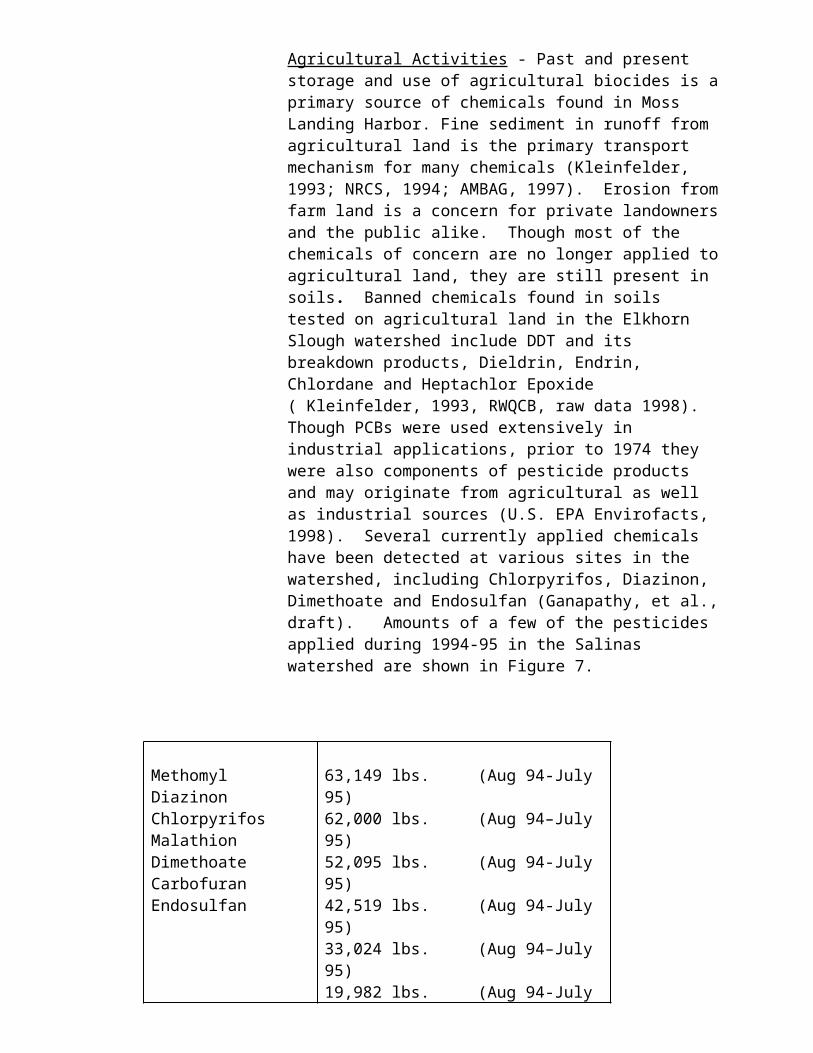
D. Preliminary Assessment of Remediation Actions
In July 1996, the U.S. Environmental Protection Agency decided to undertake a Superfund response (under the Comprehensive Environmental Response, Compensation and Liability Act) called a removal action to address the contaminated sediment problem on the Palos Verdes Shelf. EPA initiated the preparation of an Engineering Evaluation/Cost Analysis (EE/CA) of possible response actions. The EE/CA will evaluate the need for Superfund action and will use the three broad criteria of effectiveness, implementability and cost to evaluate the alternatives for addressing hazardous substances being released into the environment.
As an initial step in the EE/CA process, EPA has prepared the "Screening Evaluation of Response Actions for Contaminated Sediments on the Palos Verdes Shelf". The Screening Evaluation describes the range of potential cleanup and disposal technologies for contaminated sediments and makes an initial determination about which technologies will be incorporated into the alternatives evaluated in detail in the EE/CA. General response actions which were evaluated included:
-removal (i.e., dredging) and treatment or disposal;-institutional controls; and-in situ (or in-place) capping;-no action.
While sediment removal (i.e., dredging) is technically feasible, it could possibly result in the dispersal of contaminated sediment, thereby increasing short-term risks. Once dredged, the sediment would require disposal, possibly preceded by treatment, which could be both expensive and very difficult to implement. Upland disposal facilities are very limited, and disposal options along the coastline or in the open ocean would likely violate Federal and State environmental laws. For these reasons, EPA has decided not to consider dredging and treatment or disposal options further in the EE/CA.
Institutional control measures, such as warning notices or fishing restrictions, intended to protect human health already have been established for certain coastal areas including the Palos Verdes Shelf by the State of California, although their effectiveness is uncertain. Additional institutional controls could include measures to (1) expand the scope of existing State controls by increasing the area affected; (2) increase the awareness of and effectiveness of
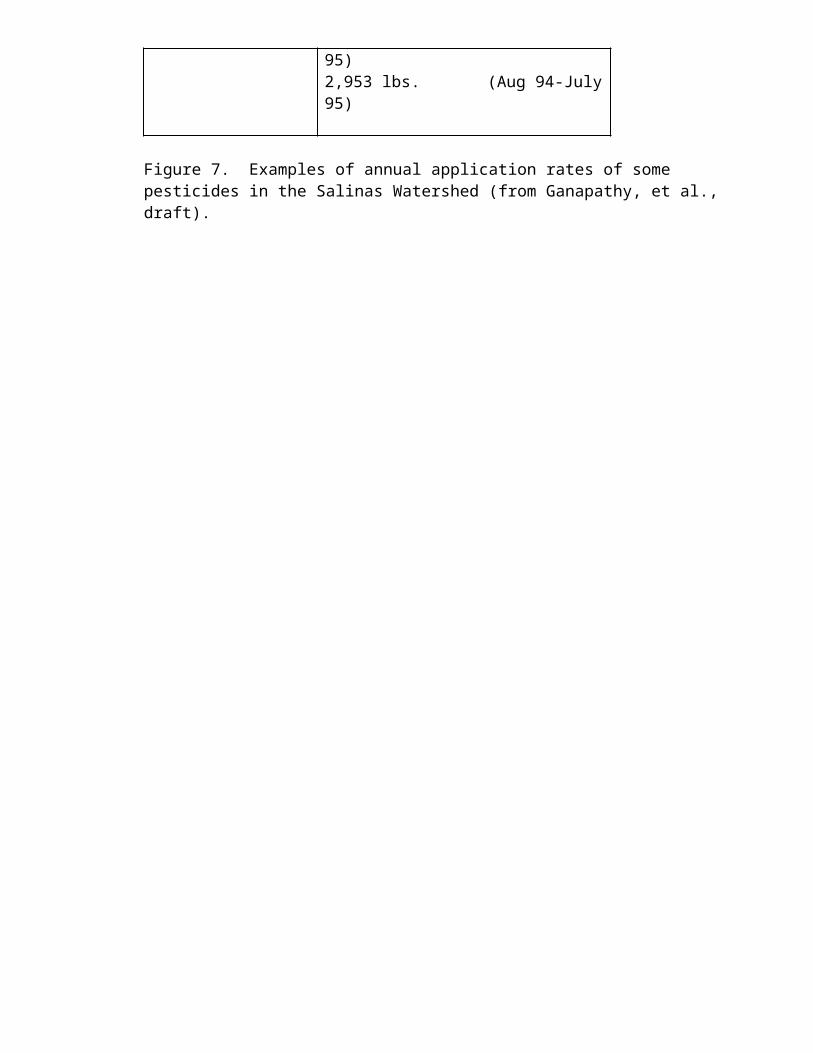
existing controls through additional public outreach efforts; and (3) enhance State enforcement of the commercial fishing closure.
In situ, or in-place, capping can be used to prevent or reduce direct human or ecological exposure to contaminants and to prevent migration of contaminants into the water. The cap could reduce or eliminate adverse impacts through (1) physical isolation of the contaminated sediment from the benthic environment, reducing the exposure of organisms to contaminants and limiting the potential for bioaccumulation and movement of contaminants into the food chain; (2) physical stabilization of the contaminated layer to retard resuspension and transport of contaminated sediment; and (3) reducing the flux of dissolved contaminants from the sediments into the water column (e.g., due to waves and currents). Large caps for areas like the Palos Verdes Shelf typically would consist of clean dredged material (i.e., sand or silt) that is placed over the contaminated area using dredge or platform barges. Caps can be constructed to various sizes or thicknesses and may be augmented after initial construction to increase effectiveness. For a large site like the Palos Verdes Shelf, a phased approach to capping would likely be desirable in order to maximize cost-effectiveness. Any cap design would need to consider the engineering characteristics of the cap material and the effluent-affected sediment in order to address potential erosion by currents and waves, mixing of the cap material and underlying sediment by bottom-dwelling organisms or other disturbances.
In situ capping has the potential to isolate the contaminated marine sediments, thereby providing long-term protection for the majority of the mass of contaminants on the Palos Verdes Shelf. Approximately 25% of the mass of contaminants is on the Palos Verdes slope, which is likely to be too steep for capping. Over the short term, capping would have some adverse impact on the existing benthic communities in the capped area, although it is expected that they would rapidly recolonize. If the cap were composed of suitable dredged material generated by local navigation projects (e.g., maintenance dredging), there would be no additional excavation beyond that already required for those projects, and reuse of the material for capping would reduce short-term impacts at traditional disposal sites. Carefully controlled placement of the cap material would minimize the resuspension of contaminated sediment.
In situ caps have been used successfully at numerous sites, although not as deep as the deeper parts of the Palos Verdes Shelf. In general, existing caps have stabilized after initial reworking and
consolidation of the contaminated sediment. Capping could be accomplished reasonably quickly, depending on the availability of capping material.
A draft report (September 1998) prepared by the United States Army Corps of Engineers for EPA evaluates “Options for In-Situ Capping of Palos Verdes Shelf Contaminated Sediment”. The report considers two options: (1) capping an area of approximately 4.9 square kilometers centered over the area with the highest DDT contamination; (2) capping a secondary area of contamination comprising approximately 2.7 square kilometers located northwest of the first area. Bioturbation, consolidation and cap effectiveness evaluations indicated that a thickness of 15 centimeters would be appropriate for a thin capping approach, designed to isolate contaminated material from shallow burrowing benthic organisms, while a 45 centimeter cap would be adequate for a thick cap design, effectively isolating the contaminated material from benthic organisms. Capping both areas with a thick cap (45 cm) would result in a reduction of potential exposures to contaminants over the total shelf area on the order of 60-70%, while a thin cap (15 cm) over both area reduces the potential exposures on the order of 60%. Capping only the most contaminated area (4.9 square kilometers) with a thin cap would reduce potential exposures on the order of 40%.
E. Cost Estimate to Implement Cleanup Plan
Cost estimates have been developed by the United States Environmental Protection Agency for three capping options (others may be developed):
Option 1 - capping of both areas (4.9 + 2.7 square kilometers) with a thick (45 cm) isolation cap = approximate cost would be $44 million to $67 million.
Option 2 - capping of both areas (4.9 + 2.7 square kilometers) with a thin (15 cm) cap = approximate cost would be $18 million to $30 million.
Option 3 - capping of only the most contaminated area (4.9 square kilometers) with a thin (15 cm) cap approximate cost would be $13 million to $19 million.
Option 1 would require on the order of 7 million cubic meters of capping material for implementation, while options 2 and 3 would require proportionally less material.
F. Estimate of Recoverable Costs from Dischargers
The United States National Oceanographic and Atmospheric Administration (NOAA), via its Natural Resource Damage Assessment, and the United States Environmental Protection Agency (EPA), via Superfund, are attempting to recover financial damages from parties responsible for DDT-related damages to the environment on the Palos Verdes Shelf. EPA estimates that approximately $20-25 million may be recovered from municipalities through settlement agreements. NOAA and EPA are seeking to recover approximately $100 million from Montrose Chemical Corporation, Westinghouse Electric Corporation and other industrial dischargers. All of the recovery estimates are approximations, and the actual amount recovered may change.
G. Two-year Expenditure Schedule
EPA should complete its evaluation of alternatives (including the "no-action" alternative) and issue the EE/CA report during 1999. At the end of the EE/CA process, EPA will solicit public comment on the EE/CA report, including the recommended removal alternative. If EPA decides to move ahead, EPA would issue an Action Memorandum formally selecting the response action.
Option 1 would require approximately 5 years to construct with a single hopper dredge. However, to take advantage of the availability of clean dredged material from the Queensway Bay dredging project for use in the cap, it may be necessary to use three hopper dredges, reducing the time for completion of the project to less than 2 years. Options 2 and 3 would require proportionally less material and less time for completion.
If $20-25 million becomes available from settlement agreements or other means, Options 2 and 3 potentially could be implemented within two years. Although Option 1 could be completed with 2 years with the use of multiple hopper dredges, $20-25 million would only allow completion of approximately one-third to one-half of the capping project, unless additional funds are available.
H. Benefits of Remediation
Capping of the DDT and PCB contamination on the Palos Verdes Shelf would isolate this material from the benthic environment and reduce bioaccumulation and movement of contaminants into the food chain. This would improve the ecological health of the marine environment and could lead to elimination of the health advisory warning against human consumption of fish caught in this area.
I. Environmental Impacts of Remediation
Placement of a cap could release contaminants into the marine environment, but design studies indicate that this should not occur with proper deployment of the capping material. Depending on the nature of the cap material, placement of the cap could destroy or modify the existing benthic community. Placement of the cap could cause damage to the ocean outfall and interfere with its operation. Monitoring will be required to verify the integrity of the final cap and assess environmental impacts from cap placement.
Mugu Lagoon/Calleguas Creek Tidal PrismMonitoring of Mugu Lagoon and the lower Calleguas Creek watershed has identified the following problems: (1) impaired reproduction in the light-footed clapper rail, a resident endangered species inhabiting the lagoon, due to elevated levels of DDT and PCBs; (2) fish and shellfish tissue levels exceeded National Academy of Sciences guidelines for several pesticides; (3) possible exceedances of U.S. Environmental Protection Agency water quality criteria for the protection of saltwater biota for nickel, copper and zinc at some locations; (4) possible impacts to sediment and water quality, as well as aquatic community health, from operations at the Naval Air Base over many years. Several pesticides whose use has been discontinued still are found at high concentrations in the sediment and biota; (5) excessive sediment loading.
The Point Mugu Naval Air Base is located in the immediate vicinity of Mugu Lagoon. The surrounding Oxnard Plain supports a large variety of agricultural crops. These fields drain into ditches which either enter the lagoon directly or through Calleguas Creek and its tributaries. The lagoon borders on an Area of Special Biological Significance and supports a great diversity of wildlife, including several endangered birds and one endangered plant species. Except for the military base, the Oxnard Plain portion of the watershed is relatively undeveloped.
Calleguas Creek and its major tributaries (Revolon Slough, Conejo Creek, Arroyo Conejo, Arroyo Santa Rosa and Arroyo Simi) drain an area of 343 square miles in southern Ventura County and a small portion of western Los Angeles County. This watershed is about 30 miles long and 14 miles wide.
The Calleguas Creek watershed exhibits some of the most active and severe erosion rates in the country. Although erosion rates are naturally high in this tectonically active area, land use also is a factor in erosion and sedimentation problems. Channelization of Calleguas Creek was initiated by local farmers in Somis and downstream areas beginning about 1884, and around Revolon Slough in 1924. Following complete channelization, eroded sediment generated in the higher reaches of the Calleguas Creek watershed has begun to reach Mugu Lagoon even during minor flood events. At current rates of erosion, it is estimated that the lagoon habitat could be filled with sediment within 50 years.
Urban developments generally are restricted to the city limits of Simi Valley, Moorpark, Thousand Oaks and Camarillo. Although some residential development has occurred along the slopes of the watershed, most upland areas still are open space. Agricultural activities
(primarily cultivation of orchard and row crops) are spread out along valleys and on the Oxnard Plain. The U.S. Navy maintains a Naval Air Base on much of the area around Mugu Lagoon.
The main surface water system drains from the mountains and toward the southwest, where it flows through the flat, expansive Oxnard Plain before emptying into the Pacific Ocean through Mugu Lagoon. Mugu Lagoon, situated at the mouth of the Calleguas Creek system, is one of the few remaining salt marshes in southern California along the Pacific Flyway. Threatened and endangered species that are supported by valuable habitats in Mugu Lagoon include the peregrine falcon, least tern, light-footed clapper rail and brown pelican. In addition to providing one of the last remaining habitats on the mainland for harbor seals to pup, Mugu Lagoon is a nursery ground for many marine fish and mammals.
The Eastern Arm of Mugu Lagoon is somewhat removed from the rest of the lagoon and tends to receive water from and drain directly into the lagoon mouth. The arm empties and fills rather quickly, leaving a considerable amount of sand near its western end, but moving towards finer sediments further east. The water tends to be marine in character the majority of the time.
The Main Lagoon and Western Arm are the areas most heavily used by birds (including endangered species). The Western Arm, with its slight gradient and slow water flow, has the most widespread freshwater influence during dry weather, receiving water from several drains. The Main Lagoon is affected primarily by Calleguas Creek, which may carry a considerable amount of fresh water during storms, although this flow generally is funneled into a channel which leads to the lagoon mouth.
A. Areal Extent of Toxic Hot Spot
Sediment contamination clearly exists throughout Mugu Lagoon and within the Calleguas Creek Tidal Prism. Problems appear to be worst in the Western Arm of Mugu Lagoon, particularly near the Rio de Santa Clara, which drains neighboring agricultural lands, and parts of the Eastern Arm. Although sediment contamination problems occur in the Main Lagoon, it appears that the large volume of this water body and good flushing is helping to keep contamination and associated effects at a lower level than might otherwise be expected. It is estimated that approximately 20% of the Western Arm and approximately 10% of the Eastern Arm of Mugu Lagoon contain contaminated sediments. The total volume of contaminated sediments is estimated to be approximately
725,000 cubic yards (based on approximately 150 acres with 3-foot depth of contamination).
Twenty-two miles of Calleguas Creek are listed as impaired due to high sediment concentrations of pesticides and accumulation in fish and shellfish. However, the area with the greatest contamination problem is estimated to cover approximately 3 miles. The total volume of contaminated sediments is estimated to be approximately 50,000 to 100,000 cubic yards.
In samples collected for the Bay Protection and Toxic Cleanup Program on February 6, 1997, sediment concentrations at stations 48013.0, 48014.0, 48015.0, 48016.0, 48017.0 and 48018.0 exceeded the ERM Thresholds for p,p’-DDE and Total DDT. Station 44054.0 also exceeded the p,p’-DDE threshold on June 19, 1996. No sediment chemistry data were collected during sediment toxicity screening surveys conducted on January 12, 1993 and April 14, 1994.
Amphipod toxicity with whole sediment was observed at stations 44016.0, 44050.0, 44051.0, 44052.0, 44053.0 and 44054.0 on January 15, 1993. Amphipod toxicity was observed at stations 44053.0 and 44054.0 on April 18, 1994, and station 48015.0 on
Figure 10: Areal extent of toxic hot spot within Mugu Lagoon/Calleguas Creek Tidal Prism.
February 10, 1997. A degraded benthic community was found at all of the stations analyzed (48013.0, 48014.0, 48015.0, 48016.0, 48017.0 and 48018.0) on February 10, 1997.
Fish were collected from Mugu Lagoon for bioaccumulation analyses. Shiner surfperch exceeded the EPA guidelines for total PCB, but not for total DDT. Topsmelt did not exceed the EPA screening guidelines for total DDT or total PCB.
Mugu Lagoon BPTCP Stations With Sediment Chemistry Concentrations Exceeding ERM Threshold
BPTCP Station Sampling Date p,p’- DDE (ppb) Total DDT (ppb)44054.0 6/19/96 30.548013.0 2/6/97 44.7 64.748014.0 2/6/97 68.1 103.448015.0 2/6/97 131.0 255.148016.0 2/6/97 112.0 166.748017.0 2/6/97 165.0 276.848018.0 2/6/97 129.0 232.6
B. Sources of Pollutants
Pesticides are of concern in Mugu Lagoon at the mouth of the Calleguas Creek watershed. The primary source of pesticides probably is agricultural runoff, both during dry weather and wet weather. Water-soluble pesticides currently in use, such as diazinon and chlorpyrifos, may be occurring in sediment porewater at high enough concentrations to be causing observed porewater toxicity. These pesticides are likely involved with observed upstream ambient toxicity. Historical discharges of pesticides, such as DDT, PCBs, toxaphene, chlordane and others, probably has contributed to the existing sediment contamination problem. Erosion from unlined channels in the watershed and from agricultural lands probably contributes to the excessive sediment loading in Mugu Lagoon. Metals may originate from non-point source runoff during dry and wet weather conditions.
The Regional Board has issued 37 permits for discharges of wastewater from point sources into the Calleguas Creek watershed. Of the 22 permitted discharges under the NPDES program, 7 are for municipal wastewaters from publicly-owned treatment works, accounting for a combined permitted discharge of 36.7 million gallons per day (98% of the total permitted discharges). Of the remaining NPDES permits, 11 are for discharges of treated groundwater from hydrocarbon or other contamination, and 5 are general permits for discharges of either well development water or ground water from dewatered aquifers at construction sites. In
addition, 88 releases of stormwater from major municipalities, certain industrial activities and construction projects are now permitted under the Regional Board's NPDES program for storm water.
Only one landfill, the Simi Valley Landfill, is active in the watershed. Simi Valley Landfill began operating in 1970. Hazardous wastes were accepted until 1983; since that time, only Class III wastes (municipal solid waste) have been discharged at this landfill. Since operations at the landfill predate current regulations for siting waste management units, only a portion of the Simi Valley Landfill is lined in accordance with current regulations. Leaks from unlined portions of the landfill have contaminated ground water in an underlying sandstone aquifer; corrective actions are underway by the operator under the direction of the Regional Board.
C. Actions by Regional Board
The Los Angeles Regional Board’s Water Quality Assessment identifies the following problems in Mugu Lagoon: aquatic life beneficial use is impaired based on water column exceedances of criteria for copper, mercury, nickel, and zinc, bird reproductivity affected (DDT), tissue accumulation (arsenic, cadmium, silver; chlordane, DDT, endosulfan, dacthal, toxaphene, PCBs); sediment concentrations (DDT, toxaphene), sediment toxicity and excessive sediment. Fish consumption beneficial use is impaired based on tissue accumulation of DDT, PCBs and toxaphene. For Calleguas Creek (Estuary to Arroyo Los Posas), the Water Quality Assessment lists the following problems: aquatic life beneficial use is impaired based on water column toxicity, sediment contamination (DDT, toxaphene), tissue bioaccumulation (chlordane, toxaphene, PCBs, DDT, dacthal, endosulfan) and sediment toxicity. Fish consumption beneficial use is impaired based on tissue bioaccumulation (DDT, toxaphene, chlordane).
The first large-scale stakeholder effort in the watershed was Mugu Lagoon Task Force, formed in September 1990. The purpose of the Task Force is to improve communication between agencies with various interests and specific projects in Ventura County that may impact water quality in Mugu Lagoon. All of the members share a common goal - to preserve and enhance Mugu Lagoon. The Task Force currently meets infrequently, since many of its members belong to the Calleguas Creek Watershed Management Committee. Active members of the Mugu Lagoon Task Force include the U.S. Army Corps of Engineers, University of California Cooperative
Extension Service Farm Advisor, Ventura County Public Works Agency, Ventura County Planning Department, California Department of Fish and Game, California Coastal Conservancy, U.S. Navy Point Mugu Naval Air Station, Ventura County Resource Conservation District, U.S. Natural Resources Conservation Service and Los Angeles Regional Water Quality Control Board.
The Los Angeles Regional Board's Watershed Management Initiative began in late 1994 with the Calleguas Creek (and Ventura River) watersheds. Through watershed management, the Regional Board expects to regulate pollutant loads from point sources through permits that better focus on issues relevant to each watershed. The Regional Board also expects that pollutant loads from nonpoint sources can be better controlled through the participation of the public in the management of their watersheds.
The Los Angeles Regional Board renewed NPDES permits for discharges within the Calleguas Creek Watershed in June 1996. However, the Regional Board was unable to fully assess cumulative impacts to beneficial uses from all pollutant sources, particularly from nonpoint sources, during the first eighteen months of application of the Watershed Management Initiative. The Regional Board was able to develop a regional monitoring program for the inland waters of the watershed which is currently being implemented and should provide additional information needed to assess cumulative impacts.
Thanks to the formation of the Calleguas Creek Watershed Management Committee in 1996, stakeholders will have the opportunity to structure and implement measures that will address pollutants from nonpoint sources through the development of a Watershed Management Plan. The Committee intends to hire a facilitator to help prepare a plan to develop a strategy for the preservation, enhancement and management of the watershed’s resources, including identification and control of sources of pollution. The Committee has outlined a three-phased plan to accomplish this goal over a 2.5 year period, beginning in January 1998. The Regional Board plans to reassess cumulative impacts to the beneficial uses of waters in the watershed by fiscal year 2002-2003. Using this information, the Regional Board is scheduled to revise NPDES permits by June 2003.
The Regional Board is working with the Naval Air Weapons Station at Point Mugu to develop a cleanup plan for contamination at this Department of Defense site. This effort still is at the stage of
characterizing historical sources of pollution and the extent of existing contamination levels. In the near future, decisions will be made concerning possible remediation and restoration activities in and around Mugu Lagoon.
D. Preliminary Assessment of Remediation Actions
Effects-based data has established that Mugu Lagoon sediment is more toxic than sediment from other lagoons in the region. Current agricultural and erosion control practices are likely moving soils heavily polluted with residuals of banned pesticides to drainages and subsequently into Mugu Lagoon.
Under the direction of the California Coastal Conservancy, Ventura County Resource Conservation District and other members of the Mugu Lagoon Task Force, the U.S. Natural Resources Conservation Service completed a report entitled: "Calleguas Creek Watershed Erosion and Sediment Control Plan for Mugu Lagoon (May 1995)". The primary focus of this study was to address erosion and sedimentation impacts and solutions for the watershed. The U.S. Environmental Protection Agency, State Water Resources Control Board and the Los Angeles Regional Water Quality Control Board recently have granted additional 319(h) funds to implement specific erosion control measures for Grimes Canyon, a critical area targeted for remediation in the plan.
Existing contaminated sediments within Mugu Lagoon and the Calleguas Creek Tidal Prism are unlikely to remediate naturally within a reasonable time frame. Removal of the contaminated sediments (i.e., dredging) or treatment appear to be the most appropriate remediation alternatives, although in situ capping might be the best solution for historical deposits, particularly within the lagoon.
E. Cost Estimate to Implement Cleanup Plan
Given the sensitive nature of Mugu Lagoon as a habitat for endangered species, the most likely remediation alternatives would be no action or in situ treatment. The no action alternative would not have a financial cost, but the contaminated sediment could remain in the environment and continue to cause problems for several more decades. In situ treatment would be very expensive and may pose technical problems for remediation in an estuarine environment. No reliable cost estimate exists at this time for this treatment method, but it would probably exceed $100 per cubic
yard. The total cost for remediation of Mugu Lagoon would be at least $72.5 million.
Dredging could be used to remove the contaminated sediments from the Calleguas Creek Tidal Prism. However, identifying a suitable and legal disposal site for contaminated sediments may be difficult. Application of this technique would cost an estimated $1 million to $5 million, based on a cost estimate of $20-100 per cubic yard (disposal costs are likely to be high, so the cost estimate probably would approach or even exceed the upper limit of the cost estimate range).
F. Estimate of Recoverable Costs From Dischargers
Contamination of the Mugu Lagoon sediments probably associated with historical use of the now-banned pesticide DDT. Although the United States Navy could be liable for any remediation activities required as a result of historical discharges of pollutants due to operations at the Naval Air Weapons Station at Point Mugu, there is no evidence that the Navy is responsible for the elevated concentrations of DDT in the sediments. It is unlikely that costs can be recovered from any other dischargers in this watershed.
G. Two-Year Expenditure Schedule
The Regional Board plans to work with the Calleguas Creek Watershed Management Committee, which already has begun development of a watershed management plan, to select the appropriate remediation alternative for Mugu Lagoon and the Calleguas Creek Tidal Prism. In addition, watershed management measures may be required to control sources of contaminants and prevent recontamination of these areas.
During Year One, the focus would be on selection of the appropriate remediation alternative for Mugu Lagoon and Calleguas Creek Tidal Prism. Additional sediment sampling may be required, particularly for Calleguas Creek Tidal Prism, to fully characterize the areal extent of the sediment contamination and prepare a plan for capping, dredging or treatment of the contaminated sediments. This sampling program probably will require approximately $100,000 - $250,000 for implementation. A source for this funding has not been determined.
During Year Two, the focus would be on implementation of the remediation alternative(s) selected for Mugu Lagoon and Calleguas Creek Tidal Prism, as well as watershed management measures to
control sources of contamination and prevent recontamination of the existing hot spots. Remediation of the Calleguas Creek Tidal Prism probably could be completed within Year Two, if funding is available. However, remediation of Mugu Lagoon could require additional time, depending upon the alternative selected. A monitoring program will be required to measure the success of the remediation plans that are implemented; although a monitoring program has not yet been designed, the estimated cost would be $50,000 - $100,000 per year, and may be required for at least three to five years following completion of the remediation activities.
H. Benefits of Remediation
Successful remediation of the contamination in Mugu Lagoon and the Calleguas Creek Tidal Prism could eliminate the source of impairment of the beneficial uses of these waters. However, watershed management efforts to control erosion probably would be required to prevent recontamination of the these areas.
I. Environmental Impacts of Remediation
If in-situ treatment is implemented, it could result in short-term impacts to the benthic infaunal community. However, this community would be expected to fully recover within 2-3 years. Any remediation activity within this sensitive watershed, particularly in Mugu Lagoon, potentially could affect endangered species, such as the peregrine falcon, least tern, light-footed clapper rail and brown pelican. Prior to initiating any remediation plan, the Regional Board will consult with the California Department of Fish and Game and the United States Fish and Wildlife Service concerning potential adverse impacts to endangered species.
With proper management of dredging and disposal of dredged material, this activity would not be expected to result in adverse environmental impacts.
Los Angeles/Long Beach HarborsThe Los Angeles and Long Beach Harbors are located in the southeastern portion of the Los Angeles Basin. Along the northern portion of San Pedro Bay, there is a natural embayment formed by a westerly extension of the coastline which contains both harbors, with the Palos Verdes Hills as the dominant onshore feature. Offshore, a generally low topographic ridge is associated with the eastern flank of the Palos Verdes uplift and adjacent Palos Verdes fault zone, and extends northwest across the San Pedro shelf nearly to the breakwater of the Los Angeles Harbor.
The port and harbor areas have been modified over the course of more than one hundred years to include construction of breakwaters, landfills, slips and wharves, along with channelization of drainages, dredging of navigation channels and reclamation of marshland. The inner harbor includes the Main Channel, the East and West Basins, and the East Channel Basin. The outer harbor is the basin area located between Terminal Island and the San Pedro and Middle Breakwaters. Los Angeles and Long Beach Harbor are considered to be a single oceanographic unit, and share a common breakwater across the mouth of San Pedro Bay. The outer harbor areas reflect the conditions of the coastal marine waters of the Southern California Bight, while the inner harbor areas typically have lower salinities.
In the presence of the strong currents and rocky habitat of the outer harbor, aquatic life communities are similar to those of the nearby coast, while the inner harbor supports biota generally found in bays and estuaries. The inner harbor has a mostly soft bottom character.
The major surface drainages in the area include the Los Angeles River, which flows in a channel and drains parts of the San Fernando Valley, as well as downtown and south Los Angeles, into eastern San Pedro Bay at Long Beach. The Dominguez Channel drains the intensely urbanized area west of the Los Angeles River into the Consolidated Slip of the Los Angeles Inner Harbor, carrying with it mostly urban runoff and non-process industrial waste discharges. A major source of both freshwater and waste in the outer harbor is secondary effluent from the Terminal Island Treatment Plant. Waste discharges to the inner harbor area of Los Angeles Harbor consist of both contact and non-contact industrial cooling wastewater and stormwater runoff. Fuel spills and oil spills from marine vessel traffic or docking facilities also contribute pollutants to the inner harbor.
Los Angeles Outer Harbor/Cabrillo PierA. Areal Extent of Toxic Hot Spot
The site's toxic hot spot status is based on several factors, including a fish advisory warning against human consumption of white croaker, which resulted from an OEHHA study released in 1991 which cited elevated DDT and PCB levels in a number of fish species caught in the area. Sediment DDT levels in some BPTCP samples collected from the site were elevated above that found elsewhere in the harbor, while sediment PCB levels were comparable to other sites. Sediment toxicity fluctuated widely. This is a heavily used sustenance and sportfishing pier (Figure 11). It is unclear whether fish caught there are contaminated from DDT found locally or from sources outside of but close to the harbor. It is estimated that 25,000 to 50,000 cubic yards of contaminated sediments exist within the Cabrillo Pier area (based on 1 to 2 foot depth of contaminants).
Based on samples collected for the BPTCP, sediment concentrations exceeded the ERM Threshold for Total DDT at every station (40010.1, 40010.2, 40010.3, 49001.0, 49002.0, 49003.0) on each occasion that sediment chemistry analyses were conducted (August 18, 1992; September 16, 1992; August 19, 1993; May 19, 1994; February 15, 1994; May 13, 1997). Sediment concentrations also exceeded the ERM for copper at station 40010.1 (Replicates 1, 2 and 3) on February 14, 1994. Amphipod toxicity with whole sediments was observed at station 40010.1 on May 28, 1993, and again at stations 40010.1, 40010.2 and 40010.3 on February 14, 1994. A degraded benthic community was observed at station 40010.2 (Replicate 2) on August 17-19, 1993.
Cabrillo Pier Area BPTCP Stations With Sediment Chemistry Concentrations Exceeding ERM Threshold
BPTCP Station Sampling Date Copper (ppm) Total DDT (ppb)40010.1 8/18/92 267.540010.2 8/18/92 207.340010.3 8/18/92 203.740010.1 9/16/92 195.640010.1 8/19/93 304.840010.2 8/19/93 204.640010.3 8/19/93 215.0
40010.1 Rep 1 2/15/94 247.0 175.040010.1 Rep 2 2/15/94 274.0 186.640010.1 Rep 3 2/15/94 273.0 174.440010.2 Rep 1 2/15/94 207.240010.2 Rep 2 2/15/94 168.840010.2 Rep 3 2/15/94 180.440010.3 Rep 1 2/15/94 171.640010.3 Rep 2 2/15/94 212.040010.3 Rep 3 2/15/94 163.2
49001.0 5/13/97 192.949002.0 5/13/97 100.049003.0 5/13/97 53.5
Fish were collected on May 12, 1997, to assess bioaccumulation of DDT and PCB. Total DDT and total PCB in white croaker muscle tissue samples exceeded EPA screening values at stations 49001.0, 49002.0 and 49003.0. Total PCB in white surfperch muscle tissue also exceeded the EPA screening value at all three stations, although total DDT concentrations fell below the EPA screening value. Clams (Macoma) collected at station 49002.0 also exceeded the EPA screening value for total PCB.
B. Sources of Pollutants
Historical discharges of DDT, PCBs and metals are the probable cause of sediment contamination in the Cabrillo Pier area. Discharge of wastewater effluent from the Terminal Island Treatment Plant is a potential source of pollutants, especially metals. Nonpoint sources of pollutants include spills from ships and industrial facilities, as well as stormwater runoff. Many areas of the port have experienced soil and/or groundwater contamination, which may result in possible transport of pollutants to the harbor’s surface waters.
C. Actions by Regional Board
The Los Angeles Regional Board’s Water Quality Assessment lists the following problems in the Cabrillo area of Los Angeles Outer Harbor: aquatic life beneficial use is impaired due to tissue accumulation (DDT), sediment toxicity, sediment contamination (PAHs, DDT, zinc, copper, chromium).
The Los Angeles Regional Board has adopted a watershed management approach, which is expected to regulate pollutant loads from point sources through permits that better focus on issues relevant to each watershed. The Regional Board also expects that pollutant loads from nonpoint sources can be better controlled through the participation of the public in the management of their watersheds. During the 2001-02 Fiscal Year, the watershed management approach will be used to renew NPDES permits within the Los Angeles/Long Beach Harbors Watershed. The Los Angeles Regional Board’s Site Cleanup Unit has developed cleanup and remediation plans for many contaminated soil and groundwater sites, including refineries and old oil fields. The Regional Board has issued waste discharge requirements for some of the boatyards and stormwater runoff sources within the port.
The Los Angeles Regional Board and the California Coastal Commission began work during fiscal year 1997-98 to prepare a long-term management plan for the dredging and disposal of contaminated sediments in the coastal waters adjacent to Los Angeles County. The goals of this plan will be to develop unified multi-agency policies for the management of contaminated dredged material, promote multi-user disposal facilities and reuse, to the extent practicable, and support efforts to control contaminants at their source using a watershed management approach.
D. Preliminary Assessment of Remediation Actions
Given the protected nature of the Cabrillo Pier area within theLos Angeles Outer Harbor, in situ capping might be a feasible method for containment of contaminated sediments. Dredging would be a proven method to remove the contaminated sediments, but identification of a suitable and legal disposal site is often a problem. Treatment of contaminated sediments may be feasible, but is likely to be expensive and difficult to accomplish with marine sediments.
E. Cost Estimate to Implement Cleanup Plan
In situ capping would probably be the least expensive remediation option. However, a stable cap must be designed to prevent reexposure of the contaminated sediments. Application of this technique to contain contaminated sediments from the Cabrillo Pier area would cost an estimated $0.5 million to $1 million, based on a cost estimate of up to $20 per cubic yard (this is a rough estimate, since the unit cost could be higher).
Dredging could be used to remove the contaminated sediments from the Cabrillo Pier area. However, identifying a suitable and legal disposal site for a large volume of contaminated sediments can be difficult. Application of this technique would cost an estimated $0.5 million to $5 million, based on a cost estimate of $20-100 per cubic yard (if a disposal site, such as a confined aquatic disposal or land disposal site, is available within or close to the Los Angeles/Long Beach Harbors complex, the cost estimate probably would approach the lower limit of the cost estimate range).
Treatment of the contaminated sediments is likely to be expensive. Application of this technique would cost an estimated $2.5 million to $50 million, based on a cost estimate of $100-$1,000 per cubic yard (due to limited experience in treating marine sediments, costs are likely to be in the upper part of the cost estimate range).
F. Estimate of Recoverable Costs from Dischargers
In July 1996, the U.S. Environmental Protection Agency decided to undertake a Superfund response (under the Comprehensive Environmental Response, Compensation and Liability Act) to address the contaminated sediment problem on the Palos Verdes Shelf. However, the Los Angeles Harbor area was not included within the scope of the Superfund action. Since it will be difficult
or impossible to prove that the contamination of the harbor is due to stormwater runoff from the Montrose Chemical Corporation’s historical manufacturing site in Torrance, which appears to be a likely source for this contamination, we do not anticipate recovering any remediation costs from dischargers.
G. Two-year Expenditure Schedule
The Regional Board plans to work with the Los Angeles Basin Contaminated Sediments Task Force to select a remediation alternative and implement the cleanup plan for the Cabrillo Pier hot spot. Additional sediment sampling will be required to better define the areal extent of the sediment contamination, prior to selection of an appropriate remediation alternative. This sampling program could be conducted during Year One, if funding becomes available (estimated cost approximately $250,000 - $500,000). However, the Regional Board would recommend implementing the cleanup of the Consolidated Slip/Dominguez Channel hot spot prior to initiating any remediation activities at the Cabrillo Pier site, since the Consolidated Slip/Dominguez Channel area may represent a source of contamination to the Cabrillo Pier area. A monitoring program would be required upon completion of any remediation activities; it is estimated that monitoring would cost $50,000 to $100,000 per year, and may be required for three to five years.
H. Benefits of Remediation
Remediation of the contamination would eliminate the immediate source of impairment of beneficial uses of the receiving waters. However, recontamination from other areas of the harbor could occur.
I. Environmental Impacts of Remediation
If capping or dredging is implemented, it could result in short-term impacts to the benthic infaunal community. However, this community would be expected to fully recover within 2-3 years. There is potential for release of contaminants into the marine environment during dredging, but proper management of this operation should minimize this risk. Special management practices would be required for disposal of contaminated sediments to contain the material and prevent releases of contaminants to the environment.
Los Angeles Inner Harbor/Dominguez Channel, Consolidated Slip
A. Areal Extent of Toxic Hot Spot
A reservoir of polluted sediment in Consolidated Slip (moving down from Dominguez Channel) probably is continuing to contaminate a large part of Los Angeles Inner Harbor (Figure 12). It is estimated that approximately 30,000 cubic yards of contaminated sediments exist in Consolidated Slip and approximately 20,000 cubic yards in Dominguez Channel (based on 6 miles of channel contaminated to an average depth of 1 foot).
In limited sampling conducted on July 30, 1992, sediment samples from stations 40006.1 and 40006.2 exceeded ERM thresholds for zinc, total chlordane and total PCB; in addition, station 40006.1 also exceeded the ERM for mercury. Amphipod toxicity with whole sediments, as well as porewater toxicity with the abalone test, were observed at both stations. A degraded benthic community was observed at station 40006.1.
In limited sampling conducted on February 3, 1994, sediment samples from station 40006.1 (Replicates 1, 2 and 3) exceeded ERM thresholds for zinc, total chlordane, total PCB and high molecular weight PAH; in addition, Replicate 3 from this station also exceeded the ERM for mercury. Amphipod toxicity was observed in
Replicates 1 and 2 from station 40006.1. Benthic samples were not analyzed on this occasion.
A more extensive survey was conducted at several stations on July 22, 1996, including the collection of surface samples and subsurface samples. Sediment samples from stations 47001.0, 47002.0, 47003.0, 47004.0, 47005.0, 47010.0, 47007.0, 47008.0 and 47009.0 all exceeded at least one ERM threshold, and sometimes exceeded several, including those for cadmium, copper, lead, mercury, zinc, dieldrin, total PCB, low molecular weight PAH, high molecular weight PAH and total PAH. Amphipod toxicity with whole sediment was observed at stations 47001.0 (surface and depth 2), 47002.0 (surface), 47003.0 (surface and depth 2), 47004.0 (surface and depth 2), 40005.0 (surface and depth 2), 47007.0 (surface), 47008.0, 47009.0 (surface) and 47010.0 (surface). A degraded benthic community was found at stations 47002.0, 47003.0, 47009.0 and 47010.0.
When average ERM Quotient exceeds 1.00, the probability of amphipod toxicity was found to be 71% (Long et al., 1995). When average PEL Quotient exceeds 1.00, probability of significant amphipod toxicity was found to be 56% (McDonald, 1996). Consolidated Slip exceeded both of these effect thresholds at several stations (47004.0, 4006.1, 47002.0, 47009.0, 47003.0, 47008.0, 47001.0, 40006.2, 40007.0). When sediment concentrations were found to exceed 11 or more of the ERM thresholds, 85% of the samples have been found to be significantly toxic to amphipods. When sediment concentrations exceeded 21 or more of the PEL thresholds, 100% of the samples have been found to be significantly toxic to amphipods. One of the Consolidated Slip stations exceeded the ERM threshold (47004.0), but not the PEL threshold.
Consolidated Slip/Dominguez Channel BPTCP Stations With Sediment Chemistry Concentrations Exceeding ERM Threshold
BPTCP Station Sampling Date Compound Concentration40006.1 7/30/92 Mercury 0.73 ppm40006.1 7/30/92 Zinc 540 ppm40006.1 7/30/92 Total Chlordane 50.0 ppb40006.1 7/30/92 Total PCB 473.8 ppb40006.2 7/30/92 Zinc 570 ppm40006.2 7/30/92 Total Chlordane 46.0 ppb40006.2 7/30/92 Total PCB 534.5 ppb40006.1 Rep 1 2/3/94 Zinc 463 ppm40006.1 Rep 1 2/3/94 Total Chlordane 112.8 ppb40006.1 Rep 1 2/3/94 Total PCB 513.1 ppb40006.1 Rep 1 2/3/94 HMW PAH 12146 ppb40006.1 Rep 2 2/3/94 Zinc 606 ppm40006.1 Rep 2 2/3/94 Total Chlordane 83.6 ppb40006.1 Rep 2 2/3/94 Total PCB 504.5 ppb40006.1 Rep 2 2/3/94 HMW PAH 11963 ppb40006.1 Rep 3 2/3/94 Mercury 0.74 ppm40006.1 Rep 3 2/3/94 Zinc 616 ppm40006.1 Rep 3 2/3/94 Total Chlordane 58.1 ppb40006.1 Rep 3 2/3/94 Total PCB 578.6 ppb40006.1 Rep 3 2/3/94 HMW PAH 12553 ppb47001.0 Surface 7/22/96 Total PCB 981.8 ppb47001.0 Depth 2 7/22/96 Total PCB 646.2 ppb47002.0 Surface 7/22/96 Total PCB 2118.2 ppb47002.0 Depth 2 7/22/96 Total PCB 803.3 ppb47002.0 Depth 2 7/22/96 HMW PAH 10374 ppb47003.0 Surface 7/22/96 Dieldrin 10.1 ppb47003.0 Surface 7/22/96 Total PCB 1420.6 ppb47003.0 Depth 2 7/22/96 Lead 385.0 ppm47003.0 Depth 2 7/22/96 Mercury 1.57 ppm47003.0 Depth 2 7/22/96 Zinc 568 ppm47003.0 Depth 2 7/22/96 Total PCB 893.4 ppb47004.0 Surface 7/22/96 Zinc 473 ppm47004.0 Surface 7/22/96 HMW PAH 11721 ppb
47004.0 Depth 2 7/22/96 Mercury 0.78 ppm47004.0 Depth 2 7/22/96 Zinc 737 ppm47003.0 Depth 2 7/22/96 Dieldrin 33.3 ppb47004.0 Depth 2 7/22/96 Total PCB 1341.6 ppb47004.0 Depth 2 7/22/96 LMW PAH 9679 ppb
47004.0 Depth 2 7/22/96 HMW PAH 16467 ppb47005.0 Surface 7/22/96 Copper 478 ppm47005.0 Surface 7/22/96 Lead 460 ppm47005.0 Surface 7/22/96 Mercury 3.28 ppm47005.0 Surface 7/22/96 Zinc 447 ppm47005.0 Surface 7/22/96 Total PCB 1599.9 ppb47005.0 Depth 2 7/22/96 Copper 1740 ppm47005.0 Depth 2 7/22/96 Lead 542 ppm47005.0 Depth 2 7/22/96 Mercury 2.94 ppm47005.0 Depth 2 7/22/96 Zinc 700 ppm47005.0 Depth 2 7/22/96 Total PCB 525.8 ppb47005.0 Depth 3 7/22/96 Lead 1590 ppm47005.0 Depth 3 7/22/96 Mercury 1.49 ppm47005.0 Depth 3 7/22/96 Zinc 1010 ppm47010.0 Surface 7/22/96 Total PCB 361.5 ppb47007.0 Surface 7/22/96 Total PCB 246.2 ppb47008.0 7/22/96 Cadmium 14.5 ppm47008.0 7/22/96 Total PCB 942.4
B. Sources of Pollutants
Historical discharges of DDT, PCBs and metals probably caused much of the existing contamination. Current point source discharges of process water and other waste streams from refineries located along Dominguez Channel may be contributing to the contamination problem. Numerous nonpoint sources, such as spills, vessel discharges, leaching of pollutants from boat anti-fouling paints, and storm drains, also are present in the area.
C. Actions by Regional Board
The Los Angeles Regional Board’s Water Quality Assessment lists the following problems in Dominguez Channel: aquatic life beneficial use is impaired due to sediment contamination (chromium, zinc, DDT, PAHs) and benthic community impairment. The Water Quality Assessment identifies the following problems in Consolidated Slip: aquatic life beneficial use is impaired due to tissue accumulation (DDT, chlordane, PCBs, tributyltin, zinc), sediment toxicity, benthic community effects, sediment contamination (PAHs, zinc, chromium, lead, DDT, chlordane, PCBs); fish consumption advisory.
The Los Angeles Regional Board’s Site Cleanup Unit has developed cleanup and remediation plans for many contaminated soil and groundwater sites, including refineries and old oil fields. The Regional Board has issued waste discharge requirements for some of the boatyards and stormwater runoff sources within the port.
The Los Angeles Regional Board has adopted a watershed management approach, which is expected to regulate pollutant loads from point sources through permits that better focus on issues relevant to each watershed. The Regional Board also expects that pollutant loads from nonpoint sources can be better controlled through the participation of the public in the management of their watersheds. During the 2001-02 Fiscal Year, the watershed management approach will be used to renew NPDES permits within the Los Angeles/Long Beach Harbors Watershed and the Dominguez Channel Watershed.
The Los Angeles Regional Board and the California Coastal Commission began work during fiscal year 1997-98 to prepare a long-term management plan for the dredging and disposal of contaminated sediments in the coastal waters adjacent to Los Angeles County. The goals of this plan will be to develop unified multi-agency policies for the management of contaminated dredged material, promote multi-user disposal facilities and reuse, to the extent practicable, and support efforts to control contaminants at their source using a watershed management approach.
D. Preliminary Assessment of Remediation Actions
Dredging would be a proven method to remove the contaminated sediments, but identification of a suitable and legal disposal site
often can be a problem. Treatment of contaminated sediments may be feasible, but is likely to be expensive and difficult to accomplish with marine sediments. In situ capping is not likely to be chosen as an alternative, due to the high flows that can occur in this area and the potential for reexposure and transport of contaminated material.
E. Cost Estimate to Implement Cleanup Plan
Dredging could be used to remove the contaminated sediments from the Dominguez Channel/Consolidated Slip area. However, identifying a suitable and legal disposal site for a large volume of contaminated sediments can be difficult. Application of this technique would cost an estimated $1 million to $5 million, based on a cost estimate of $20-100 per cubic yard (if a disposal site, such as a confined aquatic disposal or land disposal site, is available within or close to the Los Angeles/Long Beach Harbors complex, the cost estimate probably would approach the lower limit of the cost estimate range).
Treatment of the contaminated sediments is likely to be expensive. Application of this technique would cost an estimated $5 million to $50 million, based on a cost estimate of $100-$1,000 per cubic yard (due to limited experience in treating marine sediments, costs are likely to be in the upper part of the cost estimate range).
F. Estimate of Recoverable Costs from Dischargers
No responsible parties have been identified from which costs could be recovered.
G. Two-year Expenditure Schedule
The Regional Board plans to work with the Los Angeles Basin Contaminated Sediments Task Force to select a remediation alternative and implement the cleanup plan for the Consolidated Slip/Dominguez Channel hot spot. Additional sediment sampling will be required to precisely define the areal extent of the sediment contamination, prior to selection of an appropriate remediation alternative. This sampling program could be conducted during Year One, if funding becomes available (estimated cost approximately $250,000 - $500,000). If dredging is selected as the desired remediation method, the Regional Board will work with the Task Force to identify a suitable disposal alternative (e.g., constructed fill site, confined aquatic disposal site). A monitoring program would be required upon completion of any remediation activities; it is estimated that monitoring would cost $50,000 to $100,000 per year, and may be required for three to five years.
H. Benefits of Remediation
Remediation of the contamination would eliminate the immediate source of impairment of beneficial uses of the receiving waters. However, recontamination of the site from other areas is possible.
I. Environmental Impacts of Remediation
If capping or dredging is implemented, it could result in short-term impacts to the benthic infaunal community. However, this community would be expected to fully recover within 2-3 years. There is potential for release of contaminants into the marine environment during dredging, but proper management of this operation should minimize this risk. Special management practices would be required for disposal of contaminated sediments to contain the material and prevent releases of contaminants to the environment.
Future NeedsAdditional monitoring should be conducted at sites of concern to determine whether such sites meet the criteria for designation as candidate toxic hot spots in the future. Monitoring of candidate toxic hot spots also will be required to determine whether remediation efforts are successful in eliminating the hot spots or whether conditions improve without any directed remediation efforts.
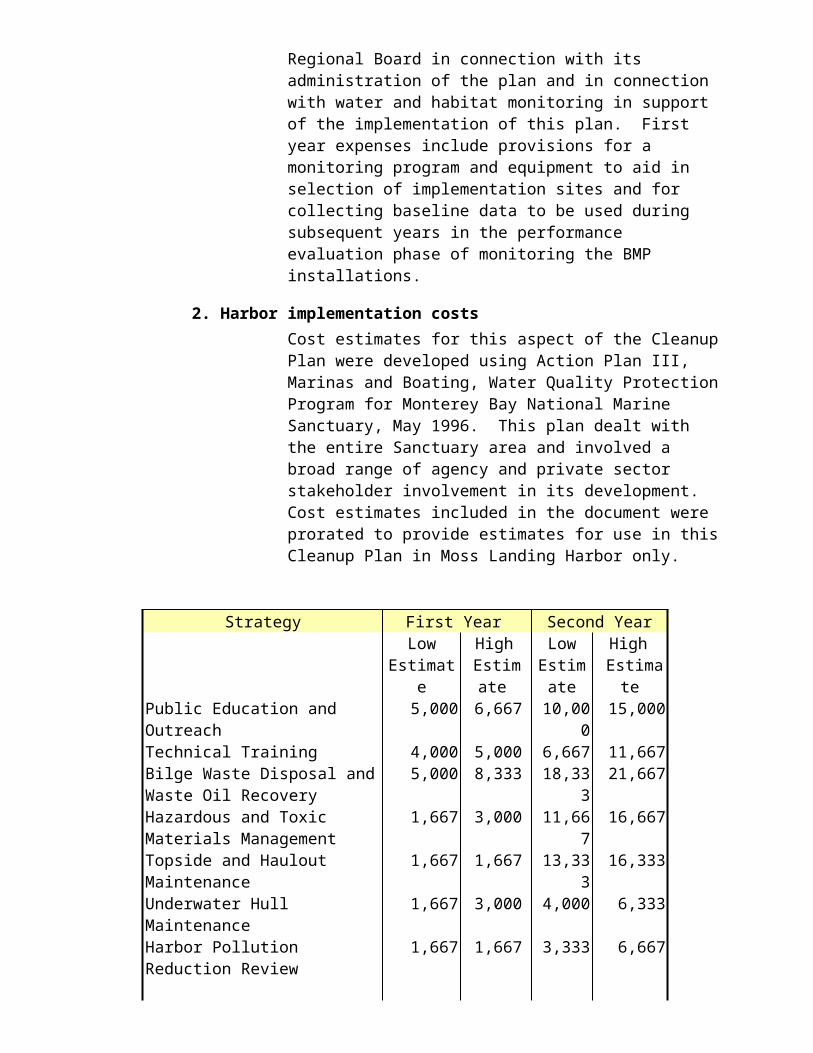
Sites of Concern (Sites that do not qualify as Candidate Toxic Hot Spots)
Water body name
Segment Name Site Identification Reason for Listing Pollutants present at the site Report reference
Los Angeles Inner Harbor
Inner Fish Harbor
44019.0, 40019.2, 40019.3 sediment concentrations; sediment toxicity
DDT, PCB, metals (Cu, Hg, Zn) [1]
Los Angeles Inner Harbor
Kaiser International
49004.0 sediment concentrations DDT, PCB, PAH, Cu, Endosulfan
[1]
Los Angeles Inner Harbor
Hugo Neu Proler
46001.0, 46002.0 sediment concentrations PCB [1]
Los Angeles Inner Harbor
Southwest Slip 40001.2, 40001.3 sediment concentrations; sediment toxicity
DDT, PCB, PAH, metals (Hg, Cr), Benz[a]anthracene, Benzo[a]pyrene, Dibenz[a,h]anthracene
[1]
Long Beach Inner Harbor
Cerritos Channel
44011.0 sediment concentrations; sediment toxicity; accumulation in mussel tissue
DDT, PCB, metals, Chlordane, TBT
[1], [2]
Colorado Lagoon
44017.0 sediment concentrations; sediment toxicity; accumulation in mussel and fish tissue
DDT, PCB, metals (Pb, Zn), Chlordane, Dieldrin
[1], [2], [3] DFG
Shoreline Marina
44020.0, 48006.0, 48008.0 sediment concentrations; sediment toxicity
Zn, DDT, PCB, Chlordane, Phenanthrene
[1], [3]
McGrath Lake 44024.0, 44027.0 sediment concentrations; sediment toxicity
DDT, Chlordane, Dieldrin, Toxaphene, Endosulfan
[1]

Sites of Concern (Sites that do not qualify as Candidate Toxic Hot Spots)Water body name
Segment Name
Site Identification Reason for Listing Pollutants present at the site Report reference
Port Hueneme 44012.0, 44013.0 sediment concentrations; sediment toxicity; accumulation in mussel tissue;
DDT, PCB, PAH, metals (Zn, Cr), Benz[a]anthracene; Benzo[a]pyrene; Dibenz[a,h] anthracene
[1], [2]
Long Beach Outer Harbor
44018.1, 44018.2, 44018.3, 44020.1, 44020.2, 44020.3
sediment concentrations; sediment toxicity
DDT, Chlordane [1]
Long Beach Inner Harbor
West Basin 40009.0, 40009.1, 40009.2, 40009.3
sediment concentrations; sediment toxicity; accumulation in clam tissue
DDT, PCB [1]
Alamitos Bay 40021.1, 40021.2, 40021.3, 40022.1, 40022.2, 40022.3, 40023.1, 40023.2, 40023.3
sediment concentrations DDT, Chlordane [1]
King Harbor 48011.0 sediment concentrations; sediment toxicity
DDT, PCB [1]
Channel Islands Harbor
44023.0 sediment concentrations; sediment toxicity
DDT, Ag [1]
Reference list
[1] Anderson, B. et al. 1998. Sediment chemistry, toxicity and benthic community conditions in selected water bodies of the Los Angeles Region. Final Report to State Water Resources Control Board, Bay Protection and Toxic Cleanup Program Monitoring.
[2] State Mussel Watch Program, Los Angeles Region[3] Water Quality Assessment [303(d) List], Los Angeles Region, December 1995
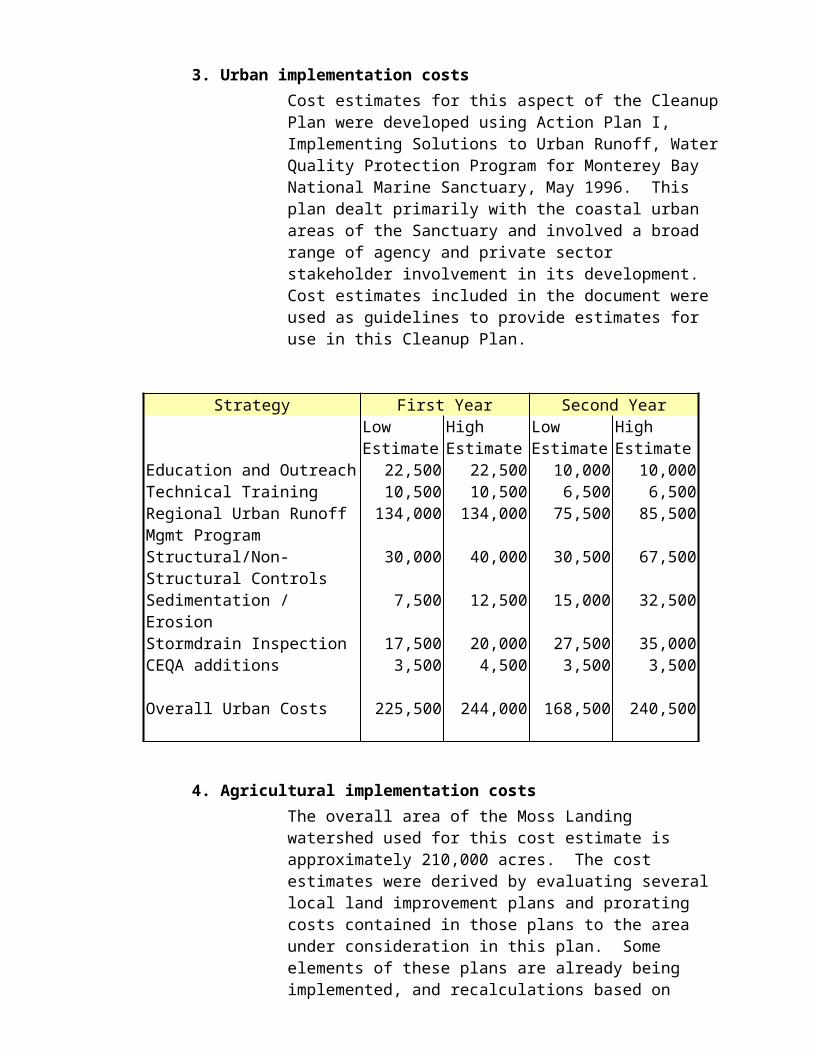
Several sites have been listed in the table above as “Sites of Concern”. These are sites that displayed signs of sediment contamination problems, primarily based upon data collected as part of the Bay Protection and Toxic Cleanup Program, but did not meet the criteria for designation as “Candidate Toxic Hot Spots”. Although designation as a “Site of Concern” does not trigger any specific action under the Bay Protection and Toxic Hot Spot Program, these sites have been identified by the Regional Board so that they can be targeted for additional monitoring as funding becomes available.
Several of the Sites of Concern could not be designated as “Candidate Toxic Hot Spots” due to the lack of recurrent toxicity; in some cases, the sites were only sampled on one occasion, while in other cases, toxicity was observed on only one of the sampling events. Inner Fish Harbor, Southwest Slip, Cerritos Channel, Colorado Lagoon, Shoreline Marina, McGrath Lake, Port Hueneme, Long Beach Outer Harbor, West Basin, King Harbor and Channel Islands Harbor all fall into this category.
Hugo Neu Proler, Kaiser International, Alamitos Bay are listed as sites of concern due to sediment contamination, but sediment toxicity was not observed on any occasion.

5
REGIONAL WATER QUALITY CONTROL BOARD, CENTRAL VALLEY REGION
REGIONAL TOXIC HOT SPOT CLEANUP PLAN
Region Description The Central Valley Region covers the entire area included in the Sacramento and San Joaquin River drainage basins. The two basins cover about one fourth of the total area of the State and include over 30% of the State's irrigable land. The Sacramento and San Joaquin Rivers furnish roughly 50% of the States water supply. Surface water from the two drainages meet and form the Delta which ultimately drains to San Francisco Bay.
The Delta, the area of primary focus for the BPTCP, is a maze of river channels and diked islands covering roughly 1,150 square miles, including 78 square miles of water area. Two major water projects located in the South Delta, the Federal Central Valley Project and the State Water Project, deliver water from the Delta to Southern California, the San Joaquin Valley, Tulare Lake Basin, the San Francisco Bay area, as well as within the Delta boundaries. The legal boundary of the Delta is described in Section 12220 of the Water Code.
Candidate Toxic Hot Spot List
Water body Name
Segment Name
Site Identification Reason for Listing
Pollutants present at the site Report reference
Delta Estuary All Delta Aquatic Life Diazinon7, 8, 10,12, 13, 17
Delta Estuary Various Morrison Ck, Mosher, 5-Mile, Mormon Sls, & Calaveras R.
Aquatic Life Diazinon & Chlorpyrifos2, 3, 4
Delta Estuary Various Ulatis Ck, Paradise Cut, French Camp & Duck Sls
Aquatic Life Chlorpyrifos5, 6
Delta Estuary All Delta Human Health Mercury9, 14, 18
Delta Estuary South Delta San Joaquin River at City of Stockton
Water Quality Objective
Low Dissolved Oxygen1, 11, 19
Delta Estuary Various Smith Canal, Mosher & 5-Mile Sloughs and Calaveras R.
Water Quality Objective
Low Dissolved Oxygen15
Delta Estuary All Delta Human Health Chlordane, Dieldrin, Total DDT, PCBs, Endosulfan & Toxaphene
16
Delta Estuary All Delta Aquatic Life Chlordane, Dieldrin, Lindane, Heptachlor, Total PCBs, PAHs, DDT
16
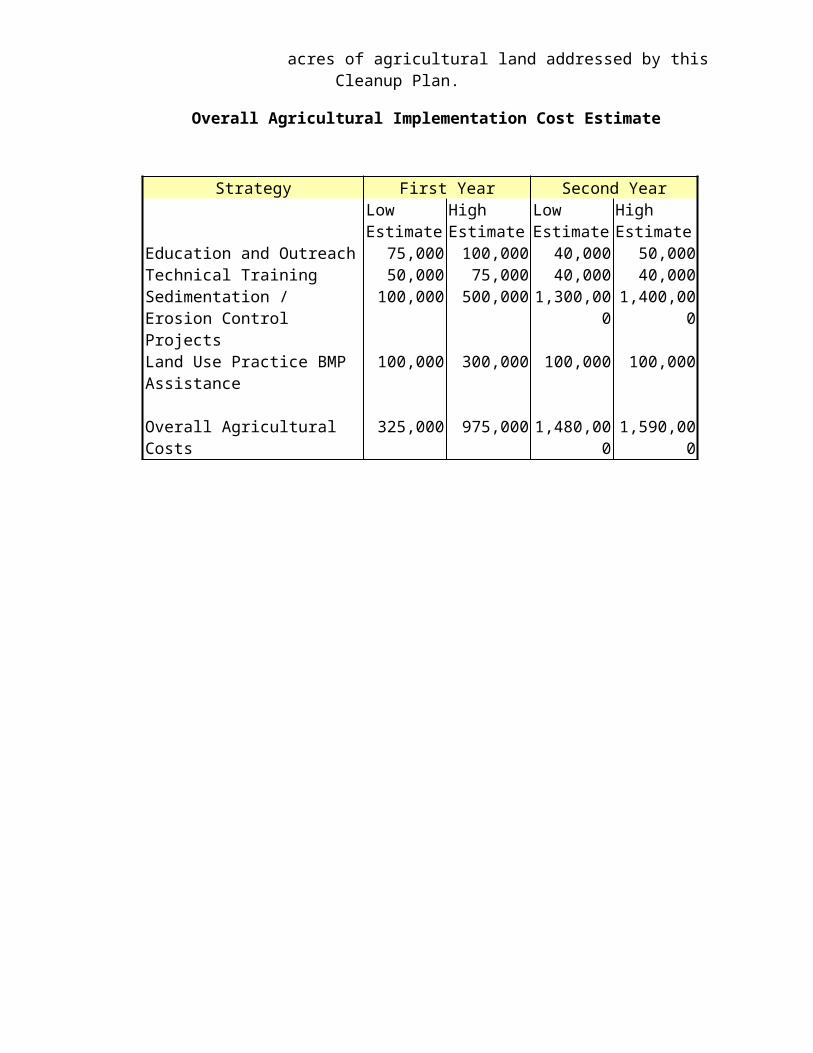
ReferencesChen, C. and W. Tsai, 1997. Evaluation of alternatives to meet the dissolved oxygen objectives of the lower San Joaquin River. Prepared for SWRCB by Systech Engineering Inc. San Ramon, Ca.
Connor, V. 1994. Toxicity and diazinon levels associated with urban storm runoff. Staff memorandum, Central Valley Regional Water Quality Control Board, Sacramento, CA
Connor, V. 1995a. Status of urban storm runoff project. Staff memorandum, Central Valley Regional Water Quality Control Board, Sacramento, CA
Connor, v. 1996. Chlorpyrifos in urban storm runoff. Staff memorandum, Central Valley Regional Water Quality Control Board, Sacramento, CA
Deanovic, L. H. Bailey, T.W. Shed and D. Hinton. 1996. Sacramento-San Joaquin Delta Bioassay monitoring report. 1993-94. First annual report to the Central Valley Regional Water Quality Control Board.
Deanovic, L. H. Bailey, T.W. Shed and D. Hinton. 1998. Sacramento-San Joaquin Delta Bioassay monitoring report. 1994-95. Second annual report to the Central Valley Regional Water Quality Control Board.
Foe, C. and R. Sheipline 1993. Pesticides in surface water from application on orchards and alfalfa during the winter and spring of 1991-92. Staff report, Central Valley Regional Water Quality Control Board, Sacramento, CA
Foe, C. 1995. Insecticide concentrations and invertebrate bioassay mortality in Agricultural return water from the San Joaquin Basin. Staff report, Central Valley Regional Water Quality Control Board, Sacramento, CA
Foe, C. and W. Croyle. 1998. Mercury concentrations and loads from the Sacramento River and Cache Creek to the Sacramento-San Joaquin Delta Estuary. Central Valley Regional Water Quality Control Board staff report. Sacramento Office.
Foe, C., L. Deanovic and D. Hinton 1998. Toxicity Identification Evaluations of Orchard Dormant Spray Storm Runoff. Central Valley Regional Water Quality Control Board Staff Report, Sacramento Office.
Jones and Stokes Associates. 1998. Potential Solutions for Achieving the San Joaquin River Dissolved Oxygen Objective. Report prepared for De Cuir and Somach and the City of Stockton. Jones and Stokes Associates, 2600 V Street, Suite 100, Sacramento, CA 95818.
Kratzer, C. 1977. Transport of diazinon in the San Joaquin River Basin, California. U.S. Geological Survey open file report 97-411. Sacramento 22p.
Kuivila, K and C. Foe. 1995. Concentration, transport and biological impact of dormant spray insecticides in the San Francisco Estuary, California. Env. Toxicol. and Chem. 14:1141-1150
Larry Walker and Associates, 1997. Sacramento River mercury control planning project. Prepared for the Sacramento Regional County Sanitation District.
Larson, K.K. Cortright, V. Connor, P. Young, L. Deanovic and D. Hinton. 1998. Stockton fish kills associated with urban storm runoff: the role of low dissolved oxygen. University of California Report prepared for the Central Valley Regional Water Quality Control Board.
Montoya, B. 1991. An analysis of the toxic water quality impairments in the Sacramento-San Joaquin Delta Estuary. Staff report, Central Valley Regional Water Quality Control Board, Sacramento, CA
Novartis Crop Protection, 1997. An ecological risk assessment of diazinon in the Sacramento and San Joaquin River Basins. Technical report 11/07 Environmental and Public affairs department Greensboro, NC
San Francisco Bay Regional Water Quality Control Board, 1995. Contaminant levels in fish tissue from San Francisco Bay. Staff report prepared jointly by the San Francisco Regional Board, the State Water Resources Control Board, and the Department of Fish and Game.
Schantz, R. and C. Chen, 1993. City of Stockton water quality model: Volume I. Model development and calibration. Prepared by Phillip Williams and Associates, San Francisco, CA.
Ranking Matrix
Water body Name Site Identification Human
Health Impacts
Aquatic Life
Impacts
Water Quality
Objectives
Areal Extent
Remediation Potential
OverallRank
Delta Estuary Delta High >10 acres High High 1
Delta Estuary Morrison Ck, Mosher, 5-Mile, Mormon Sls & Calaveras R.
High >10 acres High High 1
Delta Estuary Ulatis Ck, Paradise Cut, French Camp & Duck Sls
High >10 acres High High1
Delta Estuary Delta, Cache Creek High >10 acres High High
Delta Estuary San Joaquin River @ City of Stockton
High >10 acres High High
Delta Estuary Smith Canal, Mosher & 5-Mile Sloughs and Calaveras R.
High Moderate >10 acres High Moderate 2
Delta Estuary Delta Moderate >10 acres Moderate Moderate
Delta Estuary Delta Moderate >10 acres Moderate Moderate
1/ No cleanup plan provided as the Regional Board directed staff to seek site specific variance for pesticides.2/ Sites ranked as moderate because of the lower importance of the water bodies involved.
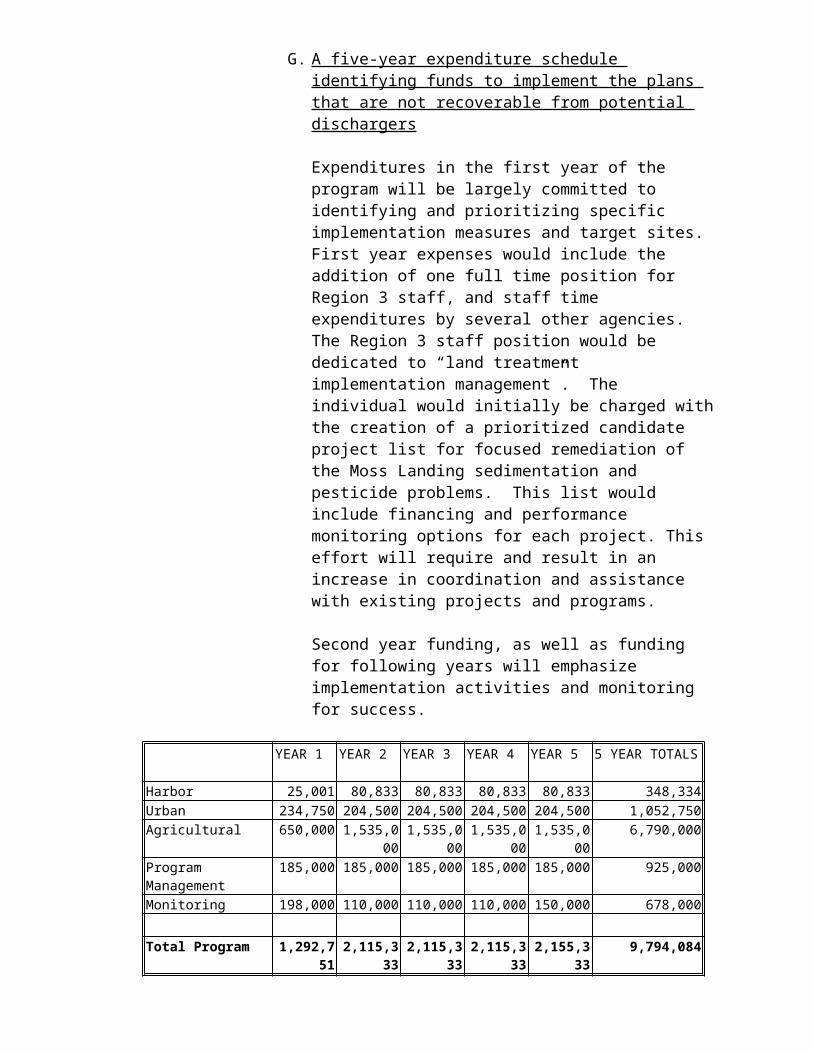
High Priority Candidate Toxic Hot Spot Characterization
Mercury Clean up Plan
Background Mercury has been identified in part II of the cleanup plan as responsible for creating a candidate BPTCP hot spot in the Sacramento-San Joaquin Delta Estuary. In January 1998 the Central Valley Regional Water Quality Control Board adopted a revised 303(d) list, ranked mercury impairments in the lower Sacramento River, Cache Creek, Sulfur Creek , Lake Berryessa, Clear Lake and the Sacramento-San Joaquin Delta Estuary as high priority because of elevated concentrations in fish tissue and committed to the development of a load reduction program by the year 20051. The widespread distribution of mercury contamination emphasizes the regional nature of the problem and the need for regional solutions.
Mercury is a potent human neurotoxin with developing fetuses and small children being most at risk. The principal route of human exposure is through consumption of mercury contaminated fish. In 1970 a human health advisory was issued for the Sacramento-San Joaquin Delta Estuary advising pregnant women not to consume striped bass. In 1994 an interim health advisory was issued by the Office of Environmental Health Hazard Assessment (OEHHA) for San Francisco Bay and the Delta recommending no consumption of large striped bass and shark because of elevated mercury and PCB concentrations.
Factors which promote excess mercury in fish tissue are not well understood. To a large extent this is because until very recently there was no methodology to measure mercury at environmental concentrations (part per trillion) in surface water. However, it is generally agreed that mercury biomagnifies in the aquatic food chain with fish in California often having a million times more mercury, on a weight basis, than ambient water. Methyl mercury is the most toxic form of mercury and the primary form accumulating in the aquatic food chain. Over ninety percent of the mercury in fish tissue is usually in the form of neurotoxic methyl mercury. Conversion of inorganic to organic mercury appears to be controlled primarily by microorganisms, mostly sulfate reducing bacteria in sediment. Important factors in other systems which appear to control the conversion rate of inorganic to organic
1The lower American River, lower Feather River, Harley Gulch, Sacramento Slough, March Creek and Reservoir, San Carlos Creek, James Creek, and Panoche Creeks were also placed on the 303(d) list as impaired because of excess mercury but were given a lower priority for cleanup.
8
mercury include temperature, percent organic matter, redox potential, salinity, pH and mercury concentration (Gilmour, 1994). Neither the primary locations of methyl mercury production nor the principal factors controlling methylation are yet known for any location in the Central Valley.
In California mercury was historically mined in the Coast Range both north and south of San Francisco Bay and transported across the Valley for use in placer gold mining in the Sierra Nevadas. Both operations caused widespread mercury sediment contamination in water courses in the Coast Range, Sierra Nevada Mountains, Valley floor, and Sacramento-San Joaquin Delta Estuary.
The limited mercury work undertaken so far in the Central Valley has concentrated on estimating mercury loads to the Estuary and on determining in situ mercury bioavailability in valley waterways. A loading study conducted by Larry Walker and Associates (1997) estimated that 640 kg of mercury were exported by the Sacramento watershed to the Estuary between October 1994 and September 1995. Most of the material was contributed during winter high flow periods. Surprisingly, the Feather and American River watersheds, sites of intensive historical placer gold mining activity, only accounted for about 25 percent of the total load. The majority of mercury appeared to originate from the Sacramento watershed above the confluence of the Feather River. The Sacramento Regional Wastewater Treatment Plant, the largest NPDES discharger in the Region, accounted for less than 2 percent of the total load.
In a companion study mercury concentration in aquatic invertebrates and fish in the historic gold mining region of the Sierra Nevada Mountains was evaluated (Slotton et al., 1997a). Concentrations of mercury in aquatic indicator organisms increased in a predictable fashion with increasing trophic feeding level. A clear signature of mine derived mercury was found associated with the most intensively worked river stretches. Mercury concentrations were lower in non-hydrologically mined reaches of the Feather and American Rivers.
Foothill reservoirs were found to operate as traps for both bioavailable and sediment associated inorganic mercury (Slotton et al., 1997a; Larry Walker and Associates, 1997). Significantly lower levels of mercury were found in aquatic organisms below reservoirs as compared to concentrations both in and above them. Similarly, bulk loads of mercury entering foothill reservoirs were greater than the amount exported. This suggests that foothill reservoirs in placer gold mining districts may act as interceptors of mercury, trapping and preventing downstream transport to the
9

Estuary. This may explain the lower than expected loads measured by Larry Walker and Associates (1997) in the Feather and American Rivers.
Between 1993 and 1995 the Central Valley Regional Board also conducted a bulk mercury loading study to the Estuary from the Sacramento watershed. The study differed from that of Larry Walker and Associates (1997) in that the Regional Board study also included an assessment of loads from the Yolo Bypass during high flows. During flood conditions the Bypass receives overflow from the Sacramento River and significant input from several coastal watersheds.
The Regional Board estimated that the Sacramento Watershed (Sacramento River at Greene’s Landing plus Yolo Bypass at Prospect Slough) exported 800 kg of mercury to the Estuary between May 1994 and April 1995 (Foe and Croyle, 1998). Staff found, like Larry Walker and Associates, that most of the mercury was transported into the Estuary during high flow periods. High mercury concentrations in the Yolo Bypass suggested possible local inputs. Follow up studies demonstrated that Cache Creek was exporting about 1,000 kg of mercury during the year. Half of the mercury appeared to be trapped by the Cache Creek Settling Basin at the confluence with the Bypass while the remainder was exported to the Estuary.
In the spring of 1996 a one time benthic invertebrate survey was conducted in the upper Cache Creek basin to determine local mercury bioavailability (Slotton et al., 1997b). All invertebrate tissue samples with mercury concentrations greater than background were associated with known mercury mines or geothermal hot springs. These included Sulfur and Davis Creeks, Harley Gulch, and the discharge from Clear Lake. The highly localized nature of these sites was demonstrated by the lower biotic tissue concentrations in adjacent streams without historic mercury mining activity. Invertebrates collected in the upper mainstem of Cache Creek away fro all historic mining activity had tissue concentrations comparable to similar indicator organisms obtained from mainstem Sierra Nevada River gold mining activity that Coast range mercury is at least as bioavailable as that in the Sierras. However, tissue concentrations in Cache Creek decreased downstream suggesting that much of the large bulk loads of mercury observed by the Regional Board might not be very biologically available in the lower watershed.
Limited fish tissue sampling has occurred in Cache Creek. Most sampling has been conducted in the lower watershed between Woodland and the Settling Basin. Mean mercury concentrations in fish of a size eaten by people ranged between 0.2 and 0.4 ppm for
10

benthic predators (channel and white catfish) and between 0.4 and 0.9 ppm composite fillet wet weight for water column predators (squawfish, crappie, small and large mouth bass, Davis, 1998; Slotton et al., 1997b). Concentrations in small fish (2-4 inches) suitable for consumption by wildlife ranged between 0.1 and 0.3 ppm whole body wet weight. Sufficient data have not yet been collected to warrant evaluating the Cache Creek watershed for a possible human health fish consumption advisory.
Estuarine bioavailability of Cache Creek mercury is not known. However, the Creek serves as the major water source for the recently created Yolo Wildlife Refuge. In addition, the CALFED Bay Delta Program is proposing to purchase large areas downstream in the Yolo Bypass and further out in the Estuary for conversion to shallow water wildlife habitat. Follow up studies are needed to ascertain the methylation potential of mercury at such sites and also to compare the methylation potential of mercury from sources in the Coast Range to that from the Sierra Nevada Mountains.
A. Areal Extent
There is a human health advisory in effect in the Delta and in San Francisco Bay because of elevated mercury levels in striped bass and other long lived fish. The entire area of the Delta is therefore considered a hot spot. The Delta is a maze of river channels and diked islands covering roughly 78 square miles of open water and about 1,000 linear miles of channel.
Cache Creek is a 1100 square mile watershed in the Coast Range with about 150 linear miles of mercury impacted waterways. The watershed also contains Clear Lake, the largest natural lake in California at 43,000 acres. A human health advisory has been posted in Clear Lake because of elevated mercury concentrations in fish tissue. The source of the mercury is Sulphur Bank Mine, a U.S. EPA Superfund site.
B. Sources
Four major bulk sources of mercury have been identified for the Sacramento-San Joaquin Delta Estuary. They are: (1) exports from the placer gold mining regions of the Sierra Nevada Mountains, (2) mercury mining in the Coast Range, (3) resuspension of estuarine sediment, and (4) effluent from municipal and industrial discharges to surface water. Not known, but critically important, is the relative methylation potential of mercury from each source once in the estuary. The four sources are briefly reviewed below.
11
1. Sierra Nevada Mountains It has been estimated that over 3 million kg of mercury were lost in the Sierra Nevada Mountains during the gold rush (Montoya, 1987). All this mercury was initially in an elemental form (quicksilver) and most of it is probably still highly oxidized. Foothill reservoirs appear to trap most of the bioavailable and total mercury entering them. Therefore, only the mercury presently located in water courses below the foothill reservoirs appear available for transport into the estuary, unless major flooding events move large volumes of sediment downstream from behind reservoirs. This needs evaluation.
2. Coast Range Some of the largest historic mercury mines in the world were located in the Coast Range both north and south of San Francisco Bay. Most of the mercury in the Coast Range is as mercuric sulfide (cinnabar) and is probably emanating from abandoned mine portals and deposits around retorts and slag piles, geothermal springs and seeps, and erosion of mercury rich landforms. The Coast Range is drier than the Sierra Nevada Mountains and therefore has fewer reservoirs and permanently flowing waterways. Off site movement of mercury from the Coast Range appears to occur mostly in the winter after large rainstorms although evidence from Clear Lake indicates it may be occurring year-round. Cache Creek has been identified as a major source of mercury to the Estuary. Sites in the Cache Creek watershed with highly bioavailable loads include runoff from Sulfur Creek, Harley Gulch, Schneider Creek and Clear Lake.
3. Sediment Potentially the largest source of mercury is already present in the Estuary buried in sediment. Mercury from sediment is potentially available through natural fluxing, bioturbation, scour and erosion from wave action, dewatering and beneficial reuse of dredge spoils on levees, and creation of intertidal shallow water habitats by breaking levees and reflooding Delta agricultural land. Potential bioavailability of mercury from each action depends on, among other things, the chemical form of the metal in sediment and environmental conditions in the Estuary which influence biological processes at the time of release to the food chain.
Municipal and Industrial Discharges Undoubtedly, the smallest source of mercury to the Estuary is from permitted municipal and industrial discharges to surface water. Load estimates are only available for the Sacramento Regional Wastewater Treatment Plant, the largest discharger in the Central Valley. The facility was estimated to have discharged 9.9 kg of mercury during water year 1995 (Larry Walker and Associates, 1997). This represents less than 2 percent of the
12
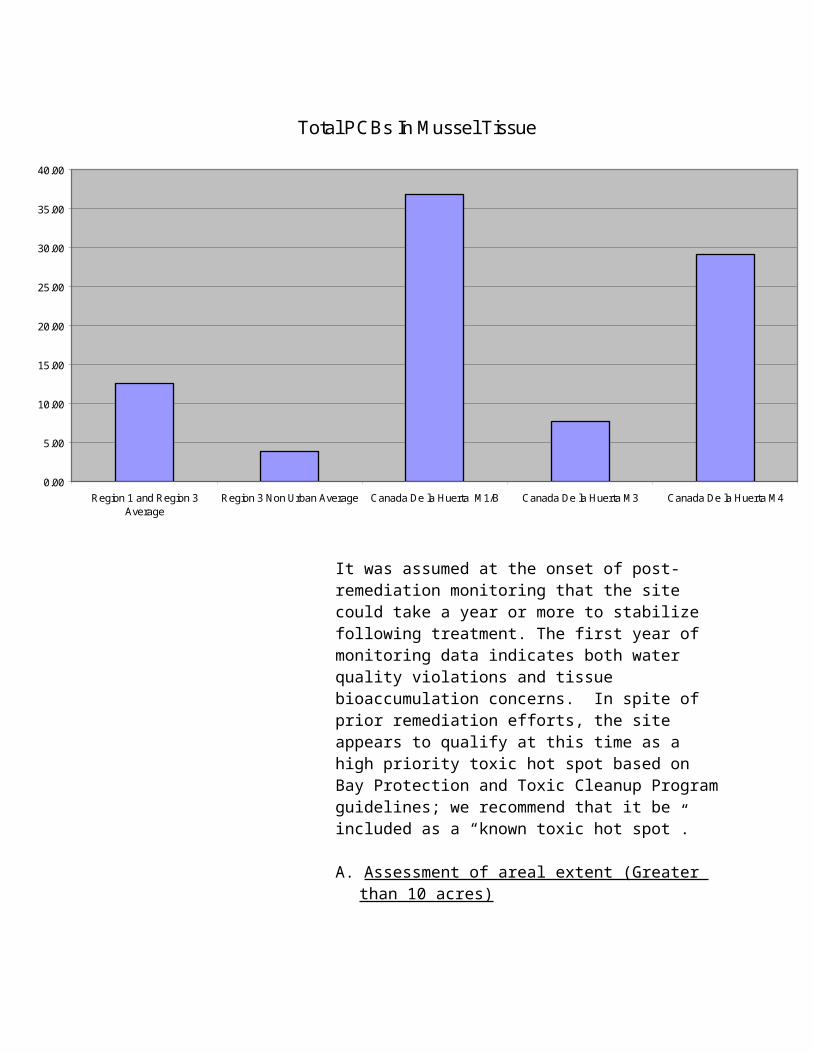
total annual load from the Sacramento Basin. More recent mercury effluent data indicates that the annual mass discharge from the Regional Plant may be as low as 2 kg/yr. This contribution represents less than one percent of the total mercury load from the Sacramento watershed at Rio Vista (personal communication, Grovhoug).
C. Summary of Actions
Three actions have been taken in the Central Valley to begin addressing the human health problems posed by mercury. Each is summarized below.
Loading studies Bulk mercury loading studies conducted by the Central Valley Board (Foe and Croyle, 1998) and by Larry Walker and Associates (1997) on the Sacramento River have determined that new loads of metal enter the estuary each year during high flows. Coast Range inputs appear more important than Sierra Nevada ones as a significant fraction of the inputs from the latter are intercepted and trapped by foothill reservoirs. Cache Creek has been identified as an important Coast Range mercury source. Other sources on the Sacramento River upstream of the confluence of the Feather River may also be important but remain unidentified.
Bioavailability Studies by Slotton et al. have determined that fish tissue concentrations can be predicted from changes in mercury concentration in invertebrate trophic levels. This relationship has been used to standardize mercury food chain bioaccumulation in the Central Valley and identify local areas where fish may or may not be present but elevated concentrations of bioavailable mercury are accumulating in the food chain. The studies have identified areas with apparent high methylation potential in the Sierra Nevadas and Coast Range. All are associated with past intensive gold, silver and mercury mining. The process has also suggested that some sites with large bulk mercury loads, such as the Cache Creek drainage, might not be as vulnerable to methyl mercury production as their loads would suggest. Similar food chain studies need to be completed for all mercury rich areas in the Central Valley.
CALFED The CALFED Water Quality Common Program has identified mercury as a contaminant of concern. The program is developing actions to attempt to reduce mercury tissue concentrations in edible fish from the Central Valley and Delta to concentrations below health advisory levels. A draft of the Water Quality Common Program is presently being circulated among the public for comment.
13
The CALFED Category III Ecosystem Restoration Program has proposed to purchase large tracts of farmland in the Estuary, break levees, and convert the fields to shallow water intertidal habitat. Newly flooded wetlands are known to have elevated rates of methyl mercury production and concern has been expressed that CALFED restoration activities might increase methyl mercury concentrations in estuarine fish. The CALFED Category III program announced in December 1997 that they would fund a grant entitled "The effects of wetland restoration on the production of methyl mercury in the San Francisco Bay Delta System" by Drs. Suchanek and Slotton. Purpose of the three year project is to quantify changes in methyl mercury production caused by restoration practices and evaluate the bioavailability and impact of the mercury on the Bay Delta Ecosystem. The ultimate intent of the Authors is to provide recommendations to managers for potentially modifying restoration approaches to minimize methyl mercury production.
D. Assessment of Actions Required
In January 1998 the Central Valley Regional Board adopted a revised 303(d) list, ranked mercury in fish tissue as a high priority impairment in several Central Valley water bodies and committed to adopting a TMDL to control mercury bioaccumulation by the year 2005. The purpose of the Bay Protection mercury clean up plan is to lay out a strategy for collecting the information needed to develop a phased TMDL with the initial emphasis in Cache Creek.
According to the U.S. EPA (1998), “the goal of a TMDL is the attainment of water quality standards. A TMDL is a written quantitative assessment of water quality problems and the contributing pollutant sources. It specifies the amount of reduction needed to meet water quality standards, allocates load reductions among sources... and provides the basis for taking actions to restore a water body”.
It will be challenging to successfully implement a TMDL for mercury in the Central Valley as there are fundamental unresolved scientific questions about mercury bioaccumulation in aquatic food chains. Principal among these is a lack of knowledge about the primary chemical forms of mercury most efficiently methylated and the locations and processes which most stimulate the conversion. Therefore, Regional Board staff propose a phased mercury TMDL. Staff propose to commence pilot mercury control work in Cache Creek, a major source of mercury to the Estuary. As the necessary scientific
14
information is obtained and success demonstrated in the control of bioavailable mercury in this watershed, then similar control efforts will be undertaken in other mercury enriched water courses and in the estuary itself. The working hypothesis for the estuary is that as all bioavailable sources of mercury to the estuary are identified and their discharge reduced to the maximum extent possible, then material already present in the system will gradually become buried and less bioavailable. The result will be a slow reduction in mercury fish tissue levels.
The U.S EPA (1998) suggests that the successful development of a TMDL requires information in six general areas: identification of a target, location of sources, quantification of the amount of reduction needed, allocation of loads among sources, an implementation plan, and monitoring and evaluation to track results and demonstrate compliance. Regional Board staff also believe that a seventh element, formation of a regional mercury taskforce, is needed to help guide the control effort. Each element, including the associated scientific uncertainties and resources needed to resolve these, is briefly described below.
1. Task force. A regional mercury control strategy task force should be formed. The Task Force should be composed of scientists, watershed stakeholder groups, and resource managers from both the Central Valley and San Francisco Bay area. The nucleus of the Task Force could be the Cache Creek Mercury Group. Purpose of the Task Force would be to advise Regional Board staff on the definition of an appropriate target, on the identification of sources and the allocation of loads, on developing the regional mercury control strategy, and as a clearing house for mercury information. Regional Board staff will take the Task Force’s recommendations and develop the mercury TMDL Basin Plan amendment. If the Task Force is unable to make recommendations in a timely fashion, the staff will develop the TMDL considering all information and advice available. Finally, the Task Force should make recommendations to the Regional Board, CALFED, and other entities on funding priorities.
2. Target. Purpose of the Cache Creek mercury TMDL is to
reduce fish tissue mercury concentrations to levels that are safe for ingestion by humans and wildlife. Several possible fish tissue mercury targets should be evaluated and one selected for incorporation into the TMDL. Possible options are the identification of a fish tissue concentration that would fully protect both wildlife and human health. An alternate target is
15
the identification of a background Cache Creek fish tissue concentration in areas of the watershed uninfluenced by mining or other anthropogenic activities which enhance mercury bioavailability.
Wildlife The U.S. Fish and Wildlife Service has identified Mergus merganser, the common merganser, as the wildlife species most likely at risk from elevated fish tissue mercury concentrations in Cache Creek (personal communication, Schwarzbach). The bird is known to breed in the Cache Creek basin and elevated mercury levels in its diet may cause reproductive impairment. Principal merganser prey items are small (3-7 inch) fish. The U.S. Fish and Wildlife Service estimate that the provisional “no and low effect dietary concentrations” for the common merganser range between 0.1 and 0.3 ppm mercury fish wet weight (personal communication, Schwarzbach). Limited data exist in the basin for mercury concentrations in small fish. Values collected in the lower basin range between 0.1 and 0.3 ppm (Davis, 1998) and in Bear Creek in late summer between 0.3 and 1.75 ppm whole body wet weight (personal communication, Schwarzbach). These values suggest that mergansers may presently experience reproductive impairment at some locations in the basin. The safe concentration estimate of 0.1 ppm wet weight is based upon a three generation mallard feeding study (Heinz, 1979). The safe value was calculated by dividing the lowest effect concentration by a factor of three. The U.S. EPA (1997) in their Report to Congress used a similar safety factor to estimate no effect concentrations. The Cache Creek wildlife target could be improved by completion of a mercury dietary study for a fish eating bird, such as a merganser, to verify the proposed no and low effect levels. The study should also evaluate seasonal changes in mercury concentrations in feathers. The risk posed by mercury to wildlife could be further strengthened by conducting an egg-feather survey in Cache Creek and elsewhere around the Estuary to ascertain how mercury concentrations in eggs and feathers of fish eating birds compare to those documented to be toxic in the merganser feeding study. Such studies are proposed in Table 1 as part of the basic scientific needs for completion of the TMDL implementation plan.
Human Health The U.S. EPA (1995) presently recommends a mercury screening value of 0.6 ppm wet weight in fish fillet to protect human health. International studies of the human health effects of mercury exposure via fish consumption are underway in the Seychelles and Faroes Islands. The reference level protective of human health may change as a result of these studies which are expected to be completed and analyzed
16
within the next several years. A better estimate of a safe mercury concentration to protect human health should be available upon completion of this work.
Limited mercury fish tissue data is available for Cache Creek. Most of the data has been collected in the lower basin between the City of Woodland and the Settling Basin. As noted previously, average mercury concentrations in predacious fish of a size consumed by people range between 0.2 and 0.9 ppm wet weight. Staff of the California Office of Environmental Health Hazard Assessment (OEHHA) have evaluated this data and concluded that, while more information is needed, some of the concentrations appear elevated for human consumption (personal communication, Brodberg).
A follow-up fish tissue study is needed. The purpose of the study is two fold. The first objective is to determine mercury concentrations in fish caught throughout the basin to better characterize the threat posed to human health and wildlife by the consumption of fish from Cache Creek. The second objective is to establish statistically reliable baseline data to evaluate the effect of mercury remediation activity in the Basin. The study should emphasize the seasonal collection of a variety of fish species at locations most likely used by people and wildlife. The study should be coordinated with OEHHA, local offices of County Public Health, Fish and Game and U.S. Fish and Wildlife Service. Resources are requested in Table 1 to collect the fish tissue data. Funds are also requested for OEHHA to help organize the study and evaluate the data.
Baseline No baseline fish tissue data is available for Cache Creek. Efforts should be undertaken to establish such data at locations in the watershed unaffected by mining activity. Possible locations for evaluation include Rayhouse, Fiske, Cole, Kelsey, Adobe, Scott and Middle Creeks. One or more of these locations should be included in the fish tissue studies described above. The data would be evaluated to ascertain whether the baseline concentrations are lower than the concentrations necessary to protect human health and wildlife. If so, the value might be considered an “anti-degradation” type of target.
3. Sources. Two mercury source studies were conducted in the Cache Creek Basin. The first was a loading study to determine the amount of total recoverable mercury exported from the watershed and the principal seasonal sources within the basin (Foe and Croyle, 1998). The second was an invertebrate bioavailability study to determine the major locations in the basin where mercury was bioaccumulating in the aquatic food
17
chain (Slotton et al., 1997b). Both are briefly reviewed below to help identify the major mercury sources needing remediation.
Loading Studies Studies conducted between 1996-98 determined that Cache Creek was a major source of estuarine mercury (Foe and Croyle, 1998). Most of the mercury appeared to be transported on sediment particles. A correlation was noted between total mercury concentration at Road 102 and flow immediately upstream at the Town of Yolo. The relationship was employed to estimate bulk mercury loads. The basin was estimated to have exported 980 kg of mercury during the wet 1995 water year. Half of the metal appears to have been trapped by the Cache Creek Settling Basin while the remainder was exported to the Estuary. In contrast, little to no mercury was predicted to be transported out of the Basin during dry years emphasizing the importance of winter runoff in the off site transport of mercury.
Seasonal studies demonstrate three general loading patterns: summer irrigation season, winter non-storm runoff periods, and winter storm runoff events. The irrigation season occurs during the six month period between April and October. Mercury transport rates in the upper basin were on the order of 10-50 g/day with most of the metal coming from Clear Lake. Probable source of the Clear Lake mercury is from the Sulfur Bank Mine, an EPA Superfund site. The winter non-storm period is the next most common event and occurs between November and March. The only observations to date have been make during wet winters. Mercury export rates were on the order of 100-1,000 g/day. Much of the mercury appears to have originated from Benmore and Grizzly Creeks which are tributaries to the North Fork of Cache Creek. Finally, storm runoff events were least common and occurred about 4-10 times per wet year. All subbasins of Cache Creek exported significant amounts of mercury but the majority of the metal appeared to come from the Cache Creek canyon between the confluence of the North and South Forks but above Bear Creek. The precise source(s) of the metal in the inaccessible canyon was not identified. Sulfur Creek and Harley Gulch, sites with extensive abandoned mining activity, also exported large amounts of mercury. Storm export rates were on the order of 5,000-100,000 g/day. Resuspension of mercury contaminated sediment appears to be a major source of mercury during all three time periods. Little dissolved and no methyl mercury data was collected. These two forms of mercury may provide a better correlation with in situ bioavailability than the bulk mercury mineral loads measured in this study.
18
Additional loading information is needed. Emphasis should be on collecting seasonal information on dissolved and methyl mercury loads at key locations throughout the basin including several background sites and all major mercury mining sources. Funding is requested for Cache Creek loading studies in Table 1.
Bioavailability studies In the spring of 1996 a one time benthic invertebrate survey was conducted in the upper Cache Creek basin to determine local mercury bioavailability (Slotton et al., 1997). Representative benthic invertebrates were collected with a kick screen, sorted to taxa, grouped according to trophic level, and analyzed for total mercury body burden. All elevated invertebrate tissue burden samples were associated with drainage from known mercury mines or geothermal hot springs. These include Sulfur and Davis Creeks, Harley Gulch, and Clear Lake. No elevated mercury signal was observed in the North Fork of Cache Creek downstream of Benmore and Grizzly Creeks suggesting that these two non-mine impacted mercury enriched drainages might not be major sources of locally bioavailable mercury. The conclusions of the bioavailability study also differ from the loading one in that Clear Lake is identified as a major source of bioavailable mercury in the upper watershed. The loading study suggested that Clear Lake was only a major source of mercury during summer and on an annual basis did not account for much of the mercury transported in the basin. The bioavailability data collected downstream of Clear Lake emphasize the need to better understand the forms and processes which mediate methyl mercury production and cycling in the Cache Creek aquatic food chain.
Additional information is needed on the correlation of mercury concentrations in water, sediment and invertebrate body burden levels. Invertebrates are emphasized as they are more ubiquitous than fish and, being closer to the bottom of the food chain, should respond more rapidly to changes in bioavailable mercury than any other life form. Also, in the Coast Range invertebrates often exhibit mercury concentrations very similar to small fish (personal communication, Slotton). More data is needed to establish the relationship between invertebrate body burden levels and mercury concentration in larger fish. Intensive seasonal monitoring of water and sediment coupled with changes in invertebrate body burden levels should be conducted at key locations in the watershed. The sediment sampling should determine flux rates of dissolved inorganic and methyl mercury from the sediment. The water, sediment
19
and invertebrate studies should be closely coordinated with the fish tissue sampling effort. The purpose is twofold. First, establish baseline seasonal invertebrate bioavailability data for the watershed so that changes in mercury cycling may be more readily determined once remediation is undertaken. Second, by intensively sampling water/sediment and invertebrates, better identify the times, locations and mercury forms most important in the formation and movement of methyl mercury up the aquatic food chain. This information will be essential to quantify the amount of load reduction needed at different sources. Funding is requested for water, sediment and invertebrate sampling in Table 1.
Site Remediation studies As noted above, Sulfur Creek, Harley Gulch, and Clear Lake have been identified as major sources of total and bioavailable mercury. All three watersheds have abandoned mercury mines. In addition, Sulfur Creek has active geothermal activity which may also contribute mercury. Site remediation feasibility studies should be undertaken in Sulfur Creek and Harley Gulch to identify the major sources of the bioavailable mercury and the most practical, cost effective control methods which will insure that the TMDL goals for the site are met. Control efforts for evaluation may include runoff and waste material isolation studies, natural revegetation, waste rock removal and infiltration evaluations.
Sulphur Bank Mine is the likely source of the mercury in Clear Lake. The mine is an active U.S. EPA Superfund site. Downstream load reduction requirements should be coordinated with the Superfund cleanup activities to ensure that the beneficial uses of both Clear Lake and the downstream watershed are protected. Funding for Cache Creek site remediation feasibility studies are requested in Table 1. No funding is suggested for Sulphur Bank Mine as the site has been selected as a U.S. EPA Superfund site and the cost of remediation will be paid for by the Federal Government.
4. Quantification of the Amount of Load Reduction Needed. The key weakness in the development of this TMDL is our present lack of understanding about the relationship between inorganic mercury concentrations in water/sediment and methyl mercury concentrations in invertebrate and fish tissue. However, it is anticipated that detailed information about mercury concentrations in the water column from upstream transport and from in situ sediment fluxing coupled with changes in invertebrate and fish tissue concentration will help establish such a relationship. This information will be used to determine how much reduction in the various forms of
20
mercury are needed downstream of each source. No implementation plan should be incorporated into the Regional Board’s Basin Plan until these relationships are established.
5. Implementation. The Regional Board committed to adoption of a mercury TMDL implementation plan by the year 2005. While discussion of the contents of the implementation plan are premature, several factors are worth noting. First, as noted throughout the discussion, the development of the plan will require significant directed research. All research results should be reviewed by the Mercury Task Force and recommendations made to Regional Board staff prior to commencing implementation. The recommendations should include an evaluation of the scientific defensibility of the research conclusions and the likelihood of success should the implementation plan be incorporated into the Basin Plan and remediation control activity undertaken. Second, the plan will include a time schedule and recommendations on how to fund implementation. This may include a discussion of developing “Pollution Trading” opportunities whereby Central Valley and Bay Area Dischargers are allowed to fund more cost effective non point source cleanup projects in Cache Creek and elsewhere in lieu of less effective abatement actions at their own facilities. Third, while the mine remediation feasibility studies have not yet been undertaken, it is likely that one of the conclusions will be that some of the principal sources of bioavailable mercury are from sites where the owners have insufficient resources to carry out the cleanup. So, in the interim, the State of California should pursue federal “Good Samaritan” legislation or identify some other legally defensible mechanism to minimize State liability and insure that public funds can be used for mercury control efforts wherever they are most cost effective. Finally, it is estimated that all the studies outlined above can be completed within 2.5 years of their being initiated. The mercury Task Force should be allowed an additional six months to evaluate the study results and make recommendations to Regional Board staff on lead allocations and an implementation plan. It should take an additional half a year for Regional Board staff to evaluate the data, all recommendations and develop a TMDL for insertion into the Basin Plan.
6. Monitoring and Evaluation. Significant monitoring will be required once the TMDL is implemented and site remediation is undertaken. It is predicted that methyl mercury concentrations in invertebrates close to the sources should decrease most rapidly (within a year or so of the completion of remediation). Concentrations in large fish and higher trophic level invertebrates more distant from the source will changes
21
more slowly. If significant reduction in invertebrate body burden levels are not measured in a timely fashion close to the sources then further remediation or other adaptive management measures should be considered. The TMDL will be considered successful and will be terminated only when mean small and large fish tissue concentrations in the Basin reach the adopted target level.
7. Other Studies Needed. As previously mentioned, there are other major sources of mercury to the Sacramento-San Joaquin Delta Estuary besides Cache Creek. These include runoff from the historic placer gold fields in the Sierra Nevadas and runoff from other mercury producing areas in the Coast Range. Off site movement of this material has contributed to elevated mercury levels in sediment and biota in the Estuary and to the posting of health advisories warning the public to limit consumption of large striped bass and shark. The strategic plan described above is a pilot TMDL with the initial emphasis being on determining mercury bioavailability and mine remediation feasibility studies in Cache Creek. The anticipation is that the information gained by intensively studying one watershed will result in the identification of cost effective solutions which can be employed elsewhere. However, in the interim, some directed studies will be needed outside of Cache Creek. Each area is briefly described below.
(A) Source identification. Mercury mass load studies (total recoverable, dissolved and methyl mercury) should continue in the Central Valley with an emphasis on watersheds where no data are available. These should include the San Joaquin, Mokelumne, and Consumnes Rivers. Detailed follow up studies should be undertaken in watersheds where the initial studies demonstrate that major sources of mercury come from. Follow up studies should include an assessment of inter-annual variability and the precise locations of all the major mercury sources within each watershed. The studies should also include assessments of the load contributions from major NPDES, storm water discharges and atmospheric input. The mass load work should be accompanied by biological surveys to identify locations with enhanced food chain mercury bioavailability. Funding for such loading studies are requested in Table 1.
(B) Public Health Mercury fish tissue studies should continue in the Delta. Studies should be designed and carried out in coordination with the Office of Environmental Health Hazard Assessment, Department of Health Services, and Fish and Game. The primary purpose is to establish the range of mercury in fish tissue in the Estuary to assess the public risk
22
posed by their consumption. A secondary objective is to establish baseline conditions to evaluate the future success of upstream remediation activities.
(C) Bioavailability Studies Directed research should be undertaken to better understand mercury cycling in the Central Valley and Estuary. Research emphasis should be on evaluating the relative bioavailability of the different sources of mercuric material moving into the Estuary in comparison with concentrations already present and available in sediment porewater. At a minimum these should include an evaluation of inputs from the Cache Creek drainage in the Coast Range, Sierra Nevada Mountains and municipal, industrial, and storm water discharges. The studies should also include an evaluation of the importance of the remobilization of mercury from sediment by natural fluxing and release during dredging, disposal of dredge material on island levees, and creation of shallow water habitat. The ultimate objective of this directed research is to provide resource managers with recommendations on how to minimize mercury bioaccumulation in the Central Valley, Delta and San Francisco Bay.
E. An estimate of the total cost to implement the cleanup plan
An estimate of the costs to develop the information necessary to implement the TMDL are provided in Table 1 below. It is impossible until this information is obtained to estimate the actual cost of implementing the mercury TMDL. It should also be noted that while there are costs to implementing this plan there are also benefits. Currently, beneficial uses are being impacted by high concentrations of mercury in Bay and Delta fish. These concentrations have lead to a human health advisory on consuming fish but probably also impact other higher trophic level organisms, such as mammals and birds that have a much higher fish consumption rate than humans, as well as possibly the fish themselves. The beneficial uses that are impacted are SPORTFISHING (COMM), and probably WILDLIFE (WILD). Implementation of this plan would lower mercury concentrations in fish and minimize or eliminate the impacts on beneficial uses. For a more thorough description of the benefits to restoring beneficial uses see Appendix A.
23
Table 1. Estimate of cost to collect information to develop a mercury control strategy.
Task Cost
TARGETFish eating bird (merganser) study 200,000Egg study 60,000Coordination with OEHHA 75,000
Total 335,000
MERCURY MONITORING IN CACHE CK (per yr)Methyl mercury sediment flux studies 200,000
Water, invertebrate and fish tissue work 200,000Mercury Mass Loading Studies 160,000
Multi-year Total 1,120,000
MINE REMEDIATION FEASIBILITY STUDIES 150,000
ESTUARINE MERCURY MONITORING STUDIES (per yr)Source Identification 100,000Fish Tissue studies (wildlife and human health) 150,000Bioavailability 500,000
Multi-year Total 1,500,000
Grand Total 3,105,000
24
F. An estimate of recoverable costs from potential dischargers
No cost recovery possible.
G. A two year expenditure schedule identifying funds to implement the plans that are not recoverable from potential dischargers.
Several potential sources of funding may be available. First, Clean Water Act 104(b)(3), 106 (g), and 319(h) grants have been used in the past by Regional Board’s to address such issues. Second, the Sacramento River Toxic Pollutant Control Program may have fiscal year 1998 and 1999 appropriation money available for mercury work. Finally, CALFED has indicated an interest in funding mercury work and asked the Regional Board in cooperation with Fish and Game to develop a mercury proposal. CALFED has not yet decided whether to fund the work.
San Joaquin River Dissolved Oxygen Cleanup Plan
Background Low dissolved oxygen concentrations in the San Joaquin River in the vicinity of the City of Stockton has been identified in Part II of the cleanup plan as constituting a candidate BPTCP hot spot. In January 1998 the Central Valley Regional Water Quality Control Board (Regional Board) adopted a revised 303(d) list which identified low dissolved oxygen levels in Delta waterways in the lower San Joaquin River as a high priority problem and committed to developing a waste load allocation (TMDL) by the year 2011. The purpose of the Bay Protection Plan is to develop a strategy to collect the information necessary to implement the TMDL.
The San Joaquin River near the City of Stockton annually experiences violations of the 5.0 and 6.0 mg/l dissolved oxygen standard2. Violations are variable in time but usually occur over a ten mile River reach between June and November. Dissolved oxygen concentrations in the mainstem River can be chronically below the water quality objective and can reach below 2.5 mg/l.
In 1978 the Board adopted more stringent biochemical oxygen demand (BOD) and total suspended solid (TSS) effluent limits for the Stockton Regional Wastewater Control Facility (RWCF) with
2 ?The 5.0 mg/l standard applies between 1 December and 30 August while the 6.0 mg/l standard is for the period of 1 September through 30 November.
25
the intent of reducing or eliminating the low dissolved oxygen conditions in the San Joaquin River. The plant has constructed the necessary additional treatment facilities and has complied with the more stringent effluent limitations. Despite the Cities best efforts, the low dissolved oxygen conditions persist.
The City completed a river model (Schanz and Chen, 1993) assessing the impact of the Stockton RWCF on receiving water quality. Water quality parameters considered included TSS, BOD, ammonia, nitrate and dissolved oxygen. The model suggested that: (1) low dissolved oxygen conditions occur in the fall and spring due to a high mass loading of BOD and ammonia, (2) the current Stockton RWCF contributions are a significant portion of the oxygen demand of the River during critical low dissolved oxygen periods, (3) addition of activated sludge/nitrification units to provide a carbonaceous biochemical oxygen demand (CBOD) of 5 mg/l and ammonia of 0.5 mg/l would increase dissolved oxygen levels in the River at the station most proximate to the RWCF from 2.5 to 3.0 mg/l during critical periods, and (4) the San Joaquin River would not meet the receiving water dissolved oxygen standards even if the entire discharge from the Stockton RWCF were eliminated from the River.
Taking these facts into consideration, the Board adopted a stricter permit in 1994 requiring the Stockton RWCF to further reduce CBOD and ammonia concentrations. Stockton appealed the permit to the State Board on a variety of grounds including that hydraulic conditions had changed in the River since the Board had considered the permit. The State Board remanded the permit back to the Regional Board for consideration of new Delta flow standards.
In the interim the Stockton RWCF refined the dissolved oxygen model for the River (Chen and Tsai, 1997). The model suggests that the principal factors controlling in-stream oxygen concentration are temperature, flow, upstream algal production, sediment oxygen demand (SOD), and discharge from the Stockton RWCF. Obviously, only one of these factors is within the ability of the Stockton RWCF to control. Solutions to the dissolved oxygen problem will require a more holistic watershed approach. Each factor is described briefly below.
Dissolved oxygen problems are most acute at high temperature in the San Joaquin River in late summer and early fall. Temperature is important because the oxygen carrying capacity of water decreases with increasing temperature while biotic respiration rates increase. Water temperature is controlled by air temperature and reservoir releases.
26
Flow of the San Joaquin River at Stockton is regulated by upstream reservoir releases and pumping at the state and federal pumping facilities at Tracy. Net flows at the City of Stockton are often zero or negative in late summer. The lowest dissolved oxygen levels in the River occur during prolonged periods of no net flow.
Algal blooms occasionally develop in the faster moving shallow upper River and are carried down past the City to the deeper slower moving deep water ship channel. Respiration exceeds photosynthesis here resulting in net oxygen deficits. Upstream algal blooms are controlled by turbidity and nutrient inputs from other NPDES dischargers, the dairy industry, erosion, stormwater runoff, and agricultural inputs.
Finally, the model identified discharge from the Stockton RWCF as contributing to the dissolved oxygen problem. The model indicates that improvements in effluent quality would increase dissolved oxygen levels in the River during critical periods. However, the model confirmed that exceedance of the dissolved oxygen water quality objective would persist if the entire discharge of the Stockton RWCF were removed from the River. The City of Stockton has expressed the concern that the estimated costs for the additional treatment are disproportionate to the benefits and that more cost-effective improvements in dissolved oxygen levels are possible.
Adult San Joaquin fall run chinook salmon migrate up river between September and December to spawn in the Merced, Tuolumne, and Stanislaus Rivers (Mills and Fisher, 1994). The Basin Plan dissolved oxygen water quality objective was increased from 5.0 to 6.0 mg/l between 1 September and 30 November to aid in upstream migration. The San Joaquin population has experienced severe declines and is considered a ‘species of concern’ by the U.S. Fish and Wildlife Service. Low dissolved oxygen may act as a barrier preventing upstream spawning migration. Also, low dissolved oxygen can kill or stress other aquatic organisms present in this portion of the Delta.
In conclusion, the San Joaquin River near the City of Stockton annually experiences dissolved oxygen concentrations below the Basin Plan water quality objective in late summer and fall. A model has been developed which identifies river flow and temperature, upstream algal blooms, SOD, and discharge from the Stockton RWCF as controlling variables. Only the latter variable is within the ability of the plant to influence. Fall run chinook salmon migrate upstream during this critical time period.
A. Areal Extent 27
The areal extent of the water quality exceedance is variable but may in some years be as much as 10 miles of mainstem River. The temporal extent is also variable but can be for as long as 4 months. Dissolved oxygen concentrations are often less than 2.5 mg/l in the mainstem River.
B. Sources
A computer model developed for the Stockton RWCF identified ammonia and BOD as the primary cause of the low dissolved oxygen concentration. The sources are discharges from the Stockton RWCF and surrounding point and non point source discharges. River flow and water temperature were identified as two other variables strongly influencing oxygen concentrations.
C. Summary of Actions
Low dissolved oxygen levels near the City of Stockton in late summer and fall are a well known problem. In 1978 the Regional Board adopted more stringent effluent limits which the RWCF met but these did not correct the in-stream problem. A model developed for the Stockton RWCF suggested that further decreases in effluent BOD and ammonia would improve in-stream dissolved oxygen concentrations during critical periods but would not completely correct the problem. In 1994 the Regional Board further tightened BOD and ammonia permit limits to protect water quality. The permit was appealed to State Board because River hydrology had changed since the permit was adopted. State Board remanded the permit back to the Regional Board to reevaluate the modeling based upon new Delta flow conditions. In the interim, the Stockton RWCF installed a gauge at their discharge point to measure River flow and refined their computer model. The model concluded that the primary factors controlling dissolved oxygen concentration in the critical late summer and fall period were River flow and temperature, upstream algal blooms, SOD, and discharge from the Stockton RWCF. The model also made a preliminary evaluation of placing aerators in the River during critical periods. The results appeared promising. Finally, simulations coupling the dissolved oxygen and the San Joaquin River daily input-output model should be run. It may be possible by coupling the two models to predict exceedances of the Basin Plan dissolved oxygen standard about two weeks in advance. This could be valuable in that it raises the possibility of being able to conduct “real time management” to aid in correcting the problem.
28
D. Assessment of Actions Required
In January 1998 the Central Valley Regional Board adopted a revised 303(d) list which identified low dissolved oxygen levels in Delta Waterways near Stockton as a high priority impairment. The goal of the TMDL is to ensure that the San Joaquin River achieves full compliance with the Basin Plan Water Quality Objective for dissolved oxygen. To meet this objective, the Central Valley Regional Board intends to develop a strategy for collecting the information necessary to develop a TMDL.
According to the U.S. EPA (1998), “the goal of the TMDL is the attainment of water quality standards. A TMDL is a written quantitative assessment of water quality problems and the contributing pollutant sources. It specifies the amount of reduction needed to meet water quality standards, allocates load reductions among sources... and provides the basis for taking actions to restore a water body”.
The U.S. EPA (1998) suggests that the successful development of a TMDL requires information in six general areas: identification of a target, location of sources, quantification of the amount of reduction needed, allocation of loads among sources, an implementation plan and monitoring and evaluation to track results and compliance. Regional Board staff also believe that a seventh element, the formation of a Steering Committee, is needed to help guide the control effort. Each of the elements are described briefly below.
Steering Committee. The Steering Committee shall be composed of representatives from the Stockton RWCF, upstream and adjacent NPDES dischargers, the dairy industry, irrigated agriculture, the environmental community, and state and federal resource agencies. A facilitator/coordinator will be needed to conduct the Steering Committee meetings. A cost estimate for this function is shown in Table 2. The primary role of the Steering Committee will be to establish a Technical Advisory Committee, determine other stakeholders who should be participants on the Steering Committee, review recommendations of the Technical Advisory Committee on what special studies should be performed, how the load reductions should be allocated, and the time schedule and strategy for implementing the TMDL. The Steering Committee will also be responsible for developing a financial plan to secure the funding for collecting the information needed to implement the TMDL.
29
The responsibilities of the Technical Advisory Committee will be to identify information needs, determine and prioritize special funding needs, recommend load allocations, direct and assist in the review of the Stockton RWCF model, collate and analyze existing data, conduct special studies, critique special study and data analysis results, establish a common data bank, develop cost estimates, draft implementation and monitoring plans, review monitoring data and advise on effectiveness of the implementation plan. Regional Board staff will make final recommendations to the Board about load allocations and the TMDL implementation. If it appears likely that the Steering and Technical Advisory Committees will be unable to make recommendations in a timely fashion, then staff will develop the load allocation and TMDL implementation plan in the absence of this information.
Target. The target of the TMDL is attainment of the Basin Plan dissolved oxygen water quality objective in the lower San Joaquin River. The dissolved oxygen objective for the time period of 1 September through 30 November is 6.0 mg/l and at all other times is 5.0 mg/l.
Sources and Causes. The Stockton RWCF dissolved oxygen model identified the following factors as the cause of the low dissolved oxygen levels: upstream and adjacent algal blooms, SOD, river flow, discharge from the Stockton RWCF and temperature. It is felt that there is a need for independent validation of the Stockton RWCF dissolved oxygen model. U.S. EPA has committed resources through Tetra Tech to do so. Model evaluation should occur after input has been obtained from both the Steering and Technical Advisory Committees. If validation shows that the model is reliable and that its initial findings are accurate, then the actions listed below are recommended.
Summarize and Compile Data. Collate all pertinent background data on the principle factors which contribute to the dissolved oxygen problem. These include information on all upstream and adjacent point and non-point source BOD and nutrient loads as well as all information on historical dissolved oxygen patterns in the San Joaquin River and changes in fisheries resources that may have been caused by the problem. All information gaps should be identified. Funds necessary for this task are shown in Table 2.
Determine BOD and Nutrient Sources. Collect all additional nutrient and BOD data needed to fill information gaps identified above. This will probably include additional studies on loadings from both local and upstream point and non-point
30

source discharges. In addition, feasibility studies should be undertaken to evaluate the cost and efficacy of load reductions at the most important sources. Funding for this task is identified in Table 2.
Determine Sources and Causes of SOD. The Steering and Technical Advisory Committees will conduct investigations to determine the sources and causes of SOD. Also, feasibility studies will be undertaken to identify the most effective solutions for controlling SOD. Funds necessary for this task are shown in Table 2.
Evaluate Engineered Solutions. The TMDL strategy should include evaluations of creative engineered solutions. At a minimum, the Steering and Technical Advisory Committees should evaluate the feasibility of river aeration and changes in San Joaquin River hydrology. Evaluations of river hydrology may include several options. One is real time management of flows at the head of Old River during critical periods. A second option might be pumping water south through the Delta Mendota Canal for release down Newman Wasteway to augment base flows in the lower San Joaquin River during critical periods. Either option might be significantly enhanced by linking the continuous monitoring data (flow, salinity, temperature, dissolved oxygen and pH) presently collected in the San Joaquin River with measurements of nutrients, and chlorophyll to determine sources and timing of high organic loads so that the head of Old River barrier can be operated in an adaptive management framework (Jones and Stokes Associates, 1998). A cost estimate for evaluating these options is shown in Table 2.
Amount of Load Reduction Needed. The load reduction needed is the difference between the load that would fulfill the Basin Plan Water Quality Objective for dissolved oxygen and the load that causes the dissolved oxygen concentrations presently measured in the main channel of the River.
Allocation of Loads Among Sources. The Steering and Technical Advisory Committees will make recommendations on load allocations to Regional Board staff after considering the following: importance of source, cost of correction per unit of dissolved oxygen increase obtained and probability of success of the action. The Steering and Technical Advisory Committees may also consider creative solutions such as funding aeration or hydrologic changes or the development of non-point source management practices. These are suggested as methods for assuring a contribution from other responsible parties who can make no load reductions. Finally, the load
31
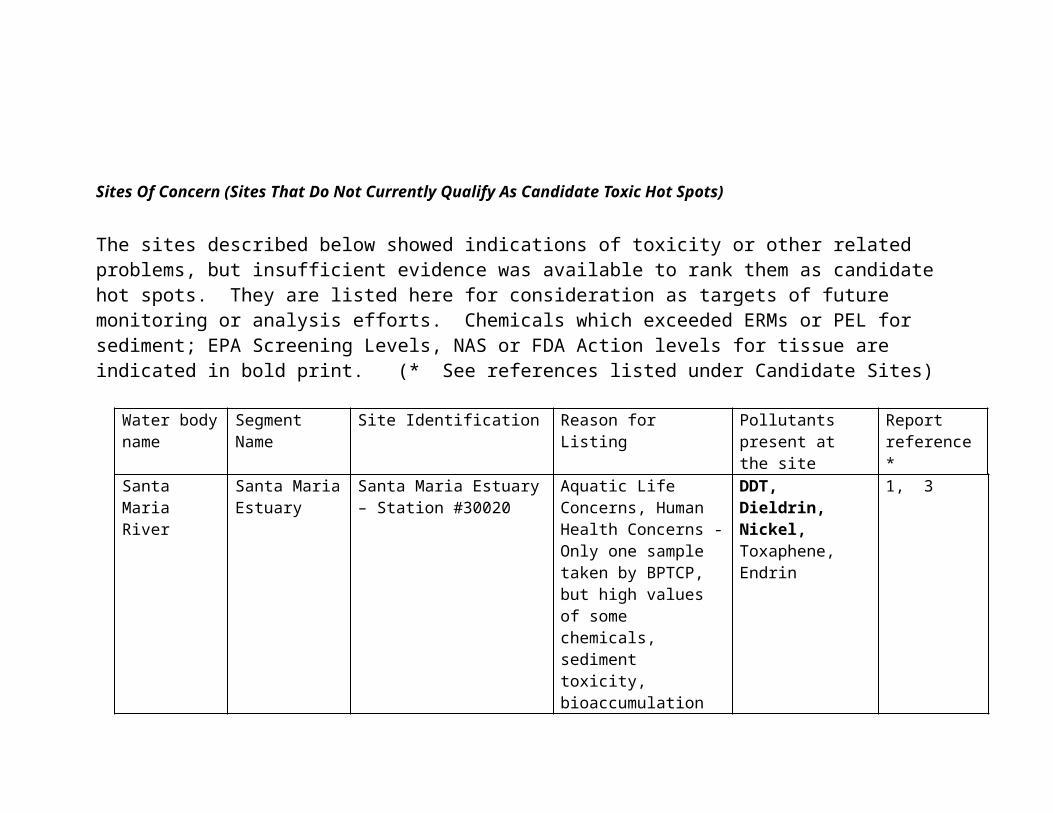
allocation process will include a safety factor to account for population growth in the Basin during the next 30 years.
Implementation Plan. While a full discussion of the implementation plan is premature, several facts are worth noting. First, the Steering and Technical Advisory Committees will make recommendations on load reduction allocations and the schedule and funding for implementing the TMDL. Regional Board staff will review these recommendations and propose a dissolved oxygen TMDL to the Board. It is anticipated that Regional Board staff will need about 6 months to review the recommendations and prepare the paperwork for the Basin Plan amendment. Second, the Basin Plan amendment will include load reduction allocations and a time schedule for meeting them. The reductions may necessitate revisions of NPDES permits and development and enforcement of management practices in the agriculture community.
It is anticipated that the TMDL will take three years to develop once funding has been secured. In the interim, the Regional Board will be revising NPDES permits for discharge to both the lower San Joaquin River and South Delta. Staff propose recommending to the Board when revising these NPDES permits, that no additional ammonia load reductions for correction of the dissolved oxygen problem will be sought while satisfactory progress is being made on the development of the TMDL and the discharge is not responsible for a significant portion of the dissolved oxygen problem. It will be assumed that satisfactory TMDL progress is being made if the majority of studies to determine load allocations are underway by December 1999 and it appears likely that the Steering Committee will recommend a TMDL implementation plan, including load allocations, to Regional Board staff by the year 2002.
Monitoring and Reevaluation. The implementation plan will include monitoring. The purpose of monitoring is to verify compliance with the Basin Plan Dissolved Oxygen Objective. If monitoring demonstrates that the Water Quality Objective is not being met, then additional load reductions will be required. These new load reductions will be implemented after consultation with the Steering and Technical Advisory Committees. An estimate of funds necessary for monitoring is shown in Table 2.
E. An Estimate of the Total Cost to Develop the TMDL
A cost estimate for developing the TMDL is provided in Table 2. Although there are costs to implement this plan there are
32
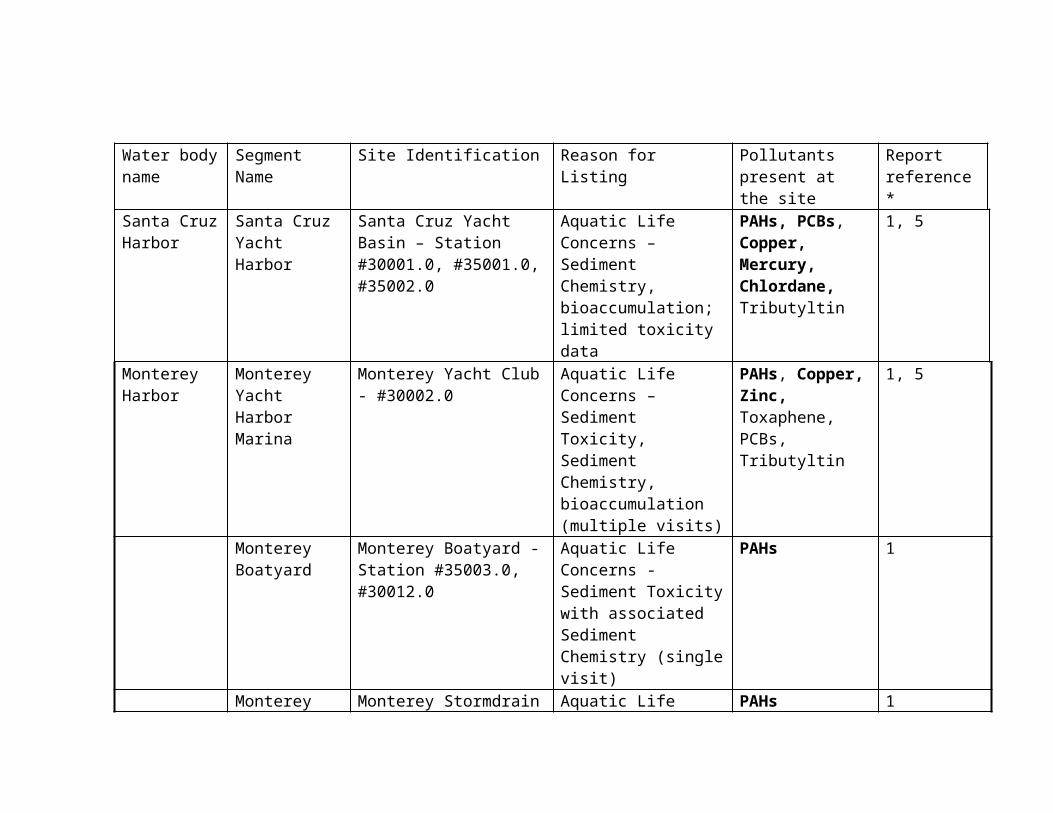
also benefits. Currently, beneficial uses are being impacted by the low dissolved oxygen levels in the South Delta. The beneficial uses that are being impacted are ESTUARINE HABITAT (EST) and SPORT FISHING (RECI). Implementation of the plan would increase dissolved oxygen concentrations and minimize or eliminate the impact on beneficial uses. For a more thorough description of the benefits to restoring beneficial uses see Appendix .
33
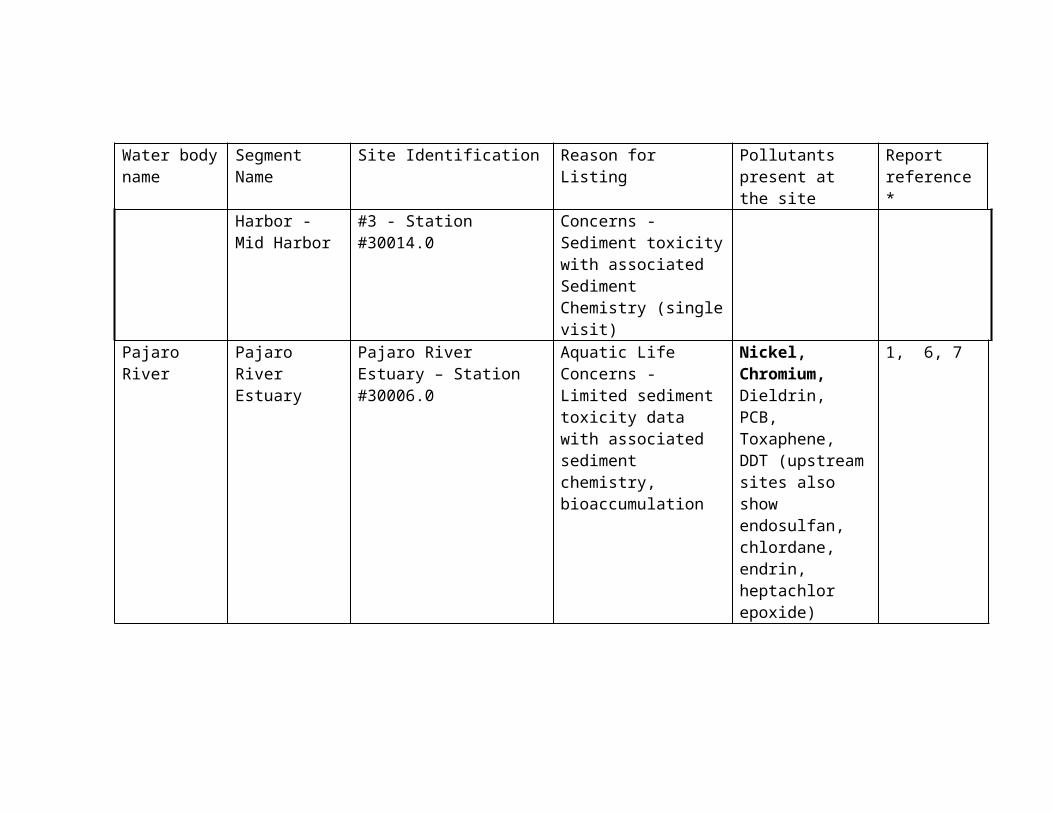
Table 2. Cost estimates for developing a dissolved oxygen TMDL in the lower San Joaquin River and an estimate of the time required to complete each task.
Task Cost Years from date funds available
Steering Committee Facilitator/Coordinator $ 12,0001
as long as required
Problem Statement Summarize and compile data $ 50,000 0.5 Source Analysis Validate D.O. Model Determine BOD and nutrient sources Evaluate feasibility of control options Determine sediment contribution Evaluate feasibility of control options Evaluate engineered solutions
$ 30,000$ 200,000$ 50,000$ 200,000$ 50,000$ 80,000
0.5 2.0
2.0
2.0Implementation Plan TMDL for Regional Board consideration -- 2.5Monitoring/Reevaluation Monitoring to evaluate load reductions $ 20,0001
annually after TMDL adopted
1 per year
F. An Estimate of Recoverable Costs from Potential Dischargers
No immediate funds are available from the discharge community to develop the TMDL. However, once the load reductions are allocated, then the responsible parties will be required to assume the costs of implementation.
G. Two Year Expenditure Schedule Identifying Funds to Implement the Plan that are Not Recoverable from Potential Dischargers.
Clean Water Act 104(b)(3), 106(g), and 319(h) grants are potential sources of funding and have been used in the past by Regional Boards to address such issues. CALFED may also be a source of funding.
34
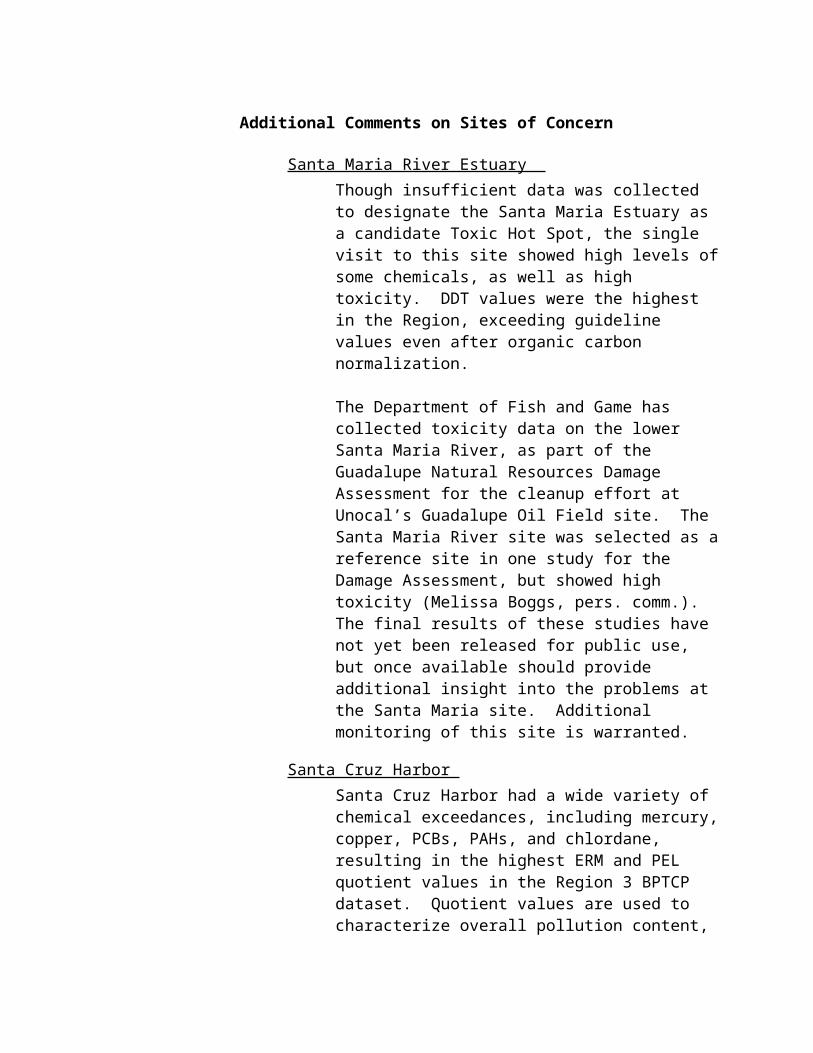
ReferencesChen, C. and W. Tsai, 1997. Evaluation of alternatives to meet the dissolved oxygen objectives of the lower San Joaquin River. Prepared for SWRCB by Systech Engineering Inc. San Ramon, CA.
Foe, C. and W. Croyle 1998. Mercury concentrations and loads from the Sacramento River and from Cache Creek to the Sacramento-San Joaquin Delta Estuary. Central Valley Regional Water Quality Control Board Staff Report. Sacramento Office.
Gilmour, C. 1994. Mercury methylation in fresh water. In National Forum on mercury in fish, proceedings. EPA 823-R-95-002.
Jones and Stokes Associates. 1998. Potential Solutions for Achieving the San Joaquin River Dissolved Oxygen Objective. Report prepared for De Cuir and Somach and the City of Stockton. Jones and Stokes Associates, 2600 V Street, Suite 100, Sacramento, CA. 95818.
Larry Walker and Associates, 1997. Sacramento River mercury control planning project. Prepared for the Sacramento Regional County Sanitation District.
Mills, T. and F. Fisher, 1994. Central Valley anadromous sport fish annual run-size, harvest and population estimates, 1967 through 1991. Cal Dept. Fish and Game. Inland fisheries Div. Tech Report.
Montoya, B. 1991. An analysis of the toxic water quality impairments in the Sacramento-San Joaquin Delta Estuary. Staff report, Central Valley Regional Water Quality Control Board, Sacramento, CA.
San Francisco Bay Regional Water Quality Control Board, 1995. Contaminant levels in fish tissue from San Francisco Bay. Staff report prepared jointly by the San Francisco Regional Board, the State Water Resources Control Board, and the Department of Fish and Game.
Schantz, R. and C. Chen, 1993. City of Stockton water quality model: Volume I. Model development and calibration. Prepared by Phillip Williams and Associates, San Francisco, CA.
Slotton D., S. Ayers, J. Reuter, and C. Goldman. 1997a. Goldmining impacts on foodchain mercury in Northwestern Sierra Nevada Streams. Final Report. Div. of Env. Studies U.C. Davis, CA
35
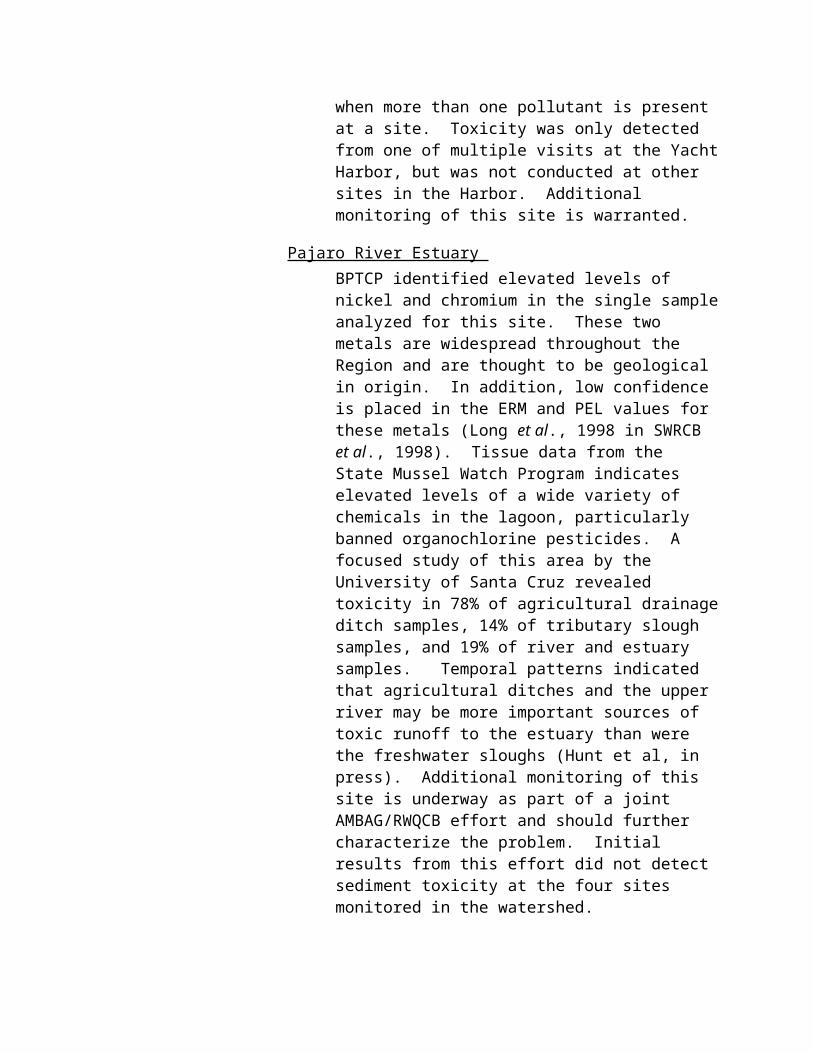
Slotton D., S. Ayers, J. Reuter, and C. Goldman. 1997b. Cache Creek watershed preliminary mercury assessment, using benthic macroinvertebrates. Final Report. Div. of Env. Studies U.C. Davis, CA
U.S. EPA 1995. Guidance for assessing chemical contaminant data for use in fish advisories, Volume 1, Fish Sampling and analysis, 2nd edition, Office of Water. EPA 823-R-95-007, September 1995.
U.S. EPA 1997. Mercury Report to Congress Volume VI: An Ecological Assessment of anthropogenic mercury emissions in the United States. Office of Air Quality Planning and Standards and Office of Research and Development.
Pesticide Variance From Regional Toxic Hot Spot Cleanup Plan
High Priority Candidate Toxic Hot Spot Characterization Variance for Diazinon Orchard Dormant Spray Cleanup Plan
Background “Diazinon in orchard dormant spray runoff” was identified in Part of the draft Central Valley Bay Protection Clean-up plan as constituting a candidate hot spot in the Sacramento-San Joaquin Delta Estuary (Ranking Matrix Table). Staff briefed the Central Valley Regional Board on 23 October 1998 on pesticide detection patterns in the Central Valley and requested guidance on whether
36
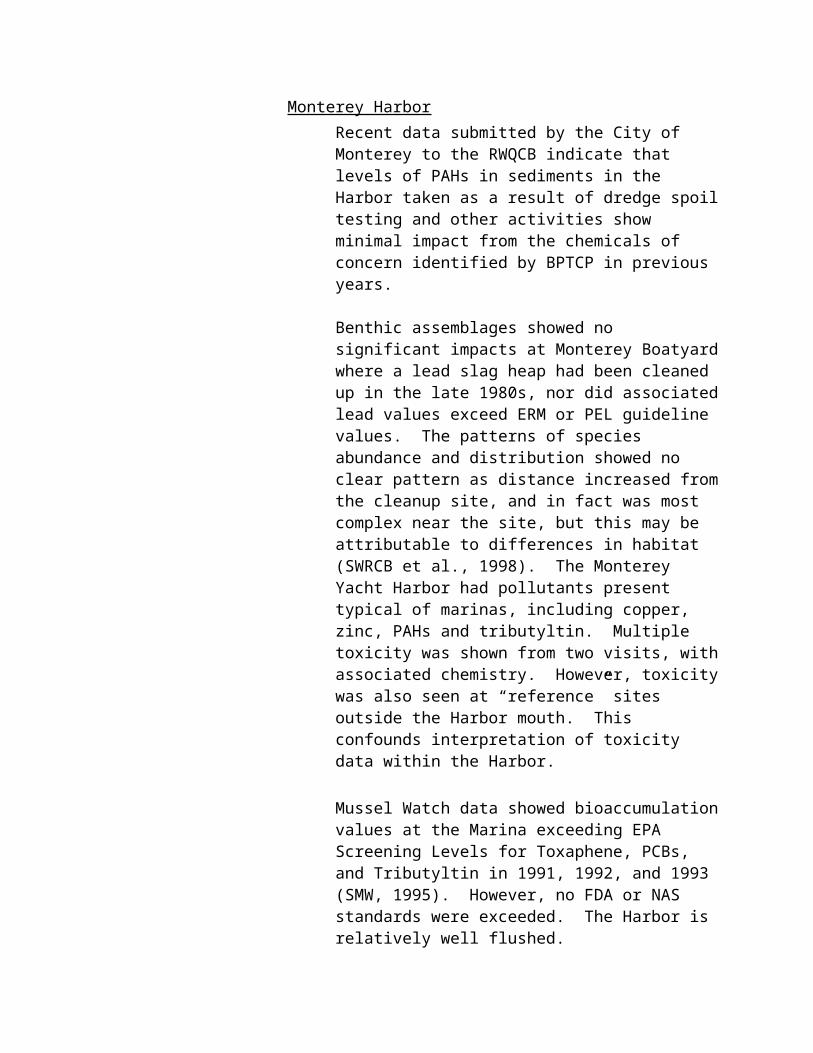
these should be considered “frequent” as required by the Bay Protection Program in order to be considered as a candidate high priority toxic hot spot. In addition, guidance was sought on whether to prepare cleanup plans under Bay Protection or seek a variance and prepare a control program under section 303(d) of the Clean Water Act as the same pesticide excursions were also listed as a high priority 303(d) impairment. The Board unanimously determined that the pattern of pesticide detections observed in the Sacramento and San Joaquin Rivers and in the Bay-Delta were frequent and merited consideration as a high priority candidate Bay Protection Hot Spot. The Board also directed staff to seek a variance and regulate pesticides under the Clean Water Act. Outlined below are all required elements of the Bay Protection Clean Up Plan except sections D through G which address the assessment of the necessary control actions and their associated cost. The activities covered by these latter sections will be addressed by the Regional Board as it develops a waste load allocation program under section 303(d) of the Clean Water Act.
About a million pounds of insecticide active ingredient are applied each January and February in the Central Valley on about half a million acres of stonefruit and almond orchards to control boring insects (Foe and Sheipline, 1993). The organophosphate insecticide diazinon accounts for about half the application. Numerous bioassay and chemical studies have measured diazinon in surface water samples in the Central Valley during winter months at toxic concentration to sensitive invertebrates (Foe and Connor, 1991; Foe and Sheipline, 1993; Ross 1992;1993; Foe, 1995; Domagalski, 1995; Kratzer, 1997). The typical pattern is that the highest concentrations and longest exposures are in small water courses adjacent to high densities of orchards. However, after large storms in 1990 and 1992 diazinon was measured in the San Joaquin River at the entrance to the Delta at toxic concentrations to the cladoceran invertebrate Ceriodaphia dubia in U.S. EPA three species bioassays (Foe and Connor, 1991; Foe and Sheipline, 1993). Following up on these findings, the U.S. Geological Survey and Regional Board traced pulses of diazinon from both the Sacramento and San Joaquin Rivers across the Estuary in 1993 (Kuivila and Foe, 1995). Toxic concentrations to Ceriodaphnia were observed as far west in the Estuary as Chipps Island, some 60 miles downstream of the City of Sacramento and the entrance to the Delta.
Concern has been expressed that other contaminants might also be present in winter storm runoff from the Central Valley and contribute to invertebrate bioassay mortality. Therefore, in 1996 toxicity identification evaluations (TIEs) were conducted on three samples testing toxic in Ceriodaphnia bioassays from the San Joaquin River at Vernalis (Foe et al., 1998). The results confirm
37
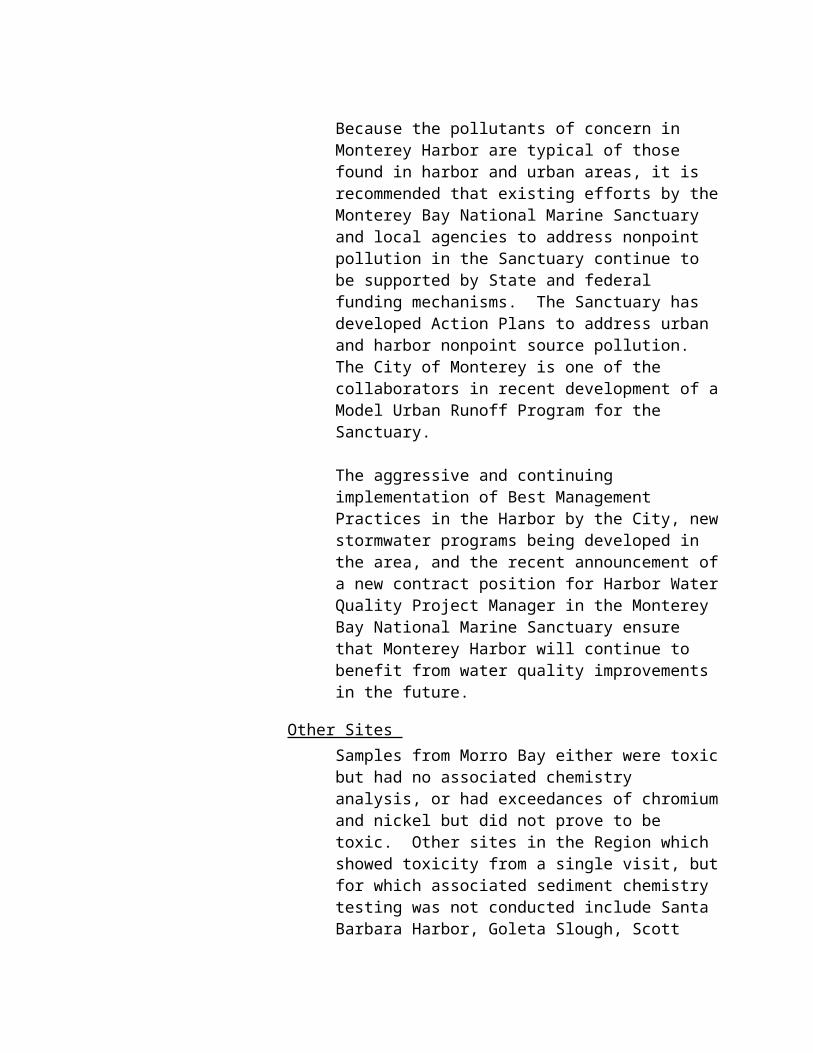
that diazinon was the primary contaminant although other unidentified chemicals may also have contributed a minor amount of toxicity. The study was repeated in 1997 with the exception that samples were taken further upstream in the Sacramento and San Joaquin watersheds in the hope of collecting water with greater concentrations of unknown toxicants thereby facilitating their identification. TIEs were conducted on samples from Orestimba Creek in the San Joaquin Basin on 23 and 25 January and from the Sutter Bypass on 23, 25, and 26 January. Again, diazinon was confirmed as the primary toxicant (Foe et al., 1998). No evidence was obtained suggesting a second contaminant.
No biological surveys have been undertaken to determine the ecological significance of toxic pulses of diazinon. However, Novartis, the Registrant for diazinon, has completed a diazinon probabilistic risk assessment for the Central Valley (Novartis Crop Protection, 1997). Little data were available for the Delta. The risk assessment, like chemical and bioassay studies, suggest that the greatest impacts are likely to occur in water courses adjacent to orchards. Lower concentrations are predicted in mainstem Rivers. The report predicts that the Sacramento and San Joaquin Rivers will experience acutely toxic conditions to the 10% of most sensitive species 0.4 and 11.6% of the time in January and February, the period of most intensive diazinon off site movement3. Novartis concludes that the risk of diazinon alone in the Sacramento-San Joaquin River basin is limited to the most sensitive invertebrates, primarily cladocerans. Furthermore, the report notes that cladocerans reproduce rapidly and their populations are therefore predicted to recover rapidly. Also, the report predicts that indirect effects on fish through reductions in their invertebrate prey are unlikely as the preferred food species are unaffected by the diazinon concentrations observed in the rivers. The study recommends though, that the population dynamics of susceptible invertebrate species in the basin be evaluated along with the feeding habits and nutritional requirements of common fish species.
In conclusion, the only major use of diazinon in the Central Valley in January and February is on stonefruit and almond orchards. In 1990, 1992, 1993, and 1996 diazinon was observed entering the Estuary from either the Sacramento or San Joaquin Rivers at toxic concentration in Ceriodaphnia bioassays. In 1993 the chemical was followed at toxic concentrations across the Estuary. On each occasions diazinon was confirmed as being present in toxic water samples by GC/MS analysis. In 1996 and 1997 TIEs implicated
3 Unfortunately, many agricultural pesticides are applied in the Central Valley and measured in the Rivers. When the risk assessment is repeated with multiple chemicals (Appendix C), the mainstem San Joaquin River is predicted to experience acutely toxic conditions about 20 percent of the year to the 10 percent of most sensitive species. Diazinon is only one of the chemicals present in the River at toxic concentrations.
38
diazinon as the primary contaminant responsible for the toxicity. Finally, sensitive organisms like Ceriodaphnia are predicted to experience acutely toxic conditions in the Sacramento and San Joaquin Rivers about 0.5 and 12 percent of the time in January and February of each year. These frequencies translate to about 1 day every four years in the Sacramento River and 7-8 days per year in the San Joaquin River.
Bay Protection Toxic Cleanup Program guidance recommends that a site or situation be considered a candidate toxic hot spot for pesticides if toxicity in bioassays can be demonstrated, bioassay results are collaborated by both chemical analysis and TIEs, and the pesticide residues reoccur in a pattern of frequent pulses. On 23 October 1998 the Central Valley Regional Board reviewed the dormant spray data and unanimously concluded that the Sacramento and San Joaquin Rivers and Delta-Estuary fit the recommend criteria for listing as a high priority candidate toxic hot spot.A. Areal Extent
Studies demonstrate that the potential areal extent of diazinon water column contamination from orchard runoff is variable by year but may include in some years the entire Sacramento San Joaquin Delta Estuary. The Delta Estuary is a maze of river channels and diked islands covering some 78 square miles of water area and 1,000 linear miles of waterway.
B. Sources
The only major use of diazinon in agricultural areas in the Central Valley in winter is as a dormant orchard spray. Virtually every study investigating off site movement into the Rivers and Estuary have concluded that the primary source of the chemical is from agriculture (Foe and Connor, 1991; Foe and Sheipline, 1993; Ross, 1992;1993; Domagalski, 1995; Kratzer, 1997).
Farmers must obtain a permit to apply diazinon as a dormant spray and their names and addresses are available through the County Agricultural Commissioner's Office. However, not known at this time is the relative contribution of each application to total offsite movement. More information is needed on the primary factors influencing off site movement and the relative contribution of different portions of the Central Valley watershed. Such information is essential not only for assessing responsibility but also for successful development and implementation of agricultural Best Management Practices (BMPs).
39
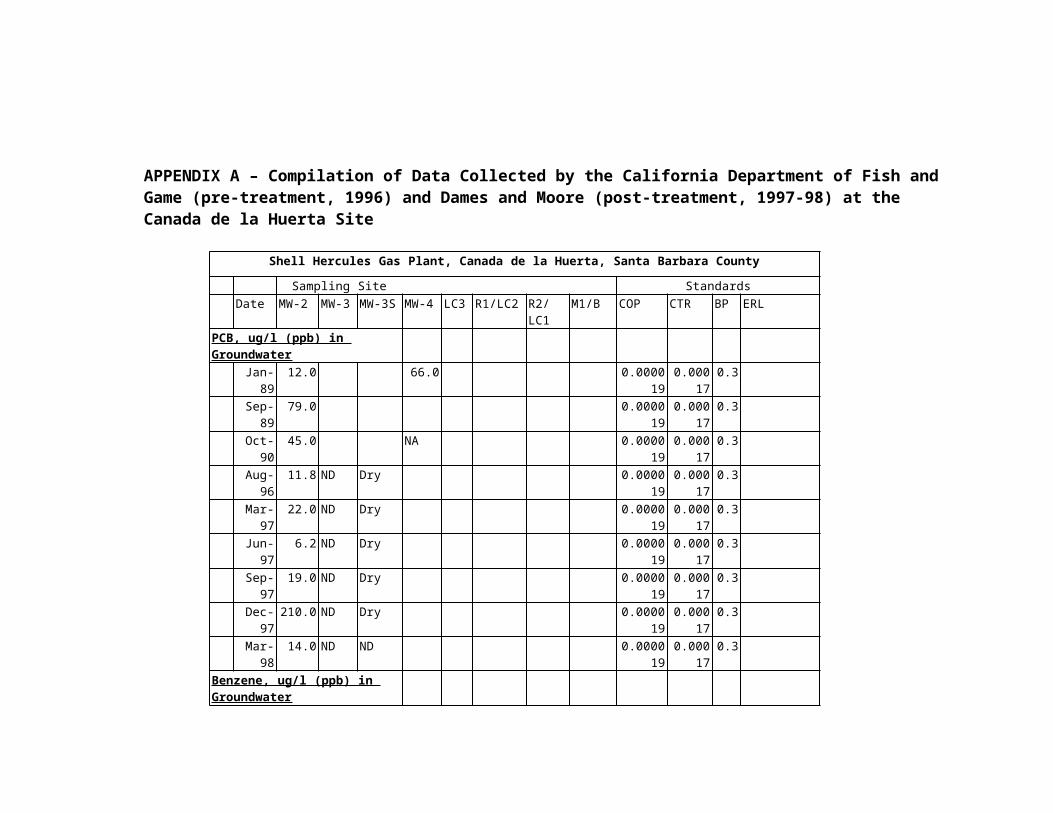
C. Summary of Actions
The Department of Pesticide Regulation (DPR) and the State Water Resources Control Board (SWRCB) both have statutory responsibilities for protecting water quality from adverse effects of pesticides. In 1997, DPR and the SWRCB signed a management agency agreement (MAA), clarifying these responsibilities. In a companion document, the Pesticide Management Plan for Water Quality (Pesticide Management Plan), a process was outlined for protecting beneficial uses of surface water from the potential adverse effects of pesticides. The process relies on a four-stage approach: Stage 1 relies on education and outreach efforts to communicative pollution prevention strategies. Stage 2 efforts involve self-regulating or cooperative efforts to identify and implement the most appropriate site-specific reduced-risk practices. In stage 3, mandatory compliance is achieved through restricted use pesticide permit requirements, implementation of regulations, or other DPR regulatory authority. In stage 4, compliance is achieved through the SWRCB and RWQCB water quality control plans or other appropriate regulatory measures consistent with applicable authorities. Stages 1 through 4 are listed in a sequence that should generally apply. However, these stages need not be implemented in sequential order, but rather as necessary to assure protection of beneficial uses.
Currently, DPR is coordinating a stage 2 effort to address effects of dormant sprays on surface water. DPR’s stated goal is to eliminate toxicity associated with dormant spray insecticides (i.e., chlorpyrifos, diazinon, and methidathion) in the Sacramento and San Joaquin River Basins and Delta. As long as progress continues toward compliance with appropriate water quality objectives, stage 3 activities will be unnecessary.
The U.S. EPA requires Regional Boards under the Clean Water Act to maintain 303(d) lists of impaired water bodies. In January 1998 the Central Valley Regional Board approved a revised 303(d) list of impaired water bodies and provided a schedule for the development of Total Maximum Daily Loads. The Sacramento and San Joaquin Rivers and Delta-Estuary were listed, in part, because of diazinon impairments from orchards to water quality. The Regional Board ranked the impairment in all three locations as a high priority and committed to the development of a TMDL by the year 2005. Components of a TMDL include problem description, numeric targets, monitoring and source analysis, implementation plan, load allocations, performance measures and feedback, margin of safety and seasonal variation and public participation. If compliance monitoring demonstrates that the problem has not
40
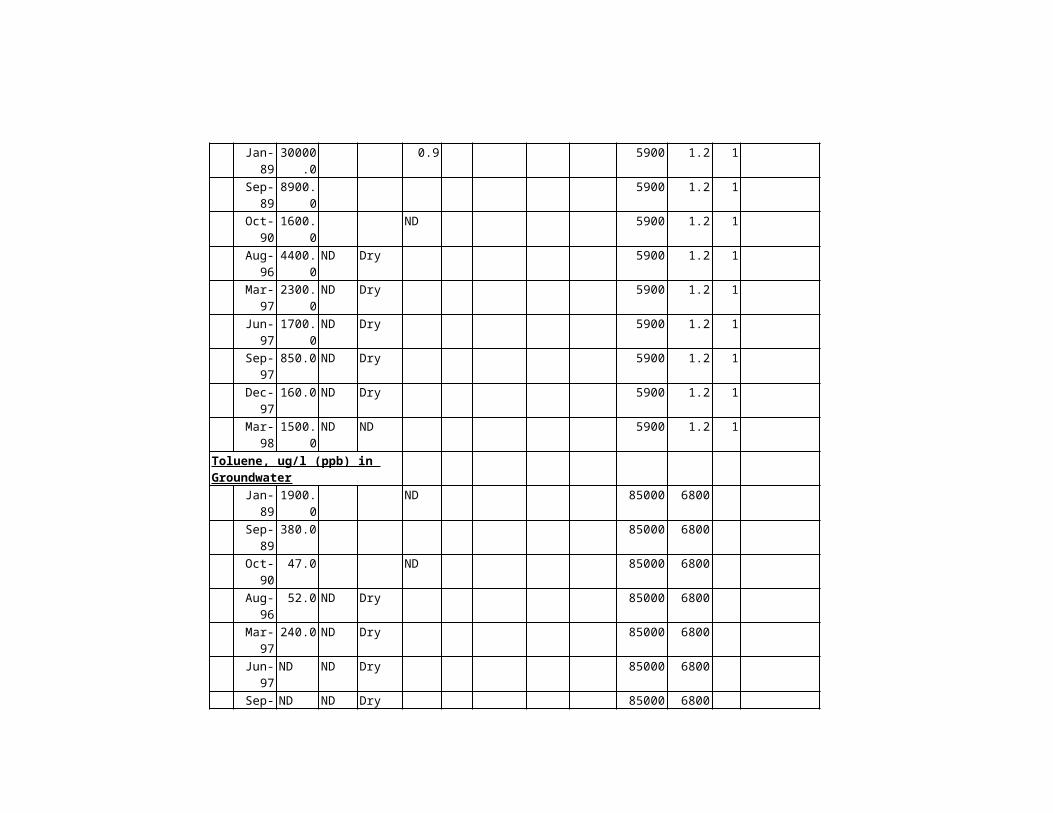
been corrected by 2005, then a TMDL waste load allocation, including an implementation schedule, must be adopted as a Basin Plan amendment by the Regional Board.
Several activities are underway in the Basin to develop agricultural BMPs to control orchard dormant spray runoff. These are summarized below by the Agency conducting the study.
Department of Pesticide Regulation. In addition to the activities already discussed, DPR is investigating orchard floor management as a means to reduce discharges of dormant sprays into surface waterways (Ross et al., 1997). At an experimental plot at UCD, DPR staff measured discharges of chlorpyrifos, diazinon, and methidathion from a peach orchard with three orchard floor treatments. Investigations are continuing in a commercial orchard. At California State University at Fresno, DPR is investigating the effects of microbial augmentation and postapplication tillage on runoff of dormant sprays. Results will be highlighted in DPR’s own outreach activities and will be made available to other groups interested in the identification and promotion of reduced-risk management practices.
DPR is also monitoring water quality at four sites--two each within the Sacramento and San Joaquin river watersheds. During the dormant spray use season, approximately January through mid-March, water samples will be collected five times each week from each site. Chemical analyses are performed on each sample; one chronic and two acute toxicity tests, using Ceriodaphnia dubia, are performed each week.
Novartis. The Registrant of diazinon distributed over ten thousand brochures last winter through U.C. Extension, County Agricultural Commissioner's Offices, and Pesticide distributors. The brochure described the water quality problems associated with dormant spray insecticides and recommended a voluntary set of BMPs to help protect surface waters. Novartis intends to repeat the education and outreach program this winter.
DowElanco and Novartis. The Registrants of chlorpyrifos and diazinon have undertaken a multiyear study in Orestimba Creek in the San Joaquin Basin with the primary objective of identifying specific agricultural use patterns and practices which contribute the bulk of the off-site chemical movement into surface water. The study involves an evaluation of pesticide movement in both winter storms and in summer irrigation return flows. Objectives in subsequent years are to
41
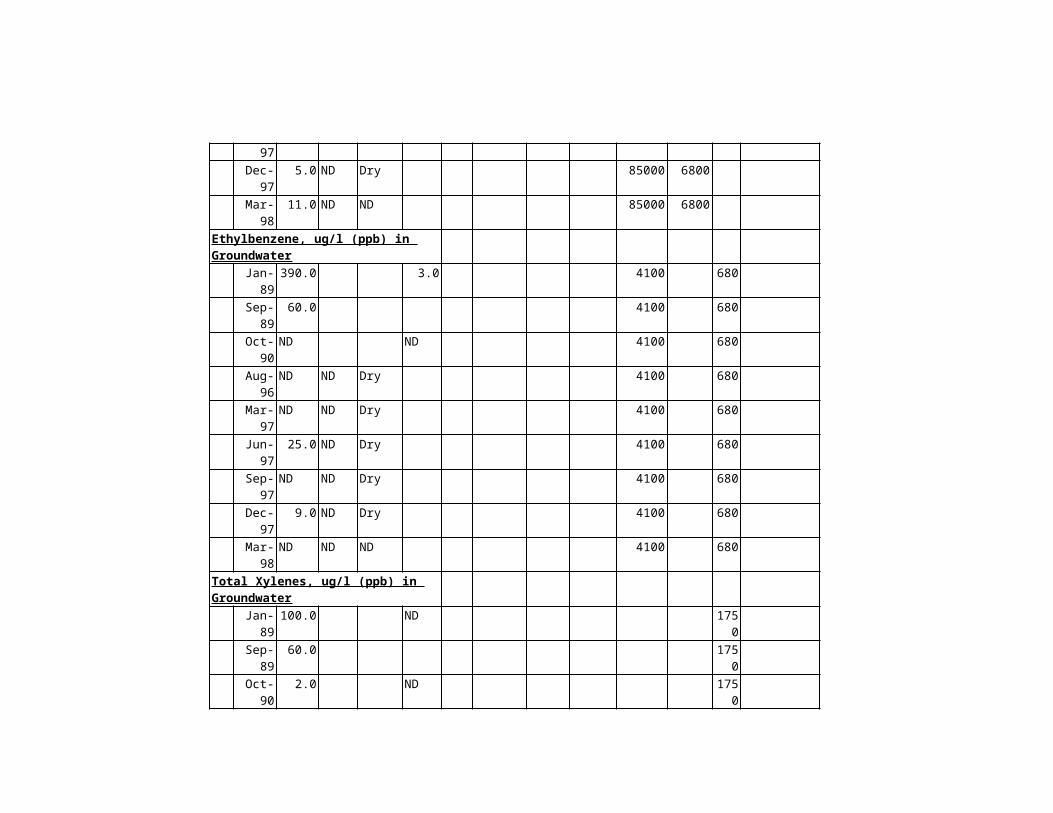
use the data to develop and field test BMPs to reduce off site chemical movement. The first year of work is complete and a report may be released soon.
Biologically Integrated Prune Systems (BIPS). The BIPS program is a community-based project that supports implementation of reduced-risk pest management strategies in prune orchards. The reduction or elimination of organophosphate dormant sprays is a goal. The project has a strong outreach component that includes demonstration sites and “hands-on” training for growers and pest control advisors (PCAs). BIPS is a recipient of one of DPR’s pest management grants.
Biologically Integrated Orchard Systems (BIOS). The BIOS program pioneered community-based efforts to implement economically viable, nonconventional, pest management practices. It emphasizes management of almond orchards in Merced and Stanislaus counties in ways that minimize or eliminate the use of dormant spray insecticides. BIOS was a recipient of a DPR pest management grant and a federal Clean Water Act (CWA) section 319(h) nonpoint source implementation grant.
Biorational Cling Peach Orchard Systems (BCPOS). This project has the same goals as the BIPS program, except that it focuses on primary pests in cling peach orchards. The University of California Cooperative Extension is acting as project leader, with Sacramento and San Joaquin valley coordinators. BCPOS is another recipient of a DPR pest management grant.
Colusa County Resource Conservation District. The Colusa County Resource Conservation District (RCD) is leading a runoff management project within the watershed of Hahn Creek. Project participants are trying to identify management practices that reduce runoff from almond orchards within the watershed, thereby reducing pesticide loads in the creek. Outreach and demonstration sites are part of this project. This project was the recipient of a CWA section 319(h) grant.
Glenn County Department of Agriculture. The Glenn County Department of Agriculture is organizing local growers and PCAs to address the use of dormant spray insecticides in the county. The local RCD is also involved; they are applying for grants to facilitate the implementation of reduced-risk pest management practices.Natural Resources Conservation Service-Colusa Office. The Colusa County office of the Natural Resources Conservation
42
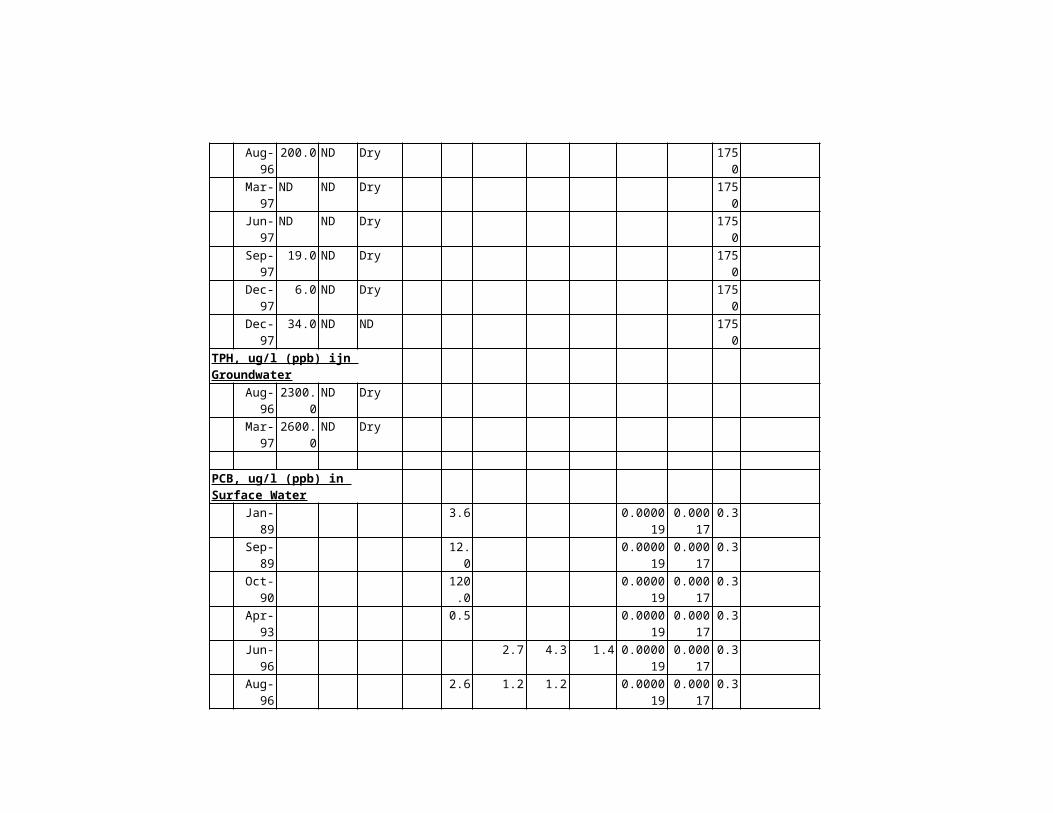
Service (NRCS) was recently awarded over $100,000 from the Environmental Quality Incentives Program (EQIP), one of the conservation programs administered by the U.S. Department of Agriculture. EQIP offers contracts that provide incentive payments and cost sharing for conservation practices needed at each site. Most of these funds should be available to help implement reduced-risk pest management practices in almond orchards in the area.
Natural Resources Conservation Service--Stanislaus Office. The Stanislaus County office of NRCS was recently awarded $700,000 from EQIP. Half of the funds are allocated to address livestock production practices, but most of the remaining funds should be available to address dormant sprays and the implementation of reduced-risk pest management practices. Local work groups, comprised of Reds, NRCS, the Farm Services Agency, county agricultural commissioners, Farm Bureau, and others will determine how EQIP funds will be distributed. Applicants for EQIP funds will be evaluated on their ability to provide the most environmental benefits.
Nature Conservancy. The Nature Conservancy is enrolling more prune growers in the BIPS project as it proceeds with its Felon Island restoration project in the Sacramento Valley. This project is supported by a CWA section 319(h) grant.
U.C. Statewide Integrated Pest Management Project. In late 1997 the U.C. Statewide Integrated Pest Management Project was awarded a two year grant by the State Water Resource Control Board to: (1) identify alternate orchard management practices to prevent or reduce off site movement of dormant sprays, (2) provide outreach and education on these new practices to the agricultural community, and (3) design and initiate a monitoring program to assess the success of the new practices. A Steering Committee composed of representatives from Commodity groups, State Agencies including Regional Board staff, and U.C. Academics was formed to serve as a peer review body for the study.
43
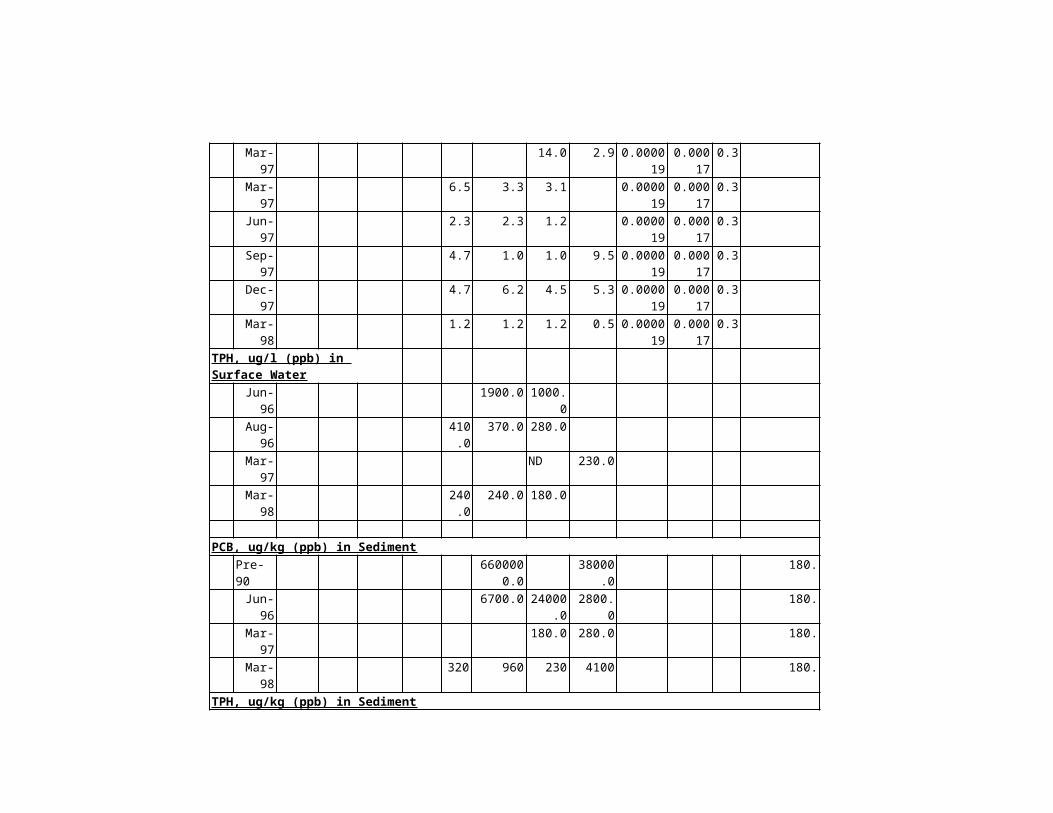
D. Assessment of Actions Required.
In January 1998 the Central Valley Regional Water Quality Control Board adopted a revised 303(d) list, ranked diazinon impairments in the Sacramento and San Joaquin Rivers and in the Delta Estuary as high priority and committed to the development of a load reduction program by the year 2005. In October 1998 staff briefed the Regional Board on pesticide detection patterns in the Central Valley and requested guidance on whether these should be considered “frequent” as required by the Bay Protection Program in order to be considered as a candidate high priority hot spot. In addition, guidance was sought on whether to prepare cleanup plans under Bay Protection or seek a variance and prepare a control program under section 303(d) of the Clean Water Act. The Board unanimously decided that the pattern of pesticide detections observed in the Sacramento and San Joaquin Rivers and in the Bay-Delta from dormant spray applications was frequent and merited consideration as a high priority candidate Bay Protection Hot Spot. The Board also directed staff to seek a variance and begin pesticide regulation under section 303(d) of the Clean Water Act.
E. An estimate of the total costs to develop the plan.
Not Applicable.
F. An estimate of recoverable costs from potential discharges.
Not Applicable.
G. Two year expenditure schedule identifying funds to implement the plan that are not recoverable from potential dischargers.
Not Applicable.
Urban Stormwater Pesticide Cleanup Plan
Background “Diazinon and chlorpyrifos in urban stormwater runoff” was identified in the draft Bay Protection Cleanup Plan as constituting a candidate toxic hot spot in several Delta backsloughs (Ranking Matrix Table). Staff briefed the Central Valley Regional Board on 23 October 1998 on pesticide detection patterns in the Central Valley and requested guidance on whether these should be considered “frequent” as required by the Bay Protection Program to be considered as a candidate high priority toxic hot spot. In addition, guidance was sought on whether to prepare cleanup plans under Bay Protection or seek a variance and prepare a control
44
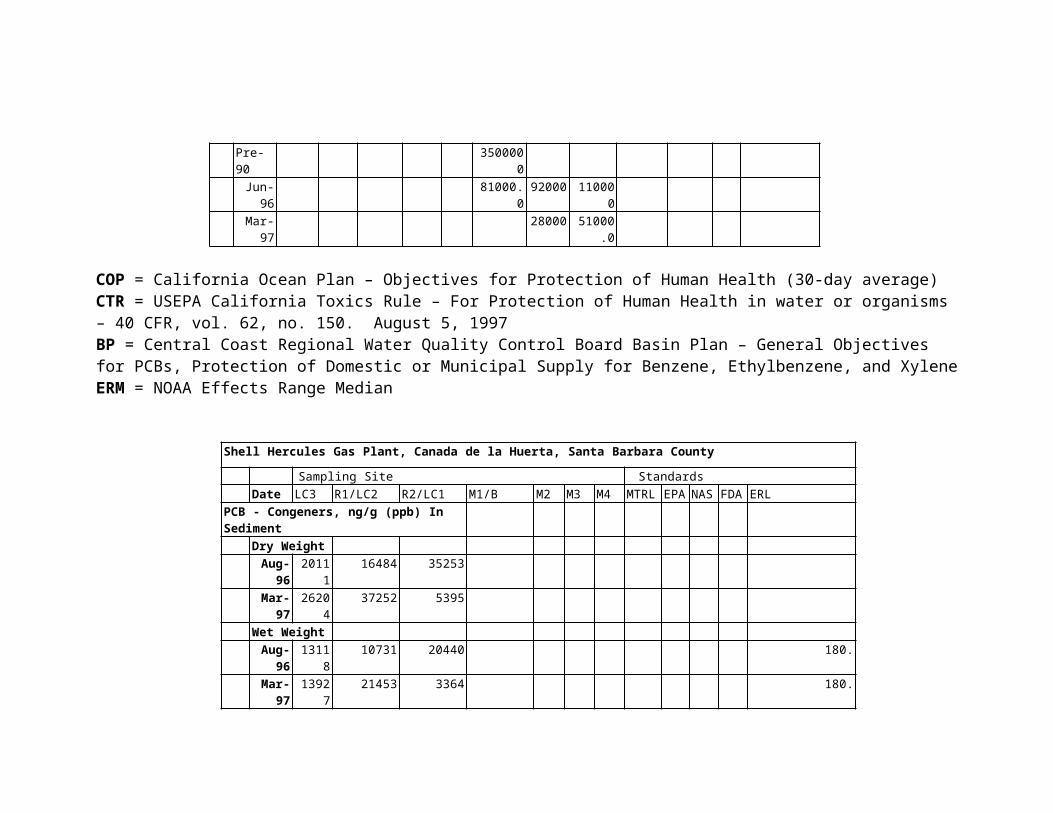
program under section 303(d) of the Clean Water Act as the same pesticides excursions were also listed as a medium priority 303(d) impairment. The Board unanimously determined that the pattern of pesticide detections observed in urban runoff around the Delta were frequent and merited consideration as high priority candidate Bay Protection Hot Spots. The Board also directed staff to seek a variance and regulate pesticides under the Clean Water Act. Outlined below are all required elements of the Bay Protection Clean Up Plan except sections D through G which address the assessment of the necessary control actions and their associated cost. The activities covered by the latter sections will be addressed by the Regional Board as it develops a waste load allocation program under section 303(d) of the Clean Water Act.
Three hundred and forty thousand pounds of diazinon and 775 thousand pounds of chlorpyrifos active ingredients were used in reported landscape and structural pest control in California in 1994 for control of ants, fleas and spiders (Scanlin and Cooper, 1997; Department of Pesticide Regulation, 1996). The figure likely underestimates by about half the total use as it does not include unreported homeowner purchases. In February and again in October 1994 Ceriodaphnia bioassay mortality was reported in Morrison Creek in the City of Sacramento and in Mosher Slough, 5 Mile Slough, Calaveras River, and Mormon Slough in the City of Stockton (Connor, 1994;1995). All these waterbodies are within the legal boundary of the Delta. A modified phase I TIE was conducted on samples from each site which implicated a metabolically activated pesticide(s) (such as diazinon and chlorpyrifos). Chemical analyses demonstrated that diazinon and occasionally chlorpyrifos was present at toxic concentrations. A phase III TIE was conducted on water collected from Mosher Slough on 1 May 1995 which confirmed that the primary cause of acute toxicity was a combination of diazinon and chlorpyrifos.
It was not known at the time that the Bay Protection samples were being collected that an assessment of the frequency of pesticide excursions would be needed to determine whether a location should be considered as a candidate toxic hot spot. Therefore, no intensive sampling was conducted at Mosher, Five Mile, and Mormon Sloughs, or the Calaveras River or Morrison Creek. However, in other testing 230 samples were collected from urban dominated waterways in the Sacramento and Stockton areas (Bailey et al. 1996). These sites are thought to exhibit water quality similar to those locations being considered here as candidate hot spots. All 230 samples were analyzed for diazinon. Eighty-five percent of the measured values (195 samples) exceeded Fish and Game recommended acute hazard criteria. Ninety samples were analyzed for chlorpyrifos. Eighty percent of the values (72 samples) also exceeded the recommended
45
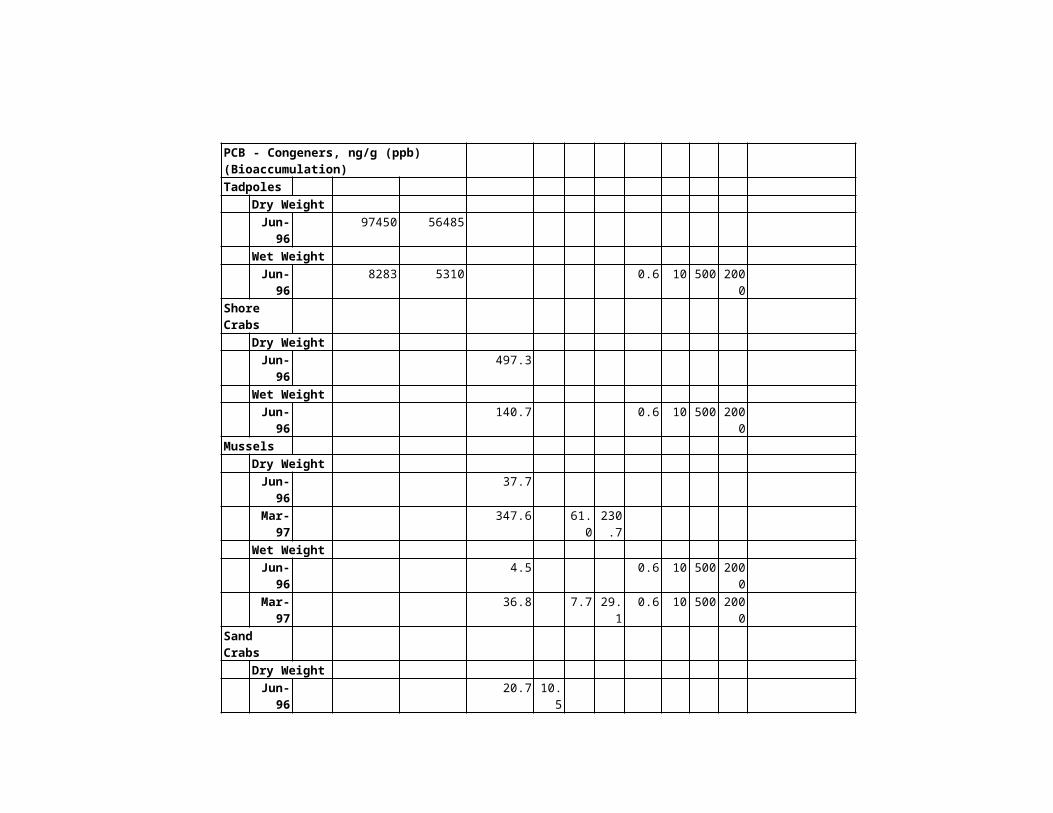
chlorpyrifos acute hazard criteria. Finally, Ceriodaphnia bioassays were run on 47 samples. Seventy-seven percent of these (36 samples) produced total mortality within 72 hours. Modified Phase I TIEs suggested that the toxicity was due to metabolically activated pesticides, such as diazinon and chlorpyrifos. Chemical analysis was consistent with these conclusions suggesting that the two organophosphate insecticides were the major contaminants.
In second set of data, the Sacramento River Watershed Program has monitored Arcade Creek in Sacramento monthly since 1996 for toxicity. Arcade Creek was selected to represent a typical urban creek. In the 1996-97 sampling period, Arcade Creek was monitored 13 times during 12 months. Seventy-seven percent of those samples exhibited significant Ceriodaphnia mortality. Diazinon and chlorpyrifos concentrations were measured in the seven samples causing 100% mortality. TIEs and pesticide detections in the seven samples confirm that both pesticides contributed to the observed toxicity. Toxicity was detected during both wet and dry weather (Larson et al., 1998a). The 1997-98 sampling period data has been summarized for only five dates. In four of the five samples (eighty percent), 100% Ceriodaphnia mortality was detected and linked through TIEs to the presence of diazinon and chlorpyrifos. Again, toxicity was detected during wet and dry periods (Larson et al., 1998b).
Background concentrations of diazinon in urban storm runoff in the Central Valley increase after application on orchards in January and February suggesting that urban use might not be the sole source of the chemical at this time (Connor, 1996). Volatilization following application is known to be a major diazinon dissipation pathway from orchards (Glotfelty et al., 1990 ) and a number of dormant spray insecticides have previously been reported in rain and fog in the Central Valley (Glotfelty et al., 1987). Therefore, composite rainfall samples were collected in South Stockton in 1995 which demonstrated that diazinon concentrations in rain varied from below detection to about 4,000 ng/l (ten times the acute Ceriodaphnia concentration). The rainfall study was continued through March and April of 1995 to coincide with application of chlorpyrifos on alfalfa for weevil control. Chlorpyrifos concentrations in composite rainfall samples increased, ranging from below detection to 650 ng/l (again 10 times the acute Ceriodaphnia concentration). However, unlike with diazinon, no study was conducted to ascertain whether chlorpyrifos concentrations in street runoff increased suggesting that agricultural inputs might be a significant urban source.
Similar invertebrate bioassay results coupled with TIEs and chemical analysis from the San Francisco Bay Area suggest that diazinon and chlorpyrifos may be a regional urban runoff problem
46
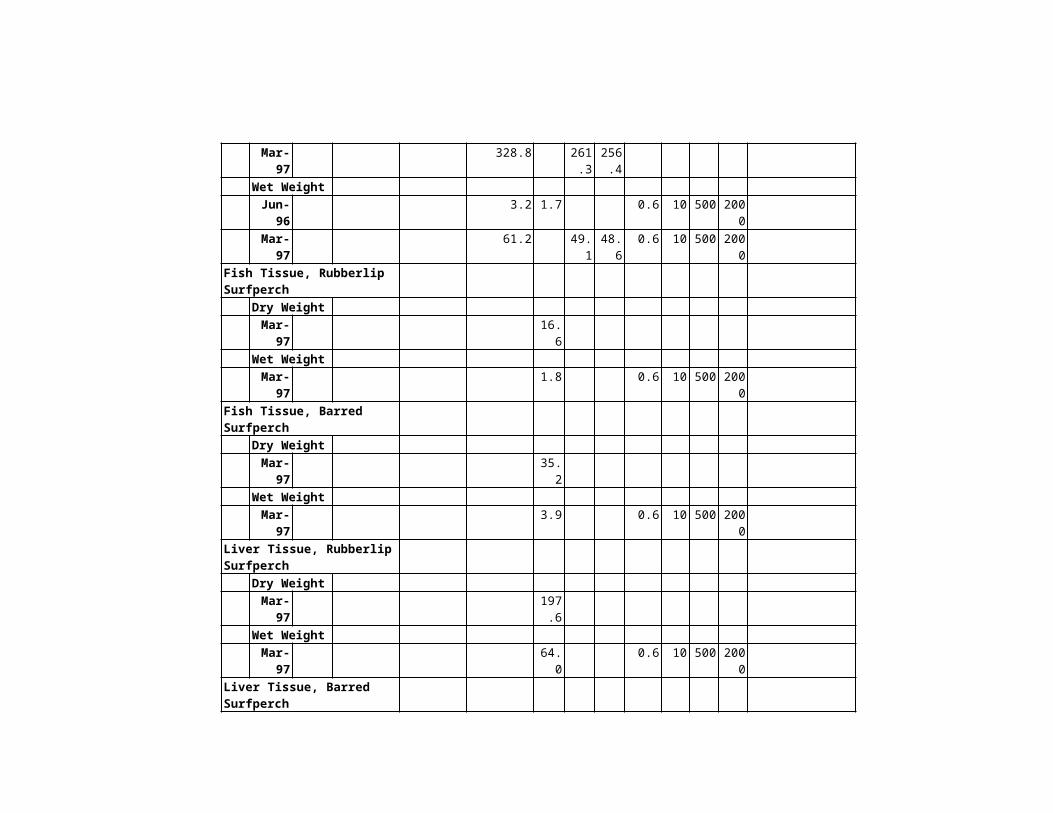
(Katznelson and Mumley, 1997) This finding prompted the formation of an Urban Pesticide Committee (UPC). The UPC is an ad hoc committee formed to address the issue of toxicity in urban runoff and wastewater treatment plant effluent due to organophosphate insecticides, in particular diazinon and chlorpyrifos. The UPC is composed of staff from the U.S. EPA, the San Francisco Bay and Central Valley Regional Water Quality Control Boards, the Department of Pesticide Regulation, Novartis and Dow Elanco, municipal storm water programs, the Bay Area Stormwater Management Agencies Association, County Agricultural commissions, Wastewater treatment plants, the University of California, and Consultants. The members of the UPC are committed to working in partnership with the various stakeholders to develop effective measures to reduce the concentrations of organophosphate insecticides in urban runoff and wastewater treatment plant effluent.
In conclusion, a combination of bioassay, chemical, and TIE work demonstrate that diazinon and chlorpyrifos are present in urban stormwater runoff discharged to urban creeks and back sloughs around the Cities of Sacramento and Stockton at concentrations toxic to sensitive invertebrates. The source of the diazinon appears to be primarily from urban sources although agricultural orchard use may also be important. Chlorpyrifos appears to be predominately of urban origin but the impacts from agricultural use need to be evaluated. Finally, bioassay and chemical analysis suggest that about 75 percent of the samples collected from urban runoff dominated waterbodies will test toxic in Ceriodaphnia bioassays while eighty to eighty-five percent of the samples will contain diazinon and chlorpyrifos at concentrations exceeding the acute California Department of Fish and Game Hazard Assessment criteria.
Bay Protection Toxic Cleanup Program guidance recommends that a site or situation be considered a candidate toxic hot spot for pesticides if toxicity in bioassays can be demonstrated, bioassay results are collaborated by both chemical analysis and TIEs, and the pesticide residues reoccur in a pattern of frequent pulses. On 23 October 1998 the Central Valley Regional Board reviewed the data and unanimously concluded that pesticides in urban runoff dominated backsloughs around the Delta fit the recommended criteria for listing as a high priority candidate toxic hot spot.
A. Areal Extent
The potential threat posed by diazinon and chlorpyrifos in urban storm runoff is localized to Morrison Creek in the City of Sacramento and Mosher Slough, 5 Mile Slough, the Calaveras River, and Mormon Slough in the City of Stockton.
47
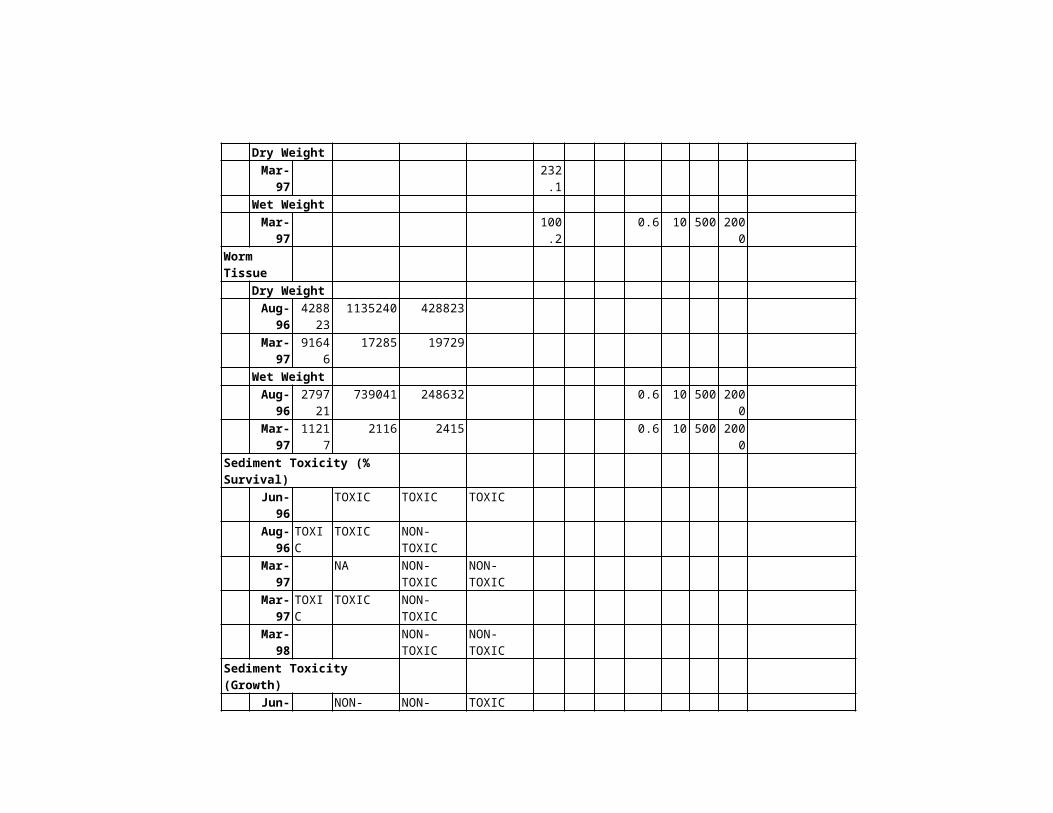
Together the areal extent of impairment may be up to 5 linear miles of back sloughs within the legal boundary of the Delta.
B. Sources
Detailed information on urban sources are not available for the Central Valley. However, source information has been obtained for the Bay Area and the conclusions are thought to also apply in the Valley with the caveat that the Bay area does not receive significant amounts of diazinon in rainfall as appears to occur in the Central Valley (personal communication, Connor). Confirmatory studies are needed to verify that the Bay Area conclusions also apply in the Valley.
The primary source of diazinon and chlorpyrifos in Bay Area creeks is from urban runoff. Sampling in urbanized areas in Alameda County indicated that residential areas were a significant source but runoff from commercial areas may also be important (Scanlin and Feng, 1997). It is not known what portion of the diazinon and chlorpyrifos found in creeks is attributable to use in accordance with label directions versus improper disposal or over application. However, a preliminary study of runoff from residential properties suggest that concentrations in creeks may be attributable to proper use (Scanlin and Feng, 1997).
C. Summary of Actions
The discovery of diazinon in urban storm runoff in both the Central Valley and San Francisco Bay Region at toxic concentrations to Ceriodaphnia led to the formation of the Urban Pesticide Committee (UPC). The objective of the UPC is to provide a forum for information exchange, coordination and collaboration on the development and implementation of a urban pesticide control strategy. An additional advantage of the Committee is that it facilitates a more efficient use of limited resources. The initial characterization of the pesticide problem through extensive bioassay, chemical and TIE work occurred in the Central Valley with confirmation in the Bay Area while the follow-up studies identifying sources and loads has primarily occurred in the Bay Area.
The UPC has prepared three reports describing various aspects of the urban pesticide problem in the Bay Area and a fourth volume describing a strategy for reducing diazinon levels in urban runoff. The first report provides a compilation and review of water quality and aquatic toxicity data in urban creeks and storm water discharges in the San Francisco Bay
48
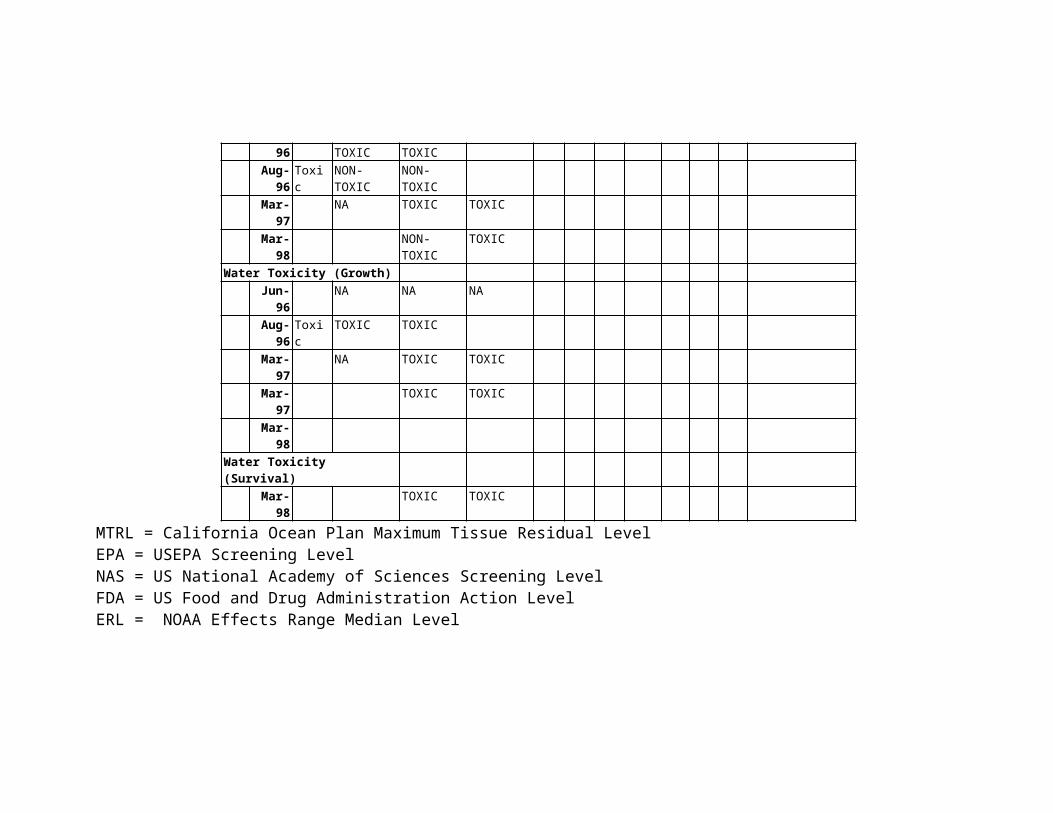
Area focusing on diazinon (Katznelson and Mumley, 1997). The review also includes a discussion of the potential adverse impact of diazinon on aquatic ecosystems receiving urban runoff. The second report characterizes the temporal and spatial patterns of occurrence of diazinon in the Castro Valley Creek watershed (Scanlin and Feng, 1997). Runoff at an integrator point for the entire watershed was sampled during multiple storms to record both seasonal and within-event variations in diazinon concentration. The purpose of the third report was to compile information on the outdoor use of diazinon in urban areas in Alameda County including estimates of quantity applied, target pests, and seasonal and long term trends (Scanlin and Cooper, 1997). This information will be used in the development of a strategy to reduce the levels of diazinon in Bay Area creeks. Finally, the UPC has produced a strategy for reducing diazinon levels in Bay Area creeks (Scanlin and Gosselin, 1997). Since pesticides are regulated on the state and national level, much of the strategy focuses on coordinating with enforcement agencies. The strategy presents a framework of roles and responsibilities that can be taken by various agencies to achieve the overall goal. The strategy focuses on diazinon as it is the most common insecticide detected at toxic levels. In the Central Valley both diazinon and chlorpyrifos are regularly observed and must be simultaneously addressed in any cleanup plan.
As was explained in the diazinon orchard dormant spray clean up plan, DPR and the SWRCB both have statutory responsibilities for protecting water quality from adverse effects of pesticides. In 1997 DPR and the SWRCB signed a management agency agreement (MAA), clarifying these responsibilities. In a companion document, the Pesticide Management Plan for Water Quality (Pesticide Management Plan), a process was outlined for protecting beneficial uses of surface water from the potential adverse effects of pesticides. The process relies on a four-stage approach: Stage 1 relies on education and outreach efforts to communicative pollution prevention strategies. Stage 2 efforts involve self-regulating or cooperative efforts to identify and implement the most appropriate site-specific reduced-risk practices. In stage 3, mandatory compliance is achieved through restricted use pesticide permit requirements, implementation of regulations, or other DPR regulatory authority. In stage 4, compliance is achieved through the SWRCB and RWQCB water quality control plans or other appropriate regulatory measures consistent with applicable authorities. Stages 1 through 4 are listed in a sequence that should generally apply. However, these stages need not be implemented in sequential order, but rather as necessary to assure protection of beneficial uses. At
49

present pesticides in urban storm water are managed through stage 1 of the MAA.
The U.S. EPA requires Regional Boards under the Clean Water Act to maintain 303(d) lists of impaired water bodies. In January 1998 the Central Valley Regional Board approved a revised 303(d) list of impaired water bodies and provided a schedule for the development of Total Maximum Daily Loads. Morrison Creek, Mosher Slough, and Five Mile Slough were listed because of diazinon and chlorpyrifos impairments to water quality. The Regional Board ranked the impairment in all three locations as a medium priority and committed to the development of a TMDL by the year 2011. Components of a TMDL include problem description, numeric targets, monitoring and source analysis, implementation plan, load allocations, performance measures and feedback, margin of safety and seasonal variation and public participation. If compliance monitoring demonstrates that the problem has not been corrected by 2011, then the TMDL waste load allocation, including an implementation schedule, must be adopted as a Basin Plan amendment by the Regional Board.
D. Assessment of Actions Required.
In January 1998 the Central Valley Regional Water Quality Control Board adopted a revised 303(d) list, ranked diazinon and chlorpyrifos impairments in urban runoff dominated back sloughs around the Delta as a medium priority and committed to the development of a load reduction program by the year 2011. In October 1998 staff briefed the Regional Board on pesticide detection patterns in the Central Valley and requested guidance on whether these should be considered “frequent” as required by the Bay Protection Program in order to be considered as a candidate high priority hot spot. In addition, guidance was sought on whether to prepare cleanup plans under Bay Protection or seek a variance and prepare a control program under section 303(d) of the Clean Water Act. The Board unanimously decided that the pattern of pesticide detections observed in urban runoff were frequent and merited consideration as high priority candidate Bay Protection Hot Spot. The Board also directed staff to seek a variance and begin pesticide regulation under section 303(d) of the Clean Water Act.
E. An estimate of the total costs to develop the plan.
Not Applicable.
F. An estimate of recoverable costs from potential dischargers. 50
Not Applicable.
G. Two year expenditure schedule identifying funds to implement the plan that are not recoverable from potential dischargers.
Not Applicable.
Irrigation Return Flow Pesticide Cleanup Plan
Background “Chlorpyrifos in irrigation tailwater” has been identified in the draft Bay Protection Clean-Up Plan as constituting a candidate hot spot in various agriculturally dominated backsloughs within the Delta (Ranking Matrix Table). Staff briefed the Central Valley Regional Board on 23 October 1998 on pesticide detection patterns in the Central Valley and requested guidance on whether these should be considered “frequent” as required by the Bay Protection Program to be considered as a candidate high priority toxic hot spot. In addition, guidance was sought on whether to prepare cleanup plans under Bay Protection or seek a variance and prepare a control program under section 303(d) of the Clean Water Act as pesticide excursions in the San Joaquin River and Delta-Estuary were also listed as a high priority 303(d) impairment. The Board unanimously determined that the pattern of pesticide detections observed in various Delta backsloughs from irrigated agriculture was frequent and merited consideration as a high priority candidate Bay Protection Hot Spot. The Board also directed staff to seek a variance and regulate pesticides under the Clean Water Act. Outlined below are all required elements of the Bay Protection Clean Up Plan except sections D through G which address the assessment of the necessary control actions and their associated cost.
One and a half million pounds of chlorpyrifos active ingredient were used in the Central Valley on agriculture in 1990 (Sheipline, 1993). Major uses in March are on alfalfa and sugarbeets for weevil and worm control and between April and September on walnuts and almonds for codling moth and twig borer control. Two minor uses are on apples and corn. A bioassay study was conducted in agriculturally dominated waterways in the San Joaquin Basin in 1991 and 92. Chlorpyrifos was detected on 190 occasions between March and June of both years, 43 times at toxic concentrations to Ceriodaphnia (Foe, 1995). Many of the crops grown in the San Joaquin Basin are also cultivated on Delta Tracts and Islands. Not known was whether these same agricultural practices might also contribute to instream toxicity in the Delta. BPTCP resources were used between 1993 and 1995 to conduct a bioassay monitoring program in the Delta. Chlorpyrifos toxicity
51
was detected on nine occasions in surface water from four agriculturally dominated backsloughs (French Camp Slough, Duck Slough, Paradise Cut, and Ulatis Creek; Deanovic et al., 1996;1997). In each instance the Ceriodaphnia bioassay results were accompanied by modified phase I and II TIEs and chemical analysis which implicated chlorpyrifos. On four additional occasions phase III TIEs were conducted (Ulatis Creek 21 March 1995, Paradise Cut 15 March 1995, Duck Slough 21 March 1995, and French Camp Slough 23 March 1995). These confirmed that chlorpyrifos was the primary chemical agent responsible for the toxicity. Analysis of the spatial patterns of toxicity suggest that the impairment was confined to backsloughs and was diluted away upon tidal dispersal into main channels. The precise agricultural crops from which the chemicals originated are not known because chlorpyrifos is a commonly applied agricultural insecticide during the irrigation season. However, the widespread nature of chlorpyrifos toxicity in March of 1995 coincided with applications on alfalfa and subsequent large rainstorms. Follow up studies are needed to conclusively identify all responsible agriculture practices.
It was not known at the time that the Bay Protection samples were being collected that an assessment of the frequency of pesticide excursions would be needed to determine whether a location should be considered as a candidate toxic hot spot. Therefore, no intensive sampling was conducted in French Camp and Duck Sloughs or in Paradise Cut or Ulatis Creeks to determine the precise frequency of irrigation induced pesticide toxicity. However, as has been previously mentioned, the same agricultural crops and pesticide application patterns occur in the Delta as in the San Joaquin Basin. Novartis (1997) conducted an ecological risk assessment using all the available pesticide data and concluded that the mainstem San Joaquin River should experience acutely toxic conditions about 20 percent of the time (approximately 70 days/year) from a mixture of insecticides but predominately diazinon and chlorpyrifos. Diazinon was most commonly observed during the dormant spray season (January and February) while chlorpyrifos explained most of the toxicity during the irrigation season (March through September). It has previously been calculated that the mainstem San Joaquin River is expected to experience acutely toxic conditions for about 7 days in January and February from off site movement of diazinon. Therefore, it is estimated that acute toxicity will occur for about 63 days during the remaining year (70-7=63). Most of this toxicity is predicted to be from chlorpyrifos excursions.
In a more recent study, Dow AgroSciences, the primary registrant for chlorpyrifos, monitored diazinon and chlorpyrifos concentrations daily in Orestimba Creek for one year (1 May
52
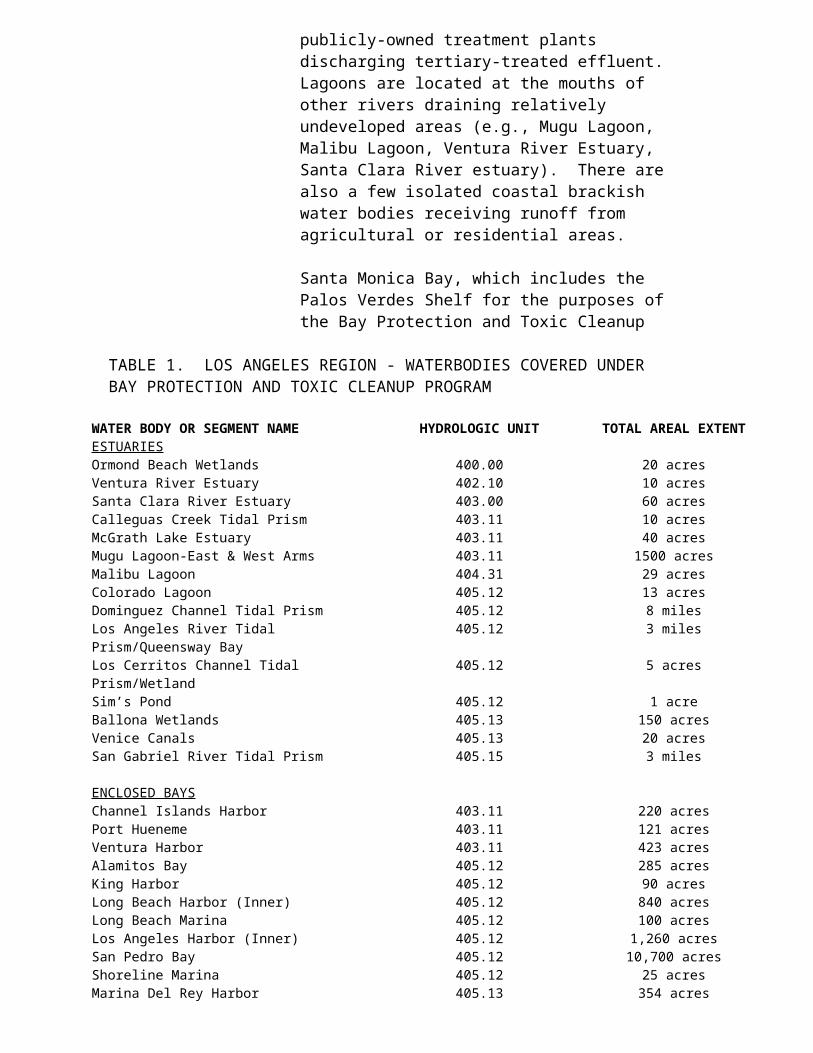
1996-30 April 1997). Orestimba Creek is about 25 miles south of the Delta in the San Joaquin Basin. The water body was selected for study as it’s water quality is thought to be typical of a local agriculturally dominated watershed. Diazinon and chlorpyrifos were measured at acutely toxic conditions to sensitive organisms like Ceriodaphnia for 50 days during the irrigation season (15 March-30 September; Dow AgroSciences, 1998). Forty-four of the fifty events (88%) were from elevated chlorpyrifos concentrations.
In conclusion, the frequency of toxicity from pesticides was not measured in agriculturally dominated back sloughs in the Delta. However, estimates of the frequency of toxicity from chlorpyrifos excursions in similar nearby watersheds range between 44 and 63 days per irrigation season. Similar frequency rates are expected in Delta backsloughs.
Bay Protection Toxic Cleanup Program guidance recommends that a site or situation be considered a candidate toxic hot spot for pesticides if toxicity in bioassays can be demonstrated, bioassay results are collaborated by both chemical analysis and TIEs, and the pesticide residues reoccur in a pattern of frequent pulses. On 23 October 1998 the Central Valley Regional Board reviewed the above data and unanimously concluded that Ulatis Creek, Paradise Cut, French Camp and Duck Sloughs fit the recommended criteria for listing as a high priority candidate toxic hot spot because of elevated concentrations of chlorpyrifos.
A. Areal Extent
The potential aquatic threat posed by chlorpyrifos in agricultural return flow is confined to the four previously named Creeks and Sloughs. The areal extent of the impairment may be up to 15 linear miles of waterway within the legal boundary of the Delta.
B. Sources
The only major use of chlorpyrifos in these four drainage basins is on agriculture. Detailed follow up studies are needed to determine the crop and precise agricultural practice which led to the off site movement.
C. Summary of Actions
As described previously, DPR and SWRCB both have statutory responsibilities for protecting water quality from adverse effects of pesticides. In 1997, DPR and the SWRCB signed a management agency agreement (MAA), clarifying these
53
responsibilities. In a companion document, the Pesticide Management Plan for Water Quality (Pesticide Management Plan), a process was outlined for protecting beneficial uses of surface water from the potential adverse effects of pesticides. The process relies on a four-stage approach: Stage 1 relies on education and outreach efforts to communicative pollution prevention strategies. Stage 2 efforts involve self-regulating or cooperative efforts to identify and implement the most appropriate site-specific reduced-risk practices. In stage 3, mandatory compliance is achieved through restricted use pesticide permit requirements, implementation of regulations, or other DPR regulatory authority. In stage 4, compliance is achieved through the SWRCB and RWQCB water quality control plans or other appropriate regulatory measures consistent with applicable authorities. Stages 1 through 4 are listed in a sequence that should generally apply. However, these stages need not be implemented in sequential order, but rather as necessary to assure protection of beneficial uses.
The U.S. EPA requires Regional Boards under the Clean Water Act to maintain 303(d) lists of impaired water bodies. In January 1998 the Central Valley Regional Board approved a revised 303(d) list of impaired water bodies and provided a schedule for the development of Total Maximum Daily Loads. The San Joaquin River and Delta-Estuary were listed, in part, because of chlorpyrifos impairments to water quality. The Regional Board ranked the impairment in both locations as a high priority and committed to the development of a TMDL by the year 2005. Components of a TMDL include problem description, numeric targets, monitoring and source analysis, implementation plan, load allocations, performance measures and feedback, margin of safety and seasonal variation and public participation. The TMDL waste load allocation, including an implementation schedule, must be adopted as a Basin Plan amendment by the Regional Board should compliance monitoring demonstrate that the problem has not been corrected.
Two activities are underway in the Central Valley to develop BMPs to reduce pesticide movement into surface water in irrigated agriculture. Each are summarized below.
U.C. Statewide Integrated Pest Management Project. In December 1997 the U.C. Statewide Integrated Pest Management Project was awarded a three year one million dollar grant by the CALFED Bay Delta program. Objectives of the grant are to (1) Identify alternate urban and rural BMP practices to prevent and reduce off site movement of diazinon and chlorpyrifos into surface water. Study is to consider both
54
summer and winter uses of the two insecticides. (2) Provide outreach and education on these new practices to the urban and agricultural community, and (3) design and initiate a monitoring program to assess the success of the new practices. Stanislaus County will be the focus of the study effort.
DowElanco The Registrant of chlorpyrifos has undertaken a multi year study in the San Joaquin Basin at Orestimba Creek to identify the specific agricultural use patterns and practices which contribute the majority of the off-site movement of their product into surface water. The study involves an evaluation of pesticide movement in both winter storms and in summer irrigation return flows. Objectives in subsequent years are to use the data to develop and field test BMPs to reduce off site chemical movement. The initial study is now complete. A report is expected soon.
Much similarity exits between agricultural practices in the San Joaquin Basin and the Delta. The results of the DowElanco work may be important in helping to identify the agricultural practices responsible for causing instream toxicity in the Estuary and also for developing successful BMPs to solve the problem. All promising solutions need to be field tested in Delta farmland.
D. Assessment of Actions Required
In January 1998 the Central Valley Regional Water Quality Control Board adopted a revised 303(d) list, ranked chlorpyrifos impairments in the San Joaquin River and in the Delta as high priority and committed to the development of a load reduction program by the year 2005. In October 1998 staff briefed the Regional Board on pesticide detection patterns in the Central Valley and requested guidance on whether these should be considered “frequent” as required by the Bay Protection Program in order to be considered as a candidate high priority hot spot. In addition, guidance was sought on whether to prepare cleanup plans under Bay Protection or seek a variance and prepare a control program under section 303(d) of the Clean Water Act. The Board unanimously decided that the pattern of pesticide detections observed in various Delta backsloughs were frequent and merited consideration as a high priority candidate Bay Protection Hot Spot. The Board also directed staff to seek a variance and begin pesticide regulation under section 303(d) of the Clean Water Act. Therefore, no further assessment of the actions required under the Bay Protection Plan are listed here.
E. An estimate of the total costs to develop the plan. 55

Not Applicable.
F. An estimate of recoverable costs from potential dischargers.
Not Applicable
G. Two year expenditure schedule identifying funds to implement the plan that are not recoverable from potential dischargers.
Not Applicable.
56

ReferencesBailey, H., J. Miller, M. Miller, L. Wiborg. 1997. Joint toxicity of diazinon and chlorpyrifos under the conditions of acute exposure to Ceriodaphnia. J. Env. Cont. Toxicol. 16(11):2304-2309
Bailey, H. L. Deanovic, K. Luhman, T. Shed, D. Hinton, and V. Connor. 1996. Pesticides in urban stormwater from the Sacramento Valley and San Francisco Bay Area. Poster presentation at State of the Estuary Conference. October 10-12 1996, San Francisco CA. p 51.
BIOS, 1995. BIOS for almonds. A practical guide to biologically integrated orchard system management. Community Alliance with family farmers foundation, Davis, CA.
Connor, V., C. Foe and L. Deanovic 1993. Sacramento River Basin biotoxicity Survey Results, 1988-90. Staff report, Central Valley Regional Water Quality Control Board, Sacramento, CA
Connor, V. 1994. Toxicity and diazinon levels associated with urban storm runoff. Staff memorandum, Central Valley Regional Water Quality Control Board, Sacramento, CA
Connor, V. 1995a. Status of urban storm runoff project. Staff memorandum, Central Valley Regional Water Quality Control Board, Sacramento, CA
Connor, V. 1995b. Algal toxicity and herbicide levels associated with urban storm runoff. Staff memorandum, Central Valley Regional Water Quality Control Board, Sacramento, CA
Connor, V. 1996. Chlorpyrifos in urban storm runoff. Staff memorandum, Central Valley Regional Water Quality Control Board, Sacramento, CA
Deanovic, L. H. Bailey, T.W. Shed and D. Hinton. 1996. Sacramento-San Joaquin Delta Bioassay monitoring report. 1993-94. First annual report to the Central Valley Regional Water Quality Control Board. Aquatic Toxicology Laboratory. University of California, Davis.
57

Deanovic, L. K. Cortright, K. Larson, E. Reyes, H. Bailey, D. Hinton 1997. Sacramento-San Joaquin Delta Bioassay monitoring report. 1994-95. Second Annual Report to the Central Valley Regional Water Quality Control Board. Aquatic Toxicology Laboratory. University of California, Davis.
Department of Pesticide Regulation, 1996. Pesticide use report, annual 1994. Information systems Branch, Department of Pesticide Regulation, Sacramento CA.
Domagalski, J. 1995. Nonpoint source pesticides in the San Joaquin River and California, inputs from winter storms: 1992-93. U.S. Geological Survey Open file report 95-165. 15p
Dow AgroSciences LLC, 1998. A monitoring study to characterize chlorpyrifos concentration patterns and ecological risk in an agriculturally dominated tributary of the San Joaquin River. Study ENV 96055 for Dow AgroSciences, 9330 Zionsville Road, Indianapolis, Indiana 46268.
Foe, C and V. Connor 1991a. San Joaquin bioassay results: 1988-90. Staff report, Central Valley Regional Water Quality Control Board, Sacramento, CA
Foe, C. and V. Connor 1991b. 1989 Rice season toxicity monitoring results. Staff report, Central Valley Regional Water Quality Control Board, Sacramento, CA
Foe, C. and R. Sheipline 1993. Pesticides in surface water from application on orchards and alfalfa during the winter and spring of 1991-92. Staff report, Central Valley Regional Water Quality Control Board, Sacramento, CA
Foe, C. 1995. Insecticide concentrations and invertebrate bioassay mortality in Agricultural return water from the San Joaquin Basin. Staff report, Central Valley Regional Water Quality Control Board, Sacramento, CA
Foe, C., L. Deanovic, D. Hinton. 1998. Toxicity identification evaluations of orchard dormant spray runoff. Central Valley Regional Water Quality Control Board staff report. Sacramento Office.
Fox, P and E. Archibald, 1997. Aquatic toxicity and pesticides in surface waters of the Central Valley. Final report. Prepared for the California Urban Water Agencies , Sacramento, CA.
58

Glotfelty, D., J. Seiber, L. Liljedahl 1987. Nature 325(6105):602-605
Glotfelty, D., C. Schomburg, M.M. McChesney, J. Sugebiel and J. Seiber. 1990. Chemosphere, 21:1303-1314.
Katznelson, R. and T. Mumley. 1997. Diazinon in surface water in the San Francisco Bay area: occurrence and potential impact. Report prepared for the Alameda Countywide Clean Water Program, Hayward, CA.
Kratzer, C. 1997. Transport of diazinon in the San Joaquin River Basin, California. U.S. Geological Survey open file report 97-411. Sacramento 22p.
Kuivila, K. and C. Foe. 1995. Concentration, transport and biological impact of dormant spray insecticides in the San Francisco Estuary, California. Env. Toxicol. and Chem. 14:1141-1150
Larsen, K., V. Connor, L. Deanovic and D. Hinton. 1998a. Sacramento River Watershed Program Toxicity Monitoring Results: 1996-1997. Prepared for the Sacramento Regional County Sanitation District by the U.C. Davis Aquatic Toxicology Laboratory.
Larsen, K., V. Connor, L. Deanovic and D. Hinton. 1998b. Sacramento River Watershed Program Toxicity Monitoring Results: 1997-1998. Prepared for the Sacramento Regional County Sanitation District by the U.C. Davis Aquatic Toxicology Laboratory.
Menconi M. and C. Cox 1994a. Hazard Assessment to the insecticide diazinon to aquatic organisms in the Sacramento San Joaquin River System. California Department of Fish and Game Env. Serv. Div. Administrative Report 94-2. Sacramento CA.
Menconi M. and A. Paul 1994b. Hazard Assessment to the insecticide chlorpyrifos to aquatic organisms in the Sacramento San Joaquin River System. California Department of Fish and Game Env. Serv. Div. Administrative Report 94-1. Sacramento CA.
Novartis Crop Protection, 1997. An ecological risk assessment of diazinon in the Sacramento and San Joaquin River Basins. Technical report 11/07 Environmental and Public affairs department Greensboro, NC
59
Ross, L. 1992. Preliminary results of the San Joaquin River study: winter 91-92. Staff memorandum to Kean Goh. Environmental Hazard Assessment Branch, Department of Pesticide Regulation. Sacramento CA.
Ross, L. 1993. Preliminary results of the San Joaquin River study: winter 92-93. Staff memorandum to Kean Goh. Environmental Hazard Assessment Branch, Department of Pesticide Regulation. Sacramento CA.
Ross, L. K. Bennett, K. Kim, K. Hefner and J. Hernandez 1997. Reducing dormant spray runoff for orchards. Staff report Environmental Monitoring and Pest Management Department of Pesticide Regulation Sacramento, CA.
Scanlin, J. and A. Cooper 1997. Outdoor use of diazinon and other insecticides in Alameda County. Report prepared for the Alameda County Flood Control and Water Conservation District, Hayward CA.
Scanlin, J. and A. Feng. 1997. Characterization of the presence and sources of diazinon in the Castro Valley Creek Watershed. Prepared for Alameda County Clean Water Program and Alameda County Flood Control and Water Conservation District.
Scanlin, J. and S. Gosselin 1997. Strategy to reduce diazinon levels in Creeks in the San Francisco Bay Area. Prepared for Alameda County Clean Water Program and Alameda County Flood Control and Water Conservation District.
U.S. EPA 1994. Short-term methods for estimating the chronic toxicity of effluents and receiving water to freshwater organisms. (3rd edition). Research and Development. EPA-600-4-91-002.
U.S. EPA 1998. TMDL Program Update. Presented at the U.S. EPA Water Quality Standards meeting in Philadelphia, PA. 24-27 August, 1998.
Future Needs1. Sediment More sediment bioassay and pore water chemical analysis needs to be conducted in the Delta and Estuary. This information would serve as baseline data for evaluating future BPTCP hot spots, in situ dredge operations, beneficial reuse of dredge spoils on delta island levees and creation of CALFED shallow water habitat.
2. Fish Tissue studies Several organochlorine compounds and mercury have been identified in multiple fish species inhabiting the Delta at concentrations in excess of FDA and the new U.S.
60
EPA fish tissue screening values (Montoya, 1991). A fish tissue study needs to be undertaken in the Delta in conjunction with the California Office of Environmental Health Hazard Assessment to ascertain whether additional fish advisories are warranted to protect human health. A similar study was recently completed in the Bay area using BPTCP funding (San Francisco Regional Water Quality Control Board, 1995).
The CALFED water quality program has identified mercury and several of these organochlorine compounds as contaminants of concern and is proposing actions to reduce their loading to the Estuary. Collection of fish tissue data would serve as baseline information to assess the future success of the CALFED program.
3. Water column fish toxicity tests The Sacramento River is about 80% of the freshwater flow into the Estuary. About half of all water samples collected since 1991 at Freeport on the lower Sacramento River at the entrance to the Delta have tested toxic in 7 day U.S. EPA (1994) fathead minnow bioassays (summarized in Fox and Archibald, 1997). The typical toxicological pattern is a 30-50% mortality rate within 7 days. Other characteristics that are important are: (1) similar toxicity has been observed throughout the watershed, (2) follow-up toxicity work performed under the RWP has indicated that pathogens are a potential causative agent for observed toxicity, (3) questions exist whether the pathogen based toxicity is representative of field conditions or is a testing artifact, and (4) the Regional Board has been given $400,000 by CALFED for follow-up studies to confirm that pathogens are the primary cause of the impairment.
4. Algal TIEs About 2000 metric tons of herbicide are used annually in the Central Valley and Delta and some compounds are regularly detected in chemical analysis of estuarine surface water (Edmunds et al., 1996). These include simazine, atriazine and diuron. The impact of herbicides on Delta primary production rates are not known. Furthermore, no algal TIE procedures have been developed to ascertain this.
On occasion water samples collected as part of the BPTCP which exhibited low algal primary production in the three species algal bioassay were eluted through a C8 resin column and retested. Often primary production rates in eluted samples were statistically enhanced, sometimes by as much as an order of magnitude, over unmanipulated ones (Deanovic et al., 1996; 1997). This suggests that a non-polar organic compound was the potential cause of the observed toxicity. Chemical analysis was performed on splits of these water samples and diuron was observed in several urban runoff samples at toxic concentrations (Connor, 1995b). However, no chemical was usually identified. Algal TIE procedures need to
61
be perfected for local diatom species (Delta algal community dominants) and estuarine surface water monitored to assess whether phytotoxins are present at concentrations impacting estuarine production.
62
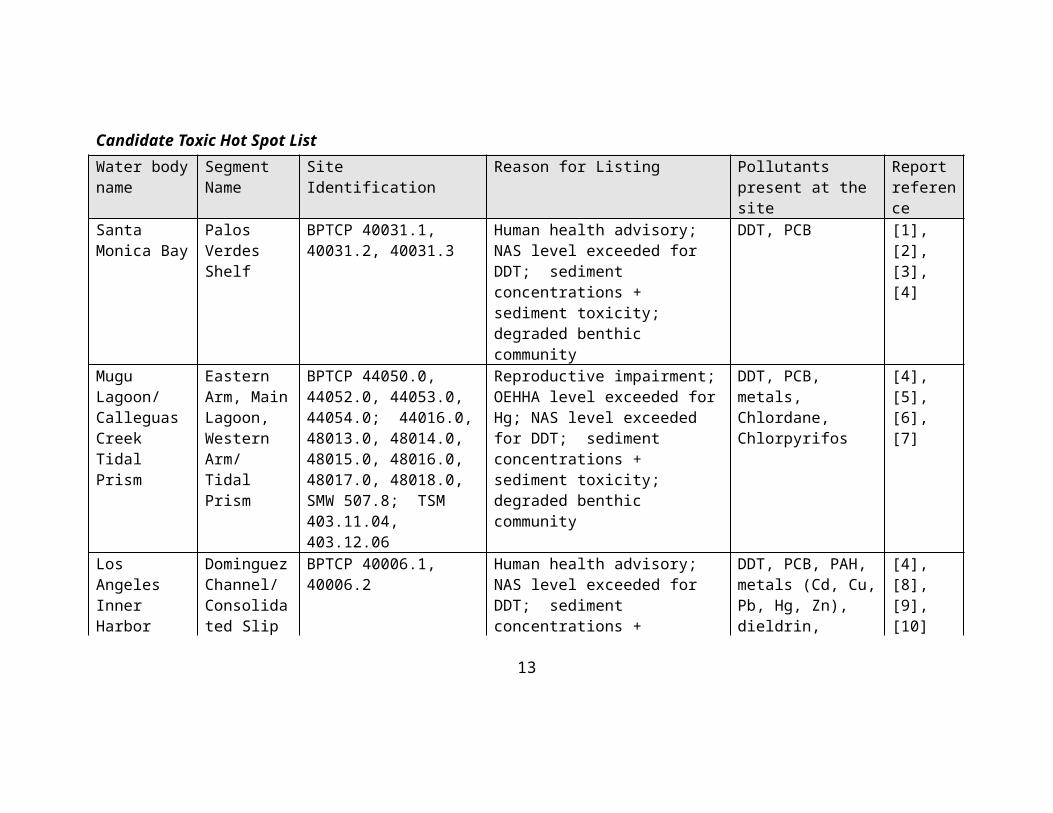
Sites of Concern (Sites that do not qualify as Candidate Toxic Hot Spots)
Water body Name Segment Name Site Identification Reason for Listing Pollutants present at the site
Report reference
Delta-Estuary Various Paradise Cut, Old River, Mcleod Lake
Aquatic life impairment
Diuron 1
Delta-Estuary Various Paradise Cut, Bishop Cut Aquatic life impairment
Carbofuran 1, 2
References
1. Deanovic, L. H. Bailey, T.W. Shed and D. Hinton. 1996. Sacramento-San Joaquin Delta Bioassay Report. 1993-94. First annual report to the Central Valley Regional Water Quality Control Board. U.C. Davis Aquatic Toxicology Laboratory. U.C. Davis, Davis, CA.
2. Foe, C. and R. Sheipline. 1993. Pesticides in surface water from applications on orchards and alfalfa during the winter and spring of 1991-92. Staff report. Central Valley Regional Water Quality Control Board, Sacramento, CA.
63
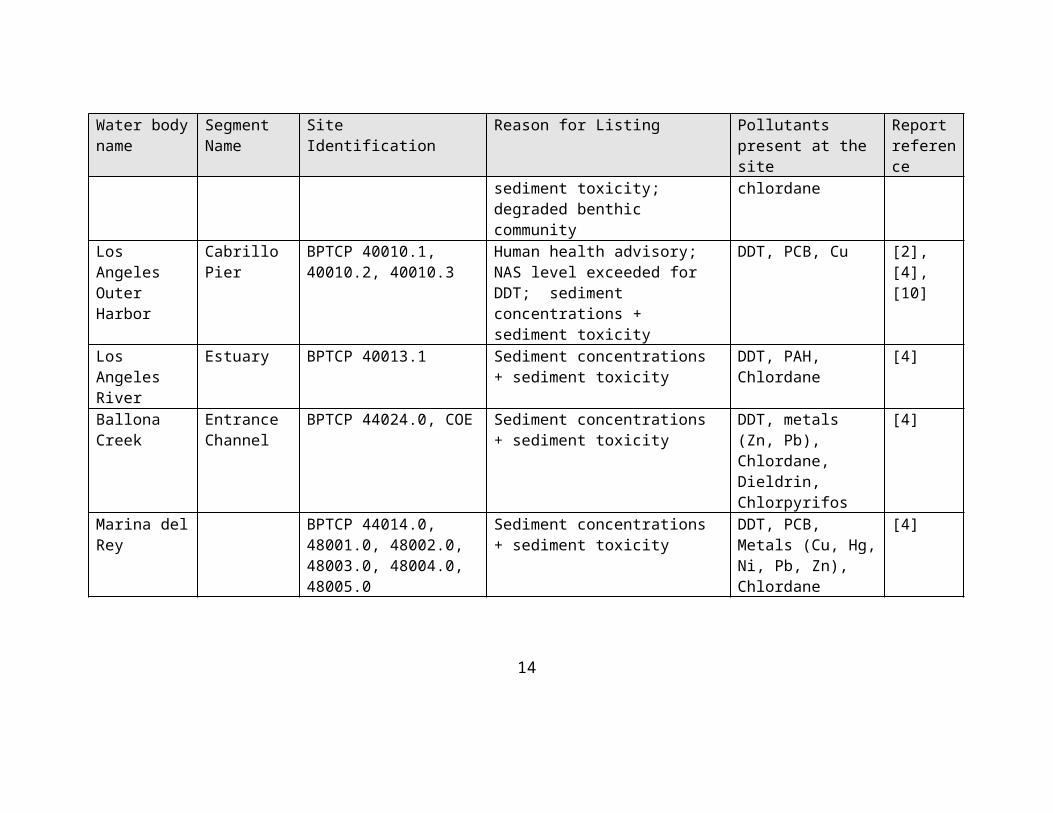
67
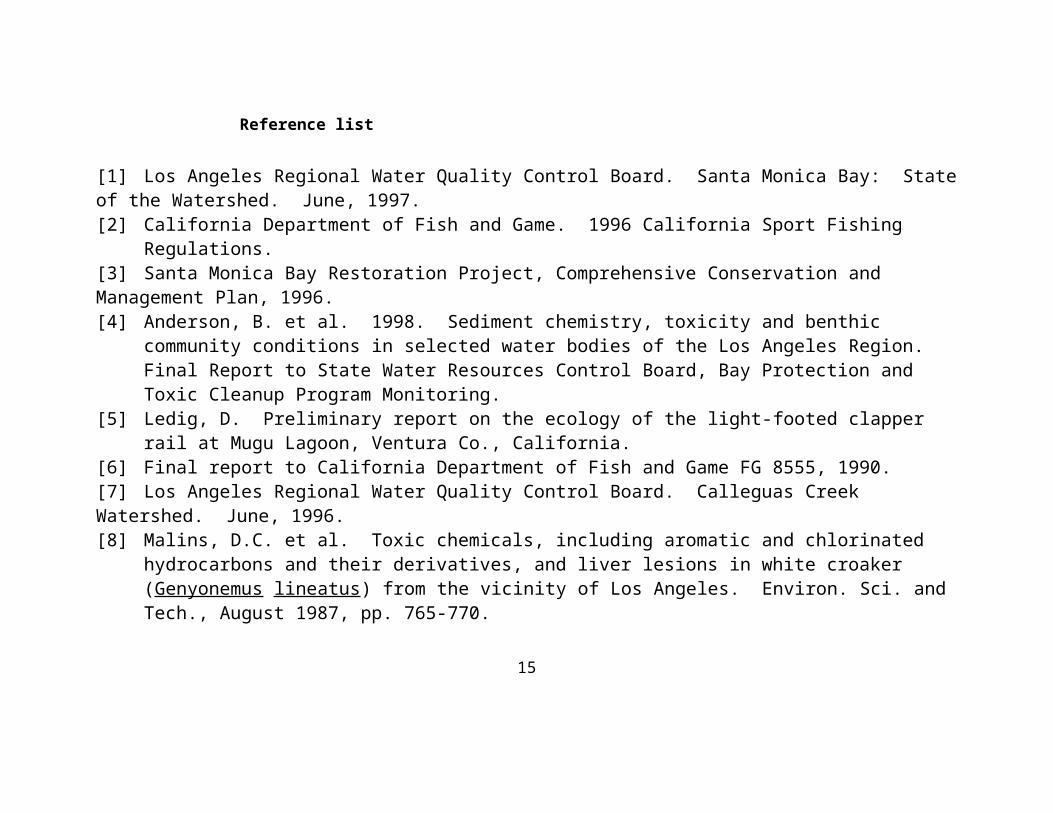
8
REGIONAL WATER QUALITY CONTROL BOARD, SANTA ANA REGION
REGIONAL TOXIC HOT SPOT CLEANUP PLAN
Region Description
The Santa Ana Region is the smallest of the nine regions in the state (2800 square miles) and is located in southern California, roughly between Los Angeles and San Diego. Although small geographically, the region’s four-plus million residents (1993 estimate) make it one of the most densely populated regions.
The climate of the Santa Ana Region is classified as Mediterranean: generally dry in the summer with mild, wet winters. The average annual rainfall in the region is about fifteen inches, most of it occurring between November and March.
2
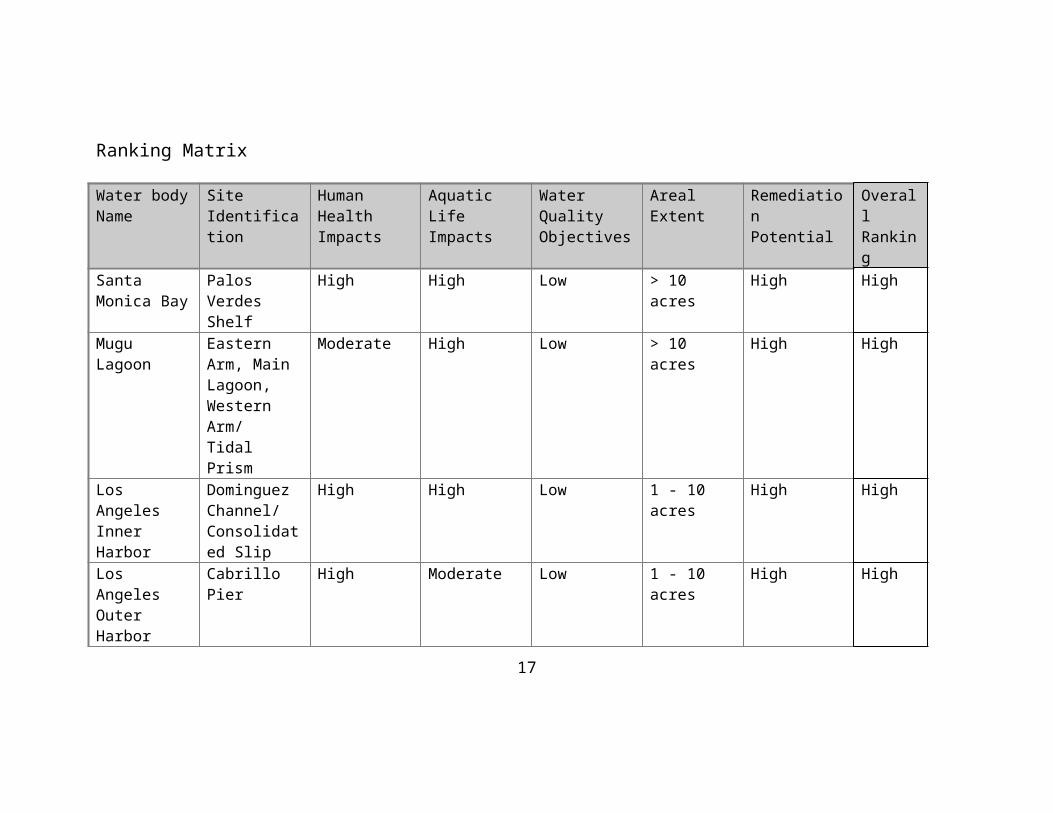
Candidate Toxic Hot Spot List
Water body name Segment Name Site Identification Reason for Listing Pollutants present at the site
Report reference
Anaheim Bay Naval Reserve BPTCP Site # 82030, Latitude - 33,44,12N, Longitude - 118,05,31W
Sediment toxicity Chlordane, DDE 3, 4
Seal Beach NWR Navy Marsh 82001, 33,43,88N, 118,04,72W Sediment toxicity DDE 3, 4, 6Seal Beach NWR Bolsa Ave. 82023, 33,44,65N, 118,04,66W Sediment toxicity Arsenic 3, 4Seal Beach NWR Middle Reach 82002, 33,44,44N, 118,04,40W Sediment toxicity Arsenic 3, 4Seal Beach NWR Left Reach 82040, 33,44,26N, 118,05,18W Sediment toxicity DDE 3, 4Huntington Harbour Upper Reach 80028, 33,42,80N, 118,03,67W Sediment toxicity Chlordane, DDE,
Chlorpyrifos3, 4, 5, 6
Bolsa Chica Ecological Reserve
82039, 33,41,75N, 118,02,76W Sediment toxicity DDE 3, 4
Upper Newport Bay Narrows 85001, 33,38,083N, 117,53,454W Sediment toxicityExceeds objectives
Chlordane, zinc, DDE
1, 3, 4
Lower Newport Bay Rhine Channel 85013, 33,36,721N, 117,55,670W Sediment toxicity Exceeds objectives
Arsenic, copper, lead, mercury, zinc, DDE, PCB, TBT
1, 2, 3, 4, 6
Lower Newport Bay Newport Island 85014, 33,37,251N, 117,56,174W Exceeds objectives Copper, lead, mercury, zinc, chlordane, DDE, PCB, TBT
1, 4
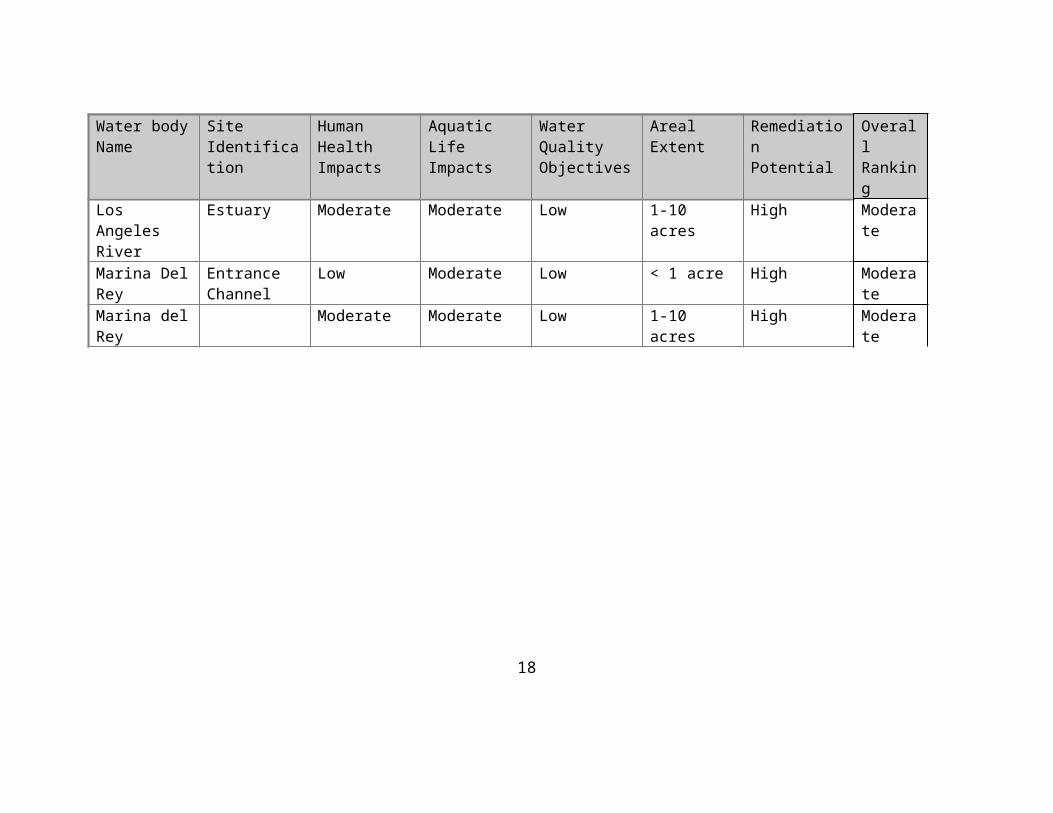
References1. Anderson, B., Hunt, J., Tudor, S., Newman, J., Tjeerdema, R.,
Fairey, R., Oakden, J., Bretz, C., Wilson, C., La Caro, F., Stephenson, M., Puckett, M., Long, E., Fleming, T., Summers, K. 1996. Chemistry, Toxicity and Benthic Community Conditions in Sediments of the Southern California Bays and Estuaries. Report to the California State Water Resources Control Board, Environmental Protection Agency, National Oceanic and Atmospheric Administration, California Department of Fish and Game, University of California, Santa Cruz, and the Moss Landing Marine Laboratories. 140 pp + appendices.
2. California Regional Water Quality Control Board - Santa Ana Region. 1990. Evaluation of Boat Yard Waste Treatment Technologies Within the Santa Ana Region. 117 pp.
3. Moore, B., Klein, E., Hines, D., Au, M., Boon, R., Ashby, K., Nguyen, D. 1997. Orange County NPDES Stormwater Program Annual Progress Report 1997 (NPDES Permit CAS618030). Report to the Santa Ana Regional Water Quality Control Board. 60 pp. + appendices.
4. Phillips, B., Anderson, B., Hunt, J., Newman, J., Tjeerdema, R., Wilson, C., Sapudar, R., Long, E., Stephenson, M., Puckett, M., Fairey, R., Oakden, J., Dawson, S., and Smythe, H. 1998. Sediment Chemistry, Toxicity, and Benthic Community Conditions in Selected Water Bodies of the Santa Ana Region. Sacramento, CA. 104p + appendices.
5. Sapudar, R., Wilson, C., Reid, M., Long, E., Stephenson, M., Puckett, M., Fairey, R., Hunt, J., Anderson, B., Holstad, D., Newman, J., Birosik, S., Smythe, H. 1994. Sediment Chemistry and Toxicity in the Vicinity of the Los Angeles and Long Beach Harbors. Final Report to the California State Water Resources Control Board and the National Oceanic and Atmospheric Administration. 81 pp + appendices.
6. State Water Resources Control Board. 1998. State Mussel Watch Program Monitoring Database. Computer file.
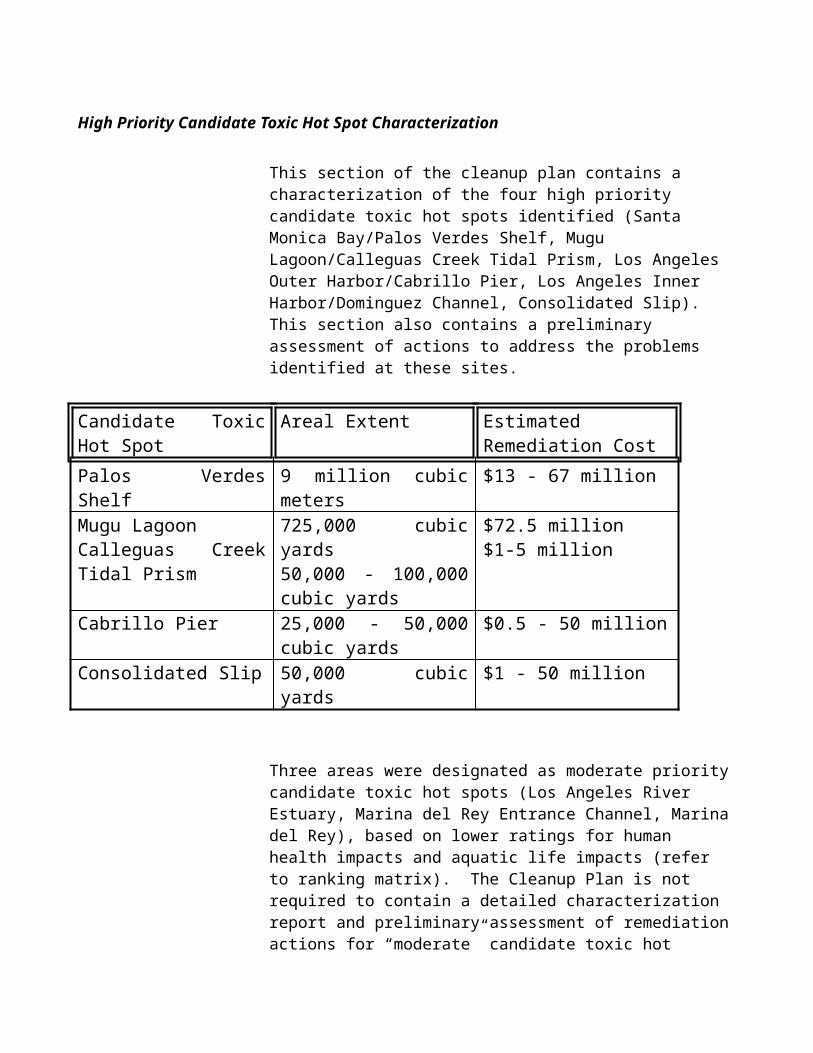
Ranking Matrix
Water body Name Site Identification Human Health Impacts
Aquatic Life Impacts
Water Quality Objectives
Areal Extent Remediation Potential
OverallRanking
Anaheim Bay - Naval Reserve
BPTCP Site # 82030, Latitude - 33,44,12N, Longitude - 118,05,31W
No Action Moderate No Action 1 to 10 acres Moderate Moderate
Seal Beach NWR - Navy Marsh
82001, 33,43,88N, 118,04,72W Low Low Low 1 to 10 acres Moderate Low
Seal Beach NWR - Bolsa Ave.
82023, 33,44,65N, 118,04,66W No Action Low No Action 1 to 10 acres Moderate Low
Seal Beach NWR - Middle Reach
82002, 33,44,44N, 118,04,40W No Action Low No Action 1 to 10 acres Moderate Low
Seal Beach NWR 82040, 33,44,26N, 118,05,18W No Action Low No Action 1 to 10 acres Moderate LowHuntington Harbour -Upper Reach
80028, 33,42,80N, 118,03,67W Low Low Low 1 to 10 acres Moderate Low
Bolsa Chica Ecological Reserve
82039, 33,41,75N, 118,02,76W No Action Low Low 1 to 10 acres Moderate Low
UNB - Narrows 85001, 33,38,083N, 117,53,454W No Action Moderate Low 1 to 10 acres Moderate ModerateLNB - Rhine Channel 85013, 33,36,721N, 117,55,670W Low High Moderate 1 to 10 acres High HighLNB - Newport Island 85014, 33,37,251N, 117,56,174W No Action High Low 1 to 10 acres High Moderate
Best professional judgment was used to assign ranks to several sites for some of the ranking criteria.
Human Health ImpactsIf tissue residues from aquatic organisms contained elevated levels, such as exceeding Elevated Data Levels (EDLs) based on State Toxic Substances Monitoring Program or Mussel Watch data, but did not exceed FDA/DHS action levels or U.S. EPA screening levels, the site was ranked “Low”. The medium and high ranks are defined in the Water Quality Control policy for Guidance on the Development of Regional Toxic Hot Spot Cleanup Plans (SWRCB, 1998).
Water Quality ObjectivesDue to the absence of numeric objectives for toxic substances for Enclosed Bays and Estuaries contained in the Water Quality Control Plan for the Santa Ana River Basin (Basin Plan) (CRWQCB-SAR, 1995), best professional judgment was used to interpret the following narrative standards:
Toxic substances shall not be discharged at levels that will bioaccumulate in aquatic resources to levels which are harmful to human health.The concentrations of toxic substances in the water column, sediments or biota shall not adversely affect beneficial uses.
Water column and sediment chemistry data and tissue residue data from aquatic organisms were used to assign the rank based on the frequency of exceedance of the objective. The water column chemistry data were compared to objectives formerly established by the Enclosed Bays and Estuaries Plan and sediment chemistry data were compared to sediment screening levels developed by NOAA (Long and Morgan, 1990, Long et al, 1995) and the State of Florida (MacDonald, 1994. The tissue residue data from aquatic organisms were compared against FDA/DHS action levels or U.S. EPA screening levels. The ranks were: Exceeded regularly (High), occasionally exceeded (Moderate), infrequently exceeded (Low).
Areal Extent of Toxic Hot SpotDetermination of areal extent of sites was based on the site location, site hydrology, the distribution of toxic substances between sites, potential dischargers in the area, and site history. There has not been a thorough site characterization at any of the sites that would produce a definitive areal extent measurement.
Natural Remediation PotentialThe natural remediation potential of the sites was based on the site location, site hydrology, the distribution of toxic substances between sites, and site history.
High Priority Candidate Toxic Hot Spot Characterization
Lower Newport Bay - Rhine Channel
A. An assessment of the areal extent of the Toxic Hot Spot (THS).
Between 1.5 and 2.5 acres.
B. An assessment of the most likely sources of pollutants (potential discharger).
The area was historically a small inlet in the larger marsh system of Lower Newport Bay. In 1918, the first boat yard was built on the channel. A fish cannery was built in 1919, but was used predominately after 1935. The dredging of Lido Channel South occurred in 1920, with large scale dredging of Lower Newport Bay occurring in 1934-35 to provide safe harbor navigation. During the 1940’s and 1950’s the channel supported boat building activity for both the US Navy and the Mexican Navy during World War II and the Korean War. The boat yards produced midsize boats, mainly mine sweepers, subchasers, and rescue boats in the 45 to 135 ft. length range. In 1964, there were 19 boat yards operating in the Lower Bay. Currently six boat yards operate along Rhine Channel (see Figure 1). The boat yards are currently regulated by General Waste Discharge Requirements (see Section C). Historic practices at the boat yards are the most likely source of pollutants in Rhine Channel, although a thorough characterization of the depth of pollution has never been undertaken. An investigation of

the extent of pollution depth and area would help to either eliminate or include likely historic sources.
C. A summary of actions that have been initiated by the Regional Boards to reduce the accumulation of pollutants at existing THSs and to prevent the creation of new THSs.
The Regional Board currently regulates the discharge of process wastewater and stormwater from all boat yard facilities in Lower Newport Bay and Huntington Harbour through General Waste Discharge Requirements (Order No. 94-26, as amended by Order No. 95-60 and 96-52). The boat yards were initially issued individual NPDES permits beginning in 1975. The main feature of Order No. 94-26, as amended, is the elimination of the discharge of process wastewater in accordance with the requirement of the Water Quality Control Policy for the Enclosed Bays and Estuaries of California. Process wastewater is defined by the Order to include the first one tenth of an inch of rain that is proceeded by seven days of dry weather. This permit requirement was to be implemented by April, 1996. Presently, five of the six boat yards in Rhine Channel have complied with this requirement.
The Newport Bay watershed is one of two watersheds within the Santa Ana Region that are the focus of intensive watershed management activities. The expected outcomes of this planning and management effort includes a further refinement of water quality problems, both in the Bay and watershed, the development and implementation of a watershed management plan that addresses these problems, and mechanisms for measuring the success of the plan and improvements in water quality.
Additionally, Lower Newport Bay is currently listed as water quality limited for metals and pesticides pursuant to Section 303(d) of the Clean Water Act. A Total Maximum Daily Load (TMDL) for metals and pesticides will be developed by the Regional Board to address this impairment. The control of pollutant sources occurring in Rhine Channel will be a component of the TMDLs.
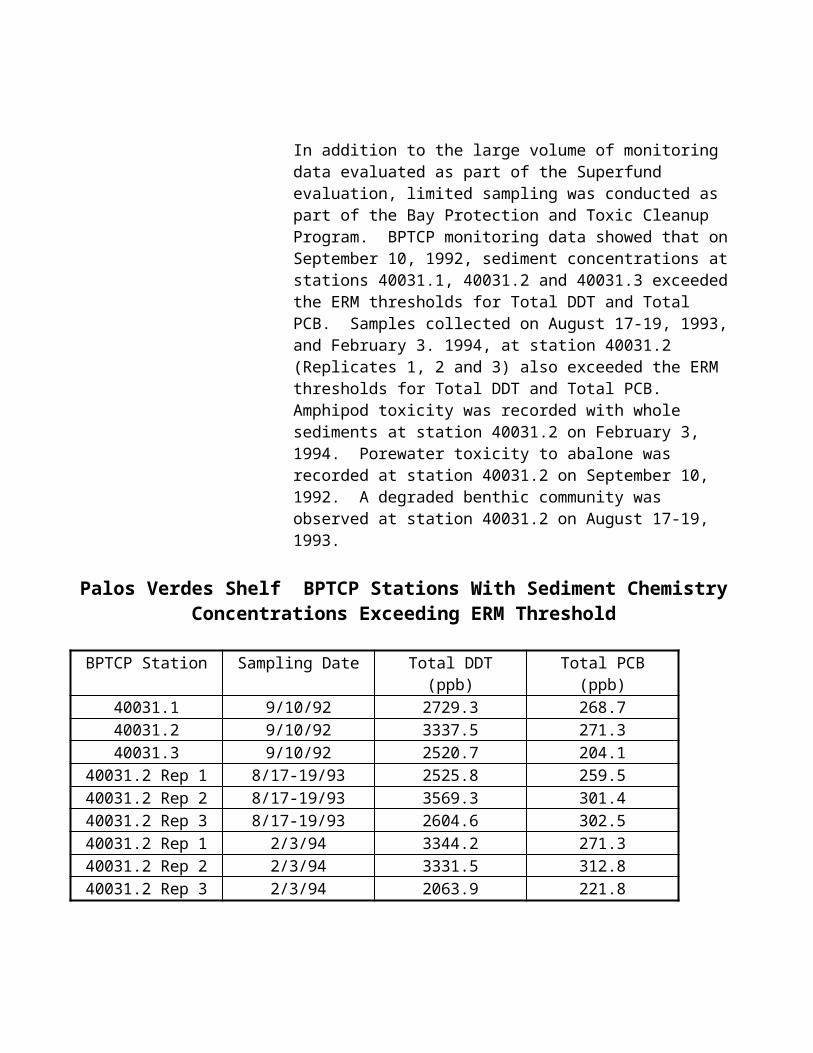
D. Preliminary Assessment of Actions required to remedy or restore a THS, including recommendations for remedial actions.
There are four options for cleanup of the Rhine Channel THS. These include ex-situ treatment, chemical separation, immobilization, and dredging. The ex-situ treatment of pollution at Rhine Channel could include either chemical separation or immobilization. Chemical separation would separate the weakly bound metals from the sediment, and the clean sediment would then be disposed. The problem with this treatment is the limited application of the method, the need for further treatment systems integration for a complete separation, and the need for a treatment site. This last factor is significant due to the urban setting of the site. Significant transportation costs would be incurred by hauling the sediment to a non-local treatment area.
Immobilization of trace metals by chemical fixation is another possible treatment. This treatment has been used extensively for solid wastes. A limitation with this treatment is the high moisture content of the sediment in Rhine Channel and the need for a treatment site.
The capping or containment of the site is not an option due to the shallow depth of Rhine Channel. Capping would effectively eliminate any navigation in the channel and adversely affect the economic activities of business that use the channel (i.e., the boatyards).
The only other viable treatment is dredging and off-site disposal. Dredging of the site would allow for a confined remediation area with a low potential for the off-site migration of toxic substances through the use of siltation curtains. It would also allow for the continued use of the channel without a significant disruption of access or business activity.
10
E. An estimate of the total cost and benefits of implementing the cleanup plan.
The dredging of Rhine Channel would involve the removal of approximately 23,000 cubic yards of sediment (2 acres x 7 feet deep). This is a rough estimate because there has not been a thorough characterization of the areal extent of pollution. These amounts should be considered conservative and preliminary. Additional costs could be incurred if alternative disposal transportation is required.
11
Sediment RemovalHydraulic dredge (23,000 cy @ $10 cy) $230,000Silt screen (material, labor)
(600 ft @ $3 ft) $1,800
Sediment TransportTruck (23,000 cy @ $200 cy) $4,600,000
Sediment DisposalClass I disposal facility (23,000 cy @ $250 cy) $5,750,000(Hazardous waste)
Total $10,581,800
The benefits of implementing the cleanup plan are related to the beneficial uses of Lower Newport Bay. The beneficial uses of Lower Newport Bay are: Navigation (NAV); Water Contact Recreation (REC1); Non-contact Water Recreation (REC2); Commercial and Sportfishing (COMM); Wildlife Habitat (WILD); Rare, Threatened or Endangered Species (RARE); Spawning, Reproduction, and Development (SPWN); Marine Habitat (MAR); and Shellfish Harvesting (SHEL). The benefits would be improved ecosystem conditions, more abundant wildlife, lower concentrations of pollutants in water and sediment, lower concentrations of pollutants in fish and shellfish tissue, and an undegraded benthic community.
F. An estimate of recoverable costs from potential dischargers.
The recoverable costs from dischargers would be insufficient to perform cleanup activities. The boatyard operations are small businesses, with a few having financial difficulty implementing control measures currently required by the Regional Board. If the Regional Board were to issue Cleanup and Abatement Orders to the boatyards in an attempt to recover costs for the proposed cleanup activities, it is envisioned that several of the boatyards would claim bankruptcy rather than participate. It is estimated that recoverable cleanup costs from dischargers would be from 1 to 10 %.
12

G. A two-year expenditure schedule identi fying funds to implement the plans that are not recoverable from potential dischargers.
Year 1.
The activities conducted during the first year would be further site pollution characterization. These activities would include extensive sampling to determine the areal extent, depth, and severity of pollution in Rhine Channel. The cost would be approximately $900,000.
Year 2.
The activities conducted during the second year would be the development of an engineering report and operating plan for the cleanup site, obtaining the appropriate permits (e.g., 401/404), and producing appropriate environmental documentation (e.g., NEPA/CEQA). These services would be provided by a consulting firm. This would cost approximately $500,000.
ReferencesCalifornia Regional Water Quality Control Board - Santa Ana Region (CRWQCB - SAR), 1995. Water Quality Control Plan for the Santa Ana River Basin. 7 sections + appendices.
Long, E. R., and L. Morgan, 1990. The potential effects of sediment-sorbed contaminants tested in the National Status and Trends Program. NOAA Technical Memorandum NOS OMA 52.
Long, E. R., D.D. MacDonald, S. L. Smith, and F. D. Calder, 1995. Incidence of adverse biological effects within ranges of chemical concentrations in marine and estuarine sediments. Environmental Management 19:81-97.
13
MacDonald, D.D., 1994. Approach to assessment of sedimentquality in Florida coastal waters. Volumes I and II. Preparedfor the Office of Water Policy, Florida Department of Environmental Regulation. MacDonald Environmental Services, Ltd., Ladysmith, British Columbia.
State Water Resources Control Board (SWRCB), 1998. Water Quality Control Policy for Guidance on the Development of Regional Toxic Hot Spot Cleanup Plans. 43 pp.
Future Needs
Several sites in the Region need additional characterization work to either include or exclude them from Candidate Toxic Hot Spot designation. These sites are listed in the following table.
14
Sites of Concern (Sites that do not qualify as Candidate Toxic Hot Spots)
Water body name Segment Name Site Identification Reason for Listing Pollutants present at the site
Report reference
Huntington Harbour Middle Reach BPTCP Site # 80027, Latitude - 33,42,80N, Longitude - 118,03,67W
Sediment toxicity(Not recurrent)
Chlordane, DDE 3, 4, 5
Huntington Harbour Launch ramp 82005, 33,43,61N, 118,03,91W Sediment toxicity(Not recurrent)
Lead, zinc, DDE 3, 4
Bolsa Bay Mouth Of EGGW
82024, 33,42,40N, 118,03,35W Sediment toxicity(Not recurrent)
Unknown 3, 4
Lower Newport Bay Arches Drain 85015, 33,37,199N, 117,55,697W Sediment toxicity(Not recurrent)
Chlordane, DDE, TBT
1, 4
15
9
REGIONAL WATER QUALITY CONTROL BOARD, SAN DIEGO REGION
REGIONAL TOXIC HOT SPOT CLEANUP PLAN
Region DescriptionThe San Diego Region is located along the coast of the Pacific Ocean from the Mexican border to north of Laguna Beach in Orange County. The Region is rectangular in shape and extends approximately 80 miles along the coastline and 40 miles east to the crest of the mountains. The Region includes portions of San Diego, Orange, and Riverside Counties. Weather patterns are Mediterranean in nature with an average rainfall of approximately ten inches per year occurring along the coast. Almost all of the rainfall occurs during wet cool winters. The Pacific Ocean generally has cool water temperatures due to upwelling.
The population of the Region is heavily concentrated along the coastal strip. There are coastal lagoons at river mouths to the ocean, and two dredged small craft harbors, Dana Point and Oceanside Harbor in the north part of the Region. In the southern part two harbors, Mission Bay and San Diego Bay, support major recreational vessel and ship traffic. San Diego Bay is long and narrow, 15 miles in length averaging approximately one mile across. A deep-water harbor, the Bay has experienced waste discharge from former sewage outfalls, industries, and urban runoff. Up to 9,000 vessels may be moored in the Bay. San Diego Bay also hosts four major U.S. Navy bases with approximately 50 surface ships and submarines home-ported in the Bay.
Candidate Toxic Hot Spot List
Water Body Name
Segment Name
Site Identification Reason for Listing 1
Pollutants Present at the Site
Report Reference
San Diego Bay North Bay Between “B” Street and Broadway piers, San Diego(Stations 93205, 93206)
5 PAHs, total chemistry
1
San Diego Bay Central Bay Switzer Creek, San Diego(Station 90039)
2 Chlordane, Lindane, DDT, total chemistry
1, 3
San Diego Bay Central Bay Foot of Evans and Sampson Streets, San Diego(Stations 90020, 93211)
5 PCBs, antimony, copper, total chemistry
1
San Diego Bay Central Bay Chollas Creek, San Diego 2
(Stations 90006, 93212, 93213)5 Chlordane, total
chemistry1
San Diego Bay Central Bay Seventh Street Channel/Paleta Creek, Naval Station(Stations 90009, 93227, 93228)
2, 5 Chlordane, DDT, total chemistry
1
1 See candidate toxic hot spot definitions on page No. 2 is repeat amphipod sediment toxicity; No. 5 is multiple degraded benthic communities.
2 The Chollas Creek watershed is one of two high-priority San Diego Region Total Maximum Daily Load (TMDL) projects proposed to be completed in the year 2000.
Reference listState Water Resources Control Board. 1996 Chemistry, Toxicity and Benthic Community Conditions in Sediments of the San Diego Bay Region. Final Report.
State Water Resources Control Board. 1997 Chemistry, Toxicity and Benthic Community Conditions in Sediments of Selected Southern California Bays and Estuaries. Final Report.
State Water Resources Control Board. 1998 Chemistry, Toxicity and Benthic Community Conditions in Sediments of the San Diego Bay Region. Addendum Report.
Ranking Matrix
Water body Name
Site Identifica-tion
Human Health Impacts
Aquatic Life Impacts
Water Quality Objectives
Areal Extent Remedia-tion Potential
Overall Ranking
San Diego Bay
Seventh Street Channel/Paleta Creek, National City
No action High No action 1 to 10 acres High High
San Diego Bay
Between “B” St. and Broadway piers, San Diego
No action Moderate No action 1 to 10 acres High Moderate
San Diego Bay
Switzer Creek, San Diego
No action Moderate No action 1 to 10 acres High Moderate
San Diego Bay
Foot of Evans and Sampson Streets, San Diego
No action Moderate No action 1 to 10 acres High Moderate
San Diego Bay
Chollas Creek, San Diego
No action Moderate No action 1 to 10 acres High Moderate
High Priority Candidate Toxic Hot Spot
Seventh Street Channel, National City
A. Assessment of the Areal Extent of the THS
Approximately three acres appear affected (Stations 90009, 93227, 93228); however, the area affected could be substantially larger or smaller. Dredging activities could have occurred in this area since San Diego Bay was sampled during the period 1992 to 1994. If so, this area or parts of this area may no longer be considered for designation as a candidate toxic hot spot.
B. Assessment of the Most Likely Sources of Pollutants(Potential Discharger)
Because benthic community analysis does not directly measure cause and effect relationships between chemicals and fauna living in the sediment, it is possible that some of the degraded benthic communities could have been caused by physical disturbance of the bottom from tug and ship propellers, or from disturbance caused by recent dredging.
Persistent chemicals, such as PAHs and Chlordane, could also have caused benthic community degradation and sediment toxicity at the Seventh Street Channel. Possible sources include industrial activities, atmospheric fallout, pesticides from lawns, streets, and buildings, and runoff from pest control operations.
C. Summary of Actions That Have Been Initiated by theRWQCB to Reduce the Accumulation of Pollutants at Existing THSs and to Prevent the Creation of New THSs
The following programs address water quality near the Seventh Street Channel. It is unknown whether any of the organizations or facilities named below have discharged chemical wastes at levels which could have caused the accumulation of pollutants at existing toxic hot spots.
NPDES Permits for the Naval Station. The Naval Station Graving Dock, which lies midway between Chollas Creek and the Seventh Street Channel and a half mile north of the Seventh Street Channel, currently is covered by its own National Pollutant Discharge Elimination System (NPDES) permit. Discharges from Navy industrial facilities are currently covered under the State Water Resources Control Board General Industrial Storm Water Permit. The Regional Board may issue NPDES permits for discharges from other Navy activities adjacent to San Diego Bay.
NPDES Municipal Storm Water Permit. In 1990, the Regional Board issued NPDES storm water permits to municipalities responsible for civilian areas, including those tributary to San Diego Bay. Activities underway in the Paleta Creek watershed by the City of National City include public education, public service announcements on television, and street sweeping. The storm water permit is now being revised.
Pacific Steel site. During the 1980s, the Regional Board took enforcement action against Pacific Steel, an automobile recycler. The company, which was located inland of the Seventh Street Channel, maintained a large “fluff” pile of non-ferrous waste. Runoff from the fluff pile was prohibited by the Regional Board from draining to San Diego Bay. The fluff pile was subsequently removed and the site cleaned up.
Military cleanups. The Regional Board has participated in Department of Defense Environmental Response Program (DERP) and Navy Installation Restoration (IR) activities to close former military hazardous waste sites on land adjacent to the Bay. Several disposal sites are located around the Seventh Street Channel.
D. Preliminary Assessment of Actions Required to Remedy or Restore a THS to an Unpolluted Condition Including Recommendations for Remedial Actions
The following discussion applies only to the limited area of three acres estimated to be contaminated. It is
possible that a larger or smaller area could have been contaminated by industrial wastes.
Section 13360 of the Porter-Cologne Water Quality Control Act prohibits regional boards, the State Board, and the courts from designating the means of compliance with the California Water Code. For this reason, the options presented below are not meant to influence the ultimate solution, but are presented to comply with Bay Protection and Toxic Cleanup Program legislative requirements and to provide a starting point for discussion. The Regional Board could require potential responsible parties to submit CWC Section 13267 technical reports documenting the amounts and types of wastes discharged.
Regional Board procedures. A first step could be to convene a meeting between potential responsible parties to discuss the data and to receive comments and information about the site. After review by staff of available information, the Regional Board Executive Officer could ask potential dischargers to submit technical reports. Subsequently, the Board could require potential responsible parties to sample the site and surrounding area to document in detail the areal extent of the site and to identify specific pollutants at the site. Only after extensive review of all available information would the Regional Board require remediation actions.
Persistence of wastes at this site. The chemical wastes found in the Seventh Street Channel and at the mouth of Paleta Creek, the pesticides Chlordane and DDT, and the class of polynuclear aromatic hydrocarbon (PAH) “ring” compounds derived from fossil fuels, are known to persist in nature. These organic chemicals may be resistant to treatment or natural remediation processes such as oxidation, microbial degradation, and photolysis. For this reason, natural recovery or in situ treatment may not be feasible. In-place capping is presumed to be infeasible because of frequent vessel traffic in this area of the Bay. Two options which may be feasible are dredging followed by placement in an upland confined disposal facility, and dredging followed by contained aquatic disposal. There is precedent for both options in San Diego Bay.
Dredging of contaminated bottom material has occurred at boat yards in north San Diego Bay and at the 24th Marine Terminal in the south Bay. A submerged aquatic disposal site has been completed in the north Bay off several storm drains known to have contributed PCBs to the Bay.
Dredging and upland disposal. Stations 90009, 93227, and 93228 are located in a heavily-used dredged channel frequented by barges, boats, and tugs. Navigation charts show depths of between 18 to 21 feet at mean lower low water, although the depths may be shallower or deeper due to sedimentation or recent dredging. There may be suitable sites on land nearby to build settling ponds to receive hydraulic dredge spoils. Sediment removal activities could include clamshell dredging or hydraulic dredging, and transportation to a suitable disposal site by barge, rail, or truck, or to settling ponds next to the Channel.
Dredging and contained aquatic disposal. Another method could involve dredging a disposal site at another location in San Diego Bay, depositing the contaminated dredge spoil from the candidate toxic hot spot site, and capping the site with suitable material. The following conditions would have to be met if this option were to be implemented:
Clean Water Act Section 404 dredging permits would be obtained from the U.S. Army Corps of Engineers for the contaminated site and for the aquatic disposal site State waste discharge requirements would be obtained from the Regional Board for the disposal site. The cap would provide adequate coverage to prevent the spread of contaminated material. Burrowing organisms would be prevented from mixing polluted sediments (i.e., bioturbation must not occur). The contaminated material covered would be able to support the cap. The bottom slope would be able to support the cap during seismic events. The cap would be well marked and protected against erosion or destruction from anchors, propellers, and strikes by vessels. The site would be located away from major navigation lanes. The exact location of the site would be noted on maps, charts, and deeds.
E. Estimate of the Total Cost to Implement the Cleanup Plan
This preliminary cost list is based on the schedule found in the 1997 guidance document. High and low costs are provided. It is assumed that if ocean disposal at the 100 fathom site is chosen, the U.S. Army Corps of Engineers would require extensive testing of the material removed from the Seventh Street Channel to be transported to the LA-5 site 6 miles from Pt. Loma. Costs were not able to be estimated for California Environmental Quality Act (CEQA) compliance, Section 404 dredging permit and state waste discharge requirements acquisition, or sampling to determine the areal extent of the candidate toxic hot spot.
Costs for dredging and upland disposal. High costs: Assume that 14,520 square yards (three acres) need remediation and that sediment to a depth of one yard would be removed. The 14,520 cubic yards of dredge spoil would then be placed on a barge, offloaded onto trucks, and transported to a suitable upland landfill. Low costs: Assume that the wastes are transported to a Class III site.
Comparison of High and Low Costs for Dredging and Upland Disposal
High Cost per Cubic Yard Low Cost per Cubic Yard
Clamshell dredging $10 Clamshell dredging $10Unloading from barge TBD Unloading from barge TBDTransport by truck 200 Transport by truck 200Disposal at Class I site 300 Disposal at Class III site 30
Sub total per cubic yard $510 Sub total per cubic yard $240
14,520 cubic yards X $510 = $7,405,200 (not including permits)
14,520 cubic yards X $240 = $3,384,800 (not including permits)
Costs for dredging and contained aquatic disposal. High costs: Assume that 14,520 square yards (three acres) need remediation and that sediment to a depth of one yard would be removed. An aquatic disposal site would be dredged and suitable material obtained for use as a cap. Another suitable cap to prevent burrowing animals from penetrating into the underlying contaminated sediment would be provided as well. The 14,520 cubic yards of dredge spoil would be placed on a barge and transported to the aquatic disposal site. The caps would then be constructed. Low costs: Assume that confinement at the disposal site is not necessary.

Comparison of High and Low Costs for Dredging and Contained Aquatic Disposal
High Cost per Cubic Yard Low Cost per Cubic Yard
Excavation of disposal site TBD Clamshell dredging and disposal (assuming confined disposal is not needed)
$10
Clamshell dredging $10Barge transport of waste (assume high truck costs)
TBD
Disposal at aquatic site 9Cap at disposal site TBDMonitoring at disposal site TBD
Sub total per cubic yard $19 Sub total per cubic yard $10
14,520 cubic yards X $19 = $275,880 total (not including creating and maintaining disposal site or acquiring permits)
14,520 cubic yards X $10 = $145,520 total (assuming a confined site is not needed)
F. Estimate of Recoverable Costs From Potential Dischargers
No attempt has been made to ask potential responsible parties to participate in any remediation activities, so projected participation by responsible parties is based on conjecture. If fifty percent of the costs were recovered and the cleanup were to cost $7.4 million, the following schedule may be possible. Assume that $3.7 million is not recoverable.
G. Two-Year Expenditure Schedule Identi fying Funds to Implement the Plans That Are Not Recoverable From Potential Dischargers
Assume that a total of more than $3.7 million would be needed, and that more than two years would be needed to remediate the Seventh Street Channel site.
Activity Deficit
Year 1:
- Meeting with responsible parties- Request for technical information- Discharger response- Staff review of response- Cleanup and abatement order- Sampling plan to characterize aerial extent- Request for bids for chemistry sampling and analysis- Lab contract
estimate $800,000
Year 2:
- Site characterization- Engineering report- Section 404 dredging permit application- State waste discharge requirements application- NEPA and CEQA environmental documentation
estimate $900,000
Future NeedsSampling information is needed to confirm whether toxic chemicals are present at sites that did not undergo repeat sampling. Follow-up information is also needed to adequately characterize toxic hot spots and sites of concern for toxic chemicals, both in the geographic area covered and by depth. Because of San Diego Regional Board experience and based on requests from industrial and government interests, it is felt new sampling trend data for the San Diego Region would be helpful to determine changes in the occurrence of toxic hot spots and sites of concern over time.
If the Regional Board cannot identify parties responsible for discharging historical chemicals such as Chlordane, DDT, PAHs, and PCBs there is a possibility the sites would not be cleaned up. There is a need, therefore, to obtain funding to clean up these “orphan” sites.
Sites of Concern
The stations on the Sites of Concern list shown below demonstrated biological degradation associated with elevated chemistry. Although the Bay Protection and Toxic Cleanup Program legislation only requires toxic hot spots to be identified and ranked, it was the consensus of the Bay Protection Program’s Monitoring and Surveillance Task Force to present lists of sites which may be impaired, based on existing information. “Sites of concern” are not defined in the State Board’s September 1998 Water Quality Control Policy for Guidance on Development of Regional Toxic Hot Spot Cleanup Plans. Criteria for identifying the sites in the San Diego Region are presented in the Regional Board’s decision matrix tables used to identify toxic hot spots.
The Sites of Concern presented in the San Diego Region Cleanup Plan fall into two categories:
“High-priority” stations recommended by the Department of Fish and Game in technical reports for the San Diego Region, and
Stations with at least one “triad” biological hit under definitions 2 and 5 of the State Board’s Policy with elevated chemistry sampled on the same date as the biological hits.
Sites of Concern (Sites that do not qualify as Candidate Toxic Hot Spots)
Water Body Name
Segment Name
Site Identification Reason for Listing
Pollutants Present at the Site
Report Reference
Stations with single biologic triad hits and associated chemistry:Mission Bay Northeast Bay Rose Creek, San Diego
(Station 93107)Degraded benthic community
Chlordane, total chemistry
1
San Diego River
Flood control channel
Sunset Cliffs Bridge, San Diego(Station 93116)
Degraded benthic community
Chlordane 1
San Diego Bay North Bay Submarine Base, Ballast Point,San Diego(Station 90028)
Degraded benthic community
PAH 1
North Bay Laurel Street, San Diego(Station 90002 1)
Sediment toxicity, degraded benthic community
Chlordane, total chemistry
1
San Diego Bay Central Bay Area near Coronado Bridge, San Diego(Station 93179 1)
Sediment toxicity PCB, PAH, total chemistry
1, 3
San Diego Bay Central Bay Indian Point, south of Coronado Bridge, San Diego(Station 90030)
Sediment toxicity PAH, total chemistry
1
Sites of Concern, continued
Water Body Name
Segment Name
Site Identification Reason for Listing
Pollutants Present at the Site
Report Reference
San Diego Bay Central Bay 26th Street, San Diego(Station 93181)
Sediment chemistry Total chemistry 1
San Diego Bay Central Bay Between Piers 3 and 4, Naval Station(Station 93223)
Degraded benthic community
Total chemistry 1
San Diego Bay Central Bay Between Piers 3 and 4, Naval Station(Station 90007)
Sediment toxicity Mercury 1
San Diego Bay Central Bay Between Piers 3 and 4, Naval Station(Station 93224)
Degraded benthic community
Zinc 1
San Diego Bay Central Bay Between Piers 5 and 6, Naval Station(Station 90022)
Sediment toxicity, degraded benthic community
PAH, total chemistry
1, 3
San Diego Bay Central Bay South of Pier 14 Naval Station(Station 93229)
Degraded benthic community
PAH 1
Tijuana Estuary
North slough El Centro Street, National Wildlife Refuge, Imperial Beach (Station 93118)
Sediment toxicity DDE 1
Tijuana Estuary
North slough Boundary Road islands, National Wildlife Refuge, Imperial Beach(Station 93119)
Sediment toxicity DDE, DDT 1
continued
Sites of Concern, continued
Water Body Name
Segment Name
Site Identification Reason for Listing
Pollutants Present at the Site
Report Reference
Tijuana Estuary
South slough South of Tijuana River mouth, National Wildlife Refuge, Imperial Beach (Station 93175)
Sediment toxicity DDE, DDT 1
San Diego Bay Central Bay 26th Street, San Diego(Station 93181)
Sediment chemistry Total chemistry 1
San Diego Bay Central Bay Between Piers 3 and 4, Naval Station(Station 93223)
Degraded benthic community
Total chemistry 1
San Diego Bay Central Bay Between Piers 3 and 4, Naval Station(Station 90007)
Sediment toxicity Mercury 1
San Diego Bay Central Bay Between Piers 3 and 4, Naval Station(Station 93224)
Degraded benthic community
Zinc 1
San Diego Bay Central Bay Between Piers 5 and 6, Naval Station(Station 90022)
Sediment toxicity, degraded benthic community
PAH, total chemistry
1
San Diego Bay Central Bay South of Pier 14 Naval Station(Station 93229)
Degraded benthic community
PAH 1
Tijuana Estuary
North slough El Centro Street, National Wildlife Refuge, Imperial Beach (Station 93118)
Sediment toxicity DDE 1
continued
Sites of Concern, continued Water Body Name
Segment Name
Site Identification Reason for Listing
Pollutants Present at the Site
Report Reference
Tijuana Estuary
North slough Boundary Road islands, National Wildlife Refuge, Imperial Beach(Station 93119)
Sediment toxicity DDE, DDT 1
Tijuana Estuary
South slough South of Tijuana River mouth, National Wildlife Refuge, Imperial Beach (Station 93175)
Sediment toxicity DDE, DDT 1
Tijuana Estuary
South slough North boundary of Border Field State Park, Imperial Beach (Station 93174)
Sediment toxicity DDE, DDT 1
Stations with single biologic triad hits but without “threshold” levels of elevated chemistry:Dana Point Harbor
East basin Central harbor south, Dana Point(Station 96016 1)
Degraded benthic community (and urchin fertilization effects)
(Copper TBT, Chlordane) 2
2
continued
Sites of Concern, continued
Water Body Name
Segment Name
Site Identification Reason for Listing
Pollutants Present at the Site
Report Reference
San Dieguito Lagoon
Southeastern slough
Fish hook slough, Del Mar(Station 95024 1)
Sediment toxicity, degraded benthic community (and urchin fertilization effects)
(Dieldrin) 2 2
1 Department of Fish and Game high-priority stations2 Chemicals present at the station but below threshold levels triggering an “elevated chemistry” designation
References
State Water Resources Control Board. 1996 Chemistry, Toxicity and Benthic Community Conditions in Sediments of the San Diego Bay Region. Final Report.
State Water Resources Control Board. 1997 Chemistry, Toxicity and Benthic Community Conditions in Sediments of Selected Southern California Bays and Estuaries. Final Report.
State Water Resources Control Board. 1998 Chemistry, Toxicity and Benthic Community Conditions in Sediments of the San Diego Bay Region. Addendum Report.