Embed Size (px)
Citation preview
STATE PRESCHOOL YEARBOOK
The National Institute for Early Education Research

THE STATE OF PRESCHOOL 2016
STATE PRESCHOOL YEARBOOK
© 2017 National Institute for Early Education Research
By W. Steven Barnett, Ph.D.Allison H. Friedman-Krauss, Ph.D.G.G. Weisenfeld, Ed.D.Michelle Horowitz, B.A.Richard Kasmin, M.A.James H. Squires, Ph.D.
ACKNOWLEDGEMENTS—The opinions expressed in this report are solely those of the authors. We wish to thank the Heising-Simons Foundation for supporting the development, production, and dissemination of this publication. Established in 2007 by husband and wife Mark Heising and Elizabeth (Liz) Simons, The Heising-Simons Foundation is dedicated to advancing sustainable solutions in the environment, supporting groundbreaking research in science, and enhancing the education of the nation’s youngest learners. The authors would like to extend their thanks to Sandy Ogilvie, Michelle Ruess, Michelle Ramjug, Milagros Nores, and Andrew Barnett, for their assistance on this report.
The primary data source for this report is the 2016 State of Preschool Survey conducted by NIEER under contract to the National Center for Education Statistics (NCES). NCES publications related to the survey are available on-line at http://nces.ed.gov/pubsearch/.
This publication is a product on the National Institute for Early Education Research (NIEER), a unit of the Graduate School of Education at Rutgers, The State University of New Jersey. NIEER supports early childhood education policy by providing objective, nonpartisan information based on research.
NATIONAL INSTITUTE FOREARLY EDUCATION RESEARCH
Design: Sandy Ogilvie Graphic Design [email protected]
Executive Summary .................................................................................................................................................. 6
National Overview ........................................................................................................................................... 12
Enrollment .................................................................................................................................................. 12
Quality Standards ....................................................................................................................................... 14
Resources ................................................................................................................................................... 17
The Need for Data: 20/20 Vision ..................................................................................................................... 19
What Qualifies as a State Preschool Program? ...................................................................................................... 27
Roadmap to the State Profile Pages ...................................................................................................................... 28
Guide to State Profiles ..................................................................................................................................... 33
Glossary of Abbreviations ................................................................................................................................ 34
State Profiles .......................................................................................................................................................... 35
Alabama ........................................................................................................................................................... 36
Alaska .............................................................................................................................................................. 38
Arizona ............................................................................................................................................................. 40
Arkansas ........................................................................................................................................................... 42
California ......................................................................................................................................................... 44
Colorado .......................................................................................................................................................... 48
Connecticut...................................................................................................................................................... 50
Delaware .......................................................................................................................................................... 55
District of Columbia ......................................................................................................................................... 57
Florida .............................................................................................................................................................. 59
Georgia ............................................................................................................................................................ 61
Hawaii .............................................................................................................................................................. 63
Idaho ................................................................................................................................................................ 65
Illinois ............................................................................................................................................................... 67
Indiana ............................................................................................................................................................. 69
Iowa ................................................................................................................................................................. 71
Kansas .............................................................................................................................................................. 75
Kentucky .......................................................................................................................................................... 79
Louisiana .......................................................................................................................................................... 81
Maine ............................................................................................................................................................... 86
Maryland .......................................................................................................................................................... 88
Massachusetts .................................................................................................................................................. 90
Michigan .......................................................................................................................................................... 94
Minnesota ........................................................................................................................................................ 96
Mississippi ........................................................................................................................................................ 98
Missouri ......................................................................................................................................................... 100
Montana ......................................................................................................................................................... 102
Nebraska ........................................................................................................................................................ 104
Nevada .......................................................................................................................................................... 106
New Hampshire ............................................................................................................................................. 108
New Jersey .................................................................................................................................................... 110
New Mexico ................................................................................................................................................... 115
New York ........................................................................................................................................................ 117
North Carolina ............................................................................................................................................... 119
North Dakota ................................................................................................................................................. 121
Ohio ............................................................................................................................................................... 123
Oklahoma ...................................................................................................................................................... 125
Oregon .......................................................................................................................................................... 127
Pennsylvania .................................................................................................................................................. 129
Rhode Island .................................................................................................................................................. 135
South Carolina ............................................................................................................................................... 137
South Dakota ................................................................................................................................................. 141
Tennessee ...................................................................................................................................................... 143
Texas .............................................................................................................................................................. 145
Utah ............................................................................................................................................................... 147
Vermont ......................................................................................................................................................... 149
Virginia ........................................................................................................................................................... 151
Washington .................................................................................................................................................... 153
West Virginia .................................................................................................................................................. 155
Wisconsin ....................................................................................................................................................... 157
Wyoming ....................................................................................................................................................... 161
American Samoa ............................................................................................................................................ 163
Guam ............................................................................................................................................................. 165
Northern Mariana Islands ............................................................................................................................... 167
Palau .............................................................................................................................................................. 169
Puerto Rico .................................................................................................................................................... 171
Virgin Islands .................................................................................................................................................. 173
Methodology ........................................................................................................................................................ 175
Appendices Table of Contents .............................................................................................................................. 178
Footnotes
VISIT OUR WEBSITE FOR ACCESS TO ALL DATA WWW.NIEER.ORG/YEARBOOK
6
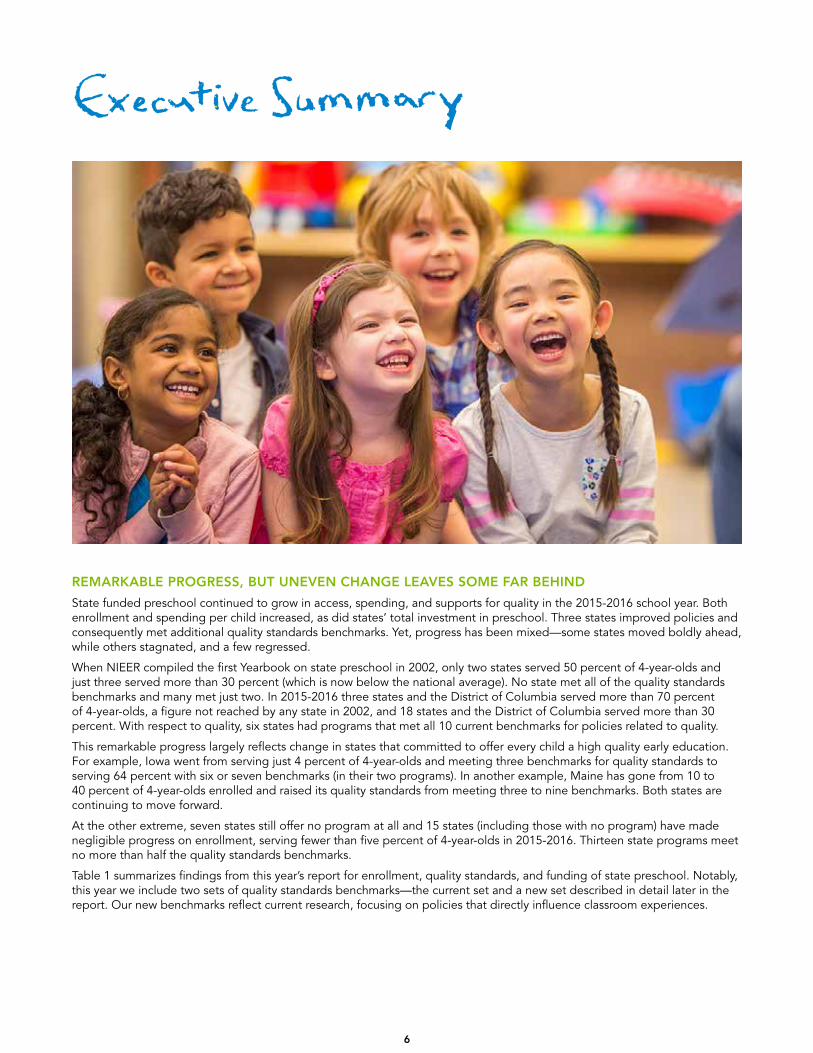
REMARKABLE PROGRESS, BUT UNEVEN CHANGE LEAVES SOME FAR BEHIND
State funded preschool continued to grow in access, spending, and supports for quality in the 2015-2016 school year. Both enrollment and spending per child increased, as did states’ total investment in preschool. Three states improved policies and consequently met additional quality standards benchmarks. Yet, progress has been mixed—some states moved boldly ahead, while others stagnated, and a few regressed.
When NIEER compiled the first Yearbook on state preschool in 2002, only two states served 50 percent of 4-year-olds and just three served more than 30 percent (which is now below the national average). No state met all of the quality standards benchmarks and many met just two. In 2015-2016 three states and the District of Columbia served more than 70 percent of 4-year-olds, a figure not reached by any state in 2002, and 18 states and the District of Columbia served more than 30 percent. With respect to quality, six states had programs that met all 10 current benchmarks for policies related to quality.
This remarkable progress largely reflects change in states that committed to offer every child a high quality early education. For example, Iowa went from serving just 4 percent of 4-year-olds and meeting three benchmarks for quality standards to serving 64 percent with six or seven benchmarks (in their two programs). In another example, Maine has gone from 10 to 40 percent of 4-year-olds enrolled and raised its quality standards from meeting three to nine benchmarks. Both states are continuing to move forward.
At the other extreme, seven states still offer no program at all and 15 states (including those with no program) have made negligible progress on enrollment, serving fewer than five percent of 4-year-olds in 2015-2016. Thirteen state programs meet no more than half the quality standards benchmarks.
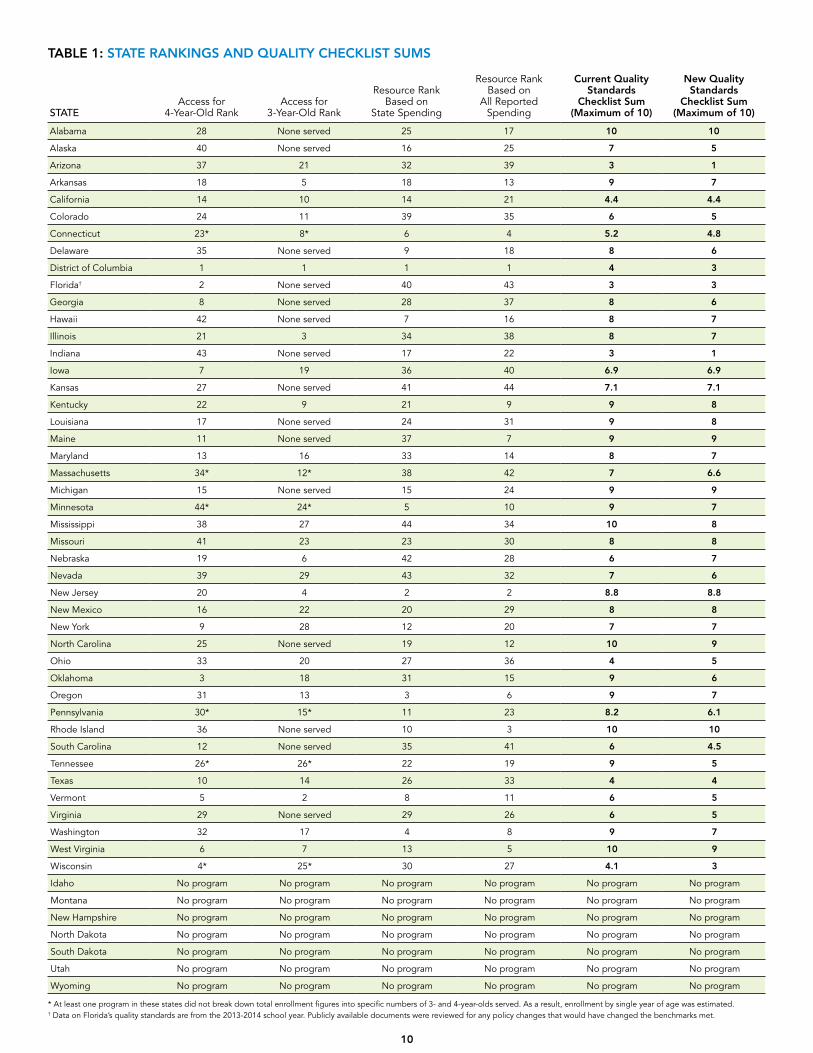
Table 1 summarizes findings from this year’s report for enrollment, quality standards, and funding of state preschool. Notably, this year we include two sets of quality standards benchmarks—the current set and a new set described in detail later in the report. Our new benchmarks reflect current research, focusing on policies that directly influence classroom experiences.
7
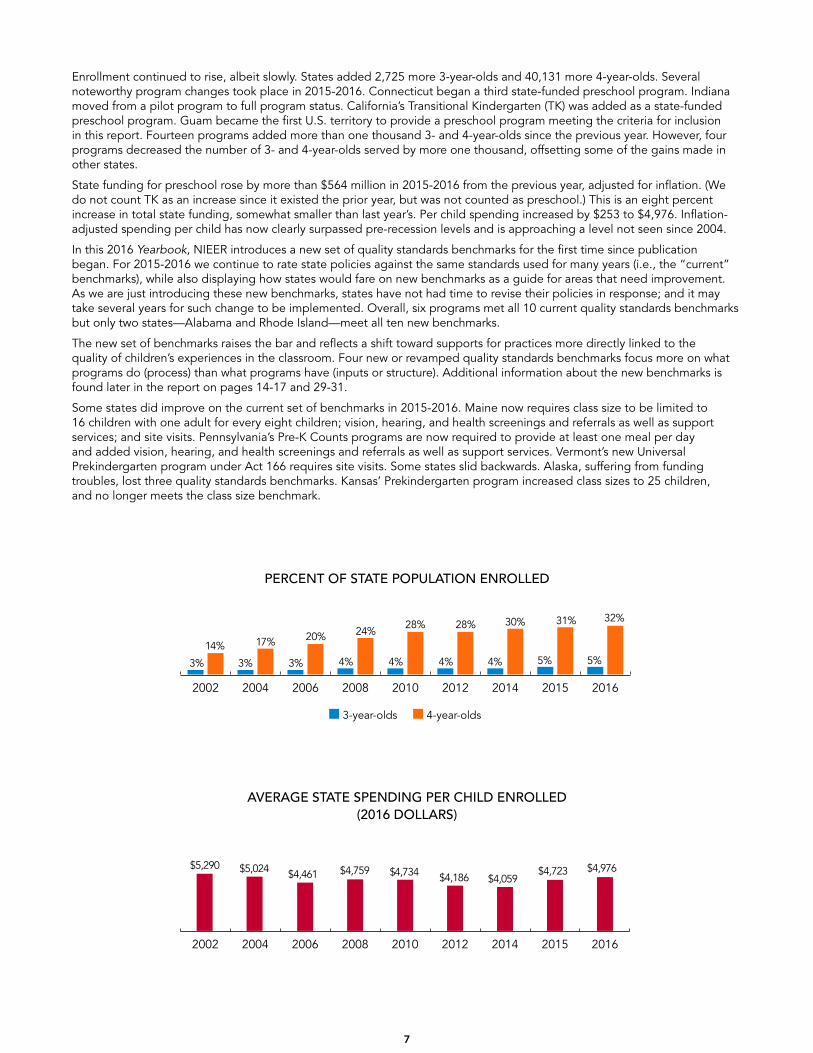
Enrollment continued to rise, albeit slowly. States added 2,725 more 3-year-olds and 40,131 more 4-year-olds. Several noteworthy program changes took place in 2015-2016. Connecticut began a third state-funded preschool program. Indiana moved from a pilot program to full program status. California’s Transitional Kindergarten (TK) was added as a state-funded preschool program. Guam became the first U.S. territory to provide a preschool program meeting the criteria for inclusion in this report. Fourteen programs added more than one thousand 3- and 4-year-olds since the previous year. However, four programs decreased the number of 3- and 4-year-olds served by more one thousand, offsetting some of the gains made in other states.
State funding for preschool rose by more than $564 million in 2015-2016 from the previous year, adjusted for inflation. (We do not count TK as an increase since it existed the prior year, but was not counted as preschool.) This is an eight percent increase in total state funding, somewhat smaller than last year’s. Per child spending increased by $253 to $4,976. Inflation-adjusted spending per child has now clearly surpassed pre-recession levels and is approaching a level not seen since 2004.
In this 2016 Yearbook, NIEER introduces a new set of quality standards benchmarks for the first time since publication began. For 2015-2016 we continue to rate state policies against the same standards used for many years (i.e., the “current” benchmarks), while also displaying how states would fare on new benchmarks as a guide for areas that need improvement. As we are just introducing these new benchmarks, states have not had time to revise their policies in response; and it may take several years for such change to be implemented. Overall, six programs met all 10 current quality standards benchmarks but only two states—Alabama and Rhode Island—meet all ten new benchmarks.
The new set of benchmarks raises the bar and reflects a shift toward supports for practices more directly linked to the quality of children’s experiences in the classroom. Four new or revamped quality standards benchmarks focus more on what programs do (process) than what programs have (inputs or structure). Additional information about the new benchmarks is found later in the report on pages 14-17 and 29-31.
Some states did improve on the current set of benchmarks in 2015-2016. Maine now requires class size to be limited to 16 children with one adult for every eight children; vision, hearing, and health screenings and referrals as well as support services; and site visits. Pennsylvania’s Pre-K Counts programs are now required to provide at least one meal per day and added vision, hearing, and health screenings and referrals as well as support services. Vermont’s new Universal Prekindergarten program under Act 166 requires site visits. Some states slid backwards. Alaska, suffering from funding troubles, lost three quality standards benchmarks. Kansas’ Prekindergarten program increased class sizes to 25 children, and no longer meets the class size benchmark.
201620152014201220102008200620042002
201620152014201220102008200620042002
3% 3% 3% 4% 4% 4% 4% 5% 5%14% 17% 20% 24%
28% 28% 30% 31% 32%
$5,290 $5,024 $4,461 $4,759 $4,734 $4,186 $4,059$4,723 $4,976
■ 3-year-olds ■ 4-year-olds
PERCENT OF STATE POPULATION ENROLLED
AVERAGE STATE SPENDING PER CHILD ENROLLED(2016 DOLLARS)
8
WHAT’S NEW?
Resources:
• Total state funding for preschool programs increased to almost $7.4 billion, an increase of more than $564 million (adjusted for inflation) across the 43 states and D.C.1 that offered preschool during the 2015-2016 year, an 8 percent increase in real dollars. Most of this increase comes from California and Texas, up more than $200 million and $100 million, respectively, from last year, adjusted for inflation.
• State preschool funding per child increased by $253 (inflation-adjusted) from last year to $4,976. All reported funding per child reached $5,696, a real one-year increase of $397.
• In addition to California and Texas, nine other states reported an increase in state spending of more than $10 million. Twenty-five states increased spending per child. Notably, Indiana increased spending per child by more than $3,000 while increasing enrollment.
• Eighteen states received competitive federal Preschool Development Grants (PDG) that contributed nearly $210 million in 2015-2016. Just over $108 million of the federal PDG spending supported increased enrollment or quality enhancement in state preschool while the remaining funds supported children in preschool programs outside of state-funded programs.
Enrollment:
• Nearly 1.5 million children attended state-funded preschool, including nearly 1.3 million 4-year-olds. Almost five percent of 3-year-olds and 32 percent of 4-year-olds were served in state-funded preschool.
• Approximately 19,000 of these children were enrolled in state-funded preschool and supported either entirely or partially by federal PDG funding.
• Across all public programs—pre-K general and special education enrollment plus federally and state-funded Head Start—43 percent of 4-year-olds and 16 percent of 3-year-olds were served. Over the last decade, enrollment across all state programs at age 4 has risen by only 5 percentage points and enrollment at age 3 by 1.5 percentage points. However, fourteen states enroll more 50 percent of 4-year-olds across these three publicly-funded programs.
• Enrollment increased by 40,131 four-year-olds and 2,725 three-year-olds. Approximately 50 percent of this increase can be attributed to the federal PDG. Eight states reduced enrollment of 3- and 4-year-olds.
Quality:
• Three programs improved on NIEER’s Quality Standards Benchmarks checklist—Maine gained four new benchmarks while Pennsylvania’s Pre-K Counts program gained two; both programs now meet nine out of ten current benchmarks. Vermont gained one benchmark.
• Five states (Alabama, Mississippi, North Carolina, Rhode Island, West Virginia) plus one program in Louisiana (NSECD) met all 10 current benchmarks for minimum state preschool quality standards. These states include some with the highest percentages of children in poverty. Alaska no longer met all 10 benchmarks after the state restructured their program to compensate for reduced funding.
• Many states met fewer than half of the current quality standards benchmarks, including states with high numbers of children in poverty serving large numbers of children (e.g., Arizona, California TK, Florida, Indiana, Ohio, Pennsylvania K4, Texas, and Wisconsin 4K). D.C. sets high standards, but charter schools serving many of the children are not required to meet these standards.
• NIEER introduced a new set of quality standards benchmarks to emphasize a greater focus on process quality and reflect new research on early childhood education quality. Only two states, Alabama and Rhode Island, met all 10 of these new quality standards.
Major Developments:
• Guam became the first U.S. territory to offer a publicly-funded preschool program, serving 72 four-year-olds (2.7% of 4-year-olds in Guam) in four public school classrooms across Guam in 2015-2016. Guam spent $12,185 per child, including program start-up costs and met seven quality standards benchmarks.
• California’s TK, which serves children too young to enter kindergarten, is included as a state preschool program for the first time. A total of 89,937 children attended TK in 2015-2016.
1 For the sake of comparison, the District of Columbia will be referred to as a “state” throughout this report. Hence, there is a total of 44 states providing state-funded pre-K.
9
• Indiana’s On My Way Pre-K expanded in 2015-2016 and graduated from pilot-program status to full inclusion in the Yearbook.
• 2015-2016 was the first year of Vermont’s Universal Prekindergarten program under Act 166, which requires all school districts in the state to provide universal, publicly funded preschool for a minimum of 10 hours per week to 3-, 4-, and 5-year-olds not enrolled in kindergarten.
• Eighteen states received federal PDG funding to support enrollment of low-income 4-year-olds in high quality preschool. Almost $210 million was used to support nearly 30,000 four-year-olds and to raise quality. Just over half of that amount supported about 19,000 four-year-olds enrolled in state-funded preschool programs. Without PDG this year, progress on enrollment and quality could have been much more limited.
• Lack of state support for preschool Dual Language Learners (DLLs) continues to be a serious concern. Only 22 state programs could report the number of DLLs they serve. Just five programs (in four states) require teachers of DLLs to have any special qualifications preparing them for the challenges of educating DLLs. On a more positive note, most states have culturally sensitive early learning and development standards. However, unless teachers are supported in achieving them, such standards are unlikely to lead to effective practice.
10
TABLE 1: STATE RANKINGS AND QUALITY CHECKLIST SUMS
STATEAccess for
4-Year-Old RankAccess for
3-Year-Old Rank
Resource Rank Based on
State Spending
Resource Rank Based on
All Reported Spending
Current Quality Standards
Checklist Sum (Maximum of 10)
New Quality Standards
Checklist Sum (Maximum of 10)
Alabama 28 None served 25 17 10 10
Alaska 40 None served 16 25 7 5
Arizona 37 21 32 39 3 1
Arkansas 18 5 18 13 9 7
California 14 10 14 21 4.4 4.4
Colorado 24 11 39 35 6 5
Connecticut 23* 8* 6 4 5.2 4.8
Delaware 35 None served 9 18 8 6
District of Columbia 1 1 1 1 4 3
Florida† 2 None served 40 43 3 3
Georgia 8 None served 28 37 8 6
Hawaii 42 None served 7 16 8 7
Illinois 21 3 34 38 8 7
Indiana 43 None served 17 22 3 1
Iowa 7 19 36 40 6.9 6.9
Kansas 27 None served 41 44 7.1 7.1
Kentucky 22 9 21 9 9 8
Louisiana 17 None served 24 31 9 8
Maine 11 None served 37 7 9 9
Maryland 13 16 33 14 8 7
Massachusetts 34* 12* 38 42 7 6.6
Michigan 15 None served 15 24 9 9
Minnesota 44* 24* 5 10 9 7
Mississippi 38 27 44 34 10 8
Missouri 41 23 23 30 8 8
Nebraska 19 6 42 28 6 7
Nevada 39 29 43 32 7 6
New Jersey 20 4 2 2 8.8 8.8
New Mexico 16 22 20 29 8 8
New York 9 28 12 20 7 7
North Carolina 25 None served 19 12 10 9
Ohio 33 20 27 36 4 5
Oklahoma 3 18 31 15 9 6
Oregon 31 13 3 6 9 7
Pennsylvania 30* 15* 11 23 8.2 6.1
Rhode Island 36 None served 10 3 10 10
South Carolina 12 None served 35 41 6 4.5
Tennessee 26* 26* 22 19 9 5
Texas 10 14 26 33 4 4
Vermont 5 2 8 11 6 5
Virginia 29 None served 29 26 6 5
Washington 32 17 4 8 9 7
West Virginia 6 7 13 5 10 9
Wisconsin 4* 25* 30 27 4.1 3
Idaho No program No program No program No program No program No program
Montana No program No program No program No program No program No program
New Hampshire No program No program No program No program No program No program
North Dakota No program No program No program No program No program No program
South Dakota No program No program No program No program No program No program
Utah No program No program No program No program No program No program
Wyoming No program No program No program No program No program No program
* At least one program in these states did not break down total enrollment figures into specific numbers of 3- and 4-year-olds served. As a result, enrollment by single year of age was estimated.† Data on Florida’s quality standards are from the 2013-2014 school year. Publicly available documents were reviewed for any policy changes that would have changed the benchmarks met.
11
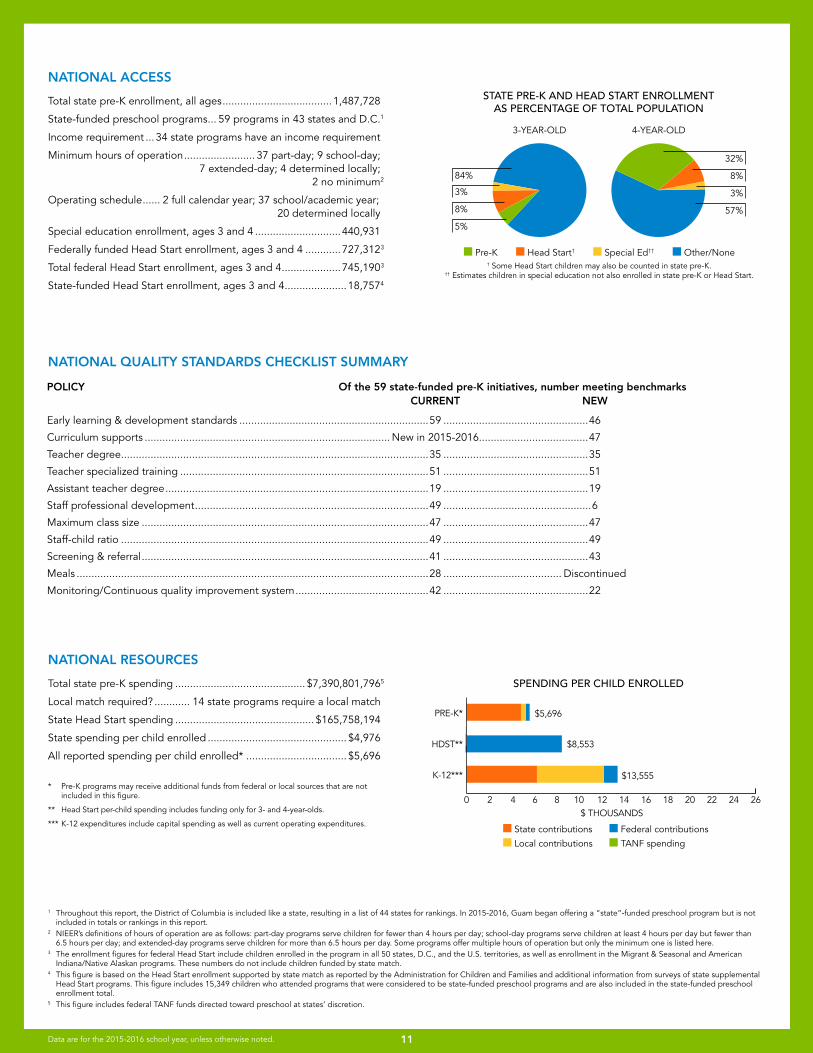
NATIONAL ACCESS
Total state pre-K enrollment, all ages .....................................1,487,728
State-funded preschool programs ... 59 programs in 43 states and D.C. 1
Income requirement ... 34 state programs have an income requirement
Minimum hours of operation ........................ 37 part-day; 9 school-day; 7 extended-day; 4 determined locally; 2 no minimum 2
Operating schedule ...... 2 full calendar year; 37 school/academic year; 20 determined locally
Special education enrollment, ages 3 and 4 .............................440,931
Federally funded Head Start enrollment, ages 3 and 4 ............727,312 3
Total federal Head Start enrollment, ages 3 and 4 ....................745,190 3
State-funded Head Start enrollment, ages 3 and 4 .....................18,757 4
NATIONAL QUALITY STANDARDS CHECKLIST SUMMARY
National
3-YEAR-OLD 4-YEAR-OLD
3%
84%
8%
5%
3%
57%
8%
32%
■ Pre-K ■ Head Start† ■ Special Ed†† ■ Other/None† Some Head Start children may also be counted in state pre-K.
†† Estimates children in special education not also enrolled in state pre-K or Head Start.
NATIONAL RESOURCES
Total state pre-K spending ............................................ $7,390,801,796 5
Local match required? ............ 14 state programs require a local match
State Head Start spending ............................................... $165,758,194
State spending per child enrolled ............................................... $4,976
All reported spending per child enrolled* .................................. $5,696
* Pre-K programs may receive additional funds from federal or local sources that are not included in this figure.
** Head Start per-child spending includes funding only for 3- and 4-year-olds.
*** K-12 expenditures include capital spending as well as current operating expenditures.
SPENDING PER CHILD ENROLLED
$5,696
$8,553
$13,555
0 42 6 8 10 12 14 16 18 20 22 24 26
K-12***
HDST**
PRE-K*
$ THOUSANDS
■ State contributions
■ Local contributions
■ Federal contributions
■ TANF spending
Data are for the 2015-2016 school year, unless otherwise noted.
STATE PRE-K AND HEAD START ENROLLMENTAS PERCENTAGE OF TOTAL POPULATION
POLICY Of the 59 state-funded pre-K initiatives, number meeting benchmarks CURRENT NEW
Early learning & development standards ................................................................59 .................................................46
Curriculum supports ................................................................................... New in 2015-2016.....................................47
Teacher degree ........................................................................................................35 .................................................35
Teacher specialized training ....................................................................................51 .................................................51
Assistant teacher degree .........................................................................................19 .................................................19
Staff professional development ...............................................................................49 ..................................................6
Maximum class size .................................................................................................47 .................................................47
Staff-child ratio ........................................................................................................49 .................................................49
Screening & referral .................................................................................................41 .................................................43
Meals .......................................................................................................................28 ........................................ Discontinued
Monitoring/Continuous quality improvement system .............................................42 .................................................22
1 Throughout this report, the District of Columbia is included like a state, resulting in a list of 44 states for rankings. In 2015-2016, Guam began offering a “state”-funded preschool program but is not included in totals or rankings in this report.
2 NIEER’s definitions of hours of operation are as follows: part-day programs serve children for fewer than 4 hours per day; school-day programs serve children at least 4 hours per day but fewer than 6.5 hours per day; and extended-day programs serve children for more than 6.5 hours per day. Some programs offer multiple hours of operation but only the minimum one is listed here.
3 The enrollment figures for federal Head Start include children enrolled in the program in all 50 states, D.C., and the U.S. territories, as well as enrollment in the Migrant & Seasonal and American Indiana/Native Alaskan programs. These numbers do not include children funded by state match.
4 This figure is based on the Head Start enrollment supported by state match as reported by the Administration for Children and Families and additional information from surveys of state supplemental Head Start programs. This figure includes 15,349 children who attended programs that were considered to be state-funded preschool programs and are also included in the state-funded preschool enrollment total.
5 This figure includes federal TANF funds directed toward preschool at states’ discretion.
12
ENROLLMENT CONTINUES TO CLIMB SLOWLY
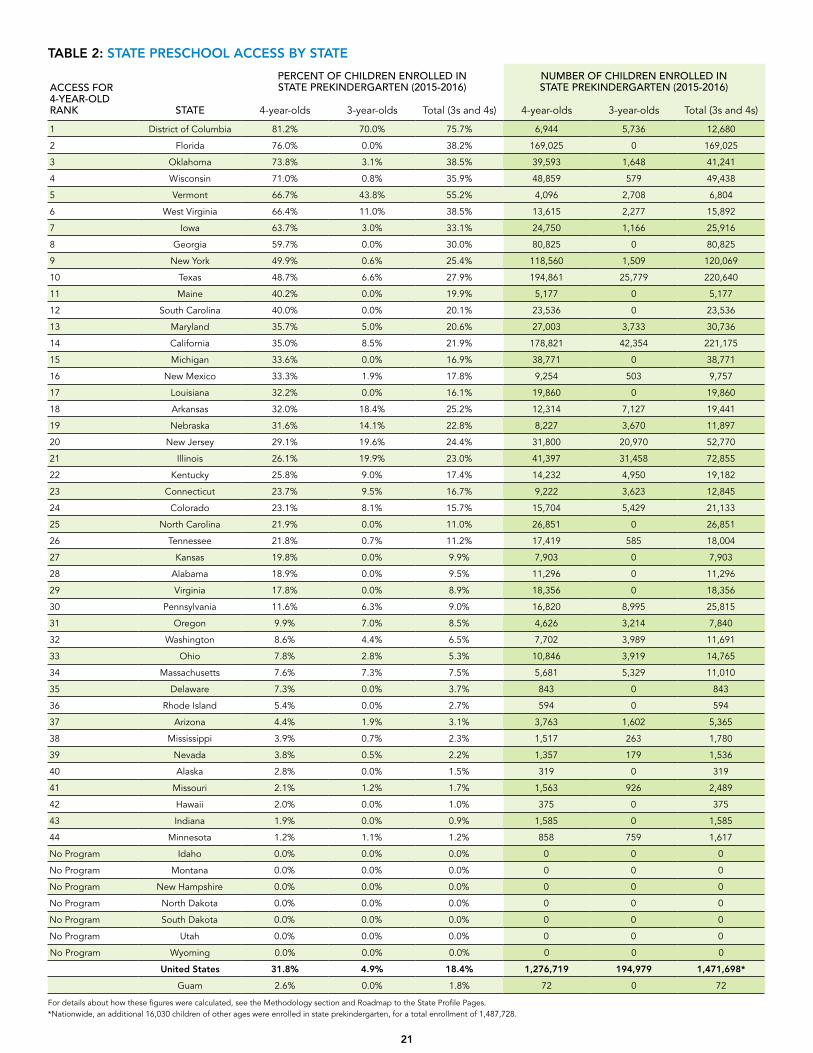
State-funded preschool served 1,487,728 children during the 2015-2016 school year. Eighty-six percent, or 1,276,719 children were 4-year-olds, continuing the trend that state preschool is a program predominantly for 4-year-olds. Table 2 reports the number and percentage of the population of 3- and 4-year-olds enrolled by state and nationally.
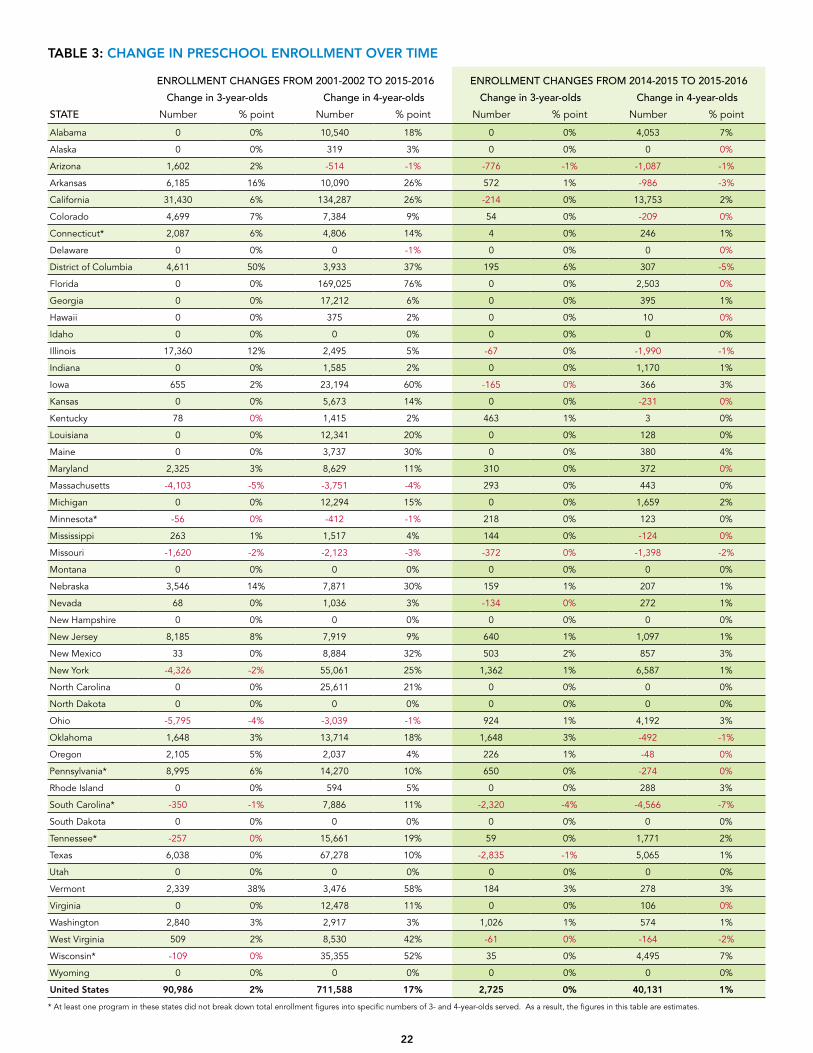
Total enrollment in 2015-2016 increased by 40,023 children from the previous year. Compared to 2014-2015, fewer 3-year-olds were added but more 4-year-olds were, likely in part due to the federal PDG program. Table 3 reports enrollment changes from the first year we started tracking state preschool (2001-2002) and from 2014-2015.
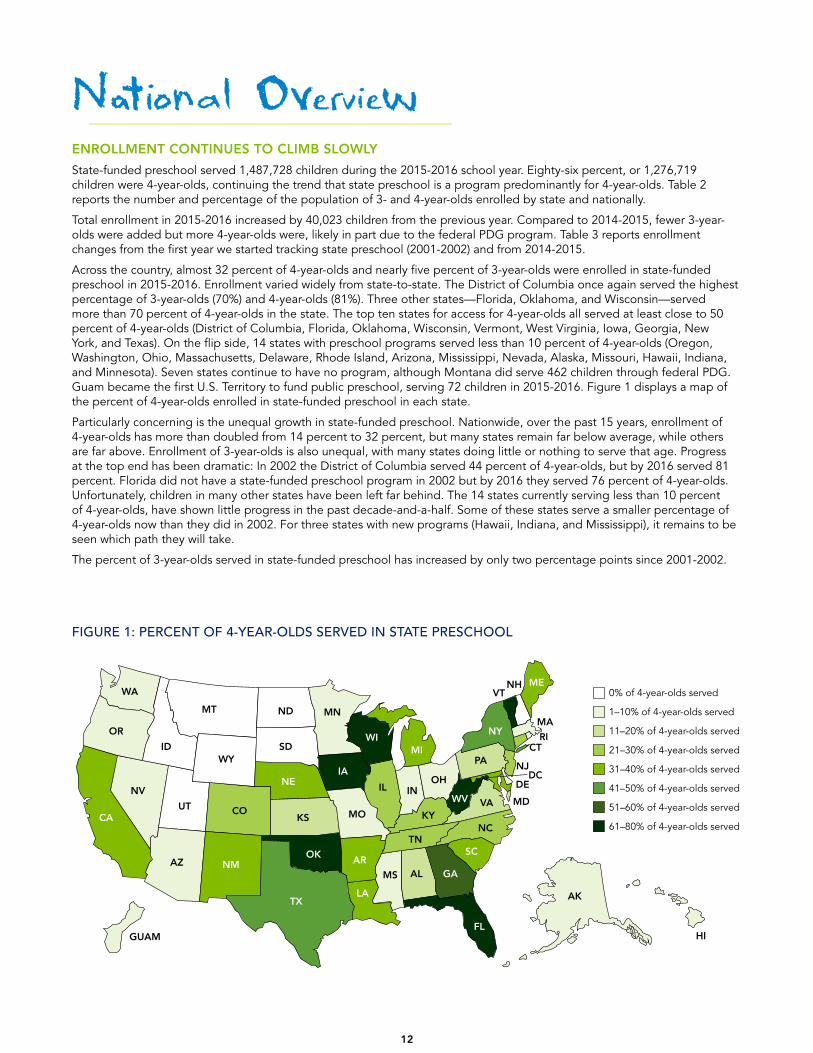
Across the country, almost 32 percent of 4-year-olds and nearly five percent of 3-year-olds were enrolled in state-funded preschool in 2015-2016. Enrollment varied widely from state-to-state. The District of Columbia once again served the highest percentage of 3-year-olds (70%) and 4-year-olds (81%). Three other states—Florida, Oklahoma, and Wisconsin—served more than 70 percent of 4-year-olds in the state. The top ten states for access for 4-year-olds all served at least close to 50 percent of 4-year-olds (District of Columbia, Florida, Oklahoma, Wisconsin, Vermont, West Virginia, Iowa, Georgia, New York, and Texas). On the flip side, 14 states with preschool programs served less than 10 percent of 4-year-olds (Oregon, Washington, Ohio, Massachusetts, Delaware, Rhode Island, Arizona, Mississippi, Nevada, Alaska, Missouri, Hawaii, Indiana, and Minnesota). Seven states continue to have no program, although Montana did serve 462 children through federal PDG. Guam became the first U.S. Territory to fund public preschool, serving 72 children in 2015-2016. Figure 1 displays a map of the percent of 4-year-olds enrolled in state-funded preschool in each state.
Particularly concerning is the unequal growth in state-funded preschool. Nationwide, over the past 15 years, enrollment of 4-year-olds has more than doubled from 14 percent to 32 percent, but many states remain far below average, while others are far above. Enrollment of 3-year-olds is also unequal, with many states doing little or nothing to serve that age. Progress at the top end has been dramatic: In 2002 the District of Columbia served 44 percent of 4-year-olds, but by 2016 served 81 percent. Florida did not have a state-funded preschool program in 2002 but by 2016 they served 76 percent of 4-year-olds. Unfortunately, children in many other states have been left far behind. The 14 states currently serving less than 10 percent of 4-year-olds, have shown little progress in the past decade-and-a-half. Some of these states serve a smaller percentage of 4-year-olds now than they did in 2002. For three states with new programs (Hawaii, Indiana, and Mississippi), it remains to be seen which path they will take.
The percent of 3-year-olds served in state-funded preschool has increased by only two percentage points since 2001-2002.
FIGURE 1: PERCENT OF 4-YEAR-OLDS SERVED IN STATE PRESCHOOL
DC
MT
WA
OR
CA
AK
GUAM
NV
IDWY
CO
NM
TX
OK
KS
NE
SD
ND MN
WI
IL
MI
OH
KY
TN
MS AL GA
SC
NC
VA
NJ
VTNH
MA
CT
DE
RI
MDWV
FL
PA
NY
ME
IN
IA
MO
AR
LA
UT
AZ
HI
0% of 4-year-olds served
1–10% of 4-year-olds served
11–20% of 4-year-olds served
21–30% of 4-year-olds served
31–40% of 4-year-olds served
41–50% of 4-year-olds served
51–60% of 4-year-olds served
61–80% of 4-year-olds served
13
0
20
40
60
80
100
20162015201420132012201120102009200820072006200520032002
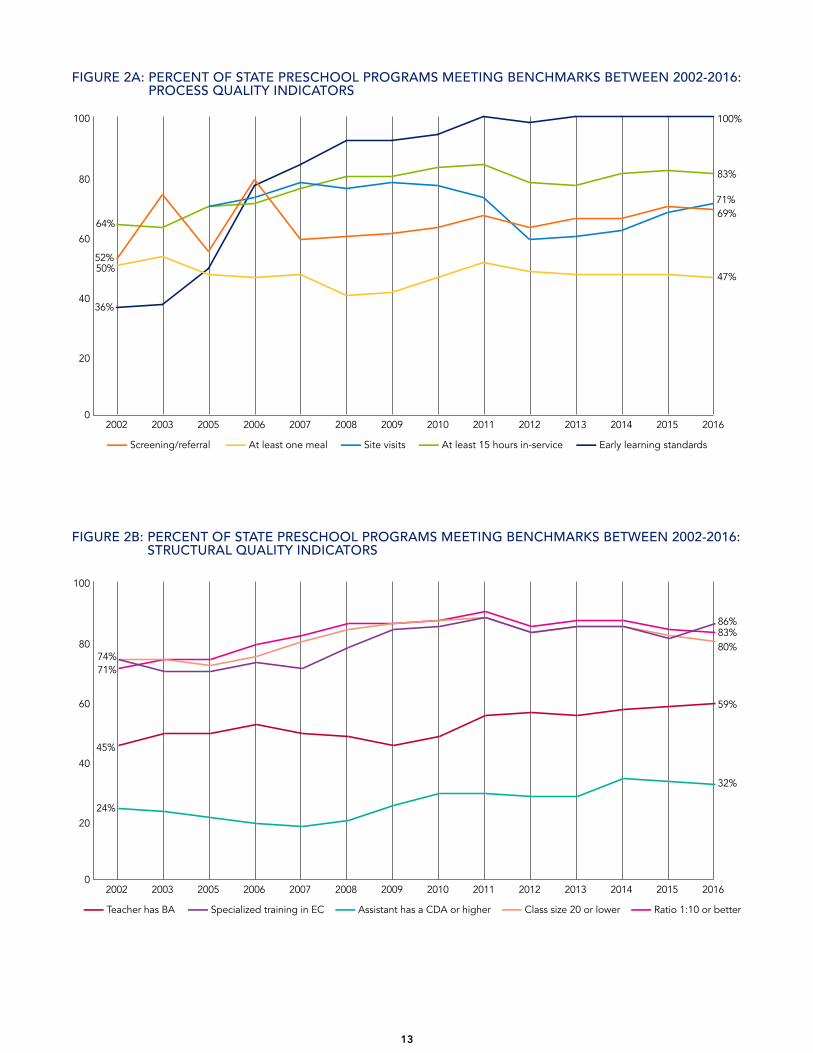
36%
50%52%
64%
47%
69%71%
83%
100%
■ Screening/referral ■ At least one meal ■ Site visits ■ At least 15 hours in-service ■ Early learning standards
0
20
40
60
80
100
20162015201420132012201120102009200820072006200520032002
■ Teacher has BA ■ Specialized training in EC ■ Assistant has a CDA or higher ■ Class size 20 or lower ■ Ratio 1:10 or better
24%
45%
74%71%
32%
59%
80%83%86%
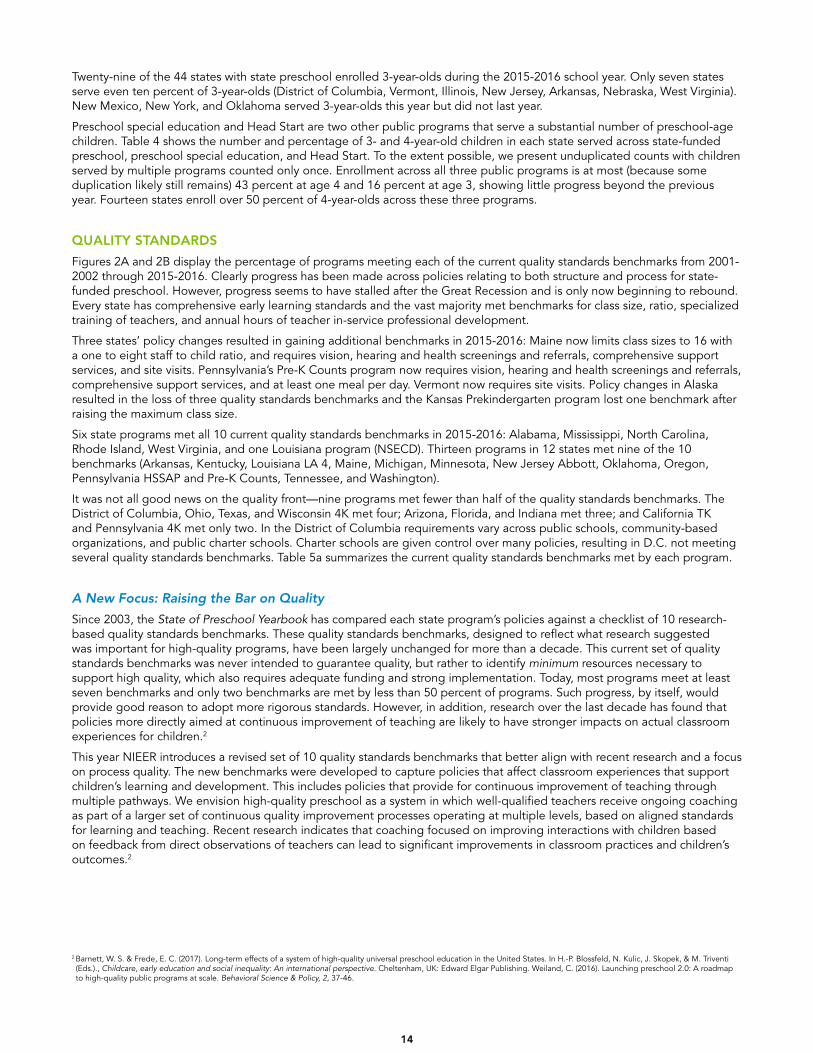
FIGURE 2A: PERCENT OF STATE PRESCHOOL PROGRAMS MEETING BENCHMARKS BETWEEN 2002-2016: PROCESS QUALITY INDICATORS
FIGURE 2B: PERCENT OF STATE PRESCHOOL PROGRAMS MEETING BENCHMARKS BETWEEN 2002-2016: STRUCTURAL QUALITY INDICATORS
14
Twenty-nine of the 44 states with state preschool enrolled 3-year-olds during the 2015-2016 school year. Only seven states serve even ten percent of 3-year-olds (District of Columbia, Vermont, Illinois, New Jersey, Arkansas, Nebraska, West Virginia). New Mexico, New York, and Oklahoma served 3-year-olds this year but did not last year.
Preschool special education and Head Start are two other public programs that serve a substantial number of preschool-age children. Table 4 shows the number and percentage of 3- and 4-year-old children in each state served across state-funded preschool, preschool special education, and Head Start. To the extent possible, we present unduplicated counts with children served by multiple programs counted only once. Enrollment across all three public programs is at most (because some duplication likely still remains) 43 percent at age 4 and 16 percent at age 3, showing little progress beyond the previous year. Fourteen states enroll over 50 percent of 4-year-olds across these three programs.
QUALITY STANDARDS
Figures 2A and 2B display the percentage of programs meeting each of the current quality standards benchmarks from 2001-2002 through 2015-2016. Clearly progress has been made across policies relating to both structure and process for state-funded preschool. However, progress seems to have stalled after the Great Recession and is only now beginning to rebound. Every state has comprehensive early learning standards and the vast majority met benchmarks for class size, ratio, specialized training of teachers, and annual hours of teacher in-service professional development.
Three states’ policy changes resulted in gaining additional benchmarks in 2015-2016: Maine now limits class sizes to 16 with a one to eight staff to child ratio, and requires vision, hearing and health screenings and referrals, comprehensive support services, and site visits. Pennsylvania’s Pre-K Counts program now requires vision, hearing and health screenings and referrals, comprehensive support services, and at least one meal per day. Vermont now requires site visits. Policy changes in Alaska resulted in the loss of three quality standards benchmarks and the Kansas Prekindergarten program lost one benchmark after raising the maximum class size.
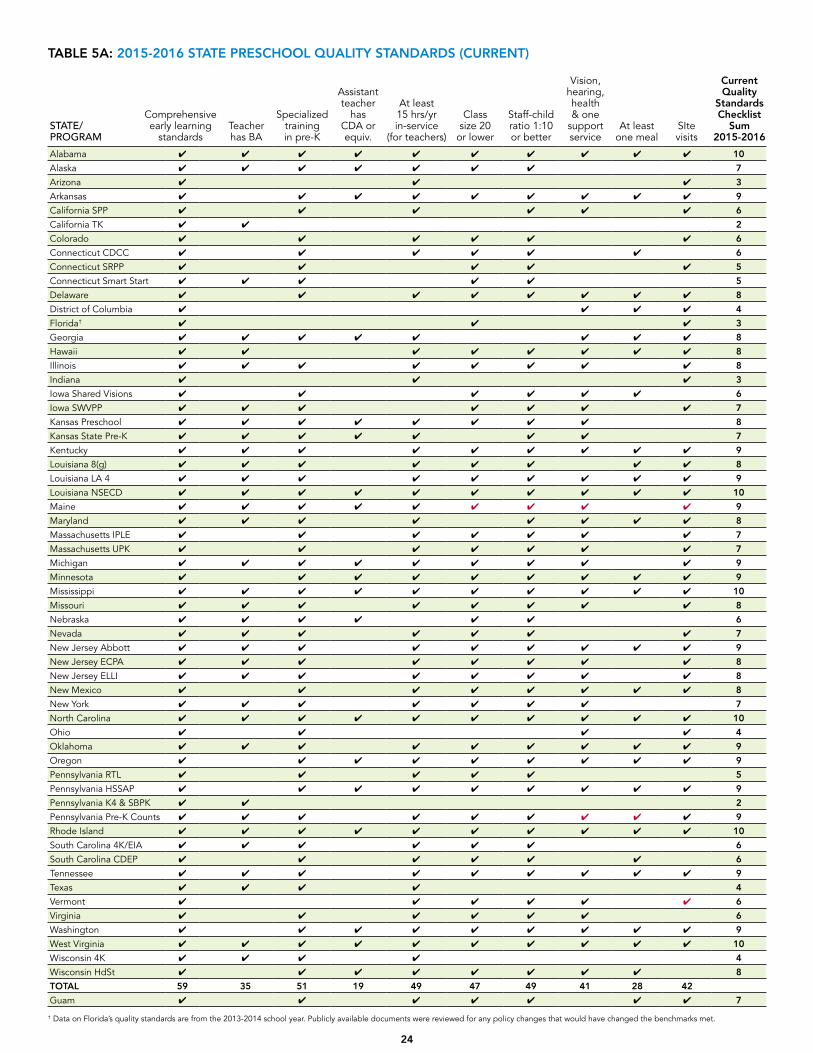
Six state programs met all 10 current quality standards benchmarks in 2015-2016: Alabama, Mississippi, North Carolina, Rhode Island, West Virginia, and one Louisiana program (NSECD). Thirteen programs in 12 states met nine of the 10 benchmarks (Arkansas, Kentucky, Louisiana LA 4, Maine, Michigan, Minnesota, New Jersey Abbott, Oklahoma, Oregon, Pennsylvania HSSAP and Pre-K Counts, Tennessee, and Washington).
It was not all good news on the quality front—nine programs met fewer than half of the quality standards benchmarks. The District of Columbia, Ohio, Texas, and Wisconsin 4K met four; Arizona, Florida, and Indiana met three; and California TK and Pennsylvania 4K met only two. In the District of Columbia requirements vary across public schools, community-based organizations, and public charter schools. Charter schools are given control over many policies, resulting in D.C. not meeting several quality standards benchmarks. Table 5a summarizes the current quality standards benchmarks met by each program.
A New Focus: Raising the Bar on Quality
Since 2003, the State of Preschool Yearbook has compared each state program’s policies against a checklist of 10 research-based quality standards benchmarks. These quality standards benchmarks, designed to reflect what research suggested was important for high-quality programs, have been largely unchanged for more than a decade. This current set of quality standards benchmarks was never intended to guarantee quality, but rather to identify minimum resources necessary to support high quality, which also requires adequate funding and strong implementation. Today, most programs meet at least seven benchmarks and only two benchmarks are met by less than 50 percent of programs. Such progress, by itself, would provide good reason to adopt more rigorous standards. However, in addition, research over the last decade has found that policies more directly aimed at continuous improvement of teaching are likely to have stronger impacts on actual classroom experiences for children.2
This year NIEER introduces a revised set of 10 quality standards benchmarks that better align with recent research and a focus on process quality. The new benchmarks were developed to capture policies that affect classroom experiences that support children’s learning and development. This includes policies that provide for continuous improvement of teaching through multiple pathways. We envision high-quality preschool as a system in which well-qualified teachers receive ongoing coaching as part of a larger set of continuous quality improvement processes operating at multiple levels, based on aligned standards for learning and teaching. Recent research indicates that coaching focused on improving interactions with children based on feedback from direct observations of teachers can lead to significant improvements in classroom practices and children’s outcomes.2
2 Barnett, W. S. & Frede, E. C. (2017). Long-term effects of a system of high-quality universal preschool education in the United States. In H.-P. Blossfeld, N. Kulic, J. Skopek, & M. Triventi (Eds.)., Childcare, early education and social inequality: An international perspective. Cheltenham, UK: Edward Elgar Publishing. Weiland, C. (2016). Launching preschool 2.0: A roadmap to high-quality public programs at scale. Behavioral Science & Policy, 2, 37-46.
15
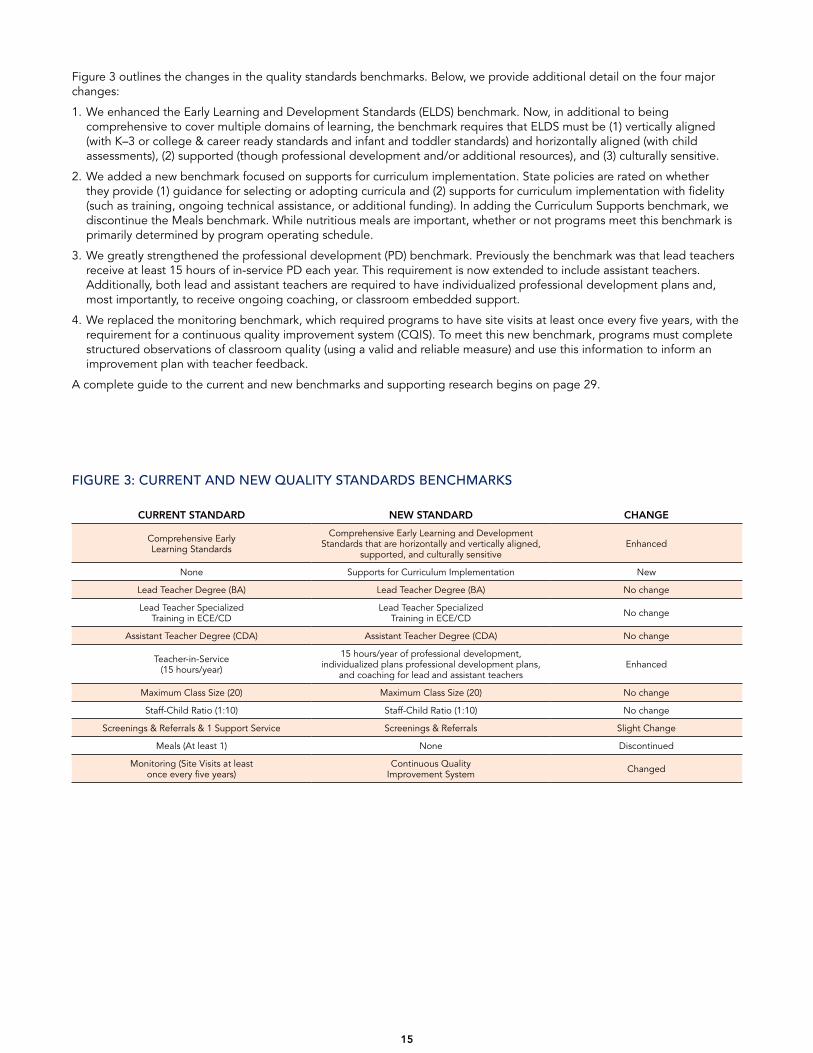
Figure 3 outlines the changes in the quality standards benchmarks. Below, we provide additional detail on the four major changes:
1. We enhanced the Early Learning and Development Standards (ELDS) benchmark. Now, in additional to being comprehensive to cover multiple domains of learning, the benchmark requires that ELDS must be (1) vertically aligned (with K–3 or college & career ready standards and infant and toddler standards) and horizontally aligned (with child assessments), (2) supported (though professional development and/or additional resources), and (3) culturally sensitive.
2. We added a new benchmark focused on supports for curriculum implementation. State policies are rated on whether they provide (1) guidance for selecting or adopting curricula and (2) supports for curriculum implementation with fidelity (such as training, ongoing technical assistance, or additional funding). In adding the Curriculum Supports benchmark, we discontinue the Meals benchmark. While nutritious meals are important, whether or not programs meet this benchmark is primarily determined by program operating schedule.
3. We greatly strengthened the professional development (PD) benchmark. Previously the benchmark was that lead teachers receive at least 15 hours of in-service PD each year. This requirement is now extended to include assistant teachers. Additionally, both lead and assistant teachers are required to have individualized professional development plans and, most importantly, to receive ongoing coaching, or classroom embedded support.
4. We replaced the monitoring benchmark, which required programs to have site visits at least once every five years, with the requirement for a continuous quality improvement system (CQIS). To meet this new benchmark, programs must complete structured observations of classroom quality (using a valid and reliable measure) and use this information to inform an improvement plan with teacher feedback.
A complete guide to the current and new benchmarks and supporting research begins on page 29.
FIGURE 3: CURRENT AND NEW QUALITY STANDARDS BENCHMARKS
CURRENT STANDARD NEW STANDARD CHANGE
Comprehensive Early Learning Standards
Comprehensive Early Learning and Development Standards that are horizontally and vertically aligned,
supported, and culturally sensitiveEnhanced
None Supports for Curriculum Implementation New
Lead Teacher Degree (BA) Lead Teacher Degree (BA) No change
Lead Teacher Specialized Training in ECE/CD
Lead Teacher Specialized Training in ECE/CD No change
Assistant Teacher Degree (CDA) Assistant Teacher Degree (CDA) No change
Teacher-in-Service (15 hours/year)
15 hours/year of professional development, individualized plans professional development plans,
and coaching for lead and assistant teachersEnhanced
Maximum Class Size (20) Maximum Class Size (20) No change
Staff-Child Ratio (1:10) Staff-Child Ratio (1:10) No change
Screenings & Referrals & 1 Support Service Screenings & Referrals Slight Change
Meals (At least 1) None Discontinued
Monitoring (Site Visits at least once every five years)
Continuous Quality Improvement System Changed
16
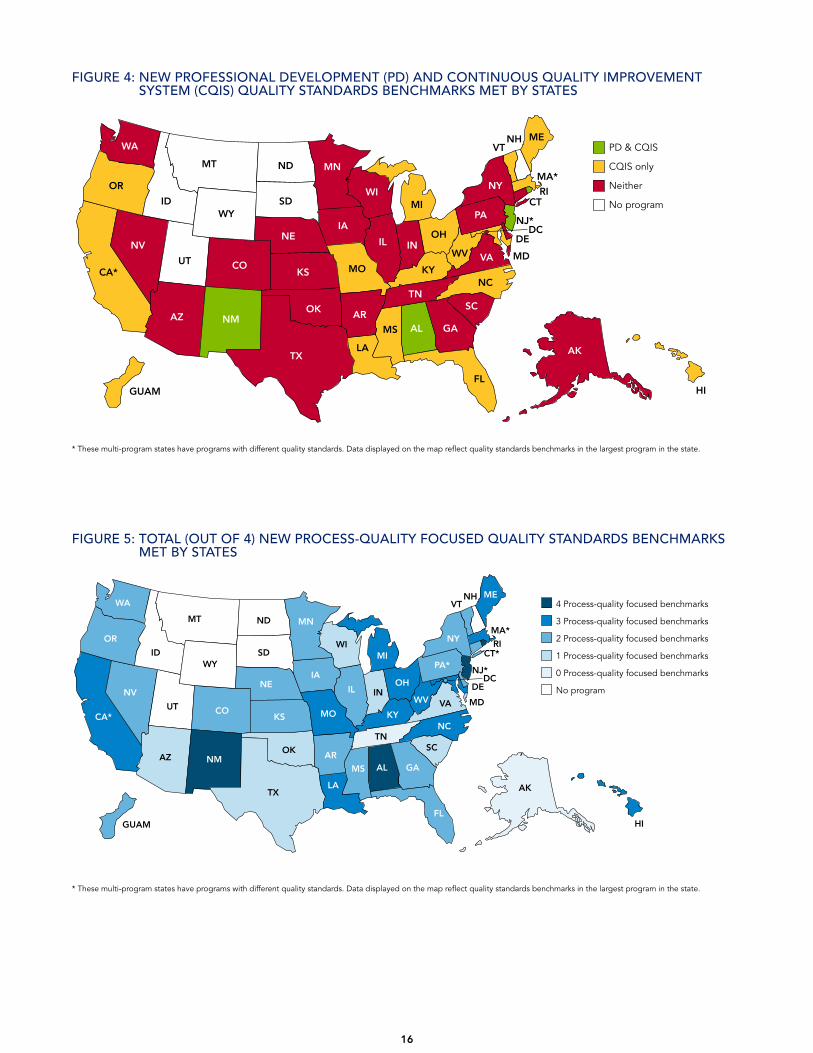
FIGURE 4: NEW PROFESSIONAL DEVELOPMENT (PD) AND CONTINUOUS QUALITY IMPROVEMENT SYSTEM (CQIS) QUALITY STANDARDS BENCHMARKS MET BY STATES
DC
MT
WA
OR
CA*
AK
GUAM
NV
IDWY
CO
NM
TX
OK
KS
NE
SD
ND MN
WI
IL
MI
OH
KY
TN
MS AL GA
SC
NC
VA
NJ*
VTNH
MA*
CT
DE
RI
MDWV
FL
PA
NY
ME
IN
IA
MO
AR
LA
UT
AZ
HI
PD & CQIS
CQIS only
Neither
No program
* These multi-program states have programs with different quality standards. Data displayed on the map reflect quality standards benchmarks in the largest program in the state.
FIGURE 5: TOTAL (OUT OF 4) NEW PROCESS-QUALITY FOCUSED QUALITY STANDARDS BENCHMARKS MET BY STATES
DC
MT
WA
OR
CA*
AK
GUAM
NV
IDWY
CO
NM
TX
OK
KS
NE
SD
ND MN
WI
IL
MI
OH
KY
TN
MS AL GA
SC
NC
VA
NJ*
VTNH
MA*
CT*
DE
RI
MDWV
FL
PA*
NY
ME
IN
IA
MO
AR
LA
UT
AZ
HI
4 Process-quality focused benchmarks
3 Process-quality focused benchmarks
2 Process-quality focused benchmarks
1 Process-quality focused benchmarks
0 Process-quality focused benchmarks
No program
* These multi-program states have programs with different quality standards. Data displayed on the map reflect quality standards benchmarks in the largest program in the state.
17
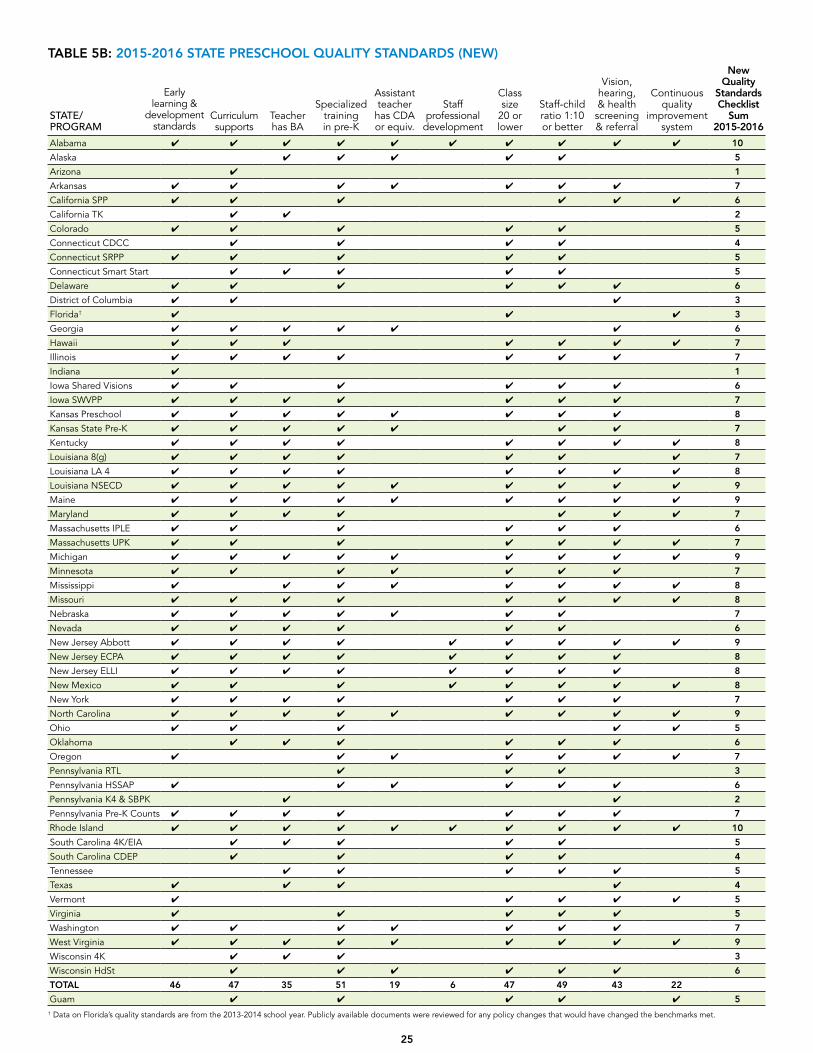
As NIEER raises the bar with its new quality standards benchmarks, many states met fewer benchmarks, reflecting the increased rigor of the new benchmarks. Only two programs, Nebraska and Ohio, met more quality standards on new benchmarks compared to current benchmarks in 2015-2016. Thirty-five programs met fewer new benchmarks than current quality standards benchmarks. Notably, Tennessee met four fewer quality standards on the new compared to current sets of quality standards. Oklahoma and Pennsylvania HSSAP met three fewer.
Only two states, Alabama and Rhode Island met all ten of the new quality standards benchmarks. Six programs met nine of the new benchmarks: Louisiana NSECD, Maine, Michigan, New Jersey Abbott, North Carolina, and West Virginia. Eleven programs met fewer than half: Arizona and Indiana each met only one; California TK and Pennsylvania K4 met two; the District of Columbia, Florida, Pennsylvania Ready to Learn, and Wisconsin 4K met three; and Connecticut CDCC, South Carolina CDEP, and Texas met four. Table 5b summarizes the new quality standards benchmarks met by each program. Our hope is that as we set out these new research-based benchmarks and provide information on the extent to which states do or do not meet them, state policies we be upgraded in response.
New professional development (PD) and continuous quality improvement system (CQIS) benchmarks are met by relatively few states. Only six programs in four states met the new professional development benchmark. (Alabama, all three New Jersey programs, New Mexico, and Rhode Island). Twenty programs met the new CQIS benchmark. Figure 4 shows which states met these two new quality standards benchmarks.
Looking at the four quality benchmarks that are new or substantially changed (Early learning and Development Standards, Curriculum Supports, Professional Development, and CQIS) and focused on process quality, only four programs met all four (Alabama, New Jersey Abbott, New Mexico, and Rhode Island). Four programs met none of these new quality standards: Alaska, Pennsylvania Ready to Learn and K4, and Tennessee. Figure 5 color codes states by the number of these new benchmarks met.
RESOURCES: AN UPHILL BATTLE
In 2015-2016, 43 states and the District of Columbia spent almost $7.4 billion on preschool, not including special education funds. The remaining seven states did not contribute to this total as they did not have a preschool program meeting the definition of state-funded preschool used in this report. (See page 27 for our explanation of what constitutes a state-funded preschool program.) Total state spending in 2015-2016 increased by more than $564 million, adjusting for inflation, an eight percent increase in spending from 2014-2015.
In addition, Guam spent $877,330 on the first year of its preschool program, including start-up costs. Table 6 reports state spending per child and in total, as well as changes in spending from the previous year.
On average, state spending per child was $4,976, an increase of $253 from the previous year, adjusted for inflation. This is the third largest year-to-year increase since the Yearbook began, and it raises the average per child spending to above pre-recession levels for the first time.
State spending per child varied dramatically across the states from $16,812 in the District of Columbia to less than $2,000 in Mississippi—meaning the District of Columbia spends almost nine times as much per child as Mississippi.
Many states rely on additional funds from local and federal sources to help fund their preschool programs. In 2015-2016, federal PDG dollars were a notable addition to funding for 18 states. Some states provide for local education agencies to share preschool costs through a formula just as they do for K–12 education. Funding from all sources is a better indicator of the total resources available to support preschool (though not a better indicator of state financial commitment). Unfortunately, not all states can fully, or even partially, report spending from local and federal sources. As a result, the all-reported spending per child numbers, reported in Table 6, understate total spending nationally, and comparisons across states can be distorted by differences in reporting.
Despite these limitations, local schools and federal funds added almost $1.1 billion to state preschool during the 2015-2016 school year, or $720 per child. Approximately $108 million, or 10 percent, was from the federal PDG. Spending from all-reported sources totaled more than $8.4 billion in 2015-2016, an all time high. Non-state funds reported included over $560 million in required local funds, $74 million in non-required local funds, and $434 million in non-TANF federal funds (including PDG). All reported spending per child was $5,696, an increase of $397 from the previous year, adjusted for inflation.
18
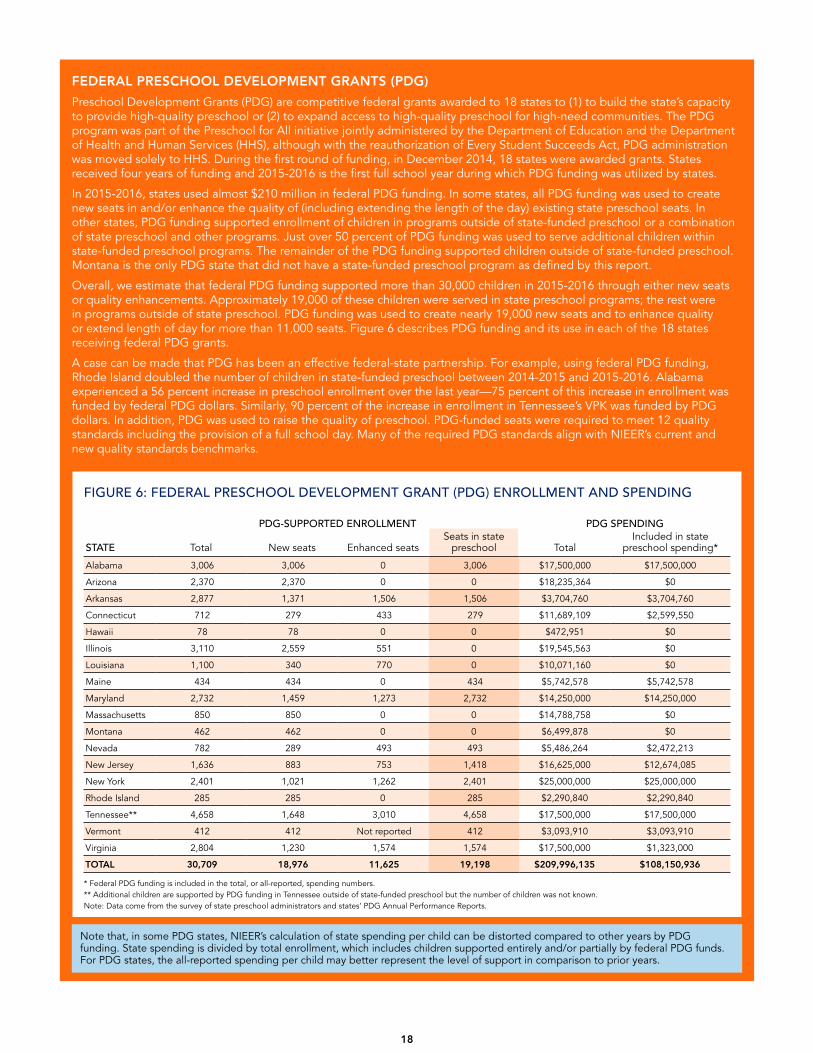
FIGURE 6: FEDERAL PRESCHOOL DEVELOPMENT GRANT (PDG) ENROLLMENT AND SPENDING
* Federal PDG funding is included in the total, or all-reported, spending numbers.** Additional children are supported by PDG funding in Tennessee outside of state-funded preschool but the number of children was not known. Note: Data come from the survey of state preschool administrators and states’ PDG Annual Performance Reports.
FEDERAL PRESCHOOL DEVELOPMENT GRANTS (PDG)
Preschool Development Grants (PDG) are competitive federal grants awarded to 18 states to (1) to build the state’s capacity to provide high-quality preschool or (2) to expand access to high-quality preschool for high-need communities. The PDG program was part of the Preschool for All initiative jointly administered by the Department of Education and the Department of Health and Human Services (HHS), although with the reauthorization of Every Student Succeeds Act, PDG administration was moved solely to HHS. During the first round of funding, in December 2014, 18 states were awarded grants. States received four years of funding and 2015-2016 is the first full school year during which PDG funding was utilized by states.
In 2015-2016, states used almost $210 million in federal PDG funding. In some states, all PDG funding was used to create new seats in and/or enhance the quality of (including extending the length of the day) existing state preschool seats. In other states, PDG funding supported enrollment of children in programs outside of state-funded preschool or a combination of state preschool and other programs. Just over 50 percent of PDG funding was used to serve additional children within state-funded preschool programs. The remainder of the PDG funding supported children outside of state-funded preschool. Montana is the only PDG state that did not have a state-funded preschool program as defined by this report.
Overall, we estimate that federal PDG funding supported more than 30,000 children in 2015-2016 through either new seats or quality enhancements. Approximately 19,000 of these children were served in state preschool programs; the rest were in programs outside of state preschool. PDG funding was used to create nearly 19,000 new seats and to enhance quality or extend length of day for more than 11,000 seats. Figure 6 describes PDG funding and its use in each of the 18 states receiving federal PDG grants.
A case can be made that PDG has been an effective federal-state partnership. For example, using federal PDG funding, Rhode Island doubled the number of children in state-funded preschool between 2014-2015 and 2015-2016. Alabama experienced a 56 percent increase in preschool enrollment over the last year—75 percent of this increase in enrollment was funded by federal PDG dollars. Similarly, 90 percent of the increase in enrollment in Tennessee’s VPK was funded by PDG dollars. In addition, PDG was used to raise the quality of preschool. PDG-funded seats were required to meet 12 quality standards including the provision of a full school day. Many of the required PDG standards align with NIEER’s current and new quality standards benchmarks.
STATE
PDG-SUPPORTED ENROLLMENT PDG SPENDING
Total New seats Enhanced seatsSeats in state
preschool TotalIncluded in state
preschool spending*
Alabama 3,006 3,006 0 3,006 $17,500,000 $17,500,000
Arizona 2,370 2,370 0 0 $18,235,364 $0
Arkansas 2,877 1,371 1,506 1,506 $3,704,760 $3,704,760
Connecticut 712 279 433 279 $11,689,109 $2,599,550
Hawaii 78 78 0 0 $472,951 $0
Illinois 3,110 2,559 551 0 $19,545,563 $0
Louisiana 1,100 340 770 0 $10,071,160 $0
Maine 434 434 0 434 $5,742,578 $5,742,578
Maryland 2,732 1,459 1,273 2,732 $14,250,000 $14,250,000
Massachusetts 850 850 0 0 $14,788,758 $0
Montana 462 462 0 0 $6,499,878 $0
Nevada 782 289 493 493 $5,486,264 $2,472,213
New Jersey 1,636 883 753 1,418 $16,625,000 $12,674,085
New York 2,401 1,021 1,262 2,401 $25,000,000 $25,000,000
Rhode Island 285 285 0 285 $2,290,840 $2,290,840
Tennessee** 4,658 1,648 3,010 4,658 $17,500,000 $17,500,000
Vermont 412 412 Not reported 412 $3,093,910 $3,093,910
Virginia 2,804 1,230 1,574 1,574 $17,500,000 $1,323,000
TOTAL 30,709 18,976 11,625 19,198 $209,996,135 $108,150,936
Note that, in some PDG states, NIEER’s calculation of state spending per child can be distorted compared to other years by PDG funding. State spending is divided by total enrollment, which includes children supported entirely and/or partially by federal PDG funds. For PDG states, the all-reported spending per child may better represent the level of support in comparison to prior years.
19
THE NEED FOR DATA: 20/20 VISION
NIEER’s quality standards benchmarks gauge the extent to which states’ preschool policies lay the groundwork for high-quality preschool. However, this does not directly assess the quality of children’s actual experiences in preschool classrooms. Even NIEER’s new quality standards benchmarks are still preconditions for quality, not a guarantee.
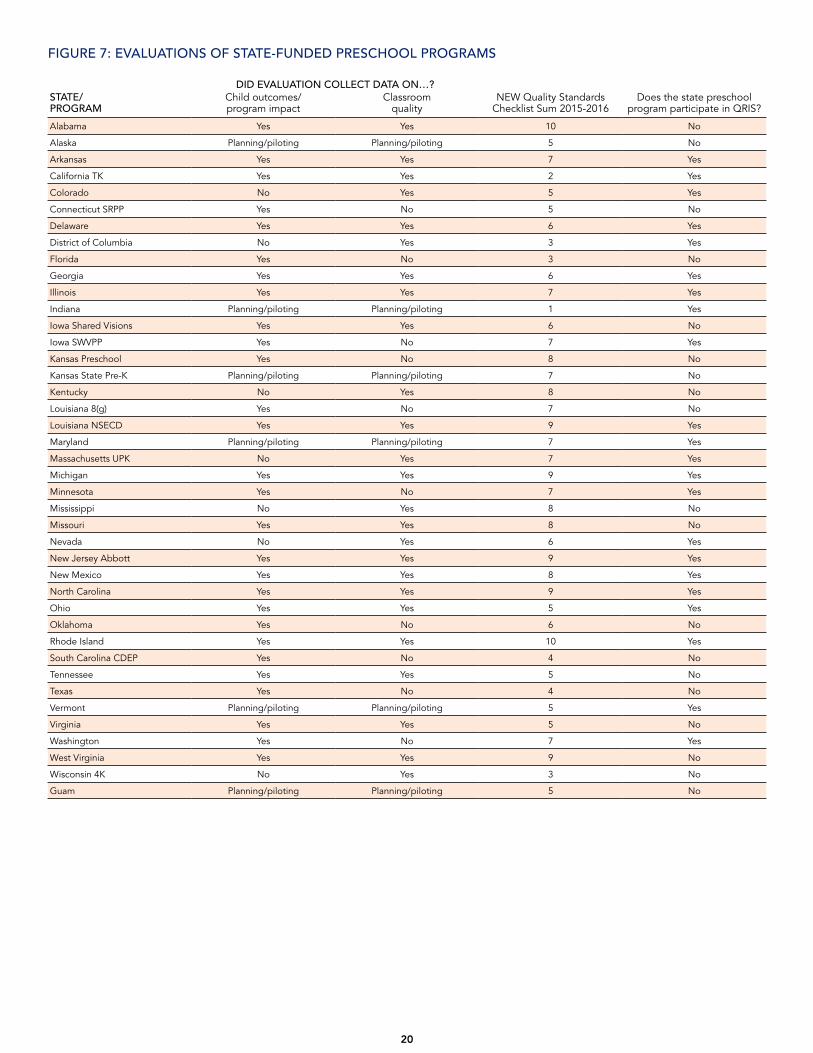
For this reason, we hope to be able to include direct measures of quality in future Yearbooks. To investigate the extent to which this may be possible, we collected data from the states regarding data on classroom quality and child outcomes that has already been collected (or will be collected soon). A total of 34 programs in 32 states and the District of Columbia report having a program evaluation. An additional six programs (including Guam) are currently either planning or piloting an evaluation. Twenty-five programs measured classroom process quality in their evaluation, and 28 programs measured child impacts or “program impacts.” Eighteen programs reported measuring both classroom quality and child impacts. Many of the states with program evaluations are also leaders in quality as assessed by NIEER’s quality standards benchmarks. Alabama and Rhode Island, the two states that met all 10 new standards, and five of the six programs that met nine (Louisiana NSECD, Michigan, New Jersey Abbott, North Carolina, and West Virginia), have completed evaluations that include both child outcomes and classroom process quality. Figure 7 summarizes information on state-funded programs’ evaluations.
The last nationally representative picture of observed early childhood classroom quality was in 2005, as part of the Early Childhood Longitudinal Study—Birth Cohort. Since then, early childhood education programs have expanded across the country and policies have changed—at both the state and federal levels. The nation is long overdue for another snapshot of observed early childhood classroom quality. We recommend a new nationally representative study of early childhood education classrooms including state- and locally-funded preschool programs as well as child care and Head Start. Ideally, this data collection effort would provide classroom quality data that is also representative at the state level. A national report card on the observed quality of experiences provided to children in both public and private preschool would inform policy making and provide a tool for parents to understand what is available and how much it varies across the nation and state by state.
20
FIGURE 7: EVALUATIONS OF STATE-FUNDED PRESCHOOL PROGRAMS
STATE/ PROGRAM
DID EVALUATION COLLECT DATA ON…?NEW Quality Standards
Checklist Sum 2015-2016Does the state preschool
program participate in QRIS?Child outcomes/ program impact
Classroom quality
Alabama Yes Yes 10 No
Alaska Planning/piloting Planning/piloting 5 No
Arkansas Yes Yes 7 Yes
California TK Yes Yes 2 Yes
Colorado No Yes 5 Yes
Connecticut SRPP Yes No 5 No
Delaware Yes Yes 6 Yes
District of Columbia No Yes 3 Yes
Florida Yes No 3 No
Georgia Yes Yes 6 Yes
Illinois Yes Yes 7 Yes
Indiana Planning/piloting Planning/piloting 1 Yes
Iowa Shared Visions Yes Yes 6 No
Iowa SWVPP Yes No 7 Yes
Kansas Preschool Yes No 8 No
Kansas State Pre-K Planning/piloting Planning/piloting 7 No
Kentucky No Yes 8 No
Louisiana 8(g) Yes No 7 No
Louisiana NSECD Yes Yes 9 Yes
Maryland Planning/piloting Planning/piloting 7 Yes
Massachusetts UPK No Yes 7 Yes
Michigan Yes Yes 9 Yes
Minnesota Yes No 7 Yes
Mississippi No Yes 8 No
Missouri Yes Yes 8 No
Nevada No Yes 6 Yes
New Jersey Abbott Yes Yes 9 Yes
New Mexico Yes Yes 8 Yes
North Carolina Yes Yes 9 Yes
Ohio Yes Yes 5 Yes
Oklahoma Yes No 6 No
Rhode Island Yes Yes 10 Yes
South Carolina CDEP Yes No 4 No
Tennessee Yes Yes 5 No
Texas Yes No 4 No
Vermont Planning/piloting Planning/piloting 5 Yes
Virginia Yes Yes 5 No
Washington Yes No 7 Yes
West Virginia Yes Yes 9 No
Wisconsin 4K No Yes 3 No
Guam Planning/piloting Planning/piloting 5 No
21
TABLE 2: STATE PRESCHOOL ACCESS BY STATE
ACCESS FOR 4-YEAR-OLDRANK STATE
PERCENT OF CHILDREN ENROLLED IN STATE PREKINDERGARTEN (2015-2016)
NUMBER OF CHILDREN ENROLLED IN STATE PREKINDERGARTEN (2015-2016)
4-year-olds 3-year-olds Total (3s and 4s) 4-year-olds 3-year-olds Total (3s and 4s)
1 District of Columbia 81.2% 70.0% 75.7% 6,944 5,736 12,680
2 Florida 76.0% 0.0% 38.2% 169,025 0 169,025
3 Oklahoma 73.8% 3.1% 38.5% 39,593 1,648 41,241
4 Wisconsin 71.0% 0.8% 35.9% 48,859 579 49,438
5 Vermont 66.7% 43.8% 55.2% 4,096 2,708 6,804
6 West Virginia 66.4% 11.0% 38.5% 13,615 2,277 15,892
7 Iowa 63.7% 3.0% 33.1% 24,750 1,166 25,916
8 Georgia 59.7% 0.0% 30.0% 80,825 0 80,825
9 New York 49.9% 0.6% 25.4% 118,560 1,509 120,069
10 Texas 48.7% 6.6% 27.9% 194,861 25,779 220,640
11 Maine 40.2% 0.0% 19.9% 5,177 0 5,177
12 South Carolina 40.0% 0.0% 20.1% 23,536 0 23,536
13 Maryland 35.7% 5.0% 20.6% 27,003 3,733 30,736
14 California 35.0% 8.5% 21.9% 178,821 42,354 221,175
15 Michigan 33.6% 0.0% 16.9% 38,771 0 38,771
16 New Mexico 33.3% 1.9% 17.8% 9,254 503 9,757
17 Louisiana 32.2% 0.0% 16.1% 19,860 0 19,860
18 Arkansas 32.0% 18.4% 25.2% 12,314 7,127 19,441
19 Nebraska 31.6% 14.1% 22.8% 8,227 3,670 11,897
20 New Jersey 29.1% 19.6% 24.4% 31,800 20,970 52,770
21 Illinois 26.1% 19.9% 23.0% 41,397 31,458 72,855
22 Kentucky 25.8% 9.0% 17.4% 14,232 4,950 19,182
23 Connecticut 23.7% 9.5% 16.7% 9,222 3,623 12,845
24 Colorado 23.1% 8.1% 15.7% 15,704 5,429 21,133
25 North Carolina 21.9% 0.0% 11.0% 26,851 0 26,851
26 Tennessee 21.8% 0.7% 11.2% 17,419 585 18,004
27 Kansas 19.8% 0.0% 9.9% 7,903 0 7,903
28 Alabama 18.9% 0.0% 9.5% 11,296 0 11,296
29 Virginia 17.8% 0.0% 8.9% 18,356 0 18,356
30 Pennsylvania 11.6% 6.3% 9.0% 16,820 8,995 25,815
31 Oregon 9.9% 7.0% 8.5% 4,626 3,214 7,840
32 Washington 8.6% 4.4% 6.5% 7,702 3,989 11,691
33 Ohio 7.8% 2.8% 5.3% 10,846 3,919 14,765
34 Massachusetts 7.6% 7.3% 7.5% 5,681 5,329 11,010
35 Delaware 7.3% 0.0% 3.7% 843 0 843
36 Rhode Island 5.4% 0.0% 2.7% 594 0 594
37 Arizona 4.4% 1.9% 3.1% 3,763 1,602 5,365
38 Mississippi 3.9% 0.7% 2.3% 1,517 263 1,780
39 Nevada 3.8% 0.5% 2.2% 1,357 179 1,536
40 Alaska 2.8% 0.0% 1.5% 319 0 319
41 Missouri 2.1% 1.2% 1.7% 1,563 926 2,489
42 Hawaii 2.0% 0.0% 1.0% 375 0 375
43 Indiana 1.9% 0.0% 0.9% 1,585 0 1,585
44 Minnesota 1.2% 1.1% 1.2% 858 759 1,617
No Program Idaho 0.0% 0.0% 0.0% 0 0 0
No Program Montana 0.0% 0.0% 0.0% 0 0 0
No Program New Hampshire 0.0% 0.0% 0.0% 0 0 0
No Program North Dakota 0.0% 0.0% 0.0% 0 0 0
No Program South Dakota 0.0% 0.0% 0.0% 0 0 0
No Program Utah 0.0% 0.0% 0.0% 0 0 0
No Program Wyoming 0.0% 0.0% 0.0% 0 0 0
United States 31.8% 4.9% 18.4% 1,276,719 194,979 1,471,698*
Guam 2.6% 0.0% 1.8% 72 0 72
For details about how these figures were calculated, see the Methodology section and Roadmap to the State Profile Pages.*Nationwide, an additional 16,030 children of other ages were enrolled in state prekindergarten, for a total enrollment of 1,487,728.
22
TABLE 3: CHANGE IN PRESCHOOL ENROLLMENT OVER TIME
ENROLLMENT CHANGES FROM 2001-2002 TO 2015-2016 ENROLLMENT CHANGES FROM 2014-2015 TO 2015-2016
Change in 3-year-olds Change in 4-year-olds Change in 3-year-olds Change in 4-year-olds
STATE Number % point Number % point Number % point Number % point
Alabama 0 0% 10,540 18% 0 0% 4,053 7%
Alaska 0 0% 319 3% 0 0% 0 0%
Arizona 1,602 2% -514 -1% -776 -1% -1,087 -1%
Arkansas 6,185 16% 10,090 26% 572 1% -986 -3%
California 31,430 6% 134,287 26% -214 0% 13,753 2%
Colorado 4,699 7% 7,384 9% 54 0% -209 0%
Connecticut* 2,087 6% 4,806 14% 4 0% 246 1%
Delaware 0 0% 0 -1% 0 0% 0 0%
District of Columbia 4,611 50% 3,933 37% 195 6% 307 -5%
Florida 0 0% 169,025 76% 0 0% 2,503 0%
Georgia 0 0% 17,212 6% 0 0% 395 1%
Hawaii 0 0% 375 2% 0 0% 10 0%
Idaho 0 0% 0 0% 0 0% 0 0%
Illinois 17,360 12% 2,495 5% -67 0% -1,990 -1%
Indiana 0 0% 1,585 2% 0 0% 1,170 1%
Iowa 655 2% 23,194 60% -165 0% 366 3%
Kansas 0 0% 5,673 14% 0 0% -231 0%
Kentucky 78 0% 1,415 2% 463 1% 3 0%
Louisiana 0 0% 12,341 20% 0 0% 128 0%
Maine 0 0% 3,737 30% 0 0% 380 4%
Maryland 2,325 3% 8,629 11% 310 0% 372 0%
Massachusetts -4,103 -5% -3,751 -4% 293 0% 443 0%
Michigan 0 0% 12,294 15% 0 0% 1,659 2%
Minnesota* -56 0% -412 -1% 218 0% 123 0%
Mississippi 263 1% 1,517 4% 144 0% -124 0%
Missouri -1,620 -2% -2,123 -3% -372 0% -1,398 -2%
Montana 0 0% 0 0% 0 0% 0 0%
Nebraska 3,546 14% 7,871 30% 159 1% 207 1%
Nevada 68 0% 1,036 3% -134 0% 272 1%
New Hampshire 0 0% 0 0% 0 0% 0 0%
New Jersey 8,185 8% 7,919 9% 640 1% 1,097 1%
New Mexico 33 0% 8,884 32% 503 2% 857 3%
New York -4,326 -2% 55,061 25% 1,362 1% 6,587 1%
North Carolina 0 0% 25,611 21% 0 0% 0 0%
North Dakota 0 0% 0 0% 0 0% 0 0%
Ohio -5,795 -4% -3,039 -1% 924 1% 4,192 3%
Oklahoma 1,648 3% 13,714 18% 1,648 3% -492 -1%
Oregon 2,105 5% 2,037 4% 226 1% -48 0%
Pennsylvania* 8,995 6% 14,270 10% 650 0% -274 0%
Rhode Island 0 0% 594 5% 0 0% 288 3%
South Carolina* -350 -1% 7,886 11% -2,320 -4% -4,566 -7%
South Dakota 0 0% 0 0% 0 0% 0 0%
Tennessee* -257 0% 15,661 19% 59 0% 1,771 2%
Texas 6,038 0% 67,278 10% -2,835 -1% 5,065 1%
Utah 0 0% 0 0% 0 0% 0 0%
Vermont 2,339 38% 3,476 58% 184 3% 278 3%
Virginia 0 0% 12,478 11% 0 0% 106 0%
Washington 2,840 3% 2,917 3% 1,026 1% 574 1%
West Virginia 509 2% 8,530 42% -61 0% -164 -2%
Wisconsin* -109 0% 35,355 52% 35 0% 4,495 7%
Wyoming 0 0% 0 0% 0 0% 0 0%
United States 90,986 2% 711,588 17% 2,725 0% 40,131 1%
* At least one program in these states did not break down total enrollment figures into specific numbers of 3- and 4-year-olds served. As a result, the figures in this table are estimates.

23
TABLE 4: 2015-2016 ENROLLMENT OF 3- AND 4-YEAR-OLDS IN STATE PRESCHOOL, PRESCHOOL SPECIAL EDUCATION, AND FEDERAL AND STATE HEAD START
PRE-K + PRE-K SPECIAL EDUCATION PRE-K + PRE-K SPECIAL EDUCATION + HEAD START††
3-year-olds 4-year-olds 3-year-olds 4-year-olds
STATENumber enrolled
% of state population
Number enrolled
% of state population
Number enrolled
% of state population
Number enrolled
% of state population
Alabama 849 1.4% 12,243 20.5% 6,867 11.7% 20,745 34.8%
Alaska 348 3.3% 826 7.4% 1,495 14.2% 2,239 19.9%
Arizona 4,580 5.4% 8,087 9.4% 9,577 11.2% 18,041 20.9%
Arkansas 9,286 24.0% 16,072 41.8% 13,183 34.1% 19,919 51.8%
California 56,977 11.5% 192,221 37.6% 95,538 19.2% 233,489 45.7%
Colorado 8,160 12.2% 19,532 28.7% 11,992 18.0% 24,732 36.3%
Connecticut*,† 5,673 14.9% 10,894 28.0% 7,953 20.9% 12,982 33.3%
Delaware 442 3.9% 1,474 12.8% 1,309 11.6% 2,453 21.4%
District of Columbia† 5,736 70.0% 6,944 81.2% 5,736 70.0% 6,944 81.2%
Florida* 6,684 3.0% 169,025 76.0% 20,121 9.1% 188,505 84.8%
Georgia† 2,645 2.0% 82,447 60.9% 14,241 10.7% 86,299 63.8%
Hawaii 599 3.3% 1,062 5.8% 1,597 8.9% 2,505 13.6%
Idaho 638 2.9% 921 4.0% 1,617 7.2% 2,969 12.9%
Illinois† 32,933 20.9% 46,670 29.4% 48,041 30.4% 63,435 39.9%
Indiana*,† 3,690 4.4% 6,437 7.6% 9,392 11.2% 13,042 15.5%
Iowa† 1,788 4.5% 25,372 65.3% 4,305 10.9% 27,097 69.8%
Kansas 2,276 5.7% 11,266 28.2% 5,058 12.8% 13,984 35.0%
Kentucky† 4,950 9.0% 14,232 25.8% 9,348 16.9% 21,740 39.4%
Louisiana* 849 1.4% 21,176 34.3% 12,010 19.5% 28,500 46.1%
Maine*,† 485 3.7% 5,648 43.8% 1,465 11.2% 6,708 52.1%
Maryland 4,543 6.1% 28,421 37.6% 8,904 12.0% 32,493 43.0%
Massachusetts† 7,919 10.8% 9,883 13.3% 11,481 15.7% 12,803 17.2%
Michigan† 3,581 3.1% 38,771 33.6% 15,840 13.8% 46,052 40.0%
Minnesota† 3,513 5.0% 5,577 8.0% 7,228 10.4% 9,888 14.1%
Mississippi† 736 1.9% 3,233 8.3% 10,204 26.1% 14,905 38.1%
Missouri 3,787 5.1% 6,798 9.0% 9,564 12.8% 12,715 16.9%
Montana 112 0.9% 234 1.9% 1,629 13.2% 2,681 21.9%
Nebraska† 3,670 14.1% 8,227 31.6% 4,425 17.0% 9,024 34.7%
Nevada 1,986 5.7% 4,067 11.3% 3,287 9.4% 5,406 15.0%
New Hampshire 826 6.5% 1,133 8.4% 1,368 10.8% 1,846 13.7%
New Jersey† 25,855 24.2% 38,314 35.1% 29,655 27.8% 42,115 38.6%
New Mexico 1,706 6.3% 10,614 38.2% 5,106 18.8% 14,515 52.2%
New York† 16,819 7.1% 129,056 54.3% 37,217 15.8% 144,974 61.0%
North Carolina† 3,440 2.8% 30,852 25.2% 10,589 8.8% 36,398 29.7%
North Dakota 341 3.2% 500 5.0% 1,518 14.5% 1,845 18.3%
Ohio 7,594 5.5% 16,591 12.0% 21,408 15.5% 33,440 24.2%
Oklahoma 1,648 3.1% 39,593 73.8% 9,710 18.2% 45,884 85.5%
Oregon† 5,129 11.1% 7,031 15.1% 5,128 11.1% 7,031 15.1%
Pennsylvania*,† 15,524 10.8% 25,775 17.8% 24,189 16.9% 36,982 25.6%
Rhode Island 644 5.8% 1,399 12.7% 1,521 13.7% 2,665 24.2%
South Carolina 1,389 2.4% 25,696 43.7% 7,570 12.9% 30,167 51.3%
South Dakota 389 3.2% 555 4.6% 2,088 17.2% 2,596 21.6%
Tennessee* 2,241 2.8% 18,943 23.7% 8,426 10.4% 27,992 35.0%
Texas 31,434 8.0% 198,661 49.7% 60,899 15.5% 233,553 58.4%
Utah 2,332 4.7% 3,090 6.2% 4,348 8.8% 6,331 12.6%
Vermont 2,817 45.5% 4,096 66.7% 3,314 53.6% 4,589 74.7%
Virginia 3,330 3.2% 23,281 22.6% 8,438 8.2% 30,150 29.2%
Washington 6,605 7.4% 11,486 12.8% 11,164 12.4% 17,743 19.7%
West Virginia† 2,277 11.0% 13,615 66.4% 3,997 19.2% 14,289 69.7%
Wisconsin**,† 2,810 4.1% 48,859 71.0% 9,446 13.7% 53,570 77.8%
Wyoming 800 10.4% 1,094 14.3% 1,438 18.7% 1,897 24.7%
United States 315,383 7.9% 1,407,995 35.0% 621,943 15.7% 1,732,867 43.1%
* These states serve special education children in their state pre-K programs but were not able to provide the number of children for at least one of their programs. Estimates were used based on the average percent of special education students in state pre-K across all programs and enrollment numbers for each program.
** These states serve special education children in their state-funded Head Start pre-K programs but were not able to provide the number of children. Estimates were used based on the percent of children with IEPs in Head Start in the state as reported by the PIR.
† At least one program in these states were able to report the number of children enrolled in state pre-K and Head Start. This information was used to estimate an unduplicated count of Head Start enrollment.
†† Totals can overestimate public enrollment in state pre-K, pre-K special education, and Head Start as some or all of Head Start children may be served in a state’s pre-K program and many states could not report this information.
For details about how these figures were calculated, see the Methodology section and the Roadmap to the State Profile Pages.
24
TABLE 5A: 2015-2016 STATE PRESCHOOL QUALITY STANDARDS (CURRENT)
STATE/ PROGRAM
Comprehensiveearly learning
standardsTeacher has BA
Specializedtraining in pre-K
Assistant teacher
has CDA or equiv.
At least 15 hrs/yr in-service
(for teachers)
Class size 20
or lower
Staff-child ratio 1:10 or better
Vision, hearing, health & one
support service
At least one meal
SIte visits
Current Quality
Standards Checklist
Sum 2015-2016
Alabama 4 4 4 4 4 4 4 4 4 4 10
Alaska 4 4 4 4 4 4 4 7
Arizona 4 4 4 3
Arkansas 4 4 4 4 4 4 4 4 4 9
California SPP 4 4 4 4 4 4 6
California TK 4 4 2
Colorado 4 4 4 4 4 4 6
Connecticut CDCC 4 4 4 4 4 4 6
Connecticut SRPP 4 4 4 4 4 5
Connecticut Smart Start 4 4 4 4 4 5
Delaware 4 4 4 4 4 4 4 4 8
District of Columbia 4 4 4 4 4
Florida† 4 4 4 3
Georgia 4 4 4 4 4 4 4 4 8
Hawaii 4 4 4 4 4 4 4 4 8
Illinois 4 4 4 4 4 4 4 4 8
Indiana 4 4 4 3
Iowa Shared Visions 4 4 4 4 4 4 6
Iowa SWVPP 4 4 4 4 4 4 4 7
Kansas Preschool 4 4 4 4 4 4 4 4 8
Kansas State Pre-K 4 4 4 4 4 4 4 7
Kentucky 4 4 4 4 4 4 4 4 4 9
Louisiana 8(g) 4 4 4 4 4 4 4 4 8
Louisiana LA 4 4 4 4 4 4 4 4 4 4 9
Louisiana NSECD 4 4 4 4 4 4 4 4 4 4 10
Maine 4 4 4 4 4 4 4 4 4 9
Maryland 4 4 4 4 4 4 4 4 8
Massachusetts IPLE 4 4 4 4 4 4 4 7
Massachusetts UPK 4 4 4 4 4 4 4 7
Michigan 4 4 4 4 4 4 4 4 4 9
Minnesota 4 4 4 4 4 4 4 4 4 9
Mississippi 4 4 4 4 4 4 4 4 4 4 10
Missouri 4 4 4 4 4 4 4 4 8
Nebraska 4 4 4 4 4 4 6
Nevada 4 4 4 4 4 4 4 7
New Jersey Abbott 4 4 4 4 4 4 4 4 4 9
New Jersey ECPA 4 4 4 4 4 4 4 4 8
New Jersey ELLI 4 4 4 4 4 4 4 4 8
New Mexico 4 4 4 4 4 4 4 4 8
New York 4 4 4 4 4 4 4 7
North Carolina 4 4 4 4 4 4 4 4 4 4 10
Ohio 4 4 4 4 4
Oklahoma 4 4 4 4 4 4 4 4 4 9
Oregon 4 4 4 4 4 4 4 4 4 9
Pennsylvania RTL 4 4 4 4 4 5
Pennsylvania HSSAP 4 4 4 4 4 4 4 4 4 9
Pennsylvania K4 & SBPK 4 4 2
Pennsylvania Pre-K Counts 4 4 4 4 4 4 4 4 4 9
Rhode Island 4 4 4 4 4 4 4 4 4 4 10
South Carolina 4K/EIA 4 4 4 4 4 4 6
South Carolina CDEP 4 4 4 4 4 4 6
Tennessee 4 4 4 4 4 4 4 4 4 9
Texas 4 4 4 4 4
Vermont 4 4 4 4 4 4 6
Virginia 4 4 4 4 4 4 6
Washington 4 4 4 4 4 4 4 4 4 9
West Virginia 4 4 4 4 4 4 4 4 4 4 10
Wisconsin 4K 4 4 4 4 4
Wisconsin HdSt 4 4 4 4 4 4 4 4 8
TOTAL 59 35 51 19 49 47 49 41 28 42
Guam 4 4 4 4 4 4 4 7
† Data on Florida’s quality standards are from the 2013-2014 school year. Publicly available documents were reviewed for any policy changes that would have changed the benchmarks met.
25
TABLE 5B: 2015-2016 STATE PRESCHOOL QUALITY STANDARDS (NEW)
STATE/ PROGRAM
Curriculum supports
Teacherhas BA
Specializedtraining in pre-K
Assistant teacher
has CDA or equiv.
Staffprofessional
development
Class size
20 or lower
Staff-child ratio 1:10 or better
Vision, hearing, & health
screening & referral
Continuousquality
improvementsystem
New Quality
Standards Checklist
Sum 2015-2016
Alabama 4 4 4 4 4 4 4 4 4 4 10
Alaska 4 4 4 4 4 5
Arizona 4 1
Arkansas 4 4 4 4 4 4 4 7
California SPP 4 4 4 4 4 4 6
California TK 4 4 2
Colorado 4 4 4 4 4 5
Connecticut CDCC 4 4 4 4 4
Connecticut SRPP 4 4 4 4 4 5
Connecticut Smart Start 4 4 4 4 4 5
Delaware 4 4 4 4 4 4 6
District of Columbia 4 4 4 3
Florida† 4 4 4 3
Georgia 4 4 4 4 4 4 6
Hawaii 4 4 4 4 4 4 4 7
Illinois 4 4 4 4 4 4 4 7
Indiana 4 1
Iowa Shared Visions 4 4 4 4 4 4 6
Iowa SWVPP 4 4 4 4 4 4 4 7
Kansas Preschool 4 4 4 4 4 4 4 4 8
Kansas State Pre-K 4 4 4 4 4 4 4 7
Kentucky 4 4 4 4 4 4 4 4 8
Louisiana 8(g) 4 4 4 4 4 4 4 7
Louisiana LA 4 4 4 4 4 4 4 4 4 8
Louisiana NSECD 4 4 4 4 4 4 4 4 4 9
Maine 4 4 4 4 4 4 4 4 4 9
Maryland 4 4 4 4 4 4 4 7
Massachusetts IPLE 4 4 4 4 4 4 6
Massachusetts UPK 4 4 4 4 4 4 4 7
Michigan 4 4 4 4 4 4 4 4 4 9
Minnesota 4 4 4 4 4 4 4 7
Mississippi 4 4 4 4 4 4 4 4 8
Missouri 4 4 4 4 4 4 4 4 8
Nebraska 4 4 4 4 4 4 4 7
Nevada 4 4 4 4 4 4 6
New Jersey Abbott 4 4 4 4 4 4 4 4 4 9
New Jersey ECPA 4 4 4 4 4 4 4 4 8
New Jersey ELLI 4 4 4 4 4 4 4 4 8
New Mexico 4 4 4 4 4 4 4 4 8
New York 4 4 4 4 4 4 4 7
North Carolina 4 4 4 4 4 4 4 4 4 9
Ohio 4 4 4 4 4 5
Oklahoma 4 4 4 4 4 4 6
Oregon 4 4 4 4 4 4 4 7
Pennsylvania RTL 4 4 4 3
Pennsylvania HSSAP 4 4 4 4 4 4 6
Pennsylvania K4 & SBPK 4 4 2
Pennsylvania Pre-K Counts 4 4 4 4 4 4 4 7
Rhode Island 4 4 4 4 4 4 4 4 4 4 10
South Carolina 4K/EIA 4 4 4 4 4 5
South Carolina CDEP 4 4 4 4 4
Tennessee 4 4 4 4 4 5
Texas 4 4 4 4 4
Vermont 4 4 4 4 4 5
Virginia 4 4 4 4 4 5
Washington 4 4 4 4 4 4 4 7
West Virginia 4 4 4 4 4 4 4 4 4 9
Wisconsin 4K 4 4 4 3
Wisconsin HdSt 4 4 4 4 4 4 6
TOTAL 46 47 35 51 19 6 47 49 43 22
Guam 4 4 4 4 4 5† Data on Florida’s quality standards are from the 2013-2014 school year. Publicly available documents were reviewed for any policy changes that would have changed the benchmarks met.
Early learning &
developmentstandards
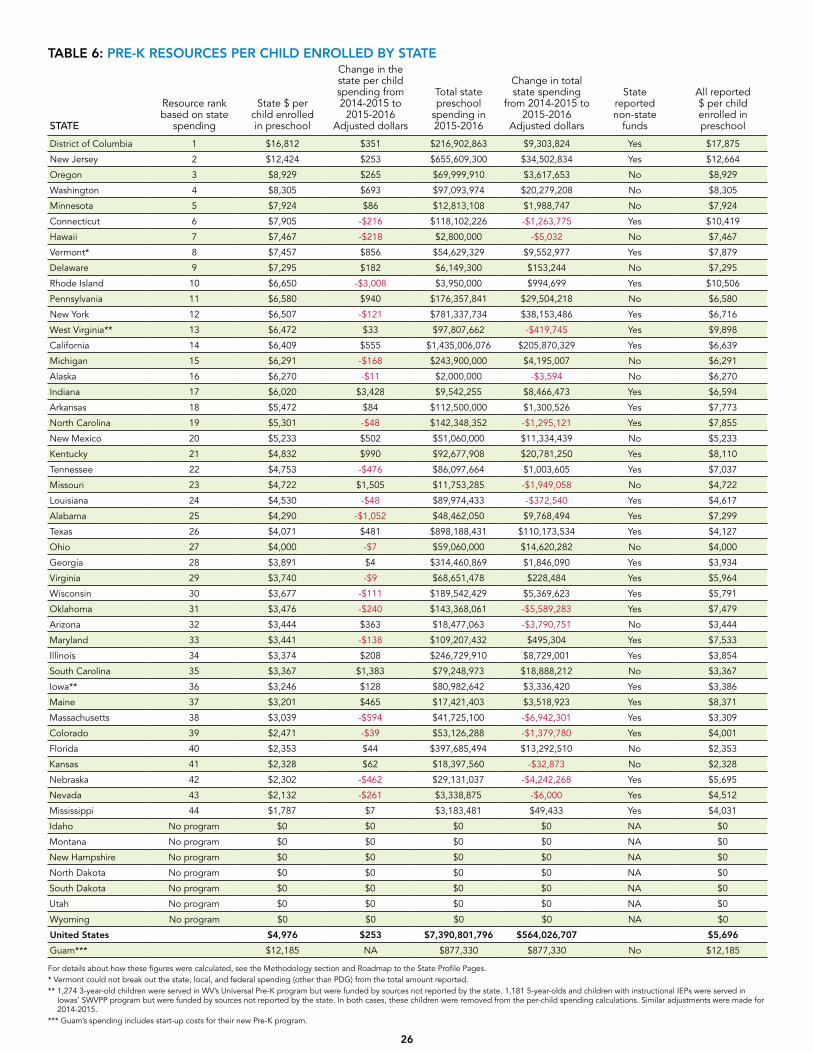
26
TABLE 6: PRE-K RESOURCES PER CHILD ENROLLED BY STATE
STATE
Resource rank based on state
spending
State $ per child enrolled in preschool
Change in the state per child spending from 2014-2015 to
2015-2016 Adjusted dollars
Total state preschool
spending in 2015-2016
Change in total state spending
from 2014-2015 to 2015-2016
Adjusted dollars
State reported non-state
funds
All reported $ per child enrolled in preschool
District of Columbia 1 $16,812 $351 $216,902,863 $9,303,824 Yes $17,875
New Jersey 2 $12,424 $253 $655,609,300 $34,502,834 Yes $12,664
Oregon 3 $8,929 $265 $69,999,910 $3,617,653 No $8,929
Washington 4 $8,305 $693 $97,093,974 $20,279,208 No $8,305
Minnesota 5 $7,924 $86 $12,813,108 $1,988,747 No $7,924
Connecticut 6 $7,905 -$216 $118,102,226 -$1,263,775 Yes $10,419
Hawaii 7 $7,467 -$218 $2,800,000 -$5,032 No $7,467
Vermont* 8 $7,457 $856 $54,629,329 $9,552,977 Yes $7,879
Delaware 9 $7,295 $182 $6,149,300 $153,244 No $7,295
Rhode Island 10 $6,650 -$3,008 $3,950,000 $994,699 Yes $10,506
Pennsylvania 11 $6,580 $940 $176,357,841 $29,504,218 No $6,580
New York 12 $6,507 -$121 $781,337,734 $38,153,486 Yes $6,716
West Virginia** 13 $6,472 $33 $97,807,662 -$419,745 Yes $9,898
California 14 $6,409 $555 $1,435,006,076 $205,870,329 Yes $6,639
Michigan 15 $6,291 -$168 $243,900,000 $4,195,007 No $6,291
Alaska 16 $6,270 -$11 $2,000,000 -$3,594 No $6,270
Indiana 17 $6,020 $3,428 $9,542,255 $8,466,473 Yes $6,594
Arkansas 18 $5,472 $84 $112,500,000 $1,300,526 Yes $7,773
North Carolina 19 $5,301 -$48 $142,348,352 -$1,295,121 Yes $7,855
New Mexico 20 $5,233 $502 $51,060,000 $11,334,439 No $5,233
Kentucky 21 $4,832 $990 $92,677,908 $20,781,250 Yes $8,110
Tennessee 22 $4,753 -$476 $86,097,664 $1,003,605 Yes $7,037
Missouri 23 $4,722 $1,505 $11,753,285 -$1,949,058 No $4,722
Louisiana 24 $4,530 -$48 $89,974,433 -$372,540 Yes $4,617
Alabama 25 $4,290 -$1,052 $48,462,050 $9,768,494 Yes $7,299
Texas 26 $4,071 $481 $898,188,431 $110,173,534 Yes $4,127
Ohio 27 $4,000 -$7 $59,060,000 $14,620,282 No $4,000
Georgia 28 $3,891 $4 $314,460,869 $1,846,090 Yes $3,934
Virginia 29 $3,740 -$9 $68,651,478 $228,484 Yes $5,964
Wisconsin 30 $3,677 -$111 $189,542,429 $5,369,623 Yes $5,791
Oklahoma 31 $3,476 -$240 $143,368,061 -$5,589,283 Yes $7,479
Arizona 32 $3,444 $363 $18,477,063 -$3,790,751 No $3,444
Maryland 33 $3,441 -$138 $109,207,432 $495,304 Yes $7,533
Illinois 34 $3,374 $208 $246,729,910 $8,729,001 Yes $3,854
South Carolina 35 $3,367 $1,383 $79,248,973 $18,888,212 No $3,367
Iowa** 36 $3,246 $128 $80,982,642 $3,336,420 Yes $3,386
Maine 37 $3,201 $465 $17,421,403 $3,518,923 Yes $8,371
Massachusetts 38 $3,039 -$594 $41,725,100 -$6,942,301 Yes $3,309
Colorado 39 $2,471 -$39 $53,126,288 -$1,379,780 Yes $4,001
Florida 40 $2,353 $44 $397,685,494 $13,292,510 No $2,353
Kansas 41 $2,328 $62 $18,397,560 -$32,873 No $2,328
Nebraska 42 $2,302 -$462 $29,131,037 -$4,242,268 Yes $5,695
Nevada 43 $2,132 -$261 $3,338,875 -$6,000 Yes $4,512
Mississippi 44 $1,787 $7 $3,183,481 $49,433 Yes $4,031
Idaho No program $0 $0 $0 $0 NA $0
Montana No program $0 $0 $0 $0 NA $0
New Hampshire No program $0 $0 $0 $0 NA $0
North Dakota No program $0 $0 $0 $0 NA $0
South Dakota No program $0 $0 $0 $0 NA $0
Utah No program $0 $0 $0 $0 NA $0
Wyoming No program $0 $0 $0 $0 NA $0
United States $4,976 $253 $7,390,801,796 $564,026,707 $5,696
Guam*** $12,185 NA $877,330 $877,330 No $12,185
For details about how these figures were calculated, see the Methodology section and Roadmap to the State Profile Pages.* Vermont could not break out the state, local, and federal spending (other than PDG) from the total amount reported. ** 1,274 3-year-old children were served in WV’s Universal Pre-K program but were funded by sources not reported by the state. 1,181 5-year-olds and children with instructional IEPs were served in
Iowas’ SWVPP program but were funded by sources not reported by the state. In both cases, these children were removed from the per-child spending calculations. Similar adjustments were made for 2014-2015.
*** Guam’s spending includes start-up costs for their new Pre-K program.


![Jambalaya [yearbook] 1920 plus Medical yearbook 1920](https://img.pdfslide.net/doc/110x75/586cd4c31a28ab0b6b8bf18e/jambalaya-yearbook-1920-plus-medical-yearbook-1920.jpg)