Embed Size (px)
Citation preview

State Support for Higher EducationState Support for Higher Education
Illinois Board of Higher EducationJanuary 26, 2010
Paul E. Lingenfelter, PresidentState Higher Education Executive Officers
Past… and Future?

11,6
00,0
00
14,8
00,0
00
3,60
0,00
0
1,50
0,00
0
52,0
00
Enrollments
4,10
0
3,15
0
2,00
0
1,70
0
563
Institutions
2.0%
5.1% 5.3%
1.1%0.1%
Percent of U.S. Population
2
Scope of Higher Education in the Scope of Higher Education in the United States – 1870 to 2000United States – 1870 to 2000
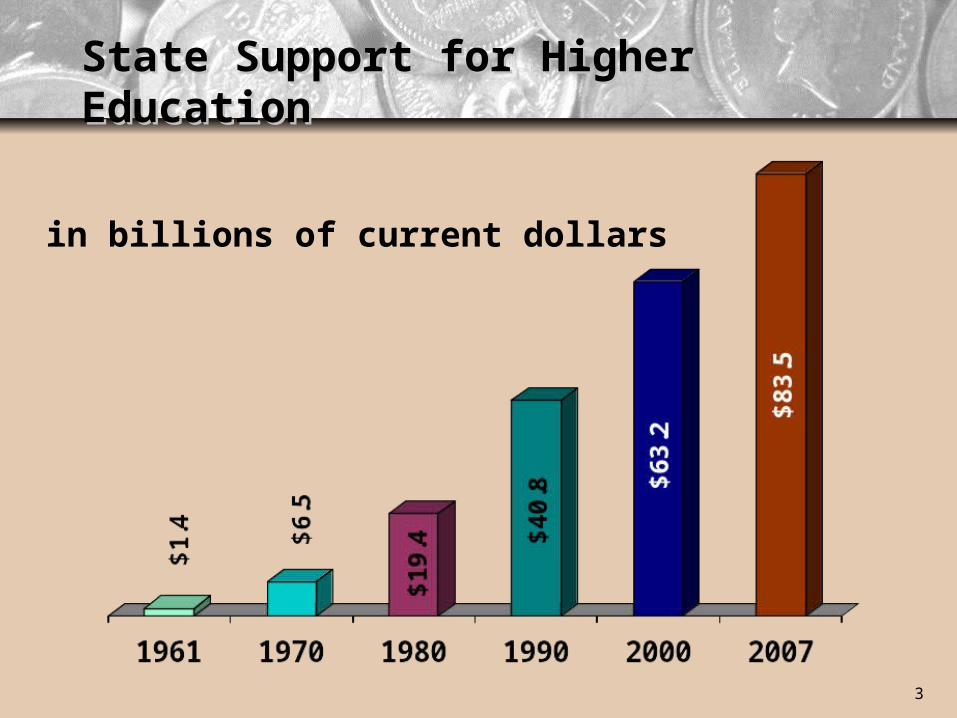
in billions of current dollars
3
State Support for Higher EducationState Support for Higher Education

Public FTE Enrollment and Educational Public FTE Enrollment and Educational Appropriations per FTE, Appropriations per FTE, U.S.U.S., Fiscal , Fiscal 1984-20091984-2009
4
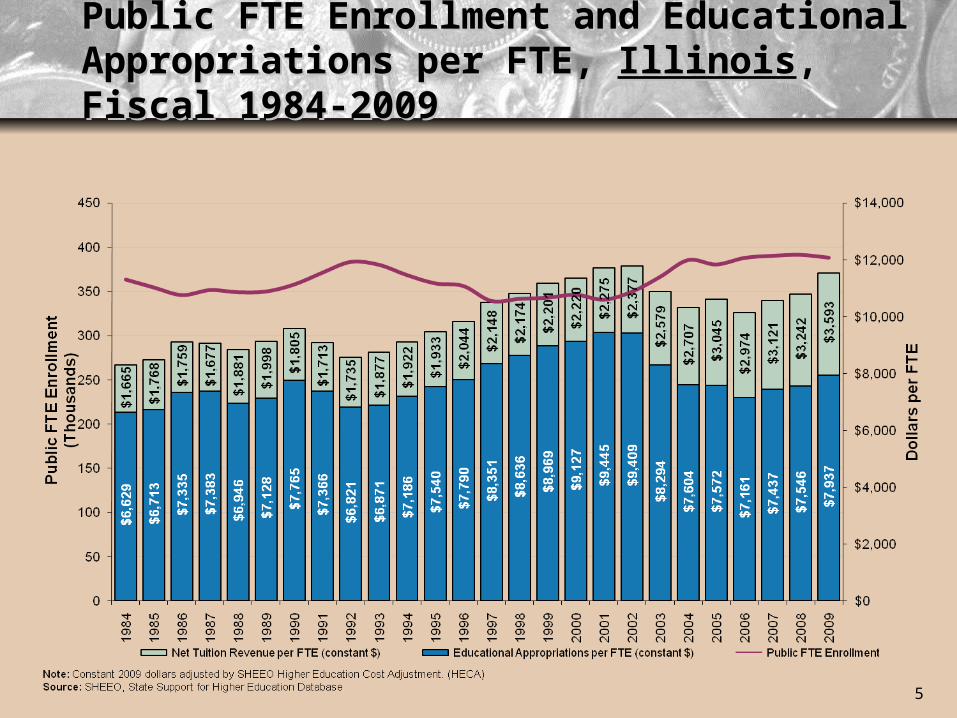
Public FTE Enrollment and Educational Public FTE Enrollment and Educational Appropriations per FTE, Appropriations per FTE, IllinoisIllinois, Fiscal , Fiscal 1984-20091984-2009
5

Illinois Data with SURS and Illinois Data with SURS and Group Insurance Broken OutGroup Insurance Broken Out
•Note: Constant 2009 dollars adjusted by SHEEO Higher Education Cost Adjustment. (HECA) Source: State Support for Higher Education Database Stimulus funds are included in 2009 appropriations 6

Per Capita Personal Income as a Per Capita Personal Income as a Percent of U.S. Average—Illinois, Percent of U.S. Average—Illinois, 1960-20051960-2005
106.1 106.9108.9
107.8
105.1
116.6
111.9113.6
117.8
108.8
90
100
110
120
130
1960 1965 1970 1975 1980 1985 1990 1995 2000 2005
•U.S. Average
Source: Regional Economic Information System, Bureau of Economic Analysis, U.S. Dept. of Commerce.7

Lagging Enrollment Growth in theLagging Enrollment Growth in thePublic Four-Year SectorPublic Four-Year Sector
Source: U.S. Department of Education, IPEDS.8
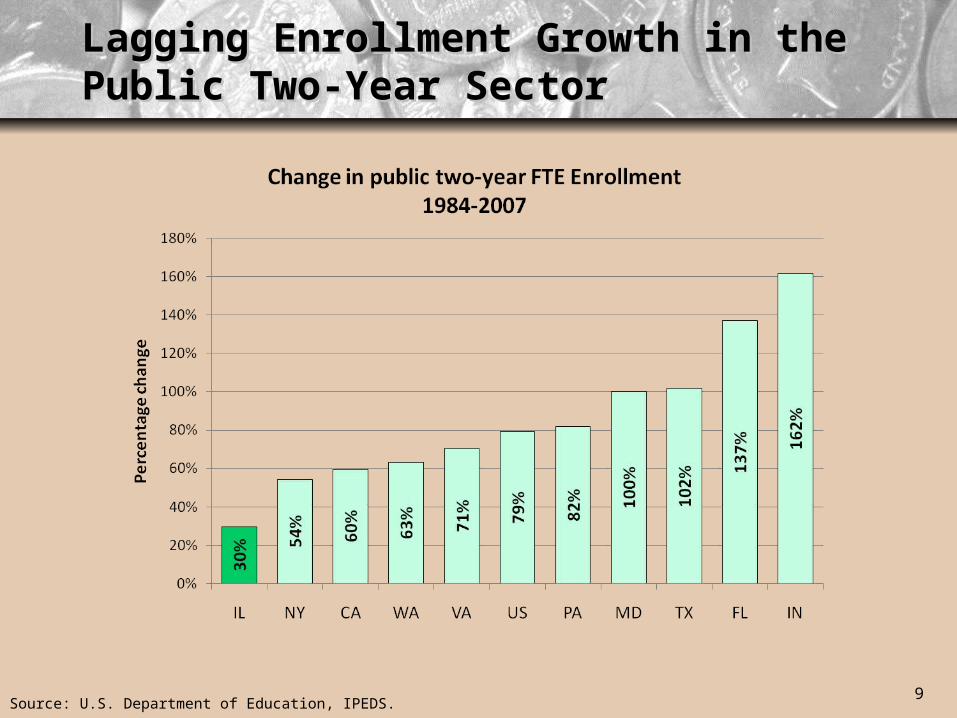
Lagging Enrollment Growth in theLagging Enrollment Growth in thePublic Two-Year SectorPublic Two-Year Sector
Source: U.S. Department of Education, IPEDS.9

Lagging Degree Growth in theLagging Degree Growth in thePublic Four-Year SectorPublic Four-Year Sector
Source: U.S. Department of Education, IPEDS.10
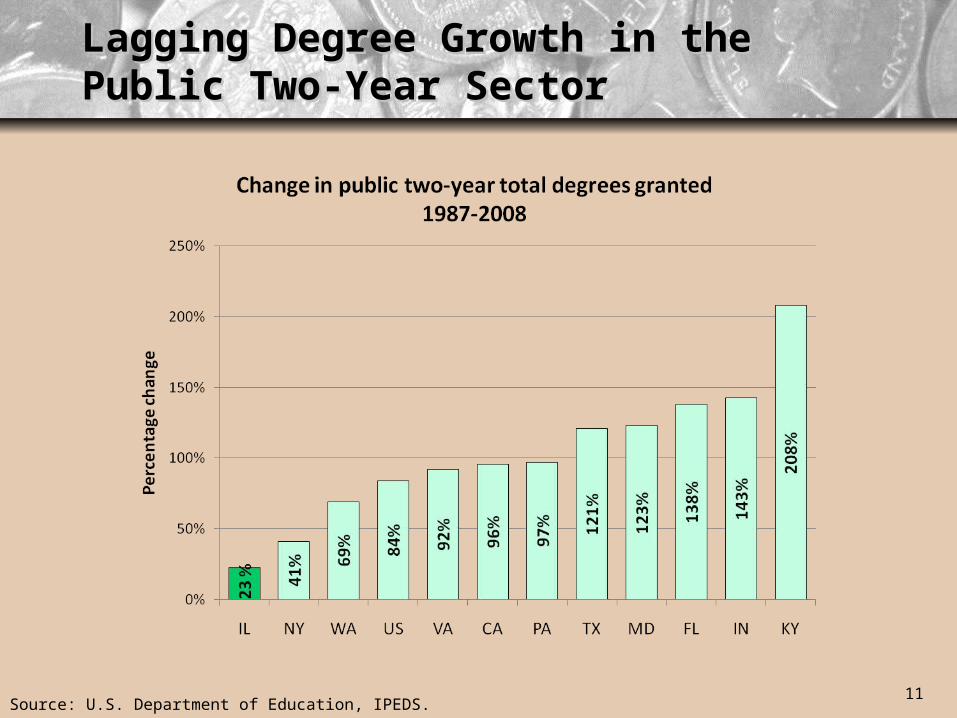
Lagging Degree Growth in theLagging Degree Growth in thePublic Two-Year SectorPublic Two-Year Sector
Source: U.S. Department of Education, IPEDS.11
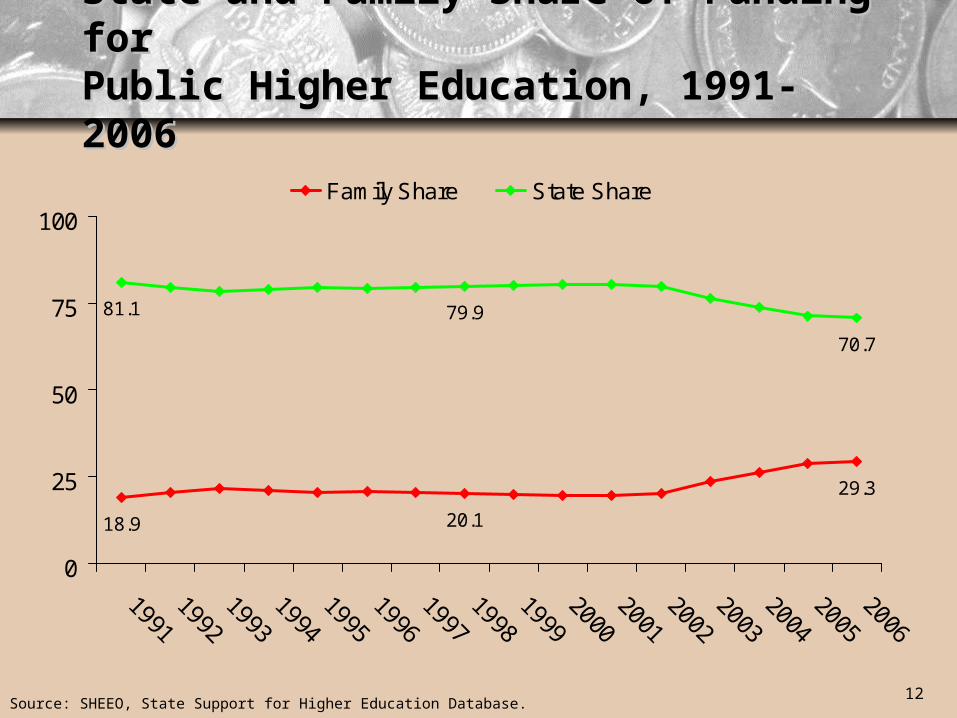
State and Family Share of Funding State and Family Share of Funding for for Public Higher Education, 1991-Public Higher Education, 1991-20062006
20.1
29.3
18.9
79.9
70.7
81.1
0
25
50
75
100Family Share State Share
Source: SHEEO, State Support for Higher Education Database.12

State Support per CapitaState Support per Capita
Source: SHEEO, State Support for Higher Education Database.13
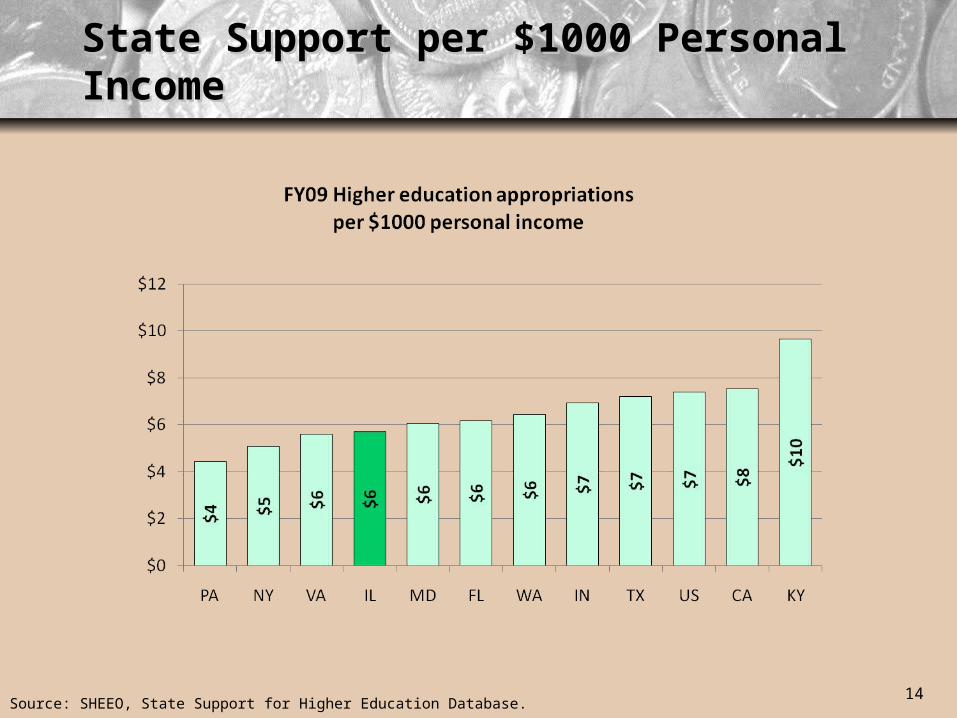
State Support per $1000 Personal State Support per $1000 Personal IncomeIncome
Source: SHEEO, State Support for Higher Education Database.14

Higher Education % of State Higher Education % of State RevenueRevenue
Source: SHEEO, State Support for Higher Education Database.15

State Tax Capacity and Effort—State Tax Capacity and Effort—Illinois Indexed to U.S. AverageIllinois Indexed to U.S. Average
0.90
1.00
1.10
1.20 Tax Effort (Effective Tax Rate)Tax Capacity (Total Taxable Resources Per Capita)
•U.S. Average
Source: SHEEO, State Support for Higher Education Database.16
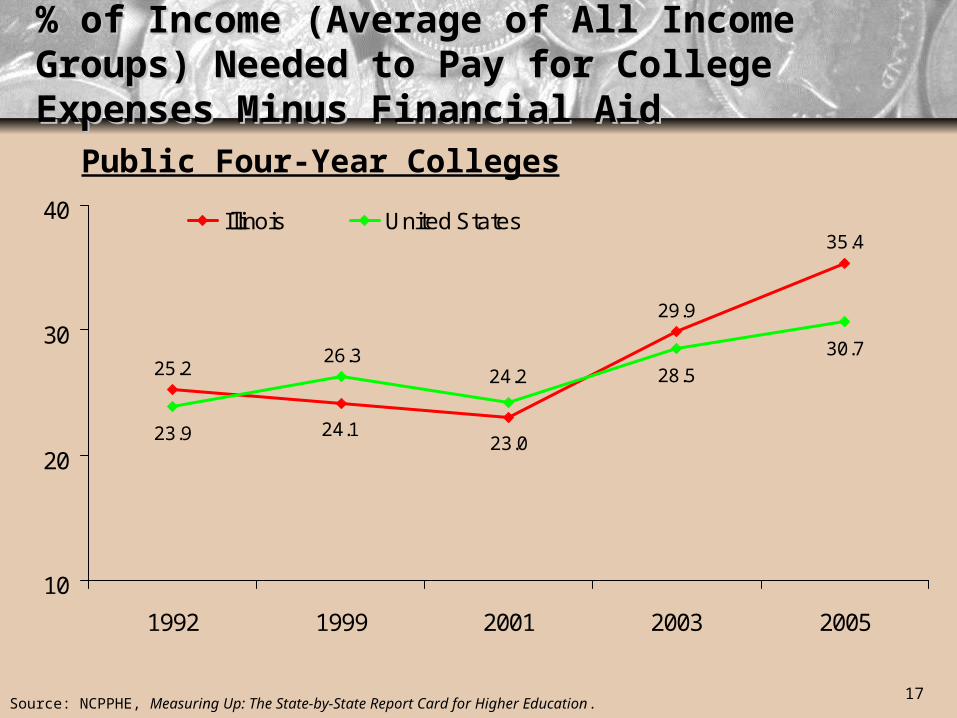
% of Income (Average of All Income % of Income (Average of All Income Groups) Needed to Pay for College Groups) Needed to Pay for College Expenses Minus Financial AidExpenses Minus Financial Aid
25.2
29.9
35.4
23.9
28.5
30.7
23.024.1
24.226.3
10
20
30
40
1992 1999 2001 2003 2005
Illinois United States
Public Four-Year Colleges
Source: NCPPHE, Measuring Up: The State-by-State Report Card for Higher Education.17

Projected State and Local Budget Projected State and Local Budget Surplus (Gap) as a Percent of Surplus (Gap) as a Percent of Revenues, 2013Revenues, 2013
Source: NCHEMS; Don Boyd (Rockefeller Institute of Government), 2005.
-10
.7
-5.7
-5.6
-0.5
-12
-9
-6
-3
0
UtahM
ontana
New Hampshire
DelawareNew Jersey
Maine
Maryland
Massachusetts
WisconsinVerm
ontO
hioNorth Dakota
ConnecticutKansas
ArkansasVirginia
NebraskaO
klahoma
MinnesotaColorado
West Virginia
KentuckyM
ichiganArizona
New YorkG
eorgiaHawaiiIllinois
PennsylvaniaAlaska
Rhode IslandU
nited States
New Mexico
CaliforniaIowa
IndianaNorth Carolina
FloridaIdaho
South CarolinaSouth Dakota
Missouri
Washington
OregonTexas
NevadaTennesseeM
ississippiLouisianaAlabam
a
18

Three of millions with a stake in Three of millions with a stake in the future of Illinois higher the future of Illinois higher education…education…
19

Contact information:
SHEEO, the national association of state-wide higher education executives, focuses on public policy for higher education in the U.S. It was founded in 1954.
Paul LingenfelterPresidentSHEEO
(303) [email protected]
20