Embed Size (px)
Citation preview


2
STATEMENT BY THE CEO
The Sustainability Statement reflects the ESG guidelines issued by Nasdaq Iceland and the Nordic
countries in 2019. These guidelines are based on recommendations made in 2015 by the United
Nations, the Sustainable Stock Exchange Initiative, and the World Federation of Exchange.
Reference is also made to the GRI Standard (Global Reporting Initiative, GRI100-400) and its
Reporting Principles (P1-10) of the United Nations Global Compact (UNGC).
The information presented in this statement cover the period January 1 to December 31, 2020. The
report gives statistical information from the year 2015, which allows us to assess the scope, position,
and potential impact of core activities concerning environmental aspects, social aspects, and
governance. This report creates a basis for guiding the development of these matters in the coming
years.
Eimskipafélag Íslands hf. uses the environmental software Klappir EnviroMaster to make the
Sustainability Statement that covers the operation of Eimskipafélag Íslands hf., Eimskip Ísland ehf.,
Faroe Ship, and The Company's shipping department in Norway.
The software ensures the traceability, transparency, and efficiency in the collection and
dissemination of environmental information. Data on fuel consumption, electricity consumption,
and the use of hot and cold water are automatically collected. The origin of data can then be traced
back to the supplier.
I hereby confirm The Company‘s Sustainability Statement for the period from January 1 to
December 31, 2020.
Reykjavík, February 2021
Vilhelm Már Þorsteinsson
CEO, Eimskipafélag Íslands hf.
3
ENVIRONMENTAL ASSESSMENT REPORT
Signatory: Dr. Jón Ágúst Þorsteinsson
Project Manager: Selja Ósk Snorradóttir
The environmental solution of Eimskipafélag Íslands hf. is a digital data collection and environmental
compliance solution, covering energy, waste and water management of vessel fleet, truck fleet,
terminal assets, warehouses, and office space. On the bases of the assessment, the environmental
management solution is found to be in compliance with the Nasdaq guidelines, Icelandic law and
regulations, the IMO MARPOL Annex I to Annex VI for the vessel fleet and EU MRV for the vessel
fleet as follows:
Energy management compliant to MARPOL Annex I, Annex VI, EU MRV and local law including:
• Data transparency, accuracy and accountability on fuel receiving of vessel fleet, truck fleet
and terminal assets
• Data transparency, accuracy and accountability on electricity use and use of district heating
for terminal assets, warehouses and offices
Waste management compliant to MARPOL Annex V and local law including:
• Data transparency, accuracy and accountability on waste sorting and disposal of vessel fleet
• Data transparency, accuracy and accountability on waste sorting, recycling and disposal of
terminals, warehouses and offices
The statement is comprised of Environment, Social and Governance accounting and notes for The
Company. The review of The Company's sustainability includes queries, especially for managers,
along with analyzes and other exploratory actions. In my opinion, the ESG statement gives a true
and fair picture of The Company’s ESG metrics.
4
I hereby confirm, with my signature, that the data provided by Eimskip and its suppliers for The
Company’s Environmental Statement has been reviewed for the period January 1, to December 31,
2020.
Reykjavík, February 2021.
Dr. Jon Agust Thorsteinsson
CEO, Klappir Green Solutions hf.
5
COMPANY DESCRIPTION
Eimskip is a leading transportation company in the North Atlantic providing container and reefer
liner services with connections to international markets and is specialized in worldwide freight
forwarding services with focus on frozen and chilled commodities.
Organizational Boundaries
The “Operational Control” methodology has been chosen to report on this company´s emissions.
According to the "Operational Control" methodology, companies should account for 100 percent of
greenhouse gas emissions from operations under their control. They should not account for
greenhouse gas emissions from operations that it has no control over, even though it has a vested
interest in their operations.
Operational Boundaries
Included in Eimskip’s operational boundaries for Scope 1 and Scope 2 emissions are the following
business units:
• Eimskipafélag Íslands hf.
• Eimskip Ísland ehf.
• Faroe Ship, and The Company's shipping department in Norway.
The operations included in Scope 3 emissions are:
• Waste from work stations in Iceland and Faroe Ships
• Business trips for Eimskip Ísland ehf. and Eimskipafélag Íslands hf.:
o Icelandair flights from January 2015 - March 2019.
o Domestic flights in Iceland with Air Iceland Connect from January 2018.
o All international flights from March 2019 (from Eimskip’s registration system).
Base Year
Eimskip’s base year is 2015.

6
ENVIRONMENTAL HIGHLIGHTS
Eimskip has been one of the key companies in Iceland since its founding in 1914, connecting the
country to the rest of the world with its extensive sailing system. In 1991, Eimskip became one of
the first companies in Iceland to establish an environmental policy. Since then, challenges in this
field have developed rapidly and the transportation industry, as well as others, realizes how
important environmental issues are for the world today. Much has been accomplished since 1991,
and Eimskip continues to take further steps towards improving its environmental performance and
aligning to global and international initiatives.
As economic activities of the world shift towards sustainability, more responsible use of resources,
and transparent ESG reporting, Eimskip makes great effort monitor the operation closely in regard
to these matters. This is strongly reflected in The Company's ambition to adopt cutting-edge
modern technology to monitor, and report on, its emissions and sustainability goals. In 2014,
Eimskip was one of the first companies in Iceland to initiate the use of smart environmental
management, which entailed collecting various environmental information digitally and
constructing a more comprehensive and reliable picture of The Company's carbon footprint than
had been possible. This work has been done in collaboration with Klappir Green Solutions. Eimskip
strives to take all three pillars of sustainability into account at each given time, and make well-
informed decisions concerning profit, people, and the planet. To attain this, Eimskip strives to
provide its customers with the most efficient and sustainable transportation solutions, as well as
outstanding services, while securing a good return for its shareholders and being responsible
towards its employees and society at large, which includes treating the environment with respect.
Eimskip now uses Klappir SeaMaster to monitor all its vessels and have onshore access to their
energy use and locations, as well as using Klappir digital logbooks to report on its vessel operations.
Eimskip also uses Klappir EnviroMaster to preserve a comprehensive overview of the carbon
footprint of both individual vessels and workstations, as well as the totality of the operation.
7
Eimskip is a registered participant in the UN Global Compact, the United Nation's initiative for social
responsibility concerning human rights, labor, environment, and anti-corruption. The Company has
committed to manage its business operations so that the UN Global Compact and its Ten Principles
become an integral part of the Eimskip's strategy, culture, and day-to-day operations.
The focus in 2020 was on continued monitoring of emissions and waste from the supply chain, by
collecting electronic data from all emitting sources and streaming it automatically to a common data
warehouse, and strategic planning on how to reduce emissions and decrease the environmental
footprint. The digitalization of emission and waste registration data from the supply chain enables
continuous monitoring of measures and provides reliable and transparent information on the
status.
Examples of ESG projects in the year 2020
• The Company received a formal certification in Iceland of operating the Equal Pay system,
based on the Icelandic law on the Equal Position in Iceland. This certification confirms that
processes and standards that have been implemented ensure that employees get equally
paid for equally valuable jobs according to rules, regardless of gender or other objective
points of view. The company’s vision for the future is that all employees are paid equal wages
and enjoy the same terms of employment for work of equal value, including for those who
work in other countries.
• The Company started a partnership with the entrepreneurial company Pure-North Recycling,
which is developing new solutions for recycling plastic in Iceland. The goal of this project was
that all plastic that falls into warehouses in Iceland would be recycled with Pure-North to
reduce The Company‘s carbon footprint.
• Eimskip started quarterly publication of environmental statements which is a great
milestone in managing and monitoring The Company‘s CO2 emissions.
• Eimskip took delivery of two new vessels, Brúarfoss and Dettifoss in 2020. These vessels are
made in line with environmental standards and designed to be very fuel-efficient.
8
• Eimskip consolidated its headquarters in one location in Reykjavík. One of the reasons for
the change was to reduce energy consumption. Another project that emerge from this
change was the project Paperless Eimskip.
• Two methane trucks were added to the Company fleet in November 2020. This is a very
important step towards Eimskip goal of reducing the Company's CO2 emissions by 40% by
2030. It is important for companies such as Eimskip to participate in energy exchange and to
try out new environmentally friendly alternatives.
• Launched a service for larger customers who can now get access to their carbon footprint
for their transportation with Eimskip
• In the third quarter, Eimskip collaborated with the consulting company Circular Solutions on
a risk assessment of The Company's ESG. Circular also provided training on ESG for all
executives and employees globally. Based on the risk analysis, Eimskip made an action plan
for the next 3 years regarding Sustainability. The action plan took effect in November 2020
with one of the first projects being improving information on The Company website. Goals
were set to improve and review The Company's policies by establishing teams across The
Company's organization.
o Policies that have been reviewed
o Human Resource Policy
o Code of Conduct
o Equal Rights Policy and action plan for 2021-2023
o New policies that have been approved
o Whistleblower Policy
o Money- Laundering Policy
o Procurement Policy (OPEX)
o Supplier Code of Conduct
9
FOCUS IN 2021
In 2021, the focus will be on further implementing The Company’s Sustainability policy and the new
policies that have been approved within the Eimskip group. New global goals of the United Nations
that are most closely linked to the operation and to The Company's action plan will also be
implemented. Focus will also continue to be on increasing waste management and to explore and
try ways to replace the fleet with more environmentally friendly trucks.
10
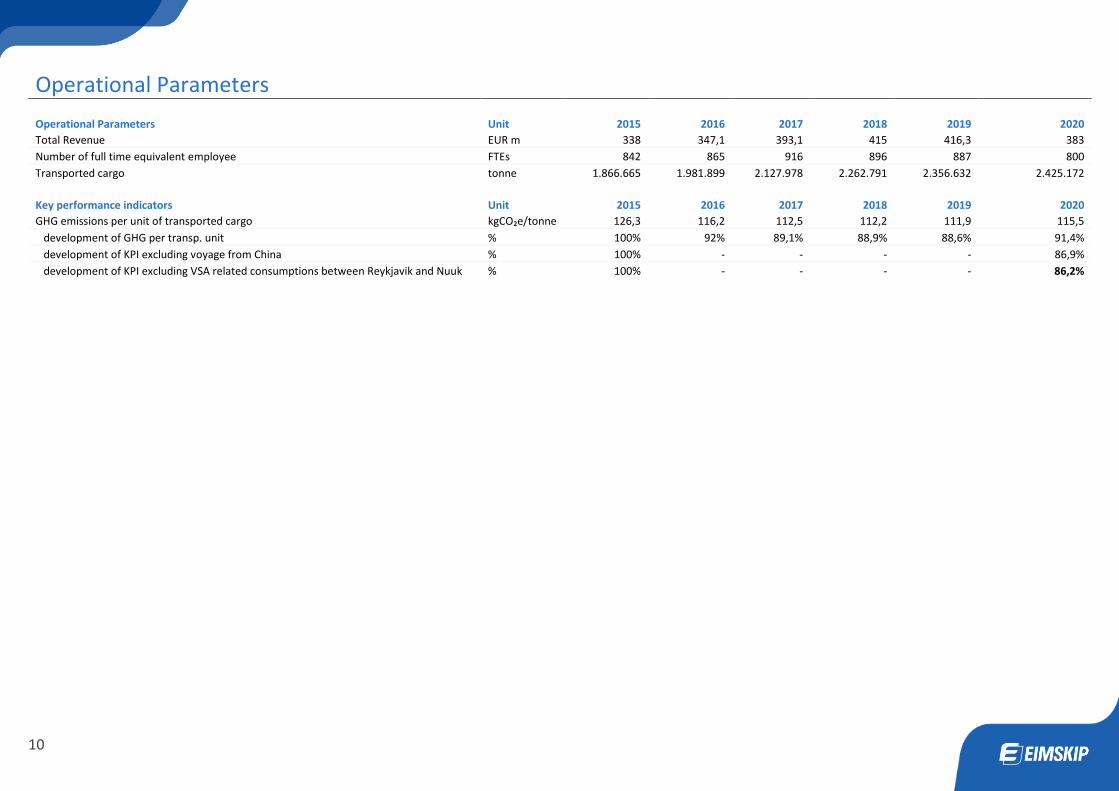
Operational Parameters
Operational Parameters Unit 2015 2016 2017 2018 2019 2020
Total Revenue EUR m 338 347,1 393,1 415 416,3 383
Number of full time equivalent employee FTEs 842 865 916 896 887 800
Transported cargo tonne 1.866.665 1.981.899 2.127.978 2.262.791 2.356.632 2.425.172
Key performance indicators Unit 2015 2016 2017 2018 2019 2020
GHG emissions per unit of transported cargo kgCO₂e/tonne 126,3 116,2 112,5 112,2 111,9 115,5
development of GHG per transp. unit % 100% 92% 89,1% 88,9% 88,6% 91,4%
development of KPI excluding voyage from China % 100% - - - - 86,9%
development of KPI excluding VSA related consumptions between Reykjavik and Nuuk % 100% - - - - 86,2%

11
Environmental
Greenhouse Gas Emissions Unit 2015 2016 2017 2018 2019 2020
Scope 1 tCO₂e 235.139 229.695 238.771,6 253.179,1 262.984,2 279.490,1
Scope 2 (location-based) tCO₂e 266,8 258,6 239 262,3 260,6 251,1
Scope 2 (market-based) tCO₂e 2.526 8.086 239 262,3 260,6 251,1
Scope 3 tCO₂e 374,9 420,7 441,6 508,1 417,7 316,1
Gross operational carbon emission tCO₂e 235.780,6 230.374,3 239.452,2 253.949,4 263.662,5 280.057,4
Total emissions neutralized by carbon offset projects tCO₂e 0 0 0 0 6,9 4,5
Net operational carbon emissions tCO₂e 235.780,6 230.374,3 239.452,2 253.949,4 263.655,6 280.052,9
E1|UNGC: P7|GRI 305-1,305-2,305-3|SASB: General Issue / GHG Emissions|TCFD: Metrics & Targets
Emissions Intensity Unit 2015 2016 2017 2018 2019 2020
GhG emissions per megawatt-hour consumed kgCO₂e/MWh 273,2 262 261,5 254,1 258,7 255,9
GhG emissions per full-time equivalent (FTEe) employee tCO₂e/FTEs 280,02 266,33 261,41 283,43 297,25 350,07
GhG emissions per unit of revenue kgCO₂e/EUR m 697.575,79 663.711,61 609.138,23 611.926,38 633.347,42 731.220,27
GhG emissions per unit of transported cargo (KPI) tCO₂e/tonne 0,126 0,116 0,113 0,112 0,112 0,115
Development of the KPI from base year % 100% 92,03% 89,09% 88,85% 88,58% 91,42%
E2|UNGC: P7, P8|GRI 305-4 |SDG: 13|SASB: General Issue / GHG Emissions, Energy Management
Energy Usage Unit 2015 2016 2017 2018 2019 2020
Total energy consumption kWh 863.091.987 879.231.148 915.765.890 999.567.598 1.019.195.640 1.094.363.387
Of which energy from bio fuel kWh 0 0 0 0 0 15.572
Of which energy from fossil fuel kWh 835.243.214 850.889.744 888.669.471 970.589.197 991.552.905 1.067.639.816
Of which energy from electricity kWh 16.231.089 17.356.579 16.349.975 16.587.947 16.737.614 15.524.718
Of which energy from hot water kWh 11.617.684 10.984.825 10.746.444 12.390.454 10.905.121 11.183.281
Direct Energy Consumption kWh 835.243.214 850.889.744 888.669.471 970.589.197 991.552.905 1.067.655.388
Indirect Energy Consumption kWh 27.848.773 28.341.404 27.096.419 28.978.401 27.642.735 26.707.999
E3|UNGC: P7, P8|GRI 302-1, 302-2|SDG: 12|SASB: General Issue / Energy Management

12
Energy Intensity Unit 2015 2016 2017 2018 2019 2020
Energy per full-time equivalent (FTEe) employee kWh/FTEs 1.025.050 1.016.452 999.744 1.115.589 1.149.037 1.367.954
Energy per unit of revenue kWh/EUR m 2.553.526,6 2.533.077,3 2.329.600,3 2.408.596,6 2.448.224 2.857.345
E4|UNGC: P7, P8|GRI 302-3|SDG: 12|SASB: General Issue / Energy Management
Energy Mix Unit 2015 2016 2017 2018 2019 2020
Fossil Fuel % 97,1% 97,9% 97% 97,1% 97,3% 97,6%
Nuclear Energy % 0,2% 0,4% - - - -
Renewable Energy % 2,7% 1,7% 3% 2,9% 2,7% 2,4%
E5|GRI 302-1|SDG: 7|SASB: General Issue / Energy Management
Water Usage Unit 2015 2016 2017 2018 2019 2020
Total water consumption m³ 245.460 230.993 235.997 260.534 254.240 262.285
Cold water m³ 45.155 41.599 50.713 46.906 66.221 69.470
Hot water m³ 200.305 189.394 185.284 213.629 188.019 192.815
E6|GRI: 303-5|SDG: 6|SASB: General Issue / Water & Wastewater Management
Environmental Operations Unit 2015 2016 2017 2018 2019 2020
Does your company follow a formal Environmental Policy? yes/no - - - Yes Yes Yes
Does your company follow specific waste, water, energy, and/or recycling policies? yes/no - - - - - -
Does your company use a recognized energy management system? yes/no Yes Yes Yes Yes Yes Yes
Is the Environmental Policy approved by the board yes/no - - - - Yes Yes
E7|GRI: 103-2|SASB: General Issue / Waste & Hazardous Materials Management
Waste Management Unit 2015 2016 2017 2018 2019 2020
Total waste generated kg 660.481 769.279 862.691 1.109.356 1.217.918 1.198.288
Of which sorted waste kg 14.922 20.392 22.565 683.657 886.821 876.658
Of which unsorted waste kg 330.200 374.568 423.838 400.789 331.097 321.630
Recycled/recovery kg 327.589 387.836 427.670 591.032 364.222 272.938
Landfill/disposal kg 332.802 381.443 435.021 518.324 853.696 925.350
Percentage of sorted waste % 2,3% 2,7% 2,6% 61,6% 72,8% 73,2%
Percentage of recycled waste % - - - 53,3% 29,9% 22,8%
Waste Intensity Unit 2015 2016 2017 2018 2019 2020
Total waste per full-time equivalent (FTEe) employee kg/FTEs 784,4 889,3 941,8 1.238,1 1.373,1 1.497,9
Total waste per unit of revenue kg/EUR m 1.954,1 2.216,3 2.194,6 2.673,1 2.925,6 3.128,6
13
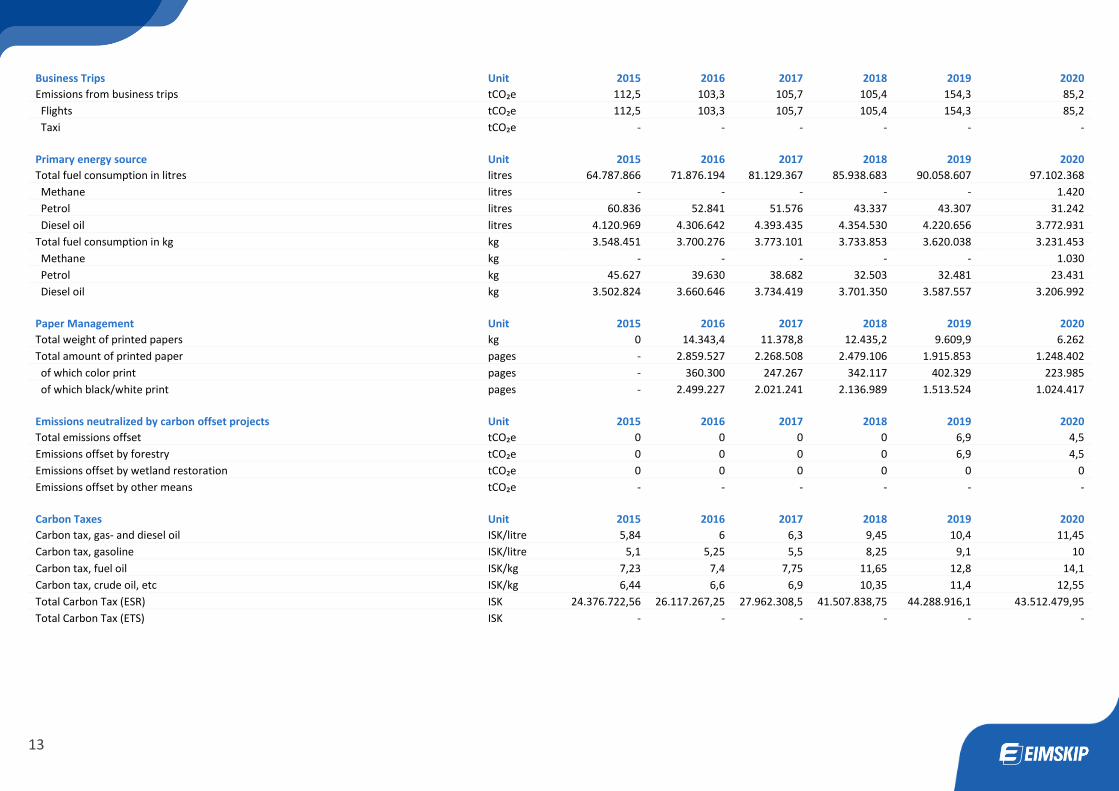
Business Trips Unit 2015 2016 2017 2018 2019 2020
Emissions from business trips tCO₂e 112,5 103,3 105,7 105,4 154,3 85,2
Flights tCO₂e 112,5 103,3 105,7 105,4 154,3 85,2
Taxi tCO₂e - - - - - -
Primary energy source Unit 2015 2016 2017 2018 2019 2020
Total fuel consumption in litres litres 64.787.866 71.876.194 81.129.367 85.938.683 90.058.607 97.102.368
Methane litres - - - - - 1.420
Petrol litres 60.836 52.841 51.576 43.337 43.307 31.242
Diesel oil litres 4.120.969 4.306.642 4.393.435 4.354.530 4.220.656 3.772.931
Total fuel consumption in kg kg 3.548.451 3.700.276 3.773.101 3.733.853 3.620.038 3.231.453
Methane kg - - - - - 1.030
Petrol kg 45.627 39.630 38.682 32.503 32.481 23.431
Diesel oil kg 3.502.824 3.660.646 3.734.419 3.701.350 3.587.557 3.206.992
Paper Management Unit 2015 2016 2017 2018 2019 2020
Total weight of printed papers kg 0 14.343,4 11.378,8 12.435,2 9.609,9 6.262
Total amount of printed paper pages - 2.859.527 2.268.508 2.479.106 1.915.853 1.248.402
of which color print pages - 360.300 247.267 342.117 402.329 223.985
of which black/white print pages - 2.499.227 2.021.241 2.136.989 1.513.524 1.024.417
Emissions neutralized by carbon offset projects Unit 2015 2016 2017 2018 2019 2020
Total emissions offset tCO₂e 0 0 0 0 6,9 4,5
Emissions offset by forestry tCO₂e 0 0 0 0 6,9 4,5
Emissions offset by wetland restoration tCO₂e 0 0 0 0 0 0
Emissions offset by other means tCO₂e - - - - - -
Carbon Taxes Unit 2015 2016 2017 2018 2019 2020
Carbon tax, gas- and diesel oil ISK/litre 5,84 6 6,3 9,45 10,4 11,45
Carbon tax, gasoline ISK/litre 5,1 5,25 5,5 8,25 9,1 10
Carbon tax, fuel oil ISK/kg 7,23 7,4 7,75 11,65 12,8 14,1
Carbon tax, crude oil, etc ISK/kg 6,44 6,6 6,9 10,35 11,4 12,55
Total Carbon Tax (ESR) ISK 24.376.722,56 26.117.267,25 27.962.308,5 41.507.838,75 44.288.916,1 43.512.479,95
Total Carbon Tax (ETS) ISK - - - - - -

14
Social CEO Pay Ratio Unit 2015 2016 2017 2018 2019 2020
CEO Salary & Bonus (X) to median FTE Salary X:1 6,3 6 6,1 6,2 4,6 4,3
Does your company report this metric in regulatory filings? yes/no - - - - - -
S1|UNGC: P6|GRI 102-38
Gender Pay Ratio Unit 2015 2016 2017 2018 2019 2020
Median total compensation for men (X) to median total compensation for women X:1 - - - - - -
Outcome of equal pay certification % - - - - 1,7% 0,7%
S2|UNGC: P6|GRI: 405-2 | SASB: General Issue / Employee Engagement, Diversity & Inclusion
Employee Turnover Unit 2015 2016 2017 2018 2019 2020
Full-time Employees Year-over-year change for full-time employees % 18,8% - - - 43,5% 24,7%
Dismissal % - - - - 10,8% 7,9%
Retirement % - - - - 1,4% 1,7%
Part-time Employees Year-over-year change for part-time employees % - - - - - 13,6%
Dismissal % - - - - - 3,4%
Retirement % - - - - - 0%
Gender Men % 9% 85% 80% 83% 77% 88%
Women % 91% 15% 20% 17% 23% 12%
Age <20 % - - - - - -
20-29 % 39,3% 35,4% 46,6% 44,2% 39% 38%
30-39 % 17,2% 23,4% 22,3% 19,2% 24,8% 19%
40-49 % 14,5% 16,6% 13% 12% 12,9% 13%
50-59 % 12,4% 14,9% 9,8% 10,6% 12,4% 12%
60-69 % 16,6% 9,7% 8,3% 13,9% 11% 17%
70+ % - - - - - -
S3|UNGC: P6|GRI: 401-1b|SDG: 12|SASB: General Issue / Labor Practices
15
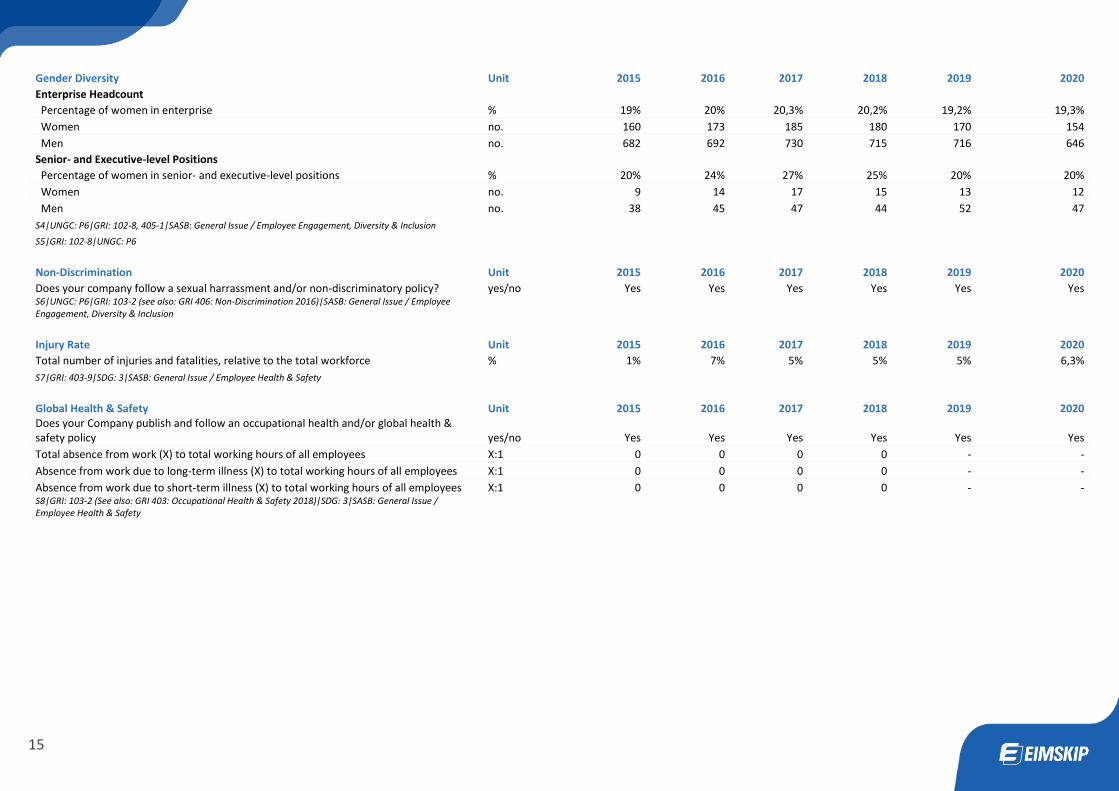
Gender Diversity Unit 2015 2016 2017 2018 2019 2020
Enterprise Headcount Percentage of women in enterprise % 19% 20% 20,3% 20,2% 19,2% 19,3%
Women no. 160 173 185 180 170 154
Men no. 682 692 730 715 716 646
Senior- and Executive-level Positions Percentage of women in senior- and executive-level positions % 20% 24% 27% 25% 20% 20%
Women no. 9 14 17 15 13 12
Men no. 38 45 47 44 52 47
S4|UNGC: P6|GRI: 102-8, 405-1|SASB: General Issue / Employee Engagement, Diversity & Inclusion
S5|GRI: 102-8|UNGC: P6
Non-Discrimination Unit 2015 2016 2017 2018 2019 2020
Does your company follow a sexual harrassment and/or non-discriminatory policy? yes/no Yes Yes Yes Yes Yes Yes S6|UNGC: P6|GRI: 103-2 (see also: GRI 406: Non-Discrimination 2016)|SASB: General Issue / Employee Engagement, Diversity & Inclusion
Injury Rate Unit 2015 2016 2017 2018 2019 2020
Total number of injuries and fatalities, relative to the total workforce % 1% 7% 5% 5% 5% 6,3%
S7|GRI: 403-9|SDG: 3|SASB: General Issue / Employee Health & Safety
Global Health & Safety Unit 2015 2016 2017 2018 2019 2020 Does your Company publish and follow an occupational health and/or global health & safety policy yes/no Yes Yes Yes Yes Yes Yes
Total absence from work (X) to total working hours of all employees X:1 0 0 0 0 - -
Absence from work due to long-term illness (X) to total working hours of all employees X:1 0 0 0 0 - -
Absence from work due to short-term illness (X) to total working hours of all employees X:1 0 0 0 0 - - S8|GRI: 103-2 (See also: GRI 403: Occupational Health & Safety 2018)|SDG: 3|SASB: General Issue / Employee Health & Safety

16
Child & Forced Labor Unit 2015 2016 2017 2018 2019 2020
Does your company follow a child labor policy? yes/no - - - Yes Yes Yes
Does your company follow a forced labor policy? yes/no - - - Yes Yes Yes
If yes, do your child and/or forced labor policy cover suppliers and vendors? yes/no - - - - - - S9|GRI: 103-2 (See also: GRI 408: Child Labor 2016, GRI 409: Forced or Compulsory Labor, and GRI 414: Supplier Social Assessment 2016)|UNGC: P4, P5|SDG: 8|SASB: General Issue / Labor Practices
Human Rights Unit 2015 2016 2017 2018 2019 2020
Does your company publish and follow a human rights policy? yes/no No No No Yes Yes Yes
If yes, does your human rights policy cover suppliers and vendors? yes/no - - - - - -
S10|GRI: 103-2 (See also: GRI 412: Human Rights Assessment 2016 & GRI 414: Supplier Social Assessment 2016)|UNGC: P1, P2|SDG: 4, 10, 16| SASB: General Issue / Human Rights & Community Relations

17
Governance Board Diversity Unit 2015 2016 2017 2018 2019 2020
Total board seats occupied by women (as compared to men) % 40% 40% 40% 60% 40% 40%
Committee chairs occupied by women (as compared to men) % - - - - 33,3% 33,3% G1|GRI 405-1|SDG: 10|SASB: General Issue / Employee Engagement, Diversity & Inclusion (See also: SASB Industry Standards)
Board Independence Unit 2015 2016 2017 2018 2019 2020
Does the company prohibit CEO from serving as board chair? yes/no Yes Yes Yes Yes Yes Yes
Total board seats occupied by independents % 80% 80% 80% 80% 60% 80%
G2|GRI: 102-23, 102-22
Incentivized Pay Unit 2015 2016 2017 2018 2019 2020
Are executives formally incentivized to perform on sustainability yes/no - No No No No No
G3|GRI: 102-35
Collective Bargaining Unit 2015 2016 2017 2018 2019 2020 Total enterprise headcount covered by collective bargaining agreements (X) to the total employee population % 100 100 100 100 100 100
G4|UNGC: P3|SDG: 8|GRI: 102-41|SASB: General Issue / Labor Practices (See also: SASB Industry Standards)
Supplier Code of Conduct Unit 2015 2016 2017 2018 2019 2020
Are your vendors or suppliers required to follow a Code of Conduct yes/no No No No No No In progress
If yes, what percentage of your suppliers have formally certified their compliance with the code % - - - - - - G5|UNGC: P2, P3, P4, P8|GRI: 102-16, 103-2 (See also: GRI 308: Supplier Environmental Assessment 2016 & GRI 414: Supplier Social Assessment 2016|SDG: 12|SASB General Issue / Supply Chain Management (See also: SASB Industry Standards)
Ethics & Anti-Corruption Unit 2015 2016 2017 2018 2019 2020
Does your company follow an Ethics and/or Anti-Corruption policy? yes/no Yes Yes Yes Yes Yes Yes
If yes, what percentage of your workforce has formally certified its compliance with the policy? % - - - - - -
G6|UNGC: P10|SDG: 16|GRI: 102-16, 103-2 (See also: GRI 205: Anti-Corruption 2016)

18
Data Privacy Unit 2015 2016 2017 2018 2019 2020
Does your company follow a Data Privacy policy? yes/no No No No Yes Yes Yes
Has your company taken steps to comply with GDPR rules? yes/no - No No Yes Yes Yes G7|GRI: 418 Customer Privacy 2016|SASB: General Issue / Customer Privacy, Data Security (See also: SASB Industry Standards)
ESG Reporting Unit 2015 2016 2017 2018 2019 2020
Does your company publish a sustainability report? yes/no No No No Yes Yes Yes
Is sustainability data included in your regulatory filings? yes/no No No No Yes Yes Yes
G8|UNGC: P8
Disclosure Practices Unit 2015 2016 2017 2018 2019 2020
Does your company provide sustainability data to sustainability reporting frameworks? yes/no - - Yes Yes Yes Yes
Does your company focus on specific UN Sustainable Development Goals (SDGs)? yes/no - - Yes Yes Yes Yes
Does your company set targets and report progress on the UN SDGs? yes/no - - - - - -
G9|UNGC: P8
External Assurance Unit 2015 2016 2017 2018 2019 2020
Are your sustainability disclosures assured or validated by a third party? yes/no Yes Yes Yes Yes Yes Yes
G10|UNGC: P8|GRI: 102-56

19
METHODOLOGY
The calculation methods, constants, and the statement are based on the Greenhouse Gas
(GHG) Protocol, which is a standardized methodology used to calculate the environmental
footprint of both companies and organizations.
1. Direct & Indirect GHG Emissions (E1)
The GHG Protocol divides emissions into three scopes to effectively set boundaries between
direct and indirect emissions:
• Scope 1 accounts for direct GHG emissions from a company’s operations. Direct
emissions occur from sources that are owned or controlled by the company. In Eimskip’s
case, Scope 1 is limited to emissions from vehicles, heavy machinery and vessels.
• Scope 2 accounts for indirect GHG emissions relating to electricity consumption and
heating. Emissions of this type do not occur within organizational boundaries of the
company and are therefore considered to be indirect.
• Scope 3 accounts for indirect GHG emissions from Eimskip´s value chain. There are
several different factors involved, including emissions originating from flights, business
trips via flight. It also includes emissions from waste-pickup and disposal from buildings
and ships.
The GHG emissions are reported in tonnes CO2 equivalents (tCO2e). CO2 equivalents is a
quantity that describes, for a given mixture and amount of GHG, the amount of CO2 that
would have the same global warming potential (GWP), i.e. the ability of a gas to trap heat in
the atmosphere when measured over the timescale of 100 years.
2. Net operational carbon emissions
Net operational carbon emissions represent the net emissions of a company with
neutralization of emissions by carbon offset projects is taken into account.

20
3. Emission Intensity (E2)
Emission intensity figures are based on combined Scope 1, Scope 2 (location-based), and
Scope 3 (business travel via flight and waste pick-up and disposal). Emission intensity is
calculated by dividing GHG emissions by a selected operational parameter unit, and is
reported as tCO2e per unit (such as tCO2e per revenue unit). Emission intensity indicators are
used to measure and compare the company’s emissions relative to its operational scale.
4. Direct & Indirect Energy Consumption (E3)
The total energy consumption measures all energy consumed by the company, including fuels
for the company’s vehicles, heavy machinery and vessels (Scope 1) and energy from electricity
and hot water (Scope 2). The energy consumption is reported by source in kilowatt-hours
(kWh).
5. Energy Intensity (E4)
Energy intensity is calculated by dividing the total energy consumption by a selected
operational parameter unit, and is reported as kWh per unit (such as kWh per full-time
equivalent employee (FTEe)). Energy intensity indicators are used to measure the efficiency
of energy usage and compare the company’s energy consumption relative to its operational
scale.

21
NOTES
[1] There are discrepancies between this statement and previously published statements,
which is due to increased resolution of data via data streams.
[2] Individual assets’ use of electricity and hot water is estimated based on data from previous
periods, as data through the end of the period were not available. The estimate amounts to
3% of electricity use and 75% of hot water use. Emissions from electricity usage in Scope 2
were calculated using the emissions factors from the National Inventory Report published by
The Environmental Agency of Iceland. The coefficients reflect total electricity production in
Iceland over a specified period.
[3] Fuel used for cars and trucks.