Embed Size (px)
Citation preview
Supplementary Material
High-speed visualization of soap bubble blowing and image-processing-based analysis of pinch-off dynamics
John Davidson and Sangjin Ryu*
Department of Mechanical and Materials Engineering University of Nebraska-Lincoln, Lincoln NE 68588, USA
Email: [email protected]
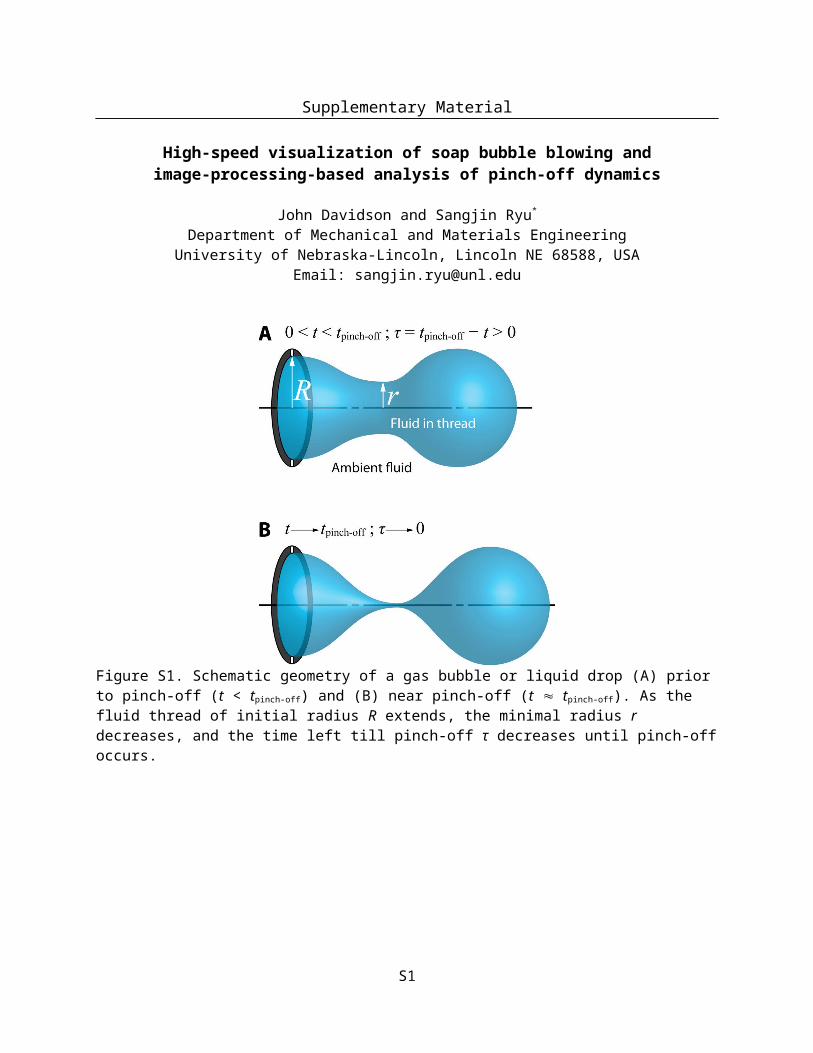
Figure S1. Schematic geometry of a gas bubble or liquid drop (A) prior to pinch-off (t < tpinch-off) and (B) near pinch-off (t tpinch-off). As the fluid thread of initial radius R extends, the minimal radius r decreases, and the time left till pinch-off τ decreases until pinch-off occurs.
Figure S2: Conceptual diagram of determining the soap film tube volume. The tube is approximated as a stack of circular disks of which the thickness (x) is one pixel, and the disk diameter di is determined by the distance between the upper and lower profile as a function of the distance from the soap ring xi. Then, the volume of the soap film tube is approximated by the sum of the disk volume.
S1
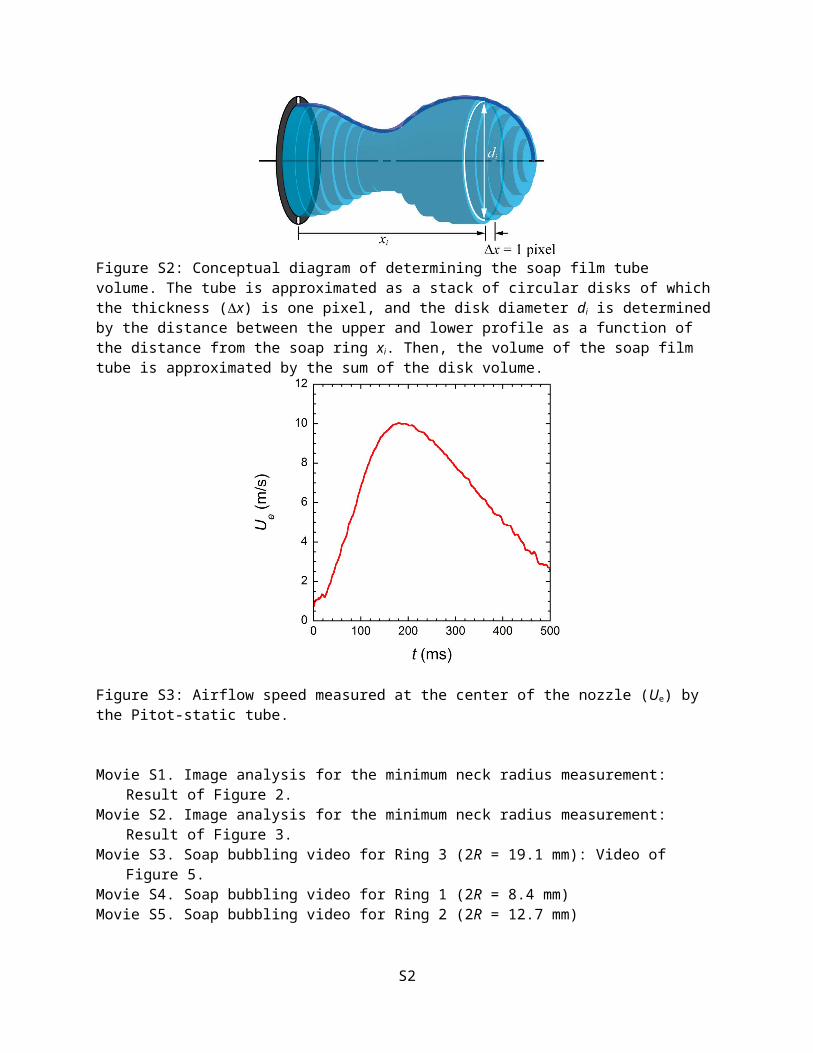
Figure S3: Airflow speed measured at the center of the nozzle (Ue) by the Pitot-static tube.
Movie S1. Image analysis for the minimum neck radius measurement: Result of Figure 2. Movie S2. Image analysis for the minimum neck radius measurement: Result of Figure 3.Movie S3. Soap bubbling video for Ring 3 (2R = 19.1 mm): Video of Figure 5.Movie S4. Soap bubbling video for Ring 1 (2R = 8.4 mm)Movie S5. Soap bubbling video for Ring 2 (2R = 12.7 mm)
S2

![[PPT]PowerPoint Presentation - World Banksiteresources.worldbank.org/.../Address_SabbirPatel.ppt · Web viewDynamics of the Cooperatives, Mutual Insurance & Takaful Mutual Insurance](https://img.pdfslide.net/doc/110x75/5ac929307f8b9aa1298cdc50/pptpowerpoint-presentation-world-viewdynamics-of-the-cooperatives-mutual-insurance.jpg)