Embed Size (px)
Citation preview
149
1. INTRODUCTION
One of the basic methodical approaches to identify the deposi-tional palaeoenvironment is a detailed analysis of sedimentary facies. Facies identification and interpretation of transport-depositional mechanisms enable the formation of a model of genetic facies (Mutti, 1992; Mutti et al., 2003). Within the model, the mutual relations and sequentiality among facies can be interpreted to estimate the position of sedimentary records within deep-water depositional system as well as to presume lateral development of sedimentary facies. A further conventional way to interpret turbidite depositional environ-ments is the identification of systematic vertical patterns of bed thickness and grain size distribution. This approach is based on the general assumption that thickening- or coarsening-upward cycles are a sign of submarine lobe environment and thinning or fining cycles, may relate to channel and levees environment (e.g. Mutti & Ricci Lucchi, 1972; Ricci Lucchi, 1975; Mutti et al., 1978; Waldron 1987; Chakraborty et al. 2002). However, the importance of cyclicity and vertical trends in the interpre-tation of depositional environment within submarine-fans is received with scepticism in some research papers. These point out that too much factors can affect the cyclicity, that many records do not show the cyclicity, that determining of vertical trends tends to be subjective and absent of any statistical tests (e.g., Walker, 1984; Pickering et al., 1989; Chen & Hiscott, 1999a). Another methodological approach is based on statistical
analysis of facies clustering in submarine-fan turbidite succes-sions. This method uses a measurement of long-term interval of time series (Hurst exponent) and it relates to the autocor-relations of the time series (Hurst, 1951, 1956; Chen & His-cott, 1999b). In the Carpathian turbidite deposits, the method of Hurst coefficient has been introduced by Kötelešová (2012).
The object of the study is a test of practical application of the statistical analysis on the successions that represent diffe-rent part of deep-sea fan depositional environment, including the channel and levee, overbank and interchannel as well as different parts of depositional lobe environment. We applied Hurst statistics, the cumulative distribution of bed thicknesses, the index of proximity (ABC index sensu Walker, 1967) and frequency histograms on four sample sections in the Central Carpathian Palaeogene Basin (CCPB) in the Orava region (Fig. 1).
2. GEOLOGICAL SETTING
The CCPB lies inside the Western Carpathian Mountain chain (Fig. 1A) and belongs to the basinal system of the Peri- and Paratethyan seas. The opening and evolution of the CCPB pro-bably related to crustal thinning, either as a result of subcrustal erosion (e.g., Kázmér et al., 2003), or due to the extensional collapse of the overthickened Central Western Carpathian
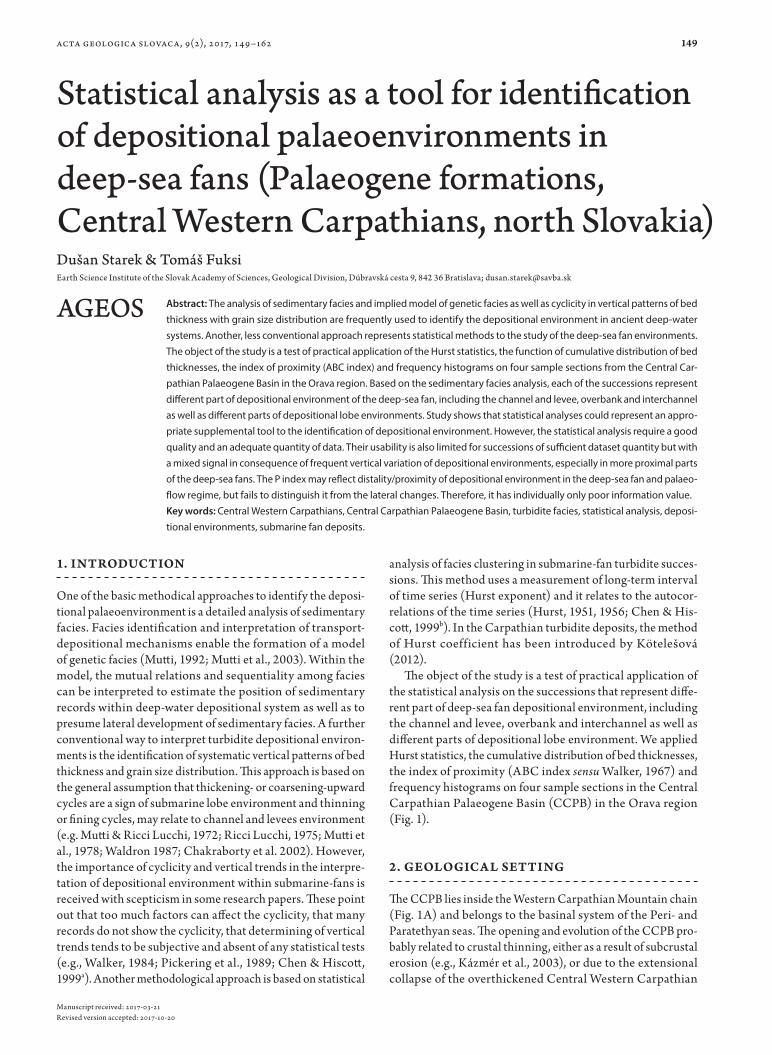
Statistical analysis as a tool for identification of depositional palaeoenvironments in deep-sea fans (Palaeogene formations, Central Western Carpathians, north Slovakia)Earth Science Institute of the Slovak Academy of Sciences, Geological Division, Dúbravská cesta 9, 842 36 Bratislava; [email protected]
Abstract: The analysis of sedimentary facies and implied model of genetic facies as well as cyclicity in vertical patterns of bed thickness with grain size distribution are frequently used to identify the depositional environment in ancient deep-water systems. Another, less conventional approach represents statistical methods to the study of the deep-sea fan environments. The object of the study is a test of practical application of the Hurst statistics, the function of cumulative distribution of bed thicknesses, the index of proximity (ABC index) and frequency histograms on four sample sections from the Central Car-pathian Palaeogene Basin in the Orava region. Based on the sedimentary facies analysis, each of the successions represent different part of depositional environment of the deep-sea fan, including the channel and levee, overbank and interchannel as well as different parts of depositional lobe environments. Study shows that statistical analyses could represent an appro-priate supplemental tool to the identification of depositional environment. However, the statistical analysis require a good quality and an adequate quantity of data. Their usability is also limited for successions of sufficient dataset quantity but with a mixed signal in consequence of frequent vertical variation of depositional environments, especially in more proximal parts of the deep-sea fans. The P index may reflect distality/proximity of depositional environment in the deep-sea fan and palaeo-flow regime, but fails to distinguish it from the lateral changes. Therefore, it has individually only poor information value.Key words: Central Western Carpathians, Central Carpathian Palaeogene Basin, turbidite facies, statistical analysis, deposi-tional environments, submarine fan deposits.
Manuscript received: 2017-03-21Revised version accepted: 2017-10-20
Dušan Starek & Tomáš Fuksi
acta geologica slovaca, 9(2), 2017, 149–162
150
crust and the pull of the retreating subduction of the External Western Carpathian oceanic lithosphere (Plašienka & Soták, 2015; Kováč et al., 2016).
The basin covered most of the Central Western Carpathian area (Fig. 1A,B) and is mainly filled up with flysch-like depos-its, which overlap the substrates of the nappe units and their
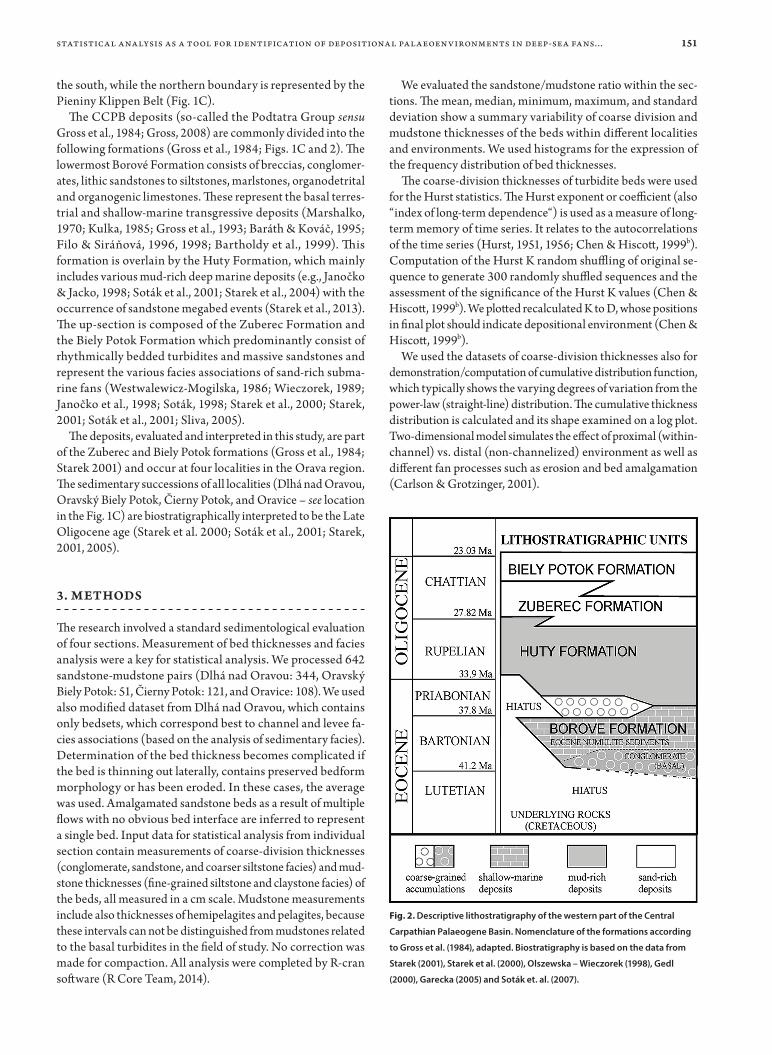
thickness reach up to thousand metres. The age of the sedi-mentary formations ranges from the Bartonian (e.g., Samuel & Fusán, 1992; Gross et al., 1993) to the Late Oligocene (cf. Olszewska & Wieczorek, 1998; Gedl, 2000; Soták et al., 2001, 2007; Garecka, 2005) (Fig. 2). In the study area, the CCPB sediments are bounded by the Central Carpathian units in
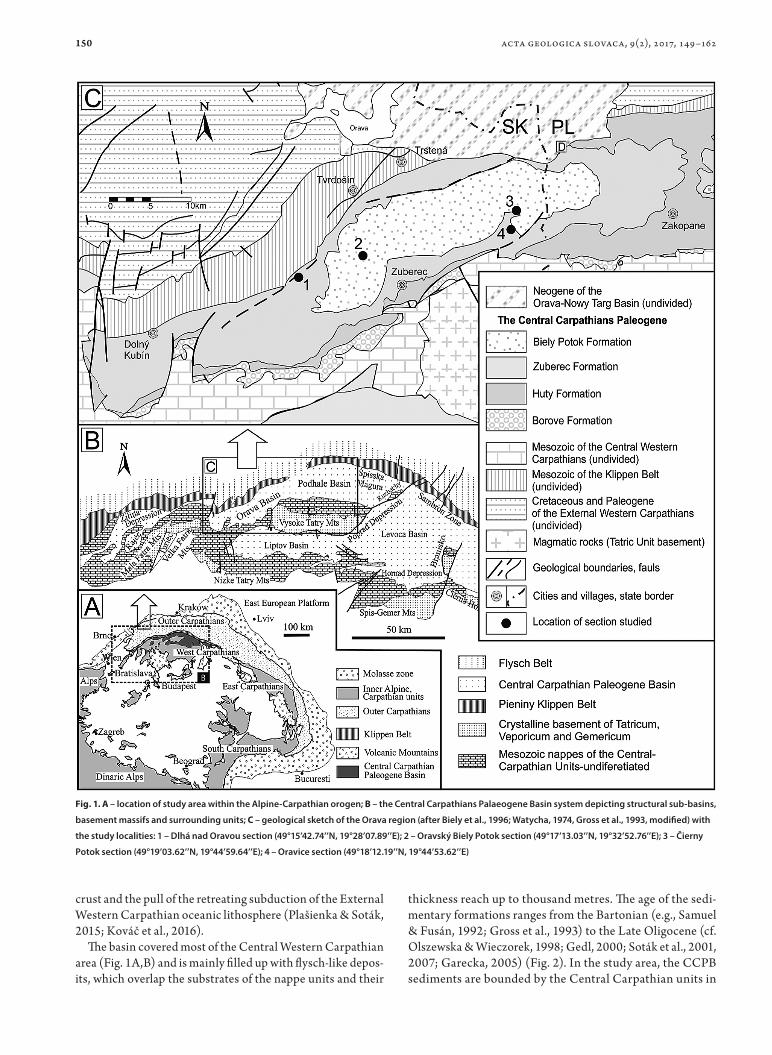
Fig. 1. A – location of study area within the Alpine-Carpathian orogen; B – the Central Carpathians Palaeogene Basin system depicting structural sub-basins,
basement massifs and surrounding units; C – geological sketch of the Orava region (after Biely et al., 1996; Watycha, 1974, Gross et al., 1993, modified) with
the study localities: 1 – Dlhá nad Oravou section (49°15’42.74’’N, 19°28’07.89’’E); 2 – Oravský Biely Potok section (49°17’13.03’’N, 19°32’52.76’’E); 3 – Čierny
Potok section (49°19’03.62’’N, 19°44’59.64’’E); 4 – Oravice section (49°18’12.19’’N, 19°44’53.62’’E)
acta geologica slovaca, 9(2), 2017, 149–162
151
the south, while the northern boundary is represented by the Pieniny Klippen Belt (Fig. 1C).
The CCPB deposits (so-called the Podtatra Group sensu Gross et al., 1984; Gross, 2008) are commonly divided into the following formations (Gross et al., 1984; Figs. 1C and 2). The lowermost Borové Formation consists of breccias, conglomer-ates, lithic sandstones to siltstones, marlstones, organodetrital and organogenic limestones. These represent the basal terres-trial and shallow-marine transgressive deposits (Marshalko, 1970; Kulka, 1985; Gross et al., 1993; Baráth & Kováč, 1995; Filo & Siráňová, 1996, 1998; Bartholdy et al., 1999). This formation is overlain by the Huty Formation, which mainly includes various mud-rich deep marine deposits (e.g., Janočko & Jacko, 1998; Soták et al., 2001; Starek et al., 2004) with the occurrence of sandstone megabed events (Starek et al., 2013). The up-section is composed of the Zuberec Formation and the Biely Potok Formation which predominantly consist of rhythmically bedded turbidites and massive sandstones and represent the various facies associations of sand-rich subma-rine fans (Westwalewicz-Mogilska, 1986; Wieczorek, 1989; Janočko et al., 1998; Soták, 1998; Starek et al., 2000; Starek, 2001; Soták et al., 2001; Sliva, 2005).
The deposits, evaluated and interpreted in this study, are part of the Zuberec and Biely Potok formations (Gross et al., 1984; Starek 2001) and occur at four localities in the Orava region. The sedimentary successions of all localities (Dlhá nad Oravou, Oravský Biely Potok, Čierny Potok, and Oravice – see location in the Fig. 1C) are biostratigraphically interpreted to be the Late Oligocene age (Starek et al. 2000; Soták et al., 2001; Starek, 2001, 2005).
3. METHODS
The research involved a standard sedimentological evaluation of four sections. Measurement of bed thicknesses and facies analysis were a key for statistical analysis. We processed 642 sandstone-mudstone pairs (Dlhá nad Oravou: 344, Oravský Biely Potok: 51, Čierny Potok: 121, and Oravice: 108). We used also modified dataset from Dlhá nad Oravou, which contains only bedsets, which correspond best to channel and levee fa-cies associations (based on the analysis of sedimentary facies). Determination of the bed thickness becomes complicated if the bed is thinning out laterally, contains preserved bedform morphology or has been eroded. In these cases, the average was used. Amalgamated sandstone beds as a result of multiple flows with no obvious bed interface are inferred to represent a single bed. Input data for statistical analysis from individual section contain measurements of coarse-division thicknesses (conglomerate, sandstone, and coarser siltstone facies) and mud-stone thicknesses (fine-grained siltstone and claystone facies) of the beds, all measured in a cm scale. Mudstone measurements include also thicknesses of hemipelagites and pelagites, because these intervals can not be distinguished from mudstones related to the basal turbidites in the field of study. No correction was made for compaction. All analysis were completed by R-cran software (R Core Team, 2014).
We evaluated the sandstone/mudstone ratio within the sec-tions. The mean, median, minimum, maximum, and standard deviation show a summary variability of coarse division and mudstone thicknesses of the beds within different localities and environments. We used histograms for the expression of the frequency distribution of bed thicknesses.
The coarse-division thicknesses of turbidite beds were used for the Hurst statistics. The Hurst exponent or coefficient (also “index of long-term dependence“) is used as a measure of long-term memory of time series. It relates to the autocorrelations of the time series (Hurst, 1951, 1956; Chen & Hiscott, 1999b). Computation of the Hurst K random shuffling of original se-quence to generate 300 randomly shuffled sequences and the assessment of the significance of the Hurst K values (Chen & Hiscott, 1999b). We plotted recalculated K to D, whose positions in final plot should indicate depositional environment (Chen & Hiscott, 1999b).
We used the datasets of coarse-division thicknesses also for demonstration/computation of cumulative distribution function, which typically shows the varying degrees of variation from the power-law (straight-line) distribution. The cumulative thickness distribution is calculated and its shape examined on a log plot. Two-dimensional model simulates the effect of proximal (within-channel) vs. distal (non-channelized) environment as well as different fan processes such as erosion and bed amalgamation (Carlson & Grotzinger, 2001).
Fig. 2. Descriptive lithostratigraphy of the western part of the Central
Carpathian Palaeogene Basin. Nomenclature of the formations according
to Gross et al. (1984), adapted. Biostratigraphy is based on the data from
Starek (2001), Starek et al. (2000), Olszewska – Wieczorek (1998), Gedl
(2000), Garecka (2005) and Soták et. al. (2007).
statistical analysis as a tool for identification of depositional palaeoenvironments in deep-sea fans...
152
The ABC index after Walker (1967) is used for the evaluation of proximity or distality of lobe systems. The coarse-division of turbidites was split to graded division (A), laminated division (B), and current rippled division (C). The ABC index or P is an equivalent of proximity and it is calculated as A (and all groups started with division A) to C ratio:
AP = –––––––––– x 100 A + C
where P express percentage of distance from A to C (percent-age values of proximity). Point of percentage of beds belonging to group A, B or C in triangular diagram reflects flow regime. Plotted values of A, B, C division fall to four defined areas in diagram (Walker, 1967).
4. R ESULTS
4.1. Sedimentary facies
The sedimentary successions within studied sections show variable lithology from fine-grained conglomerates, sand-stones up to mudstones. The conglomerates are referred to as
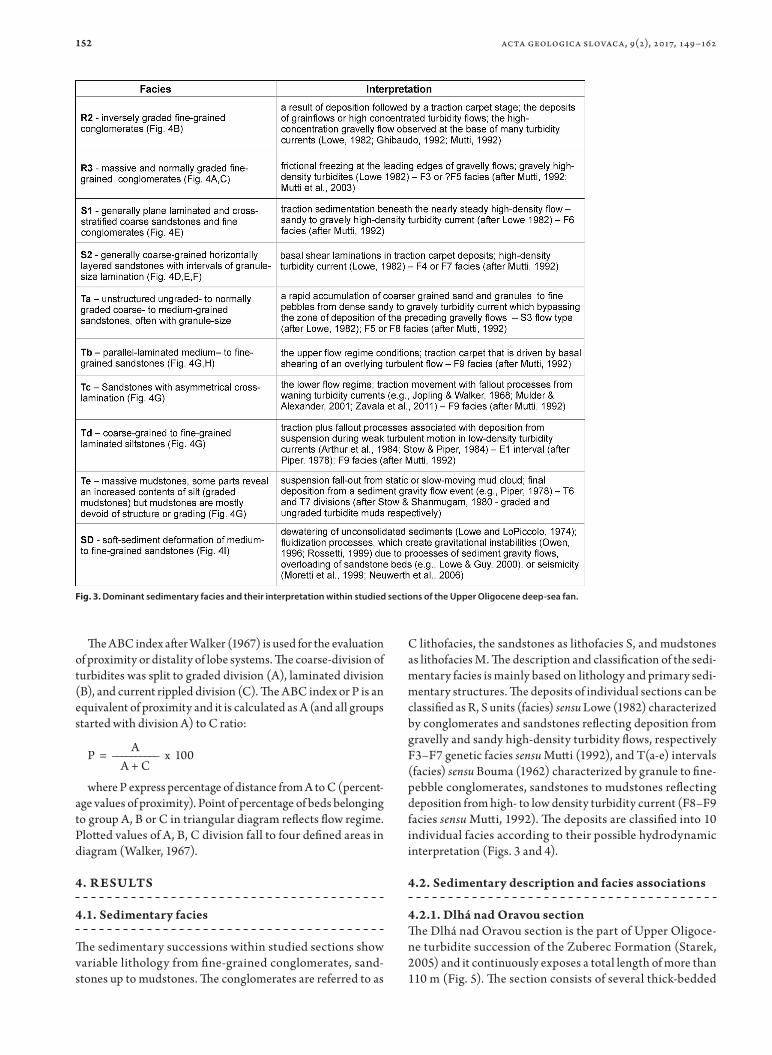
C lithofacies, the sandstones as lithofacies S, and mudstones as lithofacies M. The description and classification of the sedi-mentary facies is mainly based on lithology and primary sedi-mentary structures. The deposits of individual sections can be classified as R, S units (facies) sensu Lowe (1982) characterized by conglomerates and sandstones reflecting deposition from gravelly and sandy high-density turbidity flows, respectively F3–F7 genetic facies sensu Mutti (1992), and T(a-e) intervals (facies) sensu Bouma (1962) characterized by granule to fine-pebble conglomerates, sandstones to mudstones reflecting deposition from high- to low density turbidity current (F8–F9 facies sensu Mutti, 1992). The deposits are classified into 10 individual facies according to their possible hydrodynamic interpretation (Figs. 3 and 4).
4.2. Sedimentary description and facies associations
4.2.1. Dlhá nad Oravou sectionThe Dlhá nad Oravou section is the part of Upper Oligoce-ne turbidite succession of the Zuberec Formation (Starek, 2005) and it continuously exposes a total length of more than 110 m (Fig. 5). The section consists of several thick-bedded
acta geologica slovaca, 9(2), 2017, 149–162
Fig. 3. Dominant sedimentary facies and their interpretation within studied sections of the Upper Oligocene deep-sea fan.
153
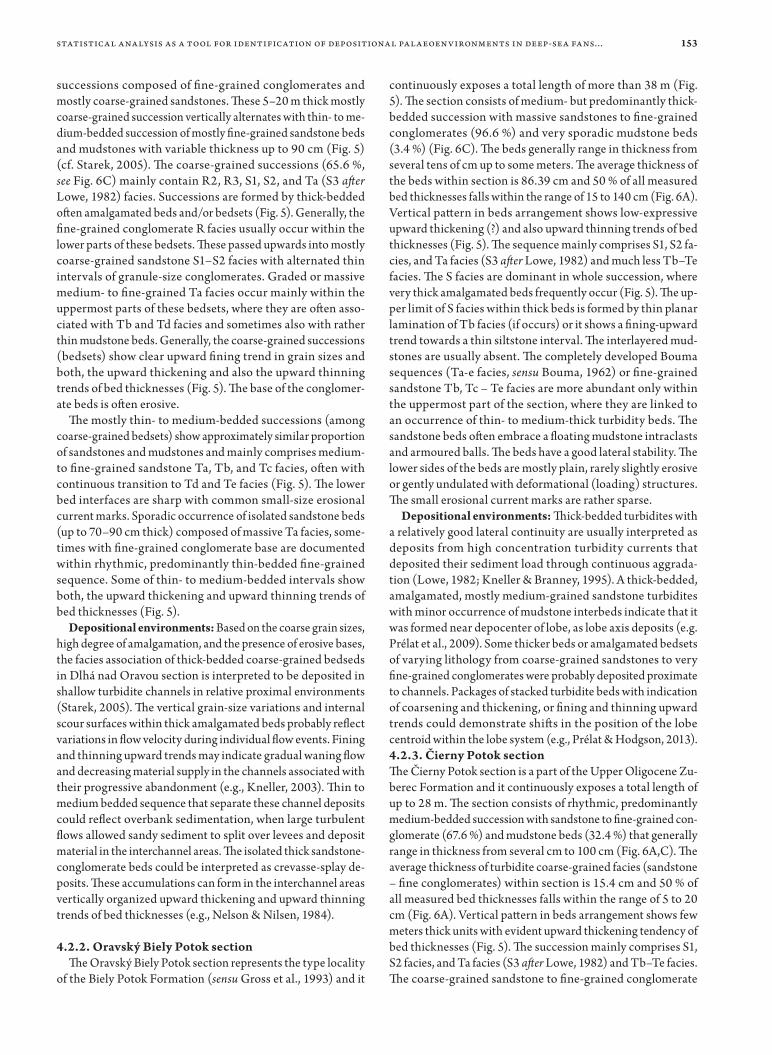
successions composed of fine-grained conglomerates and mostly coarse-grained sandstones. These 5–20 m thick mostly coarse-grained succession vertically alternates with thin- to me-dium-bedded succession of mostly fine-grained sandstone beds and mudstones with variable thickness up to 90 cm (Fig. 5) (cf. Starek, 2005). The coarse-grained successions (65.6 %, see Fig. 6C) mainly contain R2, R3, S1, S2, and Ta (S3 after Lowe, 1982) facies. Successions are formed by thick-bedded often amalgamated beds and/or bedsets (Fig. 5). Generally, the fine-grained conglomerate R facies usually occur within the lower parts of these bedsets. These passed upwards into mostly coarse-grained sandstone S1–S2 facies with alternated thin intervals of granule-size conglomerates. Graded or massive medium- to fine-grained Ta facies occur mainly within the uppermost parts of these bedsets, where they are often asso-ciated with Tb and Td facies and sometimes also with rather thin mudstone beds. Generally, the coarse-grained successions (bedsets) show clear upward fining trend in grain sizes and both, the upward thickening and also the upward thinning trends of bed thicknesses (Fig. 5). The base of the conglomer-ate beds is often erosive.
The mostly thin- to medium-bedded successions (among coarse-grained bedsets) show approximately similar proportion of sandstones and mudstones and mainly comprises medium- to fine-grained sandstone Ta, Tb, and Tc facies, often with continuous transition to Td and Te facies (Fig. 5). The lower bed interfaces are sharp with common small-size erosional current marks. Sporadic occurrence of isolated sandstone beds (up to 70–90 cm thick) composed of massive Ta facies, some-times with fine-grained conglomerate base are documented within rhythmic, predominantly thin-bedded fine-grained sequence. Some of thin- to medium-bedded intervals show both, the upward thickening and upward thinning trends of bed thicknesses (Fig. 5).
Depositional environments: Based on the coarse grain sizes, high degree of amalgamation, and the presence of erosive bases, the facies association of thick-bedded coarse-grained bedseds in Dlhá nad Oravou section is interpreted to be deposited in shallow turbidite channels in relative proximal environments (Starek, 2005). The vertical grain-size variations and internal scour surfaces within thick amalgamated beds probably reflect variations in flow velocity during individual flow events. Fining and thinning upward trends may indicate gradual waning flow and decreasing material supply in the channels associated with their progressive abandonment (e.g., Kneller, 2003). Thin to medium bedded sequence that separate these channel deposits could reflect overbank sedimentation, when large turbulent flows allowed sandy sediment to split over levees and deposit material in the interchannel areas. The isolated thick sandstone-conglomerate beds could be interpreted as crevasse-splay de-posits. These accumulations can form in the interchannel areas vertically organized upward thickening and upward thinning trends of bed thicknesses (e.g., Nelson & Nilsen, 1984).
4.2.2. Oravský Biely Potok sectionThe Oravský Biely Potok section represents the type locality
of the Biely Potok Formation (sensu Gross et al., 1993) and it
continuously exposes a total length of more than 38 m (Fig. 5). The section consists of medium- but predominantly thick-bedded succession with massive sandstones to fine-grained conglomerates (96.6 %) and very sporadic mudstone beds (3.4 %) (Fig. 6C). The beds generally range in thickness from several tens of cm up to some meters. The average thickness of the beds within section is 86.39 cm and 50 % of all measured bed thicknesses falls within the range of 15 to 140 cm (Fig. 6A). Vertical pattern in beds arrangement shows low-expressive upward thickening (?) and also upward thinning trends of bed thicknesses (Fig. 5). The sequence mainly comprises S1, S2 fa-cies, and Ta facies (S3 after Lowe, 1982) and much less Tb–Te facies. The S facies are dominant in whole succession, where very thick amalgamated beds frequently occur (Fig. 5). The up-per limit of S facies within thick beds is formed by thin planar lamination of Tb facies (if occurs) or it shows a fining-upward trend towards a thin siltstone interval. The interlayered mud-stones are usually absent. The completely developed Bouma sequences (Ta-e facies, sensu Bouma, 1962) or fine-grained sandstone Tb, Tc – Te facies are more abundant only within the uppermost part of the section, where they are linked to an occurrence of thin- to medium-thick turbidity beds. The sandstone beds often embrace a floating mudstone intraclasts and armoured balls. The beds have a good lateral stability. The lower sides of the beds are mostly plain, rarely slightly erosive or gently undulated with deformational (loading) structures. The small erosional current marks are rather sparse.
Depositional environments: Thick-bedded turbidites with a relatively good lateral continuity are usually interpreted as deposits from high concentration turbidity currents that deposited their sediment load through continuous aggrada-tion (Lowe, 1982; Kneller & Branney, 1995). A thick-bedded, amalgamated, mostly medium-grained sandstone turbidites with minor occurrence of mudstone interbeds indicate that it was formed near depocenter of lobe, as lobe axis deposits (e.g. Prélat et al., 2009). Some thicker beds or amalgamated bedsets of varying lithology from coarse-grained sandstones to very fine-grained conglomerates were probably deposited proximate to channels. Packages of stacked turbidite beds with indication of coarsening and thickening, or fining and thinning upward trends could demonstrate shifts in the position of the lobe centroid within the lobe system (e.g., Prélat & Hodgson, 2013).4.2.3. Čierny Potok sectionThe Čierny Potok section is a part of the Upper Oligocene Zu-berec Formation and it continuously exposes a total length of up to 28 m. The section consists of rhythmic, predominantly medium-bedded succession with sandstone to fine-grained con-glomerate (67.6 %) and mudstone beds (32.4 %) that generally range in thickness from several cm to 100 cm (Fig. 6A,C). The average thickness of turbidite coarse-grained facies (sandstone – fine conglomerates) within section is 15.4 cm and 50 % of all measured bed thicknesses falls within the range of 5 to 20 cm (Fig. 6A). Vertical pattern in beds arrangement shows few meters thick units with evident upward thickening tendency of bed thicknesses (Fig. 5). The succession mainly comprises S1, S2 facies, and Ta facies (S3 after Lowe, 1982) and Tb–Te facies. The coarse-grained sandstone to fine-grained conglomerate
statistical analysis as a tool for identification of depositional palaeoenvironments in deep-sea fans...
154 acta geologica slovaca, 9(2), 2017, 149–162
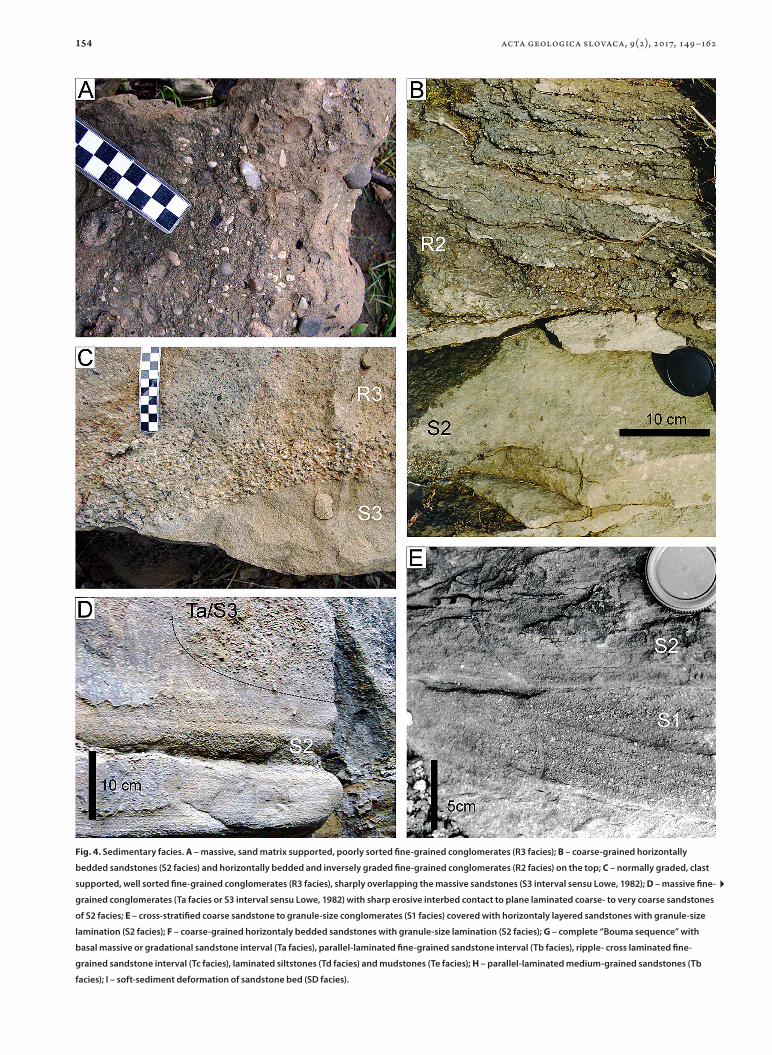
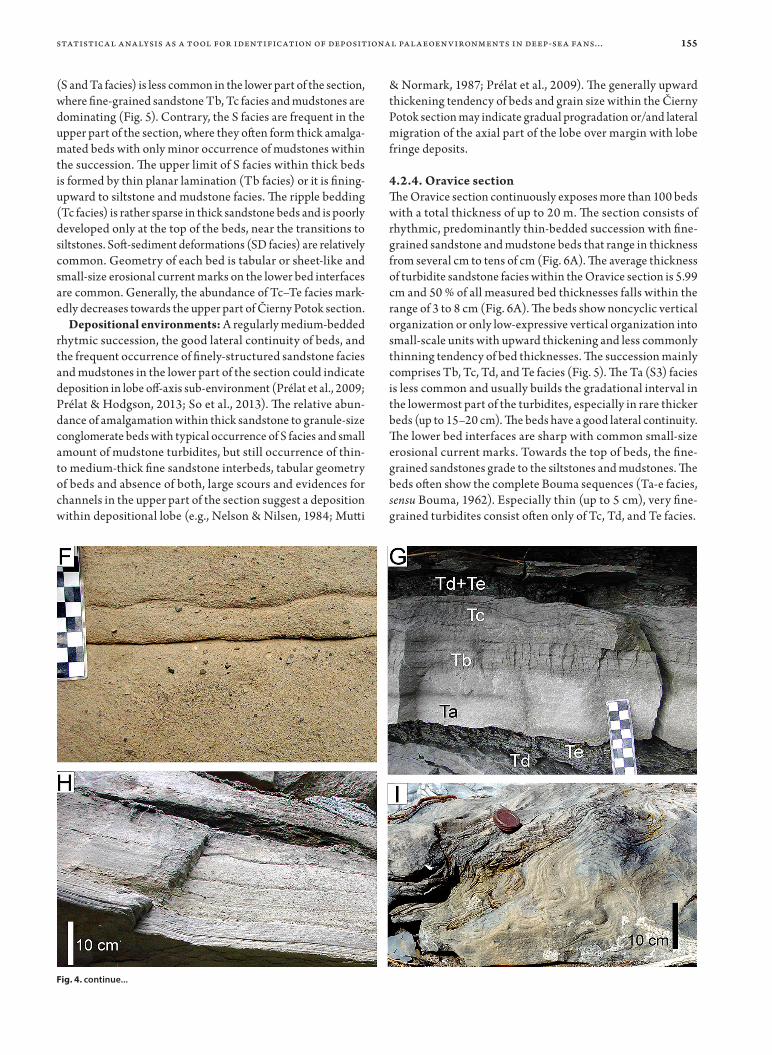
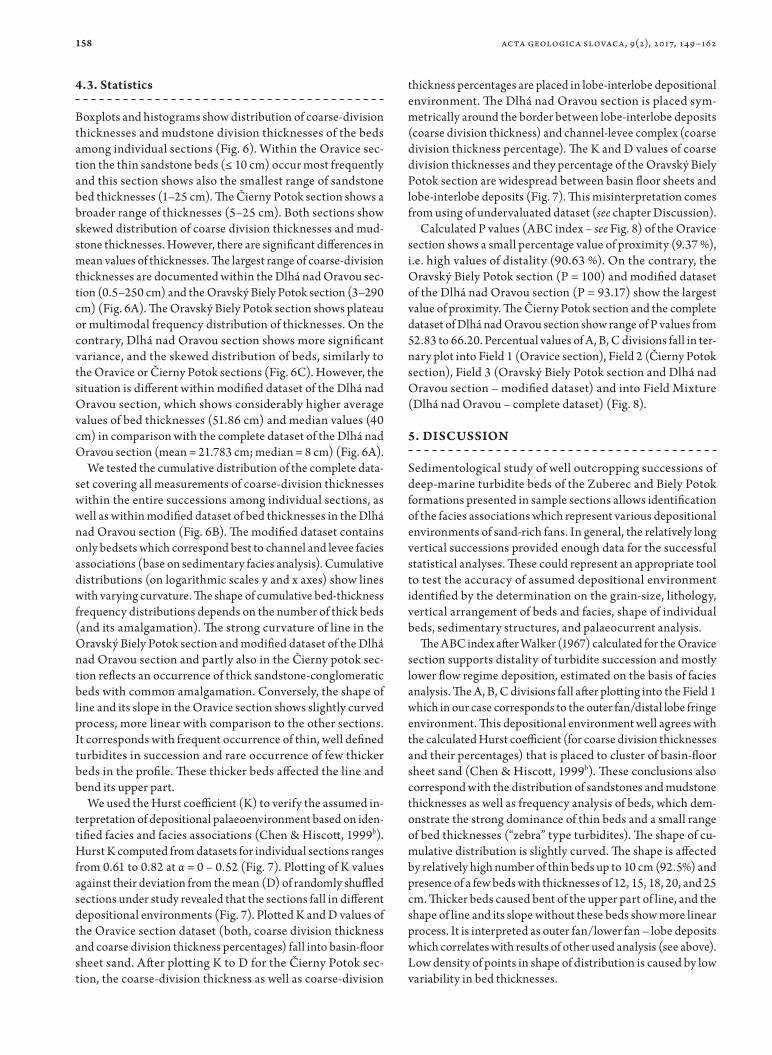
Fig. 4. Sedimentary facies. A – massive, sand matrix supported, poorly sorted fine-grained conglomerates (R3 facies); B – coarse-grained horizontally
bedded sandstones (S2 facies) and horizontally bedded and inversely graded fine-grained conglomerates (R2 facies) on the top; C – normally graded, clast
supported, well sorted fine-grained conglomerates (R3 facies), sharply overlapping the massive sandstones (S3 interval sensu Lowe, 1982); D – massive fine-
grained conglomerates (Ta facies or S3 interval sensu Lowe, 1982) with sharp erosive interbed contact to plane laminated coarse- to very coarse sandstones
of S2 facies; E – cross-stratified coarse sandstone to granule-size conglomerates (S1 facies) covered with horizontaly layered sandstones with granule-size
lamination (S2 facies); F – coarse-grained horizontaly bedded sandstones with granule-size lamination (S2 facies); G – complete “Bouma sequence” with
basal massive or gradational sandstone interval (Ta facies), parallel-laminated fine-grained sandstone interval (Tb facies), ripple- cross laminated fine-
grained sandstone interval (Tc facies), laminated siltstones (Td facies) and mudstones (Te facies); H – parallel-laminated medium-grained sandstones (Tb
facies); I – soft-sediment deformation of sandstone bed (SD facies).
155
(S and Ta facies) is less common in the lower part of the section, where fine-grained sandstone Tb, Tc facies and mudstones are dominating (Fig. 5). Contrary, the S facies are frequent in the upper part of the section, where they often form thick amalga-mated beds with only minor occurrence of mudstones within the succession. The upper limit of S facies within thick beds is formed by thin planar lamination (Tb facies) or it is fining-upward to siltstone and mudstone facies. The ripple bedding (Tc facies) is rather sparse in thick sandstone beds and is poorly developed only at the top of the beds, near the transitions to siltstones. Soft-sediment deformations (SD facies) are relatively common. Geometry of each bed is tabular or sheet-like and small-size erosional current marks on the lower bed interfaces are common. Generally, the abundance of Tc–Te facies mark-edly decreases towards the upper part of Čierny Potok section.
Depositional environments: A regularly medium-bedded rhytmic succession, the good lateral continuity of beds, and the frequent occurrence of finely-structured sandstone facies and mudstones in the lower part of the section could indicate deposition in lobe off-axis sub-environment (Prélat et al., 2009; Prélat & Hodgson, 2013; So et al., 2013). The relative abun-dance of amalgamation within thick sandstone to granule-size conglomerate beds with typical occurrence of S facies and small amount of mudstone turbidites, but still occurrence of thin- to medium-thick fine sandstone interbeds, tabular geometry of beds and absence of both, large scours and evidences for channels in the upper part of the section suggest a deposition within depositional lobe (e.g., Nelson & Nilsen, 1984; Mutti
& Normark, 1987; Prélat et al., 2009). The generally upward thickening tendency of beds and grain size within the Čierny Potok section may indicate gradual progradation or/and lateral migration of the axial part of the lobe over margin with lobe fringe deposits.
4.2.4. Oravice sectionThe Oravice section continuously exposes more than 100 beds with a total thickness of up to 20 m. The section consists of rhythmic, predominantly thin-bedded succession with fine-grained sandstone and mudstone beds that range in thickness from several cm to tens of cm (Fig. 6A). The average thickness of turbidite sandstone facies within the Oravice section is 5.99 cm and 50 % of all measured bed thicknesses falls within the range of 3 to 8 cm (Fig. 6A). The beds show noncyclic vertical organization or only low-expressive vertical organization into small-scale units with upward thickening and less commonly thinning tendency of bed thicknesses. The succession mainly comprises Tb, Tc, Td, and Te facies (Fig. 5). The Ta (S3) facies is less common and usually builds the gradational interval in the lowermost part of the turbidites, especially in rare thicker beds (up to 15–20 cm). The beds have a good lateral continuity. The lower bed interfaces are sharp with common small-size erosional current marks. Towards the top of beds, the fine-grained sandstones grade to the siltstones and mudstones. The beds often show the complete Bouma sequences (Ta-e facies, sensu Bouma, 1962). Especially thin (up to 5 cm), very fine-grained turbidites consist often only of Tc, Td, and Te facies.
statistical analysis as a tool for identification of depositional palaeoenvironments in deep-sea fans...
Fig. 4. continue...
156 acta geologica slovaca, 9(2), 2017, 149–162
157
Depositional environments: Regularly thin-bedded, rhyth-mic succession with a higher proportion of mudstone (65.6 %), thin-bedded finely-structured sandstones with significant dominance of Tc–Te facies, and the good lateral continuity of beds supported interpretation of the Oravice section as lobe fringe deposited on the margin of a prograding lobe (e.g., Prélat & Hodgson, 2013; So et al., 2013). The deposits represent dilute low concentration turbidity currents and slow hemipelagic deposition of the basin plain (Stow & Piper, 1984).
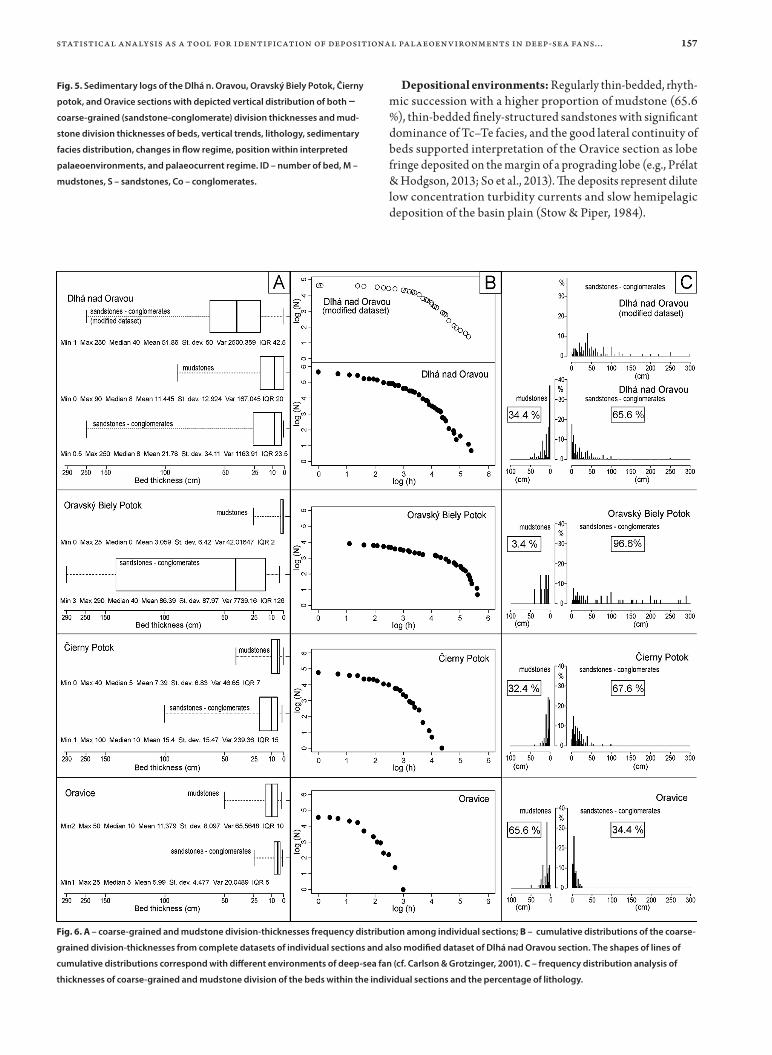
Fig. 6. A – coarse-grained and mudstone division-thicknesses frequency distribution among individual sections; B – cumulative distributions of the coarse-
grained division-thicknesses from complete datasets of individual sections and also modified dataset of Dlhá nad Oravou section. The shapes of lines of
cumulative distributions correspond with different environments of deep-sea fan (cf. Carlson & Grotzinger, 2001). C – frequency distribution analysis of
thicknesses of coarse-grained and mudstone division of the beds within the individual sections and the percentage of lithology.
statistical analysis as a tool for identification of depositional palaeoenvironments in deep-sea fans...
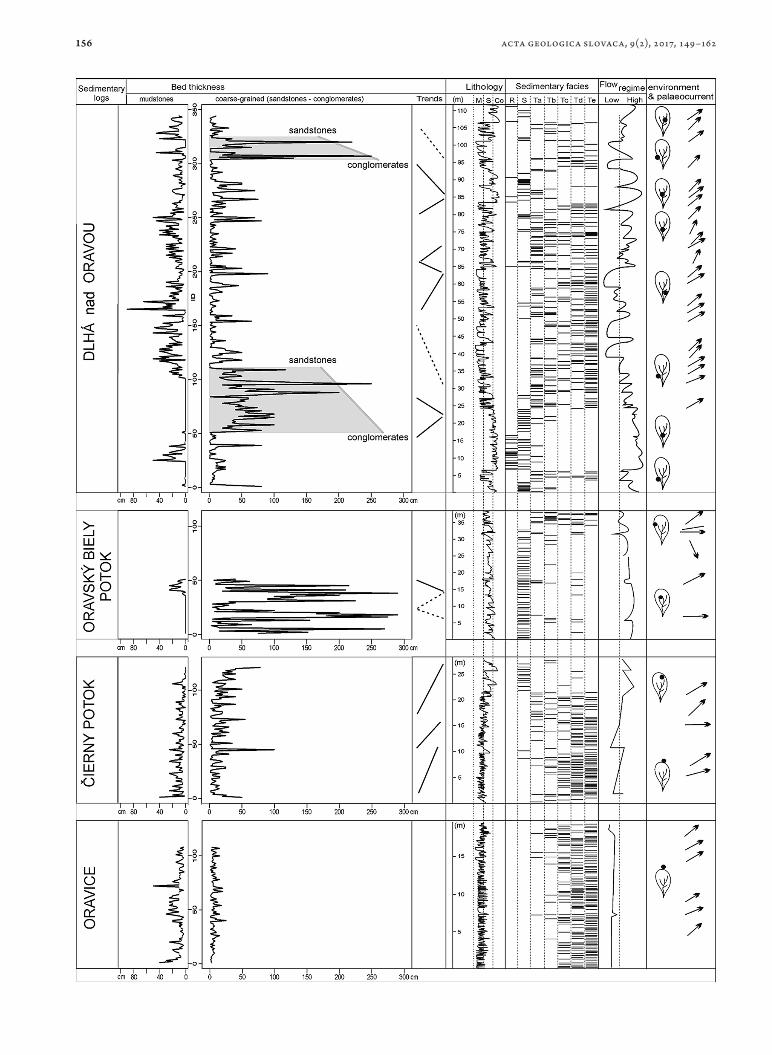
Fig. 5. Sedimentary logs of the Dlhá n. Oravou, Oravský Biely Potok, Čierny
potok, and Oravice sections with depicted vertical distribution of both –
coarse-grained (sandstone-conglomerate) division thicknesses and mud-
stone division thicknesses of beds, vertical trends, lithology, sedimentary
facies distribution, changes in flow regime, position within interpreted
palaeoenvironments, and palaeocurrent regime. ID – number of bed, M –
mudstones, S – sandstones, Co – conglomerates.
158
4.3. Statistics
Boxplots and histograms show distribution of coarse-division thicknesses and mudstone division thicknesses of the beds among individual sections (Fig. 6). Within the Oravice sec-tion the thin sandstone beds (≤ 10 cm) occur most frequently and this section shows also the smallest range of sandstone bed thicknesses (1–25 cm). The Čierny Potok section shows a broader range of thicknesses (5–25 cm). Both sections show skewed distribution of coarse division thicknesses and mud-stone thicknesses. However, there are significant differences in mean values of thicknesses. The largest range of coarse-division thicknesses are documented within the Dlhá nad Oravou sec-tion (0.5–250 cm) and the Oravský Biely Potok section (3–290 cm) (Fig. 6A). The Oravský Biely Potok section shows plateau or multimodal frequency distribution of thicknesses. On the contrary, Dlhá nad Oravou section shows more significant variance, and the skewed distribution of beds, similarly to the Oravice or Čierny Potok sections (Fig. 6C). However, the situation is different within modified dataset of the Dlhá nad Oravou section, which shows considerably higher average values of bed thicknesses (51.86 cm) and median values (40 cm) in comparison with the complete dataset of the Dlhá nad Oravou section (mean = 21.783 cm; median = 8 cm) (Fig. 6A).
We tested the cumulative distribution of the complete data-set covering all measurements of coarse-division thicknesses within the entire successions among individual sections, as well as within modified dataset of bed thicknesses in the Dlhá nad Oravou section (Fig. 6B). The modified dataset contains only bedsets which correspond best to channel and levee facies associations (base on sedimentary facies analysis). Cumulative distributions (on logarithmic scales y and x axes) show lines with varying curvature. The shape of cumulative bed-thickness frequency distributions depends on the number of thick beds (and its amalgamation). The strong curvature of line in the Oravský Biely Potok section and modified dataset of the Dlhá nad Oravou section and partly also in the Čierny potok sec-tion reflects an occurrence of thick sandstone-conglomeratic beds with common amalgamation. Conversely, the shape of line and its slope in the Oravice section shows slightly curved process, more linear with comparison to the other sections. It corresponds with frequent occurrence of thin, well defined turbidites in succession and rare occurrence of few thicker beds in the profile. These thicker beds affected the line and bend its upper part.
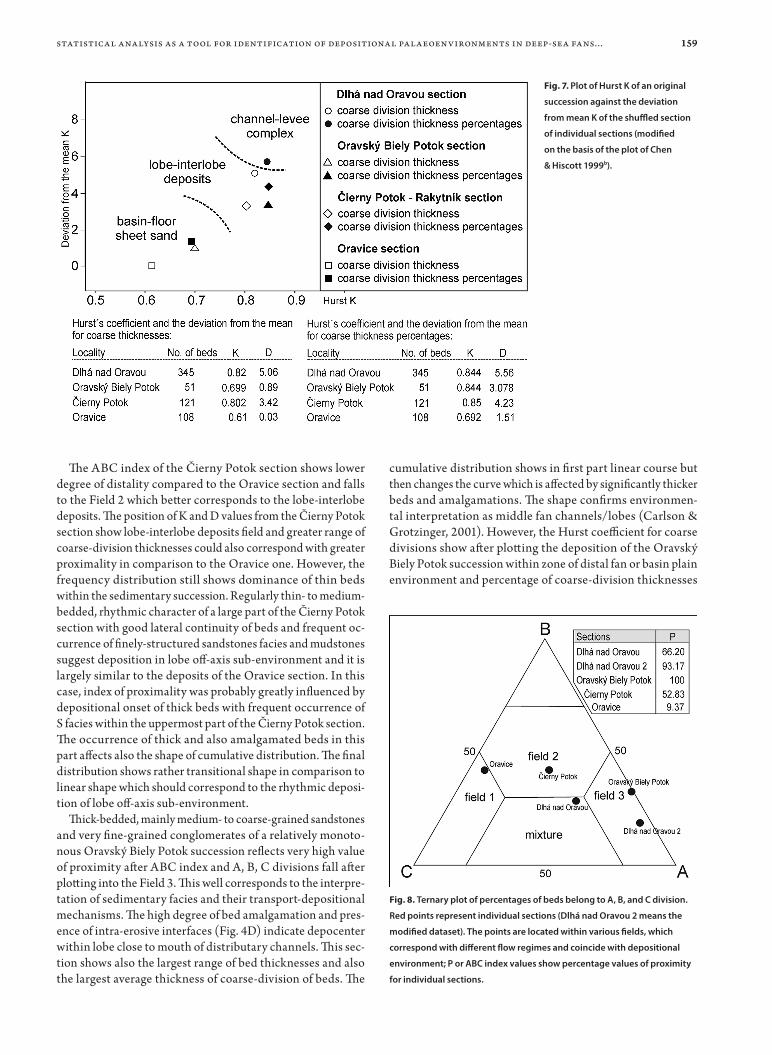
We used the Hurst coefficient (K) to verify the assumed in-terpretation of depositional palaeoenvironment based on iden-tified facies and facies associations (Chen & Hiscott, 1999b). Hurst K computed from datasets for individual sections ranges from 0.61 to 0.82 at α = 0 – 0.52 (Fig. 7). Plotting of K values against their deviation from the mean (D) of randomly shuffled sections under study revealed that the sections fall in different depositional environments (Fig. 7). Plotted K and D values of the Oravice section dataset (both, coarse division thickness and coarse division thickness percentages) fall into basin-floor sheet sand. After plotting K to D for the Čierny Potok sec-tion, the coarse-division thickness as well as coarse-division
thickness percentages are placed in lobe-interlobe depositional environment. The Dlhá nad Oravou section is placed sym-metrically around the border between lobe-interlobe deposits (coarse division thickness) and channel-levee complex (coarse division thickness percentage). The K and D values of coarse division thicknesses and they percentage of the Oravský Biely Potok section are widespread between basin floor sheets and lobe-interlobe deposits (Fig. 7). This misinterpretation comes from using of undervaluated dataset (see chapter Discussion).
Calculated P values (ABC index – see Fig. 8) of the Oravice section shows a small percentage value of proximity (9.37 %), i.e. high values of distality (90.63 %). On the contrary, the Oravský Biely Potok section (P = 100) and modified dataset of the Dlhá nad Oravou section (P = 93.17) show the largest value of proximity. The Čierny Potok section and the complete dataset of Dlhá nad Oravou section show range of P values from 52.83 to 66.20. Percentual values of A, B, C divisions fall in ter-nary plot into Field 1 (Oravice section), Field 2 (Čierny Potok section), Field 3 (Oravský Biely Potok section and Dlhá nad Oravou section – modified dataset) and into Field Mixture (Dlhá nad Oravou – complete dataset) (Fig. 8).
5. DISCUSSION
Sedimentological study of well outcropping successions of deep-marine turbidite beds of the Zuberec and Biely Potok formations presented in sample sections allows identification of the facies associations which represent various depositional environments of sand-rich fans. In general, the relatively long vertical successions provided enough data for the successful statistical analyses. These could represent an appropriate tool to test the accuracy of assumed depositional environment identified by the determination on the grain-size, lithology, vertical arrangement of beds and facies, shape of individual beds, sedimentary structures, and palaeocurrent analysis.
The ABC index after Walker (1967) calculated for the Oravice section supports distality of turbidite succession and mostly lower flow regime deposition, estimated on the basis of facies analysis. The A, B, C divisions fall after plotting into the Field 1 which in our case corresponds to the outer fan/distal lobe fringe environment. This depositional environment well agrees with the calculated Hurst coefficient (for coarse division thicknesses and their percentages) that is placed to cluster of basin-floor sheet sand (Chen & Hiscott, 1999b). These conclusions also correspond with the distribution of sandstones and mudstone thicknesses as well as frequency analysis of beds, which dem-onstrate the strong dominance of thin beds and a small range of bed thicknesses (“zebra” type turbidites). The shape of cu-mulative distribution is slightly curved. The shape is affected by relatively high number of thin beds up to 10 cm (92.5%) and presence of a few beds with thicknesses of 12, 15, 18, 20, and 25 cm. Thicker beds caused bent of the upper part of line, and the shape of line and its slope without these beds show more linear process. It is interpreted as outer fan/lower fan – lobe deposits which correlates with results of other used analysis (see above). Low density of points in shape of distribution is caused by low variability in bed thicknesses.
acta geologica slovaca, 9(2), 2017, 149–162
159
The ABC index of the Čierny Potok section shows lower degree of distality compared to the Oravice section and falls to the Field 2 which better corresponds to the lobe-interlobe deposits. The position of K and D values from the Čierny Potok section show lobe-interlobe deposits field and greater range of coarse-division thicknesses could also correspond with greater proximality in comparison to the Oravice one. However, the frequency distribution still shows dominance of thin beds within the sedimentary succession. Regularly thin- to medium-bedded, rhythmic character of a large part of the Čierny Potok section with good lateral continuity of beds and frequent oc-currence of finely-structured sandstones facies and mudstones suggest deposition in lobe off-axis sub-environment and it is largely similar to the deposits of the Oravice section. In this case, index of proximality was probably greatly influenced by depositional onset of thick beds with frequent occurrence of S facies within the uppermost part of the Čierny Potok section. The occurrence of thick and also amalgamated beds in this part affects also the shape of cumulative distribution. The final distribution shows rather transitional shape in comparison to linear shape which should correspond to the rhythmic deposi-tion of lobe off-axis sub-environment.
Thick-bedded, mainly medium- to coarse-grained sandstones and very fine-grained conglomerates of a relatively monoto-nous Oravský Biely Potok succession reflects very high value of proximity after ABC index and A, B, C divisions fall after plotting into the Field 3. This well corresponds to the interpre-tation of sedimentary facies and their transport-depositional mechanisms. The high degree of bed amalgamation and pres-ence of intra-erosive interfaces (Fig. 4D) indicate depocenter within lobe close to mouth of distributary channels. This sec-tion shows also the largest range of bed thicknesses and also the largest average thickness of coarse-division of beds. The
cumulative distribution shows in first part linear course but then changes the curve which is affected by significantly thicker beds and amalgamations. The shape confirms environmen-tal interpretation as middle fan channels/lobes (Carlson & Grotzinger, 2001). However, the Hurst coefficient for coarse divisions show after plotting the deposition of the Oravský Biely Potok succession within zone of distal fan or basin plain environment and percentage of coarse-division thicknesses
Fig. 7. Plot of Hurst K of an original
succession against the deviation
from mean K of the shuffled section
of individual sections (modified
on the basis of the plot of Chen
& Hiscott 1999b).
Fig. 8. Ternary plot of percentages of beds belong to A, B, and C division.
Red points represent individual sections (Dlhá nad Oravou 2 means the
modified dataset). The points are located within various fields, which
correspond with different flow regimes and coincide with depositional
environment; P or ABC index values show percentage values of proximity
for individual sections.
statistical analysis as a tool for identification of depositional palaeoenvironments in deep-sea fans...
160
fall to lobe-interlobe environment. These wide spread of the values and the misconception of using Hurst coefficient re-sult with greatest probability from an insufficient number of measurements in the dataset (only 51 beds). Here are clearly shown the limits for application of the Hurst coefficient in the study of axial depocenters of sand rich mid fan environment with very thick beds, because despite of the relatively large outcrop it is quite difficult to obtain a dataset with a sufficient number of beds.
The opposite problem with the interpretation of the results of statistical methods is extremely long succession with a very large number of test beds within the Dlhá nad Oravou section. Although, on the basis of sedimentary analysis, several parts of this succession clearly demonstrate deposition within shallow turbidite channels in relative proximal environments of middle fan, the index of proximality calculated for complete dataset shows only average values and A,B,C divisions fall into mixed field. The mean, medium and 50% interval of all beds also show considerable undervaluation in comparison with expected values for distributaries in proximal parts of middle fan. This is due to mixed signal from great length of the Dlhá nad Oravou suc-cession which includes the vertical development of the various depositional environments, interpreted as channel-levee and more slurry inter-channel environments with crevasse-splay deposits and overbank sandy deposition. This assumption is clearly documented by using a modified dataset that comprises only bedsets, which are evidently interpreted as channel-levee deposits. The modified dataset shows large value of proximal-ity and A,B,C divisions fall into Field 3 (Fig. 8). There is also a significant shift to higher average and median values of bed thicknesses. A slight change in the shape of cumulative distribu-tion is also documented. Transitional shape, which correspond with mixed influence of various depositional systems going to be more curved, which correspond bett er with channels (Fig. 6). Histogram shows significant change of distribution of bed thicknesses (towards the thick beds) in comparison with origi-nal dataset. The Hurst coeficient was not calculated because modified dataset of the Dlhá n. Oravou section is under minimal limit (100).
Index of proximality in turbidite deposition assumes basin-ward decrease in erosion as well as gradual thinning and fining tendency of turbidity current with distance as a result of loosing energy and gradual flow depletion (e.g., Walker, 1967; Kneller & Branney, 1995). However, the proximal areas of deep-sea fans are characterized by a relatively high lateral variability in depositional environments (channel – levee – interchannel) with strong lateral anisotropy in flow velocity. Therefore, fine-grained sediments that accumulated in levee and interchannel areas have similar characteristics to those accumulated in distal areas (e.g., Mutti & Ricci Lucchi, 1972). Comparison of sedi-mentary facies analysis and statistical analysis shows that the P index or ABC index of proximality has only poor information value, especially when the dataset includes the values of a long vertical depositional record in proximal parts of deep-sea fans. It can be used only in ideal cases where the mixed signal is not present within vertical succession as a result of lateral variability of depositional environments.
6. CONCLUSIONS
The statistical analyses could represent an appropriate supple-mental tool to test the accuracy of assumed depositional envi-ronment identified by conventional approaches as a detailed analysis of sedimentary facies. The computation of the Hurst coefficient and cumulative distributions of the bed thicknesses can be successfully used as primary methodological approaches to the interpretation of submarine fan depositional environ-ments and palaeo-flow regimes (cf. also Kötelešová, 2012). This applies especially for the interpretation of borehole data, where only one-dimensional information is available. However, the statistical analysis of the facies clustering requires good quality and adequate quantity of data (Chen & Hiscott, 1999b), what in our case is demonstrated by the example of the Oravský Biely Potok section where insufficient dataset evidently results to the misinterpretation of the position within submarine fan archi-tecture. The widespread application of the Hurst coefficient/facies clustering analysis and cumulative distribution of the bed thicknesses is limited also for successions of sufficient dataset quantity but with a mixed signal in consequence of frequent vertical variation of depositional environments, especially in more proximal parts of deep-sea fans. This may result in a shift of clustering in final plot. It can also affect the shape of cumulative distribution, eventually considerably undervalue or overvalue the statistical indicators of measured data or cause a shift in the frequency histograms of bed thicknesses, which is demonstrated within the Dlhá nad Oravou section. The P index or ABC index of proximity ideally reflect distality/proximity of depositional environment in deep-sea fan and palaeo-flow regime, but fails to distinguish it from the lateral changes of sub-environments within specific depositional areas, therefore it has generally only poor information value.
Acknowledgements: This work was supported by the scientific grant agency of the Slovak Republic (Vega 2/0017/15) and Slovak Research and Development Agency under the contract No. APVV–14–0118. The authors thank to Karel Martínek, anonymous reviewer, and editor for the detailed review of this paper and constructive comments.
References
Arthur M.A., Dean W.E. & Stow D.A.V., 1984: Models for the deposition of Mesozoic-Cenozoic fine-grained organic-carbon-rich sediment in the deep sea. In: Stow D.A.V. & Piper D.J.W. (Eds.): Fine-grained sediments: Deep-water processes and Facies. Geological Society, London, Special Publications, 15, pp. 527–560.
Baráth I. & Kováč M., 1995: Systematika gravitačných tokov v marginálnych sedimentoch paleogénu medzi Markušovcami a Kľuknavou (CKP Hornád-skej kotliny) [Systematics of gravity-flow deposits in the marginal Paleogene formations between Markušovce and Kluknava villages (Hornád Depres-sion)]. Mineralia Slovaca, Geovestník, 27, 6. [in Slovak]
Bartholdy J., Bellas S. M., Cosovic V., Fucek V. P. & Keupp H., 1999: Processes controlling Eocene mid-latitude larger Foraminifera accumulations: mo-delling of the stratigraphic architecture of a fore-arc basin (Podhale Basin, Poland). Geologica Carpathica, 50, 435–448.
acta geologica slovaca, 9(2), 2017, 149–162
161
Biely A., Bezák V., Elečko M., Kaličiak M., Konečný V., Lexa J., Mello J., Nemčok J., Potfaj M., Rakús M., Vass D., Vozár J. & Vozárová A., 1996: Geological map of Slovakia (1:500,000). Geological Survey of Slovak Republic, Bratislava.
Bouma A.H., 1962: Sedimentology of Some Flysch Deposits. Elsevier, Am-sterdam, 168 p.
Carlson J. & Grotzinger J. P., 2001: Submarine fan environment inferred from turbidite thickness distributions. Sedimentology, 48, 6, 1331–1351.
Chakraborty P.P., Mukhopadhyay B., Pal, T. & Gupta T.D., 2002: Statistical appraisal of bed thickness patterns in turbidite successions, Andaman Flysch Group, Andaman Islands, India. Journal of Asian Earth Sciences, 21, 189–196.
Chen Ch. & Hiscott R.N., 1999a: Statistical analysis of turbidite cycles in submarine fan successions: tests for short-term persistence. Journal of Se-dimentary Research, 69, 486–504.
Chen Ch. & Hiscott R.N., 1999b: Statistical analysis of facies clustering in submarine-fan turbidite successions. Journal of Sedimentary Research, 69, 505–517.
Filo I. & Siráňová Z., 1996: The Tomášovce Member – a new lithostratigraphic unit of the Subtatric Group. Geologicke Práce, Správy, 102, 41–49. [in Slovak with English summary]
Filo I. & Siráňová Z., 1998: Hornád and Chrasť Member – new regional litho-stratigraphic units of the Sub-Tatric Group. Geologické Práce, Správy, 103, 35–51. [in Slovak with English summary]
Garecka M., 2005: Calcareous nannoplankton from the Podhale Flysch (Oli-gocene–Miocene, Inner Carpathians, Poland). In: Tyszka J., Oliwkiewicz-Miklasiñska M., Gedl P. & Kaminski M.A. (Eds.): Methods and Applications in Micropalaeontology. Studia Geologica Polonica, 124, 353–369.
Gedl P., 2000: Biostratigraphy and palaeoenvironment of the Podhale Pala-eogene (Inner Carpathians, Poland) in the light of palynological studies. Studia Geologica Polonica, 117, 155–303.
Ghibaudo G., 1992: Subaqueous sediment gravity flow deposits: practical crite-ria for their field description and classification. Sedimentology, 39, 423–454.
Gross P., 2008: Lithostratigraphy of Western Carpathians: Paleogene – Pod-tatranská Group. Štátny Geologický Ústav D. Štúra, Bratislava, 78 p. [in Slovak with English summary]
Gross P., Köhler E. & Samuel O., 1984: A new lithostratigraphic division of the Inner-Carpathian Paleogene. Geologické Práce, Správy, 81, 113–117. [in Slovak with English summary]
Gross P., Köhler E., Mello J., Haško J., Halouzka R. & Nagy A., 1993: Geology of Southern and Eastern Orava. GÚDŠ, Bratislava, 319 p. [in Slovak with English summary]
Hurst H. E., 1951: Long-term storage capacity of reservoirs. Transactions of the American Society of Civil Engineers, 116, 770–808.
Hurst H.E., 1956: Methods of using long-term storage in reservoirs. Proceedings of the Institution of Civil Engineers, 5.5, 519–543.
Janočko J. & Jacko S., 1998: Marginal and deep-sea deposits of Central-Car-pathian Paleogene Basin, Spiš Magura region, Slovakia: implication for basin history. Slovak Geological Magazine, 4, 281–292.
Janočko J., Hamršmíd B., Jacko S. & Siráňová Z., 1998: Suprafan and channel – and levee deposits at Tichý Potok section, Levoča Mts.; Central Carpathian Paleogene Basin, Slovakia. Slovak Geological Magazine, 4, 3–15.
Jopling A.V. & Walker R.G., 1968: Morphology and origin of ripple-drift cross-lamination, with examples from the Pleistocene of Massachusetts. Journal of Sedimentary Petrology, 38, 971–984.
Kázmér M., Dunkl I., Frisch W., Kuhlemann J. & Ozsvárt P., 2003: The Palaeo-gene forearc basin of the Eastern Alps and Western Carpathians: subduction erosion and basin evolution. Journal of the Geological Society, 160, 413–428
Kneller B., 2003: The influence of flow parameters on turbidite slope channel architecture. Marine and Petroleum Geology, 20, 901–910.
Kneller B., & Branney M.J., 1995: Sustained high-density turbidity currents and the deposition of thick massive sands. Sedimentology, 42, 607–616.
Kováč M., Plašienka D., Soták J., Vojtko R., Oszczypko N., Less Gy., Ćosović V., Fügenschuh B. & Králiková S., 2016: Paleogene palaeogeography and basin evolution of the Western Carpathians, Northern Pannonian domain and adjoining areas. Global and Planetary Change, 140, 9–27.
Kötelešová, S., 2012: Facies clustering in deep-water successions of the Magu-ra zone of the Outer Western Carpathians: implications for interpretation of submarine-fan environments. Facies, 58, 217–227.
Kulka A., 1985: Arni sedimentological model in the Tatra Eocene. Kwartalnik Geologiczny, 29, 1, 31–64.
Lowe D.R., 1982: Sediment gravity flows: II. Depositional models with spe-cial reference to the deposits of high-density turbidity currents. Journal of Sedimentary Petrology, 52, 279–297.
Lowe D.R. & Guy M., 2000: Slurry-flow deposits in the Britannia Formation (Lower Cretaceous), North Sea: a new perspective on the turbidity current and debris flow problem. Sedimentology, 47, 31–70.
Lowe D.R. & LoPiccolo R.D., 1974: The characteristics and origins of dish and pillar structures. Journal of Sedimentary Petrology, 44, 484– 501.
Marshalko R., 1970: The research of sedimentary textures, structures, and palaeocurrent analysis of basal formations (Central Western Carpathian Paleogene, N of Spišsko-gemerské rudohorie Mts.). Acta Geologica et Geographica Universitatis Comenianae, 19, 129–163.
Moretti M., Alfaro P., Caselles O. & Canas J.A., 1999: Modelling seismites with a digital shaking table. Tectonophysics, 304, 369–383.
Mulder T. & Alexander J., 2001: The physical character of subaqueous sedimentary density f lows and their deposits. Sedimentology, 48, 269–299.
Mutti E., 1992: Turbidite sandstones. AGIP, Istituto di Geologia, Universita di Parma, 275 p.
Mutti E. & Normark W.R., 1987: Comparing examples of modern and an-cient turbidite systems: Problems and Concepts. In: Legget J.K. & Zuffa G.G. (Eds.): Marine Clastic Sedimentology: Concepts and Case Studies. Graham and Trotman, pp. 1–38.
Mutti E. & Ricci Lucchi F., 1972: Le torbiditi dell´Appennine settentrionale: introduzione allánalisi di facies. Memorie Societa Geologica Italiana, 11, 161–199.
Mutti E., Nilsen T.H. & Ricci Lucchi F., 1978: Outer fan depositional lobes of the Laga Formation (upper Miocene and lower Pliocene), east-central Italy. In: Stanley D.J. & Kelling G. (Eds.): Sedimentation in Submarine Canyons, Fans, and Trenches. Dowden, Hutchinson and Ross, Strouds-burg, pp. 210–223.
Mutti E., Tinterri R., Benevelli G., Di Biase D. & Cavanna G., 2003: Deltaic, mixed and turbidite sedimentation of ancient foreland basins. Marine and Petroleum Geology, 20, 733–755.
Nelson C.H. & Nilsen T.H., 1984: Modern and Ancient deep-sea fan sedi-mentation. SEPM Short Course Notes, 14, SEPM Society for Sedimentary Geology, Tulsa, Oklahoma, 410 p.
Neuwerth R., Suter F., Guzman C.A. & Gorin G.E., 2006: Soft-sediment deformation in a tectonically active area: The Plio-Pleistocene Zarzal Formation in the Cauca Valley (Western Colombia). Sedimentary Geology, 186, 67–88.
Olszewska B.W. & Wieczorek J., 1998: The Paleogene of the Podhale Basin (Polish Inner Carpathians) – micropaleontological perspective. Przeglad Geologiczny, 46, 721–728.
statistical analysis as a tool for identification of depositional palaeoenvironments in deep-sea fans...
162
Owen G., 1996: Experimental soft-sediment deformation: structures formed by the liquefaction of unconsolidated sands and some ancient examples. Sedimentology, 43, 279–293.
Pickering K.T., Hiscott R.N. & Hein F.J., 1989: Deep marine environments. Harper-Collins, London, 424 p.
Piper D.J.W., 1978: Turbidite muds and silts on deep-sea fans and abyssal plains. In: Stanley D.J., Kelling G., (Eds.): Sedimentation in submarine Canyons, Fans and Trenches. Dowden, Hutchinson and Ross, Strouds-burg, pp. 163–176.
Plašienka D. & Soták J., 2015: Evolution of Late Cretaceous–Palaeogene sy-norogenic basins in the Pieniny Klippen Belt and adjacent zones (Western Carpathians, Slovakia): tectonic controls over a growing orogenic wedge. Annales Societatis Geologorum Poloniae, 85, 43–76.
Prélat A. & Hodgson D.M., 2013: The full range of turbidite bed thickness patterns in submarine lobes: controls and implications. Journal of the Ge-ological Society, 170, 209–214.
Prélat A., Hodgson D.M. & Flint S.S., 2009: Evolution, architecture and hierarchy of distributary deep-water deposits: a high-resolution outcrop investigation from the Permian Karoo Basin, South Africa. Sedimentology, 56, 2132–2154.
R Core Team, 2014: R: A language and environment for statistical computing. R Foundation for Statistical Computing, Vienna, Austria. URL http://www.r-project.org/.
Ricci Lucchi F., 1975: Depositional cycles in two turbidite formations of northern Apennines (Italy). Journal of Sedimentary Petrology, 45, 3–43.
Rossetti D.F., 1999: Soft-sediment deformation structures in late Albian to Cenomanian deposits, Sao Luis Basin, northern Brazil: evidence for palaeoseismicity. Sedimentology, 46, 1065–1081.
Samuel O. & Fusán O., 1992: Reconstruction of subsidence and sedimentation of Central Carpathian Paleogene. Západné Karpaty, Séria Geológia, 16, 7–46. [in Slovak with English summary]
Sliva Ľ., 2005: Sedimentárne fácie centrálnokarpatskej paleogénnej panvy v oblasti Spišskej Magury [Sedimentary facies of the Central Carpathian Paleogene Basin in the area of Spišská Magura]. PhD Thesis, Manuscript, Comenius University in Bratislava, 137 p. [in Slovak]
So Y.S., Rhee Ch.W., Choi P.-Y., Kee W.-S., Seo J.Y. & Lee E.-J., 2013: Distal turbidite fan/lobe succession of the Late Paleozoic Taean Formation, western Korea. Geosciences Journal, 17, 1, 9–25.
Soták J., 1998: Sequence stratigraphy approach to the Central Carpathian Paleogene (Eastern Slovakia): eustasy and tectonics as controls of deep-sea fan deposition. Slovak Geological Magazine, 4, 185–190.
Soták J., Pereszlenyi M., Marschalko R., Milička J. & Starek D., 2001: Sedi-mentology and hydrocarbon habitat of the submarine-fan deposits of the Central Carpathian Paleogene Basin (NE Slovakia). Marine and Petroleum Geology, 18, 87–114.
Soták J., Gedl P., Banská M. & Starek D., 2007: New stratigraphic data from the Paleogene formations of the Central Western Carpathians at the Orava
region: Results of integrated micropaleontological study in the Pucov section. Mineralia Slovaca, 39, 89–106. [in Slovak with English summary]
Starek D., 2001: Sedimentology and paleodynamic of Paleogene formations of the Central Western Carpathians in Orava. PhD Thesis, Manuscript, Geological Institute of the Slovak Academy of Sciences, Bratislava, 152 p. [in Slovak with English summary]
Starek D., 2005: Sedimentological analysis of the Paleogene units develop-ment in the Central Western Carpathians. Mineralia Slovaca, 37, 41–46. [in Slovak with English summary]
Starek D., Andreyeva-Grigorovich A. S. & Soták J., 2000: Suprafan deposits of the Biely Potok Formation in the Orava region: Sedimentary facies and nannoplankton distribution. Slovak Geological Magazine, 6, 188–190.
Starek D., Sliva L. & Vojtko R., 2004: The channel-levee sedimentary facies and their synsedimentary deformation: a case study from Huty Formation of the Podtatranská skupina Group (Western Carpathians). Slovak Geological Magazine, 10, 177–182.
Starek D., Soták J., Jablonský J. & Marschalko R., 2013: Large-volume gravity flow deposits in the Central Carpathian Paleogene Basin (Orava region, Slovakia): evidence for hyperpycnal river discharge in deep-sea fans. Ge-ologica Carpathica, 64, 305–326.
Stow D.A.V. & Piper D.J.W., 1984: Fine-grained sediments: Deepwater processes and facies. Geological Society London Special Publications, 15, 659 p.
Stow D.A.V. & Shanmugam G., 1980: Sequence of structures in fine-grained turbidites: Comparision of Recent deep-sea and ancient flysch sediment. Geology, 25, 23–42.
Waldron J.W.F., 1987: A statistical test for significance of thinning- and thic-kening-upwards cycles in turbidites. Sedimentary Geology, 54, 137–146.
Walker R.G., 1967: Turbidite sedimentary structures and their relationship to proximal and distal depositional environments1. Journal of Sedimentary Petrology, 37, 1, 25–43.
Walker R.G., 1984: Turbidites and associated coarse clastic deposits. In: Walker R.G. (Ed.): Facies models, 2nd ed. Geosciences Canada Reprint Series, 1, pp. 171–188.
Watycha L., 1974: Szczegółowa mapa geologiczna Polski 1:50 000, 1048 - Czar-ny Dunajec [Serial geological maps of Poland 1:50 000, sheet 1048 – Czarny Dunajec (M-34-88-D)]. Wydawnictwa Geologiczne (1976). [in Polish]
Westwalewicz-Mogilska E., 1986: A new look on origin of the Podhale Flysch sediments]. Przegląd Geologiczny, 34, 12, 690–698. [in Polish with English summary]
Wieczorek J., 1989: The Hecho model for the Podhale Flysch? Przegląd Ge-ologiczny, 37, 9, 419-422. [in Polish with English Summary]
Zavala C., Arcuri M., Di Meglio M., Gamero Diaz H. & Contreras C., 2011: A genetic facies tract for the analysis of sustained hyperpycnal flow deposits. In: Slatt R.M. & Zavala C. (Eds.): Sediment transfer from shelf to deep water – Revisiting the delivery system. AAPG Studies in Geology, 61, pp. 31–51.
acta geologica slovaca, 9(2), 2017, 149–162