Embed Size (px)
Citation preview

Statistical Benchmarks for Quality Measures
of Mental Health and Substance-Related Care
Grant # R01-HS10303-02S2, Agency for Health Care Research and Quality
Substance Abuse and Mental Health Services Administration
Richard C. Hermann, M.D., M.S.
Jeffrey Chan, B.S. Wai T. Chiu, A.M.
Scott E. Provost, M.M., M.S.W.
For further information contact: Richard C. Hermann, M.D., M.S. Center for Quality Assessment & Improvement in Mental Health [email protected] www.cqaimh.org Tufts-New England Medical Center The Health Institute Division of Clinical Care Research 750 Washington Street, NEMC# 345 Boston, MA 02111 Office: 617-636-2866 Fax: 617-636-8351

Table of Contents
I. EXECUTIVE SUMMARY.................................................................................................. 1
II. INTRODUCTION .............................................................................................................. 2
Terms and Definitions .................................................................................................................. 2
Status of Comparative Data in Mental Health.............................................................................. 3
Objective 1 (Prior Use): Summary of Measure Results from Prior Use ..................................... 3
Objective 2 (Benchmarks): Development of Statistical Benchmarks ......................................... 3
III. OBJECTIVE 1 (PRIOR USE): METHODS .......................................................................... 3
Source of Measures ...................................................................................................................... 3
Data Collection............................................................................................................................. 3
IV. OBJECTIVE 1 (PRIOR USE): RESULTS............................................................................ 3
Table 1. Results from Quality Assessment Activities
in Mental Health and Substance-Related Care ......................................................... 5
V. OBJECTIVE 2 (BENCHMARKS): METHODS ................................................................. 11
Source of Measures .................................................................................................................... 11
Data Source. ............................................................................................................................... 11
Analysis ...................................................................................................................................... 11
VI. OBJECTIVE 2 (BENCHMARKS): RESULTS ................................................................... 12
Table 2. Conformance Rates and Statistical Benchmarks
for Quality Measures of Mental Health & Substance-Related Care ....................................... 13
VII. CONCLUSIONS .............................................................................................................. 14
Prior Results: Strengths and Limitations. ................................................................................... 14
Statistical Benchmarks: Strengths and Limitations .................................................................... 14
Directions for Future Research and Development...................................................................... 15
VIII. REFERENCES ................................................................................................................. 16

Center for Quality Assessment & Improvement in Mental Health 1
I. EXECUTIVE SUMMARY
Healthcare facilities and systems increasingly use quality measures to assess, improve, and oversee quality of care. However, use of measure results to identify problems and opportunities for improvement is limited by a lack of comparative data to interpret measure results. Types of comparative data include standards, means, norms, and benchmarks. For each type of comparative data, this report provides operational definitions, a summary of their strengths and weaknesses, and the status in mental health and substance-related care. We then present mean results from prior use and statistical benchmarks for mental health and substance-related quality measures. Objective 1: Measure Results from Prior Use. Mean results from prior research studies and quality improvement (QI) initiatives are often the only information available to measure users when interpreting their own QI efforts. Comparisons of quality using prior results can provide preliminary guidance, but conclusions should be drawn with caution, because results may reflect unique characteristics of the samples to which they were applied.
Among more than 300 measures from the National Inventory of Mental Health Quality Measures
(www.cqaimh.org), we identified 56 measures with results from prior use. We collected results from searches of the research literature and contacts with measure users from across the country. Overall, 110 results were found for the 56 measures; these are summarized in Table 1. Objective 2: Statistical Benchmarks. In the context of QI, a benchmark describes the results of organizations with the best performance on a quality measure. These organizations may be the source of "best practices", i.e., processes leading to superior results. Benchmarks can be used to establish achievable numeric goals for improvement that reflect excellent care.
We developed statistical benchmarks for 12 quality measures (Table 2). These measures were from a core set selected by a multi-stakeholder panel using a formal consensus process. Benchmarks—operationally defined as performance achieved by the top 10% of providers, adjusted for the number of patients per provider—were calculated using administrative data for Medicaid beneficiaries in six states. The benchmarks for these measures ranged from 60% to 98%. This level of performance was considerably better than the average results for the measures, which ranged from 7% to 64%. These findings suggest that achievable levels of excellence are well below 100% for most measures. Wide variation among benchmarks suggests that “one-size-fits-all” standards (such as the commonly used 90%) are not always appropriate. Conclusions. This report presents mean results and statistical benchmarks for quality measures of mental health and substance-related care. Feedback of individual performance results to clinicians accompanied by statistical benchmarks has been found to motivate improvement, more so than providing individual results without comparative benchmarks. Nonetheless, using benchmarks or mean results from prior use often requires case mix adjustment to provide fair comparisons of performance among providers treating varied patient populations.

Center for Quality Assessment & Improvement in Mental Health 2
II. INTRODUCTION
Performance measurement has been proposed as a means of identifying and addressing quality problems, establishing accountability between payers and providers, informing oversight activities, and selecting plans and providers. Many delivery systems, government agencies, payers, and oversight groups have begun to implement measurement-based quality assessment to encourage improvement of mental healthcare.1, 2 However, limited data are available to facilitate interpretation of measurement results. A common scenario encountered by healthcare facilities is described as follows.
Clinicians at a community mental health center implement a report card of measures to assess the quality of their care. One measure assesses continuity of care following the initiation of antidepressant drug treatment for depression. Specifically, the measure assesses the proportion of patients who complete a 12-week acute phase of treatment. After the data are collected and analyzed, clinicians at the center learn that 55% of their patients completed an acute phase of treatment. How should they interpret this result? Is their performance on the measure good, average, or poor? Perfect performance (100%) on the measure is not a realistic goal. Some patients choose to discontinue antidepressants, and their decision may not reflect poor quality care. Yet research suggests that clinicians can influence medication compliance through a combination of patient education, close follow-up, responding to side effects, and addressing non-response.3 Performance on the measure may thus best be determined through comparisons to other clinicians who treat a similar population. What is an average rate of performance on the measure? How well do the best-performing clinicians do?
Terms and Definitions. Several types of information facilitate interpretation of results of quality assessment and improvement (QA/I) activities, including standards, averages, norms, and benchmarks. Standards are threshold expectations for performance established by individuals or groups. For example, the Veterans Administration (VA) requires primary care clinics to screen patients for depression and has established a performance standard that 87% should be screened.4 Standards are sometimes set uniformly across measures (e.g., performance should exceed 90% for each measure) or may be tailored to individual measures. Standards may be informed by data, but are often established less empirically.
Average results for quality measures may be available from prior research studies and quality
improvement (QI) initiatives. Although limited by the unique characteristics of specific samples, prior results are widely used and can provide a basis for preliminary comparisons. Norms are average results for large, representative population-based samples.
A benchmark describes the results of organizations performing best on a quality measure.5,6 These organizations may be the source of "best practices", i.e., processes leading to superior results. Benchmarks can be used to establish achievable goals for improvement that reflect excellent care. The National Committee for Quality Assurance (NCQA), among other oversight groups, requires health plans and managed care organizations to establish specific, numeric goals for QI activities, using, when available, a "benchmark … taken from the industry best practice or from the best performance within a corporate structure or specific geographical area."7 Kiefe et al. developed a method of deriving statistical benchmarks and have applied it to clinician performance on quality measures in healthcare.8 One randomized controlled trial of a quality improvement intervention in primary care demonstrated that providing clinicians with feedback of individual performance compared with benchmarks resulted in greater improvement than provision of individual performance alone.9
Differences in clinical, demographic, and other patients characteristics unrelated to quality of care can influence comparisons of measurement results (whether means or benchmarks) .10-12 Case mix

Center for Quality Assessment & Improvement in Mental Health 3
adjustment, a statistical process of adjusting for these differences, allows for fairer comparisons. An achievable level of performance on a quality measure in a higher functioning sample with few comorbidities and greater social support may not be obtainable in a sample with greater limitations and fewer resources. Stratification is a simple form of case mix adjustment. Comparisons are made within more homogenous subgroups (or strata), such as patients with a specific primary diagnosis or a common influential comorbidity. Multivariate modeling is a more sophisticated form of case mix adjustment that simultaneously adjusts for numerous patient characteristics. Not all process measures need case mix adjustment—some assess provider behavior only and are not influenced by patient characteristics.13
Status of Comparative Data in Mental Health. There is relatively little data available to facilitate the interpretation of quality measure results in mental health care. The National Inventory of Mental Health Quality Measures, a detailed assessment of more than 300 process measures, found that few were accompanied by comparative information .2, 14 Developers had proposed standards constituting ‘acceptable’ performance for only 16% of measures. Even fewer were distributed with average results from prior samples or norms, and no mental health measures had associated statistical benchmarks. Comparison was further complicated by the presence of case mix adjustment methods in only 17% of measures. Objectives of this Report. This report presents results from quality measurement activities in mental healthcare using two types of data that can be helpful in interpreting results from local activities. Objective 1 (Prior Use): To review and summarize results (means and ranges) for quality measures
drawn from the National Inventory of Mental Health Quality Measures. Data were collected from the research literature and from national and regional quality assessment initiatives.
Objective 2 (Benchmarks): To develop statistical benchmarks for measures for a core set of quality
measures selected through a multi-stakeholder consensus development process. Benchmarks were developed using administrative and pharmacy data from a six-state population of Medicaid beneficiaries treated for mental health or substance-related disorders.
III. OBJECTIVE 1 (PRIOR USE): METHODS Source of Measures. The National Inventory of Mental Health Quality Measures (available at www.cqaimh.org) consists of more than 300 single-item process measures from 50 healthcare organizations. Data Collection. We systematically reviewed the research literature and contacted measure users seeking prior results on the measures. The literature review included Medline, PsychLit, CRISP, and HSRProj databases. Aggregate results from QA/I activities were collected from consumer and clinician organizations, healthcare facilities, delivery systems, managed behavioral healthcare organizations, commercial vendors, payers, employer purchasers, accreditators, and state departments of mental health and substance abuse. IV. OBJECTIVE 1 (PRIOR USE): RESULTS
Our review identified results for 56 measures from the inventory. Table 1 presents these results
along with brief descriptions of the measure, data sources, sample, and settings. All 56 measures (100%) required administrative data. Thirty three (59%) required additional sources of data, including medical records, laboratory data, pharmacy data, occurrence reports, and case management enrollment data. Four measures assessing quality of nursing home care required data from the Center for Medicare and

Center for Quality Assessment & Improvement in Mental Health 4
Medicaid Services' (CMS) Minimum Data Set 2.0.15 To some extent, the 56 measures reflect the breadth and diversity of the mental health system. They span seven domains of quality: treatment (22); access (3); continuity (11); coordination (3); prevention (1); safety (15); and assessment (1). They were developed by a wide range of stakeholders: government agencies (19); researchers (16); clinician organizations (1); accreditors (5); managed behavioral healthcare and managed care organizations (4); employer-purchasers (2) and hospital associations (9). Clinical conditions represented include depression (12), schizophrenia/other psychosis (7), bipolar illness (1), substance-related disorders (2), and dual diagnoses (1), among other conditions.

Table 1. Results from Quality Assessment Activities in Mental Health & Substance-Related Care
Measure Description Data Source* Sample Results
Treatment % of consumers treated for schizophrenia or schizoaffective disorder in close contact with family whose medical record contains evidence that clinic staff met with or spoke to family members during a one-year period.16
AD; MR; PS 224 patients at 2 public mental health clinics
43%16
719 individuals with schizophrenia in two states
62.4%17
353 inpatients hospitalized for schizophrenia
61%18
192 male VA inpatients with schizophrenia
73.6%19
96 male non-VA inpatients with schizophrenia
83.2%19
AD; MR
936 veterans with schizophrenia in 14 facilities (1991-1995)
52%20
% of inpatients with acute-phase schizophrenia who receive a daily dosage of an antipsychotic medication within the recommended dosage range at the time of discharge.17
• Alternate data source AD; PD 34,925 VA patients with schizophrenia 63.6%21 440 outpatients with schizophrenia 29.1%17 274 male VA outpatients with schizophrenia
35.7%19
% of patients with schizophrenia who receive a maintenance dose of antipsychotic medication between 300mg and 600mg CPZ equivalents per day.17
AD; MR
184 male Non-VA outpatients with schizophrenia
33.9%19
Patients from state psychiatric hospitals nationwide (1999)
67.7-74.3%23
Patients from state psychiatric hospitals nationwide (2000)
77.2-84.3%23
Patients from state psychiatric hospitals nationwide (2001)
84.3-87.4%23
Patients from state hospitals in 4 states 53%24 Patients from a community setting in 1 state
26%24
% of patients aged 18 or older on an antipsychotic who receive atypical antipsychotic medications (clozapine, risperidone, quetiapine, olanzapine).22
• Patients with SPMI
• Patients with schizophrenia or
schizoaffective disorders • Patients with schizophrenia
AD; PD
599 patients from 13 VA medical centers
47%25
119 primary care patients with depression
27.9-37.1%26
64 patients with depression 56%28
165 patients from a health plan in Washington receiving prescription from a psychiatrist
49%29
204 patients from a health plan in Washington receiving prescription from a primary care physician
48%29
% of patients newly treated for depression with an antidepressant medication who receive an adequate dosage.26
• Adequate dosage & refills >90 days27,28,29
• Adequate dosage & continuation of
medication for 16-20 weeks post-remission30
AD; MR; PD
865 patients with depression 52%30
* AD=Administrative Data; MR=Medical Record; PD=Pharmacy Data; PS=Patient Survey; LD=Laboratory Data; ED=Enrollment Data; PL=Patient Log (Contact/Appointment); OR=Occurrence Report; MDS 2.0=Minimum Data Set 2.0
Center for Quality Assessment & Improvement in Mental Health 5

Table 1. Results from Quality Assessment Activities in Mental Health & Substance-Related Care (cont.)
Measure Description Data Source* Sample Results
Treatment (continued) Adults with depression from two health plans (1993-1995)
22.7-43.6%34
Members of commercial health plans with depression
58.8%35
4,052 adult patients with depression 18.8%33
Members of California health plans with depression
43%36
Members of commercial health plans with depression
42.2%35
% of individuals started on an antidepressant medication for major depression who remain on the medication for at least 12 weeks.31
• Remain on the medication ≥6 months31
• Refill within 6 weeks32
AD; PD
1,599 primary care patients with depression
40-91.7%32
% of patients with major depressive disorder (moderate, severe or recurrent subtype) who receive an antidepressant medication or ECT.37
AD; MR 406 adult patients with depression 92.3%38
Members of commercial health plans with depression
21.3%35
Members of California health plans with depression
57%36
165 patients from a health plan in Washington receiving prescription from a psychiatrist
57%29
% of patients with depression and treated with antidepressant medication who have at least three follow-up visits during the 12-week acute phase treatment period.31
AD; PD
204 patients from a health plan in Washington receiving prescription from a primary care physician
26%29
Residents from 512 nursing facilities in 2 states
10.7-11%40 MDS 2.0
Residents from nursing facilities nationwide (2000-2001)
15.3-18.5%41
% of nursing home residents who are prescribed antipsychotic medications in the absence of psychotic conditions or severe behavioral symptoms associated with dementia.39
• Alternate data source MR; PD Residents from 8 nursing homes 29.1%42
% of individuals 65 years or older hospitalized with a primary diagnosis of depression who receive a sedating antidepressant medication at discharge.43
AD; MR 2,746 elderly patients hospitalized with depression in 297 acute-care general medical hospitals
43.4%43
63.5%44 57.6%44
% of patients with a primary or secondary diagnosis of bipolar disorder who receive blood level monitoring at least once during a 12-month period.44
AD; LD; PD 718 Medicaid patients with bipolar disorder and treated with:
• Lithium • Valproate • Carbamazepine 57.8%44
* AD=Administrative Data; MR=Medical Record; PD=Pharmacy Data; PS=Patient Survey; LD=Laboratory Data; ED=Enrollment Data; PL=Patient Log (Contact/Appointment); OR=Occurrence Report; MDS 2.0=Minimum Data Set 2.0
Center for Quality Assessment & Improvement in Mental Health 6

Table 1. Results from Quality Assessment Activities in Mental Health & Substance-Related Care (cont.)
Measure Description Data Source* Sample Results
Treatment (continued) Inpatients with a primary psychiatric diagnosis in Massachusetts hospitals
0-18%45
172 VA medical centers (1993-1997) 8.3-9.6%46 >200 private insurance plans nationwide (1993-1995)
4.8-8.8%46
Adults national sample (1999-2000) 5.6-6.3%47
Adolescents national sample (1999-2000)
3.8-6.3%47
State psychiatric hospitals nationwide (1999-2001)
8.1-10.2%23
State hospitals in 16 states .3-13.6%48 172 VA medical centers (1993-1997) 13.1-15.3%46 >200 private insurance plans nationwide (1993-1995)
7.2%-13%46
3,755 adults, Medicaid 11.9-25.1%49 370 adults admitted to a psychiatric inpatient unit
38%50
State hospitals in 16 states 3.1-29.2%48
172 VA medical centers (1993-1997) 33.1-36.9%46
% of patients treated in an inpatient substance abuse or mental health facility who are readmitted for treatment within 7 days of discharge.
• Readmitted within 14 days • Readmitted within 15 days
• Readmitted within 30 days
• Readmitted within 180 days
AD
>200 private insurance plans nationwide (1993-1995)
28.2-28.4%46
Access Enrollees in Kaiser Permanente health plans
.02-5.14%51
25%52 12.8%52 11.9%52
Enrollees in Medicaid managed care plans from 4 states
• MA • IA • CO • WA 7%52
Individuals in 16 states (1998-2000) 1,660-1,72948
% of health plan enrollees who use mental health services over a 1-year period.31
• Use of community-based services per 100,000 population
• Use of state hospital services per 100,000
population
AD
Individuals in 16 states (1998-2000) 71-7448
Assessment % of elderly patients 65 years of age and older admitted to a hospital with a diagnosis of depression who receive an assessment of psychosis.53
AD; MR 2,746 elderly hospitalized with depression in 297 acute-care general medical hospitals
49.9%53
* AD=Administrative Data; MR=Medical Record; PD=Pharmacy Data; PS=Patient Survey; LD=Laboratory Data; ED=Enrollment Data; PL=Patient Log (Contact/Appointment); OR=Occurrence Report; MDS 2.0=Minimum Data Set 2.0
Center for Quality Assessment & Improvement in Mental Health 7

Table 1. Results from Quality Assessment Activities in Mental Health & Substance-Related Care (cont.)
Measure Description Data Source* Sample Results
Continuity 384 HMOs (1999) 47.6%56
Commercial health plans (1998-2000) 44.4-48.2%57
172 VA medical centers (1993-1997) 47.8-56.3%46
>200 private insurance plans nationwide (1993-1995)
59.2-69.2%46
114 VA hospitals nationwide 13-79%58 384 HMOs (1999) 70.1%56 Commercial health plans (1996-2000) 66.9-71.7%57 305,574 Medicare enrollees 52.5%59 172 VA medical centers (1993-1997) 71.7-77.7%46 >200 private insurance plans nationwide (1993-1995)
72.2-77.9%46
12 of 62 reporting areas <5%60
14 of 62 reporting areas >25%60 Massachusetts hospitals 63%61
Massachusetts hospitals 86%61
% of patients discharged with a psychiatric or substance abuse disorder who attend an outpatient visit within 7 calendar days of discharge.
• Within 30 calendar days
• Within 180 calendar days
• Within 14-days following discharge from detoxification treatment.54
• Psychiatric inpatients, aged 18 or under,
who attended at least one outpatient medication visit within 7 days of discharge.55
• Inpatients discharged with a primary psychiatric disorder and a medication prescription who attended at least one outpatient medication visit within 14 business days of discharge.55
• Inpatients with a primary psychiatric diagnosis who attend an ambulatory care visit within 14 calendar days of discharge.55
AD
Massachusetts hospitals 80%61
Inpatients with a primary substance abuse disorder from VA medical centers
3.8-50.2%63 % of inpatients discharged with both psychiatric and substance-related disorders who receive four psychiatric and four substance abuse outpatient visits within 12 months following discharge.62
AD
Inpatients with a primary psychiatric disorder from VA medical centers
4.8-29.4%63
% of adults diagnosed with AOD disorders that receive 2 additional AOD services within 30 days of initiation of care64
AD Adults with AOD disorders from 7 MCOs
48-65%64
% of individuals hospitalized for a primary diagnosis of schizophrenia who average at least one ambulatory visit monthly for 6 months after discharge65,66
AD 139 individuals with schizophrenia in public sector systems
47%66
The average # of two-month periods within the first 6 months of discharge from psychiatric care during which patients attended 2 or more outpatient visits.46
AD Patients from 172 VA medical centers (1993-1997)
1.06-1.1646
* AD=Administrative Data; MR=Medical Record; PD=Pharmacy Data; PS=Patient Survey; LD=Laboratory Data; ED=Enrollment Data; PL=Patient Log (Contact/Appointment); OR=Occurrence Report; MDS 2.0=Minimum Data Set 2.0
Center for Quality Assessment & Improvement in Mental Health 8

Table 1. Results from Quality Assessment Activities in Mental Health & Substance-Related Care (cont.)
Measure Description Data Source* Sample Results
Coordination % of discharged psychiatric inpatients whose chart displays evidence of telephonic or written notification by the inpatient facility to the patient's primary care clinician prior to discharge.67
AD; MR Inpatients with a primary psychiatric diagnosis in Massachusetts hospitals
88%67
% of persons with a serious mental illness and served in the community who are receiving assertive community treatment.22
AD; ED Individuals with SPMI from state hospitals in 16 states
5%48
% of patients with schizophrenia and a low Global Assessment of Functioning (GAF) score who had contact with a case manager in the last three months.16
AD; MR; PS 224 patients with schizophrenia at 2 public mental health clinics
65%16
Prevention Patients from VA medical centers (1999) 62%69 % of patients seen in medical clinics who were
screened for depression during the previous 12-month period.68
AD; MR
Patients from VA medical centers (2001) 81%4
Safety % of patients diagnosed with depression during a clinical evaluation whose medical record includes an assessment of the patient's potential to harm self or others.70
MR 2,746 elderly patients hospitalized with depression in 297 acute-care general medical hospitals
53.5%53
State psychiatric hospitals nationwide (1999-2001)
3.5-4.6%23
Adults national sample (1999-2000) 4.6-7.347 Adolescents national sample (1999-2000)
14.4-18.547
Adults national sample (1999-2000) 2.8-4.247
% of unique clients who were restrained at least once.23
• # of restraint events/patient day47
• # of inpatients restrained/patient day47
AD; MR; OR
Adolescents national sample (1999-2000)
6.5-7.347
4,215 residents in 268 nursing homes 21%71
Residents from nursing facilities nationwide (2000-2001)
8.7-10.3%41
% of nursing home residents who were physically restrained during a specified time period.39
MDS 2.0
512 nursing facilities in 2 states 7.6-8.2%40 State psychiatric hospitals nationwide (1999-2001)
2.7-4.7%23
Adults national sample (1999-2000) 3.8-6.947 Adolescents national sample (1999-2000)
8.8-15.747
Adults national sample (1999-2000) 3.0-3.947
% of unique clients who were secluded at least once. 23
• # of seclusion events/patient day47
• # of inpatients secluded/patient day 47
AD; MR; OR
Adolescents national sample (1999-2000)
4.1-5.947
Adults national sample .2847 The average # of physical assault events per 1000 patient days in an adult inpatient facility during a 3-month period 47
• Average # of days per 1000 patient days
with a physical assault event47
AD; MR; OR
Adults national sample (2nd quarter 1999)
.4147
Adults national sample (1999-2000) 24.8-30.147 % of inpatients that have an "unplanned" discharge from a psychiatric unit including elopements, AMA's and failures to return from authorized leaves 47
AD; MR
Adolescents national sample (1999-2000)
10.7-18.747
* AD=Administrative Data; MR=Medical Record; PD=Pharmacy Data; PS=Patient Survey; LD=Laboratory Data; ED=Enrollment Data; PL=Patient Log (Contact/Appointment); OR=Occurrence Report; MDS 2.0=Minimum Data Set 2.0
Center for Quality Assessment & Improvement in Mental Health 9

Table 1. Results from Quality Assessment Activities in Mental Health & Substance-Related Care (cont.)
Measure Description Data Source* Sample Results
Safety (continued) MDS 2.0 512 nursing facilities in 2 states 14.7-17.2%40
State psychiatric hospitals nationwide (1999-2001)
.32-.6923
Adults national sample (1999-2000) .28-.35 47
AD; MR; OR
Adolescents national sample (1999-2000)
.52-.9547
512 nursing facilities in 2 states 14.5-15.3%40
% of residents with an injury at a point in time • # of client injury events that occurred for
every 1000 inpatient days23 • Average # of self-injury events per
patient day in an inpatient facility during a 3-month period47
• % of residents with a fall40 MDS 2.0 Residents from nursing facilities nationwide (2000-2001)
13.3-15.7%41
* AD=Administrative Data; MR=Medical Record; PD=Pharmacy Data; PS=Patient Survey; LD=Laboratory Data; ED=Enrollment Data; PL=Patient Log (Contact/Appointment); OR=Occurrence Report; MDS 2.0=Minimum Data Set 2.0
Center for Quality Assessment & Improvement in Mental Health 10

V. OBJECTIVE 2 (BENCHMARKS): METHODS Source of Measures. Quality measures for benchmark development were selected from a core set of 28 process measures developed by a multi-stakeholder panel using a formal consensus process.13, 72 Core measure selection was guided by stakeholder judgment, empirical data, and a conceptual framework aimed at achieving balance among competing priorities: meaningfulness, feasibility, actionability, and representativeness. 10 of the 28 measures could be constructed from administrative data. 2 measures were split to distinguish between individuals with mental health disorders and individuals with substance-related disorders, resulting in 12 measures for analysis. Table 2 summarizes measure specifications, including modifications from developer specifications where necessary to derive the measure from administrative data. Specifications for these measures have been described in more detail elsewhere.72 Data Source. Measure conformance rates and statistical benchmarks were calculated for Medicaid beneficiaries in six states—California, Georgia, Indiana, Mississippi, Missouri, and Pennsylvania—using CMS's 1994-95 State Medicaid Research Files of enrollment, utilization, and pharmacy data. We excluded those individuals who were dually enrolled in Medicaid and Medicare, enrolled in a Medicaid HMO, or institutionalized in a long term care facility, because administrative data were missing or incomplete for these populations. The total eligible sample consisted of 11,684,089 individuals, from California (7,266,403), Georgia (1,256,428), Indiana (657,426), Mississippi (510,912), Missouri (735,948), and Pennsylvania (1,256,972). Medicaid provider identification numbers, which can reflect either individual or co-practicing clinicians, were used to aggregate performance results at the provider level. Analysis. We applied the methodology developed by Kiefe et al.8 to calculate statistical benchmarks, defined as the performance achieved by the top 10% of providers adjusted for the number of patients per provider. This approach has several strengths: it is objective and reproducible, was specially developed for use with process measures, and employs two methods to account for small samples of patients. The “small denominator” problem is significant in the context of benchmarking because providers with small numbers of cases can skew results toward high (e.g., 1/1 = 100%) or low (e.g., 0/1 = 0%) ends of the distribution. The benchmarking method adjusts for small denominators in two ways. First, a Bayesian estimator approach is used to adjust each provider’s rate based on his or her sample size. Second, a pared mean approach is used to pool results from the top 10% of the sample. Both of these steps reduce the disproportionate impact of small-denominator cases without eliminating them from the sample. The specific steps we used to calculate the benchmark for a given measure are as follows5:
1. We calculated a Bayesian Adjusted Performance Fraction (APF) for each provider: APF=(x+1)/(d+2), where x equals the actual number of patients or subjects described in the measure numerator criteria, and d equals the total number of patients for whom the process is appropriate.
2. We ranked the providers in descending order based on the APF.
3. Beginning with the highest ranked provider we summed the number of patients in the measure denominator
in descending order until reaching a breakpoint of 10% of patients. We then added additionally the total number of patients below the breakpoint who are part of the caseload of a provider whose conformance rate is tied with the breakpoint provider.
4. For the subset of providers identified in step 3, we summed the total number of patients meeting the
measure numerator criteria.
5. We calculated the benchmark by dividing the total number of patients in the subset that met the measure criteria by the total number of patients in the subset.
Center for Quality Assessment & Improvement in Mental Health 11

VI. OBJECTIVE 2 (BENCHMARKS): RESULTS
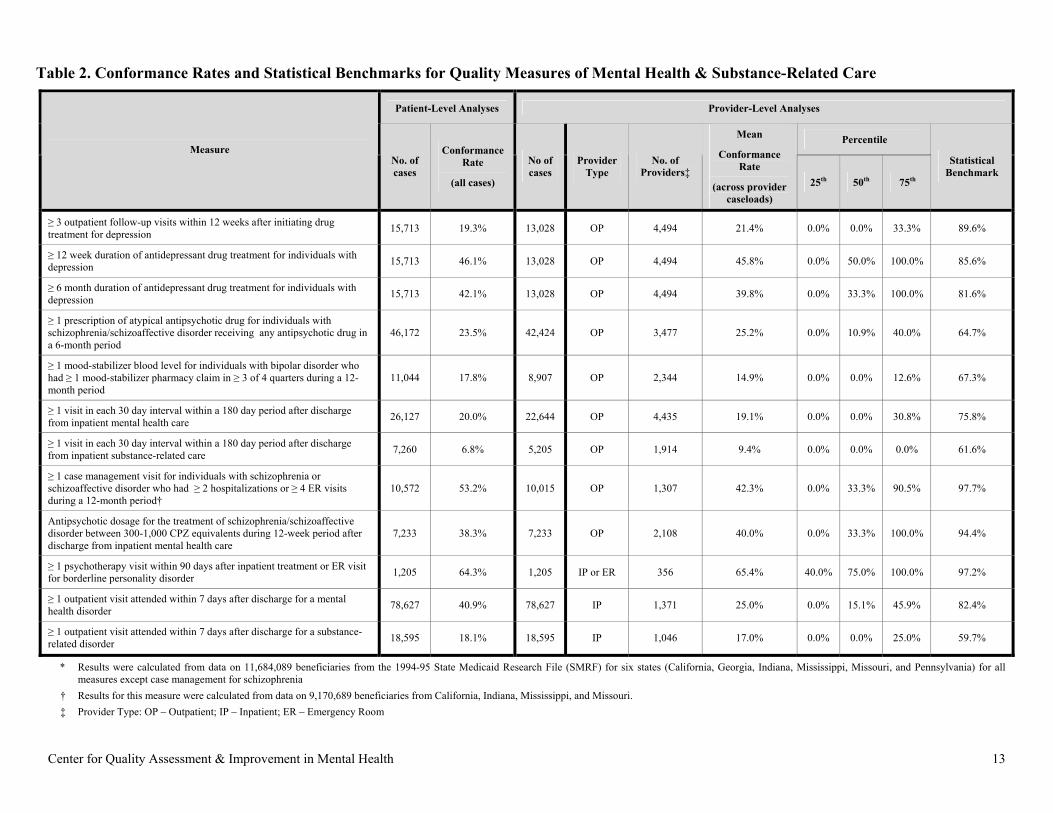
Table 2 presents results from patient-level, provider-level, and benchmark analyses. Patient-level data includes the sample size and conformance rate for each measure. Provider-level information includes the number and types of providers, the average conformance rate, and results for providers at 25th, 50th, and 75th percentile. The final column presents statistical-benchmarks (i.e., the performance achieved by the top 10% of providers, adjusted for the number of patients per provider).
These results provide a picture of the quality of care delivered to a multi-state population of
Medicaid beneficiaries across a variety of conditions, domains of quality, and treatments. Mean patient-level results show that conformance rates vary widely, from a low of 7% for a measure of the continuity of substance-related care to a high of 64% for psychotherapy for borderline personality disorder following an acute crisis. Mean provider-level results vary similarly between 9% and 65%. These generally low conformance rates suggest ample opportunities for improvement. While average results could not provide information about whether significantly better results were achievable, the statistical benchmarks show that the top 10% of providers were able to achieve a substantially higher level of performance, ranging from 60% to 98%. The finding that benchmarks vary among measures suggests that "one-size-fits-all" standards of 90% or another threshold are not always appropriate or obtainable.
Center for Quality Assessment & Improvement in Mental Health 12
Center for Quality Assessment & Improvement in Mental Health 13
Table 2. Conformance Rates and Statistical Benchmarks for Quality Measures of Mental Health & Substance-Related Care
Patient-Level Analyses Provider-Level Analyses
Percentile Measure
No. of cases
Conformance Rate
(all cases)
No of cases
Provider Type
No. of Providers‡
Mean
Conformance Rate
(across provider caseloads)
25th 50th 75th
Statistical Benchmark
≥ 3 outpatient follow-up visits within 12 weeks after initiating drug treatment for depression 15,713 19.3% 13,028 OP 4,494 21.4% 0.0% 0.0% 33.3% 89.6%
≥ 12 week duration of antidepressant drug treatment for individuals with depression 15,713 46.1% 13,028 OP 4,494 45.8% 0.0% 50.0% 100.0% 85.6%
≥ 6 month duration of antidepressant drug treatment for individuals with depression 15,713 42.1% 13,028 OP 4,494 39.8% 0.0% 33.3% 100.0% 81.6%
≥ 1 prescription of atypical antipsychotic drug for individuals with schizophrenia/schizoaffective disorder receiving any antipsychotic drug in a 6-month period
46,172 23.5% 42,424 OP 3,477 25.2% 0.0% 10.9% 40.0% 64.7%
≥ 1 mood-stabilizer blood level for individuals with bipolar disorder who had ≥ 1 mood-stabilizer pharmacy claim in ≥ 3 of 4 quarters during a 12-month period
11,044 17.8% 8,907 OP 2,344 14.9% 0.0% 0.0% 12.6% 67.3%
≥ 1 visit in each 30 day interval within a 180 day period after discharge from inpatient mental health care 26,127 20.0% 22,644 OP 4,435 19.1% 0.0% 0.0% 30.8% 75.8%
≥ 1 visit in each 30 day interval within a 180 day period after discharge from inpatient substance-related care 7,260 6.8% 5,205 OP 1,914 9.4% 0.0% 0.0% 0.0% 61.6%
≥ 1 case management visit for individuals with schizophrenia or schizoaffective disorder who had ≥ 2 hospitalizations or ≥ 4 ER visits during a 12-month period†
10,572 53.2% 10,015 OP 1,307 42.3% 0.0% 33.3% 90.5% 97.7%
Antipsychotic dosage for the treatment of schizophrenia/schizoaffective disorder between 300-1,000 CPZ equivalents during 12-week period after discharge from inpatient mental health care
7,233 38.3% 7,233 OP 2,108 40.0% 0.0% 33.3% 100.0% 94.4%
≥ 1 psychotherapy visit within 90 days after inpatient treatment or ER visit for borderline personality disorder 1,205 64.3% 1,205 IP or ER 356 65.4% 40.0% 75.0% 100.0% 97.2%
≥ 1 outpatient visit attended within 7 days after discharge for a mental health disorder 78,627 40.9% 78,627 IP 1,371 25.0% 0.0% 15.1% 45.9% 82.4%
≥ 1 outpatient visit attended within 7 days after discharge for a substance-related disorder 18,595 18.1% 18,595 IP 1,046 17.0% 0.0% 0.0% 25.0% 59.7%
* Results were calculated from data on 11,684,089 beneficiaries from the 1994-95 State Medicaid Research File (SMRF) for six states (California, Georgia, Indiana, Mississippi, Missouri, and Pennsylvania) for all measures except case management for schizophrenia
† Results for this measure were calculated from data on 9,170,689 beneficiaries from California, Indiana, Mississippi, and Missouri. ‡ Provider Type: OP – Outpatient; IP – Inpatient; ER – Emergency Room

VII. CONCLUSIONS Prior Results: Strengths and Limitations. Results from the prior application of quality measures—e.g., in research studies and QA/I initiatives—are often the only information available to measure users when interpreting their own results. Comparison with prior results can provide preliminary guidance, but conclusions should be drawn with caution. Characteristics of patients in prior samples may differ from those found locally, and measure results may reflect these differences rather than differences in quality. Often detailed information on the characteristics of patients comprising the sample is not available. The example presented previously of the community mental health center illustrates use of prior results:
The community mental health center determined that 55% of their patients completed the acute phase of antidepressant treatment. The next step for the center’s clinicians and managers was to determine whether this result represented high quality care or, alternatively, presented an opportunity for quality improvement. Learning that average results for the measure ranged from 19 to 59% in several large samples (Table 1), they preliminarily concluded that their performance was satisfactory.
Statistical Benchmarks: Strengths and Limitations. Statistical benchmarks have several advantages relative to other comparative data. While some standards are established arbitrarily, benchmarks are derived empirically from data and clinical practice. In contrast to norms and averages, benchmarks can set improvement goals reflecting excellent levels of care. Research suggests that providing clinicians with individual results in comparison to benchmarks can motivate better performance.9 The methodology we applied provides a degree of objectivity, reproducibility, and transparency. In the case of the community mental health center, benchmarks can add additional information for interpreting results:
While average results from prior studies placed the center at the high end of the range for the measure, a statistical benchmark suggested a different interpretation. The benchmark of 86% on the acute-phase depression measure exceeded the center’s performance rate of 55%. After reviewing these results, the center staff concluded that further improvement was feasible. Benchmarking in its current state also has limitations, however. For reasons discussed earlier,
benchmarks often need case mix adjustment for comparisons to be meaningful and fair. For example the simple stratification performed on the 180-day continuity of care measure in Table 2 yielded considerably different benchmarks: 62% for individuals with substance-use disorders vs. 76% for individuals with mental disorders. This difference may reflect differences among systems of care, but may also reflect an association between diagnostic group and the individual's preferences and capacity to adhere to treatment recommendations. While case-mix adjustment for mental health and substance-related care is at an early stage of development, models have been developed for a number of processes and outcomes of care.11, 12
In order to calculate provider-level results, we assigned cases to individual providers based on the
specifications of each measure. For example, the measure assessing 7-day ambulatory follow-up rates after hospital discharge assigned cases to the inpatient provider, who typically schedules outpatient visits and may provide written appointment reminders, make follow-up calls, and educate patients upon discharge to encourage attendance at outpatient visits. In practice, however, continuity of care is a product of collaboration among patients and inpatient and outpatient providers, along with others making up a patient’s network of formal and informal support. Improving inpatient practices can contribute to better performance, but is unlikely to be the only determinant of the measure result.
To our knowledge, this method of statistical benchmarking has not previously been applied to
Medicaid claims data or to measures of mental health care. The frequency distributions and statistical
Center for Quality Assessment & Improvement in Mental Health 14

properties of the resulting benchmarks are quite similar to those derived from medical record data and to measures of cardiovascular and diabetes care, suggesting convergent validity of the results.
The method we used to derive benchmarks diminishes the tendency of small sample sizes to skew
results. Nonetheless, applying this method to large administrative datasets yields a substantial number of clinicians who treat few patients. To examine their influence, we repeated the benchmark analyses excluding clinicians with less than five patients. This adjustment yielded essentially the same results. Another limitation is that the Medicaid data are several years old and clinical practice may have changed during the intervening period. Interestingly, despite national attention on quality improvement, measure results in Table 1 did not generally show trends toward improvement over time. An exception is an increased use of atypical antipsychotic drugs, which may reflect the introduction and uptake of a new product.
Directions for Future Research and Development. The infrastructure of quality measurement—specifications, norms, benchmarks, case mix adjustment, and adequately vetted and tested measures—is only just beginning to become available for routine QI in mental healthcare. There are a number of initiatives underway to provide greater standardization among data elements and measure specifications, which would allow for more meaningful comparisons among clinical sites. Multivariate models for case mix adjustment are needed to compare performance on outcomes as well as on many process measures.
Quantitative analysis is only one step in the process of learning from benchmarks. After best-performing providers are identified, the next question is how do they obtain these results. Methods for learning "best practices" from these provides are varied, ranging from formal qualitative study to informal site visits and consultations.
An additional area for investigation is the capacity for clinician feedback with benchmarks to
motivate better performance. The active ingredients of this motivation are not well studied, but presumably, threshold levels of buy-in among providers are needed for feedback to influence behavior. We know that clinician acceptance of quality measures is influenced by the importance of the clinical process or outcome assessed, measure reliability and validity, data integrity, and the adequacy of statistical adjustment.13, 72 These associations suggest that the potential of benchmarking will be realized in conjunction with the ongoing maturation of the broader infrastructure for quality measurement.
Center for Quality Assessment & Improvement in Mental Health 15

VIII. REFERENCES 1. Hermann R, Regner J, Yang D, Erickson P. Developing a quality management system for
behavioral healthcare: the Cambridge Health Alliance experience. Harvard Review of Psychiatry. 2000;8(5):251-260.
2. Hermann R, Leff H, Palmer R, et al. Quality measures for mental health care: results from a national inventory. Medical Care Research and Review. 2000;57(suppl 2):135-153.
3. Chen A. Noncompliance in community psychiatry: a review of clinical interventions. Hospital and Community Psychiatry. Mar 1991;42(3):282-287.
4. VHA Office of Quality and Performance. FY2002 VHA Performance Measurement System, Technical Manual November 8, 2001 (Updated March 8, 2002). 2002.
5. Weissman N, Allison J, Kiefe C, et al. Achievable benchmarks of care: the ABCs of benchmarking. Journal of Evaluation in Clinical Practice. 1999;5(3):269-281.
6. Chan YC, DeGroote MG, Ho SJ. Continuous quality improvement: A survey of American and Canadian Healthcare Executives. Hospital and Health Services Administration. Winter 1997;42(4):525-543.
7. National Committee for Quality Assurance. Standards and guidelines for the accreditation of MBHOs: Effective July 1, 2003. Washington, DC: National Committee for Quality Assurance; 2002.
8. Kiefe C, Weissman N, Allison J, Farmer R, Weaver M, Williams O. Identifying achievable benchmarks of care: concepts and methodology. International Journal for Quality in Health Care. 1998;10(5):443-447.
9. Kiefe C, Allison J, Williams O, Person S, Weaver W, Weissman N. Improving quality improvement using achievable benchmarks for physician feedback: a randomized controlled trial. Journal of the American Medical Association. 2001;285(22):2871-2879.
10. Ettner S, Frank R, McGuire T, Hermann R. Risk adjustment alternatives in paying for behavioral health care under Medicaid. Health Services Research. 2001;36(4):793-811.
11. Hermann R, Rollins C. Risk Adjusting Outcomes for Mental Health and Substance-Related Care: A Review of the Literature. Under review.
12. Hermann R. Risk Adjustment for Mental Health Care. In: Iezzoni L, ed. Risk Adjustment for Measuring Health Care Outcomes. 3rd ed. Ann Arbor: Health Administration Press; In press.
13. Hermann R, Palmer R. Common ground: a framework for selecting core quality measures. Psychiatric Services. 2002;53(3).
14. Hermann R, Finnerty M, Provost S, et al. Process measures for the assessment and improvement of quality of care for schizophrenia. Schizophrenia Bulletin. 2002;28(1):95-104.
15. Centers for Medicare and Medicaid Services. Minimum Data Set (MDS) Version2.0: For Nursing Home Resident Assessment and Care Screenings; 2000:23.
16. Young A, Sullivan G, Burnam A, Brook R. Measuring the quality of outpatient treatment for schizophrenia. Archives of General Psychiatry. 1998;55(7):611-617.
17. Lehman A, Steinwachs D. Patterns of usual care for schizophrenia: Initial results from the schizophrenia patient outcomes research team (PORT) client survey. Schizophrenia Bulletin. 1998;24(1):11-20.
18. Chen R, Nadkarni P, Levin F, Miller P, Erdos J, Rosenheck R. Using a computer database to monitor compliance with pharmacologic guidelines for schizophrenia. Psychiatric Services. 2000;51(6):791-794.
19. Rosenheck R, Desai R, Steinwachs D, Lehman A. Benchmarking Treatment of Schizophrenia- A comparison of Service Delivery by the National Government and by State and Local Providers. The Journal of Nervous & Mental Disease. 2000;188(4):209-216.
20. Valenstein M, Copeland L, Owen R, Blow F, Visnic S. Delays in adopting evidence-based dosages of conventional antipsychotics. Psychiatric Services. 2001;52(9):1242-1244.
Center for Quality Assessment & Improvement in Mental Health 16

21. Leslie D, Rosenheck R. Use of pharmacy data to assess quality of pharmacotherapy for schizophrenia in a national health care system: individual and facility predictors. Medical Care. 2001;39:923-933.
22. National Association of State Mental Health Program Directors. Performance measures for mental health systems: a standardized framework. Alexandria, VA: National Association of State Mental Health Program Directors; December 4 1998.
23. NASMHPD RI. National Public Rates. NRI Performance Measurement System Project Office- Mental Health Research and Data Management Center. Available at: www.rdmc.org/nripms. Accessed June 15, 2002, 2002.
24. U.S. Department of Health and Human Services and Substance Abuse and Mental Health Services Administration. The Five-State Feasibility Study: Implementing Performance Measures Across State Mental Health Systems, Mental Health, United States 1998.
25. Owen R, Feng W, Thrush C, Hudson J, Austen M. Variations in Prescribing Practices for Novel Antipsychotic Medications Among Veterans Affairs Hospitals. Psychiatric Services. 2001;52(11):1523-1530.
26. Katon W, von Korff M, Lin E, Bush T, Ormel J. Adequacy and duration of antidepressant treatment in primary care. Medical Care. 1992;30(1):67-76.
27. Agency for Health Care Policy and Research. Depression in primary care. Depression Guideline Panel: Volume 2. Treatment of major depression. Washington, D.C.: US Department of Health and Human Services; 1993.
28. Simon G, VonKorff M. Recognition, management, and outcomes of depression in primary care. Archives of Family Medicine. 1995;4:99-105.
29. Simon G, Von Korff M, Rutter C, Peterson D. Treatment Process and Outcomes for Managed Care Patients Receiving New Antidepressant Prescriptions From Psychiatrists and Primary Care Physicians. Archives of General Psychiatry. 2001;58(4):395-401.
30. Katzelnick D, Koback K, Greist J, Jefferson J, Henck H, et al. Prescribing patterns of antidepressant medications for depression in an HMO. Formulary. 1996;31:374-388.
31. National Committee for Quality Assurance. Health Plan Data and Information Set (HEDIS 2000). Washington, D.C.: National Committee for Quality Assurance; 1999.
32. Katon W, Ruter C, Lin E, et al. Are there detectable differences in quality of care or outcome of depression across primary care providers? Medical Care. 2000;38(6):552-561.
33. Melfi C, Chawla A, Croghan T, Hanna M, Kennedy S, Sredl K. The effects of adherence to antidepressant treatment guidelines on relapse and recurrence of depression. Archives of General Psychiatry. 1998;55:1128-1132.
34. Kerr E, McGlynn E, Van Vorst K, Wickstrom S. Measuring antidepressant prescribing practice in a health care system using administrative data: implications for quality measurement and improvement. Joint Commission Journal on Quality Improvement. 2000;26(4):203-216.
35. NCQA. NCQA Quality Compass 1999. 36. CalPERS Health Plan. Health Plan Quality Results. Blue Shield, Kaiser, Pacificare (90210
zipcode). Available at: http://www.calpers.ca.gov/open-enrollment/plancompare/. Accessed November 11, 2001.
37. American Psychiatric Association Office of Quality Improvement. APA Practice Guideline Measures. American Psychiatric Association, 2001.
38. West J, Leaf P, Zarin D. Health plan characteristics and conformance with key practice guideline psychopharmacologic treatment for depression. Mental Health Services Research. 2000;2(4).
39. Zimmerman D, Sarita K, Arling G, et al. Development and testing of nursing home quality indicators. Health Care Financing Review. 1995;16(4):107-127.
40. Karon S, Sainfort F, Zimmerman D. Stability of Nursing Home Quality Indicators Over Time. Medical Care. 1999;37(6):570-579.
41. Health Care Financing Administration (HCFA). MDS Quality Indicator Report. HCFA [Website]. Available at: http://www.hcfa.gov/projects/mdsreports/qi/qi_start.asp. Accessed June 24, 2002.
Center for Quality Assessment & Improvement in Mental Health 17

42. Llorente MD OE, Leyva O, Silverman MA, Lewis JE, Rivero. Use of antipsychotic drugs in nursing homes: current compliance with OBRA regulations. Journal of the American Geriatrics Society. 1998;46(2):198-201.
43. Wells K, Norquist G, Benjamin B, Rogers W, Kahn K, Brook R. Quality of antidepressant medications prescribed at discharge to depressed elderly patients in general medical hospitals before and after prospective payment system. General Hospital Psychiatry. 1994;16:4-15.
44. Marcus S, Olfson M, Pincus H, Zarin D, Kupfer D. Therapeutic drug monitoring of mood stabilizers in Medicaid patients with bipolar disorder. American Journal of Psychiatry. 1999;156(7):1014-1018.
45. Network Health of Massachusetts. Network Health Behavioral Health Quarterly Quality Management Results July 5 2000.
46. Leslie D, Rosenheck R. Comparing quality of mental health care for public-sector and privately insured populations. Psychiatric Services. 2000;51(5):650-655.
47. Maryland Hospital Association. Quality Indicator Project Implementation Manual. Elkridge, MD 1997.
48. Mental Health Statistics Improvement Program Group. Consumer-Oriented Report Card 1998. 49. Huff ED. Outpatient utilization patterns and quality outcomes after first acute episode of mental
health hospitalization: Is some better than none, and is more service associated with better outcomes? Evaluation & the Health Professions. 2000;23(4):441-456.
50. Moran P, et al. Rehospitalization of Psychiatric Patients in a Managed Care Environment. Mental Health Services Research. 2000;2(4):191-199.
51. Kaiser Permanente. Making an informed choice with HEDIS 1999 Performance Measures, Program Overview 1999.
52. United States General Accounting Office. Medicaid Managed Care: Four States' Experiences with Mental Health Carveout Programs. Washington, DC 1999. GAO/HEHS-99-118.
53. Wells K, Rogers W, Davis L, et al. Quality of care for hospitalized depressed elderly patients before and after the implementation of Medicare prospective payment system. American Journal of Psychiatry. 1993;150:1799-1805.
54. Washington Circle Group. Improving Performance Measurement by Managed Care Plans for Substance Abuse: Year 1 Report of the Washington Circle Group. Rockville, MD: Washington Circle Group; March 16 1999.
55. MBHP. Massachusetts Behavioral Health Partnership FY99 Performance Standards. Dec. 9, 1998 1999.
56. Druss BG MC, Rosenheck RA, Shih SC, Bost JE. Mental Health Care Quality Under Managed Care in the United States: A View from the Health Employer Data and Information Set (HEDIS). American Journal of Psychiatry. 2002;159(5):860-862.
57. National Committee for Quality Assurance. The State of Managed Care Quality. Washington D.C. 2001.
58. Druss B, Rosenheck R. Evaluation of the HEDIS measure of behavioral health care quality. Psychiatric Services. 1997;48(1):71-75.
59. Schneider E, Zaslavsky A, Epstein A. Racial Disparities in the Quality of Care for Enrollees in Medicare Managed Care. Journal of the American Medical Association. 2002;287(10):1288-1294.
60. Institute of Medicine. Treating drug problems: A study of the evolution, effectiveness, and financing of public and private drug treatment systems. Vol 1. Washington DC: National Academy Press; 1990.
61. Massachusetts Division of Medical Assistance. FY'99 Performance Standards. Boston, MA: Massachusetts Behavioral Health Partnership; 1999.
62. Rosenheck R, Cichetti D. A mental health program performance monitoring system for the Department of Veterans Affairs. West Haven, CT: Northeast Program Evaluation Center; September 24 1995.
Center for Quality Assessment & Improvement in Mental Health 18

Center for Quality Assessment & Improvement in Mental Health 19
63. Department of Veteran Affairs. Mental Health Program Performance Monitoring System 1995. 64. Garnick D, Lee M, Chalk M, et al. Establishing the Feasibility of Performance Measures for
Alcohol and Other Drugs. Journal of Substance Abuse Treatment. 2002;23:375-385. 65. Center for Outcomes Research and Effectiveness University of Arkansas for Medical Sciences.
NetOutcomes Performance Indicators. Little Rock, March 16, 2000. 0522-01. 66. Fischer E, Owen R. Quality of public sector care for schizophrenia in Arkansas. Mental Health
Services Research. 1999;1(4):213-221. 67. Department of Medical Assistance. Massachusetts Behavioral Health Partnership performance
standards, fiscal year 1999. Boston, MA: Massachusetts Department of Medical Assistance; 1999.
68. Veterans Health Administration/Department of Defense. VHA/DOD Performance Measures for the Management of Major Depressive Disorder in Adults, Version 2.0. Washington, DC March 2000.
69. Department of Veterans Affairs- Office of Quality and Performance. 1999. 70. Comprehensive Care. National Quality Council Workplan 2000. 71. Castle N, Mor V. Physical restraints in nursing homes: a review of the literature since the Nursing
Home Reform Act of 1987. Medical Care Research and Review. 1998;55(2):171-176. 72. Hermann R, Palmer R, Leff H, et al. Consensus development on core quality measures for mental
health care. American Journal of Psychiatry. Under review.