Embed Size (px)
Citation preview
GIS Ostrava 2010 24. - 27. 1. 2010, Ostrava
___________________________________________________________________
Statistical estimation of land uplift model parameters for landscape development modeling in ArcGIS environment
Jari, Pohjola1, Jari, Turunen
1, Tarmo, Lipping
1, Ari T.K., Ikonen
2
1Tampere University of Technology, Pori, Pohjoisranta 11, P.O.Box 300
FIN-28101, Pori, FINLAND {jari.pohjola, jari.j.turunen, tarmo.lipping}@tut.fi
2Posiva Oy, Olkiluoto
FIN-27160, Eurajoki, FINLAND [email protected]
Abstract. In this paper we present a new method for improved estimation of the parameters of the land uplift model introduced by Tore Påsse. The land uplift model serves as an input to the UNTAMO toolbox implemented in the ArcGIS environment for predicting the development of the landscape in 10 000 years' time span for safety assessment of disposal of spent nuclear fuel at Olkiluoto site in Finland. The research was carried out as an assignment by Posiva Oy, the company responsible for the repository program. The UNTAMO toolbox contains tools for predicting various aspects of landscape development such as the location and size of water bodies, the potential for agricultural and settlement as well as the amount and type of vegetation biomass. The ongoing land uplift in the Baltic Sea region is due to the rebound of glacial stress caused by the most recent ice age 115 000-10 000 years before present (BP). The rebound is known to contain two phases: the fast and the slow uplift. The fast uplift took place about at the melt of the glacier but the slow uplift is still in progress. The improved methodology for the land uplift model parameter estimation presented in this study is based on regional variations in bedrock properties and download. The parameters were computed using ancient shore level positions and their
14C
radiocarbon dating. Because of the uncertainties and inaccuracies in the dating and the shore level estimations, Monte Carlo simulation was employed for the estimation of the parameter distributions. By considering the land uplift model in statistical framework we can provide confidence limits also for the landscape development analysis performed using the UNTAMO toolbox and thus study the sensitivity of the predicted landscape features to the uncertainties of the land uplift estimation.
Keywords: land uplift, shore level curves, Monte Carlo simulation
1 Introduction
This paper was motivated by the need of Posiva Oy, a Finnish company responsible for the spent nuclear fuel repository program. The study concentrates on Olkiluoto area (see Fig. 1) - the site selected and politically approved disposal of spent nuclear fuel produced in the first five nuclear power plants in Finland.
Fig. 1. The location of Olkiluoto in Finland. The yellow square indicates the approximate location of the future repository of spent nuclear fuel.

GIS Ostrava 2010 24. - 27. 1. 2010, Ostrava
___________________________________________________________________ The effects of the most recent ice age 115 000-10 000 years before present (BP) are clearly visible in Fennoscandia: the land is still rising due to glacio-isostatic uplift, or glacial rebound, with estimated annual rates shown in Fig. 2.
Fig. 2. Absolute annual land uplift in millimeters in Scandinavia.
Reliable estimates of the land uplift are essential in assessing the long-term safety over millennia of the spent nuclear fuel disposal as the hydrological conditions in the bedrock are affected not to mention the potential pathways of humans and other biota to be exposed to possible releases of radioactivity. There are several physical models available for land uplift estimation like, for example, those presented in [2], [4], [7] and [9], but some of the parameters of these models are very difficult to obtain and the meaning of the parameters also differs between the models. The approach proposed by Tore Påsse in [11] uses a different point of view. In this model the unknown parameters can be estimated from fairly well known data describing the coastline displacement. Swedish Nuclear Fuel and Waste Management Company and Posiva Oy have accepted in co-operation to use Påsse’s model in their analysis [8]. According to the Finnish regulations [12] the time window of estimating the doses in the safety analysis of the spent nuclear fuel repository has to be at least several thousands of years, which is interpreted by Posiva to be 10 000 years from the present. The repository site, Olkiluoto Island, resides in the glacial rebound area and the annual land uplift rate is approximately 6 millimeters per year. Påsse presented the model parameters for the larger Olkiluoto region, too, but in this paper we introduce a reiteration of the model from individual input data to achieve maximum accuracy, and the ArcGIS toolbox called UNTAMO, which employs the estimated uplift in landscape predictions.
GIS Ostrava 2010 24. - 27. 1. 2010, Ostrava
___________________________________________________________________
2 Påsse’s uplift model
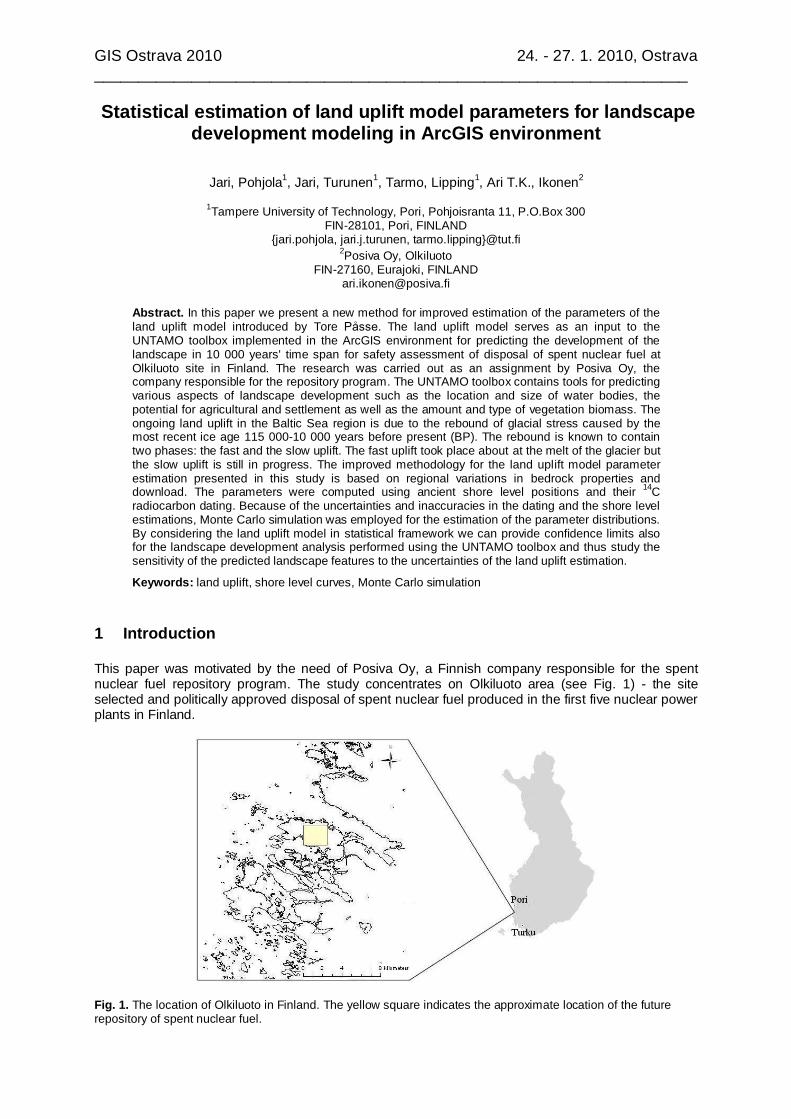
In Påsse’s model the shore level displacement is estimated from two variables:
EUS (2-1)
fs UUU (2-2)
where S is shore level displacement, U is the total glacio-isostatic uplift, Us is the slow component of the glacio-isostatic uplift, Uf is the fast component of the glacio-isostatic uplift or crustal change, and E is the eustatic sea level change (all in meters). The eustatic sea level change is either subtracted or added depending on the sign in the eustatic data.
Fig. 3. An example of shore level displacement, slow and fast uplift and eustatic sea level rise following an
illustration by Påsse [11].
The slow uplift is modeled in [11] using a linear combination of two arctan-functions:
s
s
s
sss
B
tT
B
TAU arctanarctan
2 (2-3)
where As is the download factor (in meters), Ts is the time for maximal uplift rate (i.e., the symmetry point of the arctan function; in years), t is the time (in years) and Bs is the inertia factor (y
-1).
GIS Ostrava 2010 24. - 27. 1. 2010, Ostrava
___________________________________________________________________ The fast uplift component is expressed:
2
5.0f
f
B
Tt
ff eAU (2-4)
where Af is the total subsidence (in meters), Bf is the inertia factor (y
-1), Tf is the time for maximal uplift
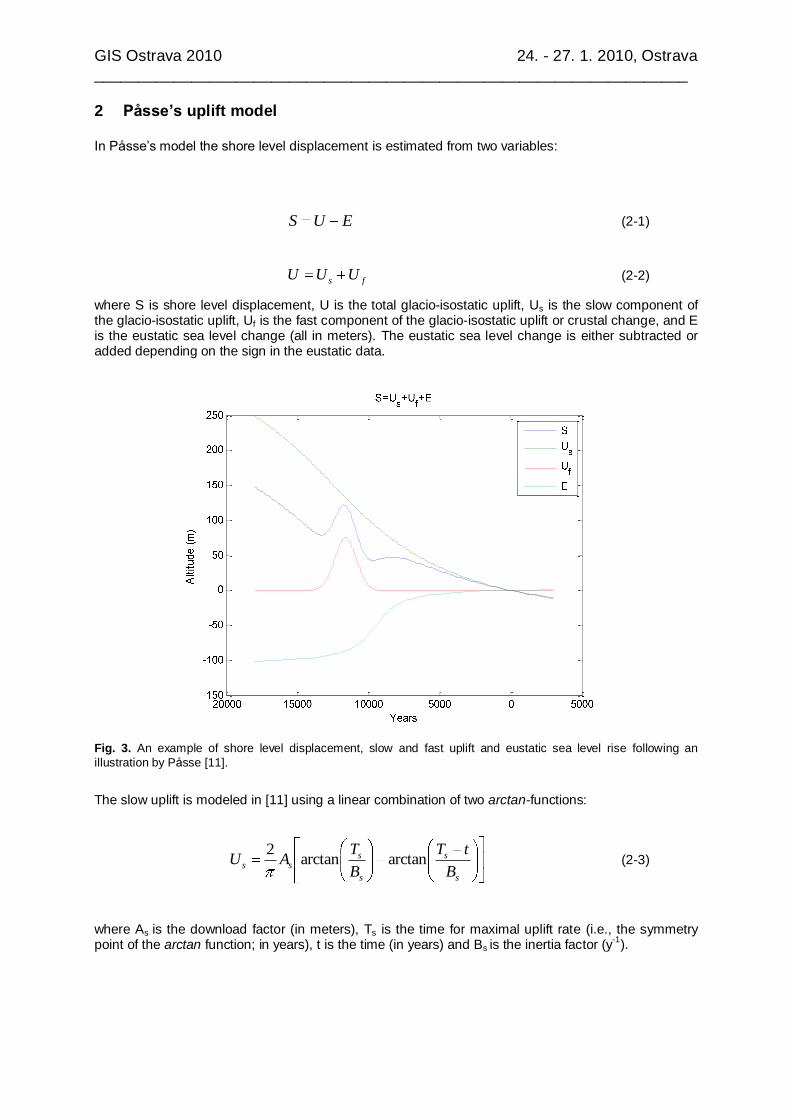
rate (i.e., the symmetry point of the arctan function; in years), t is time (in years). The eustatic sea level rise (E) is originally modeled using the radiocarbon-dated coral data collected by Fairbanks [5], Chappell [3] and Bard [1]. Påsse derived his own version based on Fairbanks’ data. Påsse also discussed about the effects of the lake phases of the Baltic Sea but concluded that the evidence is insufficient in some cases and that the influence of these lakes might be negligible in long-term studies [11]. This is true if only the future land uplift is in the interest and the parameter values are fully known. In our study the lake phases - more specifically, the duration and the estimates of the altitude of the lake levels - were taken from [13] and incorporated into the analysis since they do have a significance in deriving the model parameter values from the shore level observations dated within the time span of these lake phases. Both curves can be seen in Fig 4.
Fig. 4. Sea and lake level estimates. The blue curve is the eustatic rise according to Påsse [11]. The red crosses
are the coral data collected by Fairbanks [5], Chappell [3] and Bard [1]. The green curve is fitted to the coral data with the addition of the Baltic Sea lake phases. These include the Baltic Ice Lake (12600-10300 BP) and the Ancylus Lake (9500-9000 BP) [13]. During the lake phases the water level in the Baltic Sea area differed from the global sea level.
The parameters As and Ts play a significant role and they can be estimated from the existing data. As can be interpreted as half of the total isostatic uplift and Ts is the maximum uplift rate correlating with the glacial retreatment [14]. To find out the inertia factor Bs, a Moho map of Europe is used [6]. The inertia factor Bs is calculated using formula (2-5) [14], where ct means crustal thickness (Moho depth) in kilometers.
ct
s eB 067.0302 (2-5)

GIS Ostrava 2010 24. - 27. 1. 2010, Ostrava
___________________________________________________________________ In Fig. 5 the Påsse estimates of As and Ts (ice recession) by Påsse [11] are presented.
Fig. 5. As estimate (left) and the ice recession sT map in Fennoscandia according to Påsse [11]. The maps
are in a Swedish map projection.
3 Refinement of Påsse’s uplift model
Påsse’s slow uplift curve has zero altitude at year 0, i.e. 1950 in the common calendar, due to 14
C radiocarbon timing convention [14]. However, the zero point may sometimes cause confusion by changing the altitude sign, even though the real land uplift rate remains positive after that year. To correct for this phenomenon, the slow uplift formula is adjusted by adding a bias given by Eq. 2-6. When iterating the As and Ts values from shore level displacement data, the same bias must be added to shore level height values. The local As values are strictly bound to annual land uplift estimates as seen in Fig. 2.
)arctan(2
s
sss
B
TAABias (2-6)
Fig. 6. The shore level displacement curve calculated using the adjusted slow uplift formula for data obtained
from Nummensuo peat bog.

GIS Ostrava 2010 24. - 27. 1. 2010, Ostrava
___________________________________________________________________ For defining and iterating the local As and Ts parameter values, 349 collected point data values (x,y,
and z, as well as the 14
C radiocarbon age) of the shore level were used in this study. These points
are shown in Fig 7. The 14
C radiocarbon ages together with corresponding uncertainties were
converted into calendar year probability distributions using “OxCal” software [10]. In Fig. 8 an example
of the calibration of the point data from Nummensuo peat bog is presented. As both the 14
C
radiocarbon dating as well as the height (z) value contain uncertainties, the Monte Carlo simulation procedure was used for determining the probability distributions for the As and Ts values. The Monte Carlo simulation was based on 1000 realizations of elevation values generated according to Gaussian
distribution (p95 10 cm) and OxCal-given age distributions.
Fig. 7. Point data locations in Finland and Sweden. The majority of the points are situated in western and
southern parts of Finland.
Fig. 8. Screen capture from OxCal program. The
14C age (5500) and the standard uncertainty (180) are the
inputs. The blue line indicates the calibration curve while the error distribution of the calendar age (95.4 % confidence) is shown in grey. The figure shows that there is 95.1 % certainty that the calendar age is between 3961-4728 BC and 0.3 % certainty that the calendar age is between 4756-4766 BC.
GIS Ostrava 2010 24. - 27. 1. 2010, Ostrava
___________________________________________________________________
4 Results
4.1 Resulting parameters
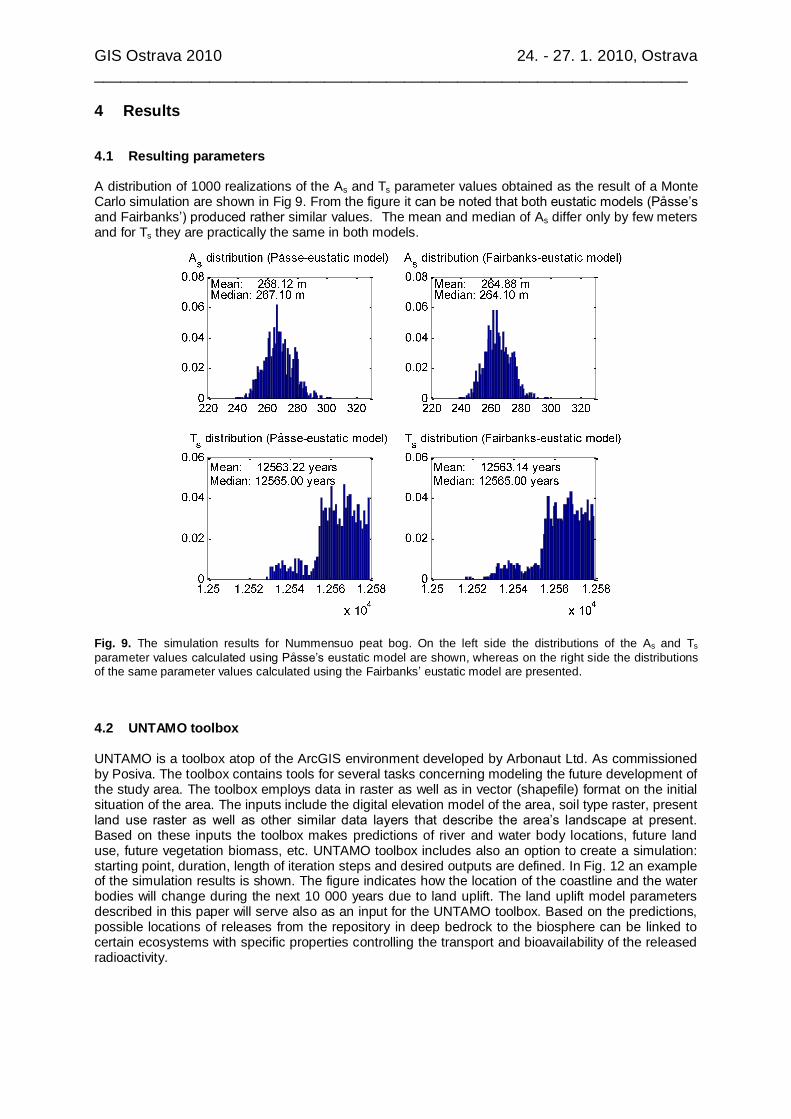
A distribution of 1000 realizations of the As and Ts parameter values obtained as the result of a Monte Carlo simulation are shown in Fig 9. From the figure it can be noted that both eustatic models (Påsse’s and Fairbanks’) produced rather similar values. The mean and median of As differ only by few meters and for Ts they are practically the same in both models.
Fig. 9. The simulation results for Nummensuo peat bog. On the left side the distributions of the As and Ts
parameter values calculated using Påsse’s eustatic model are shown, whereas on the right side the distributions of the same parameter values calculated using the Fairbanks’ eustatic model are presented.
4.2 UNTAMO toolbox
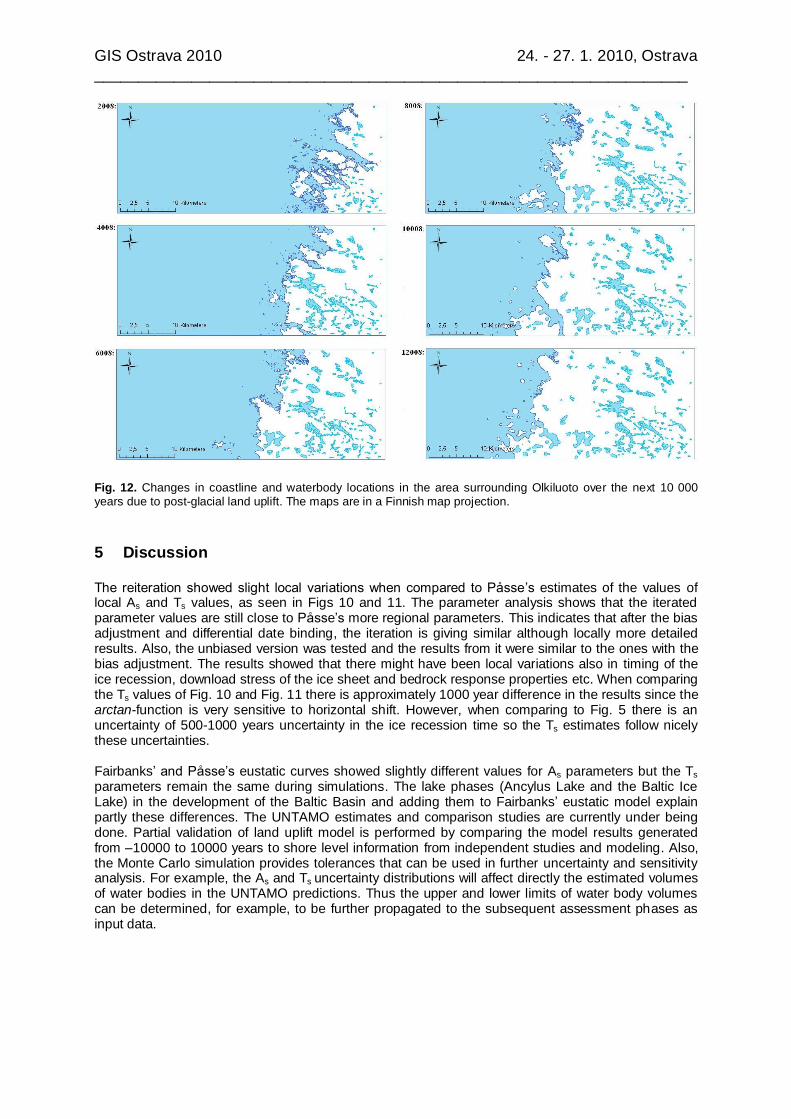
UNTAMO is a toolbox atop of the ArcGIS environment developed by Arbonaut Ltd. As commissioned by Posiva. The toolbox contains tools for several tasks concerning modeling the future development of the study area. The toolbox employs data in raster as well as in vector (shapefile) format on the initial situation of the area. The inputs include the digital elevation model of the area, soil type raster, present land use raster as well as other similar data layers that describe the area’s landscape at present. Based on these inputs the toolbox makes predictions of river and water body locations, future land use, future vegetation biomass, etc. UNTAMO toolbox includes also an option to create a simulation: starting point, duration, length of iteration steps and desired outputs are defined. In Fig. 12 an example of the simulation results is shown. The figure indicates how the location of the coastline and the water bodies will change during the next 10 000 years due to land uplift. The land uplift model parameters described in this paper will serve also as an input for the UNTAMO toolbox. Based on the predictions, possible locations of releases from the repository in deep bedrock to the biosphere can be linked to certain ecosystems with specific properties controlling the transport and bioavailability of the released radioactivity.
GIS Ostrava 2010 24. - 27. 1. 2010, Ostrava
___________________________________________________________________
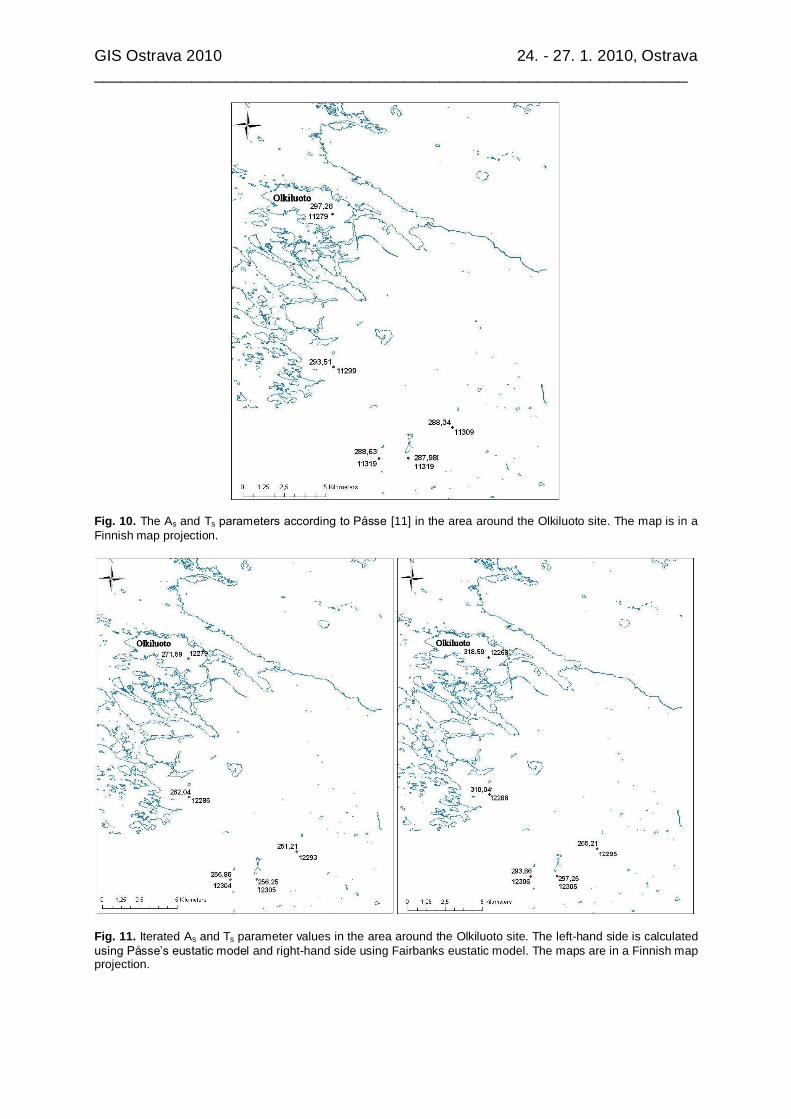
Fig. 10. The As and Ts parameters according to Påsse [11] in the area around the Olkiluoto site. The map is in a
Finnish map projection.
Fig. 11. Iterated As and Ts parameter values in the area around the Olkiluoto site. The left-hand side is calculated
using Påsse’s eustatic model and right-hand side using Fairbanks eustatic model. The maps are in a Finnish map projection.
GIS Ostrava 2010 24. - 27. 1. 2010, Ostrava
___________________________________________________________________
Fig. 12. Changes in coastline and waterbody locations in the area surrounding Olkiluoto over the next 10 000 years due to post-glacial land uplift. The maps are in a Finnish map projection.
5 Discussion
The reiteration showed slight local variations when compared to Påsse’s estimates of the values of local As and Ts values, as seen in Figs 10 and 11. The parameter analysis shows that the iterated parameter values are still close to Påsse’s more regional parameters. This indicates that after the bias adjustment and differential date binding, the iteration is giving similar although locally more detailed results. Also, the unbiased version was tested and the results from it were similar to the ones with the bias adjustment. The results showed that there might have been local variations also in timing of the ice recession, download stress of the ice sheet and bedrock response properties etc. When comparing the Ts values of Fig. 10 and Fig. 11 there is approximately 1000 year difference in the results since the arctan-function is very sensitive to horizontal shift. However, when comparing to Fig. 5 there is an uncertainty of 500-1000 years uncertainty in the ice recession time so the Ts estimates follow nicely these uncertainties. Fairbanks’ and Påsse’s eustatic curves showed slightly different values for As parameters but the Ts parameters remain the same during simulations. The lake phases (Ancylus Lake and the Baltic Ice Lake) in the development of the Baltic Basin and adding them to Fairbanks’ eustatic model explain partly these differences. The UNTAMO estimates and comparison studies are currently under being done. Partial validation of land uplift model is performed by comparing the model results generated from –10000 to 10000 years to shore level information from independent studies and modeling. Also, the Monte Carlo simulation provides tolerances that can be used in further uncertainty and sensitivity analysis. For example, the As and Ts uncertainty distributions will affect directly the estimated volumes of water bodies in the UNTAMO predictions. Thus the upper and lower limits of water body volumes can be determined, for example, to be further propagated to the subsequent assessment phases as input data.

GIS Ostrava 2010 24. - 27. 1. 2010, Ostrava
___________________________________________________________________
References
[1] Bard, E., Hamelin, B., Arnold, M., Montaggioni, L., Cabioch, G., Faure, G. & Rougerie, F.
Deglacial sea-level record from Tahiti corals and the timing of global meltwater discharge, Nature 382, 1996.
[2] Cathles, L.M. The viscosity of the earth’s mantle. Princeton University Press, 1975 Princeton. ISBN 0691081409.
[3] Chappell, J. & Polach, H. Post-glacial sea-level rise from a coral record at Huon Peninsula,
Papua New Guinea, Nature 349, 1991.
[4] Clark, R.D., Farrell, W.E. & Peltier, W.R. Global changes in postglacial sea level: a numerical calculation, Quaternary Research 9, 1978.
[5] Fairbanks, R.G. A 17,000-year glacio-eustatic sea level record: influence of glacial melting
rates on the Younger Dryas event and deep-ocean circulation, Nature 342, 1989.
[6] Grad, M., Tiira, T., & ESC Working Group. The Moho depth map of the European Plate,
Geophys. J. Int. 176., 2009.
[7] Lambeck, K. & Purcell, A. Glacial Rebound and Crustal Stress in Finland, Posiva Oy Working
Report 2003-10, 2003. Eurajoki.
[8] Lindborg, T. & Rubio Lind, L. Long-term development of the super-regional area of Olkiluoto/Forsmark/Laxemar. Minutes from the Posiva and SKB workshop, October 12-13, 2006 Rånäs Slott, Sweden, Swedish Nuclear Fuel and Waste Management Co. Report P-06-302, 2006. Stockholm. ISSN 1651-4416.
[9] McConnell, R.K. Viscosity of the Mantle from Relaxation Time Spectra of Isostatic Adjustment. Geophys. Res.73s. 1968.
[10] Oxford Radiocarbon Accelerator Unit, http://c14.arch.ox.ac.uk/embed.php?File=oxcal.html.
[11] Påsse, T. An empirical model of glacio-isostatic movements and shore-level displacement in
Fennoscandia, Swedish Nuclear Fuel and Waste Management Co. Report R-01-41, 2001. Stockholm. ISSN 1402-3091.
[12] STUK. Long-term safety of disposal of spent nuclear fuel, Guide YVL 8.4, 2001, Radiation and Nuclear Safety Authority (STUK). ISBN 951-712-470-8.
[13] Tikkanen, M. & Oksanen, J. Late Weichselian and Holoscene shore displacement history of the Baltic Sea in Finland, Fennia 180, 2002. ISSN 0015-0010.
[14] Vuorela, A., Penttinen, T. & Lahdenperä, A-M. Review of Bothnian Sea shore-level displacement data and use of a GIS tool to estimate isostatic uplift, Posiva Oy Working Report 2009-17, 2009. Eurajoki.