Embed Size (px)
Citation preview
Statistical presentation in international scientific publications 4. Reporting numbers
Malcolm CampbellLecturer in Statistics, School of Nursing, Midwifery &
Social Work, The University of Manchester
Statistical Editor, Health & Social Care in the Community
26 March 2008 Statistical presentation - 4. Reporting numbers 2
4. Reporting numbersContents
• 4.1 Introduction
• 4.2 Reporting numbers and percentages
• 4.3 Reporting statistics
• 4.4 Reporting test results
• 4.5 Terminology and notation
26 March 2008 Statistical presentation - 4. Reporting numbers 3
4.1 IntroductionRationale for statistical reporting
• Be consistent and give the reader clear, concise but complete information– find a compromise between giving too little and too
much information
– this compromise may depend on the readership of the journal
• There are general conventions for reporting– numbers
– percentages
– statistics
– hypothesis tests
26 March 2008 Statistical presentation - 4. Reporting numbers 4
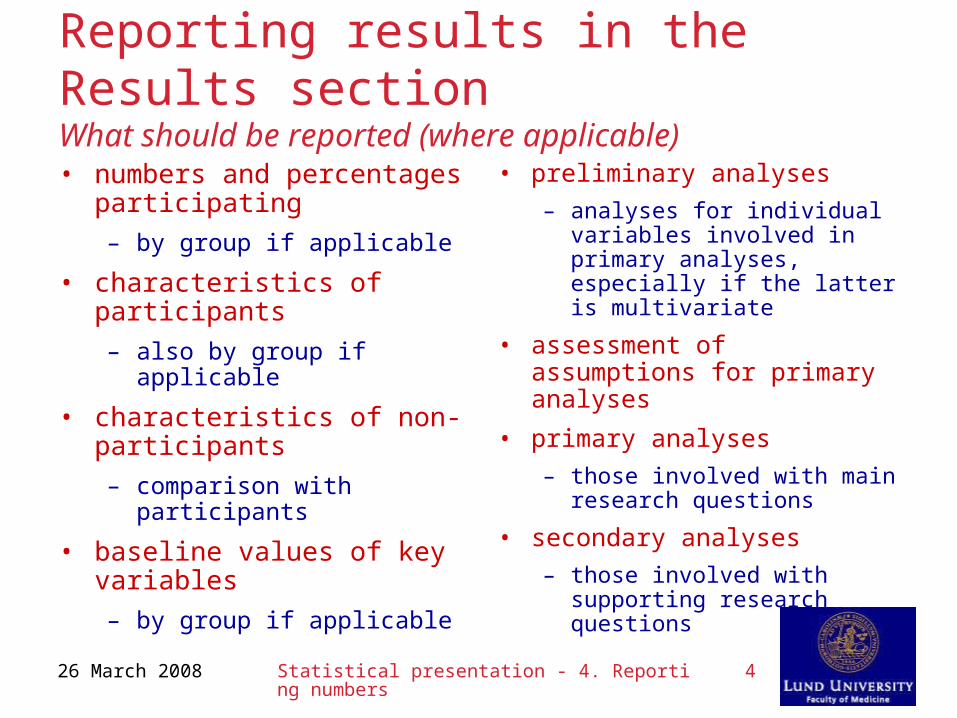
Reporting results in the Results sectionWhat should be reported (where applicable)
• numbers and percentages participating– by group if applicable
• characteristics of participants– also by group if applicable
• characteristics of non-participants– comparison with
participants
• baseline values of key variables– by group if applicable
• preliminary analyses– analyses for individual
variables involved in primary analyses, especially if the latter is multivariate
• assessment of assumptions for primary analyses
• primary analyses– those involved with main
research questions
• secondary analyses– those involved with
supporting research questions
26 March 2008 Statistical presentation - 4. Reporting numbers 5
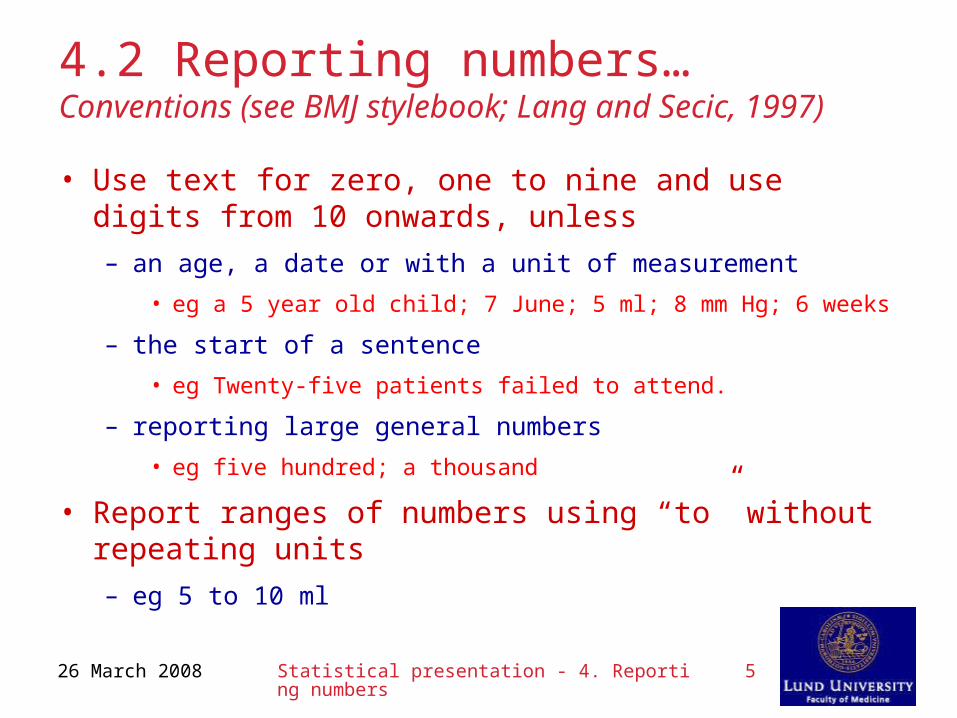
4.2 Reporting numbers…Conventions (see BMJ stylebook; Lang and Secic, 1997)
• Use text for zero, one to nine and use digits from 10 onwards, unless– an age, a date or with a unit of measurement
• eg a 5 year old child; 7 June; 5 ml; 8 mm Hg; 6 weeks
– the start of a sentence
• eg Twenty-five patients failed to attend.
– reporting large general numbers
• eg five hundred; a thousand
• Report ranges of numbers using “to” without repeating units– eg 5 to 10 ml
26 March 2008 Statistical presentation - 4. Reporting numbers 6
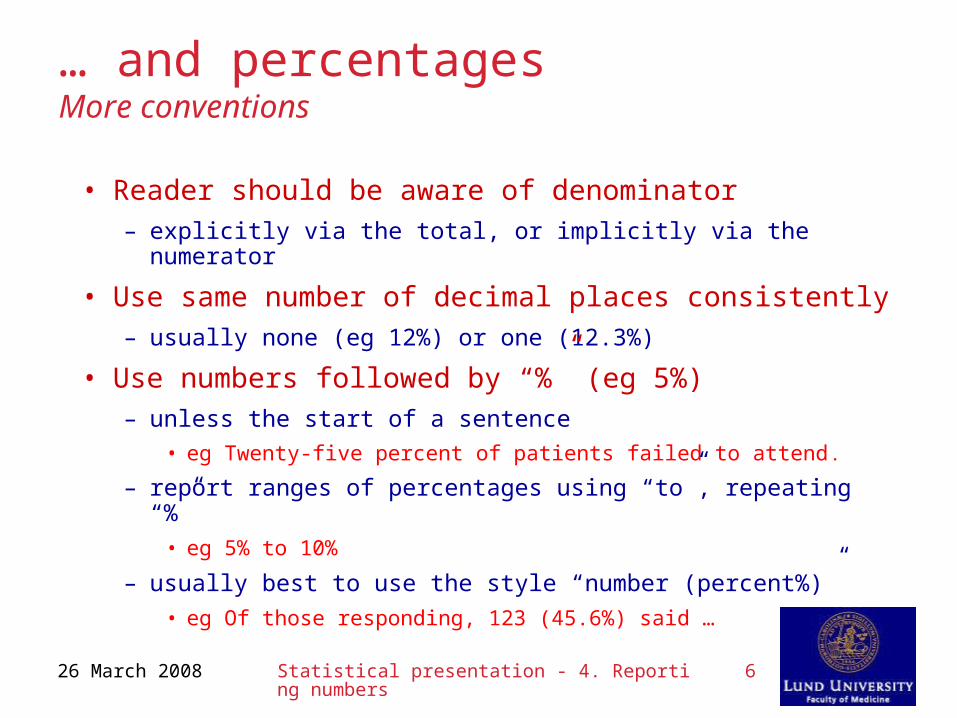
… and percentagesMore conventions
• Reader should be aware of denominator– explicitly via the total, or implicitly via the numerator
• Use same number of decimal places consistently– usually none (eg 12%) or one (12.3%)
• Use numbers followed by “%” (eg 5%)– unless the start of a sentence
• eg Twenty-five percent of patients failed to attend.
– report ranges of percentages using “to”, repeating “%”• eg 5% to 10%
– usually best to use the style “number (percent%)”• eg Of those responding, 123 (45.6%) said …
26 March 2008 Statistical presentation - 4. Reporting numbers 7
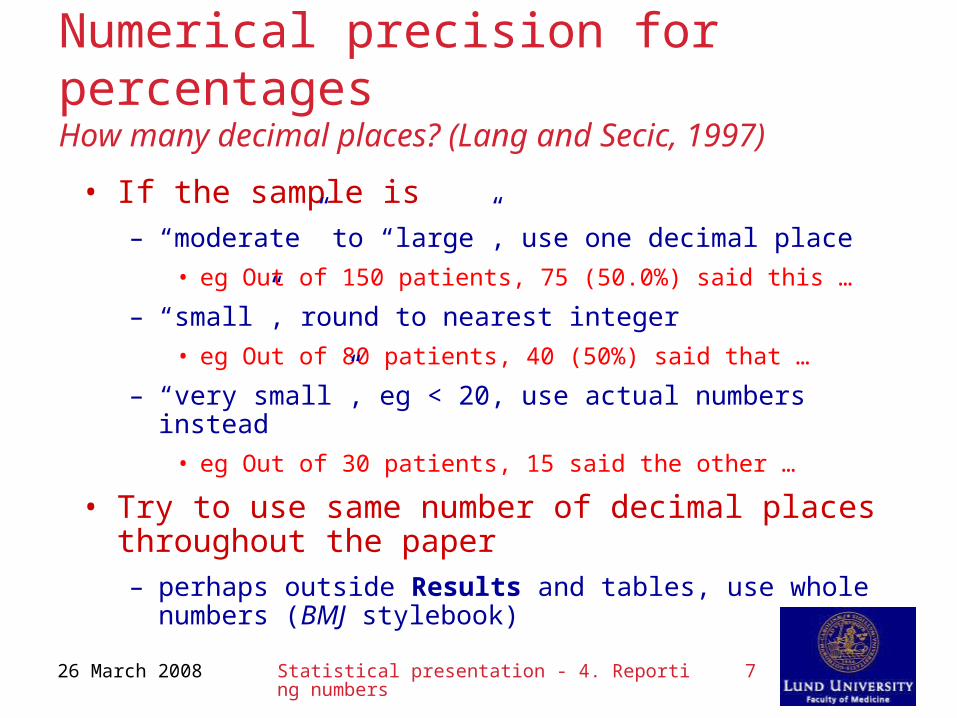
Numerical precision for percentagesHow many decimal places? (Lang and Secic, 1997)
• If the sample is– “moderate” to “large”, use one decimal place
• eg Out of 150 patients, 75 (50.0%) said this …
– “small”, round to nearest integer• eg Out of 80 patients, 40 (50%) said that …
– “very small”, eg < 20, use actual numbers instead• eg Out of 30 patients, 15 said the other …
• Try to use same number of decimal places throughout the paper– perhaps outside Results and tables, use whole
numbers (BMJ stylebook)
26 March 2008 Statistical presentation - 4. Reporting numbers 8
How to round to n decimal placesHow software does it
• Values with digits from 0 to 4 in (n+1)st decimal place are rounded downwards– eg, to one decimal place, round 2.345 to 2.3
• Values with digits from 5 to 9 in (n+1)st decimal place are rounded upwards– eg, to one decimal place, round 3.450 to 3.5
• If after rounding, nth decimal place is 0, report it– eg if one decimal place is used, report 21.0, not 21
• “21.0” is in the range 20.05 inclusive to 21.05 exclusive
• “21” is in the range 20.5 inclusive to 21.5 exclusive
26 March 2008 Statistical presentation - 4. Reporting numbers 9
The BadInconsistent percentages
• Papanikolaou et al (2003) [again]– Pressure ulcer risk assessment: application of logistic
analysis, J Advanced Nursing 44(2), 128-136
• Table 2 reports percentages
– counts should have been reported too, at least for each column (25 and 473)
– varying number of decimal places for percentages (0, 1 or 2)
– percentages such as 16.0 and 4.0 reported as 16 and 4
• [does not follow IMRaD structure (see earlier)]
• [no sample size calculation and p-values of “0.00”]
26 March 2008 Statistical presentation - 4. Reporting numbers 10
Numerical precision for statisticsHow many decimal places? (Altman et al, 2000)
• For summary statistics such as means, standard deviations, standard errors, and confidence limits, use one more decimal place than the raw values– for medians and quartiles, possibly use raw value
• For most test statistics, use at most 2 decimal places
• Where possible, try to use same number of decimal places consistently throughout paper for each type of value
26 March 2008 Statistical presentation - 4. Reporting numbers 11
4.3 Reporting statistics 1Some parametric statistics …
• Report means with SD, SE or CI: if SD high compared to mean, distribution is skewed…– report means and standard deviations or standard errors
as “mean (SD standard deviation)” or “mean (SE standard error)”
• eg 23.4 (SD 5.6); 8.9 (SE 0.1)
• avoid using “±” as this does not differentiate between SD, SE or other measures
– report confidence intervals as “CI lower to upper” or “CI lower, upper”
• eg 95% CI 1.2 to 3.4 or 95% CI 1.2, 3.4
• “CI lower – upper” is tricky if lower or upper is negative
26 March 2008 Statistical presentation - 4. Reporting numbers 12
Reporting statistics 2… and some order/nonparametric statistics
• … And if the distribution is skewed, report medians with ranges or interquartile ranges– report ranges as “range minimum to maximum” or “range
minimum, maximum”
• eg range 5 to 67 or range 5, 67
• and not as the arithmetic difference 62
– report medians and central percentile ranges (such as interquartile range [IQR]) in the form “median (IQR lower to upper)” or “median (IQR lower, upper)”
• eg 45.6 (IQR 12.3 to 89.0) or 45.6 (IQR 12.3, 89.0)
• do not report arithmetic difference for the range
• if not IQR, identify the percentile range used
26 March 2008 Statistical presentation - 4. Reporting numbers 13
The BadMeans without SDs
• Saarikoski et al (2002)– Clinical learning environment and supervision: testing a
research instrument in an international comparative study, Nurse Education Today 22, 340-349
• [does not follow IMRaD structure]
• [no sample size calculation, no test statistics but “P-value <0.000***” reported twice]
• subscale means reported without SDs; ANOVA used for two-group comparison instead of t-test
– if group SDs had been different, unequal variance t-test might have been better, given different group sizes
– not clear whether differences between means were clinically important (statistical significance may be due to large sample sizes)
26 March 2008 Statistical presentation - 4. Reporting numbers 14
4.4 Reporting test resultsHow to report results of tests (Lang and Secic, 1997)
• Do not give p-values in isolation; if readable, test results in text or tables should include– value of the test statistic (eg to two decimal places)
• state explicitly if one-tailed (default is two-tailed)
– degrees of freedom (where applicable)
• eg df = 30; or t[30] = …; df = 1, 30; or F[1,30] = …
– if sufficient space, the actual p-value to three decimal places or two significant figures (check the journal!)
• eg p = 0.012 or p = 0.34 (ranges like “p < 0.05” hide info)
• unless p < 0.001, conventionally report “p < 0.001”
– if not (in tables), “* p<0.05, ** p<0.01, *** p<0.001”
• but not at the same time as actual p-values!
26 March 2008 Statistical presentation - 4. Reporting numbers 15
Report supporting statisticsShow what the test result means (Altman et al, 2000)
• p-value does not show the “size” of any effect
• Include supporting statistics to indicate the clinical importance of the result– estimated group proportions, group means/SDs,
mean/SD of (paired) difference
– or confidence interval for difference between group proportions or means
• especially for main outcome measures
– or effect size• odds ratio, phi statistic/Cramér’s V statistic (Cohen’s w),
standardised difference between means (Cohen’s d or Glass’ g), standardised mean (paired) difference, correlation coefficient
26 March 2008 Statistical presentation - 4. Reporting numbers 16
Non-significant resultsIt’s not the end of the world
• A non-significant test does not mean failure!– just that there is insufficient evidence to show a
statistically significant difference or relationship
• not enough data, or no difference or relationship
– this might be interesting in its own right
– sometimes the pattern of results is more important
• If a main analysis, give results and supporting statistics in full– reader still needs to know that the test has been
performed correctly
– supporting statistics may help interpreting overall pattern
26 March 2008 Statistical presentation - 4. Reporting numbers 17
The BadP-values in isolation
• Abayomi and Hackett (2004)– Assessment of malnutrition in mental health clients:
nurses’ judgement vs. a nutrition risk tool
– J Advanced Nursing 45(4), 430-437• [“Data were collated and analysed using the Statistical
Package for the Social Sciences (SPSS). The chi square test was used to assess relationships between variables…”]
• [main comparison is risk assessment by tool (yes/no) v risk assessment by nurse (yes/no), which should have been measured using kappa statistic, not chi-square]
• actual p-values given but no test statistics; no supporting statistics when comparing either risk assessment with reason for admission, gender, age (<40, >40)
26 March 2008 Statistical presentation - 4. Reporting numbers 18
The UglyP-values ranges only – not sure about the tests
• Paxton et al (1996) [again]– Evaluating the workload of practice nurses: a study,
Nursing Standard 10(21), 33-38
• study comparing workload of same 34 practice-employed and health board attached nurses before and after introduction of the New General Practitioner Contract
• [no sample size calculations]
• [chi square statistic said to be used for categorical variables, ignoring paired nature of data (see earlier)]
• [statistical methods for other variables (% of time, hours per FTE) not described]
• no test statistics reported – only p-value ranges – so can’t identify tests being used
26 March 2008 Statistical presentation - 4. Reporting numbers 19
The UglyGenerally poor reporting of results
• Zeitoun et al (2003)– A prospective, randomized study of ventilator-assisted
pneumonia in patients using a closed vs. open suction system, J Clinical Nursing 12(4), 484-489
• [not randomised, no justification for small sample size (24 open suction v 23 closed suction) and probably not enough for logistic regression]
• actual p-values (some 1.000s) but no test statistics
• entries in two tables not clear– probably mean(range) days of use of drugs
• no details of how logistic regression applied – details of “final” model shown in table
• odds ratio from logistic regression mistakenly interpreted as risk ratio (“a 0.014 less chance of developing VAP”)

26 March 2008 Statistical presentation - 4. Reporting numbers 20
4.5 Terminology and notationYet more conventions
• There are common conventions on the use of– reserved terminology
– standard statistical notation, including
• common abbreviations
• Roman characters
• Greek characters
26 March 2008 Statistical presentation - 4. Reporting numbers 21
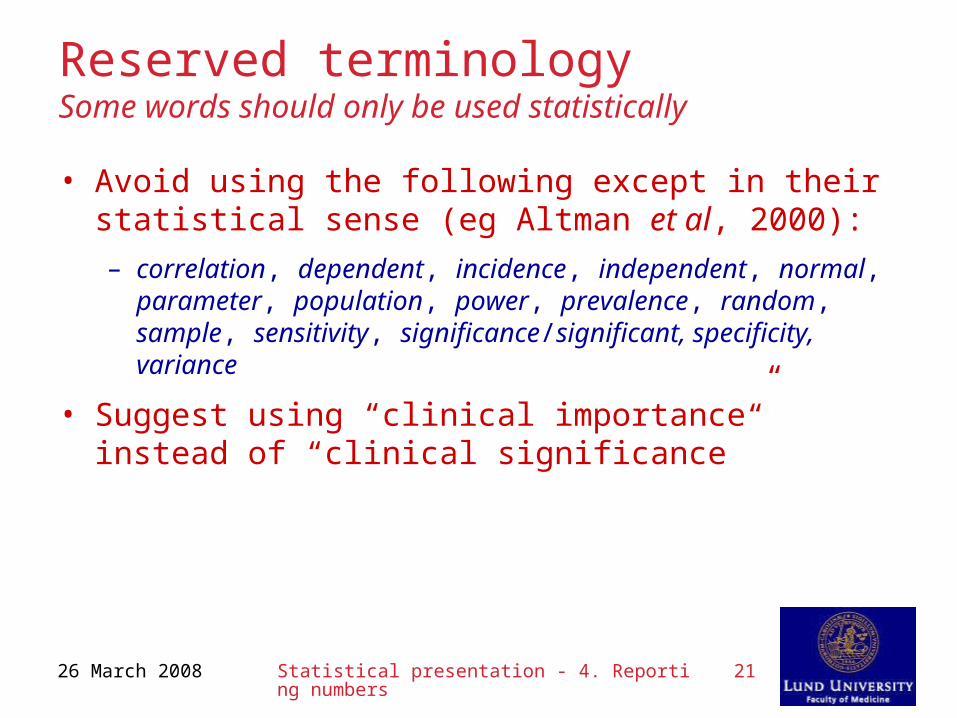
Reserved terminologySome words should only be used statistically
• Avoid using the following except in their statistical sense (eg Altman et al, 2000):– correlation, dependent, incidence, independent, normal,
parameter, population, power, prevalence, random, sample, sensitivity, significance/significant, specificity, variance
• Suggest using “clinical importance” instead of “clinical significance”
26 March 2008 Statistical presentation - 4. Reporting numbers 22
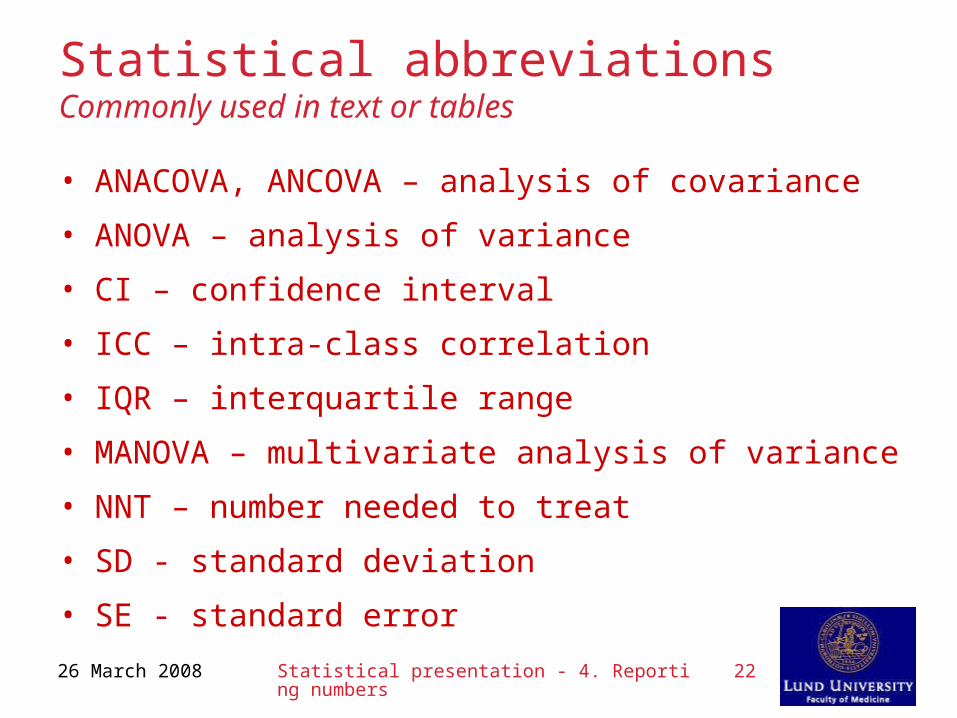
Statistical abbreviationsCommonly used in text or tables
• ANACOVA, ANCOVA – analysis of covariance
• ANOVA – analysis of variance
• CI – confidence interval
• ICC – intra-class correlation
• IQR – interquartile range
• MANOVA – multivariate analysis of variance
• NNT – number needed to treat
• SD - standard deviation
• SE - standard error
26 March 2008 Statistical presentation - 4. Reporting numbers 23
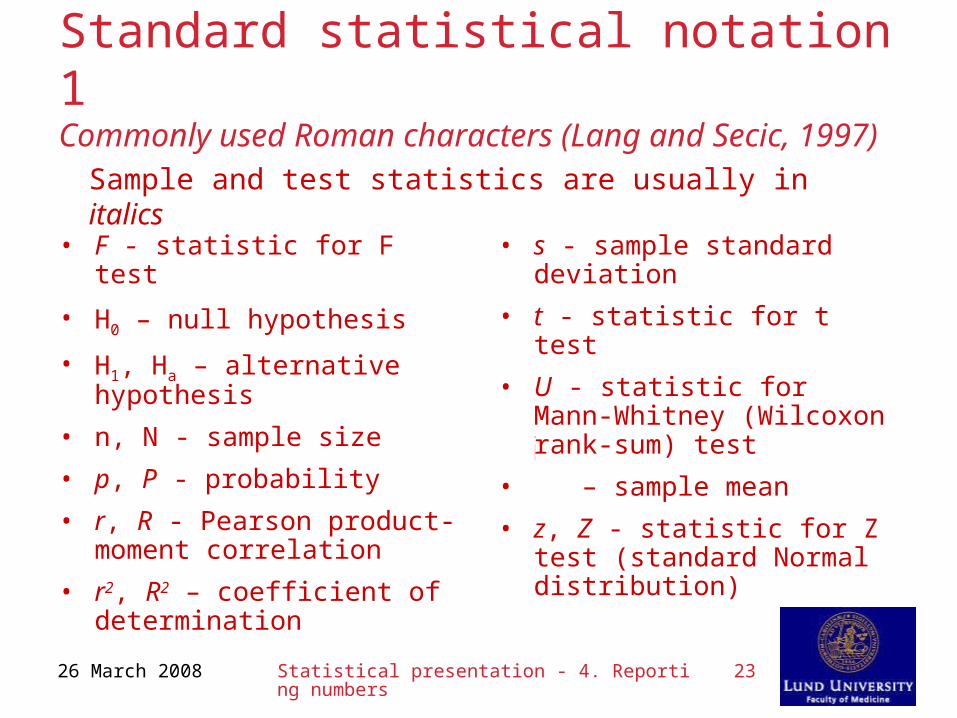
Standard statistical notation 1Commonly used Roman characters (Lang and Secic, 1997)
• F - statistic for F test
• H0 – null hypothesis
• H1, Ha – alternative hypothesis
• n, N - sample size
• p, P - probability
• r, R - Pearson product-moment correlation
• r2, R2 – coefficient of determination
• s - sample standard deviation
• t - statistic for t test
• U - statistic for Mann-Whitney (Wilcoxon rank-sum) test
• – sample mean
• z, Z - statistic for Z test (standard Normal distribution)
Sample and test statistics are usually in italics
x̄
26 March 2008 Statistical presentation - 4. Reporting numbers 24
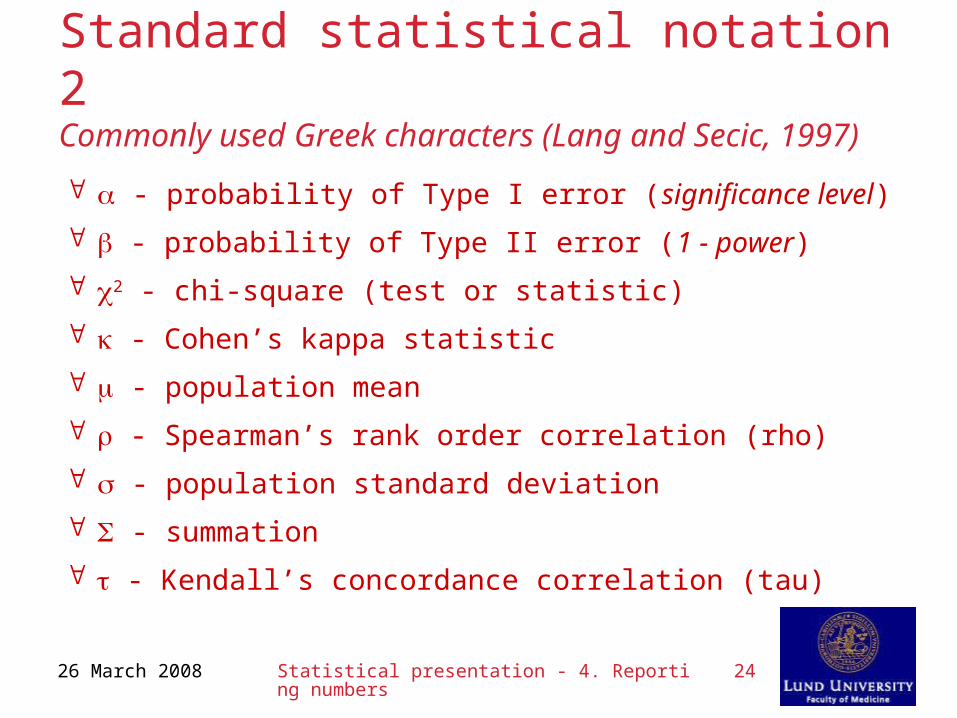
Standard statistical notation 2Commonly used Greek characters (Lang and Secic, 1997)
- probability of Type I error (significance level)
- probability of Type II error (1 - power)
2 - chi-square (test or statistic)
- Cohen’s kappa statistic
- population mean
- Spearman’s rank order correlation (rho)
- population standard deviation
- summation
- Kendall’s concordance correlation (tau)