Embed Size (px)
Citation preview
Statistics in Risk AssessmentWhat‘s about Truth?
Hans Toni Ratte
Institute of Environmental Research (Biology V)Chair of Ecology, Ecotoxicology, EcochemistryWorkgroup of Aquatic Ecology and EcotoxicologyRWTH Aachen University
0%
20%
40%
60%
80%
100%
0 0.5 1 1.5 2 2.5 3
Log (Dose/concentration)
Effe
ct
2AQUABASE Workshop 29.11.2006
Stat
istic
s in
Ris
k As
sess
men
tContent
IntroductionStatistical toxicity parametersSmall Statistical Crash Course
ECx and LOEC/NOEC conceptMinimal detectable differenceβ-error and statistical power
Test Results from ExamplesNOEC versus ECxLessons learned?Conclusions
3AQUABASE Workshop 29.11.2006
Stat
istic
s in
Ris
k As
sess
men
tBackground
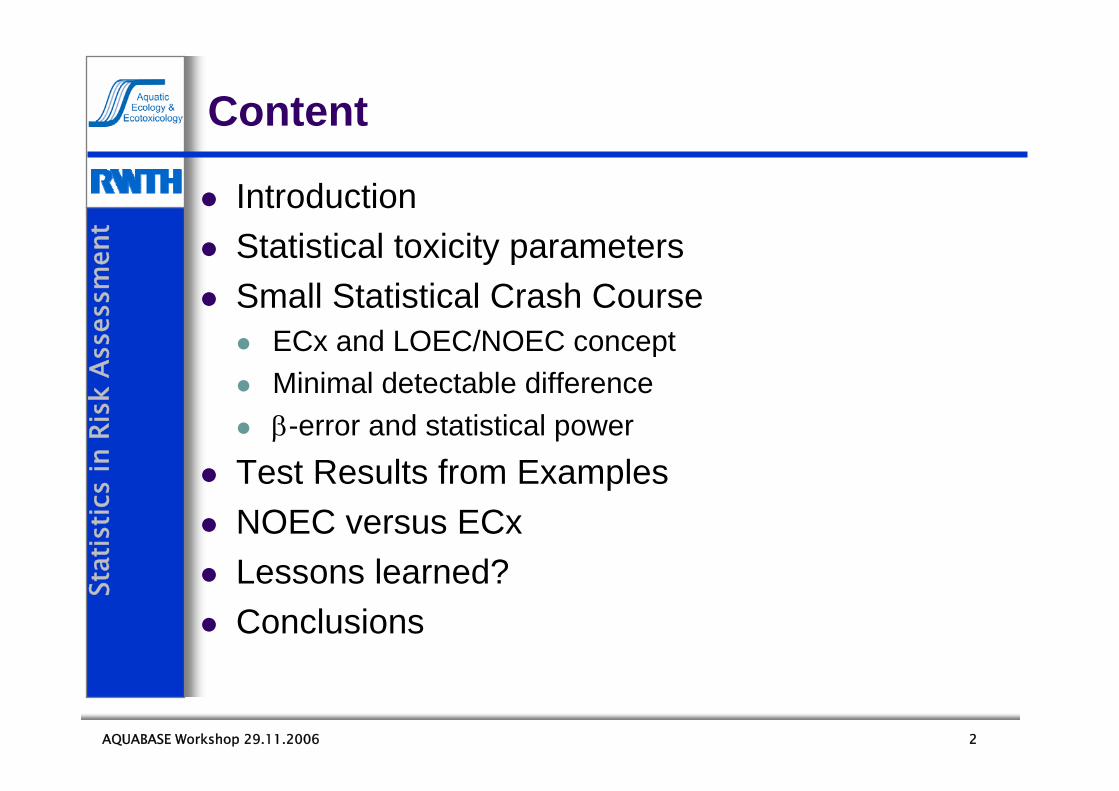
Conduct of Biotesting Prospective assessment of chemicals prior to marketingRetrospective effects assessment of environmental samples (fieldmonitoring)
Legal requirementsNational actsGermany: pesticides act, chemicals act, waste water actEU member states
Council Directive 91/414/EECREACh (new in 2007(?))
Competent authorities Responsible for execution of these lawsDecide on authorization of substances based on biotest results (determination the PNEC)
Hence biotest results must even endure before court
Intro
duct
ion
4AQUABASE Workshop 29.11.2006
Stat
istic
s in
Ris
k As
sess
men
t
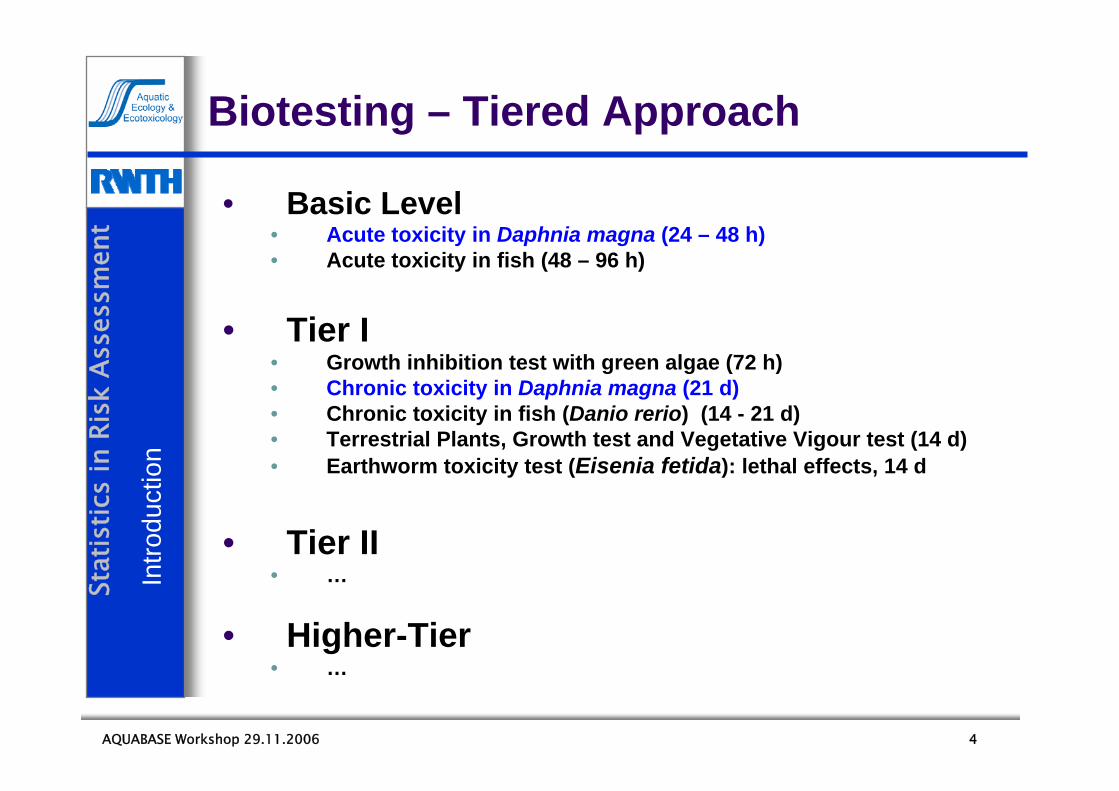
• Basic Level• Acute toxicity in Daphnia magna (24 – 48 h)• Acute toxicity in fish (48 – 96 h)
• Tier I• Growth inhibition test with green algae (72 h)• Chronic toxicity in Daphnia magna (21 d)• Chronic toxicity in fish (Danio rerio) (14 - 21 d)• Terrestrial Plants, Growth test and Vegetative Vigour test (14 d)• Earthworm toxicity test (Eisenia fetida): lethal effects, 14 d
• Tier II• …
• Higher-Tier• …
Biotesting – Tiered Approach In
trodu
ctio
n
5AQUABASE Workshop 29.11.2006
Stat
istic
s in
Ris
k As
sess
men
tRequirements of Regulatory Authorities
Test conductOECD guidelines or ISO standardsGood-laboratory practice (GLP)
Statistics ? Some recommendations within guidelinesISO/TS 20281:2004 Water quality — Guidance on statistical interpretation of ecotoxicity data (also corresponding OECD text)However: Recommendations often weak and recommended methods not obligatory
Intro
duct
ion
6AQUABASE Workshop 29.11.2006
Stat
istic
s in
Ris
k As
sess
men
tAim of Presentation
Explaining youthe concepts of hypothesis testing (NOEC determination) and concentration/response modeling (ECx estimation from curve fitting);the concept of the minimal detectable difference (MDD) between two samples as a simple indicator of test power;the weakness of the NOEC concept (too much freedom for manipulation).
Making you aware of the final end of „intelligent testing“; i.e. the consequences of weak recommendations and their consequencesMotivating you to advocate for science-based regulatory actions
Intro
duct
ion
7AQUABASE Workshop 29.11.2006
Stat
istic
s in
Ris
k As
sess
men
tExample from Guideline OECD 202:2004
Daphnia sp., Acute Immobilization Test
…“The percentages immobilized at 24 hours and 48 hours are plotted against test concentrations. Data are analysed by appropriate statistical methods (e.g. probit analysis, etc.) to calculate the slopes of the curves and the EC50 with 95% confidence limits (p = 0.95)”…
This description is adequate and the mentioned probit analysis is frequently performed with this test (sometimes also replaced by logit or Weibull analysis)
Intro
duct
ion
8AQUABASE Workshop 29.11.2006
Stat
istic
s in
Ris
k As
sess
men
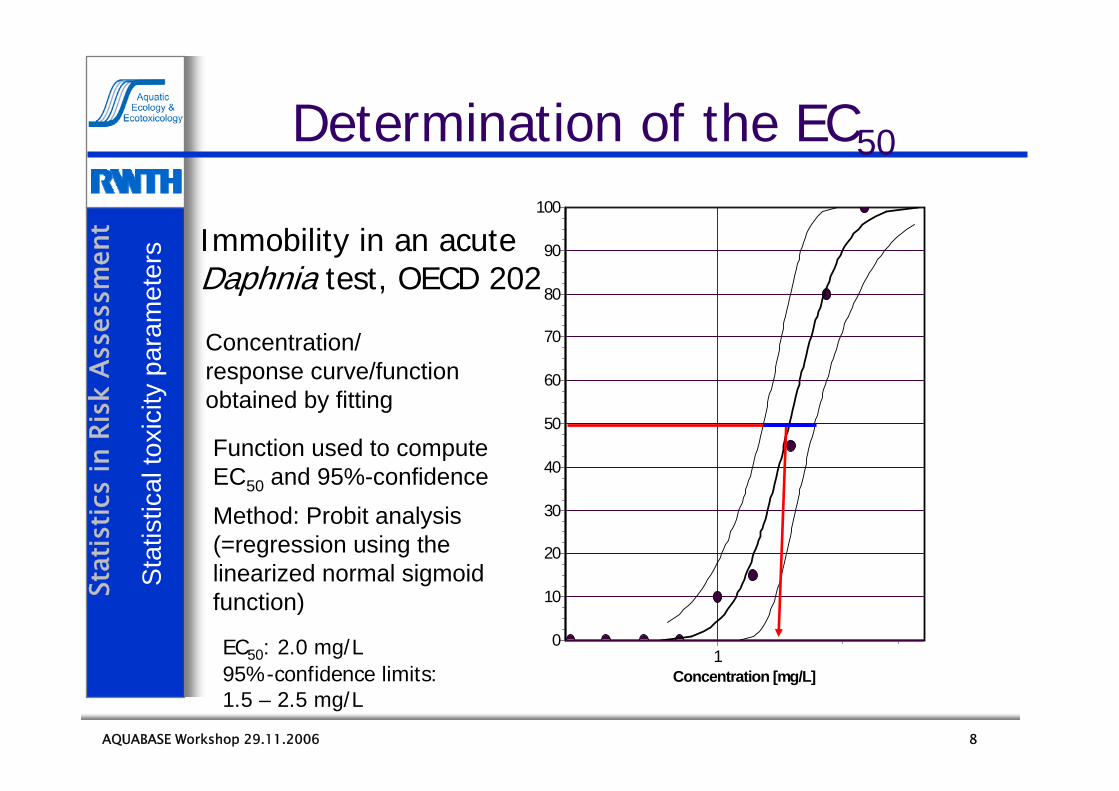
tDetermination of the EC50
DataFunction95%-CL
Concentration [mg/L]1
% M
ort
ality
100
90
80
70
60
50
40
30
20
10
0EC50: 2.0 mg/L95%-confidence limits: 1.5 – 2.5 mg/L
Immobility in an acuteDaphnia test, OECD 202
Sta
tistic
al to
xici
ty p
aram
eter
s
Concentration/response curve/functionobtained by fitting
Function used to computeEC50 and 95%-confidenceMethod: Probit analysis(=regression using thelinearized normal sigmoidfunction)
9AQUABASE Workshop 29.11.2006
Stat
istic
s in
Ris
k As
sess
men
tExample from Guideline OECD 211:1998
Daphnia magna Reproduction Test …“the number of deaths among the parent animals and the day on which they occurred (see …);”……”the Lowest Observed Effect Concentration (LOEC) for reproduction, including a description of the statistical procedures used and an indication of what size of effect could be detected and the No Observed Effect Concentration (NOEC) for reproduction; where appropriate, the LOEC/NOEC for mortality of the parent animals should also be reported;where appropriate, the ECx for reproduction and confidence intervals and a graph of the fitted model used for its calculation, the slope of the dose-response curve and its standard error;”S
tatis
tical
toxi
city
par
amet
ers
10AQUABASE Workshop 29.11.2006
Stat
istic
s in
Ris
k As
sess
men
t
0%
20%
40%
60%
80%
100%
0 0.5 1 1.5 2 2.5 3
Log (Dose/concentration)
Effe
ct
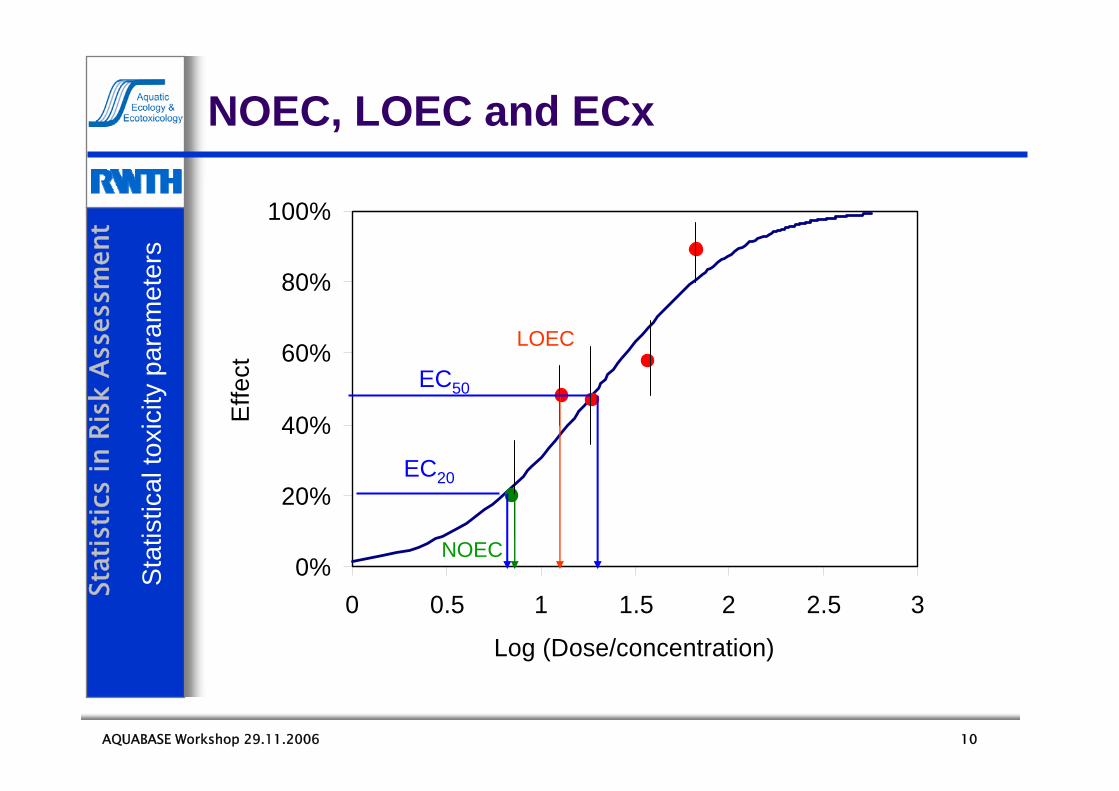
NOEC, LOEC and ECx
NOEC
LOEC
EC50
EC20
Sta
tistic
al to
xici
ty p
aram
eter
s
11AQUABASE Workshop 29.11.2006
Stat
istic
s in
Ris
k As
sess
men
tLOEC and NOEC (from OECD 211)
“Lowest Observed Effect Concentration (LOEC) is the lowest tested concentration at which the substance is observed to have a statistically significant effect on reproduction and parent mortality (at p < 0.05) when compared with the control, within a stated exposure period.”…
“No Observed Effect Concentration (NOEC) is the test concentration immediately below the LOEC, which when compared with the control, has no statistically significant effect (p < 0.05), within a stated exposure period.”S
tatis
tical
toxi
city
par
amet
ers
12AQUABASE Workshop 29.11.2006
Stat
istic
s in
Ris
k As
sess
men
tStatistical Procedures (OECD 211)
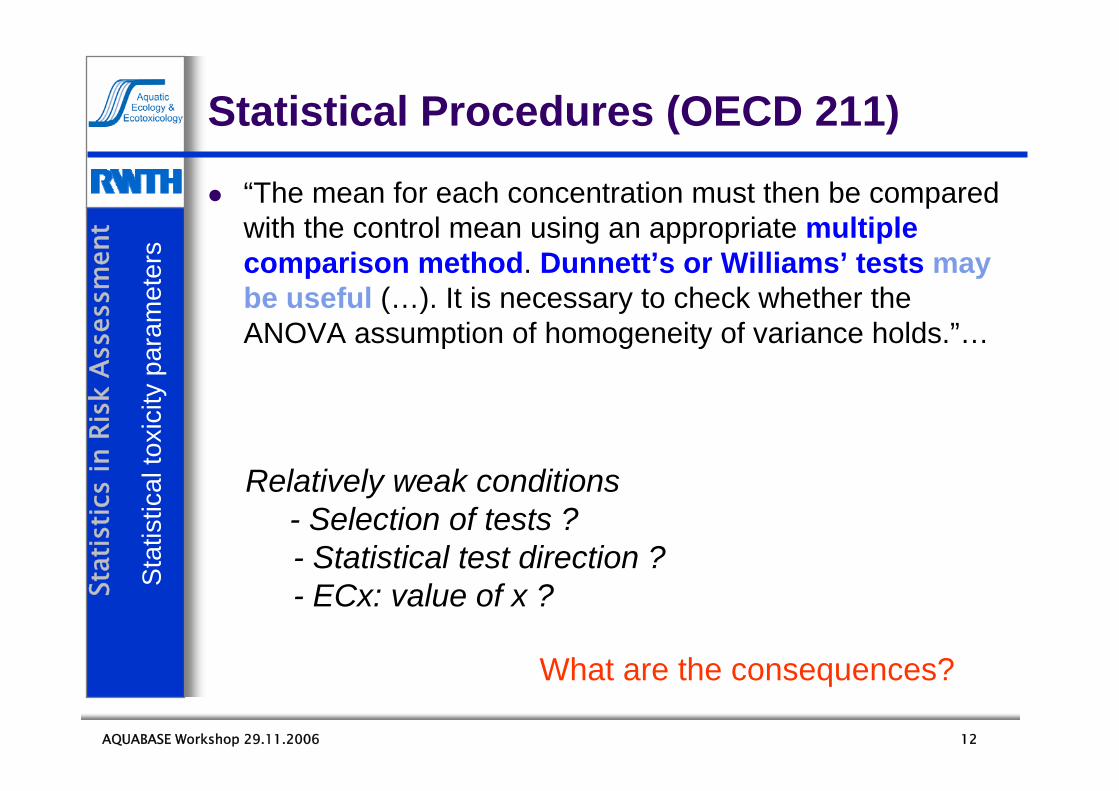
“The mean for each concentration must then be compared with the control mean using an appropriate multiple comparison method. Dunnett’s or Williams’ tests may be useful (…). It is necessary to check whether the ANOVA assumption of homogeneity of variance holds.”…
Relatively weak conditions- Selection of tests ?- Statistical test direction ?- ECx: value of x ?
What are the consequences?
Sta
tistic
al to
xici
ty p
aram
eter
s
13AQUABASE Workshop 29.11.2006
Stat
istic
s in
Ris
k As
sess
men
tToxicity Parameters and Data Scale
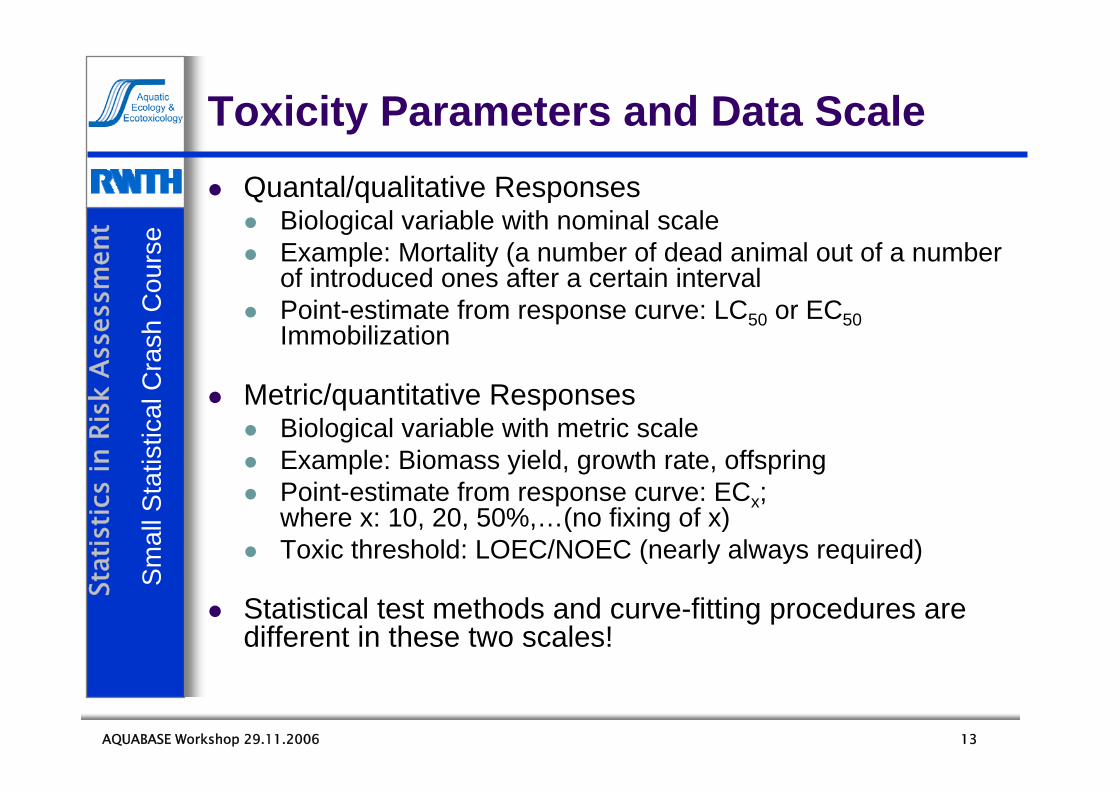
Quantal/qualitative Responses Biological variable with nominal scaleExample: Mortality (a number of dead animal out of a number of introduced ones after a certain intervalPoint-estimate from response curve: LC50 or EC50Immobilization
Metric/quantitative ResponsesBiological variable with metric scaleExample: Biomass yield, growth rate, offspringPoint-estimate from response curve: ECx;where x: 10, 20, 50%,…(no fixing of x) Toxic threshold: LOEC/NOEC (nearly always required)
Statistical test methods and curve-fitting procedures are different in these two scales!
Sm
all S
tatis
tical
Cra
sh C
ours
e
14AQUABASE Workshop 29.11.2006
Stat
istic
s in
Ris
k As
sess
men
tLOEC/NOEC Concept
Determined by hypothesis testing (statistical test)
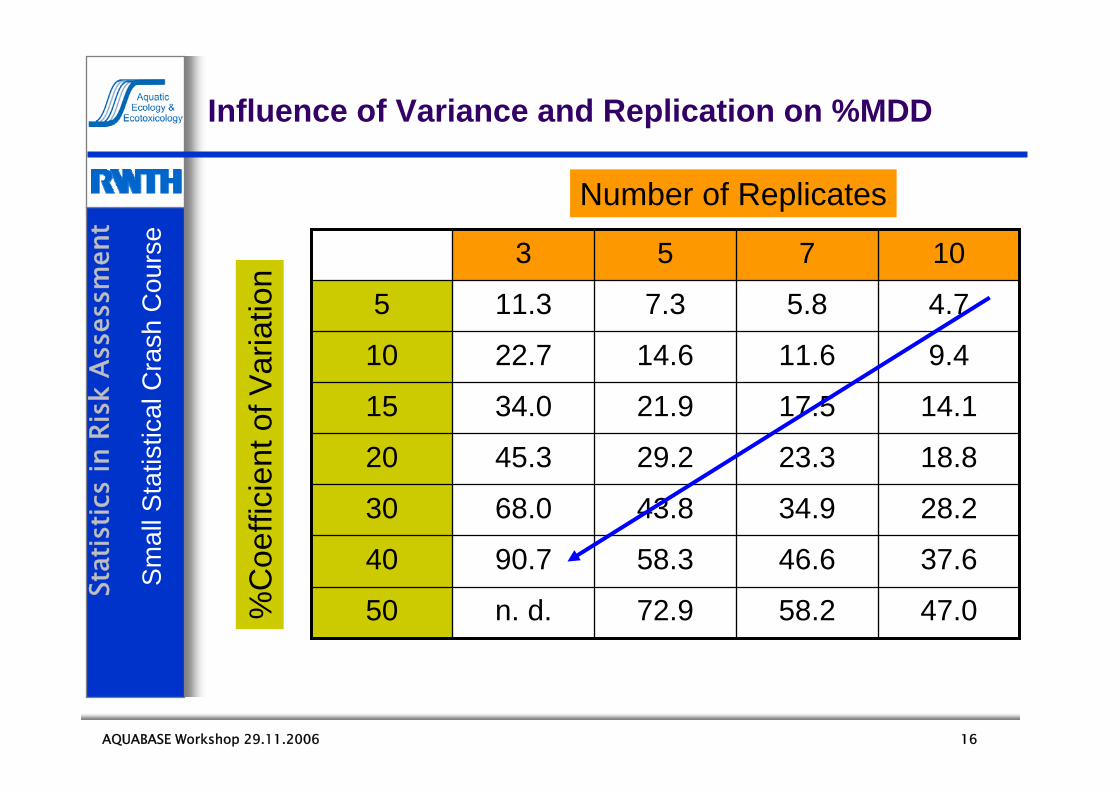
The difference between a treatment and the control that a statistical test is able “to see”, can be smaller or greater depending on the variable’s variance and the replication of test units
What’s about the minimum difference that can be detected by a statistical test?S
mal
l Sta
tistic
al C
rash
Cou
rse
15AQUABASE Workshop 29.11.2006
Stat
istic
s in
Ris
k As
sess
men
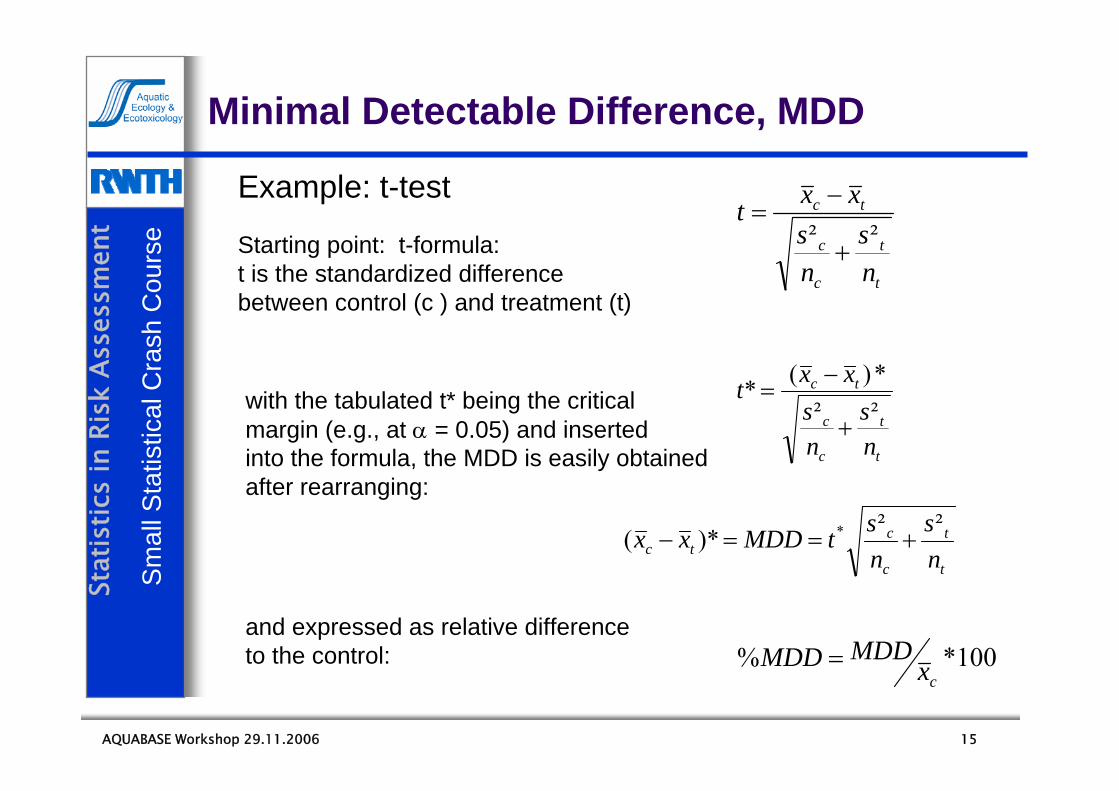
tMinimal Detectable Difference, MDD
t
t
c
ctc n
snstMDDxx ²²)*( * +==−
100*%cx
MDDMDD =
t
t
c
c
tc
ns
ns
xxt²²
+
−=
Starting point: t-formula:t is the standardized difference between control (c ) and treatment (t)
t
t
c
c
tc
ns
ns
xxt²²*)(*
+
−=with the tabulated t* being the critical
margin (e.g., at α = 0.05) and inserted into the formula, the MDD is easily obtainedafter rearranging:
and expressed as relative difference to the control:
Example: t-testS
mal
l Sta
tistic
al C
rash
Cou
rse
16AQUABASE Workshop 29.11.2006
Stat
istic
s in
Ris
k As
sess
men
tInfluence of Variance and Replication on %MDD
47.058.272.9n. d.50
37.646.658.390.740
28.234.943.868.030
18.823.329.245.320
14.117.521.934.015
9.411.614.622.710
4.75.87.311.35
10753%
Coe
ffici
ento
f Var
iatio
n
Number of ReplicatesS
mal
l Sta
tistic
al C
rash
Cou
rse
17AQUABASE Workshop 29.11.2006
Stat
istic
s in
Ris
k As
sess
men
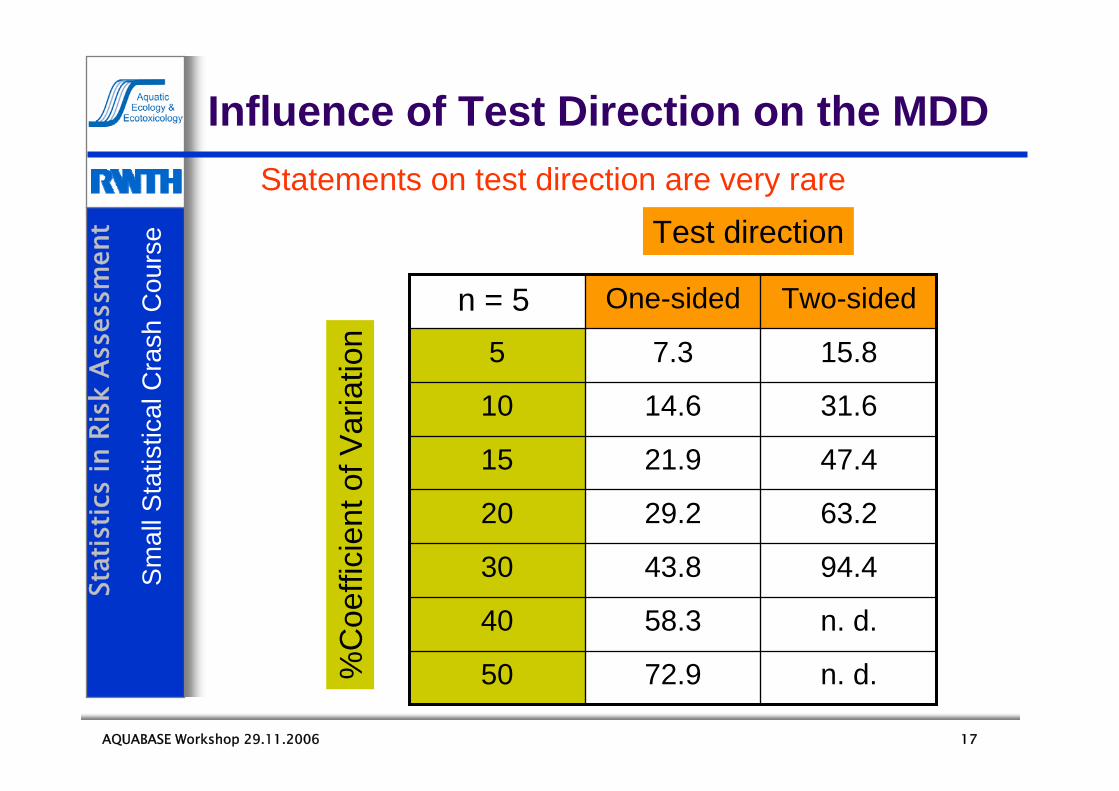
tInfluence of Test Direction on the MDD
n. d.72.950
n. d.58.340
94.443.830
63.229.220
47.421.915
31.614.610
15.87.35
Two-sidedOne-sided
Test direction
n = 5
Sm
all S
tatis
tical
Cra
sh C
ours
eStatements on test direction are very rare
%C
oeffi
cien
tof V
aria
tion
18AQUABASE Workshop 29.11.2006
Stat
istic
s in
Ris
k As
sess
men
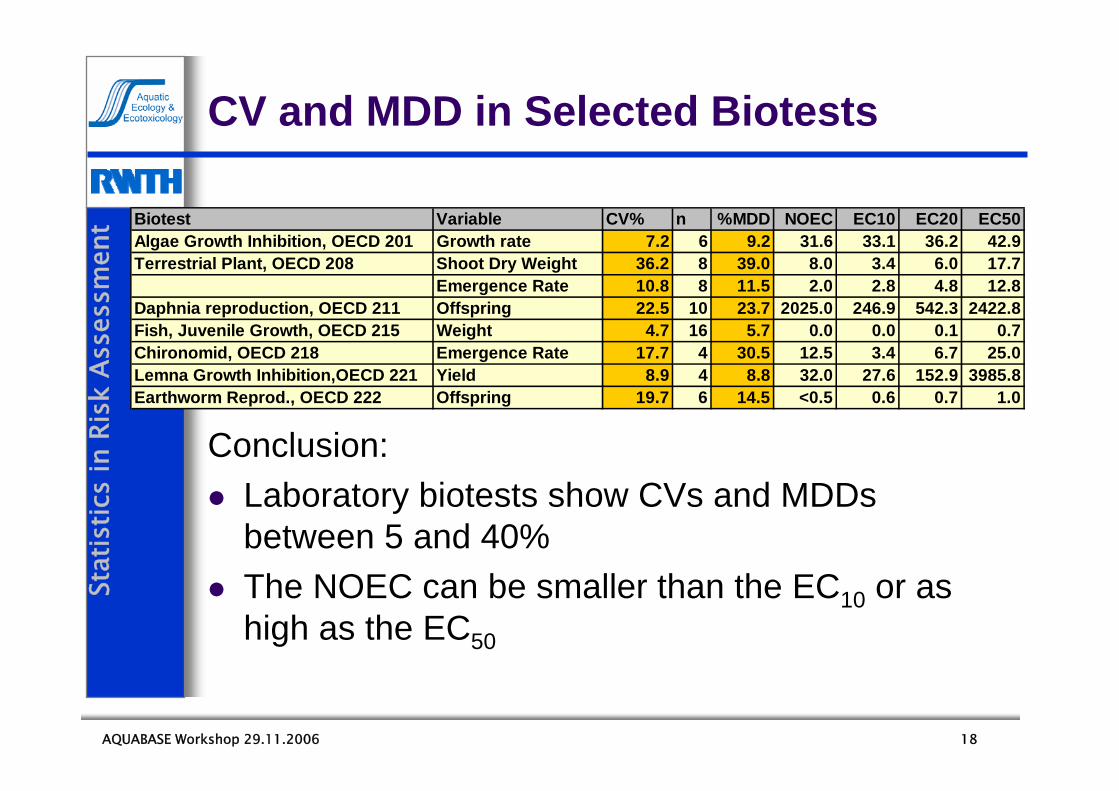
tCV and MDD in Selected Biotests
Conclusion:Laboratory biotests show CVs and MDDsbetween 5 and 40%The NOEC can be smaller than the EC10 or as high as the EC50
Biotest Variable CV% n %MDD NOEC EC10 EC20 EC50Algae Growth Inhibition, OECD 201 Growth rate 7.2 6 9.2 31.6 33.1 36.2 42.9Terrestrial Plant, OECD 208 Shoot Dry Weight 36.2 8 39.0 8.0 3.4 6.0 17.7
Emergence Rate 10.8 8 11.5 2.0 2.8 4.8 12.8Daphnia reproduction, OECD 211 Offspring 22.5 10 23.7 2025.0 246.9 542.3 2422.8Fish, Juvenile Growth, OECD 215 Weight 4.7 16 5.7 0.0 0.0 0.1 0.7Chironomid, OECD 218 Emergence Rate 17.7 4 30.5 12.5 3.4 6.7 25.0Lemna Growth Inhibition,OECD 221 Yield 8.9 4 8.8 32.0 27.6 152.9 3985.8Earthworm Reprod., OECD 222 Offspring 19.7 6 14.5 <0.5 0.6 0.7 1.0
19AQUABASE Workshop 29.11.2006
Stat
istic
s in
Ris
k As
sess
men
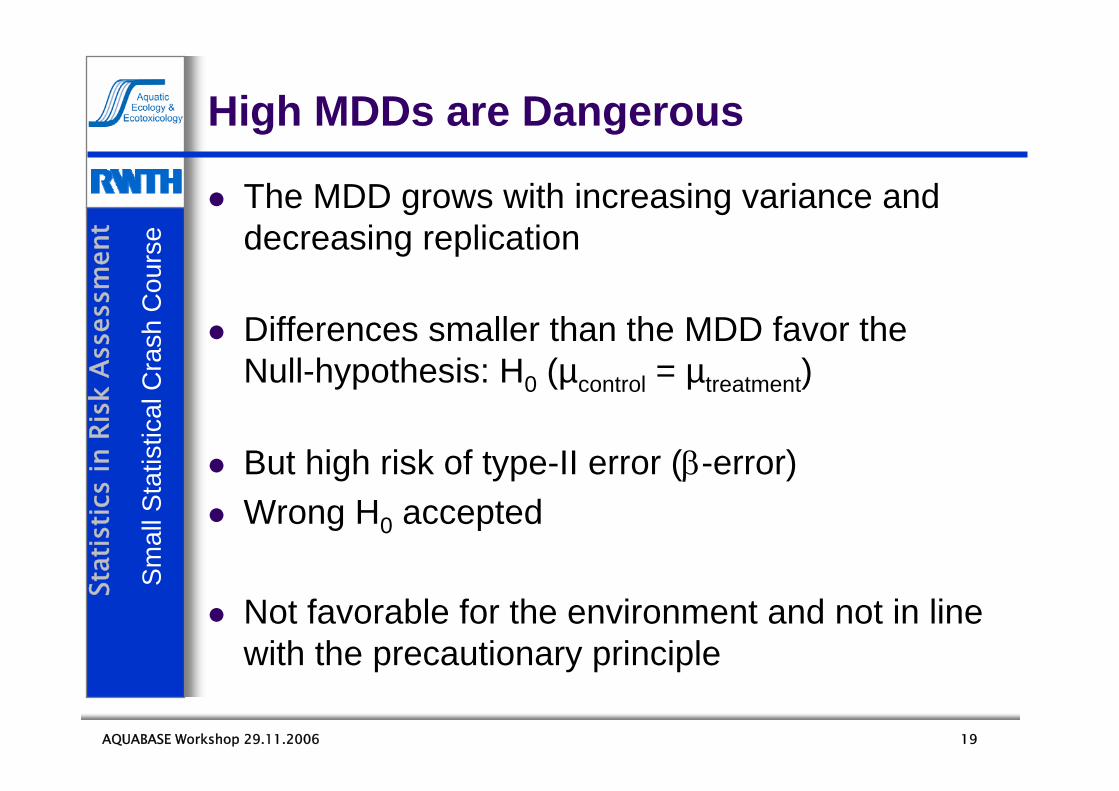
tHigh MDDs are Dangerous
The MDD grows with increasing variance and decreasing replication
Differences smaller than the MDD favor theNull-hypothesis: H0 (µcontrol = µtreatment)
But high risk of type-II error (β-error)Wrong H0 accepted
Not favorable for the environment and not in line with the precautionary principle
Sm
all S
tatis
tical
Cra
sh C
ours
e
20AQUABASE Workshop 29.11.2006
Stat
istic
s in
Ris
k As
sess
men
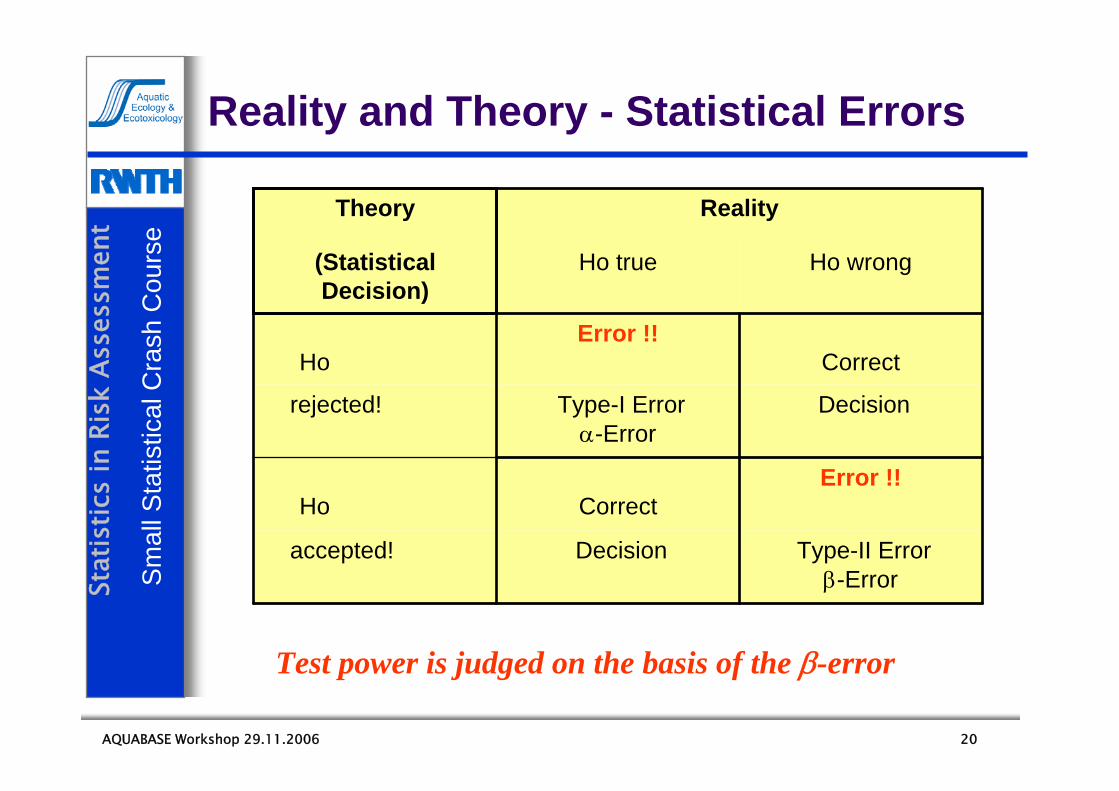
tReality and Theory - Statistical Errors
Test power is judged on the basis of the β-error
Sm
all S
tatis
tical
Cra
sh C
ours
e
Type-II Errorβ-Error
Decisionaccepted!
Error !!CorrectHo
DecisionType-I Errorα-Error
rejected!
CorrectError !!
Ho
Ho wrongHo true(StatisticalDecision)
RealityTheory
21AQUABASE Workshop 29.11.2006
Stat
istic
s in
Ris
k As
sess
men
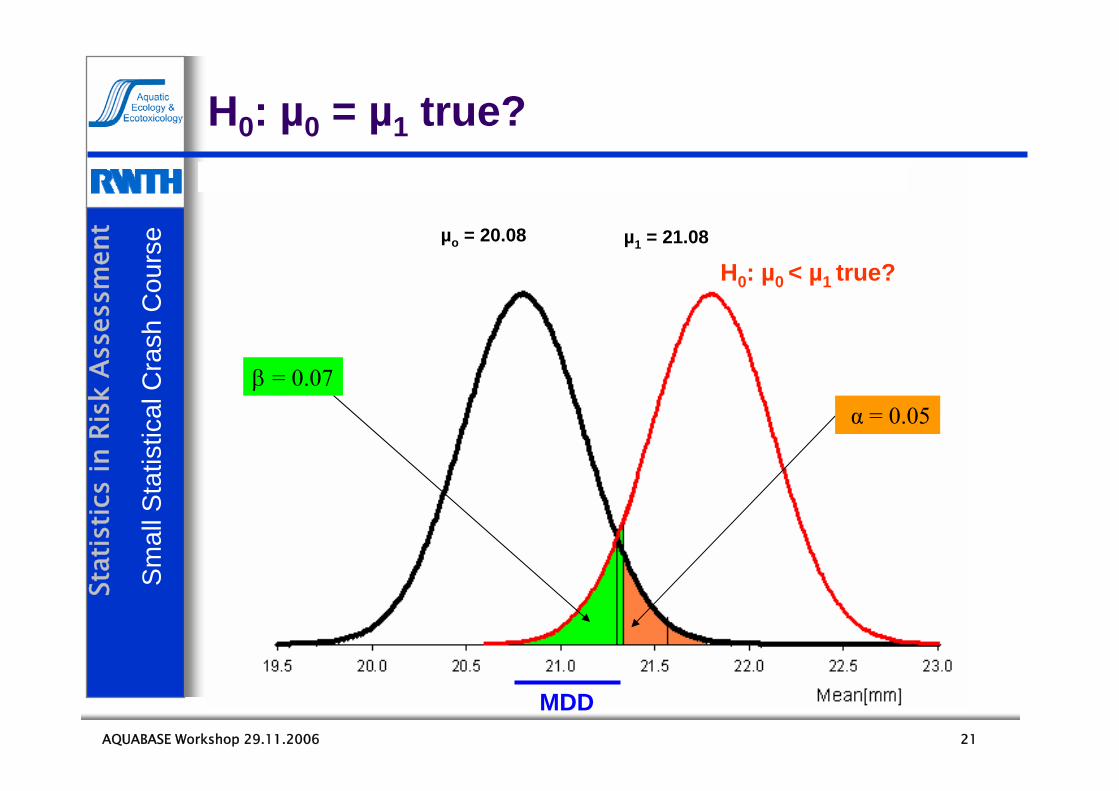
t µo = 20.08 µ1 = 21.08
α = 0.05β = 0.07
H0: µ0 = µ1 true?
H0: µ0 < µ1 true?
MDD
Sm
all S
tatis
tical
Cra
sh C
ours
e
22AQUABASE Workshop 29.11.2006
Stat
istic
s in
Ris
k As
sess
men
t
0.00
0.10
0.20
0.30
0.40
0.50
0.60
0.70
0.80
0.90
1.00
20.8 21 21.2 21.4 21.6 21.8 22 22.2 22.4 22.6 22.8
µ1 [mm]
ß-er
ror
0.00
0.10
0.20
0.30
0.40
0.50
0.60
0.70
0.80
0.90
1.00
Pow
er
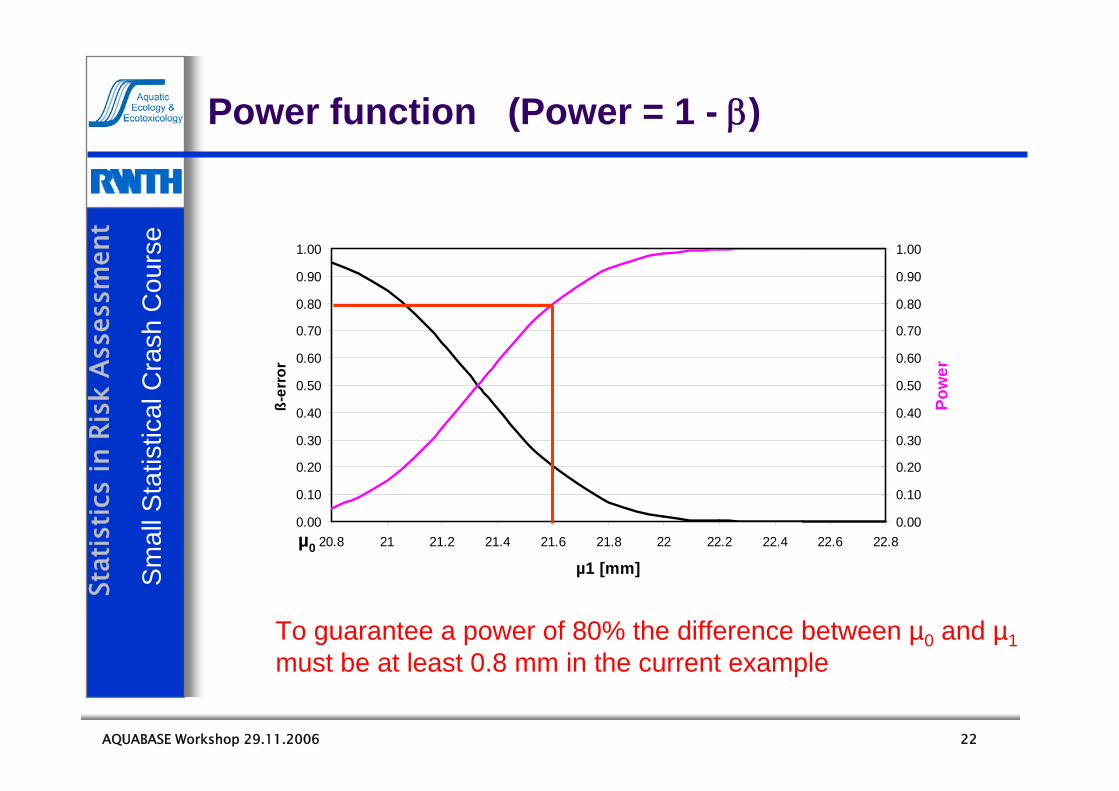
To guarantee a power of 80% the difference between µ0 and µ1 must be at least 0.8 mm in the current example
Power function (Power = 1 - β)
µ0
Sm
all S
tatis
tical
Cra
sh C
ours
e
23AQUABASE Workshop 29.11.2006
Stat
istic
s in
Ris
k As
sess
men
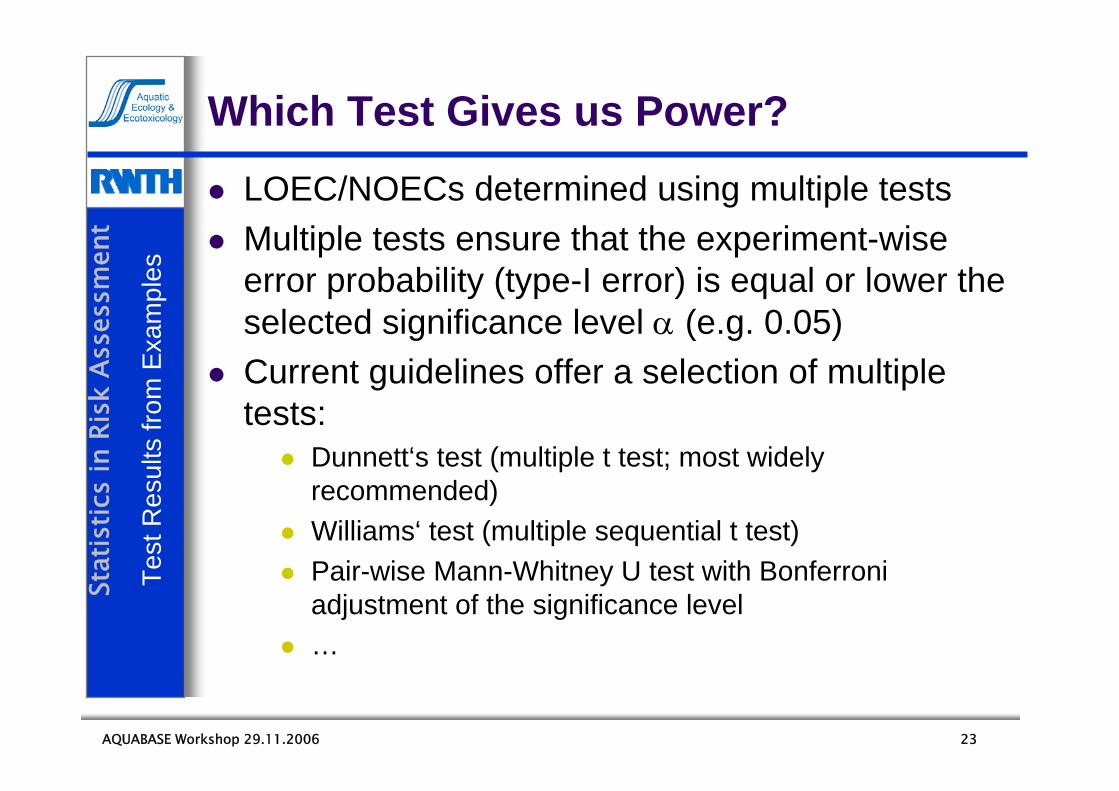
tWhich Test Gives us Power?
LOEC/NOECs determined using multiple tests Multiple tests ensure that the experiment-wise error probability (type-I error) is equal or lower the selected significance level α (e.g. 0.05)Current guidelines offer a selection of multiple tests:
Dunnett‘s test (multiple t test; most widely recommended)Williams‘ test (multiple sequential t test)Pair-wise Mann-Whitney U test with Bonferroni adjustment of the significance level…
Test
Res
ults
from
Exa
mpl
es
24AQUABASE Workshop 29.11.2006
Stat
istic
s in
Ris
k As
sess
men
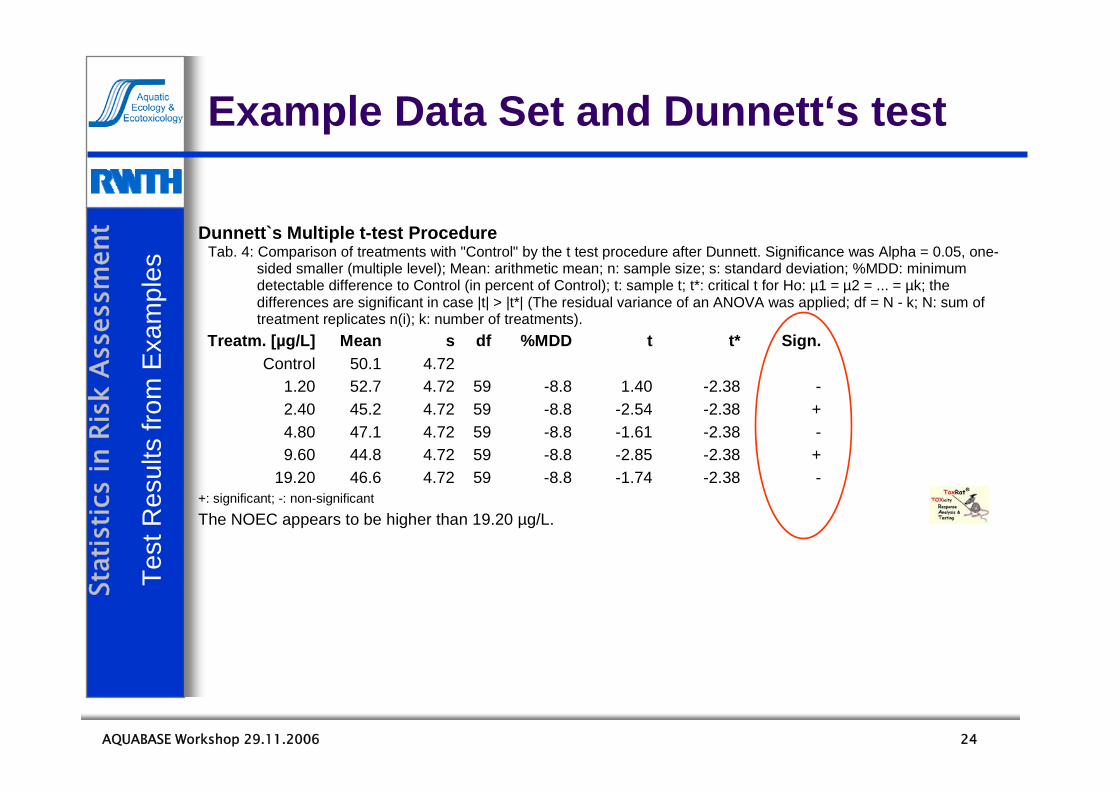
tExample Data Set and Dunnett‘s test
Dunnett`s Multiple t-test ProcedureTab. 4: Comparison of treatments with "Control" by the t test procedure after Dunnett. Significance was Alpha = 0.05, one-
sided smaller (multiple level); Mean: arithmetic mean; n: sample size; s: standard deviation; %MDD: minimum detectable difference to Control (in percent of Control); t: sample t; t*: critical t for Ho: µ1 = µ2 = ... = µk; the differences are significant in case |t| > |t*| (The residual variance of an ANOVA was applied; df = N - k; N: sum of treatment replicates n(i); k: number of treatments).
Treatm. [µg/L] Mean s df %MDD t t* Sign. Control 50.1 4.72 1.20 52.7 4.72 59 -8.8 1.40 -2.38 - 2.40 45.2 4.72 59 -8.8 -2.54 -2.38 + 4.80 47.1 4.72 59 -8.8 -1.61 -2.38 - 9.60 44.8 4.72 59 -8.8 -2.85 -2.38 + 19.20 46.6 4.72 59 -8.8 -1.74 -2.38 - +: significant; -: non-significant
The NOEC appears to be higher than 19.20 µg/L.
Test
Res
ults
from
Exa
mpl
es
25AQUABASE Workshop 29.11.2006
Stat
istic
s in
Ris
k As
sess
men
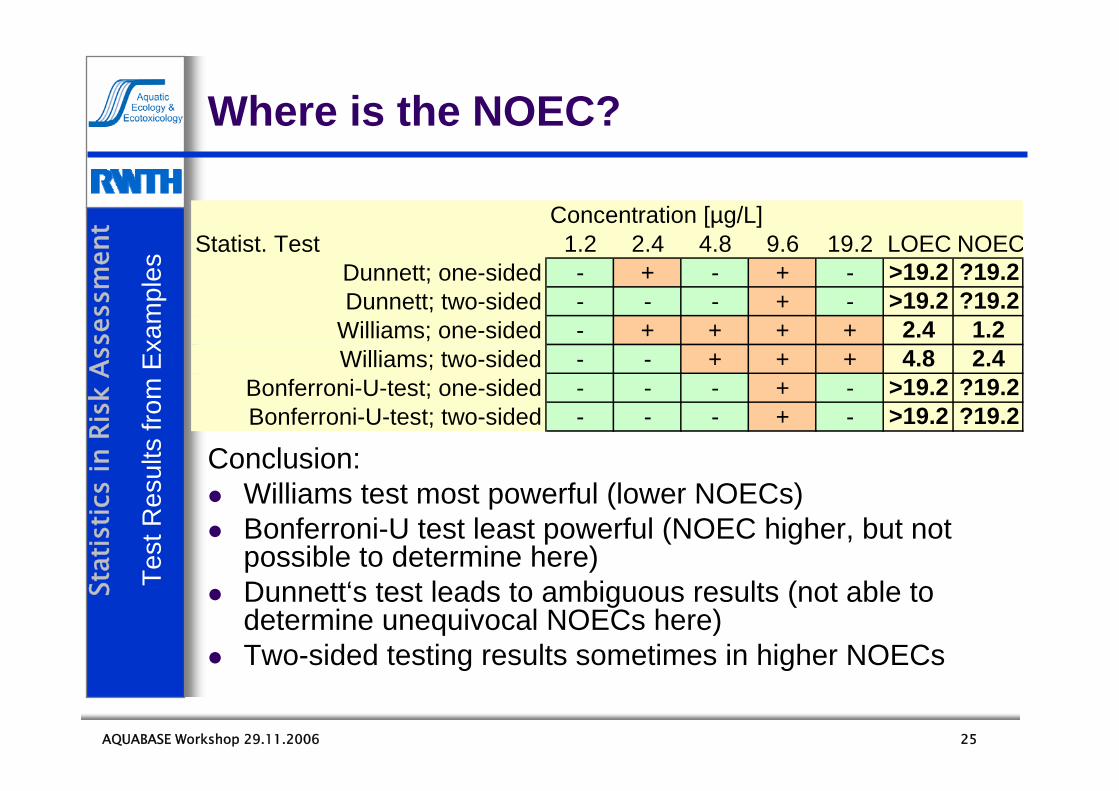
tWhere is the NOEC?
Conclusion:Williams test most powerful (lower NOECs)Bonferroni-U test least powerful (NOEC higher, but not possible to determine here)Dunnett‘s test leads to ambiguous results (not able to determine unequivocal NOECs here)Two-sided testing results sometimes in higher NOECs
Concentration [µg/L]Statist. Test 1.2 2.4 4.8 9.6 19.2 LOEC NOEC
Dunnett; one-sided - + - + - >19.2 ?19.2Dunnett; two-sided - - - + - >19.2 ?19.2
Williams; one-sided - + + + + 2.4 1.2Williams; two-sided - - + + + 4.8 2.4
Bonferroni-U-test; one-sided - - - + - >19.2 ?19.2Bonferroni-U-test; two-sided - - - + - >19.2 ?19.2
Test
Res
ults
from
Exa
mpl
es
26AQUABASE Workshop 29.11.2006
Stat
istic
s in
Ris
k As
sess
men
tNew Findings ?
NoOECD (1998) - Report on the OECD workshop on statistical analysis of aquatic toxicity data. “It was concluded that the NOEC, as the main summary parameter of aquatic ecotoxicity tests, is inappropriate for a number of reasons (…) and should therefore be phased out. It was recommended that the OECD should move towards a regression-based estimation proce-dure .“ …” A steering group should be set up to direct the mathematical, statistical and biological work required to take the workshop recommendations forward. This group should include representatives from the appropriate scientific and regulatory communities.”
NO
EC
ver
sus
EC
x
27AQUABASE Workshop 29.11.2006
Stat
istic
s in
Ris
k As
sess
men
tOECD (1998) Against NOEC
The NOEC must be one of the test concentrations.No precision statements are possible for the NOEC.NOECs may correspond to large effects on test organisms.The NOEC will not be obtainable in all cases.
“The above points indicate that the NOEC is far from ideal as a summary measure of toxic effect. It is too heavily dependent on the experimental design and the variability in the data. Consequently the NOEC may correspond to large effects, possibly of biological significance. Its value in hazard assessment is questionable.”
Pro NOEC: Simple calculation and use
NO
EC
ver
sus
EC
x
28AQUABASE Workshop 29.11.2006
Stat
istic
s in
Ris
k As
sess
men
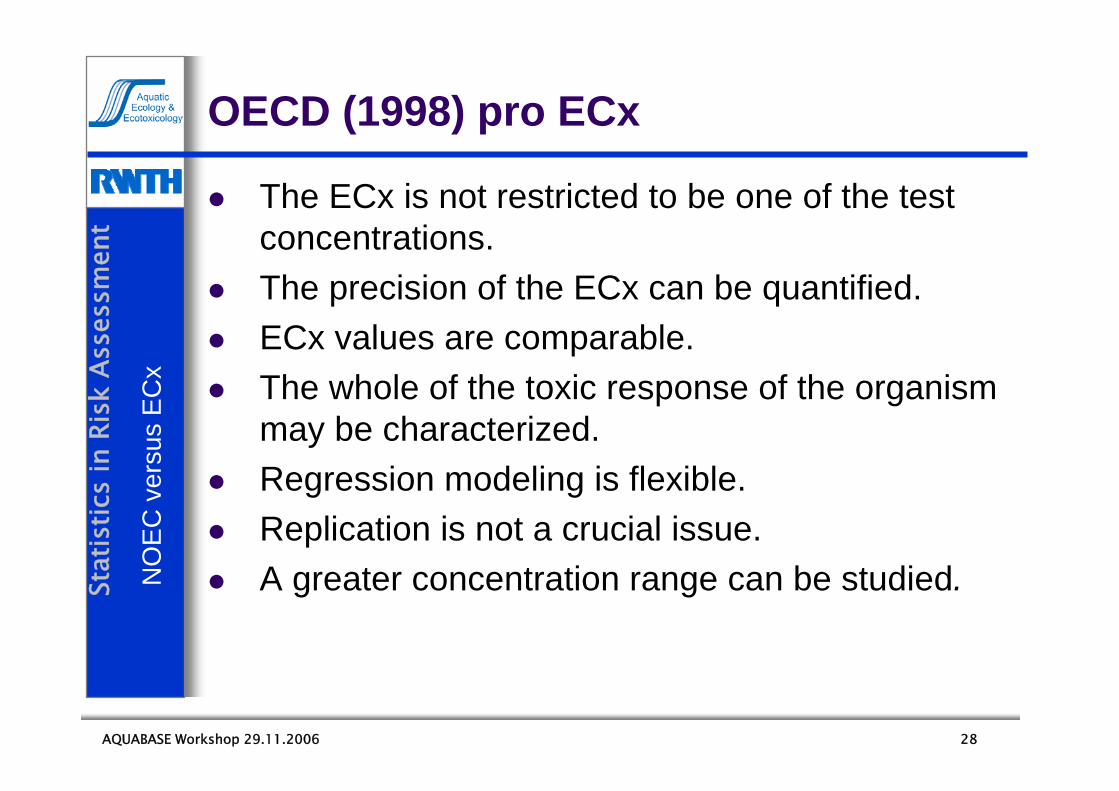
tOECD (1998) pro ECx
The ECx is not restricted to be one of the test concentrations.The precision of the ECx can be quantified.ECx values are comparable.The whole of the toxic response of the organism may be characterized.Regression modeling is flexible.Replication is not a crucial issue.A greater concentration range can be studied.N
OE
C v
ersu
s E
Cx
29AQUABASE Workshop 29.11.2006
Stat
istic
s in
Ris
k As
sess
men
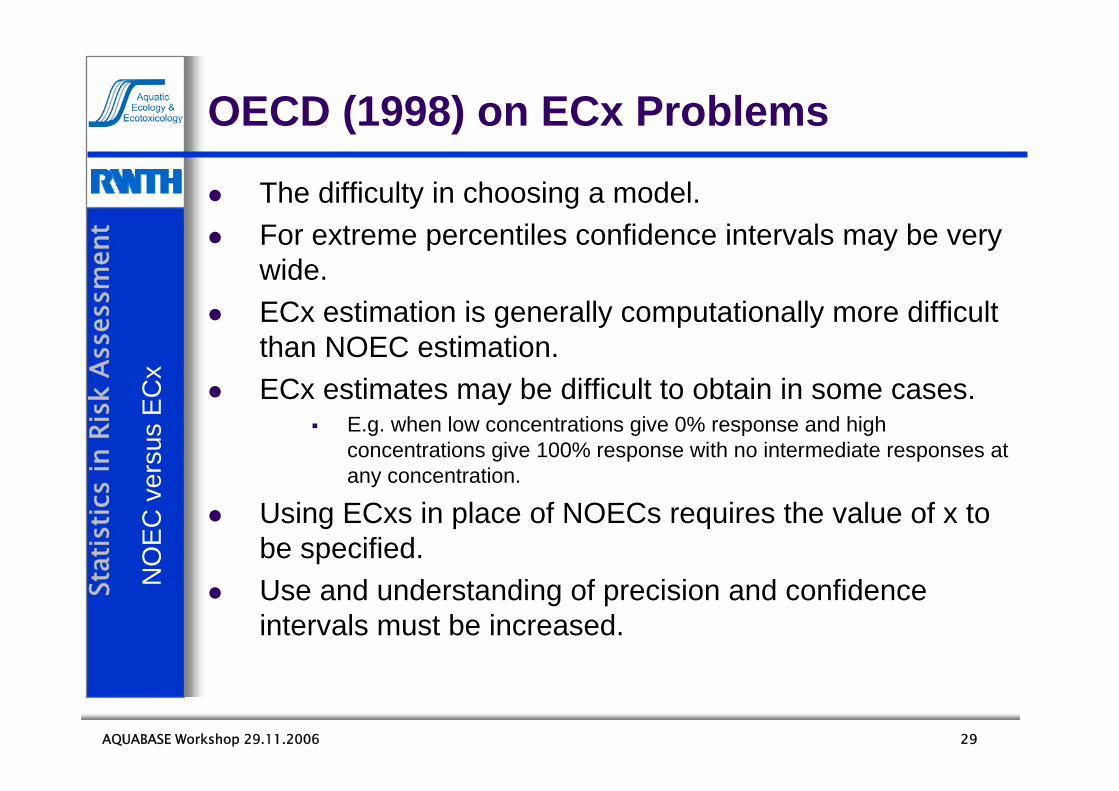
tOECD (1998) on ECx Problems
The difficulty in choosing a model.For extreme percentiles confidence intervals may be very wide.ECx estimation is generally computationally more difficult than NOEC estimation.ECx estimates may be difficult to obtain in some cases.
E.g. when low concentrations give 0% response and high concentrations give 100% response with no intermediate responses at any concentration.
Using ECxs in place of NOECs requires the value of x to be specified.Use and understanding of precision and confidence intervals must be increased.
NO
EC
ver
sus
EC
x
30AQUABASE Workshop 29.11.2006
Stat
istic
s in
Ris
k As
sess
men
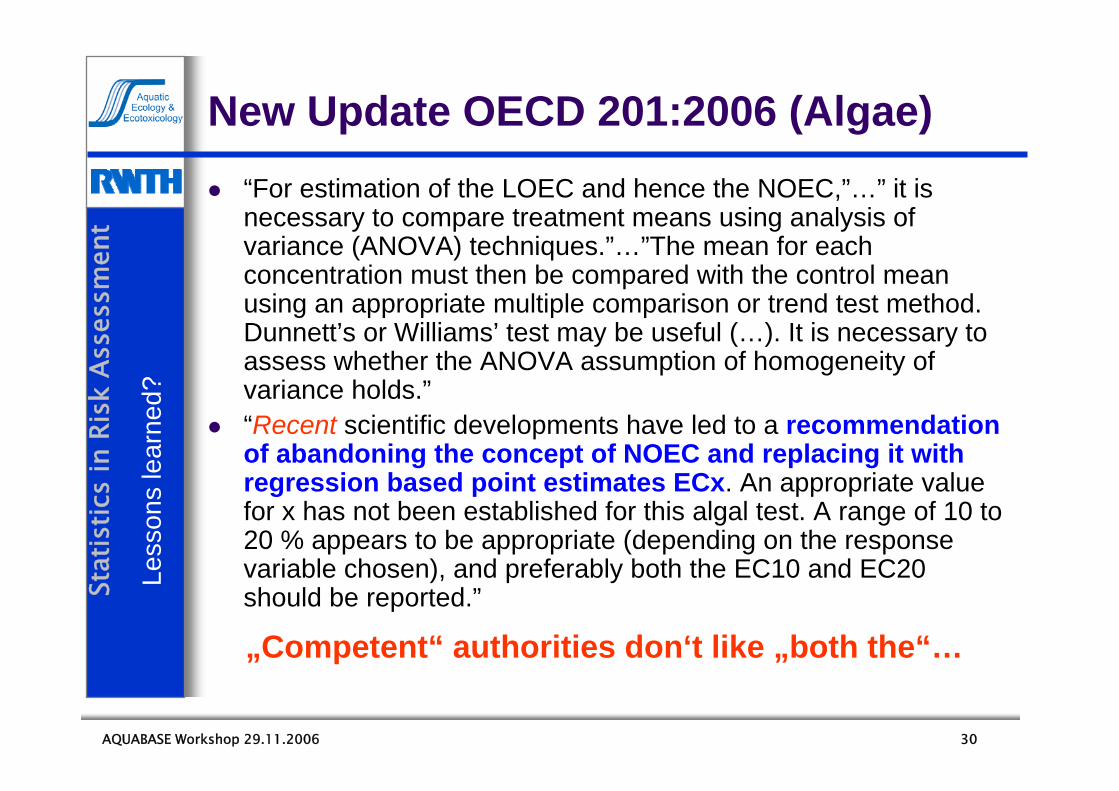
tNew Update OECD 201:2006 (Algae)
“For estimation of the LOEC and hence the NOEC,”…” it is necessary to compare treatment means using analysis of variance (ANOVA) techniques.”…”The mean for each concentration must then be compared with the control mean using an appropriate multiple comparison or trend test method. Dunnett’s or Williams’ test may be useful (…). It is necessary to assess whether the ANOVA assumption of homogeneity of variance holds.”“Recent scientific developments have led to a recommendation of abandoning the concept of NOEC and replacing it with regression based point estimates ECx. An appropriate value for x has not been established for this algal test. A range of 10 to 20 % appears to be appropriate (depending on the response variable chosen), and preferably both the EC10 and EC20 should be reported.”
„Competent“ authorities don‘t like „both the“…
Less
ons
lear
ned?
31AQUABASE Workshop 29.11.2006
Stat
istic
s in
Ris
k As
sess
men
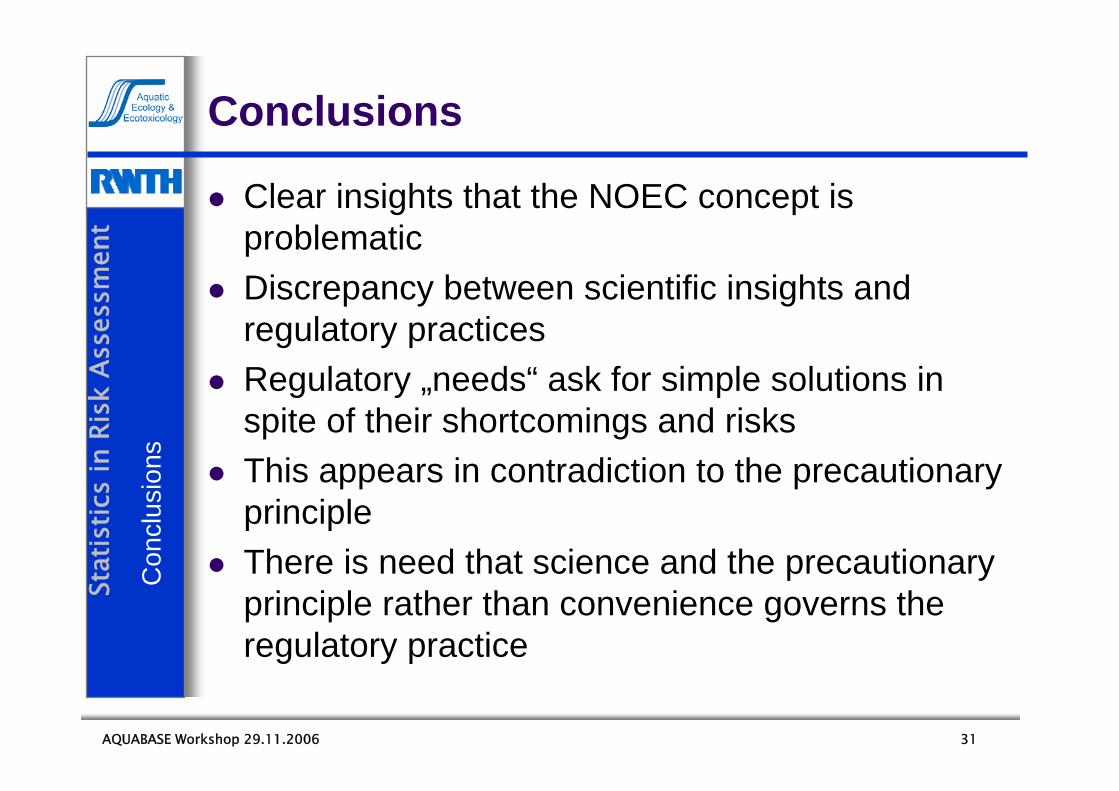
tConclusions
Clear insights that the NOEC concept is problematicDiscrepancy between scientific insights and regulatory practicesRegulatory „needs“ ask for simple solutions in spite of their shortcomings and risksThis appears in contradiction to the precautionary principleThere is need that science and the precautionary principle rather than convenience governs the regulatory practice
Con
clus
ions


![Environment Statistics Self-Assessment Tool (ESSAT)unstats.un.org/unsd/ENVIRONMENT/FDES/PartII_ESSAT.pdf · Environment Statistics Self-Assessment Tool (ESSAT) ... andecological[ecosystems,biomes,basins])](https://img.pdfslide.net/doc/110x75/5b1475197f8b9a2a7c8d35e1/environment-statistics-self-assessment-tool-essat-environment-statistics-self-assessment.jpg)