Embed Size (px)
Citation preview

STATISTICS OF INCOME . . . 1954
for 1954
U. s. TREASU RY DEPARTMENT • INTERNAL RI~VENUE SERVICE
"
~-t...!';;".:.~
i.;.
~~.'!k...~,
~;~ ... ,
~~ ;

Statistics of Income
IndividualINCOME TAX
RETURNS
1954
U. S. TREASURY DEPARTMENT
for 1954
Prepared under the direction of the
Commissioner of Intl~rnal Revenue
by the Statistics Division
Internal Revenue Service • Publication No. 79

UNITED STATES
GOVERNMENT PRINTING OFFICE
WASHINGTON 1957
For sale by the Superintendent of Documente, U. S. Government Printing Office, 'Washington 25, D. C. ~ Price 75 cents (paper cover)

LETTER OF TRANSMITTAL
TREASURy])j.;PARTl\U:NT,
OFFICE 01" COMl\USSIONI.:R OF INTERNAL HEVENUE,
Washington, D. C., October 1212, 1957.
SIR: In compliance with the provisions of section 6108 of the Internal Revenue Code of 1954, which states that statistics shall be published annually withrespect to the operation of income tax laws, I have the honor to submit this report for Statistics of Income-1951" Individula,l Income Tam Returns f01' 1954.Information relative to sources of income, items of deductions, exemptions, taxcredits, and tax liability is tabulated by various classificatiom of income andtaxpayers.
Emphasis has been given to several new features of the 1954 Code, such asexclusions from gross income for sick pay and dividends, retirement income andmedical costs for signifit;lant age groups, contributions in excess of 20 percent ofadjusted gross income, and the marital status for a surviving spouse. As theamount of taxable income was either reported or computed for each type ofindividual return, it was possible for the first time to classify the returns by thesize of the tax base and to group them according to the applicable tax rate.
Respectfully,RUSSl<;LL C. HAURINGTON,
Cmnmissione1' of Internal Revenue.
HONORABLE Rom;uT B. ANDEusON,Secretary of the Treasury.
III
OTHER STATISTICS OF INCOME PUBLICATIONSFOR 1954
Corporations
Individuals
Fiduciaries
Estates
Preliminary Statistics oj Income, 195J,.-Oorporat·ion IncomeTax Returns
Income statements, balance sheets, tax, dividends paid; classifiedby major industry groups. Historical summary of total compiledreceipts, profit or loss, taxes, dividends paid by net income status,1950-54. (39 pp" 30¢)
Statistics oj Income, 195J,.-Oorporation Income Tax ReturnsIncome statements, balance sheets, taxes, dividends paid, taxcredit. Classifications by industry groups, size of net income, sizeof total assets, accounting periods, accounting and inventoryvaluation methods. Special tables on beginning and ending inventories of manufacturing and trade corporations, cash dividendspaid, corporations filing first returns, returns with foreign taxcredits, Western Hemisphere trade corporations, personal holdingcompanies. Historical summary 1945-54.
Preliminary Statistics oj Income, 195J,.-Individual IncomeTax Returns
Adjusted gross income, taxable income, income tax liability,sources of income, exemptions, tax credits, itemized nonbusinessdeductions; classified by size of adjusted gross income. Selectedsources of income by States and Territories. (20 pp., 20¢)
Statistics oj Income, l.95J,.-Fiduciary Income Tax ReturnsTotal income, taxable income, income tax, sources of income, deductions, exemptions; classified by size of total income. Selectedsources of in.pome by States and Territories. Taxable income andincome tax by size of taxable income.
Stati,stics oj Income, 195J,.-Estate Tax ReturnsGross estate, deductions, net estate, taxes, and tax credits. Classifications by size of gross estate, size of net estate before specificexemptions. Selected estate tax data by States and Territories.(26 pp., 25¢)
Partnerships
Farmers' cooperatives
Sole proprietorships
FOR 1953
(Subjects not included for 1954)Statistics oj Income jor 1953, Part 1, Individual Income TaxReturns, Estate Tax Returns, Gift Tax Returns
Sole proprietorship income, business receipts, net profit or loss.Classifications by size of total receipts, industry groups. (138pp., 75¢)
Statistics oj Income, 1953-Partnership ReturnsPartnership receipts, deductions, profit and loss, assets, liabilities.Classifications by industry groups, size of ordinary net income ordeficit, size of total receipts. Frequency of returns by year oforganization, new or successor business Self-employment incomeand family partnership data. (62 pp., 45¢)
Statistics oj Income, 1953-Farmers' Oooperative Income TaxReturns
Receipts, deductions, net income or deficit, tax, assets, liabilities.special deductions and adjustments. Classifications by size ofbusiness receipts, size of total assets, net income status, States andTerritories, type of service performed, exemption status. (42 pp.,40¢)
Gifts Statistics oj Income jor 1953, Part 1, Individual Income TaxReturns, Estate Tax Returns, Gift Tax Returns
Total gifts, exclusions, deductions, net gifts, tax. Classificationsby size of net gifts, size of total gifts plus gift tax, tax status, typeof property. (138 pp., 75¢)
Stali,'ltics of Income publications are for sale by the Superintendent of Documents, U. S.Government Printing Office, Washington 25, D. C.
IV

CONTENTSPage
Introduction_______________________________________________________________ 1
INDIVIDUAL INCOME TAX RETURNSCharacteristics of the year ___________________________________________________ 5
Composition of adjusted gross income_ ________________________________________ 8Individual income tax provisions for 1954 ·______________ 8
Returns from which data were tabulatedc
____________________ 9
Marital status of taxpayer ___________________________________________________ 11Personal exemptions "_ _________ 11
Salary exclusions for sick pay_________________________________________________ 12Dividends received___ __ ___ ___ ___ ___ __ ___ __ __ ___ 12
Contributions______________________________________________________________ 15Drug and medical costs_ __________________________________________________ ___ 17Retirement income____ __ _______ __ ___ ___ ____ __ _______ _ __ ___ 17
Tabulated data_____________________________________________________________ 19
Description of sample and limitations of data________________________ 21Explanation of classifications and terms_ _______________________________________ 23
Classification of individual returns_ _____________________________ __________ 23Sources comprising adjusted gross income_ _________________________________ 24Itemized nonbusiness deductions_____ __ ______ ___ __ __ __ __ 26Exemptions____________________________________________________________ 27Measures of individual income____________________________________________ 28Tax items_ _____________________________________________________________ 28
Basic tables, 1954:1. Number of return", adjusted gross income, taxable income, and income tax,
by adjusted gross income classes and classes cumulated_ _____________ 332. Sources of income and loss and nonbusiness deductions, by returns with
standard or itemized deductions ._ __________ 343. Sources of income and loss and nonbusiness deductions, by adjusted gross
income classes ::.---------- 354. Sources of income and loss, exemptions, and tax items-all returns, joint
returns, and other returns, by adjusted gross income classes -=-_______ 365. Itemized nonbusiness deductions, exemptions, and tax items, by adjusted
gross income classes-returns with itemized deductions_ _____________ 486. Number of returns by size of source and by adjusted gross income c1asses_ __ 507. Number of returns by size of nonbusiness deduction and by adjusted gross
income classes_ _________________________________________ __________ 55
8. Taxable income, tax credits, and income tax, by taxable incom.e classes forapplicable tax rates_ _____________________________________ __________ 56
9. Adjusted gross income, taxable income, income tax, average tax,and effectivetax rate, by types of income tax and by adjusted gross income classes____ 58
10. Adjusted gross income, exemptions, taxable income, and income tax, bymarital status of taxpayer, by returns with standard or itemized deduc-tions, and by adjusted gross income classes_ ________________ __________ 59
11. Exemptions by marital status of taxpayer and by adjusted gross income~Iasses-------------------------------;-__________________________ 65
12. Capital gains and losses, short- and long-term, and capital loss carryover,by adjm,ted gross income classes_ ___________________________________ 69
13. Selected sources of income by' States and Territories_ ____________________ 7114. Adjusted gross income and income tax, by States and Territories. and by
adjusted gross income classes_ ______________________________________ 7215. Returns with self-employment tax-adjusted gross income and self-employ-
ment tax, by adjusted gross income classes___________________________ 7516. Returns with self-employment tax-adjusted gross income and self-employ-
ment tax, by States and Territories ._ __________ 76
Historical tables, 1945-54:17. Number of returns by major characteristics, adjusted gross income, deficit,
and tax ________________________________________________ __________ 79
v

VI CONTENTS
Historical tables, 1945-54-Continued18. Returns with income tax-number, adjusted gross income, income tax, and Page
average tax, by adjusted gross income classes_________________________ 8019. Sources of income by type - - - - - - ____________________ 8120. Selected sources of income by adjusted gross income classes_______________ 8221. Itemized deductions by type - - - - - - _- - - - - _- - - - - - _- - - - - - __________ 8422. Returns with adjusted gross income--number, adjusted gross income, and
income tax, by States and Territories ~ _________________________ 85
SYNOPSIS OF TAX LAWSIncome tax:
A. Requirement for filing return and exemptions___ _________________________ 89B. Income tax rates____ __________ _________ _____ __ ____________ _______ _ 90
Self-employment tax:C. Requirement for filing return and tax rate______________________________ 91
FACSIMILES OF TAX RETURNS, 1954
Form 1040, Individual Income Tax Return_____________________________________ 95Form 1040A, Individual Income Tax Return___________________________________ 125
INDEXAlphabetical index__________________________________________________________ 129

INTRODUCTION
This is one of several reports issued for Statistics of Income-1.95J,. in whichdata for Individual Income Tax Returns are published in a separate volume.Formerly, statistical data for individual income tax returns were included inthe annual report, Statistics of Income, Pari 1.
Information in this report was taken from individual income tax returnsfiled for the income year 1954 on Forms 1040, whether long- or short-forms, andon Form 1040A, the new card-form for income under $5,000. Although thesethree types of returns varied in form and content, it was possible to integratethe data reported on each, so that the tabulations are a complete coverage forall individual returns.
Many new items resulted from changes in the law under the 1954 Code.Several of the text tables are devoted to such features. In addition, there aresixteen basic tables giving comprehensive data distributed by significant classifications. No data were compiled this year from the business schedule C or t.hefarm schedule 1040F attached to the retul'l1 of a sole proprietor. Followingthe basic tables, there are six historical tables with impOltant. information assembled for the most recent 10-year period.
A brief synopsis of the tax law, relating to individual income under recentacts, covering filing requirements, exemptions, income tax and self-employmenttax rates, follows the statistical tables.
Facsimiles of Individual Income Tax Returns, Form 1040 and Form 1040A,for 1954 are inserted at the end of the report.
On August 21,1957, a Preliminary Report, Statistics of Income-195J,., Individual Income Tax Returns was issued containing four tables which are included in this report without change as tables 1, 4, 5, and 13.
1


IndividualI
Income T~x
Returns


INDMDUAL INCOME TAX RETURNS FOR 1954
CHARACTERISTICS OF THE YEAR
The total number of individual income tax returnsfiled for the income year 1954 was 56.7 million, a decrease of over one million from the all-time highfiled for 1953. There were 42.6 million returns with income tax after credits and 14.1 million with no incometax liability for 1954.
Adjusted gross income of $230.2 billion, reported on56.3 million returns, was larger than for any previousyear. This adjusted gross income exceeded that for1953 by nearly $400 million, even though there were1.1 million fewer 1954 returns with adjusted gross income. An adjusted gross deficit of $1 billion was reported on over 400 thousand 1954 returns with no adjusted gross income. This deficit was 12 percent lessthan that for the previous year although there was a4 percent increase in the number of deficit returns for1954. The net amount of adjusted gross income forthe 56.7 million 1954 returns was $229.2 billion, whichwas about $500 million above the. corresponding amountfor 1953.
Taxable income, the tax base under the 1954 Code,was $115.3 billion on 42.8 million returns, some of whichhad no income tax liability after credits. Unlike 1953,the tax base was either reported on. or computed foreach 1954 return.
Tabl. A.-NUMBER OF RETURNS. INCOME. DEFICIT. AND TAXE8: 195. AND·1958
Increase or
1953decrease
Items 1954(adJusted) Number or Percent
amount
All returns:-1.9Nwnber of returns .....•••.•.•....... 56,747,008 57,838,184 -1,091,176
_ Adjusted gross incomethousand dollars .. 230,235,855 229,863,409 +372,446 +.2
Adjusted gross deficit·1,155,153 -140,673 -12.2thousand dollars .• 1,014,480
Self-employment tax226,614 +74,884 +33.0thousand dollars .• 301,498
Taxable returns:-3.5Nwnber of returns •.•.•.••••••••••••. 42,633,060 44,159,622 -1,526,562
Adjusted gross income210,483,602 -814,772 -.4thousand dollars .• 209 ,668,830
Income tax ........ thousand dollars •• 26,665,753 29,430,659 -2,764,906 -9.4
Nontaxable returns:Total number of returns ..........•.. 14,113,948 13,678,562 +435,386 +3.2With adjusted gross income:
13,256,263 +417,381 +3.1Number of returns•.........•...... 13,673,644Adjusted gross income
19,379,807 +1,187,218 +f>.1thousand dollars •• 20,567,025With no adjusted gross income:
+18,005 +4.3Number of returns •................ 440,304- 422,299Adjusted gross deficit
1,155,153 -140,673 -12.2thousand dollars .• 1,014,480
Income tax liability for 1954, reported on 42.6 milliontaxable returns, was $26.7 billion after the tax creditswere deducted. The income tax after credits was 9percent, or $2.8 billion, below that for 1953. Severalreasons contribute to the decrease. Direct causes were1.5 million fewer returns with income tax for 1954, lower
income tax rates than for 1953, and two new tax creditsgranted under the 1954 Code. Other contributingcauses were liberalized nonbusiness deductions andl ex-
Iemptions for dependents, and the broadened scop~ oftaxpayers entitled to use split-income or the head ofhousehold rate. I
The total tax credits claimed amounted to $208 milhon,11 percent of which occurred on returns with nol income tax liability after credits, that is, nontaxabl~ returns. The tax credit for dividends received of *118million was reported on 2.5 million returns. This Iwasmore than two-thirds of the returns showing an amountof dividends in adjusted gross income. Retirement income credit, reported on less than one-half milliori returns amounted to $71.2 million, of which 29 per~entwas ~n nontaxable returns. Th~ remaining tax cr~ditsof $18.8 million for foreign tax paid, tax paid at soJrce,and for partially tax~exempt interest were practic~llyall on taxable returns.. I
Self-employment tax imposed on self-employment income of individuals was reported on 4.2 million retvrnsfor 1954. The self-employment taxamounted to $3p1.5million which is about $75 million greater than the self-, Iemployment tax for 1953. The rate for 1954 was 3 per-cent, three--fourths of 1 percent higher than last year.
In text table A above, there is a comparison of i954and 1953 data for the number of returns, adjusted wossincome and deficit, income tax, and self-employ~ent
tax, stating the increase or decrease over 1953. ;rheclassification of taxable and nontaxable returns Iwasbased on the presence or absence of an income tax liability after credits. The 1953 data in this compar~son
have been adjusted, since this classification for the 1953tabulations, as published originally, related to total! taxliability, i. e., income tax and self-employment tar'
The alternative income tax for 1954, reported onreturns in the higher income classes which had a Inetlong-term capital gain in excess of the net short-t~rmcapital loss, was $2..1 billion. The number of returnswith this tax for 1954 was nearly 5,000 greater than: thenumber for 1953, and. the tax was $400 million gre~ter,
reflecting the increase in long-term capital gain for 1954.The optional tax table was used to determine the in-
dI.
come tax on 33 million returns with adjuste gross· lll-
come under $5,000 for 1954. !,
I 'dPart or all of the income tax on 1954 returns was palunder the current taxpayment method by tax withheldfrom wages or by payments on declaration 9f estimhedtax. These payments arrlounted to $27.7 billion; liowever, there were tax overpaynientsto the extent of ~3.7
billion on approximately 35 million returns. Self-
5

6 INDIVIDUAL INCOME RETURNS FOR 1954
employment tax was not paid currently but, if the income tax was overpaid, no refund was available untilthe self-employment tax was satisfied. Refunds requested were $3 billion and credit on 1955 estimated taxwas $700 million.
Adjusted gross income is a legally defined term andthe amount may be less than the total of all income received by the taxpayer throughout the year. Threemajor reasons were responsible for this occurrence for1954: (1) certain types of income, such as interest received on State and municipal bonds, are tax-exempt,(2) specific sources of income, such as salaries and wages,dividends received, and long-term capital gain, havecertain legal limitations which can reduce the amountsreceived when they are included in adjusted grossincome, and (3) most sources which result in a loss,instead of a gain or profit, can be subtracted when computing the composite adjusted gross income. Some ofthe outstanding features of the components of the 1954adjusted gross income follow.
Salaries and wages reported in adjusted gross incomefor 1954 amounted to $186 billion. These salaries andwages were exclusive of the wages received under wagecontinuation plans for sickness or injury which, underthe new Code, are excludable from gross income. Salaries and wages included in adjusted gross income for1954 were $1.8 billion below the amount reported for1953, and there were nearly 1 million less returns withsalaries and wages than there were in the 1953 report.The amount of wages excluded from gross income on account of sick pay is tabulated in text table :It and discussed under Salary Exclusions for Sick Pay, page 12.
Dividends received from corporate stock and includedin adjusted gross income for 1954 amounted to $7billion. This amount, reported on Form 1040, was exclusive of dividends that qualified for the exclusion fromgross income of dividends up to $50, allowed under thenew Code to each individual taxpayer (on joint returns,up to $100 if both spouses received such dividends).The increase of $1.2 billion of dividends in adjusted grossincome for 1954 over the amount reported for 1953 was,to a large degree, the result of a change in methodof reporting dividends received by beneficiaries fromestates and trusts and by partners from their partnerships. For 1953, dividends received through partnerships and fiduciaries were reported as income from theseentities, but for 1954, income that was accorded specialtreatment, such as dividends, retained its character andwas reported separately.
Among the 1954 returns under $5,000 adjusted grossincome, 1 -return in 28 had dividends ,in adjusted grossincome, while 1 in every 7 returns with adjusted grossincome of $5,000 or more had dividends. In each case,the occurrence is less frequent than in 1953. The reduced frequency of dividend occurrence in 1954 was, tosome extent, a result of the fact that receipt of dividends totaling less than the allowable dividend exclusiondid not enter into the composition of adjusted gross
income. Additional information relating to dividendswill be found under the section for Dividends Received,on pages 12-15.
The decrease of $1 billion in the income from estatesand trusts for 1954 resulted principally from the separation of dividends received by beneficiaries from the otherfiduciary income received.
Interest received during 1954 income year was $2.4billion, an increase of 16 percent over that reported for1953. Annuities and pensions for 1954 showed an increase of $135 million, or 20 percent.
In determining the income received from businesses,partnerships, rents and royalties, sales of capital assets,and sales of property other than capital assets, both theincome and loss from each type of transaction shouldbe considered. Combining these positive and negativeamounts resulted, for 1954, in a business profit, partnership profit, rent and royalty income, gain from sale ofcapital assets, and a loss from sales of property otherthan capital assets. Both business and partnershipprofits increased for 1954, but the rent and royalty income showed a slight decrease, as compared with 1953.Gain on the sale of all types of capital assets showed anexceptionally large increase of 62 percent over 1953.The loss from sales of property other than capital assetswas smaller than for 1953. The net operating loss deduction was 28 percent less than that reported for 1953.
Standard deduction was elected by taxpayers on 41million returns for 1954, or 72 percent of all returnsfiled. However, the proportion of standard deductionreturns has been decreasing steadily for several years.
More than two-thirds of the itemized deductio'n returns for 1954 had interest paid and 93 percent showeda deduction for State and local taxes paid.
The deduction for contributions amounted to $3.9billion which was an increase of more than 9 percentover the deduction for 1953. This increase may be attributable to the increased allowance under the 1954Code for contributions and gifts to hospitals, churches,and educational institutions, and to the contributions deducted by 1.1 million more persons claiming contributions on 1954 returns. A deduction was claimed on 93percent of the itemized returns. The allowable deduction for contributions in excess of 20 percent of adjustedgross income is tabulated in text table H; and other features regarding the extra deduction are stated in the textunder Contributions, page 15.
Medical expenses were deducted on 8.6 million, or 55percent, of the 1954 returns with itemized deductions.There were 1.4 million more returns with this deductionthan in the previous year. The medical deduction for1954 amounted to nearly $3 billion, which was an increase of $600 million, or 24 percent, above the 1953 deduction. The increase was the result of the liberalizedmedical deduction under the 1954 Code which raised theamount of maximum deduction and lowered the excluded amount of such expenses from 5 to 3 percent ofadjusted gross income. The latter enabled more tax-

~t
INCOME
INDIVIDUAL INCOME RETURNS FOR IH54
bc---I ~ NUMBER OF RETURNS
10
50
20
70
30
liD
80
60
90
7
payers to claim the deduction. The average medical for 1953. Income tax was 28 percent of the totJl lll-
deduction per return was $344 for the 1954 returns, as . come tax, or 2 percent less than for 1953. 'compared with $330 for the 1953 returns. The entire The middle income group, adjusted gross incomemedical costs reported on the 1954 returns are set forth $5,000 under $10,000, contributed 22 percent of the re-later in the text under the section for Drug and Medical turns with adjusted gross income. Although this
jis a
Costs, together with its accompanying text table I, slight increase over the proportion contributed bYI thispages 16 and 17. group for 1953, the number of returns for 1954 actually
The new allowance for child care was claimed on decreased by 120,652. The adjusted gross income! was272,737 returns and the deduction amounted to $88.7 35.5 percent of the total, a proportion slightly srriallermillion. Casualty losses showed an increase of 13 per- than for the previous year. Income tax was 34.61per-cent over the 1953 losses. cent of the total income tax, but it is about 1 pe cent
In connection with the claim for retirement income below the corresponding tax reported for 1953. Icredit against the income tax, data relating to the in- The highest income group, adjusted gross inpomecome of retired persons are available on the 1954 re- $10,000 or more, contributed nearly 4 percent of the re-
turns with ad],'usted gross income. This group ha~ hadturns. Of the 493,418 persons with this tax credit, more tthan 433,000 were 65 or more years of age. Further in- a steady, though small, increase annually since 1949formation about retired taxpayers is given in the section in the proportion of returns contributed. There w s anof the text on Retirement Income and text tables .J and increase of 127,463 returns for 1954 over 1953. iThisK, pages 17-19. income group accounted for more than 18 percent of the
adjusted gross income, as compared with less thin 17In chart 1, data from returns with adjusted gross in- percent for 1953. The dollar increase in adjusted ~ross
come for 1954 illustrate the proportion of total returns, income for 1954 was $3.3 billion. The proportidn oftotal adjusted gross income, and total income tax which adjusted gross income contributed by this group ik thewas contributed by each of the three following adjusted largest since 1949. Of the total income tax, this glroupgross income groups: Under $5,000, $5,000 under $10,000, reported over 37 percent, which is nearly 3 percent boreand $10,000 or more. than the 1953 proportion. However, there was J, de-
The lowest income group, adjusted gross income un- crease in the 1954 amount of income tax, which wa~ alsodel' $5,000, had 74 percent of all the returns with ad- a characteristic of the other two groups. Ijusted gross income, which is one-half of 1 percent less For the past few years, the lowest income group, ad-than for 1953. Adjusted gross income was 46 percent justed gross income under $5,000, has continued to ~how
of the total adjusted gross income, or 1 percent less than a decline in the proportion contributed toward the ~otal
CharI I.-RETURNS WITH ADJUSTED GROSS INCOME, BY INCOME GROUPS, 1954 IPercent of total Percent of to al100 100
I
9i80
\
]I
50
jI
30
UNOER $5,000 $5,000 UNDER $10,000
ADJUSTED GROSS I NCOME GROUPS
$10,000 OR MORE

8 INDIVIDUAL INCOME RETURNS FOR 1954
of each item compared. However, the trend in the proportion contributed by each of the two higher incomegroups has changed somewhat for 1954. The middleincome group, adjusted gross income $5,000 under$10,000, shows, for the first time since 1949, a decreasein the proportion of adjusted gross income and of income tax. The highest income group, adjusted grossincome $10,000 or more, shows an increase in the proportion of adjusted gross income and of tax for the firsttime since 1950.
COMPOSITION OF ADJUSTED GROSS INCOME
The principal sources of income comprising adjustedgross income for 1954 are shown in chart 2 by their percentage relationship to adjusted gross income. The fourlargest sources-salaries and wages, business, partnership, and dividends-are allotted separate areas. Theremaining income, which is grouped together, includesinterest, annuities and pensions, income and loss fromestates and trusts, net income and net loss from rentsand royalties, net gain and the deductible 'loss from salesof capital assets and other property, net operating lossdeduction, and the other sources as reported in adjustedgross i~come.
Eighty-one percent of adjusted gross income consistsof salaries and wages. Business and partnership enterprises together form 11 percent of adjusted gross incomeand dividends contribute 3 percent. The componentsof adjusted gross income for 1954 changed very littlepercentagewise when compared with their respectiveproportion of the 1953 adjusted gross income.
CharI 2.- COMPOSITION OF ADJUSTED GROSS INCOME, 1954
SALARIES
AND
WAGES
SIS
ADJUSTED GROSS INCOME (net) $229 BI LLlDN
INDIVIDUAL INCOME TAX PROVISIONSFOR 1954
The Internal Revenue Code of 1954 revised the internal revenue laws relating to the individual income
tax in many respects. Several. of thp.-Se changes affectthe inclusion and exclusion of income items comprisinggross income and consequently the amount of adjustedgross income to be reported. Nonbusiness deductionsare altered in some cases and a new deduction is allowed.Tax credits in addition to those formerly permitted areprovided. Definitions of some of the basic concepts arerevised including that for dependents and a new maritalstatus is created. It is not possible to state all of thenumerous changes, but there are specified below some9f the important revisions which affect statistical datatabulated from individual income tax returns for 1954.
Income tax provisions of the 1954 Code apply to income of individuals only with respect to tax yearsbeginning after December 31, 1953, and ended after thedate of enactment, August 16,1954.
The amount of gross income for which a return ofincome must be filed by an individual 65 years of ageor over, unless self-employed, is raised from $600 to$1,200.
The income tax rates applicable to 1954 income arelower than those applicable to 1953 income. For yearsbeginning after December 31, 1953, two legislative actions are effective: (1) The graduated surtax rates werereduced slightly by an amendment to the 1939 Code, and(2) in the 1954 Code, the 3 percent normal tax and thereduced surtax are combined into a single comprehensiverate schedule. For 1953 income, the normal tax was 3percent and the graduated surtax ranged from 19.2percent to 89 percent. For 1954 income, according tothe amendment to the 1939 Code, the normal tax was3 percent and the graduated surtax rates were reducedso that they ranged from 17 percent to 88 percent.However, in the 1954 Code, the two latter sets of ratesare combined into a single rate schedule, applicable totaxable income, ranging from 20 percent to 91 percent.
Three new credits against the income tax liability arepermitted under the new Code. The retirement incomecredit is equal to 20 percent of the amount of retirementincome up to $1,200, but cannot exceed the tax otherwisedue. Credit for dividends received is allowed on returnswith tax year ended after July 31, 1954, in an amountequal to 4 percent of the domestic dividends (after exclusion) received subsequent to that date; however, thecredit may not exceed the lesser of the total tax reducedby the foreign tax credit or an amount equal to 2 percentof taxable income for 1954 (4 percent in subsequentyears). Tax credit for partially tax-exempt interest(allowed only if deductions are itemized) in the amountof 3 percent of such interest replaces the prior deductionfrom net income for normal tax purposes.
The new law eliminates the concept of net income, ofnormal tax net income, and of surtax net income andin place of these substitutes taxable income which meansadjusted gross income less deductions, standard or itemized, and personal ex~mptions which are now a deduction in computing taxable income.
The new legislation makes changes which affect the .

RETURNS FROM WHICH DATA WF;.RETABULATED
Individual income tax returns used to compile atafor this report were unaudited returns and, therefore) donot reflect increases nor decreases in tax liability, lincome, deductions, or other items reported by the taxpayer, that resulted from official audit of returns by 'thAInternal Revenue Service. I
Data were taken from all returns filed by citi~ens
and resident aliens, expept those with' no informa~ion
regarding income and tax data. Returns from whdchdata were tabulated included returns of adults an~ ofdependent children earning less than $600 who '~Iere
nontaxable but who filed a return to claim refund ofincome tax' withheld:> .although they did not meet ~heincome requirement for the filing of a return. A~so,
data were taken from. returns of dependent childrenunder 19 years of age and dependent students who ireported $600 or more of income, whether taxable ornontaxable, which met the requirement for filing.
INDIVIDUAL INCOME RETURNS FOR 19,54 9
inclusion in gross income of amounts received from spects. The $600 gross income test is eliminated flr aI
dividends, annuities, prizes and awards, alimony and child or a stepchild who is under 19 years of age or ,tvho,separate maintenance payments, proceeds of life in- regardless of age, is a student at an educational institu-surance, employee's death benefits, and income earned tion. In addition, the new law adds to the list of thoseover a period of years. who may qualify as a dependent, any person supported
Items specifically excluded from gross income are a by the taxpayer whose principal abode is the hom~ ofpartial exclusion of qualifying domestic dividends re- the taxpayer and who is a member of the taxpaier'sceived, amounts received by employees under a wage household. Also, residents of Panama or the C~nalcontinuation plan for loss of wages due to illness or Zone may be dependents if they otherwise qualify.personal injury to the extent of $100 per week, and Two changes in the support test for determining Ide-scholarship and fellowship grants with certain limita- pendency are introduced. First, in cases where a grpuptions. of taxpayers support a dependent, no one of whom ~on-
The definition of adjusted gross income is modified tributes over one-half of the support, the dependJncyin the case of employees to allow deduction from gross may be assigned to anyone of the group who contribhtesincome of expenses as outside salesmen and non- over 10 percent of the support, if all other persons -tvhoreimbursed transportation expenses for local travel in contributed more than 10 percent agree in writing that:connection with one's employment. they will not claim the dependent for that year. Sec~nd,
A new itemized deduction is granted for a working in case of a child or stepchild of the taxpayer, amOl!mtswoman or widower for the care of a dependent child received as scholarships will not be taken into accquntor stepchild under 12 years of age or of a dependent in determining whether the taxpayer provided over halfphysically or mentally incapable of caring for himself. of the child's support. IThe care must be for the purpose of enabling the tax- The measurement of business income is modified' bypayer to be employed. The deduction is limited to $600. the more liberalized provisions relating to business Ide-In case of a working wife, the deduction is allowed only ductions for depreciation, research and experimental
lex-
if she files a joint return with her husband and the $600 penses, soil and water conservation expenditures madelimitation is reduced by the amount by which their com- by farmers, loss carryovers, and organizational expetises.bined adjusted gross income exceeds $4,500, except where Also, depletion and related allowances for mining ~nd
the husband is incapable of self-support. natural resource industries are revised. IThe limit on the amount of deduction allowed for The business enterprise of a sole proprietor ma~ be
charitable contributions and gifts is raised under the taxed as 4f it were a corporation when the owner elbctsnew law by allowing an additional amount equal to 10 the option to be so taxed. Ipercent of adjusted gross income, if the excess contI'i- The self-employment tax rate of 3 percent on the 1954butions represent contributions to churches or tax-ex- self-employment income subject to this tax was cad-iedempt hospitals and educational institutions. into the new Code from the 1939 Code without chaJge;
The new law allows deduction for medical expenses however, this is an increase over the 214 percent fatethat are in excess of 3 percent (formerly 5 percent) of applicable to 1953 self-employment income.adjusted gross income, but permits the inclusion of drugsand medicines only to the extent that they exceed onepercent of adjusted gross income. Also, the limitationon the maximum deduction for medical expenses israised to $2,500 pe!: exemption other than age or blindness, with a maximum deduction of $5,000 in the caseof a single person or a married person filing a separatereturn, and a maximum deduction of $10,000 in the caseof married persons filing a joint return, or of a head ofhousehold, or of a surviving spouse.
The qualifications for head of household status arebroadened to include any taxpayer who supports a dependent parent even though not living in the taxpayer'shome, if the taxpayer provides over one-half the cost ofthe household which is the parent's principal abode.
The new Code allows a surviving spouse the full benefit of income splitting for 2 years following the deathof a spouse, provided he has not remarried and maintains a household as his home which.is also the principalabode for a child or stepchild for whom the taxpayeris entitled to the $600 deduction for personal exemption.
The concept of dependent is liberalized in several re-
L

10 INDIVIDUAL INCOME RETURNS FOR 1954
The individual income tax returns used were Forms1040 and 1040A for the 1954 income year coveringcalendar year returns, fiscal year returns ended withinthe period July 1954 through June 1955, and part year returns with the greater number of months falling in 1954.The majority of returns was for the calendar year 1954.Tentative returns were not used and amended returnswere used only if the original returns were excluded.Fiscal year and part year returns beginning in 1953, andpart year returns beginning in 1954 and ending beforeAugust 17, 1954, were subject to the 1939 Code. The1954 Code applies to returns beginning after December31, 1953 and ending after August 16, 1954.
Form 1040A, the new card-form return for 1954, wasused by employees with less than $5,000 total incomeconsisting of wages reported on the Withholding TaxStatement, Form W-2, and not more than $100 totalof other wages, dividends, and interest. Husband andwife could file on this form if their combined incomesdid not exceed these limits. Form 1040A could not beused as a separate return of a married person if onespouse itemized deductions or if divided communityincome was to be reported. Neither could this returnform be used by an individual claiming status as headof household or as surviving widow or widower. Although exclusion for sick pay was reported on this cardform, no other deduction from salaries and wages couldbe made, such as deductions for transportation and outof-town expenses, reimbursed expenses, or expenses ofoutside salesmen. In reporting other income on thisform, dividends received from domestic corporations upto $50 ($100 on joint returns) were excluded but noprovision was made to report the amount of the exclusion. The income tax liability of taxpayers filingon this form was determIned by the district director ofinternal revenue, on the basis of income reported, fromthe optional tax table applying to 1954 income. Thetax in this table made allowance for exemptions and thestandard deduction which takes the place of nonbusinessdeductions and tax credits.
Form 1040 for 1954, either the long-form or the shortform, was used by individuals who, by reason of the sizeor source of their income, were not permitted to useForm 1040A and by individuals who, although eligibleto use Form 1040A, found it to their advantage to useForm 1040. To claim the new tax credit for dividendsreceived or for retirement income, it was necessary touse Form 1040.
Individuals with adjusted gross income under $5,000from whatever source could elect to use the short-formreturn on which nonbusiness deductions were not reported, but on which allowable expenses in connectionwith the employer's business were deducted from salariesand wages. The income tax liability on this short-formwas determined by the taxpayer from the optional taxtable on the basis of adjusted gross income. The taxtable made allowance for the standard deduction, ex-
emptions, and tax credits other than for dividends received and for retirement income, both of which couldbe claimed on the short-form return. Individuals withadjusted gross income under $5,000 who wished to claimnonbusiness deductions in excess of the standard deduction or to claim tax credits other than dividends receivedand retirement income used the long-form return anditemized their deductions, deducted their exemptions,and computed the taxable income.
Individuals with adjusted gross income of $5,000 ormore used the long-form return, claimed their exemptions, and computed their taxable income. In computing the taxable income, the taxpayer could elect to usethe standard deduction rather than to itemize nonbusiness deductions. If he so elect-ed, the standarddeduction was the smaller of $1,000 or an amount equalto 10 percent of the adjusted gross income, except that,in the case of a married person filing a separate return,the standard deduction was $500. The standard deduction was not allowed on a separate return of husband orwife if the taxable income of the other spouse was computed by using itemized deductions. ",iVhen the standarddeduction was used, only the two tax credits for dividends received and retirement income could be claimed.
Individuals who used the long-form return, regardless of the amount of adjusted gross income, computedtheir income tax liability based on taxable income, byusing the income tax rates from the tax rate scheduleapplicable to their marital status and claiming the relevant tax credits.
Facsimiles of the 1954 individual income tax returns,Forms 1040 and 1040A, are placed at the close of thisreport, pages 95-127.
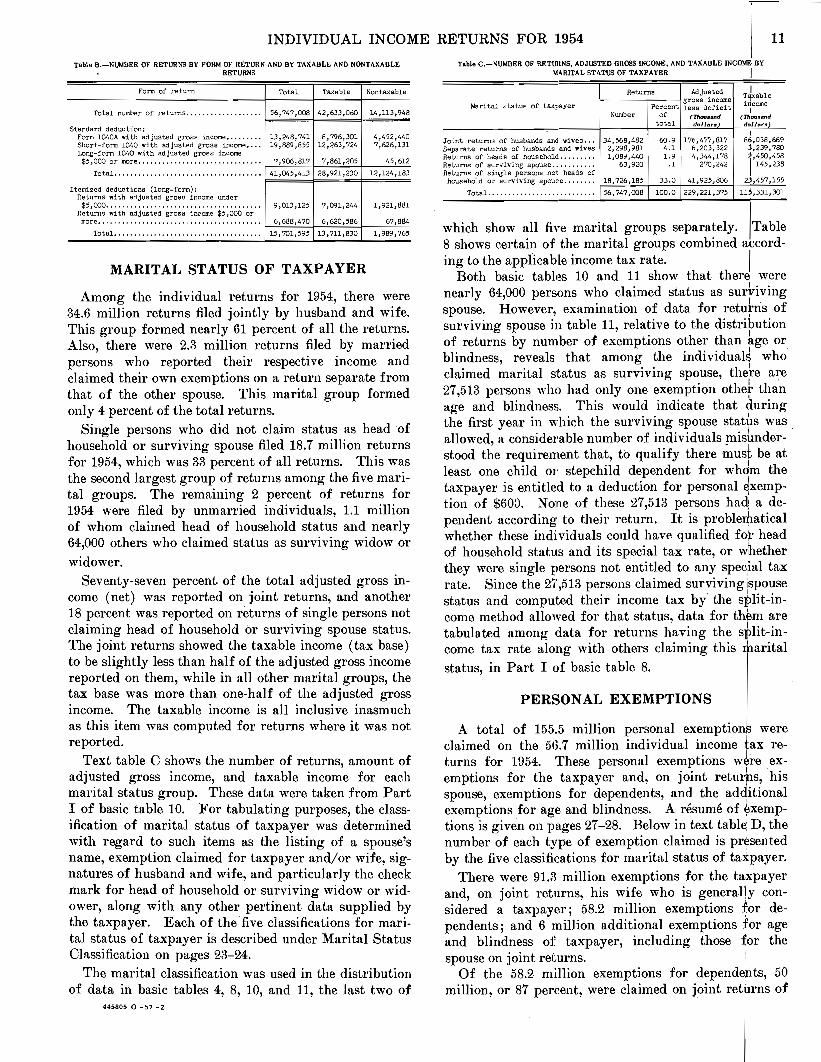
In text table B below, the number of individual returns for 1954 is tabulated to show the volume of returns filed on the different forms, whether they hadstandard deduction or itemize,d deductions, and the division between taxable and nontaxable returns. Of the56.7 million returns filed, 41 million, or 72.3 percent, hadthe standard deduction and the remainder itemized nonbusiness deductions. Compared with 1953, the numberwith standard deduction decreased approximately 3 percent and the number with itemized deductions increasedabout 3 percent.
The total number of long-form returns was 23.6 million. On these the taxpayer computed the income taxon the basis of his taxable income. Among these returns, 7.9 million showed that the taxpayer elected touse the standard deduction in computing his taxablemcome.
The optional tax table applicable to total income under $5,000 was used to determine the income tax on 13.2million returns, Form 1Q40A, and on 19.9 million shortform returns, Form 1040, making a total of 33.1 millionreturns, or 58.4 percent of all returns filed for 1954.The optional tax was used on a smaller percentage ofreturns than last year.
INDIVIDUAL INCOME RETURNS FOR 1954 I 11
Table B.-NUMBER OF RETURNS BY FORM OF RETURN AND BY TAXABLE AND NONTAXABLE Table C.-NUMBER OF RETUItNS. ADJUSTED GROSS INCOME. AND TAXABLE INCOME BYRETURNS M4RITAL STATUS OF TAXPAYER I
Total number of returns•.................. 55,747,008 42,633,060 14,113,948
MARITAL STATUS OF TAXPAYER
Standard deduction:Form 1040A with adjusted graes income •....... , 13,2/.8,741 8,'796,301 4,452,440Short-form 1040 with adjusted gross income •... 19,889,855 12,263,724 7,626,131Long-fom 1040 with adjusted gross income$5,000 or more •... ,. ........•.. 7,906,817 7,861,205 45,612
TotaL ..................••..........•....• 41,045,.1013 28,921,230 12,124,183
Itemized deductions (long-form):Returns with adjusted gross income under$5,000....................................... 9,013,125 7,091,244 1,921,881
Retur:ns with adjusted gross income $5,000 ormore......................................... 6,688,4?0 6,620,586 6?,884
TotaL.................................... 15,?01,595 13,?11,830 1,989,?65
PERSONAL EXEMPTIONS
A total of 155.5 million personal exemption wereclaimed on the 513.7 million individual income ax re-
I. /.
turns for 1954. These persona exemptIOns were ex-emptions for the taxpayer and, on joint returrs, hisspouse, exemptiOlls for dependents, and the additionalexemptions for age and blindness. A resume of ~xemptions is given on pages 27-28. Below in text tabl~ D, thenumber of each type of exemption claimed is pr~sentedby the five classifications for marital status of taipayer.
There were 91.B million exemptions for the taocpayerand, on joint returns, his wife who is generally considered a taxpayer; 58.2 million exemptions ~or dependents; and 6 million additional exemptions for ageand blindness of taxpayer, including those for thespouse on joint returns. i
Of the 58.2 million exemptions for dependents, 50million, or 87 percent, were claimed on joint rethrns of
which show all five marital groups separately. ITable8 shows certain of the marital groups combined accord-ing to the applicable income tax rate. I
Both basic tables 10 and 11 show that there werenearly 64,000 persons who claimed status as sur{,ivingspouse. However, examination of data for returns ofsurviving spouse in table 11, relative to the distributionof returns by number of exemptions other than ~ge orblindness, reveals that among the individual~ whoclaimed marital status as surviving spouse, there are27,513 persons who had only one exemption othe~ thanage and blindness. This would indicate that duringthe first year in which the surviving spouse stattis was.allowed, a considerable number of individuals !l1ishnderstood the requirement that, to qualify there must be atleast one child or stepchild dependent for whdm the'taxpayer is entitled to a deduction for personal ~xemption of $600. None of these 27,513 persons had a dependent according to their return. It is problerhaticalwhether these individuals could have qualified fo~ headof household status and its special tax rate, or w~etherthey were single persons not entitled to any spec~al taxrate. Since the 27',513 persons claimed surviving fPousestatus and computed their income tax by' the split-income method allowed for that status, data for th~m aretabulated among data for returns having the s~lit-income tax rate along with others claiming this maritalstatus, in Part I of basic table 8.
Returns Adjusted ITaxable
Maritlll status of taxpayergross income
i~comePercent less deficit INumber of (11tauund (Thoulllllf1dtotal doJ1lJrlll dollars
IJoint returns of husbands and wives ... 34,568,482 60.9 1?6,4??,Bl? 86,038,669Separate returns of husbands and wives 2,298,981 4.1 6,203,322 j,239,78OReturns of heads of household ......... 1,089,440 1.9 4,344,1?B ~,4.50,458
Returns of surviving spouse ........... 63,920 .1 270,242 1 145 ,238Returns of sine1e persons not. heads of
household or surviving spoU!:'e ........ 18,726,185 33.0 41,925,806 2),45?,155
Total ........................... 56.747,008 100.0 229,221,375 11~,331,301
Taxable NontaxableTotalForm of ret.urn
Among the individual returns for 1954, there were34.6 million returns filed jointly by husband and wife.This group formed nearly 61 percent of all the returns.Also, there were 2.3 million returns filed by marriedpersons who reported their respective income andclaimed their own exemptions on a return separate fromthat of the other spouse. This marital group formedonly 4 percent of the total returns.
Single persons who did not claim status as head ofhousehold or surviving spouse filed 18.7 million returnsfor 1954, which was 33 percent of all returns. This wasthe second largest group of returns among the five marital groups. The remaining 2 percent of returns for1954 were filed by unmarried individuals, 1.1 millionof whom claimed head of household status and nearly64,000 others who claimed status as surviving widow orwidower.
Seventy-seven percent of the total adjusted gross income (net) was reported on joint returns, ltlld another18 percent was reported on returns of single persons notclaiming head of household or surviving spouse status.The joint returns showed the taxable income (tax base)to be slightly less than half of the adjusted gross incomereported on them, while in all other marital groups, thetax base was more than one-half of the adjusted grossincome. The taxable income is all inclusive inasmuchas this item was computed for returns where it was notreported.
Text table C shows the number of returns, amount ofadjusted gross income, and taxable income for eachmarital status group. These data were taken from PartI of basic table 10. For tabulating purposes, the classification of marital status of taxpayer was determinedwith regard to such items as the listing of a spouse'sname, exemption claimed for taxpayer and/or wife, signatures of husband and wife, and particularly the checkmark for head of household or surviving widow or widower, along with any other pertinent data supplied bythe taxpayer. Each of the five classifications for marital status of taxpayer is described under Marital StatusClassification on pages 23-24.
The marital classification was used in the distributionof data in basic tables 4, 8, 10, and 11, the last two of
4458050 -57-2

12 INDIVIDUAL INCOME RETURNS FOR 1954
husbands and wives. Other married persons filing separate returns claimed 1.6 million dependents.
Among the unmarried taxpayers, heads of householdsclaimed 1.1 million dependents, surviving widows andwidowers claimed 62,263, and other single personsclaimed nearly 5 million dependents. Although exemptions for 27,513 individuals who claimed survivingspouse status without a dependent are tabulated in thatmarital group (as previously explained), it has no effect on the number of dependents in this or any othergroup, since they did not have a dependent.
As compared with the 1953 report, the number ofdependents increased by 1.7 million in 1954. However,exemptions for age and blindness decreased, as did thetaxpayer exemptions.
Tabl. D.-NUMBER OF EXEMPTIONS BY MARITAL STATUS OF TAXPAYER AND BY TYPE OF,EXEMPTION
Total Number of exemptions for-
Mari tal status of taxpayer number of Age andexemptions Taxpayer
blindness Dependents
Joint returns of husbands and wives. 123,675,873 69,136,964 4,104.404 50,434,505Separate returns of husbands and
wives •.•.•.•••.••••.•.•.•..••.••..• 4,011,966 2,298,981 79,590 1,633.395Returns of heads of household ...•... 2,253,758 1,089,440 58,497 1,105,821.Returns of surviving spouse ......... 148,616 63,920 22,433 62,263Returns of single persons not heads
of household or surviving spouse ... 25,404,216 18,726,185 1,719,631 4,958,400
Total ......•.•................ 155,494,429 91,315,490 5,984,555 58,194,384
SALARY EXCLUSIONS FOR SICK PAY
The 1954 Code specifically exempts from the incometax amounts received, as wages or in place of wages,under a continuation plan for the period during whichan employee was absent from work on account of personal injury or sickness. The tax-exempt amount couldnot exceed a weekly rate of $100, unless the plan wasone to which the employee had contributed, thenamounts received which were attributable to his contribution were excluded without limit. In case of sickness,a special rule disallowed tax exemption of amounts received for the first 7 days of illness unless the employeewas hospitalized at least 1 day any time during theperiod of absence from work on account of sickness.
Each taxpayer was required to report his gross salaryand wages and to give sufficient information to substantiate his claim for the sick-pay exclusion deducted fromgross wages. The exclusion could be claimed on eitherForm 1040 or 1040A.
In order to register the amount of sick pay excludedon account of this new provision, it was necessary to usean item not included in adjusted gross income. Theexcludable portion of wages received as sick pay :wastabulated especially for this purpose. Text table Eshows the amount of salary exclusion for sick pay inconnection with the amount of salaries and wages entering into the composition of adjusted gross income,and the total salaries and wages received. This table,by adjusted gross income classes corresponding to thosein basic tables, also shows the number of taxable andnontaxable returns on which a sick-pay exclusion wasclaimed.
There are 928,628 returns with sick-pay exclusionsamounting to $352 million deducted from gross salariesand wages. The exclusion was about two-tenths of 1percent of gross salaries and wages. Over one-half ofthe sick-pay exclusion was reported on returns with adjusted gross income under $5,000.
Tabl. E.-5ALARY EXCLUSIONS FOR SICK PAY BY ADJUSTED GROSS INCOME CLASSES
Total Salary exclusions for Suedes endsslaries sick pay wages (after
Adjusted gross income classes and wages exclusions)received Number Amount(Thousand of (Thou.and (Thou.anddollar.) returns dolla'tt) doll~rtJ)
Taxable returns:$600 under $1,000 ................. 996,636 3,524 1,006 995.550$1,000 under $1.500 ............... 2,794,266 11,520 2,087 2,792,179$1,500 under $2,000 ............... 3,763,445 18,579 8,010 3,755,435$2.000 under $2,500 ............... 6,156,387 40,623 12,083 6,l44,J04
$2,500 under $3,000 ............•.. 8,564,533 55,198 16,140 8,!i48,393$3,000 under $3,500 ............... 11,375,575 67,229 20,1'"13 11,355,402$3,500 under $4,000 ............... 13,974,643 84,780 26,494 13,948,149$4,000 under $4,500 ............... 15,496,086 84,905 31,066 15,465,020$4,500 under $5,000 ............... 15,653, ?23 69,168 19,199 15,634,524
$5,000 under $6,000 ............... 25,547,907 129,219 45,119 25,502,788$6,000 under $7,000 ............... 19,561',328 103,260 36,894 19,524,434$7,000 under $8,000 ....•....••••.. 13,141,984 69,259 27,464 13,114,520$8,000 Under $9,000 ............... 8,437,226 48,074 15,825 8,421,401$9,000 under $10,000 .............. 5,497,754 26,150 8,557 5,489,197
$10,000 under $15,000 ..••••...•••. 9,3JO,721 38,355 17,614 9,313,107$15,000 under $20,000 ............. 3,085,244 8,006 4,795 3,080,449$20,000 under $JO,OOO ............. 2,936,768 6,345 4,341 2,932,427$30,000 under $50.000 ............. 2,272,765 3,548 2,723 2,270,042$50,000 under $100,000 ............ 1,553,979 1,763 1,609 1,552,370
$100,000 under $150,000 ..•••.•••• , 375,784 331 288 375,496$150,000 under $200,000 ........... 120.404 83 73 120,331$200,000 under $500,000 ........... 142,357 92 115 142,242$500,000 under $1,000,000 ......... 17,011 6 9 17,002$1,000,000 or more •...••.......... 6,110 2 2 6,108
Total taxable returns .....•... 170,802,636 870,019 JOl ;766 170,500,870
Nontaxable returns:No adjusted gross income .......... 160,869 (') (') 157,697
Under $600 ........................ 1,146,887 5,558 9,205 1,137,682$600 under $1,000 ..•.•.•.......•. , 967,178 5,512 4,645 962,533$1,000 under $1.500 ............... 1,647,731 5,995 6,029 1,641,702$1,500 under $2,000............... 2,123,116 5.984 4,556 2,118,560$2,000 under $2,500 ............... 1,977,245 6,013 2,363 1,974,882
$2,500 under $3,000 ............... 2,103,467 9,512 10'J08 2,093,159$3,000 under $3,500 ............... 1,931,186 5,995 2,290 1,928.896$3,500 under $4,000............... 1,561,500 6,006 3,785 1,557,715$4,000 under $4,500............... ffl4,048 3,017 2,153 871,895$4,500 under $5,000..........••..• 497,190 (1) ( 1) 497,136
$5,000 under $6,000 ............... 354.653 (') (') 352,892$6,000 under $8,000............... 141,053 - - 141,053$8,000 under $10,000 .............. (1 ) - - (')$10,000 or Illore .........•..•...••. n ,425 - - 11,425
Total nontaxable returns ...... 15,502,074 58,609 50,321 15,451,753
Grand total ...•...•..•...•.... 186,J04,710 928,628 352,087 185,952,623
Returns under $5,000 ................ 93,765,711 492,135 184,898 93.580,813Returns $5,000 or more .•.....•...•.. 92.538,999 436,493 167,189 92,371,810
See text for "Description of Sample and Limitations of Data."lSample variability of this item. is too large to warrant showing it separately.
However, this value ie included in each total.
DIVIDENDS RECEIVEID
Two special tabulations were prepared to show the details concerning dividends reported on individual returns, Form 1040, for 1954. The new features, providedunder the 1954 Code for a partial exclusion of dividendsand for a tax credit for dividends received, necessitatedthe reporting of information not required in previousyears.
The new Code provides that, for any tax year endedafter July 31, 1954, gross income does not includeamounts received by an individual as dividends fromdomestic corporations to the extent that the dividendsdo not exceed $50. In case the dividends exceed $50, theexclusion applies to the dividends first received in thetax year. The exclusion, however, does not apply to div-

INDIVIDUAL INCOME RETURNS FOR 1954 113
idends received from domestic corporations whose earn- Taxpayers filing Form 1040 were required to re~ortings are not fully taxable. domestic dividends qualifying for the exclusion in Itwo
Although dividend exclusions could be taken regard- categories: those reeeived before August 1, 1954, andless of the return form used, the amount of exclusion those received after Jruly 31, 1954. Qualifying divid~nds
was not reported on Form 1040A. I:f husband and wife received through fiduciaries and partnerships werJ in-filed a joint return of income, the exclusion applied sep- cluded, a new feature of dividend reporting. The clivi-arately to the dividends received by each as an individ- dend exclusion of $50, or $100 for joint income ofual taxpayer. husband and wife, was first applied to the early recJipts
A credit against the income tax for dividends received and, if such dividends were insufficient, the remai~ingis also allowed under the new law. The tax credit is exclusion was then applied to the late receipts. If the
taxpayer's dividend receipts totaled less than the rrlaxi-allowed only for tax years ended after .July 31, 1954, mum exclusion, they were nevertheless reported and theand only with respect to qualifying dividends received exclusion applied to that extent. Domestic divid~ndsfrom domestic corporations after that date and included received after July 31, 1954, reduced by the appli~ablein gross income. Credit was allowed to the extent of 4 exclusions were eligible for the tax credit for dividendspercent of such dividends, provided this credit did not l'eceived. Foreign dividends and certain domestic ~ivi-
exceed the lesser of the total income tax reduced by for- dends did not qualify for the exclusion nor for thd taxeign tax credit, or 2 percent of taxable income. It was credit. These were reported independently and ~om-
obligatory to file Form 1040, either long- or short-form, bined with the dividends after exclusions to obtail{ theto claim benefit of this tax credit. amount of dividend8 reported in adjusted gross inc6
1
me.
Tabla F.-DIVIDENDS ELIOWLE FOR EXCLUSIONS AND TAX CREDIT FOR DIVIDENDS RECEIVED BY ADJUSTED DROSS INCOME CLASSES
1 Total divide,nda eligible forReceived before Aug. 1, 1954
Received after July· 31, 1954 Iexclusions (eligible for tax credit)
Tax credit for IAdjusted gross income classes Amount Total
Amount EXclusions Amount Exclusionsdividends received
Number of exclusions Number of Number of Amoun~returns returns returns Number of
(lhOU.~~(7'hou84nd (ThoulJand (7'houIJaJd (ThoU8ll11d (ThoulJand (ThoulJll1Id returnsdollars) dollara) dollan) dollara) dollars) dollar_) dollar)
(1) (2) (3) (4) (5) (6) (7) (8) (9) (10) (ll)'
Taxable returns:1581 $600 under $1,000••••.....•..•..••..•. 20,555 7,963 990 19,055 4,440 878 18,S55 3,523 112 15,522 1
2 $1,000 under $1,500 ................... 38,750 15,048 1,699 35,783 7,788 1,490 34,744 7,260 209 25,218 151 23 $1,500 under $2,000................... 72,740 1.0,855 3,563 69,193 23,203 3,260 62,690 17,652 303 51,593 124 34 ::;2,000 under $2,500................... 95,496 55,055 4,677 87,916 30,352 4,080 85,399 24,703 597 69,824 57 4
I5 $2,500 under $3,000................... 111,970 58,947 5,913 101,846 32,865 5,080 100,1170 26,082 833 82,739 '/99 56 $3,000 under $3,500................... 138,280 75,962 6,912 129,211 41,025 6,012 127, {{19 34,937 900 104,557 1,241 67 $3,500 under $4,000................... 160,776 88,217 8,410 146,651 47,345 7,074 141,075 40,872 1,336 101,328 1,~10 78 $4,000 under $4,500................... 167,086 105,745 8,660 151,983 59,962 7,253 143,<1.37 45,783 1,407 111,240 1,EI94 89 $4,500 under $5,000................... 163,187 125,337 9,013 154,647 70,040 7,669 147,093 55,297 1,344 111,891 1,'/91 9
I10 $5,000 under $6,000................... 337,472 188,957 17,876 309,706 102,431 14,941 305 ,;~63 86,526 2,935 214,267 2,~92. 10II $6,000 under $7,000................... 311,0'92 195,880 17,312 290,860 106,762 14,522 276,1139 89,1l8 2,790 203,389 3,202 II12 $7,000 under $8,000................... 269,775 252,394 16,472 248,584 136,501 13,704 249,650 115,893 2,768 188,357 4,026 1213 $8,000 under $9,000................... 198,953 177,726 12,358 186,278 92,758 10,403 183 ,;~12 84,968 1,955 145,465 3,+40 1314 $9,000 under $10,000.................. 170,136 151,760 10,721 159,481 79,046 9,205 154,J52 72,714 1,516 118,933 2,639 14
15 $10,000 under $15,000................. 458,445 723,683 30,269 429,407 387,464 26,467 425,Jll 336,219 3,802 362,617 13,~64 15.16 $15,000 under $20,000 ................. 202,296 524,108 14,089 190,751 276,670 12,595 189,'717 247,438 1,494 171,197 9,472 16.17 $20,000 under $30,000................. 187,299 778,880 13 ,325 176,181 407,858 12,059 176,;!92 371,022 1,266 164,555 14,!42 17.18 $30,000 under $50,000................. 121,714 863,074 9,280 115,684 442,826 8,567 116,021 420J 248 713 111,234 16, 17 1819 $50,000 under $100,000 •............... 59,465 991,328 4,807 57,603 497,622 4,546 57,620 493,706 261 56,531 17, 99 19
20 $100,000 under $150,000•.............. 10,605 413,770 891 10,403 207,285 857 10,1;'11 206,485 34 10,276 7,193 20.21 $150,000 under $200,000 •.........•.... 2,993 197,104 252 2,948 95,847 245 2,941 101,257 7 2,901 3,$97 2122 $200,000 under $500,000•. , ............ 3,067 367,981 257 3,016 176,357 251 3,029 191,624 6 2,974 6,i6:i 2223 $500,000 under $1,000,000 •............ 420 139,075 34 420 64,655 34 ,;12 74,420 (1) 395 2,~69 2324 $1,000,000 or more ........•...•.•.•..• 196 197,965 14 193 88,559 14 195 109,406 (' ) 185 2, 62 24
25 Total taxable returns •.......... 3,302,768 6,736,814 197, '794 3,077,800 3,4'79,661 171,206 3,012,U07 3,257,153 26,588 2,427,188 116,S02 25
Nontaxable returns:
(J26 No adjusted gross income .............. 29,841 16,561 1,766 26,292 9,919 1,545 21,652 6,642 221 - - 26
27 Under $600............................ 31,261 8,398 1,483 30,245 4,806 1,214 26,;~56 3,592 269 - - 2728 $600 under $1,000..................... 58,842 22,605 2,875 55,319 12,882 2,561 49,1324 9,723 314 (') 2829 $1,000 under $1,500•........•..•••••.• 87,648 43,417 4,632 77,049 24,369 4,042 72,684 19,048 590 7,040 195 2930 $1,500 under $2,000................... 69 ,873 40,836 3,660 64 ,826 23,908 3,363 60,899 16,928 297 19,692 i57 30
.31 $2,000 under $2,500................... 54,439 37,370 3,028 51,954 21,360 2,735 46,l358 16,010 293 12,152 i13 31
.32 $2,500 under $3,000................... 36,413 33,160 2,124 35,424 18,865 1,942 31,J'79 14,295 182 10,135 i16 3233 $3,000 under $3,500................... 25,413 25,575 1,465 24,372 13 ,183 1,300 22,.366 12,392 165 9,135 iS6 33J4 $3,500 under $4,000................... 11,118 13,01..2 745 10,618 7,488 682 11,.1.18 5,554 63 5,098 '71 3435 $4,000 under $4,500................... 6,081 5,809 533 6,081 3,070 495 5,081 2,739 38 3,048 199 35
6 $4,500 under $5,000................... 5,040 7,555 287 5,040 4,150 281 5,040 3,405 6 ( ')
'''I''36
37 $5,000 under $6,000................... 5,052 7,540 371 4,552 3,556 335 5,052 3,984 36 2,551 3738 $6,000 under $8,000................... 3,029 9,141 227 2,540 4,432 173 3,029 4,709 54 - 3839 $8,000 ,under $10,000.................. (2) (2 ) (2) (2) ( 2) ( 2) (2 ) (2 ) - - 3940 $10,000 or more •...•.......•.•........ 1,604 17,525 100 1,532 8,681 90 1,536 8,844 10 269 19 40
;'1 Total nontaxable returns•....... 426,177 289,505 23,322 396,367 161,021 20,784 363,297 128,484 2,538 72,615 1,~22 41
42 Grand total •.....•............... 3,728,945 7,026,319 221,1l6 3,474,167 3,640,682 191,990 3,376,104 3,385,637 29,126 2,499,803 118,024 42
;'3 Returns W'lder $5,000•... ,.•.............. 1,384,809 827,457 72,435 1,283,505 461,020 62,956 1,214,699 366,437 9,479 743,707 9,~73 4344 Returns $5,000 or more•................. 2,344,136 6,198,862 148;681 2,190,662 3,179,662 129,034 2,161,405 3,019,200 19,647 1,756,096 108,651 44
See text for t'Deseription of Sample and limitations of Data."lLess than $500.2Samp1e variability of this item is too large to warrant showing it separately. However, this value is included in each total.

14 INDIVIDUAL INCOME RETURNS FOR 1954
Table G.-DOMESTIC;; AND FOREIGN DIVIDENDS RECEIVED AND DlVIDENDS ELmIBLE AND INELI(]JBLE FOR EXCLUSI(]NS, BY ADJUSTED GRCES INCOME CLASSES
Total domestic and foreigndividends received
Dividends eligible foreXclusions
Dividends not eligible for Dividendsexclusions or credit (after exclusions)
56789
1011
.121314
1516171819
2021222324
25
26
2728293031
3233343536
37383940
Adjusted gross income classes
Taxable returns:$600 under $1,000 .$1,000 under $1,500 ..$1,500 under $2,000•......................•..........$2,000 under $2,500 ..
$2,500 under $3,000 .$3,000 under $3,500 .$3,500 under $4,000 .$4,000 under $4,500 .$4,500 under $5,000 .
$5,000 under $6,000 ..$6,000 under $7,000 ..$7,000 W"Jder $8,000 ..•...............................$8,000 under $9,000 .$9,000 under $10,000 .
$10,000 under $15,000 .$15,000 under $20,000 ..$20,000 under $30,000 ..$30,000 under $50,000 .$50,000 under $100,000 .
$100,000 W1der $150,000•.............................$150,000 under $200,000 ..$200,(0) W1der $500,000..........•...................$500,000 W1der $1,000,(0) .$1,000,000 or more •..................................
Total taxable returns •.........................
Nontaxahle returns:No adjusted gross income •............................
Under $600 , .$600 under $1,000 .$1,000 W1der $1,500 .$1,500 under $2,000 ..$2,000 under $2,500 ..
$2,500 W1der $3,000 .$3, 000 W1der $3,500 .$3,500 W1der $4,000 .$4,000 W1der $4,500 .$4,500 W1der $5,000•.................................
$5,000 under $6 1 000..............•...................$6,000 under $8,000 ..$8,000 und'r $10,000 ..$10, 000 or morE: •...............•.....................
Number ofreturns
(1)
23,62347,27586,386
102,006
129,472155,353174,866187,705191,770
367,603341,138287,908214,535180,686
'75,217207,926190,958123,144
59,913
10,6583,0073,074
426197
3,564,849
35,896
46,21684 1 412
114,18198,67364 1 863
45,44430,92513,624
6,5816,074
5,5413,529
(' )1,618
Amount
(ThousanddolllJTs)
(2)
8,91518,54646,39558,147
62,98681,01992,553
111,91913/+1 822
200,65:12DL,99G257,265184 1 334156,553
742,747534,030792,345875,692
1,010,783
421,093200,735375,280143,053203,012
18,732
11,66131,85153,29056,27643,531
39,66028,82915,592
5,9829,263
7,9059 1 476
(1 )18,092
Number ofreturns
(3)
20,55538,75072,74095,496
111,970138,280160,776167,086163,18'7
337,472311,092269 1 775198,953170,136
458,445202 1 296187,299121,714
59,465
10,6052,9933,067
420196
29,.841
31,26158,84287,64869,87354,439
36,41325,41311,118
6,0815,D40
5,0523,029
(1 )1,604
Iurount
(Thou.and
doHlIn)
(4)
7,96315,04840,85555,055
58,94775,%288,217
105,745125,337
188,957195,880252,394177,726151 1 760
723,683524,108778,880863,074991,328
413,770197,104367,981139,075197,965
6,736,814
16,561
8,39822,60543,41740,83637,370
33,16025,57513,042
5,8097,555
7,5409,141
(l)17,525
Totalexclusions
(ThoutJ~d
dollars)
(5 )
9901,6993 1 563',677
5,9136,9128,4108,6609,013
17,87617,31216,47212,35810,721
30,26914,08913,325
9,2804,807
891252257
3414
197,794
1,766
1,4832,8754,6323,6603,028
2,1241,465
745533287
371227
100
Number ofreturns
(6)
5,60210,00315,15313,526
22,02524,64022,17828,22132 1 100
43,75245,73426,70624,71720,181
42,97321,01320,88415,43810,484
2,408844996188
74
449,840
7,063
15,44327,11028,52334,82313,947
10,5486,5704,495
(1 )(1 )
(1 )(1 )(1 )
110
Iurount
(Tholl.and
dolll1T5)
(7)
9523,4985,5403,092
4,0395,0574 1 3366 1 1749,485
11,6949,1164,8716,6084,793
19,0649 1 922
13,'6512,61819,455
7,3233,6317,2993,9785,047
181,057
2,171
3,2639,2469,873
15,4406,161
6,5003,2542,550
(l)(1 )
(1 )(' )(1 )
567
Number ofreturns
(8)
22 1 12342 1 75274,7f:A92,894
121,420142,266150,691165,059172,&D
307,2'~0
286,674236 1 609184 1 722158,896
421,750191,953179,527118,634
58,885
10,5302,9753,060
425197
3,146,694
29,849
44,23984,412
114,14193,71260,768
42,89326,81613,624
6 1 5816,074
5,5413,529
(' )1,611
Iurount
(Thou.llnddo/lara
(9)
7,92516,84742,83253,470
57,07374,10784,143
103,259125,809
182,775 10187,684 11240,793 12171,976 13145,832 14
712,478 15519,941 16779,020 17866,412 18
1,005,976 19
420,202 20200,483 21375,023 22143,019 23202,998 24
6,720,077 25
16,966 26
10,178 2728,976 2848,658 2952,616 3040,503 31
37,536 3227,364 3314,847 34
5,449 358,976 36
7,534 379,249 38
(l) 3917,992 40
41 Total l)OIltaxuble returns •......................
42 Grand total•..........................•........
43 Returns under $5,000.. . .'4 Returns $5,000 or more •................................
558,100 351,111 426,177 289,505
4,122,949 7,268,982 3,728,945 7,026,319
1,645,345 929,969 1,384,809 827,4572,477,004 6,339,013 2,344,136 6,198,862
23,322
221,116
72,435148,681
602,012
323,504278,508
61,606 534,313 327,789 41
242,663 3,681,007 7,047,866 42
102,512 1,507,726 857,534 43140,~51 2,173,281 6,190,332 44
See text for "Description of Sample and Limitations of Data. II
lSarnple variability of this item is too large to warrant showing it separately. However, this value is included in each totaL
Tabulated data pertaining to dividends had to belimited to information reported on returns, Form 1040.On the Form 1040A, the amount of dividends after theexclusion was included in "other income," and theamount of the exclusion was not reported.
In text table F, the number of returns, amount ofdividends eligible for exclusions, and the amount ofexclusions, are tabulat~d for all dividends eligible forthe exclusion, as well as for dividends received beforeAugust 1, 1954, and for those received after July 31,1954. Since dividends received after July 31, 1954, lessthe exclusions are the only dividends eligible for thetax credit, the tax credit claimed in regard to such dividends is tabulated here. All these data are distributedby adjusted gross income classes, taxable and nontaxable,similar to those in basic tables.
Text table G shows the total amount received byindividuals from domestic and foreign dividends without regard to the exclusions. It also shows the amountof dividends included in adjusted gr06S income and thetwo components of dividends actually entering into this
amount, that is, (a) dividends eligible for exclusion together with the total exclusions claimed against thesedividends, and (b) dividends not eligible for exclusionor credit. These items and their frequency are presented by size of adjusted gross income separately fortaxable and nontaxable returns, as in text table F.
Data in table G reveal that the total dividend receiptsreported for the income year 1954 was $7.3 billion, ofwhich $7 billion qualified for the exclusion and $0.2billion were foreign and domestic dividends ineligiblefor exclusion or credit. Tax-exempt dividend exclusionsof $0.2 billion reduced qualifying dividends to $6.8 billion which together with the nonqualifying dividendsof $0.2 billion were included in adjusted gross income.Receipt of dividends was reported on .:1.1 million returns, but only 3.7 million returns showed dividends inadjusted gross income.
Nearly one-half of the $7 billion of dividends qualifying for the exclusion were also eligible for the tax credit.These dividends, amounting to $3.4 billion (text tableF), although eligible for the tax credit, did not termi-

See text for "Description "f Sample and Limitations of Data. 1t IlSample variability of thi~: item is too large to warrant showing it separately.
However, thi. value i. inc1u(ed in each total. I
million. However., this does not signify the ~ntireamount contribute;t to the special institutions, b~causein those instances where the special contributiOl\s exceeded the 10-percent limitation, the excess was mingledwith the other contributions to which the 20-p~rcentlimitation applied, and in cases where the contrib~tionsdid not exceed the 20-percent limitation, the deductionmay have included contributions to the special org~niza-tions. I
I
Less than 1 percent of the returns. with a deductionfor contributions showed the deduction to be in lexcessof 20 percent of adjusted gross income. Of the 1:32,073returns with charitable deduction exceeding the 20-percent limitation, 8~3 percent were returns under :$5,000adjusted gross income, but only one-fifth of the additi~nal deduction oecurred on these returns. The teversesituation was shown on returns over $5,000 a4justedgross income, where 18 percent of the returns ~ad 80percent of the additional charitable deduction.
Returns with deductionfor contributions.' Number of Deduction exceeding 20 perdent of
returns for contrl- adjusted gross ~ncome
Adjusted gross income clasues with butions AmouAt incontri- Number of exce~s of
I
butions returns 20 prrcent(Thouund (7hOu..nd
dQllttn dOJ1au)
Taxable returns:$600 under $1,000 ........... , ....• 60,784 4,020 2,489 113$1,000 under $1,500 ............... 184,179 17,494 2,500 23 .$1,500 under $2,000 ............•.. 363,911 41,850 5,012 460$2,000 under $2,500 ............... 546,431 76,645 7,070 525
$2,500 under $3,000 ............... 708,875 109,366 6,502 892$3,000 under $3,500 ............... 988,001 171,502 5,006 633$3,500 under $4,000 .............•. 1,172,547 208,668 5.023 568$4,000 under $4,500 ............... 1,375,148 25;,590 3,540 1,081$4,500 under $5,000 .....•...•.•... 1,370,217 269,870 2,523 240
$5,000 under $6,000 ............... 2,199 J 234 469,598 3,574 493$6,000 under $7,000 ............... 1,445;565 360,462 (') (')$7,000 under $8,000 ................ 845,034 234,297 (') (' )$8,000 under $9,000 ............... 491,225 162,502 2,547 759$9,000 under $10,000 .............. 282,426 101,068 (1 ) (1)
$10,000 under $15,000 ..........•.. 560,205 258,773 2,959 1,989$15,000 under $20,000 ............. 226,164 141,346 1,713 1,566$20,000 under $30,000.•....•.•...• 212,749 175,617 1,647 2,214$30,000 under $50,000 ............. 135,864 174,238 1,676 3,156$50,000 under $100,000 ............ 64,383 170,576 1,552 5,646
$100,000 under $150,000 ........... 11,101 72,188 630 3,588$150,000 under $200,000 ........... 3,108 35,984 301 2,906$200,000 under $500,000........... 3,148 ?? ,679 456 7,766$500,000 under $1,000,000 ......... 427 31,409 97 4,458$1,000,000 or more .....•.... ...... 199 50,420 52 1.3,311
Total taxable returns ..., •...•. 13,250,925 3,671,162 60,912 I 54,073
Nontaxable returns:No adjusted gross income .••.....•. 9,388 1,374 4,057 472
Under $600 ........................ 18,08J 2.595 9,530 1,560$600 under $1,000 ................. 112,049 10,129 13,125 1,183$1,000 under $1,500 ............... 153,023 16,769 11,076 1,283$1,500 under $2,000............... 183,523 24,518 11,144 1,239$2,000 under $2,500 ............... 184,278 27,875 6,089 666
$2,500 under $3,000 ............... 184,619 31,790 6,993 896$3,000 under $3,500 ............... 152,302 26,460 3,057 794$3,500 under $4,000 ............... 124,246 24,409 2,534 421$4,000 under $4,500 ............... 87,555 19,937 (1 ) (' )$4,500 under $5,000 ...........••.• 47,732 12,474 (1 ) (' )
$5,000 under $6,000 ............... 35,797 8,968 (1 ) (1)$6,000 under $8,000 ............... 18,6J2 6,040 (1 ) (1 )
$8,000 under $10,000 .............. (1 ) (') - -$10,000 or mOre ...........•....•.. 2,130 7,685 56 4,243
Totnl nontaxable returns ....•. 1,314,381 221,384 71,161 I 13,489
Grand total ..•......•......... 14,565,306 3,892,546 132,073 [ 67,562
Returns under $5,000 ................ 8,026,891 1,353,335 109,259 I 13,593Returns $5,000 or more .............. 6,538,415 2,539~211 22,814 53,969
CONTRIBUTIONS
nate in a tax credit on each of :~eD:.:I~~:~ ,:7uC::sME RE~~~:~:~:::"'_~"K""~o,,~,,l15
INCOME BY ADJUSTED aROSS INCOME CLASSES Ishowing eligible dividends. In some cases, small divi-dend receipts may have been eliminated by the applicable exclusion. Returns without an income tax beforecredits naturally had no credit. On other returns wherethe taxpayer had taxable income and income tax, hefailed to take advantage of the credit benefit even thoughhe was entitled to do so. There are 2.5 million returnsthat had a tax credit for dividends received, amountingto $118 million.
Individuals who itemized 'their nonbusiness deductions were allowed a deduction for charitable contributions and gifts. A new provision under the 1954 Codeallows a special additional deduction of up to 10 percent of adjusted gross income for contributions madeto churches, associations of churches, tax-exempt edu- 'cational institutions, and tax-exempt hospit\tls. In caseall contributions are made to such organizations, a deduction up to 30 percent of adjusted gross income maybe claimed. Contributions to organizations other thanthe above are still limited to 20 percent of adjusted grossincome unless the taxpayer qualified for the unlimiteddeduction, retained under the new Code.
In computing the deduction for contributions the taxpayer must first figure his contributions to the specialinstitutions to the extent of 10 percent of adjusted grossincome, then any amount in excess of 10 percent can beadded to the other contributions to' which the 20-percent limitation applies. In reality, the deduction consists of two parts: one a deduction under the 10-percentlimitation, the other a deduction under the 20-percentlimitation. Both limitations apply to the combined adjusted gross income on joint returns as well as the adjusted gross income on separate returns. A descriptionof contributions is given on pages 26-27.
Text table H was prepared to show the number ofreturns that had a deduction for contributions in excessof 20 percent of adjusted gross income and the amountof such excess. This was accomplished by a comparison of the amount deducted on each return with 20 percent of the reported adjusted gross income. If thededuction was found to be over 20 percent of the ad;justed gross income, the number of returns with an excess and the amount of the excess were tabulated in thistable along with the total number of returns with contributions and the amount deducted. These data are byclasses for taxable and nontaxable returns similar tothose in basic tables.
This table shows the total deduction on account ofcharitable contributions to be $3.9 billion claimed on14.6 million returns. There were 132,073 returns onwhich the deduction exceeded 20 percent of adjustedgross income. On these returns, the additional deduction allowed under the new provision amounted to $67.6

Tabl. I.-DEDUCTIBLE MEDICAL EXPENSE AND MEDICAL COST.. BY AGE GROUPS AND BY ADJUSTED GROOS INCOME CLASSES
Under 65 years of age Age 65 years or over
Number of Deduction DeductionMedical and drug cost Medical and drug cost
returns or mediaa Adjusted Adjusted Deduction
Adjusted gross income classes withfor Drugs Medical cost for
expenses Number of gross medical Number of gross Drugs Medical costmedica.l income Total income medical Total
deduetionreturns expenses Amount
returns expensesNumber of Number of Amount Amount AmountNumber of Number of
(ThoulJand (ThoulJand (17IoulJ.IIlId (ThoulJlJnd returns (Thou$and returns (ThoulJl!lld (Thou$lIt1d (17IoUlJ.llnd (Thtxl.snd returns (Thousll1ld returns (ThoulJlJrld
dol18u) dol J~trlJ) dollars) doH lin) dol larlJ) dollarlJ) dollllr$) dol/Ilrlt) dollan) dollars) dollllrs
(1) (2) (3) (4) (5) (6) (7) (8) (9) (10) (11) (12) (13) (14) (15) (16) (17) (18)
Taxable returns:1 $600 under $1,000.............. 35,663 3,416 35,663 31,568 3,416 4,455 20,096 1,038 34 ,663 3,417 - - - - - - - - 1
2 $1,000 under $1,500•.......••.. 121,930 19,594 118,924 149,266 19,222 24,518 81,235 5,894 116,424 18,624 3,006 4,399 372 401 (' ) (1 ) 3,006 386 2
3 $1,500 under $2,000............ 246,770 47,119 224,206 394,554 43,301 58,862 166,506 15,946 214,695 42,916 22,5~ 39,857 3,818 4,200 16,107 1,145 20,030 3,055 3
4 $2,000 under $2,500...•........ 376,797 88,144 332,011 755,950 77,174 105,067 247,190 25,576 325,499 79,491 44,786 101,791 10,970 11,954 25,194 2,748 43,766 9,206 4
5 $2,500 under $3,000•.•......... 462,196 117,995 407,352 1,124,027 105,340 146,223 299,897 35,704 395,330 110,519 54,844 152,224 12,655 14,388 30,613 3,053 53,344 11,335 5
6 $3,000 under $3,500••.......... 632,184 170,~7 560,726 1,825,674 150,541 217,513 410,139 53,493 548,225 1~,020 71,458 232,123 20,106 21,995 37,217 4,975 '70,4-41 17,020 6
7 $3,500 under $4,000•........... 752,500 212,779 669,099 2,514,655 182,585 275,433 499,320 ~,296 655,548 211,137 83,401 314,234 30,194 33,732 52,249 7,338 80,395 26,394 7
8 $4,000 under $4;500•........... 863,672 251,446 810,258 3,446,813 225,471 349,665 597,550 87,944 789,191 261,721 73,414 311,428 25,975 28,790 45,210 5,118 71,414 23,672 6
9 $4,500 under $5,000•...•....... 832,598 244,945 768,332 3,~5,496 221,035 355,505 569,002 84,196 753,812 271,309 ~,266 305,543 23,910 27,083 37,148 6,167 62,750 20,916 9
10 $5,000 under $6,000............ 1,292,770 386,727 1,223,673 6,669,038 349,325 589,770 866,728 140,278 1,194,131 449,492 69,097 376,115 37,402 44,1~ 46,432 6,120 68,597 38,044 10
11 $6,000 under $7,000............ 7~,074 259,016 718,193 4,634,810 227,997 397,844 516,994 93,020 700,654 304,824 45,881 294,~1 31,019 34,242 24,177 3,845 45,381 30,397 11
12 $7,000 under $8,000............ 422,858 162,298 389,155 2,900,848 138,315 243,345 264,036 50,981 379 ,627 192,3~ 33,703 251,856 23,983 29,026 14,105 2,250 32,183 26,776 12
13 $B,OOO under $9,000............ 227,998 94,714 204,743 1,727,951 77,562 137,124 132,015 27,225 201,219 109,899 23,255 197,681 17,152 20,502 13,669 2,381 21,234 18,121 13
14 $9,000 under $10,000••......... 131,523 58,944 116,744 1,103,970 51,069 90,803 74,714 15,881 115,744 74,922 14,779 139,643 7,875 8,650 6,568 1,081 14,779 7,569 14
15 $10,OClO under $15,000.......... 246,584 151,756 197,052 2,328,839 108,813 214,219 112,123 53,306 194,897 160,913 49,532 605,5~ 42,943 51,256 16,471 3,644 48,193 47,612 15
16 $15,000 under $20,CK)()•......... 80,620 ~,955 53,912 922,271 41,095 72,106 25,574 8,268 53,263 63,838 26,708 461,458 23,860 29,829 7,795 2,282 26,272 27,547 16
17 $20,000 under $30,000.......... 65,752 65,445 36,152 862,891 39,277 68,429 14,260 5,986 35,934 62,443 29,600 722,083 26,168 34 ,117 7,287 2,072 28,977 32,045 17
16 $)0,0Cl0 under $50,()(X).......... 36,469 45,105 15,460 569,451 23,850 42,079 4,496 1,974 -15,419 40,105 21,009 792,998 21,255 26,721 4,413 1,225 20,637 25,496 18
19 $50,0Cl0 under $100,()(X)•........ 17,594 26,734 4,477 288,241 10,750 20,417 1,119 607 4,446 19,810 13,117 881,369 15,984 21,747 2,353 614 12,891 21,133 19
20 $100,000 under $150,0Cl0.......• 3,405 5,679 395 46,270 1,351 3,118 112 92 381 3,026 3,010 363,150 4,328 5,841 521 235 2,982 5,606 20
21 $150,0Cl0 under $200,000••...... 1,048 1,855 102 17,249 353 950 33 23 101 927 946 163,002 1,502 2,212 262 76 927 2,136 21
22 $200,000 under $500,000........ 1,123 2,258 77 20,798 262 793 16 7 76 786 1,046 297,~9 1,996 3,034 255 79 1,029 2,955 22
23 $500,0Cl0 under $1,000,000•..... 162 323 3 2,262 13 57 - - 3 57 159 106,171 310 571 49 15 155 556 23
24 $1,000,000 or more •............ 74 163 1 1,209 2 33 1 - 1 33 73 133,736 161 355 2l 5 70 350 24
25 Total taxable returns •... 7,636,3~ 2,482,057 6,886,710 35,984,101 2,098,119 3,418,328 4,903,156 771,735 6,729,283 2,~6,593 749,654 7,248,915 383,938 454,810 388,616 56,483 729,473 398,327 25
Nontaxable returns:26 No adjusted gross income••..... 5,272 4,276 2,667 26,730 3,018 3,017 (' ) (1 ) 2,667 2,824 2,605 24,197 1,258 1,392 (1 ) (') (1 ) (1 ) 26
27 Under $600••.....••••.......... 10,558 2,31B 6,035 2,479 973 1,495 2,499 198 5,535 1,297 4,523 1,791 1,345 1,386 3,006 189 4,006 1,197 27
28 $600 under $1,000.............. B5,341 25,613 69,789 58,084 19,477 22,198 41,825 3,519 67,272 18,679 15,552 12,460 6,136 6,270 8,489 725 13,552 5,545 28
29 $1,000 under $1,500 •........... 118,246 39,922 72,568 93,065 22,480 26,410 46,355 4,689 68,018 21,721 45,678 60,129 17,442 19,353 25,115 3,~5 43,161 15,706 29
30 $1,500 under $2,000•..........• 142,532 67,524 81,732 140,013 36,545 41,60~ 58,485 8,144 77,219 33,462 60,800 105,668 30,979 35,358 36,155 4,567 57,815 30,791 30
31 $2,000 under $2,500............ 141,515 65,730 80,591 lBO, 148 37,379 44,027 57,449 7,867 78,591 36,160 60,924 134,094 2B,351 30,673 36,299 4,993 58,435 25,680 31
32 $2,500 under $3,000•........... 149,437 73,428 92,090 254,225 41,515 50,706 69,918 9,105 89 ,573 41,601 57,347 157,569 31,913 35,381 35,819 5,326 54,330 30,055 32
33 $3,000 under $3,500............ 123,495 67,478 85,166 276,438 35,690 45,174 56,923 10,023 82,169 35,151 38,309 122,716 31,788 37,813 24,178 4,539 37,792 33,274 33
34 $3,500 under $4,000............ 93,700 51,390 80,035 298,679 32,711 43,383 59,343 8,580 79 ,518 34,803 13 ,665 50,266 18,679 28,866 7,080 1,394 13 ,665 27,492 34
35 $4,CK)() under $4,500•........... 59,422 30,497 51,342 218,172 21,197 28,904 36,258 5,732 49,342 23,172 8,080 34,284 9,300 9,730 6,563 1,655 8,080 8,075 35
36 $4,500 under $5,CKX)............ 33,689 21,488 26,581 124,988 13,068 17,546 21,528 3,520 25,582 14,026 7,108 33,498 8,420 11,365 5,602 1,112 6,591 10,253 36
37 $5,000 under $6,000•.......•... 27,245 22,614 24,694 132,373 18,548 23,397 21,177 3,758 24,694 19,639 2,551 13,699 (1~66 4,189 (l) (') 2,551 3,945 37
38 $6,000 under $8,000 ............ 11.,060 16,533 9,063 61,074 9,430 13 ,450 8,546(1f'1
8,563 11,159 (1 ) (1 ) (1 ) (1 ) (') (1 ) (1 ) 38
39 48,000 under $1O,0Cl0•........•• (1 ) (1 ) (1 ) (1 ) (') (1) (1 ) (1 ) (') - - - - - - - - 39
40 $10,000 or more •.....•......... 751 1,054 491 8,056 661 990 152 60 491 930 260 7,222 373 725 87 31 255 694 40
41 Total nontaxable returns. 1,002,783 493,391 683,364 31,845,801 296,238 366,009 484,079 68,929 659,734 297,080 319,419 3744,079 197,15~ 230,486 195,019 26,723 303,855 201,763 41
42 Grand totaL ............. 8,639,147 2,975,448 7,570,074 337,829,902 2,394,357 3,784,337 5,387,235 840,664 7,389 ,017 2,943,673 1,069,073 37 ,992,994 581,091 685,296. 583,635 85,206 1,033,328 600,090 42
43 Returns under $5,000•.....•...•.. 5,307,517 1,605,749 4,575,187 315,527,7~ 1,292,138 1,861,707 3,344,639 435,657 4,458,873 1,426,050 732,330 32,169,877 313,611 360,150 436,653 58,640 704,198 301,310 43
44 Returns $5,000 or more •.•... ; .. " 3,331,630 1,369,699 2,994,887 22,302,138 1,102,219 1,922,630 2,042,596 405,007 2,930,144 1,517,623 336,743 5,823,117 267,480 325,146 146,962 26,366 329,130 298,780 44
See text for "Description of Sample and Limitations of Data. II
lSarnple variability of this item is too large to warrant showing it separately. However, this value is included in each total.2Ad justed grosa deficit.JAdjusted gross income less adjusted gross deficit.
~Cl')
......Zt::I......-<......t::I~
>t"'......ZClo~t:rj
~t:rj""'3~~Zr.nl'%jo~
~
c:e01
"'"

INDIVIDUAL INCOME RETURNS FOR 1!)54 17
DRUG AND MEDICAL COSTS
Information relating to medical cost was tabulatedfrom the schedule for itemized deductions on long-formreturns, Form 1040, for 1954, if the taxpayer claimed adeduction on account of medical and dental expenses.These data are presented in text table I on page 16.
Three major changes regarding the medical and dental expenses and the allowable deduction were made bythe 1954 Code. First, medical expenses in excess of 3percent of adjusted gross income may be deducted.Second, outlays for drugs and medicines may be included in medical expenses only to the extent that theyexceed 1 percent of adjusted gross income. Third, thelimitations on the maximum deduction are raised to$2,500 per exemption and to $5,000 per return exceptthat it is $10,000 on a joint return, a head of householdreturn, or a surviving spouse return.
'When claiming a deduction for medical expenses, thetaxpayer was required to report the cost of drugs andmedicines separately from other medical and dental cost.Each of these two amounts was reported in its entiretyas net, that is, they did not contain any expenses compensated by insurance or otherwise. These reportedcosts, however, were before any of the limitations applicable to the deduction had been applied. Drugs werereported without regard to an amount equal to one percent of adjusted gross income to be excluded later, andmedical costs were reported without regard to anamount equal to 3 percent of adjusted gross incomewhether or not it was later excluded.
In text table I, the entire expense of both drugs andmedical costs, as reported, by the taxpayer, are shownfor each of two age groups: under 65 years and 65years or over. Data taken from joint returns whereonly one spouse was 65 years of age or over were tabulated with age group 65 years or over, because on suchreturns, the medical deduction was allowed as thoughboth spouses were 65 or over. In addition to the drugand medical costs, there are tabulated also the actualmedical deduction claimed, the related adjusted gross income, and number of returns involved. All of theseitems are shown for taxable and nontaxable returns,each by adjusted gross income classes used in the basictables.
A description of medical expenses to be considered forthis deduction and the limitations on the amount to bededucted, whether under 65 or 65 or more years of age,whether joint or separate return, are given on page27 in the description of Medical and Dental Expenses.
There were 8.6 million returns which had a deductionfor medical expenses; 7.6 million of these returnsshowed age under 65 years and 1.1 million showed age65 years or over.
The cost of drugs was reported as $0.9 billion andother medical cost reported as $3.5 billion. Of the COIll
bined drug and medical costs amounting to $4.5 billion,$3 billion was claimed as a deduction from adjusteo
gross income. Thus two-thirds of the entire cost wastaken as a deduction. However, there was a wide ~ariation in the percentage of cost claimed between the returns with age under 65 and returns with age 65 or ~ver.The combined drug and medical costs reported oh returns with age under 65 were $3.8 billion of whicl~ $2.4billion, or 63.3 percent, was claimed as a medical deduction. On returns with age 65 or over, the Icombined drug and medical costs were $0.7 billion of Which$0.6 billion, or 84.8 percent, was claimed as a dedu9tion.While both age groups show that there were disallowedmedical expenses, the special provision for age 65 yearsor over permitted this group to claim 21.5 percent !moreof their expenses than could be claimed by the JJroupunder 65 years of age.
Of the total deduction for medical and dentll expenses, $1.6 billion was claimed on returns with adj6stedgross income under $5,000. This deduction repres~nted72 percent of the combined drug and medical costs re-
I••ported on this category of returns. The rema~mng
medical deduction of $1.4 billion, reported on r~turns
with $5,000 or more adjusted gross income, was 5t1 percent of the combined drug and medical costs repprtedon these returns. By coincidence, the two categoriesof returns each reported $2.2 billion combined drug andmedical costs before the limitations.
RETIREMENT INCOME
The new provisions relating to retirement income alIowan individual a credit against the income ta~ forretirement income, if certain conditions are. met! Toqualify, an individual must have received e:lrned iltcomein excess of $600 in each of 10 calendar years! (notnecessarily consecutive) before the beginning of th~ current year. Widows and widowers whose spous¢ hadreceived such prior earnings are considered to hate received such earned income. If husband and wif~ bothqualify and have retirement income, each i.s entit~ed tothe credit as individuals, even though filing jointly.
For the purpose of tax credit, retirement incotne inthe case of individuals under 65 years of age differsl fromretirement income of individuals 65 years of age 01'1 over.If the individual has not attained the age of 65 lileforethe close of the tax year, retirement income meanJ onlyamounts received from pensions or annuities un~er apublic retirement system. For individuals who ~re 65years of age or over before the close .of the tax i~ear,retirement income means amounts receIved as peI~SlOnS,
annuities, interest, dividends, and gross rents. fo beconsidered retirement income, such amounts m~st beincluded in adjusted gross income. Regardless of age,the maximum amount of retirement income allow~d forcomputation of tax credit is $1,200. Howevet, theamount of retirement income allowed as the base &f tax
• • Icredit is the smaller of (a) the retIrement lllcome re-ceived, or (b) $1,200 reduced by amounts receive~ and
• • I ..excluded from gross ll1come as penSIOns or annUItIes

18 INDIVIDUAL INCOME RETURNS FOR 1954
under social security and railroad retirement, or taxexempt pensions and annuities, and, in the case of anindividual who is not 75 years of age before the end ofthe year, reduced by the amount of earned income inexcess of $900 received during the tax year.
The tax credit, computed at 20 percent on the base fortax credit, is limited in that it may not exceed theincome tax reduced by credits for dividends received,partially tax-exempt interest, foreign tax paid, and taxpaid at source on tax-free covenant bonds. In order tosecure this tax credit, an individual must file Form 1040,either long- or short-term.
Data relating to refirement income reported in schedule K, Credit for Retirement Income, on returns thathad a tax credit for retirement income, are tabulated intwo text tables. In both tables, data are distributed byadjusted gross income classes for the taxable and thenontaxable returns, corresponding to those in the basictables.
TeJ!<t table J shows the number of returns with a taxcredit for retirement income, the total amount of retirement income that met the specified definition, the twodeductions from the $1,200 limit, the base for credit, andthe tax credit for retirement income. Frequencies inthis tabulation are on a return-count basis.
In text table K, the number of persons with a taxcredit for retirement income, the amount of retirementincome conforming to the definition, and the base forcredit are shown for two groups: persons under 65 yearsand persons 65 years or over. In addition, there are thetotal number of persons with a tax credit and the twodeductions from the $1,200 limit, but the deductions arewithout the division as to age groups. Frequencies foritems in this table are on a per capita basis.
There were 473,243 returns with a tax credit for retirement income. A total of $2.3 billion of retirementincome was reported on these returns. However, onlya portioil of this retirement income was used as the basefor credit, because of the limitation on the amount of
Tabla J.-RETIREMENT INCOME. SPECIAL DEDUCTIONS. AND TAX CREDIT FOR RETIREMENr INCOME. BY ADJUSTED GROSS INCOME CLASSES
Deductions from the $1,200 limit
Retirement incomeexcluded from adjusted
gross inc orne
Earned income inexcess of $900Adjusted gross income classes
Numberof retu.rnswith tax
credi t forretirement
income
(1)
Totalretirement
income
(ThouslJ(Iddollllrs)
(2)
Number ofreturns
(3)
AmOW1t
(Thousanddollarlf)
(4)
Number ofreturns
(5)
Amount
(Thoua.nddollars)
(6)
Base forcredit
( ThoulJlt1tddo1Jltu)
(7)
Tax creditfor retirement income
(Thol/sanddoll at's)
(S)
Taxable returns:1 $600 W1der $1,000•.................................................•.....2 $1,000 W1der $1,500•........•.•...........................•.............•3 $1,500 UIlder $2,000••.....•...•.•..•.............•.........•.•...........4 $2,000 under $2,500•.....................................................
5 $2,500 under $3,000•.....................................................6 $3,000 under $3,500 .7 $3,500 under $4,000 •.....................................................8 $4,000 under $4,500•.....................................•...............9 $4,500 under $5,000.................................•....................
(1 )7,114
16,158
15,62425,81323,76226,75124,271
(' )9,922
21,842
34,07461,93661,36271,62673,126
4,5519,681
5,06811,61410,635
7,0859,126
1.,0126,766
4,6936,3607,6615,8487,054
(')4,051
(')3,092
(')4,5404,051
(')2,845
(1 )2,253
(1 )5,4993,580
(1)2,6366,961
11,03018,40113,99'719,43417,717
1(1) 2
391 31,517 4
2,326 53,989 63,226 73,636 63,708 9
1011121314
1516171619
$5,000 W1der $6,000 ' .$6,000 under $7,000•.....................................................$7,000 W1der $8,000•.....................................................$8,(0) under $9,000 .$9,000 under $10,000•....................................................
$10,000 W1der $15,000 , .$15,000 under $20,000 .$20,000 under $30,000 .$30,000 under $50,(0)•.....•...............................•..........•..$50,000 W1der $100,000 .
28,88619,76719,17114,1688,040
29,58812,70911,851
8,1924,577
106,58892,10389 ,91798,58751,165
247;792142,532191,196182,661187,541
7,5974,5575,5333,051
(1)
9,1424,0243,9353,0541,534
6,8083,6065,0812,795
(')
8,3803,6223,4532,9391,405
1,685752449422232
6,3083,170
(1 )(1 )(')
3,327661
1,1263,5702,037
25,59019,46515,69615,.345
7,759
28,83213,70211,143
7,4534,591
5,311 103,661 113,537 123,078 131,583 14
6,091 152,519 162,459 171,557 16
926 19
2021222324
$100,000 UIlder $150,000.................................................. 1,013 71,976 339 454 47 173 937 195 20$150,000 under $200,000.................................................. 341 35,310 134 131 15 226 317 66 21$200,000 under $500.000............. 354 54,779 107 102 17 241 351 72 22$500,000 under $1,000,000................................................ 60 21,079 13 14 2 16 60 13 23$1,000,000 or more•...................................................... f- 29-+__2_6-:.-.5_5_4+- 6+ 5t- 3+- 1+ 30+ ---l6 24
25 Total taxable returns •............................... :' . 298,764 1,933,939 102,223 84,742 31,048 40,253 241,738 50,323 25
Nontaxable returns:26 No adjusted gross income •................................................ - 26
671 37- 36- 39
666 40
3,643 322,339 331,208 34
760 35911 36
- 27(') 26
716 294,344 305,385 31
117
5,322
28,22420,392
6,8285,9325,466
(')18,65748,35140,932
1,355(')
(')(1 )
3,534(1 )
(')(1)
(')6,5723,942
(')(1 )
(')(')(')
(')(')(')(')(' )
(')10,584
7,091
1,083
11,882
70,53453,27917,54112,09117,099
(1 )23,21061,61082,159
326
3,068
25,23817,760
6,6154,0544,546
(')19,64350,34641,892
Under $600 .$600 W1der $1,000•......................................................$1,000 W1der $1,500.....................................................•$1,500 W1der $2,000 .............................•.•......................$2,000 under $2,500 .
$2, 500 W1der $3,000 .$3,000 W1der $3,500................•...................................•.$3,500 W1der $4,000•......................................................$4,000 W1der $4,500•...............•....................•.••.............•$4,500 W1der $5,000•........................•...........................•
$5,000 W1der $6,000•....•...•....•••...........•....•.......•...•..•..••.$6,000 under $8,000 .$8,000 W1der $10, (0)•...•................................................$10,000 or more •......•...•..............................................
I---+---+---+----+----+---+----+------l
3233343536
2726293031
37363940
41 Total nontaxable returns•..........................................
42 Grand total•.......................................................
174,479 371,534
473,243 2,305,473 126,557
18,724
103,466
7,636
38,684
3,847
44,100
181,197
422,935 71,198 42
43 Retw-ns under $5,000•......•.........................................•.....44 Returns $5,000 or more•..•................................................•
311,101 692,728162,142 1,612,745
84,01444,543
63,13640,328
27,94510,739
22,10721,993
266,225156,710
36,363 43'32,815 44
See text for IIDescription of Sample and Limitations of Data. 1I
ISample variability of this item is too large to warrant showing it separately. However, this value is included in each total.

TAnULATED DATA
In addition to the specific data tabulated in the texttables, financial data reported on individual incom taxreturns for 1954, relating to income, deductions, Iandtaxes are tabulated ][n sixteen basic tables. The fir~t 12tables and table 15 present information on a nadonalbasis, while tables 1:3, 14, and 16 present informatidn ona State basis. Data are distributed by size of adj*stedgross income in 12 of these basic tables, 6 of which show
INDIVIDUAL INCOME RETURNS FOR 1954 19Table K.-RETIREMENT lNCOME AND SPECIAL DEDUCTIONS FOR PERSONS WITH TAX CREDIT FOR RETIREMENT INCOME BY AGE OItOUPS AND ADJUSTED GROSS INCOME CLASSES
Under 65 years of age Age 65 years or more Deductions from the $1,200 limit INumber of Retirement income Ipersons excluded from adjusted
Earned income in..... ith tax Retirement Base for Retirement Base for excess of $900
Adjusted gross income classescredit for Number of income credit Number of income credH gross income
retirement persons personsAmount Airount
Number of Number ofincome (ThoulflJnd (Thouallnd (ThoutJlJnd (1lJou.,nd persons (ThoUIJIfTld persons (~;;:;:tdolllUII) doll~r.) dollllrll) dolllll"S) dollllrtl)
(1) (2) (3) (4) (5) (6) (7) (8) (9) (10) (ll) I
Taxable returns: I1 $600 under $1,000•••....•.................... - - - - - - - - - - - 12 $1,000 under $1,500••...... (1 ) (1) (1 ) (1) - - - - - - I 2. . . . ..............3 $1,500 under $2,000 ........... ; .............. 7,114 (1 ) (1) (1) 6,097 9,279 1,993 4,551 4,012 (1)
(1)j3
4 $2,000 under $2,500.......................... 16,158 2,023 3,616 1,950 14,1)5 18 , 226 5,031 9,601 6 , 766 4,051 2, 5 4
5 $2,500 under $3,000.......................... 15,624 4,017 7,EIY. 4 , 149 11,607 26,470 6)881 5,068 4,693 (1 ) (1 ) 56 $3,000 under $3 , 500••.•...................... 26,252 2,000 3 , 215 1,515 24,252 58,721 16,886 12,114 8,3BO 3 , 092 2,2 3 67 $3,500 under $4,000.......................... 23,782 2 , 049 3,176 1,696 21 , 733 58,186 12) 301 11,652 7 , 661 (') (1) i 78 $4 ,000 under $4,500...................•...... 26,751 6 , 119 9,518 4 , 763 20,632 62 , 108 14) 671 7,102 5, 848 5,557 5 , 4 9 89 $4,500 under $5 , 000•......................... 24,271 2,040 6,039 1,771 22,231 67,087 15 j 946 8 , 609 7,054 4,051 3,5 0 9
10 $5,000 under $6,000.......................... 30,386 3,068 3,157 2,082 27,318 103,431 23,508 7,597 6,808 4 , 081 6,3l8 10II $6,000 under $7,000.......................... 22,790 5,068 12,552 3,840 17,722 79 , 551 15.625 5,546 3,606 4,051
"'rII
12 $7,000 under $8,000.......................... 19 , 171 2,523 3,035 2 , 659 16,648 86,BB2 13:.037 6,033 5,081 (1 ) (1 ) 1213 $8,000 under $9,000.......................... 15,692 (1 ) (1) (1 ) 14,175 94,222 13 "641 3 , 051 2,795 (1 ) (1 ) 1314 $9,000 under $10,000......................... 8,040 (1 ) (1 ) (1 ) 7,040 46,401 6,650 (1 ) (1) (1) (1 ) 14
15 $10,000 under $1.5,000........................ 32,164 1,567 3,072 1,386 30,597 244,720 27.446 10 , 768 8,380 1,882 3,3 7 1516 $15,000 under $20,000......................... 13,668 412 1,536 323 13 , 256 140 , 996 13:.379 4 , 600 3,622 858 861 1617 $20,000 under $30,000........................ 12,418 404 1 , 660 425 12,014 189,536 10,718 4,251 3,453 473 1,126 1718 $30,000 under $50,000........................ 8 , 81.5 142 952 145 8 , 673 181,709 7,308 3,247 2,939 430 3,570 1819 ~,50,000 under $100,000....................... 4,728 75 1,460 56 4,653 186 , 081 4,535 1,647 1,405 211 2,0'7 19
I20 $100,000 under $150,000...................... 1 , 035 4 380 4 1,031 71,596 933 346 454 50 1~3 2021 $150,000 under $200,000...................... 362 3 327 4 359 34,983 313 143 131 14 2~6 2122 $200,000 under $500,000...................... 372 2 2 1 370 54 , 777 350 116 102 17 241 2223 $500,000 under $1,000,000.................... 60 - - - 60 21 , 079 60 14 14 2 16 2324 $1
'°00,000 or more •..... '..................... 29 - - - 29 26,554 30 6 5 3 11 24
25 Total taxable returns •................. 310,182 35,550 71,344 30,'.96 274,632 1,862,595 211,242 107,579 84,742 35,432 40,2~3 25
Nontaxable returns:26 No adjusted gross income •.................... - - - - - - - - - - - 26
27 Under $600.-.. ................................. - - - - - - - - - - - 2728 $600 under $1,000............................ (1 ) (1 ) (1 ) (1 ) - - - - - - - 2829 $1,000 under $1,500.......... '" ............. 19,643 4,557 5,550 4,397 15,086 17, 660 14,260 (1 ) (1 ) - - 2930 $1,500 under $2,000.......................... 50,346 7,067 10,290 8,129 43,279 71,520 40,222 10,584 6,572 3,534 1, 55 3031 $2,000 under $2,500... ...................... 41,892 4,568 7,017 4,657 37,324 75,142 36,275 7,591 3,942 (1) (1 ) 31
32 $2,500 under $3,000.......................... 25,238 4,585 7,846 4,669 20,653 62,688 23,555 (1) (1 ) (1 ) (') 3233 $3,000 under $3,500.......................... 21,362 (I) (1 ) (1 ) 19,845 51,307 18,857 (1 ) (1) (1 ) (1) 3334 $3,500 under $4,000.......................... 7,689 (1 ) (1) (1 ) 7 , 200 15,736 6,241 (1 ) (') - - 3435 $4,000 under $4,500.......................... 5,577 - - - 5 , 577 12 , 091 5,932 (1 ) (1 ) - - 3536 $4,500 under $5,000.......................... 5,070 - - - 5,070 17,099 5,466 (1 ) (1 ) - - 36
37 $5,000 under $6,000.......................... 5 , 102 (1 ) (1) (1 ) 4,585 10,532 4 , 702 - - -
I ~37
38 $6,000 under $8,000.......................... - - - - - - - - - - 3839 $8,000 under $10,000......................... - - - - - - - - - - 3940 $10,000 ot more •............................. 328 - - - 328 1 , 083 117 - - - 40
41 Total nontaxable returns .... , .......... IB3,236 24,289 36,676 25 J 570 158,947 334,858 15~,,627 30,994 18,724 B,653 3,847 41
42 Grand total ............................ 493,41B 59,839 108,020 56,066 433,579 2,197,453 366 , 869 138,573 103,466 44,085 44,~OO 42
I43 Returns under $5,000........ , ........•......... 318,258 43,537 69,408 41 , 708 274,721 623,320 22L.,517 89 ,691 63,138 30,496 22,107 4344 Returns $5 , 000 or more ......................... 175,160 16,302 38,612 14 , 358 158,858 1,574,133 14;!,352 48,882 40,328 13 ,589 21,193 44
See text for "Description of Sample and Limitations of Data. II j.ISamp1e variabi~ity of this item is too large to warrant showing it separately. However, this value is included in each total.
retirement income that could be used in the computation of husband and wife. Of the 493,418 persons witl re-of retirement credit. The tabulations show that the base tirement credit, 12 percent were under 65 years of lage.for credit was $0.4 billion. This is only 18 percent of Their retirement ineome was $0.1 billion, less th~n 5the reported retirement income.' The maximum retire- percent of the total reported. Eighty-eight percelit ofment income allowed for computing the credit was $1,200 the individuals were 65 years of age or over and theyfor each retired person, but this maximum was reduced had $2.2 billion of retirement income. However, Iper-by the amount of nontaxable pensions and annuities and sons under 65 years, as a group, were able to use 52by the earnings in excess of $900. Moreover, this di- percent of their retirement income as the base for crbdit,minished limitation was allowed as the base for credit while those 65 years or over were able to use only 17only where it was less than the retirement income re- percent of theirs.ceived. There were many insirunces in which retirementincome was smaller than the diminished limitation and,therefore, became the base for credit.
Deductions from the $1,200 limit were $103.5 millionfor nontaxable pensions and annuities and $44.1 millionfor the excess earned income.
Text table K shows that there were 493,418 personswho claimed the tax credit for retirement income. Approximately 20,000 of these individuals were the spouseof a retired person who also claimed a retirement income tax credit, both being reported on a joint return

20 INDIVIDUAL INCOME RETURNS FOR 1954
I
the taxable and nonta.xable returns separately and inthe remaining 6 they are combined. In one basic table,data are' tabulated by size of taxable income, a newclassification. In tables where data from taxable andnontaxable returns are tabulated together, the data fromnontaxable returns are in the class indicated by theamount of adjusted gross income reported.
Table 1 shows the number of returns with adjustedgross income, amounts of adjusted' gross income, taxable income, and income tax liability after credits, tabulated by adjusted gross income classes, as well as cumulations at every income class level from the lowest classand from the highest class, together with correspondingpercentages of the total. In these distributions, taxableand nontaxable returns with adjusted gross income arecombined, but nontaxable returns with no adjusted grossincome are shown in aggregate, apart from the returnswith income.
In table 2, the amounts of income and loss from eachof the sources comprising adjusted gross income areshown as reported on returns with standard deductionand with itemized deductions. For returns with itemized deductions, these items are subdivided between returns with adjusted gross income and returns with noadjusted gross income, and the amount of each nonbusiness deduction is given for both categories of returns.These items include the combined taxable and nontax.able data.
Table 3 contains the sources of income and loss comprising adjusted gross income for all returns and thenonbusiness deductions reported on returns with itemized deductions. These items are combined for taxableand nontaxable returns and are distributed by adjustedgross income classes, the intervals of which are broaderin some instances than in other basic tables.
Table 4 presents, by adjusted gross income classes, theamount of each source of income and loss comprisingadjusted gross income, as well as exemptions, taxable income, income tax before credits, tax credits, income taxliability after credits, and items pertaining to taxpayments. In addition to the amounts, there are frequencies for these items where pertinent. Part I of thistable includes data for all returns; Part II shows thesedata for joint returns only; and Part III has similardata for returns other than joint returns. Throughoutthe table, taxable and nontaxable returns are shownindependently.
Table 5 includes data lor returns with itemized nonbusiness deduction only, tabulated separately for taxableand nontaxable returns, each by adjusted gross incomeclasses. These data embrace the number of returns,amount of adjusted gross income, the various itemizeddeductions, exemptions, taxable income, income tax before credits, tax credits, and income tax liability aftercredits, together with appropriate frequencies.
In table 6, there is a distribution of the number ofreturns by adjusted gross income classes, cross classifiedby size of a specified source of income or loss reported
in adjusted gross income. Most of the sources are included in this cross classification, however, frequenciesfor net operating loss deduction and fiduciary loss arenot available. Taxable and nontaxable returns are combined and certain of the adjusted gross income classesare merged.
Table.7 has a distribution of the number of returnsby adjusted gross income classes, cross classified by thesize of specified itemized deductions. Only four deductions-contributions, interest paid, taxes, and medical expenses-are included in this tabulation. Taxableand nontaxable returns are combined and the adjustedgross income classes are the same as those in table 6.
Table 8 shows data tabulated by a new classificationbased on the amount of taxable income. In this table,there are the number of returns with taxable income,the amount of taxable income, total tax credits, dividend received credit, retirement income credit, normaltax and surtax, and alternative tax, both taxes beingafter credits. Because different tax rates, depending onthe marital status of taxpayer, are applied to taxableincome, the tabulation of these data are set in threeparts, each signifying an applicable tax rate. Part I isfor joint returns and returns of surviving spouse, bothof which are entitled to split-income. The taxable income class intervals correspond to the brackets of thegraduated rate schedule used for such returns. Part IIis for separate returns of husbands and wives and returns of single persons not head of household or surviving spouse, both of which use the regular tax rates.The taxable income class intervals correspond to thebrackets of that graduated rate schedule. Part III is forreturns of heads of household entitled to use the ratesprovided for this status. The taxable income class intervals in this part correspond to the bracket of that graduated rate schedule. In each part, taxable and nontaxablereturns are shown separately. Taxable income was mechanically computed for short-form returns, Form 1040,and for returns, Form 1040A, so that all returns with apositive amount of taxable income were included in thistable whether or not the amount was reported by thetaxpayer.
Table 9 contains data from taxable returns only andshows the number of. returns with income tax, amountof adjusted gross income, taxable income, income taxliability after credits, average income tax per return,and effective income tax rate based on taxable income.All these data are distributed by adjusted gross incomeclasses for all taxable returns, for returns with normaltax and surtax, and for returns with alternative tax.
In table 10, the number of returns, amount of adjusted gross income, exemptions, taxable income, and income tax liability after credits are shown for all returns and for returns in each of the five categories inthe classification for martial status of taxpayer. Theseitems are tabulated by adjusted gross income classes fortaxable returns and for nontaxable returns.

INDIVIDUAL INCOME RETURNS FOR HI54
~I~-
I 21I
Table 11 gives an analysis of the personal exemptionsclaimed by the taxpayer. Here are the total number ofexemptions claimed, the number of additional exemptions claimed for age and blindness, and the number ofexemptions other than age and blindness, that is, the percapita exemption for the taxpayer, his spouse on a jointreturn, and his dependents. In addition, there is a frequency distribution of returns by specified numbers ofexemptions other than age or blindness (per capita).These data are distributed by size of adjusted gross income, separately for taxable and nontaxable returns, foreach of the five categories in the classification for maritalstatus of taxpayer.
Data in table 12 pertain to the details making up thenet gain and net loss from sales of capital assets includedin adjusted gross income. Because of the different treatment for capital gain and for capital loss, details fromreturns with a deduction on account of a capital loss areshown apart from details from returns with a capitalgain. Returns with a capital loss are subject to normaltax and surtax, but returns with a capital gain are subject to the alternative tax under certain circumstances.Therefore, the latter returns are segregated in the tabulation to show details for capital gain subject to normaltax and surtax apart from details for capital gain subject to alternative tax. In each breakdown, there arethe amounts of net short-term capital gain and loss(after carryover), net long-term capital gain and loss,and capital loss carryover from the 5 preceding years.Other data include capital loss before statutory limitation regarding the deductible loss, amount of capital lossdeducted from gross income, capital gain. included inadjusted gross income, and the entire excess of net longterm capital gain over net short-term capital loss whichwas taxed at the special rate of 25 percent. All thesedata are shown separately for taxable and nontaxablereturns, by adjusted gross income classes.
Table 13 presents in aggregate for each State andTerritory certain sources of income, adjusted gross income, and income tax liability after credits reported onreturns with adjusted gross income. These data are fortaxable and nontaxable returns combined. For the firsttime, Puerto Rico is a separate entity in the State andTerritory classification. The sources of income tabulated by States have been expanded this year to include the combined business net profit and loss, thecombined partnership net profit and loss, the combinednet gain and loss from sales of capital assets, and thecombined rents and royalties net income and loss, inaddition to the amounts of salaries and wages, dividends,and interest, which were the only items of income formerly tabulated. A frequency of the number of returnsfor each source presented is also shown.
In table 14, the number of returns, amount of adjustedgross income, and income tax liability after credits,reported on returns with adjusted gross income, aretabulated for each State and Territory, by adjustedgross income classes established especially for this table,
which differ somewhat from those used elsewhere! fornational distributions. Taxable and nontaxable retjurnsare combined in this tabulation.
Table 15 shows information taken from returns, Form1040, that had a self-employment tax reported by thetaxpayer. This information is presented on a nationalbasis by adjusted gross income classes without regard tothe income tax status. The number of returns with selfemployment tax, amount of adjusted gross income onthese returns, and the self-employment tax are sl}ownfor all returns with this tax. In addition, the returnswhich had self-employment tax without an income tax,although included in the distribution for all re~urnswith self-employment tax, are also shown by themsJlves.
Table 16 presents data from returns, Form 1040, IWithadjusted gross income and with self-employment tax.These data include the number of returns with Jselfemployment tax, amount of adjusted gross income andself-employment tax, distributed on a State basis. I Noself-employment tax was reported on returns filetl bycitizens residing in Puerto Rico. Returns, Form 11040P. R., filed by Puerto Ricans for self-employment taxpurposes were not processed for statistics. I
i
DESCRIPTION OF THE SAMPLE ANDfLIMITATIONS OF DATA !
,,
The data presented for individual income tax returnsfor 1954 are based on a stratified systematic sample' consisting of 100 percent of returns showing adjusted grossincome of $150,000 or more and of various lesser! percentages of returns showing adjusted gross income under $150,000. More than 240,000 returns were sel~ctedin 64 district directors' offices. These represented ~bout0.4 percent of the total population of 56.8 millio~ in-dividual returns filed throughout the country. i
Description of tbe sample.~TableL shows the pumbel' of returns processed, the number of returns ih thesample, the prescribed sampling ratio, and the achievedsampling ratio, by estimating strata. The diffetencebetween the prescribed sampling ratio, and the achievedsampling ratio ariBes from three sources: incom1pletenumbering series, nonresponse, and the normal vari~tionbetween expected sample size and actual sample size.
In addition to the stratification imposed by selebtingreturns from each internal revenue district, the salmpleselection was adapted to the regular return sorting procedures which are employed in the district offices ~o fa-
!Tabl. Lo_NUMBER OF INDIVIDUAL INCOME TAX RETURNS PROCESSED FOR 19&f, mn.\uER .
OF RETURNS IN SAhlPI.E, AND SAhlPLE RATllll, BY ESTlhlATINO STRATUhI 1I
Sample stratum Number of Number of Sample r.tloB
Adjusted groBs incomereturns returns
IPrescribec~ChlevedForm Type of return processed in sample
10{,()A
r~ ';;;;000::::::::: ............ 13,278,525 26,204 1/500 I 1/507All. 00.0.000 41,456,390 82,663 1/489 1/502
$10,000 under $30,0000 Business ••.. 11 '914'376 79,304 1/23 1/241040 $10,000 under $50,000. Nonbusiness.
$30,000 under $150,000 Business ..•.161,771 45,175 9/30 9/32$50,000 under $150,000 Nonbusiness.
$150,000 and over ....• All ......... 7,130 7,130 1/1 1/1
Grand total, all returns .•.....•.•.. 56,818,198 240,476 - i -

22 INDIVIDUAL INCOME RETURNS FOR 1954
Tobie N.-SAMPLINO VARIABILITY OF ESTIMATED NUMBER OF RETURNS
lSample is not large enough to give reliable estimate of the sampling variabilityfor this i tern.
of less than $150,000 are subject to sampling variability.Table N below shows the range within which we wouldexpect to find 19 out of 20 estimates prepared fromsamples similarly selected. In the preparation of thistable, it was assumed that systematic selection withinstrata would yield results equivalent to simple randomsampling. For instance, if data from returns showingadjusted gross income of under $10,000 reveal 500,000returns having a certain characteristic, the chances are19 out of 20 that the difference between this figure andthe one that would have been obtained from a completecount is less than 31,530.
And if the adjusted gross income class ofreturns to which the estimate refers is-
100230460560
410
280630
1,4101,980
2,7705,4806,280
(1)3,1607,080
10,010
14,15031,530«,39095,490
U d $10 000$101000 under $50,000 under
n er, $50,000 $150,000
Then the chances are about 19 out of 20that the difference between this estimatedmunber of returns and the figure that wouldbe obtained from a count of all returns isless thaIl;-
If the estimated number of returns is-
1,(XX) •••• ; •••••••••••••••••••••••••••••••5,(XX) •••••••••••.••••••••••••••••••••••••25,(XX) •••••••••••••••••••••••••••••••••••50,000 .....•...................•.•.......
100,000 ......•...........................500,000 .•............•...................1,000,000..........•.•..•................5,000,000 ............•..................•
cilitate collection and audit requirements. Returns aresorted on the basis of type of form, kind of schedulesattached, size of adjusted gross income, and taxpaymentstatus, as reported by the taxpayer. These sorts constituted effective sampling strata because the characteristics on which the strata are based correlate highlywith income and tax characteristics.
Inflating sample values to population size.-Thesample values were extended to the returns they represented by multiplying them by "weighting factors."These weighting factors were derived for each class ofreturn by dividing the number of sample returns intothe total number of returns filed. For instance, theweighting factor of 507 for Form 1040A returns wasobtained by dividing the number of returns in the sample, 26,204, into the total number of returns filed, 13,278,525. The primary sources of population data werecounts made and submitted by the district offices showing the numbers of Form 1040A and Form 1040 returns processed.
In comparing the weighted sample numbers of returns with the figures presented as national totals forsimilar classes of returns, slight discrepancies will· benoted. As shown in table M, the discrepancies resultfrom the elimination of certain returns and the reclassification of others in preparing the tables.
Tobie O.-RELAT1VE SAMPLING VARIABILITY OF ESTIMATED ADJUSTED GROSS INCOMEAOGREOATF.S FOJl SELECTED CLASSES OF RETURNS
Under $10,000.................................. 188,190,533 0.35$10,000 under $50,000.......................... 33.829,629 0.19$50,000 under $150,000.... ..•.•... .•........ 6,047,527 0.25$150,000 and over 1-_---=2:!.:,1~68~,~16:::::6+_---___::0.:.:.0:::.0
All classes.............................. 230,235,855 °.29
Deletion of certain entries.-Throughout the tablesthe policy has been followed of deleting where possiblethose entries where the estimated relative error traceable to sampling variability was judged to be excessive.These cells are appropriately noted in each instancewhere this deletion has occurred.
A general table of sampling variability for estimatesthat are based on returns from the several strata is notpractical to prepare because of the large number ofentries in the tables. The sampling variability for thevalue in each such cell must be estimated individually.
It is reasonable to assume that the estimates of adjusted gross income by class are subject to less relativesampling variability than are the associated frequencies.Since other money amounts are closely related to or dependent on adjusted gross income, it may be confidentlyassumed that these too are subject to less sampling variability. Presented in table 0 are selected aggregatemoney amounts together with the range in percent thatwould include 19 out of 20 estimates prepared from similarly selected samples.
Estimated adjusted Estimated relativegross income sampling varia-aggregate ~ility in ,percent
(ThoulJlJIJd dolllJn) I
Adjusted gross income class
Tobie M.-SOURCES OF DEVIATION BETWEEN WElOHTEDSAMPLE NUMBER OF RETURNS ANDNUMBER OF RETURNS APPEARINO IN TABLES FOR 19M
Separate systems of weighting were used for the national tabulations and for the State tabulations. Theweights for the national tabulations were derived fromnationwide populations obtained by adding the populations reported by the district directors' offices. Theseparate district office populations were used to derivethe independent district office weights for the State tabulations. Achieved sampling rates varied sufficientlyamong districts to warrant using two separate systemsof weights.
As a result of using two weighting systems androunded weighting factors, there exist slight discrepancies between items in tables showing distributions byStates and corresponding items shown in the nationaltables.
Sampling variability.-The data from returns withadjusted gross income of $150,000 or more are not subject to sampling variability since all such returns wereincluded in the sample. However, the estimates whichinclude data from returns with adjusted gross income
IThese figures are estimated from sample returns filed with the Internal RevenueService but which contain no information on income. They are in the population of returns sampled but are excluded fram tabulations.
NUJIlber of returns Source of deviationDeviation
Adjusted gross income from ReturnsMisclas-class National Weighted weighted with no
totals sample sample informa- sif1ed
tlon1 returns
Under $10,000 •........•• 54,617,989 54,734,915 -116,926 -70,701 -46,225$10,000 under $150,000 .. 2,121,937 2,076,153 0145,784 -489 0146,273$150,000 and over •.•••.. 7,082 7,130 -48 ° -48
All cJ..e.SBes .•••... 56,747,008 56,818,198 -71,190 -71,190 °

Classifications for Individual Returns
EXPLANATION OF CLASSIFICATIONS·AND TERMS
For the tabulations in this report, individual returnswere classified by size of adjusted gross income, by sizeof taxable income, by size of certain sources of incomeand deductions, as standard or itemized deductions returns, as taxable or nontaxable for income tax, by typesof tax, by marital status of taxpayer, by number ofexemptions other than age and blindness, and by Statesand Territories.
Adjusted gross income classes.-The amount of adjusted gross income reported by the taxpayer was thebasis for this classification. With one exception, theclass intervals remain the same as last year. This year,the class $100,000 under $200,000 was subdivided intotwo classes: $100,000 under $150,000, and $150,000 under$200,000. Returns with an adjusted gross deficit, whatever the amount, and returns with a breakeven in adjusted gross income are designated "No adjusted grossincome" and appear as a separate class. Returns withno information on them were not used for statistics. Intables where the taxable and nontaxable returns arecombined, the nontaxable returns are included in the adjusted. gross income· class. corresponding to the amountof adjusted gross income reported, without regard tothe class interval into which nontaxable returns aregrouped when shown separately.
Taxable and nontaxable returns.-This classificationwas based on the presence or absence of an income taxliability after credits. This is a departure from the taxstatus classification for the years 1951 through 1953 inthat the current basis included only the income tax, anddisregarded the self-employment tax.
Taxable returns are those which showed an incometax liability remaining after the five tax credits allowedfor dividends received, for retirement income, for foreign taxes paid, for tax paid at source, and for partiallytax-exempt interest. The last three tax credits were allowed only to taxpayers who itemized their nonbusinessdeductions.
Nontaxable returns are returns with no income taxliability after credits. Nontaxable returns may havehad an income tax before credits, in which case the taxcredits were sufficient to eliminate the original tax.
INDIVIDUAL INCOME RETURNS FOR 19.54 25
all types of returns. Total salaries and wages, that is Compensation of the sole proprietor was not allo~edbefore exclusions for sick pay, included bonuses, tips, as a business deduction and the net operating loss deduc-commissions, and other kinds of compensation received tion was not reported among the business deductions:by the employee for services rendered. Amounts paid Partnership net profit or net loss was reported byto the employee by his employer to cover expenses in- individuals who were members of a partnership, syhdi-curred in connection with the employer's business were . cate, joint venture, or the like. If the taxpayer w~s aincluded as income from wages. On Form 1040, travel member of more than one partnership during the yJear,and lodging expenses incurred while away from home the single amount of partnership net profit or net (lossovernight and transportation expenses were deducted reported in adjusted gross income represented a cOlhbi-
INDIVIDUAL INCOME RETURNS FOR 1954 " FOther limitations of the data.-In addition to sam- Returns with standard deduction or with itemized
pIing variability, the data are subject to certain othei' deduetions.-Returns classified as returns with starldardlimitations. The data do not reflect changes that re- deduction were card-form returns, Form 1040Aj andsuIted from the audit program affecting Form 1040 and short-form returns, Form 1040, on both of which the1040A for 1954. In addition, controls maintained over adjusted gross income was less than $5,000 and starldardthe selection and processing of the returns used in com- deduction was automatically allowed through use df thepiling the data do not completely eliminate the possibil- optional tax table; and the long-form returns,Formity of error. Practical operating considerations neces- 1040, with adjusted gross income of $5,000 or mo~e onsitate allowance of reasonable tolerances in processing which the optional standard deduction was elect~d bycontrols. the taxpayer. I
Returns classified as returns with itemized deduGtionswere long-form returns, Form 1040, on which norlbusiness deductions allowed against adjusted gross ilicomewere reported in detail by the taxpayer, or on whibh nodeductions (standard or itemized) were taken, alld allreturns with a deficit or a· breakeven in adjusted Igrossincome whether long-form or short-form returns.
Size of income or deduction.-For the purpose of afrequency distribution of significant items, the r~turnswere segregated according to the size of specified s1urcesof income or loss comprising adjusted gross incom;e andthe size of certain itemized deductions. The class intervals are narrow providing adequate classificatiobs ofsmall items of income or deduction. ±
Taxable income c1asses.-The amount of taxa Ie income, which is the tax base, supplied the basis fOI thissize classification. Taxable income was reported IPy thetaxpayer on long-form returns, Form 1040, but wasmechanically computed for returns, Form 1040A, andfor short-form returns, Form 1040, on which the t~xableincome was not reported. This made it possi~le toclassify all individual returns by taxable income classes.Returns with no taxable income are so designated.: Theclass intervals coincide with the taxable income bracketsof the three income tax rate schedules applying to (1)joint retuI'rls and returns of surviving spouse, (2)1 separate returns of husbands and wives and of singlepersons not head of household or surviving spousk, and(3) heads of household. There are 24 inc~me br~1ck.etsin the first two groups and 26 brackets m the thIrdgroup, each group having its distinct class intervals.
Marital status.-Classification of returns for niaritalstatus of taxpayer was based on the marital sta~us indicated by the taxpayer. The Code provides thht themarital status be determined at the close of the taf yearor on the date of the death of a spouse. The five classifications are: joint returns of husbands and ~vives,separate returns of husbands and wives, returns oflheadsof household, returns of surviving spouse, and r~turns
of other single persons. When using data tabulated bymarital status, the user should first read the disoussionunder Marital Status of Taxpayer, on page 11. i
.Joint returns of husbands and wives are th~se onwhich a married couple reported their combined iAcome,or returns of a married person whose spouse liad noiilcome but who, nevertheless, was entitled to claim exemption for the spouse. This group includes jOfnt returns filed on Form 1040A even though the ~istrict
._._--_._-----------------

26 INDIVIDUAL INCOME RETURNS FOR 1954
from fiduciaries was not included. The excess capitalloss not deductible in the current year may be carriedinto each of 5 succeeding years as a short-term capitalloss until it has been eliminated by capital gains orthrough the capital loss deduction allowed in computingadjusted gross income.
Short term applies to gains and losses from sales ofcapital assets held 6 months or less. Such gains andlosses, together with the capital loss carryover, aremerged to obtain the net short-term capital gain or loss.In this merger, the net short-term capital gain or lossfrom partnerships and the net short-term capital gainfrom fiduciaries are also included.
Long term applies to gains and losses from sales ofproperty treated as capital assets but held more than 6months. These gains and losses are taken into accountat 100 percent. Long-term capital gains and losses together with net long-term capital gain or loss receivedthrough partnerships and net long-term capital gainreceived from fiduciaries are merged to determine thenet long-term capital gain or loss.
Capital loss carryover from 1949-53 is the remainingportion of net capital loss sustained in those years butwhich the taxpayer had not yet been able to eliminatethrough his capital gains or the $1,000 deduction allowed for capital losses in computing his adjusted grossincome, in years subsequent to the year in which thecapital loss arose. This carryover was reported withand treated as a current year, short-term capital lossby the taxpayer.
Net loss from sales of capital assets before limitation is the entire net loss from sales or exchanges of property treated as capital assets and reported on returnsshowing a capital loss deduction from gross income onaccount of this loss. It is a combination of the netshort-term capital gain or loss including the capital losscarryover and the net long-term capital gain or loss,without regard to the statutory limitation on the allowable deduction.
Net long-term capital gain in excess of net shortterm capital loss is the entire amount of this excessoccurring on returns with the alternative tax; it is notthe amount included in adjusted gross income. Thisexcess long-term capital gain is the amount to which thespecial rate of 25 percent is applied in computing thealternative tax.
Net gain or loss from property other than capitalassets is that from sales or exchanges of property whichwas not treated as a capital asset. Unlike the excessnet long-term capital gain above, all or this type of netgain was included in adjusted gross income. Also, anet loss of this type was wholly deducted in computingadjusted gross income.
Annuities and pensions included in adjusted gross income are only the taxable portion of amounts receivedwithin the tax year. The full amount of a pension orannuity received by a retired employee who contributednothing toward the cost was taxable. In cases where
----- ...............~ ...~ -....,""--.;:;I...:c.·.-··"··1·.. ,1..1'16 0pV·Ui::I'C:i.
Types of tax.-Returns were recognized as having twokinds of income tax, that is, the combined normal taxand surtax or the alternative tax, and as having an unrelated self-employment tax.
Normal tax and surtax was computed at the regularrates and occurred on all types of returns. This taxincludes the optional tax paid in lieu thereof. Normal
the annuitant contributed to the cost, new methods wereprovided for computing the taxable amount to be reported, each depending upon the type of pension orannuity but, in general, provision was made to excludea 'portion of the receipts as recovery of cost.
Rents and royalties were reported in a single scheduleon the income tax return. Therefore, the annual netincome or net loss which was available represented acombination of the net income and net loss from bothtypes of investment. Rents included not only rentsfrom real estate but also amounts received from rentingany kind of property, and included the fair marketvalue of crops received as rent from farm property.Royalties included revenue from copyrights, patents,trademarks, formulas, nat.ural resources under lease, andthe like. Deductions against the gross income receivedfrom these investments 'were claimed for maintenance,
'insurance, repairs, interest, taxes, depreciation, depletion, and other expenses pertaining to the respectiveIncome.
Income or loss from estates and trusts is the taxpayer's share of fiduciary income from an estate or trustunder which he was a beneficiary. Fiduciary incomeincludes amounts required to be distributed, andamounts credited to the beneficiary's account whether actually received or not, as well as amounts paid to thebeneficiary. Income from estates and trusts was reduced by the taxpayer's share of depreciation. Capitalgain, dividends qualifying for the exclusion, and partially tax-exempt interests were excluded and reportedin their respective source. A loss from estates andtrusts was distributed to a beneficiary only upon termination of a trust or an estate which had a net operatingloss carryover, or a capital loss carryover, or for itslast tax year had deductions (other than exemption andcharitable deduction) in excess of gross income.
Other sources of income include alimony received,prizes, awards, sweepstakes winnings, gambling profits,recovery of bad debts and taxes deducted in a prior year,insurance received as reimbursement of medical expensespreviously deducted, and any other item of income notseparately repolied. Also there was included a total of$22,912,000 which consisted of wages not subject to income tax withholding, dividends after exclusions, andinterest, not exceeding $100 per return, reported in onesum as other income on 431,819 returns, Form 1040A.
Itemized Nonbusiness Deductions
The descriptions of itemized deductions which followare confined to the nonbusiness deductions permittedunder the 1954 Code as a deduction from adjustedgross mcome.
Contributions consist of gifts to organizations createdin the United States or its possessions, or under ourlaws and operated for religious, charitable, scientific,literary, or educational purposes exclusively, or for theprevention of cruelty to children or animals; and gifts
- ,'. - - -----------,.~--~-------
amounts of compensation included in adjusted gross income, except wages reported in other income on Form1040A. Salaries and wages after exclusions are exclusive of amounts received as wages or, in place of wages,under a wage continuation plan for the period duringwhich the employee was absent from work on accountof sickness or personal injury. Generally, the exclusion was limited to $100 per week, but was reported on
INDIVIDUAL INCOME RETURNS FOR 1954 I 27
made to veterans' organizations or to governmental agencies which use the gifts for public purposes. Personswho were members of a partnership included their prorata share of contributions made by their partnership.In general, the deduction may not exceed 20 percent ofadjusted gross income, but under the new Code, there isallowed an additional deduction up to 10 percent of adjusted gross income for contributions made to churches,tax-exempt hospitals and tax-exempt educational institutions. So it was possible to have a deduction equal to30 percent of adjusted gross income. Also, there is anunlimited deduction if, in the current year and in 8 ofthe 10 preceding years, the amount of contributions plusthe amount of income ta;; paid during such year (inrespect to such year or preceding years) exceeds 90 percent of taxable income for the respective year, computed\yith modifications.
Interest paid is that paid on personal debts, mortgages,bank loans, and installment purchases of real or personalproperty, but does not include interest on money borrowed to buy tax-exempt securities or single-premiumlife insurance and endowment contracts; neither does itinclude interest relating to rents, royalty, or businessincome which was reported in those schedules.
Taxes paid include personal property taxes, State income taxes, certain State and local retail sales taxes,State gasoline taxes and automobile license fees, taxespaid to a foreign country or possession of the UnitedStates unless a foreign tax credit was claimed, and realestate taxes except those levied for improvements thattended to increase the value of the property. Federaltaxes were not deductible. Taxes paid on business property were reported in the rent and business schedules.
Medical and dental expenses are al.lowed as a deduction from adjusted gross income with limitations. Expenditures considered for this deduction were the actualamounts paid during the tax year for the care of thetaxpa.yer, his spouse, and any dependent who receivedover one-half of his support from the taxpayer regardless of the dependent's gross income. Such expenses included payments to physicians, surgeons, dentists, nurses,hospitals, oculists, chiropractors, and osteopaths, as wellas X-rays, therapy treatments, dentures, crutches, hearing aids, and the like. Amounts paid for medicines anddrugs could be included only to the extent of 1 percentof adjusted gross income under the new law. However,the allowable deduction was liberalized in that medicalcosts in excess of 3 percent (formerly 5 percent) of adjusted gross income were allowed. Any sick and healthinsurance or hospital coverage received was subtractedfrom the total medical expenses, after which the deduction was allowed if within the limitations. If neitherthe taxpayer nor his spouse had attained the age of 65,the deductible medical expenses for both, including thosefor their dependents, were that portion of such expenseswhich exceeded an amount equal to 3 percent of adjustedgross income. If either the taxpayer or his spouse was65 years of age or over before the close of the tax year,
4458050 -57-3
the decluctible expenses for both were not restrict~d tothe excess over 3 percent of adjusted gross income;1 amIthe entire medical expenses for both together with n~edi
cal expenses for their dependents in excess of 3 petcentof the adjusted gross income constituted their deduc~ibleexpenses. However, the maximum deduction allowJd inany case was limited to $2,500 multiplied by the nurrberof allowable exemptions other than age and blindhess,b~t could I~ot exceed $10,000 for husband and wife *~ngjomtly, for a head of household, or for a survIvmgspouse, nor could it exceed $5,000 for a single persoh, orfor married persons filing separate returns. I
Child care is a deduction provided under the new 90de,for working women and widowers. The deduction! wasallowed on account of expenses for the care of a depelndent child 01' stepchild under 12 years of age, or of a.nydependent who was physically or mentally inca[1ableof carillg for himself, \yhile the taxpayer \yas lemployed. The deduction was limited to $600, regardlessof the amount of expense incurred. In the case bf a\yorking wife, the deduction \vas allowed only if i (~)she filed a joint return with her husband, and (2) tiheircombined adjusted gross income was less than $0,100(unless the husband was incapable of self-supp~rt.)
This second limitation for a working wife resulted tromthe provision that the maximum allO\vable deductio~I of$600 is reduced by the amount of adjusted gross incomein excess of $4,500. I
Losses from fire, storm, or other casualty, or t~eft
reported as a deduction are the net losses on nonbusinessproperty resulting from destruction by fire, storm'lautomobile accident, shipwreck, flood, or other nat
lral
physical forces, and from losses due to theft. The, deduction was limited to the net loss sustained, that is,1 thevalue of property just before the loss less salvage vhlueand insurance or other reimbursement received. f
Other deductions include all other authorized I onbusiness deductions not separately reported, such as ~li
mony and separate maintenance payments, expense~ lll
curred in the collection of taxable income or for the ~an
agement, conservation, or maintenance of property l~eld
for the production of taxable income, taxpayer's share• I
of interest and taxes paid by a cooperatIve apartmentcorporation, gambling losses not in excess of winn~ngs
. ., I Itlreported in income, and expenses m connectIOn WIt 11 1etaxpayer's job, for example, dues to unions or pro~es
sional societies, cost of tools and supplies, fees to ~m
ployment agencies, and any allowable expense in con~ec
tion with his employer's business which was in ex~ess
of reimbursed amounts. I
Exemptions
In computing taxable income for the tax year. 1~54,a deduction of $600 was allowed for each ex~mptIOIr towhich an i. ndividu.al was entitled. A per capIta eX~l~p
tion of $600 was allowed for the taxpayer and, on a J~mt
return, his spouse, and for each child (including a s~ep-

28 INDIVIDUAL INCOME RETURNS FOR 1954
child or an adopted child) who received more than onehalf of his support from the taxpayer and who was under 19 years of age or was a student. If the child was19 or over and not a student, exemption was allowedonly if the child met the support test and had gross income under $600. Also, an exemption was allowed foreach other dependent (specified below) with less than$600 gross income who received over one-half of his support from the taxpayer. To qualify as a dependent, thechild or other dependent must have been a citizen orresident of the United States, or a resident of Canada,Mexico, Republic of Panama, or the Canal Zone.
Additional exemptions of $600 for age 65 or over and$600 for blindness were allowed the taxpayer and, if ajoint return was filed, the taxpayer's spouse.If the dependency qualifications were met; exemption
was claimed for parent, grandparent, grandchild,brother, sister, stepbrother, stepsister, stepmother, stepfather, mother-in-law, father-in-law, brother-in-law, sister-in-Iaw, son-in-law, and daughter-in-law; for uncle,aunt, nephew, or niece if related by blood; and for anyperson who lived in the taxpayer's home and who wasa member of his household, whether or not related to thetaxpayer.
The new law made an exception to the support test fora dependent who was supported by several persons noneof whom contributed more than one-half. Under thisprovision, anyone of the group who had contributedmore than 10 percent of the support could claim the exemption if each of the others who contributed more than10 percent of the support filed a declaration that hewould not claim the exemption.
The number of exemptions and the amount claimed,as tabulated in this report, include exemptions fromevery return filed. There is some duplication of exemptions inasmuch as dependents with less than $600 ofgross income from wages subject to income tax withholding filed a return to oJaim refund of tax; and children dependents under 19 years of age and childrendependents over 19 years who were students, with grossincome of $600 or more, filed a return because their income met the requirement for filing. Exemptionsclaimed on returns filed by these dependents were tabulated, as well as the exemptions for these dependentsreported on the return of the taxpayer rightfully claiming the dependent.
Measures of Individual Income
Items explained here are in accordance with the definitions under the new provisions of the 1954 Code.
Adjusted gross income is defined as gross incomeminus (a) allowable expenses attributable to the taxpayer's trade or business, (b) expenses paid or incurredin connection with services as an employee under a reimbursement or other expense allowance arrangementwith the employer, (c) expenses of travel, meals, andlodging while away from home incurred by the taxpayer in connection with services rendered as an em-
ployee, (d) expenses of transportation paid by the taxpayer in connection with the perforrnance of servicesas an employee, (e) expenses of outside salesmen attributable to business carried on by the taxpayer if suchbusiness consists of the performance of services as anemployee and if the business is to solicit, away from theemployer's place of business, business for the employer,(f) deductions attributable to rents and royalties, (g)deductions for depreciation and depletion allowable toa life tenant or an income beneficiary of property heldin trust, (h) allowable losses from sales of capital assets and other property, and (i) a deduction equal to50 percent of the excess of net long-term capital gainover net short-term capital loss.
Adjusted gross deficit occurred in the event that thedeductions allowed for the computation of adjustedgross income, stated above, exceeded the gross income.
Taxable income tabulated for individuall'eturns is adjusted gross income minus deductions, itemized or standard, and personal exemptions. The amount of taxableincome, shown throughout this report, includes both thetaxable income reported by taxpayers on the long-formreturn, Form 1040, and a mechanically computedamount of taxable income for taxpayers who used theshort-form return, Form 1040, or the return, Form1040A, wherein the amount of taxable income was. nota factor because the optional tax table was used for taxpurposes. Taxable income for the latter taxpayers wascomputed by (a) using the midpoint of the adjustedgross income bracket of the tax table into which theincome fell as the ·amount of adjusted gross income, and(b) providing a 10-percent standard. deduction basedon the midpoint, and (c) allowing $600 for each exemption claimed. This formula resulted in the actualamount of taxable income upon which the tax was based.This is the only instance in which an item, not reportedon the individual income tax return, was supplied forthe tabulations.
The concept of taxable income may be considered similar to the concept of surtax net income of former years,if the other changes in the new law are ignored.
Tax Items
The reduced tax rates, previously enacted as applicable to individual income on and after January 1,1954,were carried from the 1939 Code into the 1954 Code.However, in the 1954 Code, the normal tax rate and thegraduated surtax rates were consolidated into a singlecomprehensive rate schedule.
The income tax rates for 1954 income were 20 percentof the first $2,000 of taxable income, increasing to 91percent of taxable income in excess of $200,000 for allpersons except heads of household, and in excess of$300,000 for heads of household. However, under thesplit-income provision, the 91-percent rate was operative only on taxable income in excess of $400,000 onjoint returns and returns of surviving spouse. Themaximum tax was limited to 87 percent of taxable in-

INDIVIDUAL INCOME RETURNS FOR 1954
come. These rates are somewhat lower than those on1953 income.
Fiscal-year and part-year returns covering a periodthat embraced January 1, 1954, showed a proration oftax to give effect to the change in tax rates on January1,1954.
The descriptions of tax items are given in terms ofthe 1954 tax provisions.
Income tax before credits is the tax based on taxableincome and calculated at the prescribed rates. It may bethe optional tax, the regular income tax, or the alternative tax and it is without regard to tax credits allowed as a reduction thereof.
Normal tax and surtax is the regular income taxwhich includes the optional tax. The normal tax andsurtax was computed on taxable income at the ratesstated above and reported by taxpayers who filed thelong-form return, Form 1040. Optional tax was reported by taxpayers who used the short-form return,Form 1040, while the optional tax was determined bythe district director for taxpayers who filed the cardform return, Form 1040A. The optional tax table statedthe tax for the various adjusted gross income bracketsand numbers of exemptions, for taxpayers with adjustedgross income under $5,000 from whatever source.
Alternative tax applied only in case the taxpayer hadan excess of net long-term capital gain over net shortterm capital loss and only if the alternative tax was lessthan the regular income tax. Alternative tax was thesum of (a) a partial tax computed at the regular incometax rates on taxable income reduced by 50 percent ofthe excess net long-term capital gain over the net shortterm capital loss, and (b) an amount equal to 25 percentof the entire excess. The alternative tax is not effectiveon taxable income under $18,000.
Tax credit for dividends received is a new incometax credit, allowed on returns with tax year ended afterJuly 31, 1954, for domestic dividends received after thatd~~. Thi~ credit is equal to 4 percent of the qualifying?1v1dends III excess of the dividends excluded from grosslllcome. However, the credit could not exceed the lesserof (a) the income tax reduced by foreiO'n tax creditEo ,
or (b) 2 percent of the taxable income.Tax credit for retirement income, under the new
law,.is allowed a.gainst the income tax, if the taxpayerqualified with regard to eamed income in prior years.The credit is 20 percent of the retirement income, asdefined by statute, with a ma.ximum limit of $240 foreach individu~l. The credit, however, could not exceedthe income tax reduced by the other four tax credits.
Tax credit for foreign tax paid was allowed againstthe income tax only to taxpayers who itemized deductions but who did not deduct this tax among thosedeductions. The credit pertains to income and profitsta.xes paid to a foreign country or possession of theUnited States, including the taxpayer's share of suchtaxes pa.id through partnerships and fiduciaries. Thecredit could not exceed the same proportion of the tax
I
129against which the credit was taken which the tax~bleincome from sources in such foreign country bore to: theentire taxable income computed without pers6nalexemption. . I
Tax credit for tax paid at source relates to income~ax withheld and paid, by the debtor corporation,! onIllterest from tax-free covenant bonds. Credit for theamount of tax paid including the taxpayer's sharJ ofsuch tax paid through partnerships and fiduciaries \vasallowed against the income tax but only if deductionswere itemized. 1
Tax credit for partially tax-exempt interest rep1,cesthe former deduction from net income and was allm~edagainst the income tax only if deductions were itemited.The tax credit is 3 percent of the partially tax-exethptinterest included in gross income, but was limited, to~he lesser of (a) 3 percent of taxable income, or (b) rheIllcome tax reduced by the credit for foreign tax pnidand the credit for dividends received. I
Income tax liability after credits is the remainingtax a.fter the subtraction of all tax credits, but priot,\ toadjustments for tax withheld and the payments ondeclaration.
Self-employment tax was reported by an individualwho had net earnings from self-employment deritedfrom a trade or business carried on by him, or from 11isshare of self-employment net earnings from a part~ership of which he was :t member. However, farmers ~nd
most professional services were excluded from the defihition of self-employment earnings, and certain typesj ofincome and deductions were excluded, such as rents, ,nterest, dividends, capital gains and losses, net operadngloss deduction, and casualty losses. If such net earningswere $400 or more, they were considered self-empI6yment income. In determining the amount of self-e~ployment income to be taxed, three factors were c~nsidered: first, the amount of net earnings frhmself-employment must be $400 or more; second, ~hemaximum amount of self-employment income to lbetaxed is $3,600; and third, the amount of wages receiv~don which social security tax had been withheld by ~nemployer. If social security tax was withheld frqmwages, the amount of such wages was subtracted frqmthe maximum amount of $3,600 to determine the lidiiton self-employment income to be taxed. The amount 'afself-employment income subject to tax was the smallerof (a) the amount of the limit on self-employment i;ncome to be taxed, determined as stated, or (b) theamount of net earnings from self-employment. No e~emption was allowed against the self-employment i~1come for purpose of computing the self-employment taxat 3 percent. 1
Tax withheld is the income tax withheld at source Qnwages together with the over withholding of social ~ecurity employee tax. The amount of income tax to pewithheld by employers was stated in wage bracket withholding tables or was determined by applying the P1e-
II
J__
30 INDIVIDUAL INCOME RETURNS FOR 1954
scribed 18 percent withholding tax rate to the amount ofwages in excess of withholding exemptions. The overwithheld social security tax, that js, the excess over themaximum tax of $72, occurred because the employer received wages from more than one employer.
Payments on 1954 declaration of estimated incometax were reported on returns, Form 1040 only. Thesepayments, made on account of the 1954 Declaration ofEstimated Income Tax, Form 1040-ES, also includedany credit which was applied against the estimated taxfor 1954 by reason of an overpayment of the 1953 taxliability.
Tax due at time of filing is the amount of tax that remained after the tax withheld and payments on 1954
declaration had been applied against the total tax liability for the year which included both the self-employment tax and the income tax liability after credits.
Overpayment of tax occurred when the tax withheldand payments. on 1954 declaration exceeded the combined self-employment tax and income tax liability aftercredits. Overpayment of tax gave rise to a refund orto a credit on the subsequent year's estimated incometax.
Refund of tax overpayment is the amount indicated bythe taxpayers who requested a refund.
Credit on 1955 tax is the amount of 1954 tax overpayment which the taxpayers specified be credited on 1955estimated income tax.

BASIC TABLES
INDIVIDUAL RETURNS, 1954Page
1. Number of returns, adjusted gross income, taxable income, andincome tax, by adj usted gross income classes and classes cumulated _ 33
2. Sources of income and loss and nonbusiness deductions, by returnswith standard or itemized deductions_________________________ 34
3. Sources of income and loss and nonbusiness deductions, by adjustedgross income classes_ _______________________________________ 35
4. Sources of income and loss, exemptions, and tax items-all returns,joint returns, and other returns, by adjusted gross income classes_ 36
5. Itemized nonbusiness deductions, exemptions, and tax items, byadjusted gross income classes-returns with itemized deductions_ 48
6. Number of returns by size of source and by adjusted gross incomeclasses____________________________________________________ 50
7. Number of returns by size of nonbusiness deduction and by adjustedgross income classes ________________________________________ 55
8. Taxable income, tax credits, and income tax, by taxable incomeclasses for applicable tax rates_______________________________ 56
9. Adjusted gross income, taxable income, income tax, average tax,and effective tax rate, by types of income tax and by adjustedgross income classes_ _______________________________________ 58
10. Adjusted gross income, exemptions, taxable income, and income tax,by marital status of taxpayer, by returns with standard or item-ized deductions, and by adjusted gross income classes __________ 59
11. Exemptions by marital status of taxpayer and by adjusted grossincome classes_ ____________________________________________ 65
12. Capital gains and losses, short- and long-term, and capital losscarryover, by adj usted gross income classes ___________________ 69
13. Selected sources of income by States and Territories______________ 7114. Adjusted gross income and income tax, by States and Territories
and by adjusted gross income classes_________________________ 7215. Returns with self-employment tax-adjusted gross income and self-
employment tax, by adjusted gross income classes ____ _________ 7516. Returns with self-employment tax-adjusted gross income and self-
employment tax, by States and Territories_ ___________________ 76
31


INDIVIDUAL INCOME TAX REfURNS FOR 1954 33
Tabl. I.-NUMBER OF RETURNS, ADJUSTED GROSSINCOME, TAXABLE INCOME, AND INCOME TAX, BY ADJUSTED GROSS INCOME CLASSES.AND CLASSES CUMULATED
Returns Adjusted gross income Taxable income Income tax liabilityafter credits l
Adjusted gross income classes end classes cUlIIulated
NumberPercent of
total
Amount(Thousand
dol/lJt'S)
Percent oftotal
Amount(Thousanddollau)
Percent oftotal
Amount(1hOUl!lllnd
dolltlnil)
,Percen~ of
total,(1) (3) (5) (7) (8) I
CUMULATED FROM LOWEST ADJUSTED GROSS INCOME CLASS
ADJUSTED GROSS INOOME CLASSES
I0.10.81· 3~.2
12345
3.1 64.2 7$.1 8~. 6 91'8 10
liD:! H.9 145 15
II: 2 16.3 17.7 18.3 19
.. 4 20
;1.3 21i.o 22
~. 7 23.6 24.8 25
109.0 26
I - 27
I - 28
II
37,648213,519344,635575,180
817,8471,120,6041,346,6911,489,9751,559,856
2,770,1092,385,4031,820,5971,301,277
932,992
2,185,1661,145,.5891,521,8831,683,9811,708,710
614,555257,014455,363154,785222,374
26,665,753
26 665 753
0.20.91.52.5
3.64.95.86.46.7
12.010.27.85.53.9
8.84.24.94.43.4
1.00.40.60.20.3
100.0
188,5871,072,6311,748,6142,915,272
4,125,8775,606,8806,699,0477,409,0117,759,499
13,786,65411,821,0638,945,1786,324,4194,479,948
10,097,2874,809,1745,611,8245,052,8153,946,903
1,170,329452,603740,497234,854332,335
115,331,301
115 331 301
0.61.12.43.24.2
5.36.57.47.87.6
12.39.46.54.43.0
6.32.73.12.62.0
0.60.20.40.10.2
100.0
1,294,8162,542,6685,630,7287,357,6219,703,996
12,304,84014,979,29817,062,18717,849,57417,586,011
28,346,77121,656,98415,025,57210,036,6586,812,809
14,410,9186,323,5427,023,4966,071,6734,656,424
1,391,103547,816919,072294,745406,533
230,235,85521,014,480
_ '229 221 375
7.05.68.07.57.7
8.08.28.17.56.6
9.26.03.62.11.3
2.20.70.50.30.1
(')(')(' )(1 )(' )
100.0
3,939,8173,180/54~
4,520,5954,206,6784,311,673
4,484,7794,607,9754,548,399
·4,202,7543,708,206
5,189,1993,352,0772,016,6011,187,245
721,146
1,217,149368,907291,858161,99570,400
11,6283,1973,245
439201
56,306,704
440,304
56 747 008
Returns with adJuated gross income, taxable and nontaxable:Under $600 .$600 under $1,000 ..$1,000 under $1,500 .$1,500 under $2,000 .$2,000 under $2,500 ..
$2,500 under $3,000 ..$3,000 under $3,500 ..$3,500 under $4,000 ..$4,000 under $4,500 ..$4,500 under $5,000 .
$5,000 under $6,000 .$6,000 under $7,ODD , ..$7,000 under $8,000 .$8,000 under $9,000 .$9,000 under $10,000 .
$10,000 under $15,000 .$15,000 under $20,000 .$20,000 under $30,000 ..$30,000 under $50,000 .$50,000 under $100,000 ..
$100,000 under $150,ooD , ..$150,000 under $200,000 · ..$200,000 under $500,000 .$500,000 under $1,000,000 ..$1 ,000,000 or more .
Total .
12345
6789
10
1112131415
1617181920
2122232425
26
27 Returns with no adjusted gross income, nontaxable .
28 Grand total .
5657585960
6162636465
6667686970
2930313233
3435363738
3940414243
44·45464748
Returns with adjusted gross income, taxable and nontaxable:
~~~:~ !~~gixi:::::::::::::::::::::::::::::::::::::::::::::::::::::::::::: ;;~~~;~;~ ~:~ j;~~~;~~ ~:~ 188,587 0.2 37,648 L;~Under $1,500 11,640,953 20.7 9,468,212 4.1 1,261,218 1.1 251,167 G.9 31Under $2,000... 15,847,631 28.1 16,825,833 7.3 3,009,832 2.6 595,802 ;1.2 32Under $2,500...... 20,159,304 35.8 26,529,829 11.5 5,925,104 5.1 1,170,982 4.4 33
Under $3,000............ 24,644,083 43.8 38,834,669 16.9 10,050,981 8.7 1,988,829 ~.5 34Under $3,500............................................................ 29,252,058 52.0 53,813,967 23.4 15,657,861 13.6 3,109,433 11..7 35Under $4,000............................................................ 33,800,457 60.0 70,876,154 30.8 22,356,9D8 19.4 4,456,124 1~. 7 36Und"er $4,500............................................................ 38,003,211 67.5 88,725,728 38.5 29,765,919 25.8 5,946,099 2.2.3 37Under $5,000...... .•......•. 41,711,417 74.1 106,311,739 46.2 37,525,418 32.5 7,505,955 2~.1 38
Unde, $6,000..................................... 46,900,616 83.3 134,658,510 58.5 51,312,072 44.5 10,276,064 38.5 39Under $7,000 ;.... 50,252,693 89.2 156,315,494 67.9 63,133,135 54.7 12,661,467 4~.5 40Under $8,000.. 52,269,294 92.8 171,341,066 74.4 72,078,313 62.5 14,482,064 54.3 41Under $9,000........ 53,456,539 94.9 181,377,724 78.8 78,402,732 68.0 15,783,341 59.2 42Under $10,000 54,177,685 96.2 188,190,533 81.7 82,882,680 71.9 16,716,333 62.7 43
Under $15,000... 55,394,834 98.4 202,601,451 88.0 92,979,967 80.6 18,901,499 76.9 44Under $2D,ooo........................................................... 55,763,741 99.0 208,924,993 90.7 97,789,141 84.8 2D,047,088 7$.2 45Under $30,000..... 56,055,599 99.6 215,948,489 93.8 103,400,965 89.7 21,568,971 8¢.9 46Under $50,ooD.................................. 56,217,594 99.8 222,020,162 96.4 108,453,780 94.0 23,252,952 81.2 47Under $100,000... 56,287,994 99.9 226,676,586 98.5 112,400,683 97.5 24,961,662 9).6 48
49 Under $150,000...... 56,299,622 99.9 228,067,689 99.1 113,571,012 98.5 25,576,217 9t9 4950 Under $200,000...... 56,302,819 99.9 228,615,505 99.3 114,023,615 98.9 25,833,231 9t9 5051 Under $500,000 56,306,064 99.9 229,534,577 99.7 ),14,764,112 99.5 26,288,594 9$.6 5152 Under $l,OOO,OOO ~......................... •..•.•••• 56,306,503 99.9 229,829,322 99.8 114,998,966 99.7 26,443,379~1.2 5253 All returns............................................................. 56,306,704 100.0 230,235,855 100.0 115,331,301 100.0 26,665,753 10(j).0 53
54 Returns with no adjusted gross income, nontaxable......................... 440,304 21,014,480 5455 Total returns............................................................. 1-:5-'6,-7-,4"'7'-00,..,..,8+-----+.'-,22"9,:...,22"1,:...,3:...75+----+-:1-,1-,5-3-3-1-3-0-1+-----t-2-6- 6-6-5-7-5-3+---+1---I 55
CUMULATED FROM HIGHEST ADJUSTED GROSS INCOME CLASS IReturns with adjusted gross income, taxable and nontaxable:
$l,Doo,ooO or more......... 201 (') 406,533 0.2 332,335 D.3 222,374 .8 56$500,ooD or more.......... 640 (') 701,278 0.3 567,189 0.5 377,159 .4 57$200,000 or more....... 3,885 (1) 1,620,350 0.7 1,307,686 1.1 832,522 .1 58$150,000 or more.... ...•.... 7,082 (1) 2,168,166 0.9 1,760,289 1.5 1,089,536 4.1;;;9$100,000 or more........................................................ 18,710 (') 3,559,269 1.5 2,930,618 2.5 1,704,091 t4 6D
$50,000 or more.......... 89,110 0.2 8,215,693 3.6 6,877,521 6.0 3,412,801 Its 61$30,000 or more......................................................... 251,105 0.4 14,287,366 6.2 11,930,336 10.3 5,096,782 1~.1 62$20,000 or more...................... 542,963 1.0 21,310,862 9.3 17,542,160 15.2 6,618,665 24.8 63$15,000 or more......................................................... 911,870 1.6 27,634,404 12.0 22,351,334 19.4 7,764,254 29.1 64$10,000 or more......................................................... 2,129,019 3.8 42,045,322 18.3 32,448,621 28.1 9,949,420 3t.3 65
$9,000 or more......... 2,850,165 5.1 48,858,131 21.2 36,928,569 32.0 10,882,412 40.8 66$8,000 or more.. 4,037,410 7.2 58,894,789 25.6 43,252,988 37.5 12,183,689 4~.7 67$7,000 or more............................................. 6,054,011 10.8 73,920,361 32.1 52,198,166 45.3 14,004,286 52.5 68$6,000 or more......... 9,406,088 16.7 95,577,345 41.5 64,019,229 55.5 16,389,689 6i.5 69$5,000 or more.... 14,595,287 25.9 123,924,116 53.8 77,805,883 67.5 19,159,798 7i.9 70
71 $4,500 or more.. 18,303,493 32.5 141,510,127 61.5 85,565,382 74.2 20,719,654 rt.7 7172 $4,ODO or more.................. 22,506,247 40.0 159,359,701 69.2 92,974,393 80.6 22,209,629 8).3 7273 $3,500 or more.... 27,054,646 48.0 176,421,888 76.6 99,673,440 86.4 23,556,320 88.3 7374 $3,000 or more 31,662,621 56.2 191,401,186 83.1 105,280,320 91.3 24,676,924 9:1.5 7475 $2,500 or more...... 36,147,400 64.2 203,706,026 88.5 109,406,197 94.9 25,494,771 9~.6 75
76 $2,000 or IOClre.................. 40,459,073 71.9 213,410,022 92.7 112,321,469 97.4 26,069,951 97.8 7677 $1,500 or more.................... 44,665,751 79.3 220,767,643 95.9 114,070,083 98.9 26,414,586 99.1 7778 $1,000 or more.......................................... 49,186,346 87.4 226,398,371 98.3 115,142,714 99.8 26,628,105 9~.9 7879 $600 or more............................................................ 52,366,887 93.0 228,941,039 99.4 115,331,301 100.0 26,665,753 lD<i1.0 7980 All retUrns:........................ 56,306,704 100.0 230,235,855 100.0 115,331,301 100.6 26,665,753 10$.0 80
81 Returns with no adjusted gross income, nontaxable 1-:-::-::44-,0:',:.:3:':04::-1r- +.-:-:2:':1!..,0:::1::,:4!..,4::8:::0+ I-:cc:-::---:-:::-:=+ --t--:-:-:-:-::--::-:-'-t---+~ 8182 Total returns.... 56,747,008 - '229,221,375 115,331,301 26,665,753 82
See text for individual returns for "Explanation of Classifications and Terms" and for "Deacription of Sample and Limitations of Osta. 1I
lLess than 0.05 percent.2AdjustCd gross deficit.'Adjusted gross income less adjusted gross deficit.

34 INDIVIDUAL INCOME TAX RETURNS FOR 1954
Table 2.-S0URCES OF INCOME AND LOSS AND NONBUSINESS DEDUCTIONS, BY RETURNS WITH STANDARD OR ITEMIZED DEDUCTIONS
All returns (taxabl.:! and Returns with standardnontaxable) deduction
Returns with itemized deductions
Showing adjustedgross income
Showing no adjustedgross incomeItems Number of
returns
(1)
Amount
(Thousanddollars)
(2)
Nu."TIber ofreturns
(3)
Amount
(ThousanddoIlllrs)
(4)
Number ofreturns
(5 )
Amount(Thouslf1Id
dollars)
(6)
Number ofreturns
(7)
Amount(Thou.and
c*Jllar.)
(8)
Sources:Salaries and wages (after exclusions) .Dividends (after exclusions) .Interest received .
49,925,3053,681,0076,124,385
185,952,6237,04.7,8662,37C,230
36,3Dt.-,4991,915,0253,533,688
115,401,6171,584,0151,061,124
13,525,3491,736,1342,544,793
70,393,3085,446,8851,288,790
95,45729,84945,904
157,69716,96620,315
123
45
Business or profession:Net profit , , .Net loss .
6,320,812 19,234,6121,464,726 2,308,809
4,766,078" 12,069,791753,186 675,529
1,538,100 7,148,782361,734 617,988
16,634349,806
16,041 41,015,290 5
Partnership:Net profit " , .Net loss .
1,588,04.6228,949
9,004.,04.3478,242
975,53994,978
3,962,51670,255
601,681 5,011,37786,068 189,471
10,82647,903
30,150 6218,518 7
Net operating loss deduction . 34,781 144,965 18,166 5,569 20,447 86,136
910
1112
13
1415
Sales of capital assets:Net gain................................................•.......Net loss .......................................................•
Sales of property other than capital assets:Net gain.........•. " , " , .Net loss .
Annui ties and pensions........•.......•.........•...•.............
Rents and royalties:Net income....................................................•.Net loss...................•..........................•.........
2,411,147664,084
135,062207,456
730,279
3,863,6181,143,837
107,811199,058
806,069
3,536,292429,542
1,340,293 1,216,824304,181 160,593
77,387 56,78087,844 56,613
439,563 443,262
2,163,521" 1,661,011534,497 174,149
1,009,483 2,397,190335,305 202,031·
54,641 48,15198,128 72,409
288,141 356,032
1,650,108 1,836,905578,931 227,591
61,37124,598
3,03421,484
2,575
49,98930,409
117,850 916,821 10
2,881 1170,035 12
38,375 1427,802 15
1617
Estates and trusts:Income..•.......................... " , , .Loss...................•.............•.......... : ........•......
368,80612,258
685,1405,800
172,7875,482
239,0251,517
193,9706,752
444,4084,024
(1 )(l)
(1)(l)
1617
15,261,291 93,348,058
18
19
Other sources .
Adjusted gross income or deficit .
690,691
56,747,008 229,221,375
3,134,372
41,045,413
368,877
136,887,797
1,825,258 310,191 60,088
440,304
11,624 18
31,014,480 19
Itemized nonbusiness deductions:20 Contributions............•.•...... , '" ..............•.........21 Interest paid .22 Taxes.................••........................ " , "23 Medical and dental expenses...................................•...
14,565,30610,727,79814,577,3438,639,147
3,892,5473,204.,5424,085,3622,975,448
14,555,91810,721,35414,565,6308,633,875
3,891,1733,201,2874,076,6302,971,172
9,3886,444
11,7135,272
1,374 203,255 218,732 224,276 23
242526
Child care .Losses from fire, storm, other casualty, or theft , .Other deductions .
272,7372,107,002
11,507,354
88,714444,300
2,731,267
272,2372,106,457
11,504.,665
87,960444,245
2,730,760
(1)(l)
2,689
(l) 24(1) 25
50? 26
27 Total itemized deductions................................... 15,243,545 17,422,180 15,229,351 17,403,227 14,194 18,953 27
See text for individual returns for llExplanation of Classifications and Terms" and "Description of Sample and Limitations of Data. II
ISample variability of this item is too large to warrant showing it separately. However, this value is included in each total.2Adjusted gross income less adjusted gross deficit.3Adjusted gross deficit.

TobIe 3.-S0URCES OF INCOME AND LOSS AND NONBUSINESS DEDUCTIONS, BY ADJUSTED GROSS INCOME CLASSES
A.II returns
Business or profession Partnership Sales of capital assetsSales of property oth~r
Salaries and Dividends Interest Net operat- than capital assets AnnuitiesAdjusted gross income classes Number of
wages (after (arter ex- received ing loss and
returns exclusions) elusions) Net profit Net loss ~et profit Net loss deduction Net gain Net 109S Net gain Net loss pensions
(Thouund (Thousand (lhou.Jlmd (11tou$~d (lhoU~UI:nd {Thow-Hlnd (ThouslJ/1d (Thousand (Thousand (Thousand (Thousc'lt'ld (Thousand (Thousand
dollars) dollars) dollars) dalhrs) dollars) dollars) dollars) dollars) dollars) dollars) dolllJT!J) dollars) dollars)
(1) (2) (3) (4) (5) (6) (7) (8) (9) (10) (ll) (12) (13) (14)
Taxable and nontaxable returns:No adjusted gross income ••..•.••..•.••••••••••• 440,304 157,697 16,966 20,315 16,041 1,015,290 30 J 150 218,518 86,136 ll7,850 16,821 2,881 70,035 6,777Under $600.... , ................................ 3,939,817 l,137,6a2 10,178 21,955 140,399 71,078 15,958 4,231 10,348 20,495 11,749 1,768 12,427 5,199$600 under $1,000.......................... , ..• 3,180,541 1,958,083 36,901 53,966 351,725 53,408 42,612 10,215 2,584 30,410 10,186 2,516 5,034 24,564$1,000 under $1,500............................ 4,520,595 4,433,881 65,505 94,934 727,315 90,111 78,154 3,894 1l,473 57,167 19,135 4,818 4,118 75,338$1,500 under $2,000 ............................ 4,206,678 5,873,995 95,448 107,508 874,895 84,074 109 ,592 6,614 3,634 58, 3D 18,388 4,7f:iJ 5,379 115,001
$2,000 under $2,500, ..............•............ 4,311,673 8,119,186 93,973 106,019 982,191 95,293 139,1l0 8,695 242 66,076 15,454 4,884 5,031 98,127$2,500 under $3,000............................ 4,484,779 10,641,552 94,609 92,588 1,068,887 90,855 195,356 7,209 2,729 66,450 19,539 8,311 9,228 77,183$3,000 under $4,000•........................... 9,156,374 28,790,162 200,461 176,014 2,030,897 138,584 499,378 30,533 7,532 150,5S4 33,488 7,351 18,192 81,190$4,000 under $5,000••.....•.................... 7,910,9f:iJ 32,468,575 243,493 186,123 1,659,320 110,592 524,379 19,145 2,424 DJ,241 35,150 10,280 14,337 72,449$5,000 under $10,000........................... 12,466,268 72,550,811 946,788 544,444 4,587,587 192,519 1,918,999 35,614 10,653 554,328 98,156 23,146 22,696 139,192
$10,000 under $15,000.......................... 1,217,149 9,319,192 721,459 254,104 2,214,822 67,210 1,188,504. 25,213 3,351 372,542 36,S41 13,342 11,541 37,940$15,000 under $20 ,000.......................... 368,907 3,083,117 520,773 149,775 1,326,095 42,947 795,926 11,796 1,477 237,653 18,924 4,932 5,04.7 17,750$20,000 under $30,000.......................... 291,858 2,933,567 780,502 176,403 1,447,476 51,968 1,106,191 15,951 445 315,170 21,04.3 9,521 5,493 17,068$30,000 under $50,000.......................... 161,995 2,270,315 868,526 173,144 1,103,839 57,408 1,085,314 18,336 716 338,630 15,Dl 4,451 4,353 18,121$50,000 under $100,000......................... 70,400 1,553,~70 1,008,076 128,428 546,550 69,192 845,897 21,942 1,044 400,335 7,6J3 3,365 3,428 12,116
$100,000 under $150,000........................ 11,628 375,500 420,263 38,203 97,073 26,715 226,849 14,997 33 190,598 1,106 1,052 1,453 3,527$150,000 under $200,000........................ 3,197 120,346 200,724 13,916 25,205 13,232 76,267 5,883 87 103,502 330 99 431 1,615$200,000 under $500,000........................ 3,245 142,322 376,622 21,099 25,587 21,593 97,570 9,432 5 244,209 303 244 648 2,200$500,000 under $l,(X)(),(X)()•......•....•......... 439 17,062 143,f:iJl 5,441 4,815 10,951 18,696 6,369 1 107,312 39 58 79 419$1,000,000 or more •.......•.................... 201 6,108 202,998 5,851 3,893 5,789 9,141 3,655 51 166,997 30 32 108 293
Total••............................••.... 56,747,008 185,952,623 7,047,866 2,370,230 19,234,612 2,308,809 9,CK)4 ,043 478,242 144,965 3,731,862 379,446 107,8ll 199,058 806,069
All returns-Continued Returns with itemized deductions
Rents and royalties Estates and trusts Deductions for-
Other AdjustedLosses from
TotalAdjusted Medical fire, storm,Adjusted gross income classes Net Net sources gross income Number of gross income Contribu- Interest Taxes and dental Child care otherOther deductions
income loss Income LessreturnS tions paid deductions
expenses casualty,or theft
(Thous81ld (Thousand (Thous/Jnd (lhoustJlld (Thous/Jnd (Thousand (Thous81Id (Thou!lland (Thousand (Thous/J"d (ThouS/J"d (Thouslll"ld (Thousand (Thousand (Thousanddollars) doll/Jrs) dolhrs) dollars) dollars) dollars) dollars) dollaftJ) dollars) dollars) dollars) dollars) dollars) dollars) dollars)
(15) (16) (17) (18) (19) (20) (21) (22) (23) (24) (25) (26) (27) (28) (29) (30)
Taxable and nontaxable returns:No adjusted gross income•....•.......••...•.... 38,375 27,802 (1) (1 ) 1l,624 21,014,480 440,304. 21,014,480 1,374 3,255 8,732 4,276 (1 ) (1 ) 507 18,953Under $600..................................... 41,127 13,656 9,451 627 14,720 1,294,816 30,603 11,155 2,595 1,300 3,482 2,318 (1 ) (1) 3,407 13,119$600 under $1,000.............................. 104.,290 6,877 6,270 - 19,635 2,542,668 220,560 184 ,910 14,149 6,715 13,997 29,029 (1 ) 8ll 9,289 74,249$1,000 under $1,500•........................... 188,819 1l,659 12,423 - 32,764 5,630,728 410,507 523,636 34,263 16,881 38,082 59,516 987 4,242 19,439 173,410$1,500 under $2,(XX)•................•...•...... 187,277 14,514 17,046 41 46,430 7,357,621 615,834 1,076,271 66,368 30,886 f:iJ,212 114,643 2,362 9,856 39,631 323,958
$2,(X)() under $2,500•.......•...........•....... 179,552 16,753 D,148 27 43,225 9,703,996 807,763 1,821,923 104,520 52,144 91,443 153,874 5,04.2 12,204 51,969 471,196$2,500 under $3,000•...................•....... 159,779 26,478 D,904 - 42,259 12,304.,840 961,411 2,649,964 141,156 85,022 123,476 191,423 10,853 16,921 81,161 650,012$3,000 l.mder $4,(X)()•..... ".•.•.................. 257,957 43,145 28,858 177 90,284 32,041,485 2,559,255 9,004,661 431,039 328,931. 402,878 502,294 26,025 44,971 253,lf:iJ 1,989,298$4,000 under $5,000••.......•.................. 279,887 49,287 23,008 397 66,162 35,435,585 2,966,888 13,335,511 557,871 552,617 594,206 548,376 22,362 65,654 377,618 2,718,7Q4.$5,000 under $10,000........................... 826,065 114,002 109,080 371 152,366 81,878,795 5,445,659 35,599,599 1,343,296 1,490,479 1,556,584 1,004,372 18,683 179 ,063 1,04.2,878 6,635,355
$10,000 under $15,000•.............•....•...... 331,573 28,231 82,667 ?O7 47,867 14,410,918 573,041 6,865,328 2f:iJ,106 222,985 307,949 152,315 929 33,030 240,308 1,217,622$15,000 under $20,000.......................... 189,840 12,353 59,231 393 31,386 6,323,542 230,696 3,967,099 141,634 95,636 172,967 65,198 208 14,147 ll8,611 608,401$20,000 under $30,000.......................... 243,355 17,071 78,339 281 28,156 7,023,496 217,047 5,257,3f:iJ 175,752 107,593 216,981 65,~3 182 16,665 141,063 723,739$30,000 under $50,000••.•......•............... 225,645 19,074 70,642 563 28,627 6,071,673 138,314 5,212,764 174,6f:iJ 83,032 206,974 45,164 43 16,321 127,502 653,696$50,000 under $100,000......................... 168,164 14,666 89,530 1,113 19,511 4,656,424 65,449 4,341,986 171,549 66,04.0 162,154 26,836 18 17,280 ll4,307 558,184
$100,000 under $150,000........................ 54,837 4,863 23,214 289 9,443 1,391,103 11,269 1,348,089 73,956 21,558 49,392 5,697 2 5,815 41,511 197,931$150,000 under $200,000........................ 16,968 2,653 9,695 222 2,317 547,816 3,149 539,7f:iJ 36,04.7 9,166 20".658 1,8f:iJ 2 2,320 18,821 88,874$200,000 under $500,000........................ 23,6f:iJ 5,161 20,272 297 2,726 919,072 3,208 908,445 79,551 21,246 34,150 2,265 2 3,151 31,906 172,271$500,000 under $1,000,000••.................... 7,544 1,038 7,297 26 1,003 294,745 438 294,166 32,241 6,174 9,912 326 1 1,005 9,705 59,364$1,000,000 or more•..•..............•.......... 11,577 259 9,359 9 184 406,532 200 405,431 50,420 2,882 11,133 163 - 772 8,474 73,S44
Total••.........•... "..•.......•..•.....•. 3,536,292 429,542 685,140 5,800 690,691 )229,221,375 15,701,595 )92,333,578 3,892,547 3,204,542 4,085,362 2,975,448 88,714 444,300 2,731,267 17,422,180
See text for individual returns for "Explanation of Classifications and Terms" and for "Description of Sample and Limitations of Data."lSarnple variability of this item is too large to warrant showing it separately. However, this value is included in each totaL2Ad justed gross deficit.)Adjusted gross income less adjusted gross deficit.
Zt:l
~t:lc::::>t'"'
~is:M
~><
~~Zw
;:5~
....~
~01
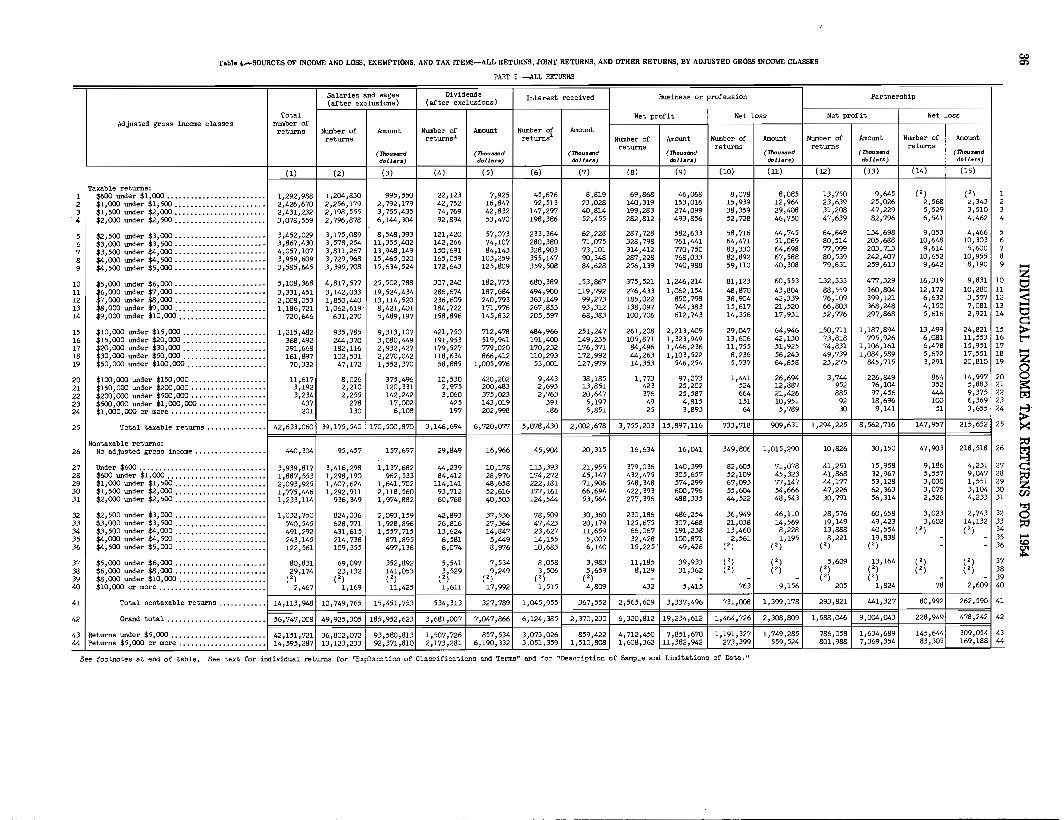
Tabl. 4.-S0URCES OF INCOME AND LOSS, EXEMPTIONS, AND TAX ITEMS-ALL RETURNS, JOINT RETURNS, AND OTHER RETURNS, BY ADJUSTED aROSS INCOME CLASSES
PART I. -.ALL RETURNS
Salaries and wages Dividends Interest received Business or profession Partnership(after exclusions) (after exclusions)
Total Net profit Net loss Net profit Net lossAdjusted gross income classes number of
returns Number of Amount Number of Amount Number of Amountreturns returns1 returns1
Number of Amount Number of Amount Number of Amount Number of Amountreturns returns returns returns
(Thousand (Thousand (ThoUIJll7ld (Thousand (Thou""nd (Thouund (Thou.7&':1d
dollars) dol1/Jn) dollar:r) dollar:r) dollars) doJIlJrII) dollars)
(1) (2) (3) (4) (5) (6) (7) (8) (9) (10) (11) (12) (13) (14) (15)
Taxable returns:1 $600 under $1,000 .............•.•.•....... 1,292,988 1,204,830· 995,550 22,123 7,925 45,676 8,819 69,868 46,068 8,078 8,085 13,750 9,645 (' ) ( ') 1
2 $1,000 under $1,500 ....................... 2,426,670 2,256,179 2,792,179 42,752 16,847 92,513 23,028 140,319 153,016 15,939 12,964 23,639 25 1026 2,568 £,343 2
3 $1,500 under $2,000 •.......•.•.......•.... 2,431 1232 2,198,555 3,755,435 74,769 42,832 147,297 40,814 199,283 274,099 38,359 29,408 31,208 47,229 5,529 3,510 3·4 $2,000 wider $2,500 .•..•..•............... 3 1°78,559 2,796,878 6,144,304 92,894 53,470 198,386 52,455 282,812 493,856 52,728 46,750 47,639 82,796 6,541 4,462 4
5 $2,500 under $3,000 ....................... 3,452,029 3 1175,089 8,548,393 121,420 57,073 233,364 62,228 287,728 582,633 58,716 44,745 64,649 134,698 9,053 4,466 5
6 $3,000 under $3,500 ....................... 3,867 1430 3,578,254 11,355,402 142 1266 74,107 280,380 71,075 328,798 761,441 64,471 51,089 80,514 205,688 10,648 10,303 6
7 $3,500 under $4,(X)() ....................... 4,057,107 3 1811,267 13,948,149 150,691 84,143 328,903 73,101 314,412 7/0,750 83,330 64,698 77,999 203,713 9,614 5,600 7
8 $4,000 under $4,500 ....•...•...........•.. 3,959,609 3,729,968 15,465,020 165,059 103,259 355,147 90,348 287,228 768,033 82,892 67,588 80,539 242,407 10,652 10,955 8
9 $4,500 under $5,(X)() ....................... 3,585,645 3,395,708 15,634,524 172,643 125,809 359,508 84,628 256,139 740,988 59,110 40,308 79,631 259,613 9,642 8,190 9
10 $5,000 under $6,000 ....................... 5,108,368 4,817,577 25,502,788 307,240 182,775 680,389 153,867 375,521 1,246,214 81,123 60 ,553 132,333 477 ,329 16,319 9,831 10
11 :6,000 under $7,000 ....................... 3,331,451 3,142,033 19,524,434 286,674 187,684 494,900 119,792 276,433 1,062,154 48,870 43,804 88,559 360,804 12,172 10,280 11
12 7,000 under $8,(X)() ....................... 2,008,053 1,850,440 13,114,520 236,609 240,793 363,149 99,273 185,022 850,798 38,904 42,339 76,109 399,121 6,632 3,577 12
13 $8,000 under $9,000 ....................... 1 1186,721 1,062,619' 8,421,401 184,722 171,976 267,853 93,312 138,097 744,383 15,617 21,520 66,803 368,248 4,150 7,081 13
14 $9,000 under $10,000 •..•....•............. 720,646 631,270 5,489,197 158,896 145,832 205,597 68,383 100,706 612,743 14,356 17,931 52,776 297,868 5,616 2,921 14
15 $10,(X)() under $15,000 ..................... 1,215,482 935,785 9,313,107 421,750 712,478 484,966 251,247 261,208 2,213,409 29,047 64,946 150,711 1,187,894 13,499 24,821 15
16 $15,000 under $20,000 ..................... 368,492 244,370 3 1080,449 191,953 519,941 191,400 149,235 105,871 1,323,949 13,606 42,130 73,818 795,926 6,081 11,553 16
17 $20,000 under $30,000 ..................... 291,668 182 1116 2,932,427 179,527 7/9,020 170,232 176,371 84,496 1,446,236 11,755 51,925 74,831 1,106,161 6,478 15,951 17
18 $30,000 under $50,000 ................•.... 161,897 102,531 2,270,042 118,634 866,412 110,293 172,992 44,263 1,103,522 8,236 56,243 49,739 1,084,589 5,672 17,551 18
19 $50,000 under $100,(X)() .................... 70,332 47,172 1,552,370 58,885 1,005,976 53,001 127,979 14,353 546,254 5,737 64,858 23,275 845,715 3,291 20,810 19
20 $100,000 under $150,000 ......•.•.•.•.•.... 11,617 8,026 375,496 10,530 420,202 9,443 38,185 1,773 97,073 1,441 26,694 3,744 226,849 864 14,997 20
21 $150,000 under $200 ,000 ................... 3,192 2,210 120,331 2,975 200,483 2,693 13J851 423 25,202 524 12,887 952 76,104 352 5,883 21
22 $200;000 under $500,000 ................... 3,234 2,255 142 J242 3,060 375,023 2 J763 20,647 376 25,587 664 21,426 885 97,456 444 9,375 22
23 $500,000 under $1,(X)(),(X)() ................. 437 278 17J002 425 143,019 391 5,197 49 4 1815 151 10,951 92 18,696 100 6,369 23
24 $1,000,(X)() or more ........................ 201 130 6,108 197 202,998 186 5,851 25 3,893 64 5,789 30 9,141 51 3 1655 24
25 Total taxable returns ............... 42,633,060 39,175,540 170,500,870 3 1146,694 6,72°1°77 51°78,430 2,002,678 3,755,203 15,897,116 733,718 909,631 1,294,225 8,562,716 147,957 215,652 25
Nontaxable returns:26 No adjusted gross income .................. 440,304 95,457 157,697 29,849 16,966 45,904 20,315 16,634 16,041 349,806 1,015 J290 10,826 30,150 47 1903 218,518 26
27 Under $600 ................................ 3,939 1817 3,416,298 1,1371682 44,239 10,178 113 ,393 21,955 379,036 140,399 82,605 71,078 41 1251 15 1958 9,186 4,231 27
28 $600 under $1,000 ......................... 1,8871553 1,2981190 962,533 84,412 28,976 174,272 45,147 432,475 305,657 52 1109 45,323 41,868 32,967 5,557 9,047 28
29 $1,(X)() under $1,500 ....................... 2J093 1925 1,407 1624 1,641,702 114,141 48,658 222,181 71,906 548,348 574,299 67,093 77 1147 44,177 53,128 3,030 1,551 2930 $1,500 under $2,(X)() ....................... 1,775,446 1,292,911 2,118,560 93,712 52,616 177 ,161 66,694 422,393 600,796 55,604 54 1666 47,226 62,363 3,075 3,104 3031 $2,000 under $2,500 ....................... I J233,114 936,349 I J9?4,882 60,768 40,503 124,544 53,564 277,396 488,335 44,522 48,543 30,791 56,314 2,526 4,233 31
32 $2,500 under $3,000 ....................... I J032,750 824,036 2J093.159 42,893 j7J536 78,509 30,360 230,186 486,254 36,949 46,110 28,576 6O J658 3,023 2,743 3233 $3,000 under $3,500 ....................... 740,545 628,771 1,928,896 26,816 27,364 47,423 20,179 125,675 307,468 21,038 14 1569 19,149 49,423 3,602 14,132 3334 $3,500 under $4,000 ....................... 491,292 431,615, 1,557,715 13,624 14,847 23,627 11,659 66,067 191,238 13,460 8,228 13,888 40,554 (' ) (' ) 34
35 $4,000 under $4,500 ....................... 243,145 214,738 871,895 6.581 5J449 14J155 5 J007 32,428 100,871 2,561 1,195 8,221 19,838 - - 3536 $4,500 under $5,000 ....................... 122 J561 109,355 497,136 6,074 8 J976 10,683 6 J14O 15,225 49,428 (' ) (' ) ( ,) (' ) - - 36
37 $5,(X)() under $6,(X)() ....................... 80,831 69,097 352,892 5,541 7J534 8,058 3,983 11,185 39,933 ( ') (' ) 5,609 13,164 ( ') (' ) 37
38 $6,(X)() under $81(X)() ........ : .............. 29,174 23,132 141,053 3,529 9,249 3,506 5,659 8J129 31,362 ( ') ( ') ( ,) ( ,) (, ) (' ) 3839 $8,(X)() under $10,000 ...................... ( ,) ( ,) ( ') ( ,) ( ') ( ,) ( ,) - - - - ( ') (' ) - - 3940 $10,(X)() or more ........................... 2J467 1,169 11 1425 1,611 17J992 1,515 4,809 432 5,415 763 9.156 205 1,824 78 2,609 40
41 Total nontaxable returns ............ 14 1113,948 10,749,765 15,451,753 534,313 327,789 1,045,955 367,552 2,565,609 3,337,496 731,008 1,399,178 293,821 441,327 80,992 262,590 41
42 Grand total ......................... 56J747 1OO8 49,925,305 185,952,623 3,681,007 7J047,866 6,124 1385 2,37° 1230 6,320,812 19J234,612 1,464,726 2,308,809 1,588.046 9,004,043 228,949 . 478,242 42
43 Returns under $5,(X)() ........................ 42 J151,721 36 1802,072 93,580,813 1,507,726 857,534 3,073 J026 859,422 4 J712,450 7,851,670 1,191,327 1,749,285 786,058 1,634,689 145 J644 309,054 4344 Returns $5J(x)() or more ...................... 14, 595 J 287 13,123,233 92,371,810 2,173,281 6,19"0 1332 3,051 J359 I J510,808 I J608,362 11,382,942 273,399 559,524 801,988 7,369 1354 83,305 169,188 44
See footnotes at end of table. See text, for individual returns for ''Expla..~t1on of Classifice.ticns e.nd Terms" wd for "Description of Sample and Limitations of Data. ot
~
....z
3~to<....Z
~tr.l
~><
~Zen
d~
.....~

Tabla 4.-S0URC~OF INCOME AND LaSS, EXEMPTIONS, AND TAX ITEMS-ALL RETURNS, JOINT RETURNS, AND OTHER RETURNS, BY ADJUSTED GROSS INCOME CLASSES-CoaUa.ad
PARr I. -ALL RFl'URNS-eontinued
Net operating sales of capital assets Sales of property other than capital assets Annuities and pensions Rents and royaltiesloss deduction
Net gain Net lOBS Net gain Net loss Net income Net lossAd justed gross income classes
Number of Amount Number of Amountreturns Number of Amount Number of Amount Number of Amount Number of Amount returns Number of Amount Number of Amount
returns returns returns returns returns returns(Th1&ustmd (ThouslJnd (Thousand (Thouflllnd ('Thou_lind (ThouslJnd (Thou:Jlfrld (Thouslfrlddollus) dollars) dollan) dollar,,) dollars) dollars) dolllJr:s) dollars)
(16) (17) (18) (19) (20) (21) (22) (23) (24) (25) (26) (27) (28) (29) (30) (31)
Taxable returns:1 $600 under $1,000 ....................... ( ') ( ,) 16,022 3,635 3,006 948 ( ,) ( ') - - 2,989 1,978 27,800 10,049 3,500 503 12 $1,()(X) under $1,500 ..................... - - 33,009 10,410 11,624 7,456 ( ,) ( ') ( ') (,) 7,074 4,872 56,927 33,948 15,601 4,106 23 $1,500 under $2,(X)() ..................... (') ( ') 50,084 20,156 13,233 8 J191 3 J568 1 J873 3,099 953 19,072 19,647 96,812 64 J922 26,759 8 J344 34 $2 JOOO under $2,500 ..................... ( ') ( ,) 73,198 34 J017 18,679 10 J725 3 J523 784 5 J536 2,102 26 J129 24,684 124,700 80,575 37,873 11,643 4
5 $2,500 under $3,000 ..................... ( ,) ( ,) 75,887 42,370 26,3?O 13 J379 4,006 2,893 7,625 6,158 27,181 28,128 158,190 97,409 54,286 14 J793 56 $3,000 -under $3,500 ..................... ( ') ( ,) 90,715 43,590 18,273 12,829 4,547 2 J061 10,607 7 J127 37 J446 34,682 177,636 104,209 64,358 17 J992 67 $3,500 under $4,000 .................... _ ( ') (') 114,859 67,208 25,239 13 J697 4,037 2,894 12,159 6,674 31 J219 24,557 203,021 105 J352 74,985 18,328 78 $4,000 under $4,500 ..................... ( ,) ( ,) 111 J927 70,594 34,839 18,563 5,054 1,161 15,158 9,337 33,351 36,154 253,330 135,128 103,577 24,708 89 $4,500 under $5,000 ......... ............ ( ') ( ,) 93,395 59J262 29,796 15,058 7,543 5,887 6,575 4,805 29 J724 31,968 235,021 116,585 89,503 23,240 9
10 $5,000 under $6,000 ..................... ( ,) ( ') 2i17 ,008 152 J244 55,207 27,670 6,023 3,495 22,325 10,993 42,874 46,242 372,966 232,269 152 J735 39,543 1011 $6,000 under $7,000 ..................... ( ,) ( ') 159,512 113,075 45,638 26,313 7 Jl13 3,230 13,227 5,031 30,263 30,880 275,393 187,130 112,140 31,097 1112 $7,000 under $8JOOO ..................... ( ,) ( ') 136,418 113,650 33 J012 15,020 7,608 4 J564 8,146 4,737 23,649 29,279 180,083 147,812 68,164 18;091 1213 $8 JOOO under $9,000 ..................... ( ,) ( ') 90,584 86,855 30,663 14,634 7,615 8,625 3,055 796 15,215 17 J566 121 J096 134,452 42,271 14,298 1314 $9 JooO under $10,(X)() .................... ( ,) ( ') 87,251 75,058 23,292 14 J447 3,065 2,987 2,571 585 12 J767 13,130 85,629 109,284 22,994 8,553 14
15 $10,000 under $15,000 ................... I J171 3,351 247,265 370,790 61,848 36,192 10,765 13,331 11,414 11,505 29 J901 37,827 196,103 329,963 48,125 28,038 1516 $15,000 under $20,000 ................... 312 1,477 111,526 235,366 30,229 18,875 4,106 4,932 5,029 5,047 12 J171 17,686 78,646 189,818 16,763 12,108 1617 $20,000 under $30,000 ................... 291 445 111,404 314,511 31,580 21,011 3,824 9,521 4,154 5,493 10,338 17,068 70,912 243,342 16,132 17,071 1718 $30,000 under $50,(X)() ................... 200 716 77,293 336,954 21,651 15,111 1,877 4,451 3,009 4,293 7,798 18,093 44,356 224,968 10,355 19,040 1819 $50,000 under $100J(X)() .................. 47 1,044 42,215 398,766 10,037 7,617 695 3,365 1,518 3,428 4,594 12,115 21 J250 163,599 4,999 14,370 19
20 $100,(X)() under $150,(X)() ................. ( ') ( ,) 8 J19O 190,331 1,488 1,102 136 I J052 361 1,435 971 3,489 3,837 54,837 1,Om 4,863 2021 $150,000 under $2oo,(X)() ................. 3 87 2,413 103,003 394 327 37 97 96 431 352 1,615 1,040 16,755 361 2,649 2122 $200,000 under $500,000 ................. 2 5 2,592 243,357 375 303 63 244 108 639 370 2,200 1,099 23,598 443 5,158 2223 $500,000 under $1,000,(X)() ............... 1 1 372 107,300 46 39 16 58 11 79 56 419 170 7 J544 73 1,038 2324 $1,000,000 or more ...................... 2 51 164 166,997 32 30 11 32 10 108 23 293 80 11,577 29 259 24
25 Total taxable returns ............. 14,174 30,296 I J943,303 3,359,499 526,571 299,537 87,272 78,666 137,327 91,887 405,527 454,572 2 J786,097 2,825,125 967,123 339,833 25
Nontaxable returns:26 No adjusted gross inccme ................ 11,046 86,136 61,371 117,850 24,598 16,821 3,034 2,881 21,484 70 J035 2,575 6,777 49,989 38,375 30 J409 27,802 26
27 Under $600 .............................. ( ,) ( ') 4O J216 20,495 21 J635 11,749 4,536 1,768 7,183 12 J427 13,003 5,199 127,365 41,127 23,732 13,656 2728 $600 under $1,000 ....................... ( ') ( ') 6O J870 26 J775 17,452 9,238 5,040 1,510 8,055 5 J034 41,015 22,586 191,310 94,241 17,742 6,374 2829 $1,000 under $1,500 ..................... 3,519 11,473 85,736 46,757 17,639 11,679 8,980 4,695 8,048 3 J987 82,661 70,466 235,080 154,871 24,714 7,553 2930 $l J5oo under $2,000 ..................... ( ') ( ') 68,341 38,157 19,083 10,197 7,085 2,887 6,180 4,426 82,029 95,354 178,149 122,355 15,662 6,170 3031 $2,(X)() under $2,500 ..................... - - 50,599 32 J059 10,524 4,729 6,584 4,100 5,546 2,929 51,765 73,443 115,311 98,977 16,209 5,110 31
32 $2,500 under $3,000 ..................... (' ) ( ') 41,954 24,080 10 J614 6 J160 4,991 5,418 5,546 3,070 29,727 49,055 74,499 62,370 18,184 11,685 3233 $3,000 under $3,500 ..................... - - 22,770 25,765 6,090 3,988 3,034 2,085 4,023 2,908 12,176 16,866 39,777 35,242 10,101 2,722 3334 $3,500 under $4,000 " ................... ( ') ( ,) 14,104 14,021 4,984 2,974 ~' )
( ') (, ) (' ) 4,085 5 J085 23,076 13,154 10,597 4,103 3435 $4,000 under $4J500 ......... ~ ........... - - 5,532 3,088 2,551 1,410 ') ( ') - - 2,514 2,472 19,662 19,413 4,068 683 3536 $4,500 under $5 J(X)() ..................... - - 2,551 297 ( ') ( ,) ( ') (' ) ( ') ( ,) ( ') ( ') 9,087 8,761 ( ') ( ,) 36
37 $5,000 under $6,000 ..................... - - 9,036 6,759 ( ') ( ') - - ( ') ( ,) ( ') ( ,) 8,540 7,526 2,518 1 J049 3738 $6,000 under $8,(X)() ..................... - - 3,529 5,438 - - ( ') ( ') ( ') ( ') - - 4,553 6,417 ( ,) ( ,) 3839 $8,000 under $10,000 .................... - - ( ') ( ,) - - - - - - - - ( ') ( ,) - 3940 $10,000 or more ......................... - - 711 9,573 820 773 33 13 41 123 151 244 623 7,163 244 775 40
41 Total nontaxable returns .......... 20,607 114,669 467,844 372,363 137,513 79,909 47,790 29,145 70,129 107,171 324,752 351,497 1,077,521 711,167 176,714 89,709 41
42 Grand total " ........... .......... 34,781 144,965 2,411,147 3,731,862 664,084 379,446 135,062 107,811 207,456 199,058 730,279 806,069 3,863,618 3,536,292 1,143,837 429,542 42
43 Returns under $5,000 .......... ' ........... 28,194 127,102 1,113,140 700,586 316,766 179,910 81,558 47 J569 131 J392 143,781 537,252 555,828 2,396,742 1,437/063 643,877 210,171 4344 Returns $5,000 or more .................... 6,587 17,863 1,298,007 3,031,276 347,318 199,536 53,504 60,242 76 J064 55,277 193,027 250 J241 1,466,876 2 J099,229 499,960 219,371 44
See footnotes at end of table. See text for individual retw-ns for "Explanation of Classifications and Terms" and for "Description of Sample and Limitations of Data. 1I
zsa:sg>t"'
Z8a::trl
~:><
~~en
::5~....~
~-.;J

Table 4.-50UBCES OF INCOME AND LOSS, EXEMPTIONS, AND TAX ITEMS-ALL RETURNS, JOINT RETURNS, AND OTHER RETURNS, BY ADJUSTED OROSS INCOME CLASSES-Co.Ii.oed
PART I.-JJ.L RE'I'UIlN&-L:ont inued
~
Estates and trusts
Income
Taxable incom"e"
Amount
(ThoulJlI1'Iddollars)
Number ofreturns
Tax credits for-
Amount
(ThoUIIlJ11ddolllJr!J)
NUIIlber ofreturns(ThoulJlJ11d
dollau)
e~:~~rW~~hIIn~~;r:ax I Dividends .recelved I Retireme~t income Ino taxable cred1ts
incomeAmount
(Thou!Jlfnddol/en)
Number ofreturns
(Thoutfll1'lddollan)
Exemptions
(Thousanddoll.raJ
Adjustedgross
income
Othersources
(ThouaMddollau)
Amount
(ThoUlJlJ11ddollars)
Loss
Number ofreturns(17louIJlJnd
dollan)
AmountNumber ofreturns
Adjusted gross income classes
(32) (33) (34) (35) (36) (37) (38) (39) (40) (41) (42) (43) (44) (45) (46) .
25 1 Total taxable returns .
Nontaxable returns:261 No adjusted gross income .
271 Under $600 .28 $600 under $1,000 .29 $1,000 under $1, 500 .30 $1,500 under $2,000 ..31 $2,000 under $2,500 .
10 I $5,000 under $6,000 .11 $6,000 under $7,000 ..12 $7,000 under $8,000 .13 $8,000 under $9,000 .14 $9, ()()() under $10,000 .
d~....~
52§g>t"'
52~tzj
~
~~u:J
1234
(2)391
1,517
2,326 53,989 63,226 73,836 83,708 9
5,311 103,861 113,537 123,078 131,583 14
6,091 152,519 162,459 171,557 18
928 19
195 2066 2172 2213 23
6 24
- , 26
- 27(2) 28
718 294,344 305,385 31
3,643 322,339 331,208 34
760 35911 36
671 137- 38- 39
868 40
50,323 I 25
15,62425,81823,78226,75124,271
28,88619,76719,17114,1688,040
29,58812,70911,8518,1924,577
1,013341354
6029
(2)19,64350,34641,892
(2)7,114
16,158
328
25,23817,760
6,6154,0544,546
3,068
298,764
7991,2411,2101,8941,791
2,9923,2024,0263,1402,639
58151424657
7,2933,3976,1632,0692,962
55
19
(2)195157113
116186
71199
(2)
13,0649,472
14,14216,01717,999
116,802
269
2,551
(2)7,040
19,69212,152
10,1359,1355,098
fl~48
15,52225,21851,59369,824
10,2762,9012,974
395185
362,617171,197164,555111,23456,531
214,267203,389188,357145,465118,933
82,739104,557101,328111,240111,891
3,7592,5251,279
959947
1,289
(2)913
4,5015,498
738(2)
37,706213,724345,450577 ,376
623,445261,673463,586157,654226,062
820,9751,125,8341,351,1321,496,0251,565,375
2,778,6852,392,8941,828,2091,307,544
937,243
2,205,6061,158,4361,540,0471,704,3041,732,154
- .26,851,139.12,427,188
77,76328,674(2)2,052
440,304
3,939,8171,886,5642,073,3101,724,0831,190,722
1,006,512721,268484,677238,591117,514
4,480
18,79712,8396,1954,8004,730
(2)3,018
19,81824,770
4,275(2)
1,170,329452,450740,497234,854332,333
4,107,0805,594,0416,692,8527,404,2117,754,769
188,4451,069,6131,728,7962,890,502
10,096,3514,808,1765,610,7695,052,1153,946,268
13,782,37911,821,0628,944,4846,324,4194,479,948
415
3,068(2)
26,23819,2776,6154,5545,047
(2)'20,61551,36342,392
11,6173,1923,234
437201
1,292,9882,426,6702,431,2323,078,559
3,452,0293,867,4304,057,1073,959,6093,585,645
5,108,3683,331,4512,008,0531,186,721
720,646
1,215,482368,492291,668161,89770,3)2
723,910
3,317,6342,624,0793,669,3433,768,7553,162,076
2,932,4742,367,2241,-790,841
966,505505,369
367,494125,935
(2)6,899
4,210,7055,383,7036,527,6737,139,0466,921,884
775,7931,634,1401,994,9753,178,049
23,4526,3716,463
810354
2,452,592768,160613,382'342,787147,010
66,965,710 I 42,633,0601115,226,743
10,262,7156,763,3134,016,8822,359,2021,436,249
1,389,769546,951915,760293,111406,532
1,078,798.3,047,9874,237,8236,922,726
31,014,480
1,294,8161,463,8702,582,7413,119,7982,781,270
2,799,6152,386,6581,842,3381,030,931
575,819
435,963196,196(2)47,849
9,505,22512,592,64015,219,84916,818,64317,010,192
27,910,80821,524,45414,961,90610,032,0346,808,273
14,390,5586,316,3077,018,9636,067,7274,651,794
209,668,830
47,69331,36128,15428,62519,510
9,2372,3152,727
267184
24,85626,85343,31331,62329,373
44,92438,91030,16624,67610,070
2,616
(1~051,148
17,4049,677
10,4413,4821,683
11,624
14,72015,20220,69528,31420,907
4,43212,06918,11622,317
531,771
289222297
269
(2)
(2)
(2)
(2)( 2)
(2)( 2)(2)
(2)
(2)(2)
707393281562
1,113
(2)
(2)
4,671
(2)
(2)
971755576690464
1234264
83
(2)
(2)
4
(2)(2)
(2)
(2)(2)
(2)(2)(2)
( 2)
10,730
7673,4695,2069,419
( 2)
3,757(2)3,032
(2)(2)
(2)(2)
1,681
9,4515,5038,954
11,8403,729
10,14718,043
5,7718,603
13,376
21,37114,48115,79421,80130,437
82,37959,22778,32970,59589,385
22,4329,681
19,8817,2979,359
627,250
236
t1f23
11~9(2)
(2)(2)
2,431799930136
66
(2)
25,10222,61116,67719,68016,155
40,78320,45623,20416,44111,606
2,5005,0169,575
11,102
10,62515,16511,04611,59711,706
4,00612,02211,51113,5305,011
305,409
$2,500 under $3,000 .$3,000 under $3,500 .$3,500 under $4,000 .$4,000 under $4,5OC .$4,500 under $5,000 .
$5,000 under $6,000 .$6,000 under $8,000 .$8,000 under $10,000 .$10,000 or more .
3233343536
Taxable returns:1 $600 under $1,000 .2 $1,000 under $1,500 .3 $1,500 under $2,000 .4 $2,000 under $2,500 ..
5 $2,500 under $3,000 .6 $3,000 under $3,500 .....•.............•.•.•.•...7 $3,500 under $4,000 .
~ t::~ :~:~ t:&c;g:::::::::::::::::::::::::::::
37383940
15 $10,000 under $15,000 .16 $15,000 under $20,000 .17 $20,000 under $30,000 .18 $30,000 under $50,000 .19 $50,000 under $100,000 .
20 $100,000 under $150,000 .21 $150,000 under $200,000 ..22 $200,000 under $500,000 .23 $500,000 under $1,000,000 .24 $1,000,000 or more .
431 Returns under $5,000 .44 Returns $5,000 or more .
690,691 2,499,803
367,101 743,707323,590 1,756,096
41
42
Total nontaxable returns .
Grand total .
63,397
368,806
148,470220,336
57,890
685,140
125,814559,326
1,528
12,258
5,0417,217
.1,129
5,800
1,5294,271
158,920 I 419,552,5451 26,330,952 181,073 104,558113,932,875 22,661 72,615 1,222 I 174,479
118,0241 473,243
9,3731 311,101108,651 162,142
20,875 41
71,198 42
38,383 4332,815 44
See footnotes at end. of table. See text for individual returns for ''Explanation of Claasifications and Terms" and for "Description of Sample and Limitationa of Data.1!

Table ••-SOURCES OF INCOME AND LOSS, EXEMPTIONS. AND TAX ITEMS-ALL RETURNS. JOINT RETURNS. AND OTIlER RETURNS. BY ADJUSTED GROSS INCOME CLASSES-Co.~ ••ad
PART I. -ALL RETURNS-Continued
Tax credits for- Tax withheld Payments on 1954 Tax due at tillle Overpaymentdeclaration of filing
Income taxForeign tax paid Tax paid at source
Partially tax- liability Refund Credit on 1955 taxAdjusted gross income classes exempt. interest after
credits NUJIlber of Amount Number of Amount Number of Amount.Number of Amount Number of Amount Number of Amount returns' returns6 returns Number of Amount Number of Amount
returns (Thou.... returns (Thousand returns (ThouSiJ"d (Thousand (Thousand (ThotlslJnd (ThoUlJlflldreturns
(1hou~llmdreturns
(Thouunddollars) dollars) doll at's) dollars) dollars) dollars) dolllJu) <kJl1at's) dollars)
('7) (/,8) ('9) (50) (51) (52) (53) (5') (55) (56) (S?) (58) (59) (60) (61) (62) (63)
Taxable returns:1 $600 under $1,000 .................. - - - - - - 37 1 648 1,109,765 93,295 20,912 1,711 222,194 5,540 1,047,007 61,184 9,702 757 12 $1,000 under $1,500 ................ - - - - - - 213,519 2,132,468 262,790 69,814 8,468 735,394 24,716 1,571,148 77,486 24,951 1,862 23 $1,500 under $2,000 ......•......... - - - - - - 3'04,635 2,074,657 379,768 113,698 19,147 715,258 43,319 1,564,877 86,138 44,206 4,647 34 $2,000 under $2,500 ................ (') (') - - ( 2) (') 575,180 2,677,970 627,970 166,195 36,902 954,966 61,384 1,946,813 130,963 63,679 8,707 4
5 $2,500 under $3,000 ................ - - - - (') (') 817,847 3,075,596 886,582 206,357 ,7,299 1,061,023 71,032 2,176,929 164,143 59,902 6,586 56 $3,000 under $3,500 ................ - - - - (') (') 1,120,604 3,494,547 1,180,154 223,499 56,304 1,505,897 94,328 2,205,148 180,528 73,987 8,778 67 $3,500 under $4,000 ................ (') (2) - - - - 1,346,691 3,729,857 1,413,191 254,484 70,213 1,599,087 107,501 2,310,097 211,367 80,925 11,632 78 $4,000 under $4,500 ................ ( 2) (') - - (') ( 2) 1,489,975 3,666,167 1,565,993 265,846 86,471 1,439,029 107,428 2,377,382 235,390 91,529 13,411 89 $4,500 under $5,000 ................ (') ( 2) (') (') - - 1,559,856 3,352,693 1,619,377 250,805 84,602 1,283,192 108,461 2,177,162 220,965 85,460 14,019 9
10 $5,000 under $6,(XX) ................ ( 2) ( 2.) (') (') (') (2) 2,770,109 4,758,254 2,792,259 436,589 178,300 1,701,170 195,435 3,214,847 340,293 147,795 26,985 1011 $6,000 under $7,000 ................ 3,054 426 - - (') (') 2,385,403 3,101,022 2,327,300 359,286 170,601 1,246,805 159,232 1,943,184 228,441 119,836 22,807 1112 $7,000 under $8,000 ................ (') ( 2) (') ( 2) (') (') 1,820,597 1,828,585 1,674,977 306,311 173,945 882,426 132,629 1,037,964 127,737 83,385 17,994 1213 $8,CXX) under $9,000 ................ (') (2) (') (') (') ( 2) 1,301,277 1,042,254 1,126,227 239,222 158,777 577,976 117,682 544,417 72,627 62,531 17,594 1314 $9,(XX) under $10,000 .•..... ~ ........ (2) ( 2) - - - - 932,992 619,522 769,337 192,576 143,843 369,106 87,760 295,273 43,630 56,904 15,635 14
15 $10,000 under $15,000 .............. 7,650 1,264 1,236 3 883 18 2,185,166 895,545 1,229,769 568,047 795,295 741,384 338,160 31',184 78,372 165,079 77,248 1516 $15,000 under $20,000 .............. 5,891 844 1,971 1 620 11 1,145,589 224,249 473,563 260,697 533,021 243,136 219,573 54,415 46,376 72,696 25,402 1617 $20,000 under $30,000 .............. 7,437 1,553 1,071 1 885 9 1,521,883 164,773 487,463 243,255 854,337 195,551 280,291 27,720 27,392 70,198 65,579 1718 $30,000 under $50,000 .............. 7,620 2,720 2,843 5 1,365 24 1,683,981 91,661 565,277 146,614 1,057,477 111,025 297,511 9,784 17,090 41,721 215,239 1819 $50,000 under $100, (XX) ............. 7,391 4,484 2,008 11 893 22 1,708,710 41,867 315,873 67,283 1,180,511 49,279 285,936 2,757 9,704 18,486 62,262 19
20 $100,000 under $150,000 ....•......• 2,113 1,393 579 2 256 7 614,555 6,867 75,072 11,347 466,534 8,229 94,183 323 2,083 3,080 18,880 2021 $150,000 under $200,000 ............ 792 1,192 154 (') 75 , 257,014 1,883 22,880 3,154 202,529 2,250 39,537 112 1,205 835 6,655 2122 $200,000 under $500,000 ............ 939 1,977 172 (') 82 11 455,363 1,887 28,743 3,202 378,397 2,230 66,969 103 1,246 910 17,433 2223 $500,000 under $1,000,CXX) ....••.... 163 773 27 11 17 3 154,785 215 2,9()1, ,31 136,302 296 19,194 22 869 123 2,738 232' $1,000,000 or more ................. 68 719 - - 7 1 222,374 99 1,086 201 197,252 138 26,753 11 '16 53 2,299 24
25 Total taxable returns ......•. 52,192 18,078 13,135 39 9,113 144 26,665,753 38,092,403 19,921,850 4,409,825 7,038,238 15,647,041 2,984,554 24,821,679 2,365,645 1,377,973 665,149 25
Nontaxable Feturns:26 No adjusted gross income •......•.•• - - - - - - - 74,922 20,020 58,176 27,037 10,080 330 9',858 35,113 31,475 11,519 26
27 Under $600 ......................... - - - - - - - 3,224,143 104,233 29,636 6,723 80,007 1,150 3,233,360 107,636 15,805 2,801 2728 $600 under $1,000 .................. - - - - - - - 983,438 54,319 41,578 9,990 155,540 3,563 991,571 57,737 25,259 5,797 2829 $1,000 under $1,500 ......•......... - - - - - - - 962,228 75,907 59,019 10,094 186,641 6,247 973,935 79,048 32,850 5,354 2930 $1,500 under $2,(XX) •....•.•........ - - - - - - - 923,457 80,068 71,691 14,137 161,233 6,936 936,946 84,627 34,521 7,334 3031 $2,000 under $2,500 .•...•.......... - - - - - - - 657,207 59,135 60,223 9,931 99,393 5,341 672,349 63,088 25,800 3,542 31
32 $2,500 under $3,(XX) ................ - - - - - - - 619,836 62,872 44,550 9,456 91,658 6,013 615,998 66,052 22,005 3,895 3233 $3 , 000 under $3,500 ................ - - - - - - - 498,585 46,365 35,498 7,581 58,993 4,045 497,349 48,808 16,000 3,358 3330\ $3, 500 under $4,000 ........•....... - - - - - - - 355,203 37,204 19,024 3,891 30,939 2,595 356,255 38,391 10,235 1,461 30\35 $4,000 under $4,500 ..•...•...•..... - - - - - - - 173,412 21,925 8,800 1,729 18,533 1,333 170,372 22,219 4,143 660 3536 $4,500 under $5,CXXl ........•••••... (') (') - - - - - 91,762 12,403 7,150 1,693 5,153 465 94,785 13,261 (') (2) 36
37 $5,000 under $6,000 ................ ( ') (') (') (') - - - 62,075 11,325 6,661 2,639 5,174 419 64,133 11,846 4,102 1,839 3738 $6,000 under $8,000 ................ ( ') (') - - - - - 18,613
Zlj29 t1r2Zlr2 ( 2) (') l'M79 (lr6 2,585 1,370 38
39 $8,000 under $10,(XX) ...•........... - - - - - - - (') - - - - 3940 $10,000 or more ....•.........•...•. 159 402 - - - - - 901 1,630 1,492 3,795 121 13 1,379 3,477 636 1,939 40
41 Total nontaxable returns ...•. 1,676 560 (') (') - - - 8,646,805 593,883 448,124 113,745 903,982 38,488 8,723,392 641,234 227,508 51,477 41
42 Grand total ........•......... 53,868 18,638 13,652 ,3 9,113 144 26,665,753 46,739,208 20,515,733 4,857,949 7,151,983 16,551,023 3,023,042 33,545,071 3,006,879 1,605,481 716,626 42
43 Returns under $5,000 .........•.•.•.•. 4,017 370 517 1 1,541 10 7,505,955 33,877,913 8,603,571 2,006,955 513,379 10,414,210 661,727 26,014,341 1,984,144 754,526 116,728 4344 Returns $5, (XX) or more ............... 49,851 18,268 13,135 42 7,572 130\ 19,159,798 12,861,295 11,912,162 2,850,994 6,638,604 6,136,813 2,361,315 7,530,730 1,022,735 850,955 599,898 44
See text for individual returns for "Explanation of Classifications and Terms" and for "Description of Sample and Limitations of Data. II
lExcludes returns, Form 104QA, in adjusted gross income classes under $5,(XX)·.2Sample variability of this item is too large to warrant showing it separately. However, this value is included in each total.:1Adjusted gross deficit.'Adjusted gross income less adjusted gross deficit.'Includes returns with income tax withheld, or with excess social security tax withheld, or with both.6Includes returns with payments on declaration, or with credit for overpayment of prior year's tax, or with both.7Less than $500.
Zt:J<:g:>t""
Z8s::t:":l
~:><
~~rJJ
d::0I-'
~
~CO

Tabl. 4.-S0URCES,OF INCOME AND LOSS, EXEMPTIONS, AND TAX ITEMS-ALL RETURNS, JOINT RETURNS, AND OTHER RETURNS, BY ADJUSTED GROSS INCOME CLASSEs.-COnUnued
PARr n.-JOINT Rll'I1JIlNS
salaries and wages DividendsInterest received Business or profession Partnership(after exclusions) (after eXclusions)
Net profit Net loss Net profit Net lossAdjusted gross incDme classes Number of
returns Number of AmountNumber of Amount Number of AmOunt
returns returns 1 returns1 AmOWlt AmOWlt AmOWlt AmountNumber of Number of Number of Number of
(Thou:tlUld (Thouaand (Thouund returns (ThoulflUld returns (ThoutllUld returns (J'looutJand returns (Thousanddollan) dollan) dolJau) dolllJu) dollan) dollMtJ) dollan)
(1) (2) (3) (4) (5) (6) (7) (S) (9) (10) (11) (12) (13) (14) (15)
Taxable returns:1 $600 under $1,000 •.•.•...•.....•.. , •...... - - - - - - - - - - - - - - - 12 $1,000 under $1,500 ....................... 136,907 100,714 135,478 2,485 117 8,042 2,542 42,647 50,820 4,025 4,27.0 (2 ) (2 ) - - 23 $1,500 under $2,000 ....................... 429,159 337.021 566,144 11,554 6,876 29,588 9,863 108,957 151,927 24,666 20,752 B,67J 12,588 (2 ) ( 2) 34 $2,000 under $2,500 .............. , ........ 933,923 780,014 1,678,045 22,782 8,750 61,035 16,081 19S,056 338,69.2 37,072 37,993 25,151 48,007 3,529 2,234 4
5 $2,500 under $3,000 ....................... 1,463,928 1,276,841 3,428,969 35,655 11,029 98,044 26,932 228,771 462,870 48,655 40,534 44,725 92,341 6,536 3,663 56 $3, (XX) under $3,500 ....................... 2,013,805 1,813,570 5 J 712 ,460 50,274 17,448 130,997 34,562 279,603 639,791 56,319 46,827 54,992 143,916 7,642 9,794 67 $3, 500 under $4,000 ....................... 2,619,817 2,434,876 8,880,461 70,576 26,719 179,506 34,745 276,748 672,592 75,707 56,332 59,571 158,191 8,597 5,151 78 $4, (XX) under $4, 500 .. ..................... 2,945,716 2,754,007 11,427,056 78,853 29,291 229,635 54,368 265,370 720,569 74,806 64,284 71,254 216,882 8,084 5,046 89 $4,500 Wlder $5,000 ....................... 2,890,378 2,742,075 12,622,958 99,479 44,329 260,383 56,551 234,173 674,942 55,056 38,674 66,369 219,374 8,125 7,776 9
10 $5,000 under $6,000 ....................... 4,491,165 4,262,100 22,641,271 195,507 80,305 525,300 105,788 340,173 1,108,081 75,550 52,924 115,347 409,709 14,220 8,253 1011 $6,000 under $7,000 ............ ' .......... 3,063,436 2,910,212 18,139,644 209,853 104,009 410,270 82,209 256,992 972,619 46,313 39,343 79 ,288 319,776 10,655 8,495 1112 $7,000 under $8,000 ....................... 1,865,911 1,742,806 12,403,639 185,681 137,433 310,753 76,019 171,329 770,915 36,898 40,067 67,385 352,277 5,574 3,507 1213 $8,QCX) under $9,000 ....................... 1,112,694 1,007,499 8,044,741 151,188 101,383 234,318 70,757 131,380 699,753 13,068 15,713 60,033 335,037 3,633 6,920 1314 $9,(X)() under $10,000 ...................... 678,854 602,387 5,258,486 134,357 104,392 187,221 58,944 93,964 586,528 13,839 15,563 46,529 264,897 5,616 2,921 14
15 $10,000 under $15,000 ..................... 1,109,457 881,467 8,863,452 353,888 436,503 420,242 184,510 243,060 2,069,419 26,009 55,229 134,393 1,055,226 11,631 22,715 1516 $15,000 under $20,000 ..................... 331,080 227,926 2,905,342 164,681 349,967 167,067 119,265 99,190 1,247,890 12,404 37,759 67,677 725,143 5,415 10,109 1617 $20,000 under $30,000 ..................... 258,228 167,460 2,732,418 152,143 509 ,985 145,883 138,274 80,060 1,377,248 10,628 47,676 68,135 1,017,565 5,668 14,521 1718 $30,000 under $50,000 ..........•.......... 144,975 95,382 2,149,500 103,926 630,066 97,388 143,445 41,753 1,047,861 7,497 50,728 46,346 1,013,349 4,813 16,194 IS19 $50,000 under $100,000 .................... 62,217 44,053 1,470,533 51,464 747,399 46,466 106,088 13,527 521,273 5,142 55,784 21,828 797,994 2,994 19,614 19
20 $100,000 under $150,000 •...•.•............ 10,041 7,447 355,593 9,035 318,065 8,154 31,418 1,635 91,317 1,330 24,387 3,501 214,314 771 14,120 2021 $150,000 under $200,000 ................... 2,693 2,024 111,423 2,497 151,828 2.266 11,193 387 22,846 464 10,812 885 72,353 303 4,946 2122 $200,000 under $500,000 ................... 2,656 2,031 130,904 2,499 277,688 2,271 16,563 334 23,075 570 18,087 803 89,107 382 8,051 2223 $500.()(X) Wlder $1,()(X),000 ................. 322 233 15,620 313 102,671 293 3,511 41 3,933 123 8,931 70 12,939 84 5,860 2324 $1.()(X).()(X) or more ........................ 110 93 4,413 107 65,631 102 2,442 15 2,282 41 3,394 21 3,508 29 1,778 24
25 Total taxable returns ............... 26,567,472 24,192,328 129,678,550 2,088,797 4,261,884 3,55~,224 1,386,0'70 3,108,165 14,257,243 626,182 786,063 1,044,972 7,576,364 115,80'7 183,038 25
Nontaxable returns:26 No ad justed gross income .................. 309,432 75,120 136,809 19 J 109 12,558 29,181 15,691 12,491 13,134 256,284 807,676 8,241 12,527 30,644 170,407 26
27 Under $600 ................................ 558,410 307,295 142,246 13.583 3,668 39,676 9,346 207,164 77,458 59,163 56,340 16,190 7,694 5,084 2,477 2728 $600 under $1,000 ....•............. " ..... 830,262 500,963 400,018 21,078 8,492 56,538 15,025 306,446 221,288 43,031 40,721 23,859 19,821 4,023 7,958 2829 $1,000 under $1,500 ....................... 1.322,535 866,301 1,012,805 53,060 19,031 106,917 35,490 446,938 469,354 61,072 74,121 34,553 42,411 2,530 1,051 2930 $1,500 under $2,000 ....................... 1,351,828 978,080 1,591,624 47,902 22,885 115,985 44,141 3S6,397 549,802 52,065 53,160 40,646 55,209 3,0'75 3,104 3031 $2,000 under $2,500 ....................... 1,068,711 816,741 1,721,716 40,134 23,566 95,857 38,412 267,7S7 470,548 43,516 45,421 29,774 54,993 2,526 4,233 31
32 $2,500 under $3,000 ............•.......... 936,201 748,157 1,897,617 30,751 24,714 64,440 26,532 224,654 474,179 36,460 46,032 27,570 58,272 2,523 2,687 3233 $3,000 under $3, 500 .......... ............. 693,715 594,141 1,822,592 17,732 12,928 38,815 13,984 124,152 302,049 19,515 14,260 18,091 46,360 3,602 ViI )32 3334 $3, 500 under $4,000 ....................... 470,197 417,028 1,505,949 10,601 8,996 21,121 7,884 63,065 181,865 12,426 8,042 13,371 38,491 (2 ) 3435 $4,000 under $4,500 ....................... 231,626 203,719 829,158 5,581 5,288 13,155 4,883 32,428 100,871 2,561 1,195 7,721 19,215 - - 3536 $4,500 under $5,000 ....................... 118,014 106,314 488,315 4,040 3,912 8,149 4,955 14,736 47,114 (2 ) ( ') - - - - 36
37 $5,000 under $6,000 ....................... 79,814 69,097 352.892 4,524 4,743 7,041 3.468 11,185 39,933 ( 2) ( 2) 5,609 13,164 (2 ) ( 2) 3738 $6,()(X) under $8,000 ....................... 27,168 21,615 132,7?? 3,529 9,:249 3,506 5,659 7,640 27,839 ( 2) (2 ) ( 2) (2 ) (2 ) (2 ) 3839 $8,000 under $10,000 ...................... (2 ) (2 ) ( 2) ( 2) (2 ) (2 ) (2 ) - - - - (2 ) (2 ) - - 3940 $10.000 or more ........................... 2,097 1,034 10,132 1,374 13,117 1,379 3,942 399 4,729 721 7,150 198 1,635 65 1,462 40
41 Total nontaxable returns ............ 8,001,010 5,706,605 12,049,078 273,498 174,017 602,760 229,582 2,105,482 2,980,163 591,312 1,161,991 226,823 372,185 57,084 209,933 41
42 Grand total ......................... 34,568,482 9,898,933 141,727,628 2,362,295 4,435,901 4,157,984 1,615,652 5,213,647 17,237,406 1,217,494 1,948,054 1,271,795 7,948,549 172,891 392,971 42
43 Returns under $5,000 ................. ' ...... 21,324,564 17,853,067 56,000,420 635,229 290,597 1,587,064 451,987 3,720,583 6,619,865 964,356 1,458,135 552,747 1,248,163 99,532 241,581 4344 Returns $5,000 or more ..... ' . ............... 13,243,918 2,045,866 85,727,208 1,727,066 4,145,304 2,570,920 1,163,665 1,493,064 10,617,541 253,138 489,919 719,048 6,700,386 73,359 151,390 44
See footnotes at end of table. SE;E; tE;xt for indi..... idua1 t'eturns for "Explanatio~ of Classifications and Tet'fl\s" and for tlDescription of Sample and Limitations of Data. it
~
.....z
3g>t"".....z8ls:t.".:l
~
~~00
6~....~

Tobie f.-SOURCES OF INCOME AND LOSS, EXEMPTIONS, AND fAX ITEMS-ALL RETURNS, JOINT RETURNS, AND OTHER RETURNS, BY ADJUSTED GROSS INCOME CLASSES-Cootioued
PARr II.-JDINf RETURNS-Continued
Net operating sales of capital assets Sales of property other than capital assets Annuities and pensions Rents and royaltiesloss deduction
Net gain Net loss Net gain Net loss Net income Net lossAdjusted gross income classes
Number of Amount Number of Amountreturns Number of Amount Number of Amount Number of Amount Number of Amount returns Number of Amount Number of Amount
returns returns(Thou~lJIId
returns(ThoulJo/I1Id
returns(Thousand (Thousand
returns(ThoUiUf1Id
returns(Thouaand(Thou:JlJIId (7'hou"..,d
dollars) dollars) dollars) dollars) dollars) dollars) dollars) dollars)
(16) (17) (18) (19) (20) (21) (22) (23) (24) (25) (26) (27) (28) (29) (30) (31)
Taxable returns:1 $600 under $1,000 ....................... - - - - - - - - - - - - - - - - 12 $1,000 under $1,500 ..................... - - 7,922 1,541 2,513 1,192 - - (2) (2) (2) (2) 7,114 4,085 (2) (2) 23 $1,500 under $2,000 ..................... (2) (2) 15,998 7,701 3,068 2,633 (2) (2) 2,582 803 2,989 2,974 31,382 19,183 11,193 4,519 34 $2,000 under $2,500 ..................... (2) (2) 38,008 17,810 10,63.0 6,652 (2) (2) 3,502 1,841 8,005 7,072 54,724 31,779 18,294 6,530 4
5 $2,500 under $3,000 ..................... (2) (2) 45,207 26,403 12,746 8,133 2,989 2,268 6,125 6,040 8,023 5,865 99,196 50,188 32,193 9,128 56 $3,000 under $3,500 ..................... .(2) (2) 54,513 24,241 9,131 6,293 4,047 1,785 8,607 5,674 15,159 14,965 115,367 54,930 43,796 11,371 67 $3,500 under $4,ocx:> ..................... - - 80,636 47,385 16,222 8,840 2,520 953 9,659 5,401 14,071 12,897 140,798 67,242 55,361 13,788 78 $4,ocx:> under $4,500 ..................... (2) (2) 74,167 47,328 27,268 15,653 4,054 1,063 11,652 6,966 18,703 21,234 198,521 100,571 87,484 21,508 89 $4,500 under $5,ocx:> ..................... (2) (2) 67,168 47,208 24,155 12,692 7,043 5,687 6,075 4,173 19,157 23,289 193,171 81,095 74,486 20,196 9
10 $5,000 under $6,000 ..................... (2) (2) 152,971 96,667 41,974 21,400 3,489 1,391 20,791 10,136 30,689 36,127 320,949 169,216 133,025 32,473 1011 $6,()(X) under $7,ocx:> ..................... (2) (2) 130,151 85,358 38,431 22,708 6,613 3,193 13,203 5,019 22,220 26,438 247,544 141,524 106,593 28,267 1112 $7,ocx:> under $8,OCX:>, ..................... - - 108,238 81,883 28,923 12,419 6,108 3,169 7,629 4,459 16,654 20,083 160,860 113,675 63,141 14,622 1213 $8,ocx:> under $9,ocx:> ..................... (2) (2) 75,891 66,118 24,972 10,908 5,581 8,411 3,055 796 11,158 14,199 105,315 92,608 39 ,282 12,715 1314 $9,000 under $10,000 .................... (2) (2) 76,047 63,723 21,703 13,334- 2,541 2,485 2,571 585 9,159 8,657 80,049 85,786 22,427 8,521 14
15 $10,000 under $15,000 ................... 1,051 3,123 206,131 286,641 51,267 28,834 9,838 12,333 10,066 9,248 21,500 26,078 170,302 255,106 42,578 24,365 1516 $15,ocx:> under $20,ocx:> ................... 286 1,327 95,734- 188,019 25,373 15,449 3,767 4,465 4,499 4,707 9,433 14,129 68,151 148,316 15,040 10,613 1617 $20,000 under $30,ocx:> ................... 267 423 95,123 253,192 26,045 16,792 3,507 8,050 3,779 4,932 7,760 10,642 60,795 201,858 14,666 15,323 1718 $30,ocx:> under $50,<x>o ................... 196 689 68,259 282,370 18,963 12,894 1,793 4,072 2,789 3,871 6,322 15,413 39,399 187,416 9,306 17,391 1819 $50,ocx:> under $l00,ocx:> .................. 47 1,044 37,195 336,486 8,584 6,437 641 3,027 1,414 3,240 3,603 8,698 18,643 132,195 4,455 12,270 19
20 $100,000 under $150,000 ................. (2) (2) 7,076 163,971 1,243 933 115 921 340 1,306 796 2,932 3,339 43,802 1,015 4,488 2021 $150,000 under $200,000 ................. 3 87 2,065 87,129 307 257 34 42 80 333 289 1,286 885 13,652 317 2,468 2122 $200,000 under $500,000 ................. 2 5 2,183 205,720 279 226 57 214 96 581 306 1,668 919 18,149 378 4,245 2223 $500,000 under $1,000,000 ............... 1 1 279 86,048 29 24 10 44 8 70 50 391 128 3,919 57 823 2324 $1,()(X),000 or more·······.···.·.·· .... ·· 2 51 104 113,851 4 4 6 12 2 (7) 14 159 48 7,434 14. 86 24
25 Total taxable returns ............. 12,455 29,34-1 1,441,066 2,616,793 393,830 224,716 68,321 65,524 119,558 80,288 227,077 276,056 2,117,599 2,023,729 776,118 275,937 25
Nontaxable returns:26 No ad justed gross income ................ 8,471 82,079 46,603 101,166 15,881 11,138 3,030 2,869 11,339 52,510 2,~75 6,777 34,651 30,345 16,350 20,985 26
27 tinder $600 .....•.•...................... (2) (2) 23,334- 16,294 11,049 3,608 2,513 493 4,115 11,261 6,008 3,022 41,182 15,177 6,619 8,136 2728 $600 undor $1,000 ....................... (2) (2) 35,313 18,242 9,461 5,466 3,040 1,011 4,036 4,149 18,511 10,415 76,033 34,666 8,662 3,188 2829 $l,<X>O under $1,500 ..................... 3,030 10,100 57,666 34-,110 13,133 8,765 5,991 2,669 7,048 3,420 39,027 35,814 123,332 78,066 12,675 3,640 2930 $1,500 under $2,(X)() ..................... (2) (2) 50,809 31,279 18,062 9,261 6,585 2,840 5,663 4,400 42,795 44,913 129,308 86,043 12,662 5,301 3031 $2,<X>O under $2,500 ..................... - - 45,548 28,780 8,507 3,477 6,084 4,093 5,057 2,195 34,607 44,753 93,705 74,175 13,186 4,548 31
32 $2,500 under $3,000 ..................... (2) (2) 36,403 21,442 8,097 4,757 4,991 5,418 5,546 3,070 20,109 29,391 66,966 55,145 18,184 11,685 3233 $3,000 under $3,500 ..................... - - 18,747 22,795 5,573 3,471 (~1034 2,085 4,023 2,908 8,108 10,732 36,695 31,460 9,584 2,499 3334 $3,500 under $4,ocx:> ..................... (2) (2) 12,087 12,250 4,495 2,485 (2) (2) (2) 3,568 5,046 20,070 10,474 9,080 3,688 3435 $4,()(X) un'1er $4,500 ..................... - - 5,032 3,054 2,551 1,410 (2) (2) - - (2) (2) 17,662 16,155 3,568 550 3536 $4,500 under $5,ocx:> ..................... - - (2) (2) (2) (2) (2) (2) (2) (2) (2) (2) 7,553 7,699 (2) (2) 36
37 $5,000 under $6,ocx:> ..................... - - 8,019 4,986 (2) (2) - - (2) (2) (2) (2) 8,540 7,526 2,518 1,049 3738 $6,000 under $8,000 ..................... - - 3,529 5,438 - - (2) (2) (2) (2) - - 4,036 5,394 (2) (2) 3839 $8,ocx:> under $10,ocx:> .................... - - (2) (2) - - - - - - - - (2) (2) - - 3940 $10,ocx:> or more .... ········.·· ... · .... ·. - - 535 5,542 775 732 33 13 35 96 75 84 533 5,833 160 496 40
41 Total nontaxable returns .......... 16,537 108,076 345,659 306,875 99,107 54,761 39,774 25,279 50,885 86,241 178,931 195,793 660,766 459,333 115,282 67,588 41
42 Grand total······················· 28,992 137,417 1,786,725 2,923,668 492,937 279,477 108,095 90,803 170,443 166,529 406,008 471,849 2,778,365 2,483,062 891,400 343,525 42
43 Returns under $5,000 ...................... 23,083 120,015 716,695 509,301 203,059 116,045 63,445 38,716 99,007 116,596 264,963 283,390 1,487,430 848,478 435,911 151,939 4344 Returns $5,()(X) or more··············.····· 5,909 17,402 1,070,030 , 2,414,367 289,878 163,432 44,650 52,087 71,346 49,933 141,045 188,459 1,290,935 1,634,584 455,489 191,586 44
See footnotes at end of table. See text for individual returns for "Explanation of Classifications and Tenns" and for "Description of Sample and Limitations of Data.!l
-- -~--~~---------------
....Z
~....~t""....z8is:tz:j
~~
~~ZUJ
6~....~
~....

Table {.-SOURCES OF INCOME AND· LOSS, ·.EXEMPTIONS, AND TAX ITEMS-ALL RETURNS, JOINT RETURNS, AND OTHER RETURNS, lIY ADJ!JSiLlHlROS5 INCOME CLASSES-Goulieued
PART II. -JOINT RETURNS-Continued
Estates and trusts Taxable income Tax credits for-
Income Loss Other Adjusted Number of Income tax Dividends received Retirement incomesources gross Exemptions eturns wit before
Adjusted gross income classes income Number of Amount no taxable creditsNumber of Amount Number of Amount returns income Number of Amount Number of Amountreturns returns returns returns(Thousand (Thoustmd (Thounnd (Thou:umd (ThoU3lfnd (Thousand (Thou.l!I1td ('Thoustmd ('Thousand
dollars) do11l1rs) dolhn) doHlIn) dollan) dolltJrs) dollars) do/Jau) dollan)
(32) (33) (34) (35) (36) (37) (38) (39) (40) (41) (42) (43) (44) (45) (46)
Taxable returns:$600 under $1,000............................... - - - - - - - - - - - - - - - 1$l,QCX) under $1,500............................. - - - - 1,256 192,774 164,288 136,907 9,348 - 1,847 ( ') ( ') - - 2$1,500 under $2,000............................. (' ) (' ) - - 5,733 752,382 514,995 429,159 149,017 - 30,194 7,570 106 - - 3$2,000 under $2,500............................. 2,527 2,254 - - 8,505 2,102,024 1,414,809 933,923 429,922 - 86,208 12,768 74 (' ) (' ) 4
5 $2,500 under $3,(XX) ............................. 3,085 5,967 - - 11,519 4,054,792 2,512,129 1,463,928 1,028,154 - 205,685 22,OGG 130 (' ) ( ') 5$3,OCO under $3,500 .......................... 4,057 5,112 ( ') ( ') 11,050 6,575,130 3,744,525 2,013,805 1,957,864 - 391,732 32,155 267 8,609 932 6$3,500 under $4,(XX) ............................. 4,523 2,055 - - 23,568 9,837,296 5,195,432 2,619,817 3,299,872 - 659,761 41,740 378 10,667 974 7
8 $4,000 under $4,500 ............................ 5,091 2,573 (' ) ( ') 22,204 12,527,228 6,177,854 2,945,716 4,620,203 - 924,342 48,147 497 14,699 1,862 89 $4,500 under $5,000............................. 6,207 7,153 (' ) ( ') 24,580 13,723,435 6,232,492 2,890,378 5,569,795 - 1, 113,9J9 56,799 627 12,633 1,340 9
lC $5,000 under $6,(XX) ............................. 17,017 7,007 (' ) (' ) 32,663 24,558,938 9,680,553 4,491,165 11,445,966 - 2,288,555 124,262 1,348 16,673 2,783 1011 $6,000 under $7,000 ............................. 14,059 5,769 (' ) (' ) 25,379 19,800,631 6,507,559 3,063,436 10,581,208 - 2,125,267 139,603 1,819 13,148 2,504 1112 $7,000 under $8,000 ............................. 11,603 3,857 (' ) (' ) 20,948 13,908,756 3,884,889 1,865,911 8,172,734 - 1,657,116 143,951 2,296 11,080 1,799 1213 $8,000 under $9,000............................. 12,613 8,485 - - 17,607 9,409,115 2,288,708 1,112,694 5,856,373 - 1,200,609 114,948 1,923 7,108 1,602 1314 $9,000 under $10,000 ............................ 12,098 13,263 (' ) (' ) 8,931 6,412,890 1,392,000 678,854 4,180,665 - 867,373 99,509 1,969 6,023 1,198 14
15 $10,000 under $15,000 ........................... 28,529 41,841 783 446 33,535 13,120,684 2,344,116 1,109,457 9,104,208 - 1,950,119 '299,478 8,293 15,162 3,237 1516 $15,000 under $20,000 ........................... 14,485 29,950 492 205 23,584 5,675,901 729,076 331,080 4,287,170 - 1,001,783 145,308 6,524 6,825 1,330 1617 $20,CXXl under $30,000 ... , ....................... 17,031 46,758 505 226 19,978 6,216,075 577,446 258,228 4,943,679 - 1,303,776 138,321 9,455 5,978 1,311 1718 $30,000 under $50,000 ........................... 12,714 46,257 525 376 19,520 5,437,1?6 324,692 144,975 4,522,363 - 1,475,157 97,097 11,794 4,840 937 1819 $50,000 under $100,000 .............. : ........... 9,242 66,311 349 842 16,056 4,106,829 137,865 62,217 3,492,352 - 1,491,432 49,312 13,651 2,493 500 19
20 $100,000 under $150,000 ........................,.. 1,969 16,497 119 255 7,579 1,200,886 21,701 10,041 1,016,213 - 528,651 8,806 5,680 550 106 2021 $150,000 under $200,000 ......................... 643 6,300 31 188 1,700 460,661 5,808 2,693 383,378 - 216,407 2,435 2,613 218 43 2122 $200,000 under $500,000 ......................... 727 13,379 51 218 2,467 747,521 5,796 2,656 605,536 - 369,459 2,432 4,651 200 41 2223 $500,000 under $1,000,000 ....................... 105 3,186 6 13 239 216,779 674 322 173,456 - 112,813 291 1,488 34 8 2324 $1,000,000 or more··························· ... 34 2,388 2 3 164 196,968 241 110 169,840 - 104,067 99 1,003 14 4 24
25 Total taxable returns····················· 178,859 336,456 7,380 3,228 338,765 161,234,821 53,857,648 26,567,472 85,999,316 - 20,106,292 1,587,637 76,588 140,988 22,756 25
Nontaxable returns:26 No adjusted gross income ........................ (' ) (2 ) - - 8,505 3802,982 610,354 - - 309 ,432 - - - - - 26
27 Under $600 ...................................... ( ') ( ') - - 5,855 198,635 1,055,018 - - 558,410 - - - - - 2728 $600 under $1,000 ............................... ( ') ( ') - - 8,139 673,678 1,592,153 - - 830,262 - - - - - 2829 $1,000 under $1,500 ............................. 2,489 1,729 - - 12,942 1,643,324 2,620,840 (' ) ( ') 1,322,046 (' ) (' ) (' ) (' ) (2 ) 2930 $1,500 under $2,000 ............................. 6,997 7,066 - - 20,596 2,380,266 3,039,743 3,017 1,077 1,348,811 674 (' ) (' ) 3,017 657 3031 $2,000 under $2,500 ............................. 3,511 2,190 - - 11,563 2,414,915 2,825,948 12,142 4,139 1,056,569 1,404 (' ) (' ) 12,142 1,398 31
32 $2,500 under $3,000 ............................. 2,506 2,175 - - 13,938 2,539,924 2,715,859 11,590 5,301 924,611 1,071 3,034 31 11,090 1,040 3233 $3,(XX) under $3,500 ............................. ( ') ( ') - - 7,680 2,235,907 2,246,162 13,203 6,778 680,512 1,Jl6 5,602 122 11,686 1,194 3334 $3,500 under $4,(XX) ............................. (' ) (' ) ( ') (' ) 8,921 1,764,297 1,725,700 6,115 4,864 464,082 974 4,581 39 6,115 935 3435 $4,(XX) under $4,500 ............................. ( ') (' ) - - 2,263 982,829 927,406 4,554 4,800 227,072 959 flr8 199 4,054 760 3536 $4,500 under $5,(XX) ............................. (') ( ') ( ') (' ) 1,683 554,153 493,629 4,rY.7 3,857 113,967 773 (' ) 3,547 754 36
37 $5,OCO under $6,000· .... ············.·····.· .. .. (' ) ( ') - - 2,615 430,263 366,274 2,551 3,708 77,263 626 (' ) (' ) 2,551 582 3738 $6,OCO under $8,000 ............................. (' ) (2 ) - - 997 183,295 119,970 ( ') ( ') 26,668 ( ') - - - - 3839 $8,000 under $10,000 .. · .. ··•· ................... - - - - - ( ,) ( ,) - - (' ) - - - - - 3940 $10,000 or more . ................................ 184 416 - - 26 35,533 6,423 363 4,109 1,734 1,170 238 17 279 756 40
41 Total nontaxable returns .................. 30,244 33,797 ( ') (' ) 105,723 '15,242,995 20,347,879 58,571 39,351 7,942,439 9,302 24,111 662 55,487 8,093 41
42 Grand total ............................... 209,103 370,253 8,380 3,469 444,488 4176,477,816 74,205,527 26,626,043 86,038,667 7,942,439 ~O, 115, 594 1,611,748 77,250 196,475 30,849 42
43 Returns under $5,000 ....................... ....... 53,027 53,393 3,017 492 210,500 '64,350,007 45,809,336 13,488,790 17,095,015 7,835,774 3 1 421,075 243,624 2,682 103,299 12,108 4344 Returns $5,000 or more ............................ 156,076 316,860 5,363 2,977 233,988 112,127,809 28,396,191 13,137,253 68,943,652 106,665 16,694,519 J 368, 124 74,568 93,176 18,741 44
See footnotes at end of table. See text for individual returns for lIExplanation of Classifications and Terms" and for "Description of Sample and Limitations of Data. 11
t
-z3~t"'-Z~~
~~en
~~
.....~

....~...o~
oo~
~
o..
Table 4.-S0URCES OF INCOME AND LOSS, EXEMPTIONS, AND TAX ITEMS-ALL RETURNS, JOINT' RETURNS, AND OTHER RETURNS, BY ADJUSTED GROSS INCOME CLASSES-Co.u.uod
PARI' II. -JOINT RETURNS-Continued
Tax credits for- Tax withheld Payments on 1954 Tax due at time Overpaymentdeclaration of filingIncome tax
Foreign tax paid Tax paid at source Partially tax- liability Refund Credit on 1955 taxAd justed gross income classes
exempt interest aftercredits Number of Amount Number of Amount Number of Amount
[Number of AmoWlt Number of AmoWlt Number of Amount returns' returns 6 returns Number of Amount Number of Amountreturns (ThoustlJ1d returns (Thousand returns (Thousand (1'1w)us811d (Thousmd (Thouscllnd (Thoucll811d returns (ThouBtIJ1d returns (Thousand
dollars dollars) dollars) dollcllrl!l) rJollan) dollcllrs) dolhrs) dolhrs) dollars)
(47) (48) (49) (50) (51) (52) (53) ( 54) (55) (56) (57) (58) (59) (60) (61) (62) (63)
Taxable returns:1 $600 under $1,000········· .. ·· .... · - - - - - - - - - - - - - - - - - 12 $1,000 under $1,500................ - - - - - - 1,845 91,658 9,089 4,108 310 48,311 1,242 87,090 7,890 (' ) (' ) 23 $1,500 under $2,0cx) ....... ·.······ - - - - - - 30,088 308,739 43,588 34,907 6,396 149,.024 9,585 256,783 23,314 12,321 2,329 34 $2,000 under $2,500................ - - - - - - 86,On 728,156 122,552 70,480 14,885 290,085 21,123 603,658 61,045 29,853 5,058 4
5 $2,500 under $3,(XX) ................ - - - - - - 205,352 1,218,240 262,660 115,118 24,560 420,080 35,865 984,506 100,931 34 ,825 4,184 56 $3,(XX) under $3,500.............. ·. - - - - - - 390,533 1,752,578 456,051 137,361 33,036 600,194 52,698 1,342,650 125,690 44,373 6,008 67 $3,500 under $4,(XX) ................ - - - - - - 658,409 2,371,604 742,182 178,018 47,321 763,569 65,282 1,755,554 166,345 59,717 9,275 78 $4,0CX) under $4,500....... ......... (' ) ( ') - - (' ) (' ) 921,797 2,704,523 1,019,()()!,. 198,013 59,244 829,861 73,578 2,007,420 202,959 66,760 10,558 89 $4,500 under $5 I CXX) • ............... - - (' ) ( ') - - 1,111,971 2,704,587 1,199,237 185,824 59,081 858,280 77,437 1,937,736 197,289 58,893 10,108 9
10 $5,(XX) under $6,CXX) .. ... " ......... (' ) (' ) - - - - 2,284,220 4,213,339 2,377,709 336,391 129,431 1,324,943 142,756 3,008,459 319,331 116,185 19,257 1011 $6,(XX) under $7,(XX) ................ 2,531 397 - - ( ') (' ) 2,120,545 2,873,778 2,119,455 285,779 126,609 1,078,852 127,214 1,866,462 214,091 96,951 17,764 1112 $7,(XX) under $B,OCX) ................ (' ) ( ') (' ) (' ) (' ) (' ) 1,652,977 1,723,451 1,564,750 247,064 132,145 786,191 107 ,431 1,010,334 123,169 67,607 13,147 1213 $8,000 under $9,000.········· .. · ... (' ) (' ) - - ( ') (' ) 1,197,047 989 ,685 1,067,148 199,358 121,228 530,817 101,724 530,783 69,587 48,759 12,937 1314 $9,(XX) under $10,0cx)··············· (' ) ( ') - - - - 864,177 592,156 731,393 172,056 1..21,147 340,523 74,956 288,227 41,603 50,224 13,682 14
15 $10,(XX) under $15,0CX)...... ···:···. 5,390 1,012 - - 575 11 1,937,566 845,631 1,156,607 487,946 653,lBg 673,033 284,596 302,286 72,534 139,748 63,456 1516 $15,(XX) under $20,OCX) ...... ·.·.· 4,333 549 1,118 (7) 337 3 993,377 209,754 443,440 228,452 433,263 218,201 185,702 51,270 43,307 63,145 17,435 16
17 $20,0CX) under $30,0cx) .............. 5,508 1,215 - - 502 4 1,291,791 152,473 453,578 212,418 685,421 174,760 238,224 25,880 23,996 59,753 53,373 17
18 $30,000 under $50, OCX).........,.. ... ....... 5,854 1,746 1,744 1 929 13 1,460,666 85,605 541,007 130,325 883,666 99,951 259,491 8,848 15,168 36,808 204,567 18
19 $50,OCX) under $loo,OCX)............ · 5,912 3,608 1,471 10 589 11 1,473,652 39,405 292,826 59,343 987,036 43,972 249,439 2,518 8,496 15,907 51,968 19
20 $100,000 under $150,000............ 1,780 1,132 472 2 168 5 521,726 6,415 70,399 9,807 387,436 7,206 81,405 273 1,866 2,580 15,332 2021 $150,000 under $200,000............ 636 831 121 (') 61 4 212,916 1,727 20,999 2,660 164,680 1,925 33,480 94 875 676 5,155 21
22 $200,000 under $500,000............ 766 1,454 137 (7) 63 10 363,303 1,725 26,625 2,628 297,824 1,860 54,841 81 904 727 14,681 2223 $500,000 Wlder $1,0CX),0CX).......... 111 433 17 (' ) 13 1 110,883 186 2,703 316 96,322 230 14,509 18 754 78 1,891 2324 $1,000,000 or more················· 33 171 - - 3 1 102,888 75 799 110 86,022 77 17,344 7 305 28 971 24
25 Total taxable returns.··.···· 38,928 13,031 6,120 14 5,229 82 19,993,821 23,615,490 14,723,801 3,298,482 5,550,252 9,241,945 2,309,922 16,070,937 1,821,4L9 1,006,435 553,205 25
Nontaxable returns:26 No adjusted gross income........... - - - - - - - 55,602 16,719 44,147 19,940 6,971 254 69,780 27,638 25,263 8,595 26
27 Under $€OO......................... - - - - - - - 239,662 9,461 16,943 4,779 33,045 571 245,794 11,802 8,720 2,142 2728 $600 under $1,000.................. - - - - - - - 355,089 18,728 21,675 7,002 91,502 2,224 355,131 20,368 16,514 4,778 2829 $1,0CX) under $1,500................ - - - - - - - 597,819 49,069 40,149 8,419 145,769 4,926 599,384 51,268 26,166 4,949 2930 $1,500 under $2,0cx) ................ - - - - - - - 690,633 60,905 . 47,333 11,747 143,127 6,161 687,458 63,870 28,879 6,818 3031 $2,OCX) under $2,500.......... ...... - - - - - - - 568,232 50,750 48,013 8,261 95,767 5,151 573,733 53,451 23,215 3,304 31
32 $2,500 under $3,000................ - - - - - - - 559,510 54,160 35,458 7,522 89,086 5,750 548,146 55,605 20,964 3,759 3233 $3,0CX) under $3,500................ - - - - - - - 473,467 43,990 27,355 6,539 56,925 3,877 466,636 45,722 12,419 3,028 3334 $3,500 under $4,000................ - - - - - - - 342,640 34,731 17,500 3,525 29,422 2,522 342,667 35,859 9,718 1,436 3435 $4,0CX) under $4.,500............... - - - - - - - 164,899 20,998 8,800 1,729 18,533 1,333 161,859 21,292 4,143 660 3536 $4,500 under $5,000................ (' ) (' ) - - - - - 90,238 11,969 5,116 1,155 4,636 409 92,778 12,806 (' ) ( ') 36
37 $5,000 under $6,0cx)................ - - - - - - - 62,075 11,325 5,644 2,203 5,174 419 63,116 11,551 3,585 (~1698 3738 $6,0CX) under $8,OCX)................ (' ) (' ) - - - - - 17,096 4,911 4,085 4,887 (' ) (' ) 18,079 8,617 ( ') 3839 $8,000 under $10,0cx)..... · ... ··.··· - - - - - - - ( ') (' ) - - - - (' ) (' ) - - 3940 $10,0CX) or more···················· 151 397 - - - - - 783 1,362 1,230 2,696 115 13 1,172 2,638 501 1,193 40
41 Total nontaxable returns..... 1,151 547 - - - - - 4,218,745 389,618 323,448 90,404 720,589 33,648 4,226,733 423,027 183,213 43,407 41
42 Grand total.................. 40,079 13,578 6,120 14 5,229 82 19,993,821 27,834,235 15,113,419 3,621,930 5,640,656 9,962,534 2,343,570 20,297,670 2,244,476 1,189,648 596,612 42
43 Returns under $5,000................. (' ) ( ') ( ') ( ') ( ') ( ') 3,406,087 16,017,876 4,225,843 1,236,318 325,451 4,674,187 369,988 13,118,763 1,285,144 484,318 87,149 4344 Returns $5,000 or more ........... .... 38,062 13,387 5,603 13 4,729 76 16,587,734 11,816,359 10,887,576 2,385,612 5,315,205 5,288,347 1,973,582 7,178,907 959,332 705,330 500 ,463 44
See footnotes at end of table. See text for individual returns for "Explanation of Classifications and Terms" and for "Description of Sample and Limitations of Data. ll
....Z~<:....g>t'"'....Z
~t."j
~><
~~Ul
6::tl......
~
~

Table t.-SOURCES OF INCOME AND LOSS, EXEMPTIONS, AND TAX ITEMS-ALL RETURNS, JOINT RETURNS, AND OTHER RETURNS, BY ADJUSTED GROSS INCOME CLASSES-Conlin.ed
PARr III. -orHER THAN JOnI]' RErURNS
Salaries and wages DividendsInterest received Business or profession Partnership
(after exclusions) (after exclusions)
Net profit Net loss Net profit Net lOBS
Ad justed groBs income classes Number ofAmoWlt AmOWltreturns Number of N\IJDber of Number of _unt
returns returns1 returns 1 Number of AmO\U1t Number of Amount Number of Amount Number of Amount
(1houund (Thouund (1houund returnS (Thousand returns (Thounnd returns (Thouund returns (Thouunddollsn) dollara) dollars) doHlIn) dol/flU) dollan) dollartl)
(1) (2) (3) (4) (5) (6) (7) (S) (9) (10) (ll) (12) (13) (14) (15)
Taxable returns:1 $600 under $1,000 .........•.............. 1,292,988 1,204,830 995,550 22,123 7,925 45,676 8,819 69,868 46,068 8,078 8,085 13,750 9,645 (2 ) (2 ) 1
2 $1,(X)() under $1,500 ...................... 2,289,763 2,155,465 2,656,701 40,267 16,730 84,471 20,486 97,672 102,196 11,914 8,694 21,643 23,155 2,568 2,343 23 $1,500 W1der $2,000 ...................... 2,002,073 1,861,534 3,18'9,291 63,215 35,956 117,7Cl9 30,951 90,326 122,172 13,693 8,656 22,535 34,641 4,023 2,140 34 $2,000 under $2,500 ...................... 2,144,636 2,016,864 4,466,259 70,112 44,720 137,351 36,374 84,756 155,164 15,656 8,757 22,488 34,789 3,012 2,228 4
5 $2,500 under $3,000 ...................... 1,988,101 1,898,.248 5,.119,.424 85,765 46,044 135,320 35,296 58,957 119,763 10,061 4,211 19,924 42,357 2,517 803 5
6 $3,000 under $3,500 ...................... 1,853,625 1,764,684 5,642,942 91,992 56,659 149,383 36,513 49,195 121,650 8,152 4,262 25,522 61,772 3,006 509 6
7 $3,500 under $4,000 ...................... 1,437,290 1,376,391 5,067,688 80,115 57,424 149,397 38,356 37,664 98,158 7,623 8,366 18,428 45,522 (2 ) (2 ) 7
8 $4,000 under $4,500 ..................... · 1,013,8'93 975,871 4,037,964 86,206 73,968 125,512 35,980 21,858 47,464 8,086 3,304 9,285 25,525 2,568 5,909 8
9 $4,500 W1der $5,000 ...................... 695,267 653,633 3,011,566 73,164 81,480 99,125 28,077 21,966 66,046 4,054 1,634 13,262 40,239 (2 ) ( 2) 9
10 $5,000 under $6,000.....•.•.......•...•.. 617,203 555,477 2,861,517 111,733 102,470 155,089 48,079 35,348 138,133 5,573 7,629 16,986 67,620 (2 ) (2 ) 10
11 $6,000 under $7,000 •..................... 268,015 231,821 1,384,790 76,821 83,675 84,630 37,583 19,441 B9,535 2,557 4,461 9,271 41,028 (2 ) (2 ) II
12 $7,000 under $8,000................•.•... 142,142 107,634 710,881 50,928 103,360 52,396 23,254 13,693 79,883 2,006 2,272 8,724 46,844 (2 ) ( 2) 12
13 $8,000 W1der $9,000...................... : 74,027 55,120 376,660 33,534 70,593 33,535 22,555 6,717 44,630 2,549 5,807 6,770 33,211 (2 ) ( 2) 13
14 $9,000 under $10,000 ..................... 41,792 28,883 230,711 24,539 41,440 18,376 9,439 6,742 26,215 517 2,368 6,247 32,971 - - 14
15 $10,000 under $15,000 .................... 106,025 54,318 449,655 67,862 275,975 64,724 66,737 18,148 143,990 3,038 9,717 16,318 132,668 1,868 2,106 15
16 $15,000 under $20,000.................... 37,412 16,444 175,107 27,272 169,974 24,333 29,970 6,681 76,059 1,202 4,371 6,141 70,783 666 1,444 16
17 $20,000 under $30,000 .................... 33,440 14,656 200,000 27,384 269,035 24,349 38,097 4,436 68,988 1,127 4,249 6,696 88,596 SlO 1,430 17
18 $30,000 under $50,000 .................... 16,922 7,149 120,542 14,708 236,346 12,905 29,547 2,510 55,661 739 5,515 3,393 71,240 859 1,357 18
19 $50,000 under $100,000................... 8,115 3,119 81,837 7,421 258,577 6,535 21,891 826 24 , 981 595 9,0'14 1,447 47,721 297 1,196 19
20 $100,000 under $150,000.................. 1,576 579 19,903 1,495 102,137 1,289 6,767 138 5,756 111 2,307 243 12,535 93 S77 20
21 $150,000 under $200,000 .........•....••.. 499 186 8,908 478 48,655 427 2,658 36 2,3~6 60 2,075 67 3,751 49 937 21
22 $200,000 under $500,000.....•............ 578 224 11,338 561 97,335 492 4,084 42 2,512 94 3,339 82 8,349 62 1,324 22
23 $500,000 under $1,000,000 .••............. ll5 45 1,382 ll2 40,348 98 1,686 8 882 28 2,020 22 5,757 16 509 23
24 $1,000,000 or more .............-.......... 91 37 1,695 90 137,367 84 3,400 10 ],.,611 23 2,395 9 5,633 22 1,877 24
25 Total taxable returns .............. 16,065,588 14,983,212 40,822,320 1,057,897 2,458,193 1,523,206 616,608 647,038 1,639,873 107,536 123,568 249,253 986,352 32,150 32,614 25
Nontaxable returns:26 No adjusted gross income ................. 130,872 20,337 20,888 10,740 4,408 16,723 4,624 4,143 2,907 93,522 207,614 2,585 17,623 17,259 48,111 26
27 Under $600 ............................... 3,381,407 3,109,003 995,436 30,656 6,510 73,717 12,600 171,872 62,.941 23,442 14,738 25,061 8,264 4,102 1,754 27
28 $600 under $1,000 ........................ 1,057,291 797,227 562,515 63,334 20,484 117,734 30,122 126,029 84,369 9,078 4,602 lS,em 13,146 ( 2) (2 ) 28
29 $1,. 000 \U1der $1, 500 ...................... 771,390 541,323 628,897 61,081 29.,627 115,264- 36,416 101,410 104,945 6,021 3,026 9,624 10,717 ( 2) ( 2) 29
30 $1,500 \U1der $2,000...................... 423,618 314,831 526,936 45, S10 29,731 61,176 22,553 35,996 50,994 3,539 1,506 6,580 7,154 - - 3031 $2,000 under $2,500 ...................•.. 164,403 119,608 253,166 20,634 16,937 28,687 15,152 9,609 17,787 (2 ) (2 ) ( 2) (2 ) - - 31
32 $2,500 \U1der $3,000 ...................... 96,549 75,879 195,542 12,142 12,822 14,069 3,828(~I532
12,075 (2 ) (2 ) (2 ) ( 2) ( 2) (2 ) 3233 $3,000 under $3,500 .............•...•.••. 46,830 34,630 106,304 9,084 14,436 8,608 6,195 (2 ) (2 ) ( 2) ( 2) (2 ) - - 3334 $3,500 under $4,000 ...................... 21,095 14,587 51,766 3,023 5,851 2,506 3,775 3,002 9,373 (2 ) ( 2) (2 ) (2 ) - - 3435 $4,000 under $4,500...................... 11,519 11,019 42,737 ( 2) ( 2) (2 ) ( 2) - - - - (2 ) ( 2) - - 3536 $4,500 under $5,000...................... 4,547 3,041 8,821 (2 ) (2 ) 2,534 1,185 (2 ) (2 ) - - ( 2) (2 ) - - 36
37 $5,000 \U1der $6,000...................... (2 ) - - ( 2) ( 2) ( 2) ( 2) - - - - - - - - 37
38 $6,000 \U1der $8,000 ...................... (2 ) \' ) (2 ) - - - - (2 ) (2 ) - - (2 ) (2 ) - - 38
39 $8,000 under $10,000..................... (2 ) (2 ) (2 ) ( 2) (2 ) (2 ) (2 ) - - - - - - - - 3940 $10,000 or more .......................... 370 135 1,293 237 4,875 136 867 33 686 42 2,006 7 189 13 1,147 40
41 Total nontaxable returns ........... 6,112,938 5,043,160 3,402,675 260,815 153,772 443,195 137,970 460,127 357,333 139,696 237,187 66,998 69,142 23,908 52,657 41
42 Grand total ........................ 22,178,526 20,026,372 44,224,995 1,318,712 2,611,965 1,966,401 754,578 1,107,165 1,997,206 247,232 360,755 316,251 1,055,494 56,058 85,271 42
43 Returns W1der $5,000 ....................... 20,827,157 18,949,005 37,580,393 872,497 566,937 1,485,962 407,435 991,867 1,231,805 226,971 291,150 233,311 386,526 46,112 67,473 43
44 Returns $5,·000 or mare ..................... 1,351,369 1,r:J77,367 6,644,602 446,215 2,045,028 480,439 347,143 115,298 765,401 20,261 69,605 82,940 668,968 9,946 17,798 44
See footnotes at end of table. See text for individual returns for "Explanation of Classifications and Terms" end for rtDescription of Sample and Limitations of Data."
t
Zt:::l
~g~.....
~t,:o:j
~
~~g.....~

Tabl. 4.-50URCES OF INCOME AND LOSS, EXEMPTIONS, AND TAX ITEMS-ALL RETURNS, JOINT RETURNS, AND OTHER RETURNS, BY ADJUSTED GROSS INCOME CLASSES-Conlinned
PART III. -arHER THAN JOIm: REl'URNS-Continued
Net operating Sales of capital assets Sales of property other than capital assets Annuities and pensions Rents and royaltiesloss deduction
Net gain Net loss Net gain Net loss Net income Net lossAdjusted grOBS income classes Number of Amount Number of Amount
returns Number ofAmount
Number of Amount Number of Amount Number of Amount returns Number ofAmount
Number ofAmount
(Thou.ll!Tld returns (71loulland returns (Thousand returns (Thousand returns (Thoustmd (Thousand returns (Thousand returns (ThOQlllmd
dollars) dollllrtJ) dollars) dollarll) dol/lUll) dollar;,) dollan) doIla'f')
(16) (17) (18) (19) (20) (21) (22) (23) (24) (25) (26) (27) (28) (29) (30) (31)
Taxable returns:1 $600 under $l,CXJO....................... ( 2) (2 ) 16,022 3,635 3,006 948 ( 2) (2) - - 2,989 1,978 27,800 10,049 3,500 503 . 12 $1,000 under $1,500..................... - - 25,087 8,869 9,111 6,264- (2 ) (2 ) (2 ) (2 ) 6,057 4,012 49,813 29,863 14 J 584 3,879 23 $1,500 under $2,(0) ..................... ( 2) (2 ) 34,086 12,455 10,165 5,558 (2 ) (2) (2 ) (2 ) 16,083 16,673 65,430 45,739 15,566 3,825 34 $2,000 under $2,500..................... - - 35,190 16,207 8,049 4,073 (2 ) (2 ) ( 2) ( 2) 18,124 17,612 69,976 48,796 19,579 5,113 4
5 $2,500 under $3,()(X)..................... - - 30,680 15,967 13,644- 5,246 ( 2) ( 2) ( 2) (2 ) 19,158 22,263 58,994 47,221 22,CI'l3 5,665 56 $3,()(X) under $3,500..................... - - 36,202 19,349 9,142 6,536 ( 2) (2 ) (2) (2 ) 22,28'7 19,717 62,269 49,279 20,562 6,621 67 $3,500 under $4,000.................. ... ( 2) (2) 34,223 19,823 9,017 4,857 ( 2) (2 ) 2,500 1,273 17,148 11,660 62,223 38,110 19,624 4,540 78 $4,()(X) under $4,500..................... - - 37,760 23,266 7,571 2,910 (' ) ( 2) 3,506 2,371 14,648 14,920 54,800 34,557 16,093 3,200 89 $4,500 under $5,000..................... - - 26,227 12,054 5,641 2,366 ( 2) ( 2) (2 ) (2 ) 10,567 8,679 41,850 35,490 15,017 3,044 9
10 $5,000 under $6,()(X)..................... (' ) (2 ) 54,037 55,571 13,233 6,261 2,534 2,104 (2 ) (2 ) 12,185 10,115 52,017 63,053 19,710 7,070 1011 $6,()(X) under $7,()(X) ..................... - - -:8,361 27,717 7,207 3,605 (2 ) (2) (2 ) (2 ) 8,043 4,442 27,849 45,606 5,547 2,830 1112 $7,()(X) under $8,()(X).. , .. - ............... (2 ) ( 2) 28,180 31,767 4,089 2,601 ( 2) ( 2) (2 ) (') 6,995 9,196 19,223 34,137 5,023 3,469 1213 $8,000 under $9,()(X)..................... - - 14,693 20,737 5,691 3,726 (2 ) (2) - - 4,057 3,367 15,781 41,844 2,989 1,583 1314 $9,000 under $10,000.................... - - 11,204 11,335 (2) (2 ) ( 2) (' ) - - 3,608 4,473 5,580 23,498 (2 ) (2 ) 14
15 $10,000 under $15,000................... 120 228 41,134 B4,149 10,581 7,358 927 998 1,348 2,257 8,401 11,749 25,801 74,857 5,547 3,673 1516 $15,000 under $20,000................... (2 ) (2 ) 15,792 47,347 4,856 3,426 339 467 530 340 2,738 3,557 10,495 41,502 1,723 1,495 1617 $20,000 under $30,()(X)................... (2 ) (2 ) 16,281 61,319 5,535 4,219 317 1,471 375 561 2,578 6,426 10,117 41,484 1,466 1,748 1718 $30,000 under $50,()(X)............. ...... (2 ) (2 ) 9,034 54,584 2,688 2,217 84 379 220 422 1,476 2,680 4,957 37,552 1,049 1,649 1819 $50,000 under $100,000.................. - - 5,020 62,280 1,453 1,180 54 338 104 188 991 3,417 2,607 31,404 544 2,100 19
20 $loo,()(X) under $150,()(X)................. - - 1,114 26,360 245 169 21 131 21 129 175 557 498 11,035 82 375 2021 $1.50,()(X) under $200,000................. - - 348 15,874 87 70 3 55 16 98 63 329 155 3,103 44 181 2122 $2oo,()(X) under $5oo,()(X)................. - - 409 37,637 96 77 6 30 12 58 64 532 180 5,449 65 913 2223 $5oo,()(X) under $1,()(X),()(X).. ............. - - 93 21,252 17 15 6 14 3 9 6 28 42 3,625 16 215 2324 $1,()(X),()(X) or more ...................... - - 60 53,146 28 26 5 20 8 108 9 134 32 4,143 15 173 24
25· Total taxable returns ............. 1,719 955 502,237 742,706 132,741 74,821 18,951 13,142 17,769 11,599 178,450 178,516 668,498 801,396 191,005 63,896 25
Nontaxable retw-ns:26 No adjusted gross income................ 2,575 4,057 14,768 16,684 8,717 5,683 (2 ) (2 ) 10,145 17,525 - - 15,338 8,030 14,059 6,817 26
27 Under $600.............................. (2 ) ( 2) 16,882 4,201 10,586 8,141 (') ( 2) 3,068 1,166 6,995 2,177 86,183 25,950 17,113 5,520 2728 $600 under $1,000.................... - - 25,557 8,533 7,991 3,772 ( 2) (2) 4,019 885 22,504 12,171 115,271 59,575 9,080 3,186 2829 $1,000 under $1,500.................. ... (2) ( 2) 28,070 12,647 4,506 2,914 2,989 2,026 (2 ) ( 2) 43,634 34,652 111,748 76,805 12,039 3,913 2930 $1,500 under $2,()(X) ..................... ( 2\ (2) 17,532 6,878 ( 2) (2) (2 ) (2 ) (2 ) (') 39,234 50,441 48,841 36,312 3,000 869 3031 $2,(X)() under $2,500.......... ..... _..... - - 5,051 3,27) ( 2) (') (2 ) ( 2) ( 2) (2 ) 17,158 28,690 21,606 24,802 3,023 562 31
32 $2,500 under $3,000..................... - - 5,551 2,638 2,517 1,403 - - - - 9,618 19,664 7,533 7,225 - - 3233 $3,000 under $3,500............. ........ - - 4,023 2,970 ( ,~ ( 2) - - - - 4,068 6,134 3,082 3,782 ( 2) (2 ) 3334 $3,500 under $4,()(X)... _................. - - ( 2) (2 ) (2 ) (2) - - - - (2) (2 ) 3,006 2,680 (') (2 ) 3435 $4,()(X) under $4,500..................... - - (2 ) (2 ) - - - - - - (2) ( 2) (2 ) (2) (2 ) ( ,) 3536 $4,500 lil'lder $5,O(XL .................... - - (2 ) (2 ) - - - - - - (2 ) ( 2) (2 ) ( 2) (') (' ) 36
37 $5,()(X) under $6,()(X) ..................... - - (2\ (2) - - - - - - (2 ) ( ') - - - - 3738 $6,()(X) under $8,()(X)............ ......... - - - - - - - - - - - - (2 ) (2 \ - - 3839 $8,000 under $10,()(X) .................... - - (') (2) - - - - - - - - - - - - 3940 $10,()(X) or more ................... ...... - - 176 4,031 45 41 - - 6 27 76 160 90 1,330 84 279 40
41 Total nontaxable returns .......... 4,070 6,593 122,185 65,488 38,406 25,148 8,016 3,866 19,244 20,930 145,821 155,704 416,755 251,834 61,432 22,121 41
42 Grand total ....................... 5,789 7,548 624,422 808,194 171,147 99,969 26,967 17,008 37,013 32,5-:8 324,271 334 ,220 1,085,253 1,053,230 252,437 86,017 42
43 Returns under $5,000 ...................... 5,111 7,087 396,445 191,285 113,707 63,865 18,113 8,853 32,295 27,185 272,289 272,438 909,312 588,585 207,966 58,232 4344 Returns $5,000 or more ........... ......... 678 461 227,977 616,9(9 57,440 36,104 8,854 8,155 4,718 5,344 51,982 61,782 175,941 464,645 44,471 27,785 44
......Z
~~t"'......z8is:t<j
~
~~rn
6~....~
See footnotes at end of table. See text for individual returns for lIExplanation of Classifications and Terms 11 and for "Oescription of Sample and Limitations of Oata. 1t
-- ---- ---------
"'"Q1
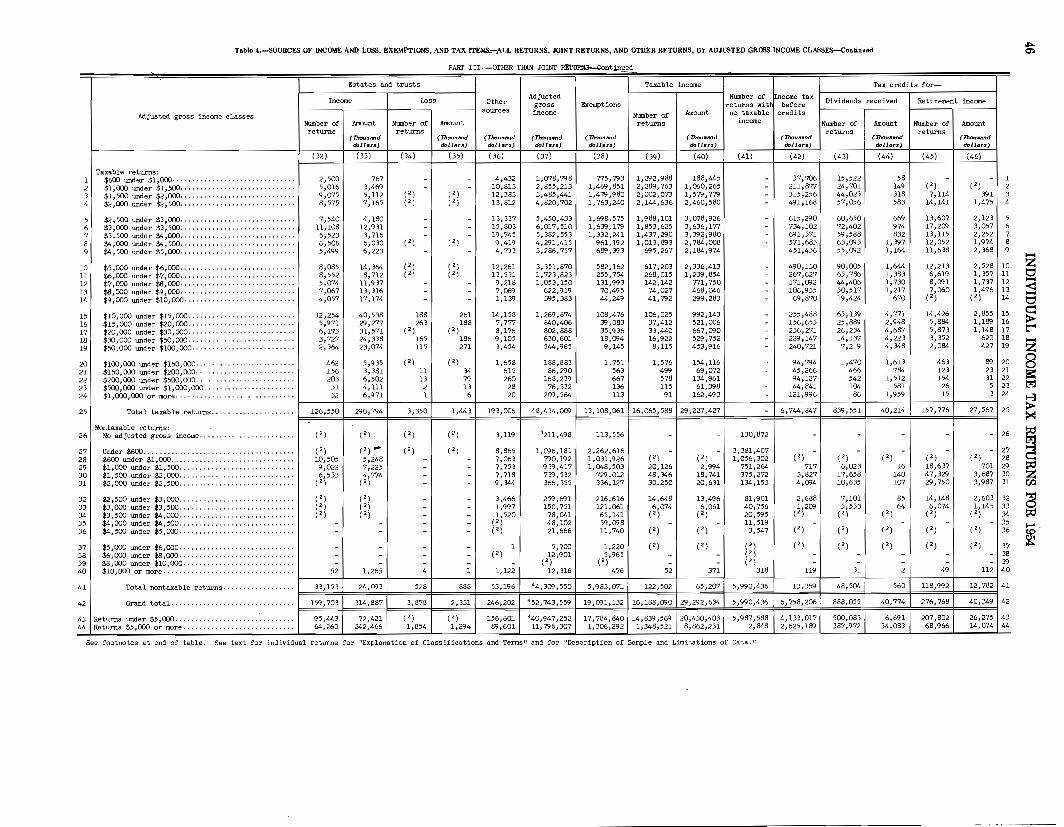
Tabl. 4.-S0URCES OF INCOME AND LOSS, EXEMPTIONS, AND TAX ITEMS...--:Al,L RETURNS, JOINT RETURNS, AND OTHER RETURNS, BY ADJUSTED GROSS INCOME CLASSES-Conlinued
PART III. OTHER THAN JOINT ued
Estates and trusts Taxable income Tax credits for-
Income Lo5s OtherAdjusted Number of ncome tax
Dividends received Retirement incomegross Exemptions returns wit before
Adjusted gross income classessources income Amount no taxable creditsNumber of
Nwnber of Amount Number of Amount returns income Number of Amount Number of AmountretW'Ils returns returns returns
(1houI«nd (11Ious tnd (lhou.und (TlcUlJlfld (Thous5td (1hous«nd (11IoulJl!I1'Id (1houund (11IoulJlJ1Jddollars) dolltln) dolll'lu) dollars) dclllfr:f) dollars) dollars) doJ1au) dollan)
(32) (33) (34) (35) (36) (37) (38) (39) (40) (41) (42) (43) (44) (45) (46)
Taxable returns:1 $600 under $1,000· .. · .. · ........................ 2,500 767 - - 4,432 1,078,798 775,793 1,292,988 188,445 - 37,706 15,522 58 - - 12 $1,000 under $1,500............................. 5,016 3,469 - - 10,813 2,855,213 1,469,851 2,289,763 1,060,265 - 211,877 24,701 149 ( 2) ( 2) 23 $1,500 under $2,000....... "..................... 9,075 5,112 ( 2) (2 ) 12,383 3,485,441 1,479,980 2,002,073 1,5'79,779 - 315,256 44,023 318 7,114 391 34 $2,000 under $2,500............................. 8,575 7,165 (2 ) (2 ) 13,812 4,820,702 1,763,2/+0 2,144,636 2,460,580 - 491,168 57,056 583 14,141 1,475 4
5 $2,500 under $3,000............................. 7,540 4,180 - - 13,337 5,450,433 1,698,575 1,988,101 3,078,926 - 615,290 60,650 669 13,607 2,123 56 $3,000 under $3,500.............................. 11,108 12,931 - - 15,803 6,017,510 1,639,179 1,853,625 3,636,171 - 734,102 72,402 974 17,200 3,057 67 $3,500 under $4,000............................. 6,523 3,716 - - 19,745 5,382,553 1,332,241 1,437,290 3,39~,980 - 691,371 59,588 832 13,115 2,252 78 $4,000 under $4,500...................... , ...... 6,506 6,030 ( 2) ( 2) 9,419 4,291,415 961,192 1,013,893 2,784,008 - 571,683 63,093 1,397 12,052 1,974 89 $4,500 under $5,000............................. 5,499 6,223 - - 4,793 3,286,757 689,393 695,267 2,184,974 - 451,436 55,002 1,164 11,638 2,368 9
10 $5,000 under $6,0Cl0 ................... , ......... 8,085 14,364 (2 ) ( 2) 12,261 3,351,870 582,162 617,203 2,336,413 - 490,130 90,005 1,644 12,21.3 2,528 10
11 $6,0Cl0 under $7 ,0Cl0 ............................. 8,552 8,712 (2 ) (') 13,531 1,723,823 255,754 268,015 1,239,854 - 267,627 63,786 1,383 6,619 1,357 11
12 $7,000 under $8,0Cl0 ........ ..................... 5,074 11,937 - - 9,218 1,053,150 131,993 142,142 Tll,750 - 171,OCn 44,406 1,730 8,a'll 1,737 12
13 $8,000 under $9,000.............. ··········.·.·· 7,067 13 ,316 - - 7,069 622,919 70,495 74,027 468,046 - 106,935 30,517 1,217 7,060 1,476 1314 $9,000 under $10,0Cl0 ............................ 4,057 17,174 - - 1,139 395,383 44,249 41,792 299,283 - 69,870 19,424 670 ( 2) (2 ) 14
15 $10,000 under $15,0Cl0 ................. .......... 12",254 40,538 188 261 14,158 1,269,874 108,476 106,025 992,143 - 255,488 63,139 4,771 14,426 2,855 15
16 $15,000 under $20,0Cl0 ........................... 5,971 29,277 263 188 7,777 640,406 39 ,083 37,412 521,006 - 156,653 25,889 2,948 5,884 1,189 16
17 $20,000 under $30,000........................... 6,173 31,571 ( 2) (2 ) 8,176 802,888 35,936 33,440 667,090 - 236,271 26,234 4,687 5,873 1,148 17
18 $30,000 under $50,0Cl0 ..... . , , .. , .............. ,. 3,727 24,338 165 186 9,105 630,601 18,004 16,922 529,752 - 229,147 14,137 4,223 3,352 620 18
19 $50,000 under $100,000................... 00 ••••• 2,364 23,074 115 271 3,454 544,965 9,145 8,115 453,916 - 240,721 7,219 4,348 2,084 427 19
20 $100,000 under $150,000......................... 462 5,935 ( 2) ( 2) 1,658 188,883 1,751 1,576 154,116 - 94,794 1,470 1,613 463 89 2021 $150,0Cl0 under $200,000 ......... , ............... 156 3,381 11 34 615 86,290 563 499 69,072 - 45,266 466 784 123 23 2122 $200,000 under $500,000 .... , ........ ,., ... , ..... 203 6,502 13 79 260 168,239 667 578 134,961 - 94,127 542 1,512 154 31 2223 $500,000 under $1,000,000............... , ... , ... 31 4,111 2 13 28 76,332 136 115 61,398 - 44,841 104 581 26 5 2324 $1,000,000 or more···., .. ,····,., ..... ·········· 32 6,971 1 6 20 200 ,564 113 91 162,493 - 121,996 86 1,959 15 3 24
25 Total taxable returns ........ ··· .. · ....... 126,550 290,794 3,350 1,443 193,006 48,434,009 13,108,061 16,065,588 29,227,427 - 6,744,847 839,551 40,214 157,776 27,567 25
Nontaxable returns:26 No adjusted gross income ........................ (2 ) ( 2) (2 ) (2 ) 3,119 '211,498 113,556 - - 130,872 - - - - - 26
27 Under $600 ..... "................................ (2 ) (')" (2 ) ( 2) 8,865 1,006,181 2,262,616 - - 3,381,407 - - - - - 2728 $600 under $1,000 ............................... 10,505 5,248 - - 7,063 790,192 1,031,926 (2 ) (2 ) 1,056,302 ( 2) ( 2) (2 ) (2 ) (') 2829 $1,000 under $1,500............................. 9,022 7,225 - - 7,753 939,417 1,048,503 20,126 2,994 751,264 717 6,023 16 18,637 701 2930 $1,500 under $2,000...................... ....... 6,533 4,774 - - 7,718 739,532 7~ ,012 48,346 18,741 375,272 3,827 17,658 140 47,329 3,687 3031 $2,000 under $2,500 ............................. (2 ) (2 ) - - 9,344 366,355 336,127 30,250 20,631 134 ,153 4,004 10,635 107 29,750 3,987 31
32 $2,500 under $3,000 ............................. ( 2) (2 ) - - 3,466 259,691 216,616 14,648 13,496 81,901 2,688 7,101 85 14,148 2,603 3233 $3,000 under $3,500 ............................. (2 ) ( 2) - - 1,997 150,751 121,061 6,074 6,061 40,756 (~)209 3,533 64 6,074 1,145 3334 $3,500 under $4,000 ............................. (2 ) ( 2) - - 1,520 78,041 65,141 (') (2 ) 20,595 (2 ) (2 ) (2 ) ( 2) 3435 $4,000 under $4,500 ............................. - - - - (2 ) 48,102 39,098 - - 11,519 - - - - - 3536 $4,500 under $5,0Cl0 ............................. - - - - ( 2) 21,666 11,740 ( 2) (2 ) 3,547 (2) ( 2) ( 2) ( 2) ( 2) 36
37 $5,000 under $6,000 ............................. - - - - 1 5,700 1,220 (2 ) (2 ) ( 2) ( 2) ( 2) ( 2) ( 2) (2 ) 3738 $6,000 under $8,000 .. · .......................... - - - - (2 ) 12,901 5,965 - - (2 ) - - - - - 3839 $8,000 under $10,000 ............................ - - - - - ( 2) ( 2) - - (2 ) - - - - - 3940 $10,000 or more ... ··· .. ......................... 52 1,265 4 1 1,122 12,316 476 52 371 318 119 31 2 49 112 40
41 Total nonte.xable returns .......... ·· ...... 33,153 24,003 528 588 53,196" 44,300,550 5,983,07~ 122,502 65,207 5,990,436 13,359 48,504 560 118,992 12,782 41
42 Grand total ............................... 159,703 314,887 3,878 2,331 246,202 452,743,559 19,001,132 16,188,090 29,292,634 5,990,436 6,758,206 888,055 40,774 276,768 40,349 42
43 Returns under $5,000 ............................... 95,443 72,421 (2 ) (2 ) 156,601 440,947,252 17,784,840 14,839,569 20,430,403 5,987,588 4,133,017 500,083 6,691 207,802 26,275 4344 Returns $5,000 or !Dore·· .......................... 64,260 242,466 1,854 1,294 89 ,601 11,796,307 1,306,292 1,348,521 8,862,231 2,848 2,625,189 387,972 34,083 68,966 14,074 44
See footnotes at end of table. See text for individual returns for "Explanation of Cla.ssifications and Terms ll and for IlDescription of Sample and Limitations of Data. II
~
....z
3g>t"4....z8is::t."'.:l
~~
~~U:J
6~......~
~---

Table 4.-S0URCES OF INCOME AND LOSS, EXEMPTIONS, AND TAX ITEMS-ALL RETURNS, JOINT RETURNS, AND OTHER RETURNS, BY ADJUSTED GROSS L"ICOME CLASSES-Coe~nued
PART III.-arllER THAN JOINT RETURNS-eOlltinUed
Tax credits for- Tax withheld Payments on 1954 Tax due at timeOverpaymentdeclaration of fili..ng
Income taxForeign tax paid Tax paid at source Partially tax-exempt' liability Refund Credit on 1955 taxinterest after
Adjus~ed gross incCIlIe classes credits Number of Amount Number of Amount Number of Amount
Number of Amount Number of Amount Number of Amount returns' returns6 returnsNumber of Amount Number of Amount
returns (ThouslfI'Jd returns (ll'rousand returns (Thousand (Thousand (ThDU~ulnd (Thouund (7hoUS811d returns (Thousand returns (Thousandthllllrs) dollars) dollars) dollars) dollars) do1l6rs) dollars) dolletJrs) rfollars
(47) (<<1) (49) (50) (51) (52) (53) (54) (55) (56) (57) (58) (59) (60) (61) (62) (63)
Taxable returns:1 $600 under $1,000 ................. - - - - - - 37,648 1,109,765 93,295 20,912 1,711 222,194 5,540 1,047,007 61,184 9,702 757 12 $1,000 under $1,500 ............... - - - - - - 211,674 2,040,810 253,701 65,705 8,158 687,082 23,474 1,484,059 69,596 24,434 1,793 23 $1,500 under $2,000, ..... , ... , .... - - - - - - 314,547 1,765,918 336,180 78,791 12,751 566,234 33,734 1,308,004 62,824 31,886 2,318 34 $2,000 under $2, 500 ............... ( 2) ( 2) - - ( 2) (2 ) 489 ,088 1,949,813 505,418 95,716 22,017 664,881 40,261 1,343,154 69,918 33,826 3,649 4
5 $2,500 under $3,0Cl0 ....... , .. , .. ,. - - - - ( 2) ( 2) 612,495 1,857,356 623,923 91,239 22,739 640,943 35,167 1,192,422 63,212 25,077 2,402 56 $3, 0Cl0 under $3,500 ..............'. - - - - (2 ) (2 ) 730,071 1,741,969 724,103 86,138 23,268 905,703 41,630 862,498 54,838 29,614 2, 'TIO 67 $3, 500 under $4, 0Cl0 ............ ... (2) (2) - - - - 688,282 1,358,253 671,009 76,466 22,892 835,518 42,219 554,543 45,022 21,208 2,357 78 $4,000 under $4, 500 ............... ( 2) ( ') - - - - 568,178 961,644 546,989 67,833 27,227 600,168 33,850 369,962 32,431 24,770 2,853 89 $4,500 under $5, 0Cl0 ••..••••. , ..••• ( ') ( 2) - - - - 447,885 648,107 420,140 64 ,981 25,521 424,913 31,024 239 ,426 23,676 26,567 3,911 9
10 $5,0Cl0 under $6,0Cl0 .. ........ '" ' ( 2) ( 2) (2 ) ( 2) ( 2) ( 2) 485,889 544,915 414,550 100,197 48,869 376,227 52,679 206,388 20,962 31,610 7,728 1011 $6, 0Cl0 under $7, OC() ••••••••••••••• ( 2) (2) - - - - 264,858 227,243 207,845 73,5rJ7 43,992 167,953 32,018 76,722 14,350 22,885 5,043 1112 $7,000 under $8,000 ............... - - - - ( ,) ( 2) 167,620 105,134 110,227 59,247 41,800 96,235 25,198 27,630 4,568 15,778 4,847 1213 $8,000 under $9,000 ............... (2) ( ') (2 ) (2 ) - - 104,230 52,569 59,079 39,864 37,549 47,159 15,958 13,634 3,040 13,772 4,657 1314 $9,000 under $10,000 .............. - - - - - - 68,815 27,366 37,944 20,519 22,696 28,583 12,804 7,046 2,027 6,680 1,953 14
15 $10,000 under $15,000 ............. 2,260 252 1,236 3 308 7 247,600 49,913 73,162 80,101 142,106 68,352 53,564 11,898 5,838 25,331 13,792 1516 $15,000 under $20,000 ............. 1,558 295 853 1 283 8 152,212 14,496 30,123 32,246 99,758 24,935 33,871 3,145 3,069 9,551 7,967 1617 $20,000 under $30,000 ............. 1,929 J38 1,071 1 383 5 230,002 12,300 33,885 30,837 168,916 20,792 42,067 1,840 3,396 10,445 12,205 1718 $30,000 under $50,000 .. - ......... - 1,766 974 1,009 4 436 11 223,315 6,057 24,270 16,289 173,811 11,rJ74 38,020 936 1,923 4,913 10,672 1819 $50,000 under $100,000 ............ 1,479 876 537 1 304 11 235,058 2,462 23,047 7,939 193,475 5,307 36,497 239 1,208 2,579 10,294 19
20 $100,000 under $150,000 ........... 333 261 107 (7) 88 2 92,829 452 4,673 1,540 79,098 1,023 12,778 50 217 500 3,548 2021 $150,000 under $200,000 ........... 156 361 33 (7) 14 (7) 44,098 156 1,881 494 37,849 325 6,057 18 330 159 1,500 2122 $200,0Cl0 under $500,0c() ..... ·· .... 173 523 35 (7) 19 1 92,060 162 2,118 574 80,573 370 12,128 22 342 183 2,752 2223 $500,000 under $1,000,000 ......... 52 340 10 11 4 2 43,902 29 201 115 39,980 66 4,685 4 115 45 847 2324 $l,OClO,OC() or more·············,·· 35 548 - - 4 (7) 119,486 24 287 91 111,230 61 9,409 4 111 25 1,328 24
25 Total taxable returns,.····· 13,264 5,C47 7,015 25 3,884 62 6,671,932 14,476,913 5,198,050 1,111,341 1,487,986 6,405,008 674,632 8,750,741 544,197 371,540 111,943 25
Nontaxable returns:26 No adjusted gross income .......... - - - - - - - 19,320 3,301 14,029 7,097 3,109 76 25,079 7,475 6,212 2,924 26
27 Under $600 ........................ - - - - - - - 2,984,481 94,772 12,693 1,944 46,962 579 2,987,566 95,834 7,085 659 2728 $600 under $1,000 ................. - - - - - - - 628,349 35,591 19,903 2 /988 64,038 1,339 636,440 37,369 8,744 1,019 2829 $1,0C() under $1,500 ............ , .. - - - - - - - 364,409 26,838 18,870 1,675 40,872 1,321 374,552 27,780 6,684 405 2930 $1,500 under $2,0Cl0 ............... - - - - - - - 232,824 19,163 24,358 2,390 18,106 775 249,488 20,757 5,642 516 3031 $2,0Cl0 under .$2,500 ............... - - - - - - - 88,975 8,385 12,210 1,670 3,626 190 98,617 9,637 2,585 238 31
32 $2,500 under $3,OClO ............... - - - - - - - 60,327 8,712 9,002 1,934 2,572 263 67,852 10,447 (2 ) (2 ) 3233 $3, 0Cl0 under $3,500 .............. , - - - - - - - 25,117 2,375 8,143 1,042 ( 2) ( ') 30,713 3,086 3,582 330 3334 $3,500 under $4,000 ...... _........ - - - - - - - 12,564 2,473 ( 2) (2 ) (2 ) ( 2) 13 ,587 2,532 (2 ) (2 ) 3435 $4,000 under $4,500 ............... - - - - - - - 8,513 927 - - - - 8,513 927 - - 3536 $4,500 under $5, OC() ••••••••••••••• - - - - - - - (2 ) (2 ) ( 2) (2 ) (2 ) ( 2) ( 2) (2 ) ( 2) ( 2) 36
37 $5,000 under $6,000 ............... (2 ) (2 ) ( 2) (2 ) - - - - - (2 ) (; ) - - ( ') ( 2) ( 2) ( 2) 3738 $6,000 under $8,000 ............... - - - - - - - (2) (2 ) ( ,) (2 ) - - (2 ) ( 2) (2 ) ( 2) 3839 $8,000 under $10,000 .............. - - - - - - - (2 ) (2 ) ( 2) (2 ) - - (2 ) (2 ) - - 3940 $10,000 or more ................. , . 8 5 - - - - - 119 268 262 1,009 (2 ) ( 2) 207 839 135 746 40
41 Total nontaxable retUrns .... 525 13 ( 2) ( 2) - - - 4,428,063 204 ,265 124,675 23,341 183,393 4,840 4,496,662 218,207 44,295 8,070 41
42 Grand total ......... , ....... 13,789 5,060 7,532 29 3,884 62 6,671,932 18,904,976 5,402,315 1,236,016 1,511,327 6,588,491 679,472 13,247,403 762,404 415,835 120,013 42
43 Returns under $5,0Cl0 ... , ....... , .... ( 2) (2 ) - - (2 ) (2 ) 4,099,868 17,860,038 4,377,729 770,636 187,928 5,740,023 291,739 12,895,579 699,000 270,210 29,579 4344 Returns $5,000 or more .. ............ 11,789 4,881 7,532 29 2,843 58 2,572,064 1,044,938 1,024,586 465 380 1,323,399 848,468 387,733 351 / 824 63,404 145,625 90434 44
See text fOr individual returns for r1Explanation of Classifications and Terms ll and for llDescription of Sample and Limitations of Data. II
lEJcclades returns, Form 1040A, in adjusted gross income classes under $5,000.2Sample variability of this item is too large to warrant showing'it separately. However, this value is included in each grand totaLJAdjUBted gross deficit.4Adjusted graBS income less adjusted gross deficit.'Includes returns with income tax withheid l or ",ith excess social security tax withheld, or with 'both.6Includes returns with payments on declaration, or with credit for overpayment of prior year1s tax, or with 'both.?Lee. than $500.
------
.....Zt::1
~
~t"'.....z8is:t'j
E~~en
6:::0.....~
~

Table 5.-'-ITEMIZED NONBUSINESS DEDUCTIONS, EXEMPTIONS, AND TAX ITEMS, BY ADJUSTED GROSS INCOME CLASSES-RETURNS WITH ITEMIZED DEDUCTIONS
Deduction for- TO~Bl .,!e~uctions
Number of Adjusted Medical and dental Losses from fire,returns gross Contributions Interest paid Taxes expenses Child care stonn, or other Other
Adjusted gross income classes with income casualty, or theft deductions Number of Amounti tem1zed returns
deductions Number ofAmount
Number ofAmount
Number ofAmount
Number of Amount Number of Amount Number of Amount
(Thousand returns (ThoulJlJnd returnS (17toulJllnd returns (Thou/Jand returns (Thcnuand returns Thou.and returns (1houtJlJnd (ThoulJatld (Thousand
dol/lin) dollar,,) dollau) dol1l1n) dollau) dollttn) dollau) dolIlJrtJ) dollartJ)
(1) (2) (3) (4) (5) (6) (7) (8) ,(9) (10) (11) (12) (13) (14) (15) (16) (17)
Ta.xeble retuxns:1 $600 under $1,000 ...... , ........ 70,877 63,192 60,784 4,020 17,557 971 52,781 2,921 35,663 3,416 - - 5,000 265 1,926 70,336 13,519 12 $1,000 W'lder $1,500 ............. 211,328 266,386 184,179 17,494 65,220 5,288 179,741 13,521 121,930 19,594 (2) ( ') 25,617 2,755 8,767 209,822 67,489 23 $1,500 under $2,000 ......... , ... 393,034 691,011 .363,911 41,850 144,760 15,165 347,853 30,719 246,770 47,119 4,000 1,4.34 28,070 3,111 21,131 392,021 160,529 34 $2,000 under $2,500 ............. 590,723 1,341,012 546,431 76,645 259,586 30,552 540,174 58,388 376,797 88,144 11,506 3,235 49,107 7,667 32,860 590,699 297,491 4
5 $2,500 under $3,000 ............. 749,143 2,065,264 708,875 109,366 399,686 57,172 705,911 89,506 462,196 117,995 20,033 7,540 73,263 9,701 53,151 749,140 444,431 56 $3,000 under $3,500 ............. 1,033,784 3,368,740 988,001 171,502 639,578 104,081 983,588 143,267 632,184' 170,647 29,036 10,016 111,382 13,450 81,721 1,032,756 694,684 67 $3,500 under $4,000 ............. 1,219,794 4,581,113 1,172,547 208,668 842,537 166,292 1,178,171 200,496 752,500 212,779 35,053 11,291 142,234 18,420 120,207 1,219,771 938,153 78 $4,000 under $4,500 ............. 1,415,523 6,016,695 1,375,148 255,590 1,063,211 235,265 1,377,833 263,742 883,672 251,446 32,794 9,339 190,418 28,605 152,329 1,415,498 1,196,316 89 $4,500 under $5,000 ............. 1,407,038 6,681,374 1,370,217 269,870 1,124,821 283,095 1,381,869 299,734 832,598 244,945 38,605 10,269 185,720 21,828 171,787 1,407,013 1,301,528 9
10 $5,000 under $6,000 ............. 2,255,312 12,321,563 2,199,234 469,598 1,878,930 529,660 2,217,037 535,419 1,292,770 386,727 24,046 7,952 348,673 49,712 330,259 2,254,764 2~309,327 10
11 $6,000 under $7,000 ............. 1,483,371 9,587,108 1,445,565 360,462 1,248,711 399,918 1,458,121 411,749 764,074 259,016 16,534 5,043 275,439 40,101 272,698 1,483,346 1,7/.;.8,987 1112 $7,000 under $8,000 ............. 856,123 6,383,513 845,034 234 ,297 719,202 254,367 839,461 278,113 422,858 162,298 9,534 3,602 155,983 26,246 185,496 856,123 1,144,419 1213 $8,000 under $9,000 ............. 499,880 4,221,040 491,225 162,502 433,030 172,634 491,265 188,424 227,998 94,714 6,034 1,836 97,998 17,353 131,867 499,856 769,330 1314 $9,000 under $10,000 ............ 285,485 2,699,270 282,426 101,068 236,233 102,630 282,886 123,744 131,523 58,944 500 250 64,459 15,753 79,666 285,484 482,055 14
15 $10,000 under $15,000 ........... 571,445 6,845,784 560,205 258,773 436,271 220,567 560,785 306,229 246,584 151,756 2,016 929 107,550 29,694 230,776 571,270 1,198,724 1516 $15,000 under $20,000 ........... 230,281 3,959,864 226,164 141,346 159,441 94,589 226,200 172,123 80,620 64,955 373 208 35,569 12,858 116,081 230,159 602,160 1617 $20,000 under $30,000 ........... 216,857 5,252,827 212,749 175,617 141,353 105,717 212,631 216,773 65,752 65,445 383 182 33,624 16,617 139,846 216,821 720,257 1718 $30,000 under $50,000 ........... 138,216 5,208,818 135,864 174,238 85,508 82,567 135,576 204,714 36,469 45,105 86 43 21,920 15,862 126,650 138,154 649,179 18
19 $50,000 under $100,000 .... , ..... 65,381 4,337,356 64,383 170,576 39,200 64,686 64,310 161,728 17,594 26,734 33 18 11,638 16,273 113,557 65,352 553,572 19
20 $100,000 under $150,000 ......... 11,258 1,346,755 11,101 72,188 6,824 21,553 11,062 49,361 3,405 5,679 4 2 2,586 5,815 41,030 11,255 195,628 2021 $150,000 under $200,000 ......... 3,144 538,896 3,108 35,984 1,952 9,016 3,081 20,627 1,048 . 1,855 3 2 805 2,292 18,305 3,142 88,081 2122 $200,000 under $500,000 ......... 3,197 905,132 3,148 r 71 ,679 2,080 20,700 3,155 . 33,884 1,123 2,258 3 2 921 3,137 31,102 3,194 168,762 2223 $500,000 under $1,000,000 ....... 436 292,532 427 31,409 278 5,236 423 9,869 162 323 1 1 146 1,005 9,602 436 57,445 2324 $1,000,000 or more .............. 200 405,431 199 50,420 134 2,882 195 11,133 74 163 - - 82 772 8,474 200 73,844 24
25 Total taxable returns ..... 13,711,830 89,380,676 13,250,925 3,671,16;2 9,946,163 2,984,663 13,254,109 3,826,184 7,636,364 2,482,057 231,077 73,264 1,968,204 359,292 2,479,288 13,706,612 15,875,910 25
Nontaxable returns:26 No adjusted gross income ........ 440,304 11,014,480 9,388 1,374 6,444 3,255 11,713 8,732 5,272 4,276 (2) (') (') (' ) 507 14,194 18,953 26
27 Under $600 ...................... 30,603 11,155 18',083 2,595 8,052 1,300 15,075 3,482 10,558 2,318 (') (2) (') (') 3,407 23,101 13,119 2728 $600 under $1,000 ............... 149,683 121,718 112,049 10,129 33,740 5,744 114,166 11,076 85,341 25,613 (') (2) 7,551 546 7,363 144,654 60,730 2829 $1,000 under $1,500 ............. 199,179 257,250 153,023 16,769 66,598 11,593 145,564 24,561 118,246 39,922 3,006 917 8,074 1,487 10,672 196,190 105,921 2930 $1,500 under $2,000 ............. 222,800 385,260 183,523 24,518 82,342 15,721 186,077 29,493 142,532 67,524 4,500 928 16,070 6,745 18,500 219,244 163,429 3031 $2,000 under $2,500 ............. 217,040 480,911 184,278 27,875 93,244 21,592 187,926 33,055 141,5~5 65,730 4,495 1,807 18,574 4,537 19,109 214,433 173,705 31
32 $2,500 under $3,000 ............. 212,268 584,700 184,619 31,790 114,700 27,850 184,163 33,970 149,437 73,428 8,519 3,313 18,548 7,220 28,010 211,740 205,581 3233 $3,000 under $3,500 ............. 172,376 558,175 152,302 26,460 112,022 29,746 157,793 34,330 123,495 67,478 7,568 3,055 14,622 3,905 26,749 171,887 191,723 3334 $3,500 under $4,000 ............. 133,301 496,633 124,246 24,409 101,546 28,812 124,799 24,785 93,700 51,390 5,551 1,663 17,046 9,196 24,483 133,300 164,738 3435 $4,000 under $4,500 ............. 91,589 387,964 87,555 19,937 68,465 19,868 87,573 19,178 59,422 30,497 ti~OO ti?71
16,505 11,364 28,382 90,590 131,597 3536 $4,500 under $5,000 .. ........... 52,738 249,478 47,732 12,474 43,689 14,389 49,747 11,552 33,689 21,488 6,582 3,857 25,120 52,735 89,263 36
37 $5,000 under $6,000 ............. 43,797 236,622 35,797 8,968 31,730 13,061 37,264 10,810 27,245 22,614 - - 8,517 15,431 12,603 41,296 83,487 3738 $6,000 under $8,000 ............. 20,667 141,322 18,632 6,040 16,616 17,424 18,144 7,857 11,080 16,533 - - 4,523 12,109 29,656 20,150 89,619 3839 $8,000 under $10,000 ............ (') (') (') (') ( 2) ( ,) ( ') (') (2) (') - - ( ') ( ,) (') (') (') 3940 $10,000 or more ... .............. 2,396 47,033 2,130 7,686 1,923 8,739 2,230 5,829 751 1,054 - - 600 6,181 16,785 2,395 46,274 40
41 Total nontaxable returns .. . 1,989,765 32,952,902 1,314,381 221,385 781,635 219,879 1,323,234 259,178 1,002,783 493,391 41,660 15,450 138,798 85,008 251,979 1,536,933 1,546,270 41
42 Grand total ............... 15,701,595 392,333,578 14,565,306 3,892,547 10,727,798 3,204,542 14,577,343 4,085,362 8,639,147 2,975,448 272,737 88,714 2,107,002 444,300 2,731,267 15,243,545 17,422,180 42
43 Returns under $5,000 ............. , 9,013,125 327,593,551 8,026,891 1,353,335 5,287,798 1,077,751 8,01;2,517 1,336,508 5,307,517 1,605,749 213,187 68,644 935,469 154,731 836,181 8,559,124 6,432,899 4344 Returns $5,000 or more . ........... 6,688,470 64,740,027 6,538,415 2,539,212 5,440,000 2,126,791 6,564,826 2,748,854 3,331,630 1,369,699 59,550 20,070 1,171,533 289,569 1,895,086 6,684,421 10,989,281 44
See footnotes at end of table. See text for individual returns for "Explanation of Classifications and Terma l1 and for lIDescription of Sample and Limitations of Data. n
~
-Z§g~-8is::t.".l
~'
I~....~

Tobie 5.-ITEMIZED NONBUSINESS DEDUCTIONS, EXEMPTIONS, AND TAX ITEMS, BY ADJUSTED GROSS INCOME CLASSES-RETURNS IIITH ITEMIZED DEDUCTIONS-Continued
Taxable income Tax credits fol'--Income tax
Number of Income tax artia11y tax-exempt liabilityExeJDptions returns Dividends received Retirement income Foreign tax paid Tax paid at source
Adjusted gross income classes before interest afterAmount wi th no credi ts credi tsNumber of
returnstaxable Amount Amount Amount Amountincome Number of Number of Number of Amount Number of Number of
(7lloa-nd (ThouSilnd (Tho,!und returns (fltoulflJnd returns (fltoulflJt1d returns (ThoUlflJnd returns (Thousand returns (Thousand (Thou:fanddollars) dollan) dollau) dollars) dollau) dollau) dollan) dollau) dollan)
(18) (19) (20) (21) (22) (23) (24) (25) (26) (27) (28) (29) (30) (31) (32) (33)
Taxable returns:1 $600 under $1,(XX) ............................... 42,526 70,877 7,147 - 1,419 2,500 5 - - - - - - - - 1,414 12 $1,000 under $1,500 ......•.••.•......•.......... 132,824 211,328 66,073 - 13,203 10,611 40 - - - - - - - - 13,163 23 $1,500 under $2,(XX) ............................. 335,069 393,034 195,413 - 39,129 18,198 108 ( ') ( ') - - - - - - 38,960 34 $2,000 under $2,500 .... " ....................... 595,934 590,723 447,587 - 89,200 30,316 283 7,567 587 ( ') ( ') - - ( ') (' ) 88,308 4
5 $2,500 under $3,(XX) ............................. 910,303 749,143 710,530 - 141,720 33,589 291 5,551 448 - - - - ( ') ( ') 140,978 56 $3,000 under $3,500 .........••••................ 1,504,141 1,033,784 1,169,915 - 234,942 42,208 406 12,190 1,860 - - - - ( ') ( ') 232,676 67 $3,500 under $4,000 ............................. 2,042,360 1,219,794 1,600,600 - 320,628 43,032 461 13,101 1,423 ( ')
~ :l - - - - 318,739 78 $4,000 under $4,500 ......... ~ ................... 2,643,165 1,415,523 2,177,214 - 437,559 56,589 860 14,665 1,855 ( ') - - ( ') ( ') 434,524 89 $4,500 under $5 ,(XX) ............................. 2,831,498 1,407,038 2,548,348 - 512,406 52,206 913 12,176 1,667 ( ') ( ') ( ') ( ') - - 509,806 9
10 $5,000 under $6,000 ............................. 4,801,424 2,255,312 5,210,812 - 1,046,594 79,132 1,156 14,725 2,961 ( ') ( ') (') ( ,) ( ,) ( ') 1,042,204 1011 $6,000 under $7 ,(XX) ..•.•...••..•••• : .•••..•••••• 3,173,984 1,483,371 4,664,137 - 939,184 88,347 1,429 10,625 1,874 3,054 426 - - ( ,) ( ') 935,453 1112 $7,000 under $8,(XX) ............................. 1,822,633 856,123 3,416,461 - 693,571 77,933 1,738 10,597 1,985 (' ) ( ,) ( ,) ( ') ( ') ( ') 689,799 1213 $8,000 under $9,(XX) ..•.•..•• ~ •.•.•••.••.••...... 1,058,366 499,880 2,393,344 - 490,014 59,092 1,583 6,574 1,208 ( ,) ( ') ( ,) ( ') ( ,) ( ') 487,174 1314 $9,000 under $10,000 ....•••.•.•.......•......... 618,096 285,485 1,599,119 - 330,544 45,910 997 4,534 843 ( ') ( ,) - - - - 328,675 14
15 $10,000 under $15,000 .......•....•.............• 1,221,334 571,445 4,425,726 - 957,178 181,548 7,091 18,269 3,780 7,650 1,264 1,236 3 883 18 945,022 1516 $15,(XX) under $20,(XX) ........................... 495,136 230,281 2,862,568 - 680,746 114,480 6,651 9,463 1,817 5,891 844 1,971 1 620 11 671,422 1617 $20,000 under $30,000 .........•....•........•..• 465,522 216,857 4,067,048 - 1,105,641 131,222 11,695 9,953 1,948 7,437 1,553 1,071 1 885 9 1,090,435 1718 $30,000 under $50,000 •..•.•.....•.••••.......... 295,636 138,216 4,264,003 - 1,430,810 99,532 14,673 7,552 1,393 7,620 2,720 2-,843 5 1,365 24 1,411,995 1819 $50,000 under $100,000 .......................... 136,996 65,381 3,646,788 - 1,597,416 53,690 17,553 4,432 893 7,391 4,484 2,:008 11 893 22 1,574,453 19
20 $100,000 under $150,000 .•...............•....... 22,740 11,258 1,128,387 - 600,245 10,111 7,228 1,005 194 2,113 1,393 579 2 256 7 591,421 2021 $150,(XX) under $200,(XX) ......................... 6,289 3,144 444,526 - 257,223 2,865 3,386 340 66 792 1,192 154 ( .) 75 4 252,575 2122 $200,(XX) under $500,(XX) ......................... 6,406 3,197 72'9,964 - 457,790 2,946 6,147 354 72 939 1,977 172 ( .) 82 11 449,583 2223 $500,(XX) under $1,000,000 ....................... 809 436 234,278 - 157,180 394 2,058 60 13 163 773 27 11 17 3 154,322 2324 $1,000,(XX) or more .............................. 352 200 331,235 - 225,117 184 2,961 29 6 68 719 - - 7 1 221,430 24
25 Total taxable returns ..................... 25,163,543 13,711,830 48,341,223 - 12,759,459 1,236,635 89,713 164,768 26,954 52,192 18,078 13,135 39 9,113 144 12,624,531 25
Nontaxable returns:26 No adjusted gross income .................. "..... 723,910 - - 440,304 - - - - - - - - - - - - 26
27 Under $600 ...................................... 36,979 - - 30,603 - - - - - - - - - - - - 2728 $600 under $1,000 ............................... 126,454 - - 149,683 - - - - - - - - - - - - 2829 $1,000 under $1,500 ............................. 235,999 ( ') ( ') 198,679 192 ( ') ( ,) ( ') ( ,) - - - - - - - 2930 $1,5OO"under $2,(XX) ............................. 314,759 14,169 3,656 208,631 1,326 9,118 97 14,152 1,229 - - - - - - - 3031 $2,()(X) under $2,500 ............................. 385,123 13,152 4,833 203,888 1,566 5,551 34 13,152 1,532 - - - - - - - 31
32 $2,500 under $3,000 ............................. 446,641 15,665 10,714 196,603 2,144 8,101 91 14,665 2,053 - - - - - - - 3233 $3,(XX) under $3,500 ............................. 420,229 9,676 6,260 162,700 1,251 4,068 65 9,159 1,186 - - - - - - - 3334 $3,500 under $4,000 ............................. 369,278 4,108 2,818 129,193 594 3,608 57 4,108 537 - - - - - - - 3435 $4,000 under $4,500 ............................. 286,531 3,020 2,232 88,569 446 ( ') ( ') 2,520 264 - - - - - - - 3536 $4 , 500 under $5,000 ............................. 171,215 4,040 2,662 48,698 533 ( ') ( ,) 3,540 499 ( ,) ( ') - - - - - 36
37 $5,000 under $6,000 ............................. 169,916 (' ) ( ,) 41,746 616 (,) (' ) (' ) ( ,) (' ) ( ,) ( ') ( ,) - - - 3738 $6,000 under $8, (XX) ............................. 71,024 ( ') ( ') 20,167 139 - - - - (' ) (' ) - - - - - 3839 $8,000 under $10,(XX) ............................ ( ') - - (, ) - - - - - - - - - - - - 3940 $10, (XX) or more ................................. 6,508 365 4,119 2,031 1,209 245 16 281 791 159 402 - - - - - 40
41 Total nontaxable returns .................. 3,766,980 67,246 41,218 1,922,519 10,016 36,790 642 65,162 8,810 1,676 560 ( ') (2 ) - - - 41
42 Grand total ............................... 28,930,523 13,779,076 48,382,441 1,922,519 12,769,475 1,273,425 90,355 229,930 35,764 53,868 18,638 13,652 43 9,113 144 12,624,531 42
43 Returns under $5,000 .............................. 14,554,938 7,155,574 8,956,153 1,857,551 1,798,258 323,743 3,945 129,086 15,364 4,017 370 517 1 1,541 10 1,778,568 4344 Returns $5,000 or more .. " ........................ 14,375,585 6,623,502 39,426,288 64,968 10,971,217 949,682 86,410 100,844 20,400 49,851 18,268 13,135 42 7,572 134 10,845,963 44
See text for individual returns for "Exp1anation of Classifications and Terns" and for "Description of Sample and Limitations of Data.!!lAdJusted gross deficit.2Samp1e variability of this item is too large to warrant showing it. separately. However, this value is included in each total.3AdJusted gross income less adjusted gross deficit.4Less than $500.
-ZSZ~g~-Z~t;r:j
>-3>><~
~~en
d~....~
"""
~

Table e.-NUMBER OF RETURNS BY SIZE OF SOURCE AND BY ADJUSTED GROSS INCOME CLASSES
Number of returns by size of source
Adjusted gross income classesN1..1mber of $100 $200 $300 $400 $500 $1,000 $1,500 $2,000 $2,500 $3,000 $4,000 $5,000 $10,000 $25,000 $50,000 $100,000returns Under $100 under under under under under under under under under under under under under under under
$200 $300 $400 $500 $1,000 $1,500 $2,000 $2,500 $3,000 $4,000 $5,000 $10,000 $25,000 $50,000 $100,000or more
(1) (2) (3) (4) (5) (6) (7) (8) (9) (10) (11) (12) (13) (14) (15) (16) (17) (18)RETURNS WITH SALARIES AND WAGES
(AFTER EXCLUSIONS)
Taxable and nontaxable returns:No adjusted gross income ................. 95,457 10,022 7,610 7,489 6,999 2,513 24,130 7,597 5,613 6,111 4,621 4,620 3,690 3,124 (1) (1 ) (1 ) -Under $600..•••••••..•••.•.•..••••••••••. 3,416,298 398,238 569,154 612,026 579,379 584,504 646,240 10,533 5,070 2,557 2,530 2,533 (1) (l) - - - -$600 under $1,000.•••..•.............•..• 2,503,020 19,463 23,114 28,110 27,062 29,012 2,340,772 19,009 6,504 3,970 (1) (') (1) (1) - - - -$1,000 under $1,500...................••. 3,663,803 27,565 26,037 22,149 19,036 23,749 150,596 3,331,074 20,637 24,850 7,516 7,044 3,030 (1) - - - -$1,500 under $2,000...................... 3,491,466 16,601 16,641 23,132 20,161 15,136 82,445 147,314 3,095,335 40,142 13,507 12,969 3,502 2,561 - - - -
$.2,000 under $.2,500.•.....•........••..•• 3,733,227 10,147 16,603 16,170 15,831 16,133 46,543 75,582 134,645 3,320,066 38,011 26,920 9,529 3,047 - - - -$2,500 under $3,000•.....••...........••• 3,999,125 9,111 11,584 14,646 10,740 10,172 41,527 47,406 53,569 154,694 3,546,869 60,572 15,033 2,513 (1) - - -$3,000 under $4,000...................... 8,449,907 13,280 13,256 14,122 12,226 14,888 62,266 55,202 61,563 102,806 216,866 7,737,367 121,102 22,963 - - - -$4,000 under $5,000...................... 7,449,769 10,673 8,754 8,199 9,240 8,235 25,937 26,132 33,735 46,334 59,496 361,595 6,745,163 104,757 (1) - - -$5,000 under $10,000..........•.......... 11,597,191 20,376 19,402 15,824 11,773 8,177 42,662 36,027 34,277 54,293 58,733 166,776 402 ,515 10,706,682 15,649 - - (1 )
$10,000 under $15,000•......•........•.•• 936,587 4,116 4,615 3,322 3,547 2,479 12,326 9,956 7,847 7,953 7,478 19,197 17,969 174,472 660,886 I 173 (1) -$15,000 under $.20,000•....•...........••• 244,569 1,964 2,363 1,725 1,563 1,121 5,369 3,840 3,474 3,230 2,697 6,547 5,166 26,674 177,941 495 - -$20,000 unde-r $30,000 .................... 182,211 1,373 1,915 1,371 1,219 1,218 4,999· 3,835 1,941 3,606 2,121 4,229 3,605 16,672 111,760 22,251 (1 ) (1 )$30,000 under $50,000•.•••........••••.•. 102,556 913 1;055 1,012 809 667 2,371 2,068 1,547 1,447 1,031 2,737 1,993 8,692 24,404 51,395 395 -$50,000 under $100,000................... 47,206 364 435 482 372 297 1,066 606 705 651 577 1,099 697 3,391 8,123 15,514 12,535 72
$100,000 under $150,000........ : ......... 8,030 109 64 63 54 69 252 216 97 68 66 162 142 499 1,167 1,517 2,461 962$150,000 under $200,000.................. 2,213 16 19 19 23 20 66 41 27 32 21 46 39 173 329 406 475 459$200,000 under $500,000.................. 2,259 20 26 21 18 16 46 40 32 36 33 54 39 173 390 366 463 480$500,000 under $1,000,000................ 279 4 11 5 4 3 6 16 3 6 - 5 4 26 45 48 53 40$1,000,000 or more ....................... 130 3 3 2 - 1 6 5 4 1 1 4 2 8 29 20 28 13
Total ... " ......................... 49,925,305 546,402 722,863 771,669 720,096 716,412 3,491,647 3,776,723 3,466,625 3,773,053 3,966,409 8,440,511 7,334,716 11,081,123 1,003,473 92,757 16,535 2,071
RETURNS WITH DIVIDENOO'(AITER EXCLUSIONS)
Taxable and nontaxable returns:No adjusted gross income ................. 29,649 7,652 5,511 3,553 (1 ) 2,536 4,151 2,548 (1) (1) (1) (1 ) (') (1) (1) (1) (1) -Under $600••.........•••.......•.••...•.• 44,239 18,684 6,960 5,489 6,040 2,517 3,006 (I) - - - - - - - - - -$600 under $1,000........................ 106,535 31,163 17,050 12,069 7,050 9,080 26,068 (1) - - (1 ) - (1 ) - - - - -$1,000 under $1,500...................... 156,693 44,193 24,636 17,613 12,104 8,514 30,702 16,106 2,506 (l) - - - - - - - -$1,500 under $2,000...................... 166,461 42,221 24,660 15,148 11,132 8,535 27,212 24,290 12,743 (1 ) (1 ) - (1) (1) - - - -$2,000 under $2,500...................... 153,662 44,627 17,663 12,665 11,565 ? ,561 21,762 16,136 12,169 6,023 (1) (1 ) (1) - - - - -$2,500 under $3,000...................... 164,313 46,756 27,736 19,293 10,134 10,576 22,719 7,667 7,138 3,500 5,051 2,534 (1 ) - (1) - - -$3,000 under $4,000...................... 333,397 119,648 46,560 30,340 20,778 13,703 37,131 16,226 11,084 12,662 9,642 11,625 (1) (1 ) - - - -$4,000 under $5,000...................... 350,357 123,760 45,402 33,325 19,684 16,053 42,084 16,729 9,704- 6,697 9,132 13,635 11,652 (1) - - - -$5,000 under $10,000 ..................... 1,183,734 408,971 162,444 106,860 67,911 42,039 143,509 62,525 45,581 29,076 20,713 36,384 18,240 35,922 (1) (1) - -$10,000 under $15,000.................... 422,856 80,888 47,236 33,704 24,629 2D,326 60,655 35,419 21,024 15,229 10,412 15,687 12,006 32,618 12,938 (1) (1) (1)$15,000 under $20,000.................... 192,192 27,449 16,351 11,237 9,597 7,619 26,641 16,511 10,718 6,297 6,267 9,917 6,644 19,063 15,420 (1 ) - -$20,000 under $30,000.................... 179 ,631 16,196 10,384 8,655 6,703 6,616 22,237 14,716 11,306 8,617 7,607 10,747 8,438 20,264 24,363 2,556 - -$30,000 under $50,000.................... 118,718 6,860 5,159 4,220 3,723 2,718 10,925 6,235 6,633 5,090 4,700 7,226 5,833 18,516 19,080 9,635 152 (1 )$50,000 under $100,000................... 56,942 1,603 1,371 1,057 1,043 605 3,264 2,471 2,639 1,660 1,650 2,797 2,953 8,203 12,548 9,006 5,562 90
$100,000 under $150,000.................. 10,534 160 106 144 93 90 319 276 215 209 150 308 247 1,100 1,755 1,650 2,429 1,063$150,000 under $200,000 .................. 2,960 33 19 25 16 15 72 49 60 32 39 56 55 206 406 390 565 922$200,000 under $500,000.................. 3,071 26 23 16 16 11 47 42 37 33 24 63 36 160 351 266 395 1,499$500,000 under $1,000,000................ 426 3 1 2 1 - 5 5 6 3 2 5 3 20 31 37 28 274$1,000,000 or IOOre ....................... 197 - 1 - - - 3 - - 2 1 3 1 6 9 20 12 139
Total .. ............................ 3,681,007 1,021,095 461,315 317,417 213,336 159,514 484,532 245,213 155,066 101,205 77,177 111,515 69,671 137,570 89,019 23,947 9,171 4,022
RETURNS WITH INTEREST RECEIVED'
Taxable and nontaxable returns:No adjusted gross income ................. 45,904 15,172 6,115 8,652 (1 ) 3,531 7,112 (1 ) (1 ) (1 ) (1) (1) (1) (1) (1 ) - - -Under $600............................... 113,393 45,249 30,123 14,035 11,445 4,006 7,067 - (1 ) - - - - - - - - -$600 under $1,000........................ 219,948 79,081 51,574 25,114 14,541 16,596 30,563 (1 ) (1 ) (1) (1 ) - - - - - - -$1,000 under $1, 500... ................... 314,694 103,963 63,636 33,528 31,069 23,098 39,632 17,566 (I) (1 ) - - - - - - - -$1,500 under $2,000...................... 324,458 114,653 66,456 35,606 17,066 23,066 42,830 11,990 11,024 (1 ) - (1) - - - - - -$2,000 under $2,500...................... 322,930 121,024 56,290 37,299 23,632 16,740 43,233 13,182 5,046 5,995 (') - - - - - - -$2,500 under $3,000...................... 311,873 136,4~4 62,601 21,583 21,653 18,128 30,567 10,179 5,029 3,062 (1) (1 ) (1) - - - - -$3,000 under $4,000...................... 680,333 329.756 124,773 66,498 39,773 29,129 56,632 12,])5 9,077 6,040 3,506 2,517 (1) - - - - -$4,000 under $5,000...................... 739,493 373,466 139,393 64,034 47.710 26,159 54,.442 11,014 6,043 5,085 3,506 4,568 (1) (1) - - - -$5,000 under $10,000..................... 2,024,476 1,033,153 341,640 193,356 103,932 69,154 163,586 55,725 23,786 17,224 6,147 8,596 6,076 (1) - -
=I-
$10,000 under $15,000................... 465,992 169,759 75,455 50,720 32,703 26,131 63,593 27,229 13,455 6,926 4,389 5,651 3,241 4,163 557 - -$15,000 under $20,000.................... 191,591 49,472 26,750 17,233 14,440 11,192 32,327 13,760 6,454 5,372 2,690 3,591 2,442 2,694 974 - - -:;0,000 under :30,000.................... 170,375 34,662 20,196 16,992 12,365 6,959 26,730 15,162 9,361 6,197 4,090 5,194 2,926 4,204 1,307 (1 ) - -
30,000 under 50,000........ ............ 110.370 17,670 10,293 6,957 7,284 5,810 18,592 11,417 7,385 4,839 3,219 4,606 2,588 4,950 2,329 217 (1 ) (1 )$50,000 under $100,000................... 53,056 6,172 3,957 3,095 2,739 2,416 6,232 5,696 3,652 2,759 2,139 3,168 2,154 4,668 1,629 329 29 (1 )
$100,000 under $150,000.................. 9,447 936 556 463 404 302 1,166 636 739 521 430 569 446 1,109 762 122 57 (1)$150,000 under $200,000••.....•••........ 2,697 212 171 121 97 92 297 222 202 135 115 161 150 328 259 89 23 3$200,000 under $500,000.................. 2,774 218 124 82 90 61 288 226 172 150 126 181 133 387 347 120 49 20$500,000 under $1,000,000•......•.....•.• 393 23 17 9 11 11 40 29 26 15 14 20 19 54 49 28 20 6$1,000,000 or more ................ .~...... 186 9 2 1 4 5 11 11 3 8 4 7 2 31 35 20 22 11
....Tota1....... '" .................... 6,124,385 2,631,366 1,080,326 597,382 382,525 286,606 628,942 209,935 105,949 68,853 33,691 40 596 22 776 25,743 8,475 953 207 60
See footnotes at end. of table. See text for individual returns for llExp1anation of Classifications and Terms" and for "Description of Sample and Lim!tations of Data. 1I
g;
....Zo<....oc:::>t""
Z8is::tz:j
~><
~c:::~Ul
d~......co~

Tobie e.-NUMBER OF RETURNS BY SIZE OF SOURCE AND BY ADJUSTED OROOS INCOME CLASSFS-CoetiDued
.-Number of returns by size of source
Adjusted gross income classesNumber of $100 $200 $300 $400 $500 $1,000 $1,500 $2,000 $2,500 $3,000 $4,000 $5,000 $10,000 $25,000 $50,000
returns Under $100 under under under under under under under under under under under under under under under $100,000
$200 $300 $400 $500 $1,000 $1,500 $2,000 $2,500 $3,000 $4,000 $5,000 $10,000 $25,000 $50,000 $100,000or more
(1) (2) (3) (4) (5) (&) (7) (8) (9) (1O) (11) (12) (13) (14) (15) (1&) (17) (18)RETURNS WITH BUSINESS OR PROFESSION
With profit
Taxable and nontaxable returns:(1 ) (1) (1) (1) (') (I) (1 ) (') (1 ) (1 ) (1) (1) (I) (1)No adjusted. gross income ................. 16,634 2,540 &,152 .
Under $bOO............................... 379,03& 39,659 51,347 5&,458 62,017 72,580 91,850 3,074 (1 ) - (I) - - (1) - - - -$bOO under $1,000........................ 502,343 11,552 12,&14 20,&02 17,462 30,544 400,488 5,056 3,019 - (') (1) - - - - - .
$1,000 under $1,500...................... &88,&&7 9,084 18,589 13,549 18,007 18,541 121,286 478,8&1 4,13& 5,0&3 - (I ) (I) (I ) - - - -$1,500 under $2,000............ : ......... 621,676 8,509 15,124 14,052 12,577 20,335 62,940 101,154 378,307 5,143 (1) (1 ) (1 ) - - - - -$2,000 under $2,500...................... 560,208 10,584 10,070 9,540 13,154 11,181 57,7&7 43,032 89,483 306,266 5,584 3,030 (1 ) - - - - -$2 ,500 under $3,000...................... 517,914 12,625 11,579 13,014 12,138 11,135 37,&04 34 ,2&3 47,401 ?l,811 257,066 8,244 - (I > - - - -$3,()(X) under $4,OCXJ...................... 834,952 26,248 19,570 22,917 20,214 23,337 &5,851 51,8&8 44,398 54,100 88,340 410,402 5,639 (I) - - - -$4,()(X) under $5,000...................... 591,020 21,939 23,848 17,222 15,189 7,&93 52,458 40,319 29,800 33,432 31,05& 80,81& 231,048 6,200 - - - -$5,()(X) under $10,()(X) ................ : .... 1,095,093 26,933 29,015 31,096 18,936 24,224 85,268 &&,&74 46,132 47,775 41,456 83,77& 7&,803 515,905 (I) - - -$10,OCXJ under $15,OCXJ.................... 261,417 2,93& 2,376 2,409 1,775 2,099 8,&54 6,594 7,466 5,34& 4,830 9,903 9,094 &8,505 129,381 - (1) -$15,OCXJ under $20,()(X) .................... 105,992 838 587 495 &11 523 2,360 1,888 1,521 1,114 1,3&0 2,244 3,190 13,484 75,678 99 - -$20,000 under $30,()(X) ...... ~ ............. 84,558 43& 357 355 32& 472 1,337 1,470 1,131 1,113 88& 1,955 1,350 7,603 52,972 12,771 (I) -$30,000 under $50,000.................... 44,284 419 277 2&0 288 228 7&2 ?l4 &19 538 4?3 742 708 3,046 8,719 26,391 100 -$50,()(X) under $loo,Q(X) .... \.......... '.' ... 14,3?l 147 1&0 8& 78 &4 404 301 310 150 129 28& 243 94& 1,606 3,824 5,623 14
$100,000 under $150,000.................. 1,773 39 15 (I ) 18 (I) 97 ?l 54 25 32 58 29 122 180 13& 393 490$150,000 under $2oo,0CXJ.................. 424 9 5 2 4 5 21 15 9 7 14 13 18 35 &5 33 40 129$200,OCXJ under $5oo,0CXJ.................. 37& 4 3 2 & 1 23 17 15 11 8 18 13 30 &7 34 25 99$500,<:XXj under $l,OCXJ,OCXJ................ 49 1 - - 1 1 5 2 1 1 - 4 2 & 8 3 4 10$1,000,000 or more ....................... 25 - - 1 - - 2 - 1 2 1 - 2 - 4 2 5 5
Total ......... '" .................. 6,320,812 173,458 197,087 204,607 193,318 224,004 995,329 835,914 656,392 532,414 434,311 603,102 330,214 620,535 269,816 43,297 6,263 751
~
Taxable and nontaxable returns: .No adjusted gross income ................. 349,806 17,579 17,444 20,960 19,047 16,950 61,871 43,434 25,492 22,968 1&,585 23,158 18,753 24,876 16,214 3,307 (I) (I)Under $10,OCXJ............................ 1,042,932 13&,939 11&,088 95,736 95,184 79,&9& 239,049 119,741 55,681 36,209 18,045 26,264 7,114 14,1&8 2,501 (I ) - -$10,000 under $30,000.................... 55,123 3,279 3,378 3,281 2,324 2,664 10,453 5,286 4,733 3,123 2,949 3,025 2,474 5,071 2,429 595 (I) 31$30,000 or more .......................... 16,8&5 413 38& 412 353 392 1,504 1 1 183 991 811 &80 1,262 887 3,112 2,759 1,029 431 2&0
Totel .............................. 1,464,726 158,210 137,296 120,389 116,908 99,702 312,877 1&9,&44 8&,897 63,111 38,259 53,709 29,228 47,227 23,903 5,448 1,601 317
RETURNS WITH PARTNERSHIP
Wi th profi t
Taxable and nontaxable returns:No adjusted gross income................. 10,826 - (1 ) (I ) (1) - (1 ) (') (I) (1 ) (1 ) (I) (I) (1 ) (1) (') - (I)Under $bOO................................ 41,251 5,002 5,534 6,514 6,008 7,087 10,089 (I ) - - (1 ) - - - - - - -$boo under $1,000........................ 55,&18 2,551 (') (I) (1) (1 ) 41,462 3,047 (1) (1) (1) (1 ) - - - - - -$1,()(X) under $1,500...................... &7,81& (1) (I ) 2,534 (1) (1 ) 13,176 43,019 - (1) (I) - - - (I) - - -$1,500 under $2,000...................... 78,434 4,557 (') (1 ) (' ) (I ) 11,185 10,130 40,412 (') (I) (1) (1) - - - - -$2,000 under $2,500...................... 78,430 (I) (1) 3,556 (') (1 ) 9,227 5,167 8,666 37,603 3,047 3,019 (1 ) (I) - - - -$2,500 under $3,()(X)...................... 93,225 2,551 (1) 2,550 (1 ) (I ) 6,653 8,221 9,162 10,285 45,125 4,570 (I) - - - - -$3,000 under $4,000...................... 191,550 4,051 2,989 3,590 3,551 5,136 11,728 11,251 11,393 13,908 22,CJ6.4 98,301 2,582 (1) (I> - - -$4,000 under $5,()(X)...................... 168,908 4,044 3,092 4,043 3,529 2,534 15,401 10,161 6,125 8,77& 8,779 22,CIl? 77 ,35& 2,991 - - - -$5,000 under $10,000..................... 423,706 11,805 10,620 8,&01 3,562 6,142 33,295 17,912 17,432 19,956 15,941 24,259 33,589 217,957 2,&34 - - (1)
$10,000 under t15,000.................... 150,8OB 3,055 2,519 2,071 1,838 1,611 7,234 5,409 4,620 4,335 3,57& 5,354 5,795 34,441 &8,875 (1 ) - -$15,()(X) under 20,()(X).................... 73,818 1,089 850 1,003 &78 982 4,048 2,402 2,159 1,518 1,249 2,233 1,787 9,74& 43,928 14& - -$20,()(X) under $30,000.................... 74,892 843 943 &45 &27 &91 3,010 2,242 2,061 1,430 1,031 2,430 2,190 8,DO? 38,812 9,902 (1) -$30,000 under $50,000.................... 49,771 788 532 45& 379 330 1,372 1,611 1,004 878 8&5 1,551 1,058 3,998 10,353 24,312 270 (I)$50,()(X) under $loo,()(X)................... 23,286 J44 194 179 125 132 500 450 310 380 314 525 383 1,&79 3,216 6,645 7,853 57
$lQO,OOO under $150,000.................. 3,744 82 24 18 29 29 72 &4 &1 &4 47 72 &1 200 425 402 1,141 953$150,000 under $200,000.................. 954 & 14 7 7 4 28 20 14 18 & 13 10 &1 114 87 140 405$200,000 under $500,000.................. 887 27 8 10 7 9 24 13 11 10 11 21 11 5& 100 77 91 401$500,()(X) under $1,000,0<x>................ 92 & 1 1 2 - 5 2 1 - 1 3 2 5 9 & & 42$1,000,000 or more ................. ~ ..... 30 3 1 - - - 3 1 1 - - 2 1 3 2 1 2 10
Total .............................. 1,588,046 43,823 37,34& 40,88& 27,439 32,301 170,584 122,167 104,966 104,703 106,120 1&5,957 127,413 281,240 169,513 42,170 9,531 1,887
With loss
Taxable and' nontaxable returns:No adjusted gross income................. 47,903 2,495 2,543 (1) 3,505 (1) &,059 5,13& 5,088 (1 ) 2,551 2,565 (I) 7,208 3,911 (1 ) (1) (1)Under $10,OCXJ............................ 144,136 30,030 21,725 8,&49 11,752 9,&08 28,789 13,621 4,593 6,644 (1 ) (1) (I) (1 ) (I ) - (1) -$10,000 under $30,000..•.•..•..••...•.•.• 2&,112 3,660 2,564 1,921 1,805 1,289 4,059 3,292 1,488 1,037 945 1,075 &42 1,359 778 122 (1) (1 )$30,000 or more .......................... 10,798 95& 537 501 350 832 1,334 1,021 474 4?l 455 &07 58& 1,017 1,053 3&& 138 100
Total ............................... . 228,949 37,141 27,369 12,0&0 17,412 12,746 40,241 23,070 11,643 10,244 &,00& 6,270 3,299 11,659 7,293 2,108 283 105
See footnotes at end of teble. See text for individual returns for "Explanation of Classifications and Terms'l and for "Description of Semple and Limitations of Data."
----------
......Zt::1
3~t"'
Z~trl
~><
~~en
d~
.....
~
0-......

Tablo 8.~NIJMBEROF RETURNS BY SIZE OF SOURCE AND BY ADJUSTED OROSS INCOME CLASSES-Conlln.od
Number of returns by size of source
Adjusted gross income classes Number of$100 $200 $300 $400 $500 $1,000 $1,500 $2,000 $2,500 $3,000 $4,000 $5,000 $10,000 $25,000 $50,000returns $100,000
Under $100 under under under under under under under under under under under under under under under or more$200 $300 $400 $500 $1,000 $1,500 $2,000 $2,500 $3,000 $4,000 $5,000 $10,000 $25,000 $50,000 $100,000
(1) (2) (3) (4) (5) (6) (7) (8) (9) (10) (ll) (12) (13) (14) (15) (16) (17) (18)RETURNS WITH SALES OF CAPITAL ASSETS
Wi th net gain
Taxable and nontaxable returns:No adjusted gross income ........................ 61,371 9,512 4,564 4,470 2,995 5,491 15,723 3,594 (1) 2,561 (1) (') (l) 3,109 (1 ) (1 ) (1 ) (1 )Under $600•..................................•.• 40,216 9,431 8,944 7,454 3,953 3,463 3,463 (l) (l) - - - - (1 ) - - - -$600 under $1,000............................... 76,892 16,978 15,513 14,924 5,484 4,959 14,988 (1) (l) (1) - (1 ) (1 ) (1 ) - - - -$1,000 under $1,500............................. 118,745 31,427 15,951 12,507 10,412 7,399 26,512 8,495 3,040 (1) (1) (l) (l) - - - - -$1,500 under $2,(X)()............................. 118,425 28,058 16,424 1l,888 15,118 9,405 19,470 9,521 6,001 (1) (1 ) (1) - (1 ) - - - -$2,000 under $2,500............................. 123,797 27,075 20,078 15,434 12,005 6,438 22,603 10,072 6,063 2,506 - (1) (l) . - - - - -$2,500 under $3,000............................. 117,841 32 ,686 14,668 1l,416 7,989 9,471 21,372 10,232 4,034 (1) 2,478 (1 ) - (1 ) - - - -$3,000 under $4,000............................. 242,448 58,008 29,604 27,730 21,062 19,594 46,105 13 ,553 10,124 6,023 4,582 4,023 (1 ) (1 ) (l) - - -$4,000 under $5,000............................. 213,405 59,054 33,212 17,690 19,621 11,627 30,258 16,605 7,203 5,040 4,529 4,529 3,520 (l) - - - -$5,000 under $10,000............................ 693,862 178,904 95,396 52,816 47,013 39,399 ll4,945 51,549 36,264 18,757 18,267 18,196 12,663 9,172 (1 ) - - -$10,000 under $15,000........................... 247,585 50,493 26,766 19,282 13,210 12,054 37,090 19,286 13,438 10,711 6,732 10,513 7,845 16,245 3,766 124 (1 ) (1 )$15,000 under $20,000........................... 111,717 19,096 9,862 8,286 5,618 5,455 15,081 9,205 6,972 5,078 3,615 4,778 4,367 9,215 4,967 (1 ) (1 ) -$20,000 under $30,(X)()........................... 111,476 16,786 8,945 6,058 5,254 4,162 14,973 9,333 7,121 4,590 4,069 6,472 4,262 10,806 8,286 321 (1 ) -$30,000 under $50,000........................... 77,363 10,270 5,242 3,752 2,992 2,763 8,237 6,070 4,393 3,584 3,055 4,413 2,749 9,021 8,663 2,102 (1 ) (1 )$50,000 under $100,000.......................... 42,258 3,268 2,020 1,561 1,226 1,058 3,943 2,659 2,543 1,697 1,376 2,127 1,774 5,675 6,350 3,514 1,395 72
$100,000 under $150,000......................... 8,194 436 272 183 197 III 465 331 247 179 218 330 316 1,031 1,406 1,066 1,065 341$150,000 under $200,000.................... ~ .... 2,416 94 50 45 25 33 100 79 64 65 36 90 74 23O 333 329 369 400$200,000 under $500,000......................... 2,599 70 42 29 20 17 73 48 41 59 47 61 70 194 277 252 330 969$500,000 under $1,000,000....................... 373 13 3 1 1 2 8 4 4 5 3 6 8 16 36 19 16 228$1,000,000 or oore .............................. 164 3 2 1 - 2 4 - 1 1 1 5 - 6 10 6 8 ll4
Total ..................................... 2,411,147 551,662 307,558 215,527 174,195 142,903 395,413 i72,631 112,641 65,369 52,086 59,613 42,215 68,772 36,684 8,358 3,381 2,139
Wi th net loss
Taxable and nontaxable returns:No adjusted gross income ........................ 24,598 (1' (1) (1) (1) (1) 7,156 9,792 - - - - - - - - - -Under $10,000.................... ~ .............. 480,986 79,070 60,537 49,415 31,822 20,324 74,988 164,830 - - - - - - - - - -$10,000 under $30,000•.• : ....................... 124,423 17,641 12,000 8,564 7,403 6,426 19,596 52,793 - - - - - - - - - -$30,000 or more ................................. 34,077 2,908 2,280 2,058 1,542 1,282 5,590 18,417 - - - - - - - - - -
Total ..................................... 664,084 101,643 76,352 61,071 42,301 29,555 107,330 245,832 - - - - - - - - - -
RETURNS WITH SALES OF PROPERTY OTHERTHAN CAPITAL ASSETS
Wi th net gain
Tsxable and nontaxable returns:No adjusted gross income........................ 3,034 (1) - - - - (1) (1) {1} - - (1 ) - - - (1 ) - -Under $600...................................... 4,536 '(1) (1) (1 ) {1 } - {1 } - - (1) - - - - - - - -$600 under $1,000............................... 6,074 (1) (1 ) (1) (l) (1 ) (1) - (1 ) - - - - - - - - -$1,000 under $1,500............................. 9,986 (1) (1) (l) (1) (1) (1) (1) - - - - - - - - - -$1,500 Under $2,000............................. 10,653 2,551 3,023 (l) (1) - (1) (1) (1) - - (1) - - - - - -$2,000 under $2,500............................. 10,107 2,532 {1 } {1} (1) (1) (1) (1) - (1) - - - - - - - -$2,500 under $3,000............................. 8,997 (1 ) (1) (1 ) (1) - (1 ) (1 ) (1) (1) (1) - - - - - - -$3,000 under $4,000............................. 12,607 (1) 3,051 (l) (1) (1) 3,510 (1 ) (1) (l) - - - (1 ) - - - -$4,000 under $5,000............................. 15,564 3,040 2,989 (1) (1) (1) 3,012 (1) (1) (l) - (1) - - - - - -$5,000 under $10,000............................ 31,941 7,123 2,517 5,561 3,034 2,575 5,006 (1) (1) (l) (1) (1) - (1 ) - - - -110,000 under $15,000........................... 10,797 2,178 1,390 1,113 542 399 1,483 946 424 896 194 417 213 551 (1) - - -
15,000 under $20, CX)() ••••••••••••••••••••••••••• 4,106 947 601 271 268 294 459 419 167 170 (1) 167 (1 ) 192 (1 ) - - -$20,000 under $30,000........................... 3,824 578 292 202 265 (1) 958 257 207 98 (1) (l) 122 388 242 - - -$30,000 under $50,000........................... 1,877 374 188 140 (1) III 222 158 (1) 90 (1) (l) (1 ) 162 118 (1 ) - -$50,000 under $100,000.......................... 695 116 54 66 )2 32 100 32 50 18 (1 ) 21 18 43 77 21 (l) (l)$100,000 under $150,000......................... 136 27 II (1 ) - (1.) 14 14 (1) - - II (1 ) 18 (1 ) II (1 ) -$150,000 under $200,000......................... 38 6 5 5 1 - 5 5 5 2 1 - - 1 1 - 1 -$200,000 under $500,000.......... : .............. 63 17 5 7 7 1 8 2 3 1 - 1 3 3 4 - - 1$500,000 under $1,000,000....................... 16 1 1 2 - 2 2 1 - 1 1 1 1 - 3 - - -$1,000,000 or more .............................. II - - 1 1 2 1 - 1 1 1 - 1 1 1 - - -
Total ..................................... 135,062 28,065 20,134 12,399 10,748 10,516 23,845 10,901 6,454 4,800 2,429 1,812 425 1,880 576 64 9 5
With net loss
raxsble and nontaxable returna:No adjusted gross income ........................ 21,484 (l) (1 ) {1} (l) (1) 3,058 (1) (1) (1) (1) (1) (1 ) 3,103 (1 ) (1 ) (1 ) -Under $10,000................................... 160,221 34,341 18,241 18,770 14,200 12,189 32,451 18,820 3,512 (1) 2,523 (1 ) (1 ) (1 ) (1 ) - - "$10,000 under $30,000........................... 20,621 3,478 2,492 2,010 1,188 1,755 3,662 2,065 986 1,042 584 346 356 438 195 (l) - -$30,000 or more ...............................•. 5,130 714 504 416 254 152 1,056 596 233 208 157 251 ll2 300 134 32 II -
Total ..................................... 207,456 40,074 22,771 22,196 17,627 16,109 40,227 23,546 5,255 4,839 3,764 3,637 1,509 4,358 918 108 518 -See footnotes at end of table. See text for individual returns for "Explanation of Classifications and Terms" and for "Description of Sample and Limitations of Data."
~
.....Zsa:sg>t'"'.....z8is:tz:j
~~
~~00
~~.....~
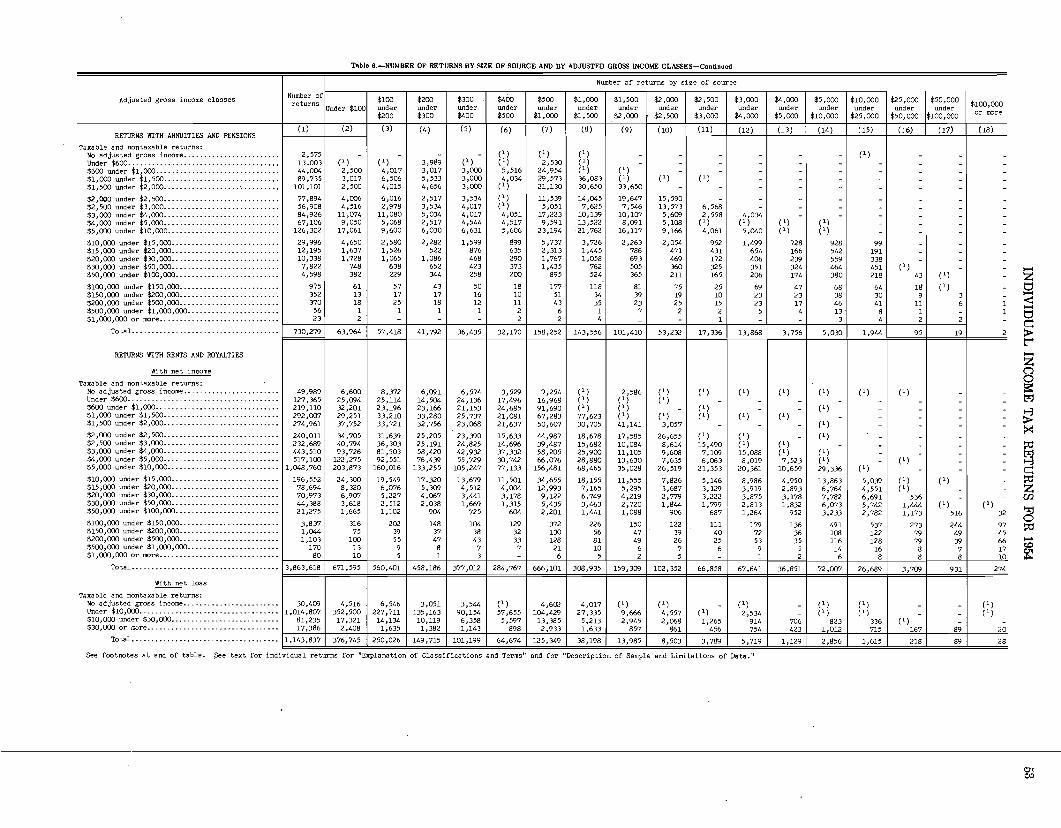
Tabla 6.-NUMBER OF RETURNS BY SIZE OF SOURCE AND DY ADJUSTED GROSS INCOME CLASSES-Continued
Number of returns by si ze of source
Adjusted gross income classes I Number of It $lClO $200 $300 $400 $500 $1,000 $1,500 $2,000 $2 ,500 $3,000 $4,000 $5,000 I $10,000 I $25,000 I, $50,000 I $100000returns Under $100 under under under under under under under under under under under under under under under '$200 $300 $400 $500 $1,000 $1,500 $2,000 $2,500 $3,000 $4,000 $5,000 $10,000 $25,000 $50,000 $100,000 or IlDre
(l) I (2) (3) (4) (5) (6) (7) {8} (9) (10) (11) (12) (13) (14) I (15) I (J6) 1 (17) 1 (18)RETURNS WITH ANNUITIES AND PENSIONS
Taxable and nontaxable returns:(l) (1) (1) - I -I - I - 1 - I - I (1)No adjusted gross income ........................ 2,575 - - - -
Under $600...................................... 13,003 (l) (I) 3,989 (1) (I) 2,530 (1) -$600 under $1,000 ..... , ......................... 44,004 2,500 4,017 3,017 3,000 5,516 24,954 (1) (l)$1,000 under $1,500............................. 89,735 3,017 6,506 5,533 3,000 4,034 29,573 36,083 (l) (l) 1 (l)$1,500 under $2,000................... '.......... 101,101 2,500 4,015 4,656 3,000 (1) 21,130 30,650 33,650 -$2 ,000 under $2,500............................. 77,894 4,006 6,016 2,517 J,534 (l) 11,539 14,045 19,647 15,590$2,500 under $3,000............................. 56,908 4,516 2,978 3,534 4,017 (l) 5,051 7,625 7,546 13,573 6,568$3,000 under $4,000............................. 84,926 11,074 11,080 5,034 4,017 4,051 17,223 10,139 10,107 5,609 2,558 4,034$4,000 under $5,000............................. 67,106 9,050 5,068 2,517 4,544 4,517 9,591 13,522 8,091 5,108 (') (1) (I) (l)$5,000 under $10,000............................ 126,302 17,061 9,600 6,030 6,631 5,606 23,194 . 21,762 16,117 9,166 4,061 5,040 (I) (1)
$10,000 under $15,000•...........•......•.....•• 29,996 4,650 2,580 2,282 1,599 599 5,737 3,726 2,263 2,054 952 1,499 728 928 99$15,000 under $20,000........................... 12,195 1,637 1,526 522 876 635 2,313 1,445 786 471 431 654 166 542 191$20,000 under $30,000........................... 10,338 1,728 1,065 1,086 468 290 1,767 1,058 693 469 172 406 239 559 338$30,000 under $50,000........................... 7,822 748 638 652 423 373 1,435 762 505 360 325 351 324 464 451 (1) - - ......$50,000 under $100,000.......................... 4,598 382 229 344 258 200 895 524 365 211 165 206 174 380 218 43 (I) - Z$100,000 under $150,000......................... 975 61 57 43 50 18 177 118 81 75 25 69 47 68 64 18 (1) - t::J$150,000 under $200,000......................... 352 13 17 17 16 10 51 34 39 19 10 23 23 38 30 9 3 - ......
<:$200,000 under $500,000......................... 370 18 25 18 12 11 43 35 23 25 15 23 17 46 41 11 6 1 ......$500,000 under $1,000,000....................... 56 1 1 1 1 2 6 1 7 2 2 5 4 13 8 1 - 1 t::J$1,000,000 or more .............................. 23 2 - - - 2 2 4 1 - 1 - - 3 4 2 2 - c::::
Total ..................................... 730,279 63,964 57,418 41,792 36,435 32,170 158,252 143,556 101,410 53,232 17,336 13,868 3,756 5,030 1,944 95 19 2 >t"'
RETURNS WITH RENTS AND ROYALTIES ......Z
Wi th net income 8Taxable and nontaxable returns:No adjusted gross income ........................ 49,989 6,600 8,372 6,091 6,574 3,529 9,254 (1) 2,586 (I) (I) (I) (I) (l) (I) (1) - - s::Under $600...................................... 127,365 25,094 25,114 14,504 24,136 17,496 16,968 (1) (1) (') - - - - - - - - t,:I:j$600 under $1,000............................... 219,110 32,201 23,196 23,166 21,153 24,685 91,690 (l) (I) - (I) - - (l) - - - -
~$1,000 under $1,500............................. 292,007 29,251 33,210 33,280 25,737 21,081 67,283 77,623 (I) (l) (1) (l) (') - - - - -$1,500 under $2,000............................. 274,961 37,752 33,721 32,756 23,068 21,637 50,607 30,705 41,141 3,057 - - - (l) - - - - :><$2,000 under $2,500............................. 240,011 34,705 31,639 25,205 23,390 15,633 44,987 18,678 17,585 26,655 (I) (l) - (l) - - - -$2,500 under $3,000............................. 232,689 40,794 36,303 25,191 24,825 14,696 39,487 15,682 10,084 8,614 15,490 (1) (I) - - - - -
~$3,000 under $4,000............................. 443,510 93,726 81,503 58,420 42,932 37,332 58,205 25,900 11,105 9,608 7,109 15,088 (1) (1) - - - -$4,000 under $5,000............................. 517,100 122,275 92,551 76,439 55,729 30,742 66,076 28,880 13,630 7,635 6,063 8,019 7,523 (I) - (l) - -$5,000 under $10,000............................ 1,048,760 203,873 160,016 133,255 105,247 77,133 156,481 68,465 35,028 26,519 21,353 20,361 10 ,659 29,336 (I) - - - c::::$10,000 under $15,000........................... 196,552· 24,300 19,549 17,320 13,679 11,501 34,655 18,155 11,555 7,826 5,146 8,986 4,950 13,863 5,039 (I) (I) - ~$15,000 under $20,000........................... 78,694 8,320 6,076 5,309 4,512 4,004 12,993 7,165 5,295 3,687 3,129 3,919 2,893 6,764 4,551 (1) - - Z$20,000 under $30,000........................... 70,973 6,90'7 5,227 4,067 3,441 3,178 9,122 6,749 4,219 2,779 3,222 3,875 3,178 7,782 6,691 536 - - en$30,000 under $50,000........................... 44,388 3,618 2,512 2,038 1,669 1,315 5,435 3,463 2,720 1,844 1,799 2,813 1,832 6,073 5,742 1,444 (1) (I)
d$50,000 under $100,000.......................... 21,275 1,665 1,102 904 725 604 2,201 1,441 1,088 906 687 1,264 952 3,233 2,782 1,173 516 32$100,000 under $150,000......................... 3,837 316 202 148 104 129 372 226 150 122 111 179 136 491 537 273 244 97 ~$150,000 under $200,000......................... 1,044 75 39 37 38 32 130 56 47 39 40 72 36 108 122 79 49 45$200,000 under $500,000......................... 1,103 100 55 47 43 33 128 81 49 26 25 53 35 116 128 79 39 66 .......$500,000 under $1,000,000....................... 170 13 9 8 7 7 21 10 6 7 6 9 5 14 16 8 7 17 c.o$1,000,000 or more .............................. 80 10 5 1 3 - 6 5 2 5 - 1 2 6 8 8 8 10 ~
Total ........ " ........................... 3,863,618 671,595 560,401 458,186 377,012 284,767 666,101 308,935 159,309 102,352 66,858 67,641 36,851 72,007 26,689 3,709 931 274
Wi th net loss
Taxable and nontaxable returns:No adjusted gross income ........................ 30,409 4,516 6,546 3,051 3,544 (l) 4,602 4,017 (I) (l) - (I) - (l) (') - - (')Under $10,000................................... 1,014,807 352,500 227,711 135,163 90,154 57,655 104,429 27,335 9,666 4,557 (1) 2,534 - (1) (') - - (I)$10,000 under $30,000........................... 81,235 17,321 14,134 10,119 6,358 5,597 13,385 5,213 2,945 2,068 1,265 914 706 823 336 (I) -$30,000 or j;:;~re••....•••.•.•.•.••••••.••••.•.••• 17,386 2,408 1,635 1,382 1,143 898 2,933 1,633 857 861 456 754 423 1 012 715 167 89 20
Total ............ '" ........ " ............ 1,143,837 376,745 250,026 149,715 101,199 64,674 125,349 38,198 13,985 8,503 3,789 5,719 1,129 2,856 1,615 218 89 28
See footnotes at end of table. ,See text for individual returns for "Explanation of Classifications and Terms lr and for "Description of Sample and Limitations of Data. 1I
<:nC.:l

Table 6.-NUMBER OF RETURNS BY SIZE OF SOURCE AND BY ADJUSTED GROSS INCOME CLASSES-Continued
Number of returns by size of source
Adjusted gross income classesNumber of $100 $200 $300 $400 $500 $1,000 $1,500 $2,000 $2,500 $3,000 $4,000 $5,000 $10,000 $25,000 $50,000returns
Under $100 under under under under under under under under under under under under under under under $100,000
$200 $300 $400 $500 $1,000 $1,500 $2,000 $2,500 $3,000 $4,000 $5,000 $10,000 $25,000 $50,000 $100,000 or more
(1) (2) (3) (4) (5) (6) (7) (8) (91 (10) (11) (12) (13) (14) (15) (16) (17) {181RETURNS WITH INCOME FROM ESTATES AND TRUSTS -
Taxable and nontaxable returns:No adjusted gross income ........................ ('1 - - - (11 (11 (') ('1 (11 - - - - (11 (1) - - -Under $600...................................... 4,006 (11 (11 (1) - - - - - - - - - - {11 - - -$600 under $1,000•.•..•.......•.....••........•. 14,522 (11 (ll (ll (11 (1) 6,516 - - - - - - - - - - -$1,000 under $1,500............................. 16,527 (') (1) (1) (1) (1) 3,517 6,499 - {11 - - - - - - - -$1,500 under $2,000............................. 23,105 (11 4,506 (ll (') (1) 6,506 3,020 (11 - (1) (ll - - - - - -$2,000 under $2,500............................. 16,113 (1) (') (1) (,l (ll 6,052 (11 (1 ) (1) - (1) - - - - - -$2,500 under $3,CX)() ...........................•. 15,148 (11 2,534 (11 (1 l - 5,012 2,551 {ll - - - - {11 - - - -$3,000 under $4,000............................. 30,717 5,523 4,023 3,023 4,017 (1) 3,051
tl)23(') - (ll 2,509 (ll (1) - - - -
$4,000 under $5,000............................. 26,281 4,040 2,521 3,000 4,034 (1) 4,496 (11 {ll (1 ) (1) (1) - - - - -$5,000 under $10,(XX). ........................... 103,248 24,667 10,080 8,563 8,013 6,509 16,092 10,046 6,655 (1) (1) 3,024 (11 6,041 - - - -$10,000 under $15,000........................... 40,921 4,980 3,815 2,999 2,277 1,989 6,417 3,220 3,408 1,601 1,545 2,347 1,442 3,077 1,780 (1) - -$15,()(X) under $20,000........................... 20,480 2,402 1,573 892 708 904 2,814 2,014 1,517 954 919 977 987 2,250 1,569 - - -$20,000 under $30,000.........•....•....•.••..•. 23,228 2,297 1,J28 1,670 1,104 787 3,090 2,508 1,286 1,039 959 1,181 1,148 2,676 1,951 204 - -$30,000 under $50,000........................... 16,459 1,236 1,289 765 788 668 2,066 1,446 1,270 868 611 1,074 693 1,595 1,491 592 (1) -$50,()(X) under $100,()(X) .......................... 11,627 816 606 534 507 439 1,526 987 609 501 432 637 458 1,308 1,051 1,008 204 (ll
$loo,()(X) under $150,000......................... 2,438 215 167 129 75 68 264 179 125 125 72 132 72 272 294 121 92 36$150,()(X) under $200,000......................... 800 54 39 3D 31 23 105 56 45 34 34 42 32 99 79 40 35 22$200,()(X) under $500,000......................... 933 80 43 33 32 24 90 54 47 48 36 50 35 97 115 45 41 63$5oo,()(X) under $1,()(X),000 ....................... 136 10 4 7 3 3 14 6 10 3 3 10 9 5 18 8 8 15$1,000,000 or IDOre .............................. 66 2 1 3 - 2 4 3 4 - 2 1 - 7 10 12 6 9
Total ..................................... 368,806 55,886 38,036 29,154 27,120 20,533 68,121 40,633 21,531 8,696 6,654 14,007 8,529 18,448 8,862 2,054 393 149
See text for individual returns for "Explanation of Classifications and Terms" and for lIDescription of Sample and Lindtations of Data."lSample variability of this item is too large to warrant showing it separately. However, this value is included in each total.2EYc1udes returns, Form. 1040A, with this source of income.
~
zS<:8c:::>t"'.....z8is:t.'=j
~><
~~d:;:0.....~

INDIVIDUAL INCOME TAX RETURNS FOR 1954 55
Tabl. 7.-NUMBER OF RETURNS BY SIZE OF NONBUSINESS DEDUCTION AND BY ADJUSTED GROSS INCOME CLASSE~RETURNS WITH ITEMIZED DEDUCTIONS
Ad justed gross income classes
1- Number of returns by size of deduct ion iN:~:n~r r--u-nd-e-r--'--~:-1-~-~r-'---:-~-2-~~-r-""----~-3-~-~-r--'---~-~-~-r---'---'---:-~-~-~-r--'--$-~-,-~-~--'-:-$-~-,~-~-~-T-$-~-~-~-~""---$-~-,~-~-~"'$-~-'-~~-r--'-V.-W1-'-~-er""---$-~-'-~~-~"'~';-10-,-0-00-
$100 $200 $300 $400 $500 $1,000 $1,500 $2,000 $2,500 $3,000 v.,000 $5,000 $10,000 r more
RETURNS WITH CONTRIBUTIONS DEDUCTED(1) (2) (3) (4) (5) (6) (7) (8) (9) (1O) (ll) (12) (13) (14) (15)
(I)
(1 )
(1)(l)
Taxable and nontaxable returns:No adjusted gross income........... 9,388 4,607 2,572 (1) (1) (1) (1),Under $600.......... 18,083 10,614 3,970 (1) (1) (')$600 under $1,000.................. 172,833 124,017 37,254 9,528 i ' ) (') (l)$1,000 W1der $1,500........ ........ 337,202 188,641 ll7,168 24,175 4,964 (') (1)$1,500 under $2,000................ 547,434 264,879 191,509 64,:310 16,660 6,081 3,995$2,000 W1der $2,500................ 730,709 305,918 223,521 142,890 31,150 19,098 8,108
$2,500 under $3,000................ 893,494 351,936 269,667 166,468 57,745 22,149 25,529$3,000 under v.,000........ 2,437,096 837,183 737,630 419,764 266,300 99,430 74,272 (')$4,000 under $5,000.......... 2,880,652 957,600 816,958 469,530 300,326 197,655 134,071 3,512 (')$5,000 under $10,000.... 5,318,937 1,296,725 1,407,944 944,815 61.2,623 377,426 596,762 45,533 4,579 (1) (1)
$10,000 under $15,000.............. 561,669 52,985 92,922 92,044 '79,35/+ 61,403 132,094 33,867 10,530 3,607 1,222 l,J38 303$15,000 under $20,000...... .... .... 226,519 14,060 25,806 28,856 28,131 23,982 69,059 20,606 8,351 3,537 1,783 1,167 890 291$20,000 under $30,000.... .••. ...•.. 212,877 9,199 19,123 20,109 22,876 21,519 66,527 26,215 11,394 6,037 3,304 3,599 1,377 1,598$30,000 under $50,000.. ..•.•..•. ..• 135,953 4,160 8,233 8,378 10,015 9,768 38,929 22,441 11,365 6,479 3,682 5,442 2,285 4,107 669$50,000 under $100,000..... 64,449 1,136 2,211 2,597 2,847 2,782 13,066 9,328 6,606 5'2451 3,263 4,197 2,352 5,111 3,708
$100,000 under $150,000 "'1 1l,113 1 ll4 174 263 270 319 1,202 1,092 822 754 677 844 623 11'557 2,402$150,000 under $200,000............ 3,lll 30 37 46 39 53 227 227 193 159 123 241 174 478 1,084$200,000 under $500,000............ 3,159 29 45 36 36 33 164 137 144 94 100 141 125 397 1,678$500,000 under $1,000,000.... ...... 429 4 3 2 1 3 24 19 II 10 9 9 4 32 298
$1,000,000 or more •................ r-_~1_9:-9~~~~_-~~~~3~~~~_-~~~~-~~~__3~__~4~ 4~_~_3~~~3~~~3~~---:-5~~~6~~_1~7~~---:-14~8Total 14,565,306 4,424,037 3,956,750 2,395,944 1,466,403 844,246 1,165,591 166,018 54,999 27,442 15,179 16,983 8,139 13,588 I 9,987
RETURNS WITH INTEREST PAID
10,727/798 2,747,830 1,937,423 1,658,415 1,141,719
Taxable und nontaxable returns:No adjusted gross income .......•...Under $600 ..$600 under $1,000 _ ..$1,000 under $1,500.....•........•.$1,500 under $2,000 ..$2,000 W1der $2,500 .
$2,500 under $3,000•.••..........•..$3,000 under $4,000 .$4 ,000 under $5,000•...............$5,000 under $10,000 ..
$10,000 under $15,000•.............$15,000 under $20,000•..........•..$20,000 under $30,000 .......•......$30,000 under $50,000...•..........$50,000 under $100,000•............
$100,000 under $150,000 .$150,000 under $200,000 .$200,000 W1der $500,000 .$500,000 under $1,000,000 .$1,000,000 or more •................
Total •. " .
6,4448,052
51,297131/818227,102352,830
514,3861,695,6832,300,1864,565/036
437 J 650159/703141,505
85,56239,259
6,8281,9572,087
279134
(')3,557
29,65473,332
133,160179,541
241,265638,696617,442735,143
42,64818,33216/24011,5784,990
82220018019II
(' )(')9,540
31,23842/88990,916
ll5,089390,733475,541693,960
43,77215,20214,562
7,1963,125
376126104
84
(')(1)5,568
10,60218,72039,399
74,931274,972427,527766,364
45,70415,42711/502
6,2902,578
380779110
5
(' )(')3,0009,608
15,60819,751
37,682207,753377,475888,670
58,11016,70313 ,097
6/9892,402
3489459
53
(' )(1 )(' )(')9/602
10,126
24,740100,209215,351674,644
61,36618,39712,2337,3462,727
2437472
73
(')
(1 )5,0177/119
11,097
19,67976,712
179,231700,553
152,97553,93244/91822,2438,1l9
1,24928625626
7
1,346,619
(1 )(1 )
5,5746,085
36,429
22,55913/49814,97210,2794,382
71618820024
7
116,428
(')(' )(' )4,633
6,2104/2845,7034,6112,640
477137131127
30,879
(' )
(')3/085
1,7891,3882,7902,6731,790
3~~ 1
8014
4
15,023
(1 )
(1 )
9291,0421,7561,6471,297
332617413
8
8,686
(1 )
(1 )
782691
1,4751,862
1,603 1314121ll9116
7,488
(1)
543327808901919
2318287139
4,441
(I)
239408
1,1471,5221,777
5701872234010
6/131
(1 )
(1 )
(')(I)
302425910
4702314ll
7750
3,477
RETURNS WITH TAXES PAID
14,577,343 3,072,041 3,944,063 3/302,807 1,961,921 999,215 188,642
(') (1)
70,283 36,195 22,528
(1 )(1 )
(1)
3,943
285509
706706
1,326245134
(1 )
(1 )
185120479
1,1995,655
3/337929664
5010
(I)
13,6439,410
(' )
261239462
2'
019
1
4,917
1,0712ll196
219
503447
1,6146,1188,830
1,131243235
195
19,145
550747
2,9738,7095,506
669163ll6
177
(' )(I)
(I) (1)
(I)(')(')
4,965 2,0677,922 2,452
21,991 7,77322,415 13,824
8 583 6,850
, ~;; 1 ~;~139 130
18 1610 7
(1 )
(1)(' )(1 )
(')(' )(' )
15,744
26,63837,50257,06532/13510/513
972216153
107
(' )(')(I)5,0346,5517,623
9,14229,42750,986
400,464
244,151114,766
82/46534,3068,863
881172128
181
(1 )(1)
933,507
4,0218,059
15,098
17,24156,137
108,266582,782
98,81+322,26913 /1434,9541,414
1433326
32
(')(I)3/017
10,12621,74432,858
43/411170,252342,350
1,223,604-
81,98516,34410/Q.D3,9211,084
ll82817
31
(')(1 )13,56835,74949/58583,764
134,975482,830839,755
1,575,684
58,18014,060
7,7412/947
733
1052119
21
2/6004,999
32,26664,060
124/869202,895
264,1l3918,163
1,071,0471/172,726
32,3666,7884,6961/790
574
8713
911
2,5996,518
116,561185,315322,622364,862
400,175764,974482,556367/537
1l,6202/8772/338
l'~Zf 1
6619
72
11/71315,075
166,947325,305533,930728,100
890,0742,444,3512,897,0225,345,178
562,318226/557212,783135,674
64/372
11,0743,0853,165
425195
T8J{8.ble and nontaxable returns:No adjusted gross income .Under $600 .$600 under $1,000 .$1,000 under $1,500.•...•.......•..$1,500 under $2,000 .$2,000 under $2,500•....•.•..•.....
$2,500 under $3,000•...............$3,000 under $4,000 .$4 ,000 under $5,000........•.......$5,000 under $10,000....•..........
$10,000 under $15,000 .$15/000 under $20,000•..•......•...$20,000 under $30,000 .$30,000 under $50,000 .$50,000 W1der $100,000 .
$100,000 under $150,000•.•.........$150,000 under $200,000•...........$200,000 under $500,000 .$500,000 under $1,000,000••........$1,000,000 or more•.......•........
Total••....•••........•...•..
RETURNS WITH MEDICAL EXPENSES DEDUCTEO
82,917 48,619 43,512 18,503 8,571
Taxable and nontaxable returns:No adjusted gross income." .Under $600 .$600 under $1,000 .$1,000 W1der $1,500 .$1,500 under $2,000......•.........$2,000 under $2,500•..............•
$2/500 under $3,000••.........•....$3,000 under $4,000 .$4,000 under $5,000 .......•........$5,000 under $10,000 .
$10,000 \illder $15,000..........•...$15,000 under $20/000..•...........$,20,000 under $30,000•.............$30,000 under $50,000 ..$50,000 W1der $100,000.........•...
$100,000 W1der $150,000•..........•$150,000 under $200,000•...........$200,000 under $500,000•...........$500,000 \illder $1,000,000•.........$1,000,000 or more•................
Total•.........•..... " ...•..
5,27210,558
121,004240,176389,302518,312
6ll,6331,601,8791,809,3812,878,048
247/05280,78665,80836,48717,623
3,4131,0501,126
16374
(1)4,064
44,63778,80296,391
ll2,882
128,975321/656360,388570,732
30,6748,4615,4112,797
900
1433430
42
(1)4,016
32,168~9,760
106,965132,120
154,039386,431444,94 6638,626
39/48311,189
6,4042,9451,298
217475410
4
(')(')17,00740,20869,84696,556
ll2,026305,290347,605511,297
34,3329,5287,5713,3081,264
2127180
73
(I)(1 )9,574
27,68646,71973,225
82,316194,655232,124366,672
26,4187,6226,0912,9001,282
245625764
(' )(1 )6,542
13,69319,64831,676
39/837129,722156,575255,261
21,2706,2556,1122,535l,Oft8
263645315
2
691,621
(' )(1 )8,518
13,48731,17955,350
69,769214,260213,179406,095
53,73417,47714,77(:
8,5584,338
705236232
29II
1,113,455
(' )
(1 )(I)9,5259,49]
14,62523,68533/77862,630
18/8647/3896,3293,8201,773
381ll'l126
1710
196,109
(1)(1 )(I)4,0233,978
3,99512,03510,10925,787
7,9314,5953,5172,4521,023
2408578
92
(1 )
(')(1 )(' )
3,0177,0297,143
15,612
5,1552,1022,3871,573
739
1964645
97
(1)
(' )(' )
~i~17
(1 )
~i~9913 ,217
4,7473,0542,5851,8091,400
255100120
2113
(1 )(I)<')(1 )(1 )6,551
2,2821,4951,8871,222
785
1444560
81
(' )
(1)
(1 )
958722991
1,151477
1013343
64
(1)
(' )
3,017
1,180897
1,7001,3211,167
290104134
2010
10,3811
(1)
(1 )(1 )
109
216
1421
320
See text for individual returns for "Explanation of Classifications and Terms" and for lIDescription of Sample and Limitations of Data."lSarnp1e variability of this item is too large to warrant showing it separately. However, this value is included in each total.

56 INDIVIDUAL INCOME TAX RETURNS FOR 1954
Tabl. 5.-TAXABLE INCOME, TAX CREDITS, AND INCOME TAX, BY TAXABLE INCOME CLASSES FOR APPLICABLE TAX RATES
PART 1.- JOINT REl'URNS AND RETURNS OF SURVIVIJ<} SPClJSE
Amount(Thouund
dollarll)
Alternative tax
Number ofreturns
AmoWltCT7toU5ltnd
doilltn)
Income tax liability after credits
Number ofreturns
Nannal tax and surtaxAmount
(ThoUMnddollars)
Number ofreturns
(Thouunddollars)
AmountNumber ofz:eturns
Total of Dividends received credit Retirement income credit
the 5 taxcredits
Taxableincome
(Thoullanddollars;
Nwnber ofreturns
withtaxableincome
Taxable income classes
(1) (3) (4) (5) (6) (7) (8) (9) (10) (11)
22,917 26,552,314
Taxable returns:1 Not over $4,000 .2 Over $4,000 not over $8,000 .3 Over $8,000 not over $12,000 .4 ()ver $12,CXJO not over $16,0C>0 .•.•.•..5 Over $16,(0) not over $20,CXXl .
6 Over $20,000 not over $24 I 000 .7 Over $24,000 not over $28,000 .8 Over $28,000 not over $32,(XX). .9 Over $32,000 not over $36,000 .
10 Over $36,000 not over $40,000 .
11 Over $40,000 not over $44, 000 ~ ..••••.12 Over $44,000 not over $52,000 .13 Over $52,000 not over $64,000 .14 Over $64,000 not over $76,000 .15 Over $76,000 not over $88,000 .
16 Over $88,000 not over $100,000 .17 Over $100,000 not over $120,000 .18 Over $120,000 not over $140,000 .19 Over $140,000 not over $160,000 .20 Over $160,000 not over $180,000 .
21 Over $180,000 not over $200,000 .22 Over $200,000 not over $300,000 .23 Over $300,000 not over $400,000 .24 Over $400,000 .
25 Total taxable returns .
20,653,4924,550,699
680,064259,616142,310
87,83056,89039,63327,76020,555
16,15921,55419,07010,3556,005
3,9813,8652,2441,258
809
5711,202
364490
26,606,776
36,586,33324,300,5296,524,8033,576,9272,536,840
1,919,3411,471,6331,182,355
940,843780,125
677,0491,028;2561,095,708
719,415489,461
372,847420,911289,145187,660137,051
108,316286,369124,073387,569
86,143,559
18,04414,8879,7257,2605,975
4,8874,0903,3783,0733,007
2,6624,2735,0483,8394,041
2,3502,7822,3111,6531,361
9912,8761,1953,371
113,079
484,160479,035221,446120,61773,396
51,06334,94426,28818,84114,649
11,90716,62114,6848,4045,085
3,3773,4021,9571,125
724
5071,104
328444
1,594,108
5,6768,8706,8015,8184,517
4,1073,3662,8982,6432,158
2,1513,6073,9573,1792,504
1,9562,3391,6031,211
987
7992,232
8672,722
76,968
84,55228,55010,5494,8482,901
2,3111,7791,072
928786
488766695452323
195196148
9365
34903355
141,909
11,5795,3972,184
978727
422403184169128
1051591439464
3740301612
820
513
20,653,4924,550,699
680,064259,616142,258
87,80956,76139,43527,29413,167
9,79111,7059,2484,2942,407
1,3731,272
651329171
138213
5869
7,299,8054,966,2901,414,859
837,470640,152
520,676427,47"366,860306,311174,646
150,851219,270227,852137,549
95,339
66,55575,91648,34229,60918,180
17,11135,02314,37543,577
18,134,092
8,254
6,3689,8499,8226,0613,598
2,6082,5931,593
929638
433989306421
54,462
107,420
97,747182,544235,519188,880138,078
119,770144,692108,83276,02460,300
47,471138,52962,988
199,320
1,908,114
12345
6789
10
1112131415
1617181920
21222324
25
Nontaxable returns:26 Not over $4,000 .27 Over $4,000 not over $8,000 ..28 Over $8,000 not over $12,000 .29 Over $12,000 not over $16,000 .30 Over $16,000 not over $20,000 .31 Over $20,000 ..
32 Total nontaxable returns .
60,282130
27752433
60,571
36,334867245
1,072435
1,393
40,346
8,276
118053
256III561
9,437
24,35151
712414
24,511
6566
12
675
55,3069424712418
55,537
7'
469
1
12146
244III222
8,213
262728293031
32
33 Grand totaL................... 26,667,347 86,183,905 122,516 1,618,619 77,643 197,446 31,130 26,552,314 18,134,092 54,462 1,908,114 33
PART H.-SEPARATE REl'URNS OF HUSBANDS AND WIVES AND OF SINGLE PERSONS Nar HEAD OF HOUSEHOLD OR SURVIVING SPOUSE
Amount(Thousand
dollars)
Alternative tax
Nwnber ofreturns
Amount(Thousanddollars)
Income tax liability after credits
Number ofreturnS
Nonnal tax and surtax
(Thouaanddollars)
AmountNwnber ofreturns
(Thouunddollars)
AmountNwnber ofreturns
(ThouSlUfddolhn)
Total of Dividends received credit Retirement income credit
the 5 taxcredits
Taxableincome
(Thousanddollars)
Number ofreturns
withtaxableincome
Taxable income classes
(1) (2) (3) (4) (5) (6) (7) (8) (9) (10) (11)
12345
6789
10
1112(131415
1617181920
21222324
25
Taxab1e returns:Not over $2,000 .Over $2,000 not over $4,000 .Over $4,000 not over $6,000 .Over $6,000 not over $8,000 .Over $8,000 not over $10,000 .
Over $10,000 not over $12,000 .Over $12,000 not over $14,000 .Over $14,000 not over ·$16,000 .Over $16,000 not over $18,000 .Over $18,000 not over $20,000 .
Over $20,000 not over $22,000 .Over $22,000 not over $26,CXX:>. .Over $26,000 not over $32,000 .Over $32,000 not over $38,000 .Over $38,000 not over $44,000 .
Over $44,000 not over $50,000 .Over $50,000 not over $60,000 .Over $60,000 not over $70,000 , .Over $70,000 not over $80,000 .Over $80,000 not over $90,000 .
Over $90,000 not over $100,000 .Over $100,000 not over $150,000.· .Over $150,000 not over $200,000 .Over $200,000 .
Total taxable returns .
10,289,3843,970,670
558,529119,75546,124
29,80717,95412,3199,6387,296
6,0437,4627,4593,9562,311
1,7512,0911,296
714574
488828291477
15, 097~, 217
9,281,84410,889,3282,647,968
814,502411,297
325,527232,070184,348163,138138,289
126,533177,396214,485137,02494,262
81,953114,08183,58053,29748,655
46,41099,68949,848
218,606
26,634,130
12,17510,4166,8744,1223,131
2,6112,0121,5181,4751,397
1,0731,9922,5491,4951,122
9821,4581,019
712706
6141,366
8244,299
65,942
252,192204,498126,75450,87127,206
19,10612,7798,7827,6815,547
4,7676,0056,4313,3971,937
1,5871,8751,199
646533
414781271445
745,704
2,6183,7793,4352,2381,853
1,7201,3461,0411,1871,052
8321,5111,9791,123
846
7691,063
850541562
4591,074
5493,140
35,567
65,71832,95315,1348,8485,718
4,3772,7301,9611,3741,323
1,0031,7911,705
777466
438492353192165
172264
87105
148,146
9,4986,3913,/.111,B171,182
770550399251258
213329326139
82
76121694033
39441721
26,076
10,289,3843,970,670
.558,529119,75546,124
29,80717,95412,3199,6385,420
4,4844,6934,6832,0711,1l0
853899581232233
130246
92147
15,080,054
1,833,2082,219,516
567,906185,154100,597
86,15465,72956,18252,75034,953
33,88142,63256,39432,27621,843
20,24026,09921,33010,44312,288
7,92420,45311,57970,597
5,590,128
1,876
1,5572,7712,7761,8851,201
8981,192
715482341
358 1582199330
17,163
12,247
11,65225,16632,395.28,43822,669
20,23632,89024,38019,69316,455
20,24942,86721,253
126,246
456,836
12345
6789
10
1112131415
I
I ~*181920
21222324
25
262728293031
32
Nontaxable returns:Not over- $2,000 .Over $2,000 not over $4,000 .Over $4,000 not over $6,000 .Over $6,000 not over $8,000 .Over $8,000 not over $10,000 .Over $10,000 .
Total nontaxable returns .
116,961(1 )
24
117,485
61,139(1 )
340
62,810
12'566
1(1) =
105
12,944
47,087
47,087
531
531
115,401(')
24
115,925
12,020(')
105
12,398
262728293031
32
33 Grand total.................... 15,214,702 26,696,940 78,886 792,791 36,098 264,071 38,474 15,080,054 5,590,128 17,163 456,836 33
See footnotes at end of table. See text for individual returns for llExplanation of Classifications and Terms" and llDescription of Sample and Limitations of Data. II

INDIVIDUAL INCOME TAX RETURNS FOR 1954 I 57
Tabla 8~TAXABLEINCOME, TAX CREDITS, AND INCOME TAX, BY TAXABLE INCOME CLASSES FOR APPLICABLE TAX RATES-Continued
PART III.-REl'URNS OF HEADS OF HOUSEHOLD
Number of Total ofDividends reedved credit Retirement income erecti t Income tax liability after credits
returnsTaxable the :> tax Normal tax and surtax Alternative taxincomeTaxable income clQsses with credits Number of AmOWlt Number of Amount AmOWlttaxable returns returns Number of Number of AmOW1j
income (Thou81U1d (Thousand (ThoulIJfld (Thouund l'eturns (ThoUIIlJr1d returns(1houa d
dollartJ) do1JfJrlJ) dolhrs) doJlllra) dollars) dollar')
( 1) (2) (3) (4) ( 5) (6) (7) (8) (9) (10) (11)
Taxable returns:1 Not over $2,000 ....................... 439,114 433,419 361 13,641 160 2,017 201 439,114 85,908 - - 12 Over $2,000 not over $4,000........... 373,004 1,031,559 758 29,835 658 1,024 100 373,004 208,299 - - 23 Over t,oao not over $6,000 ........... 70,602 332,388 803 18,419 394 2,105 409 70,602 69,266 - - 34 Over 6,000 not over $8,000 ........... 18,092 124,642 455 8,066 270 1,422 181 18,092 27,256 - - 45 Over $8,000 not over $10,000 .......... 8,520 75,38.5 281 4,236 200 393 80 8,520 17,442 - - 5
6 Over $10,000 not over $12,000 ......... 4,313 47,405 255 2,438 162 383 88 4,313 11,558 - - 67 Over $12,000 not over $14,000 ......... 3,095 40,081 211 1,808 147 243 53 3,095 10,326 - I - 78 Over $14,000 not over $16,000......... 2,027 30,302 165 1,221 121 194 41 2,027 8,286 - - 89 Over $16,000 not over $18,000 ......... 2,021 34,179 387 1,429 242 166 33 2,021 9,954 - - 9
10 Over $18,000 not over $20,000 ......... 1,272 24,185 96 832 82 48 12 1,248 7,188 - - 10
11 Over $20,000 not over $22,000 ......... 1,051 22,064 134 660 108 121 24 1,051 6,964 - - 1112 Over $22,000 not Over $24,000 ...... , .. 1,523 34,772 278 1,303 251 75 18 1,470 10,914 - 1213 Over $24,000 not over $28,000 ......... 1,061 27,423 156 785 132 69 10 862 7,743 276
2'f413
14 Over $28,000 not over $32,000 ......... 704 20,855 139 546 121 58 13 439 4,876 265 2, 49 1415 Over $32,000 not over $38,000 ......... 742 25,763 482 572 153 103 18 434 6,089 308 3, 54 15
16 Over $38,000 not over $44,000 ......... 528 21,623 121 397 109 60 8 198 3,560 330
5'r
1617 Over $44,000 not over $50,000 ......... 308 14,620 92 240 82 39 5 158 3,472 150 3, 01 1718 Over $50,000 not over $60,000 ......... 353 19,101 253 281 114 46 8 172 4,444 181 4, 36 1819 Over $60,000 not over $70,000 ......... 209 13,533 154 174 127 36 7 94 3,083 115 3, 70 1920 Over $70,000 not over $80,000 ......... 158 11,841 148 153 132 49 11 51 2,034 107 4, 49 20
21 Over $80,000 not Over $90,000 ......... 55 4,732 44 47 34 20 4 30 1,433 25 1,b5 2122 Over $90,000 not over $100,000 ........ 86 8,100 73 81 67 12 2 24 1,311 62 3,215 2223 Over $100,000 not over $150,000 ....... 126 14,740 143 118 127 10 1 32 2,393 94 6,¢48 2324 Over $150,000 not over $200,000 ....... 41 7,160 147 39 88 6 1 11 1,373 30 3,053 2425 Over $200,000 not over $300,000 ....... 30 7,235 105 26 80 5 1 7 1,274 23 3,)61 2526 Over $300,000. , ...•..•.••.•. ,., ....... 32 21,947 124 29 196 5 1 5 1,597 27 11 699 26
27 Total taxable returns ........... 929,067 2,449,054 6,365 87,376 4,267 8,709 1,330 927,074 518,043. 1,993 58J41 27
Nontaxable returns: I28 Not over $2,000 ....................... 3,017 1,402 280 1,017 16 3,017 264 - - - - 2829 Over $2,000 not over $4 ,000 ........... - - - - - - - - - -
I- 29
30 Over $4,000 not over $6,000 ........... - - - - - - - - - - - 3031 Over $6,000 not over $8,000 ........... - - - - - - - - - - - 3132 Over $8,000 not over $10,000 .......... - - - - - - - - - - - 3233 Over $10,000 .......................... - - - - - - - - - - - 33
34 Total nontaxable returns ........ 3,017 1,402 280 1,017 16 3,017 264 - - - - 34
35 Grand total ..................... 932,084 2,450,456 6,645 88,393 4,283 11,726 1,594 927,074 518,043 1,993 58, 41 35
See text fOr individuul returns for /lExplanation of Classifications and Terms l1 and for llDescription of Sample and Limitations of Data. 1I
lSample vario.bility of this item is too large to warrant showing it separately. HOWever J this value is included 1n each totaL

58 INDIVIDUAL INCOME TAX RETURNS FOR 1954
Tabl•••-ADJUSTED GROSS INCOME, TAXABLE INCOME, INCOME TAX, AVERAGE TAX, AND EFFECTIVE TAX RATE, BY TYPES OF INCOME TAX AND BY ADJUSTED GROSS INCOME CLASSES
62 Returns under $5,000 , _ .63 Returns $5,000 or more .
56 $100,000 under $150,000 .57 $150,CXX) under $200,CXX) .58 $200,000 under $500,000 .59 $500,000 under $1,000,000 .60 $1,000,000 or more .
40 $10,000 under $15,000 .41 $15,000 under $20,000 ,42 $20,000 under $30,000 ..43 $30,000 under $50,000 ..44 $50,CXX) under $100,000 .
45 $100,000 under $150,000 .46 $150,000 under $200,000 .4~ $200,000 UI1tler $500,000 .48 $500,000 under $l,Ooo,OOJ .49 $1,000,000 or more .............................................•.......................
Effective taxAdjusted Taxable
Income tax rate-incomeNumber ofreturns with gross in:ome income
liebility Average tax afterafter credits in~ome tax
income tax credi ts as apercent of
(ThouslInd (ThouslInd (Thoulurnd taxable inconedollan) dollllrs) dollan) (Do/lBrs)
(1) (2) (3) (4) (5) (6)
1,292,988 1,078,798 188,445 37,648 29 20.0 12,426,670 3,047,987 1,069,613 213,519 88 20.0 22,431,232 4,237,823 1,728,796 344,635 142 19.9 33,078,559 6,922,726 2,890,502 575,180 1S7 19.9 4
3,452,029 9,505,225 4,107,080 817,847 237 19.9 53,867,430 12,592,640 5, 594, Q4.1 1, 120,6Q4. 290 20.0 64,057,107 15,219,849 6,692,852 1,346,691 332 20.1 73,959,609 16,818,643 7 ,4Q4. ,211 1,489,975 376 20.1 83,585,645 17,010,192 7,754,769 1,559,856 435 20.1 9
5,108,368 27,910,808 13,782,379 2,770,109 542 20.1 103,331,451 21,524,454 11,821,062 2,385,/t 03 716 20.2 112,008,053 14~961,906 8,944,484 1,820,597 907 20.4 121,186,721 10,032,034 6,324,419 1,301,277 1,097 20.6 13
720,646 6,808,273 4,479,948 932,992 1,295 20.8 14
1,215,482 14,390,558 10,096,351 2,185,166 1,796 21. 6 15368,492 6,316,307 4,808,176 1,145,589 3,109 23.8 16291,668 7,018,963 5,610,769 1,521,883 5,218 27.1 17161,897 6,067,727 5,052,115 1,683,981 10,402 33.3 1870,332 4,651,794 3,946,268 1,708,710 24,295 43.3 19
11,617 1,389,769 1,170,329 614,555 52,901 52.5 203,192 546,951 452,450 257,014 80,518 56. S 213,234- 915,760 740,497 455,363 140,805 61. 5 22
437 293, III 234-,854 154,785 354,199 65.9 23201 406,532 332,333 222,374 1,106,338 66.9 24
42,633,060 209,668,830 115,226,743 26,665,753 625 23.1 25
1,292,988 1,078,798 188,445 37,648 29 20.0 262,426,670 3,Q4.7,987 1,069,613 213,519 88 20.0 272,431,232 4,237,823 1,728,796 344,635 142 19.9 283,078,559 6,922,726 2,890,502 575,180 187 19.9 29
3,452,029 9,505,225 4,107,080 817,847 237 19.9 303,867,430 12,592,640 5,594,Q4.1 1,120,604 290 20.0 314,057,107 15,219,849 6,692,852 1,34-6,691 332 20.1 323,959,609 16,818,643 7 ,4Q4. ,2.11 1,489,975 376 20.1 333,585,645 17,010,192 7,754,769 1,559,856 435 20.1 34
5,108,368 27,910,808 13,782,379 2,770,109 542 20.1 353,331,451 21,524,454 11,821,062 2,385,403 716 20.2 362,008,053 14,961,906 8,944,484 1,820,597 907 20.4 371,186,721 10,032,034 6,324,419 1,301,277 1,097 20.6 3S
720,646 6,808,273 4,479,948 932,992 1,295 20.8 39
1,215,482 14,390,558 10,096,351 2,185,166 1,798 21. 6 40368,464 6,315,756 4,807,668 1,145,414 3,109 23.8 412S5,773 6,870, ~70 5,48?,~06 1,475,208 5,162 26.9 42143,050 5,270,463 .4,358,078 1,421,960 9,940 32.6 4334,553 2,227,259 1,877,893 813,611 23,54'1 43.3 44
3,900 461,847 384,746 210,347 53,935 54.7 45S74 149,163 120,032 73,622 84 ,235 61.3 46721 200,453 155,105 108,947 151,106 70.2 47
74 50,030 37,833 29,774 402,351 78.7 4843 96,253 72,842 61,880 1,439,062 85.0 49
42,559,442 203,703,810 110,175,355 24,242,262 570 22.0 50
- 51(') (') (') (') (' ) (') 52
5,895 148,293 128,563 46,675 7,918 36.3 5318,847 797,264 694,037 262,021 13,903 37.8 5435,779 2,424,535 2,068,375 895,Cl'J9 25,017 43.3 55
7,717 927,922 785,583 404,208 52,379 51. 5 562,318 397,7SS 332,418 183,392 79,117 55.2 572,513 715,307 585,392 346,416 137,850 59.2 58
363 243,081 197,021 125,011 344,38J 63.5 59158 310,279 259,491 160,494 1,015,786 61.8 60
73 J 618 5,965,020 5,051,388 2,423,491 32,920 4S.0 61
28,151,269 86,433,883 37,430,309 7,505,955 267 20.1 6214,481,791 123,234,947 77,796,434- 19,159,798 1,323 24.6 63
Adjusted gross income classes
Total _.
Total , .
Total '" .. , , .
61
50
25
30 $2,500 under $3,000 .31 $3,000 under $3,500 .32 $3,500 under $4,000 .33 $4,000 under $4,500 .34- $4,500 under $5,000 .
35 $5,000 under $6,l)(X) _ .36· $6,000 under $7,000 .37 $7,000 under $8,000 , .38 $8,000 under $9,000 .39 $9,000 under $10,000 .
RETURNS WIlli NORMAL TAX AND SURTAX
26 $600 under $1,l)(X) .27 $1,000 under $1,500 .28 $1,500 under $2,000 , .29 $2,000 under $2,500 _.......•........
RETURNS WIlli ALTERNATIVE TAX
51 Under $15,000 .52 $15,000 U11der $20,000 .53 $20,000 under $30,000 .54 $30,000 under $50,000 .55 $50,000 under $100,000 .
ALL TAXABLE RETURNS
$600 under $1,000 .$1,CXX> under $1,500.................••.....................••..........................$1,500 under $2,CXX>......•.....•..........•...........................................$2,000 under $2,500 .
$2,500 under $3,000 _ , .$3,000 under $3,500 .$3,500 under $4,000 .S:4,000 under $4,500 .$4,500 under $5,000 .
10 $5,CXX) under $6,000 .11 $6,CXX) under $7,l)(X) .12 $7,000 under $8,l)(X) , , , , .13 $8,000 under $9,000 , , .14 $9,000 under $10,000 .
15 $10,000 under $15,000 .16 $15,000,under $20,000 .17 $20,000 under $30,000 _ .18 $30,000 under $50,000..............•...................................................19 $50,000 under $100,000 .
20 $100,000 under $150,000 ..21 $150,000 under $200,000 ..22 $200,000 under $500,000 .23 $500,000 under $1,000,000..........................•...................................24 $1,000,000 or more .
See text for individual returns for IlExp1anation of Classifications and Terms ll and for l1Description of Sample and Limitations of Data. II
lSample variability of this item is too large to warrant showing it separately. However, this value is included in each total.

...ioo~
~
~
Table tOo-ADJUSTED GROSS INCOME, EXEMPrIONS, TAXABLE INCOME, AND INCOME TAX, BY MARITAL STATUS OF TAXPAYER., BY RETURNS WlTH STANDARD OR ITEMIZED DEDUCTIONS, AND BY ADJUSTED GROSS INCOME CLASSES
PART 1. -ALL RETURNS
All returns Joint returns of husbands and wives Separate returns of husbands ~J1d '.vives
Income tax: Income tax:Adjusted Taxable Income tax
Adjusted gross income classes Adjusted Taxable liability Adjusted Exemptions Taxable liability Exemptions liabilityTotal gross incomeExemptions income Number of gross income income Number of gross income income
number of after after aftercredits returns credits returns crf'ditsreturns
(Tho~lfa"d (Thousand (Thousand (Tholuand (Thoul'land ( Thoilifand (Thousand (Thousand (Thousand (Thousand (Thousand (ThousanddoJJarlf) dollsn) dollars) dollars) dolJan) dollars) dolliJts) dollars) dollars) dollars) dollsr!!.) dollars)
(1) (2) (3) (4) (5) (6) (7) (8) (9) (10) (11) (12) (13) (14) (15)
Taxable returns:1 $600 under $1,000•........•.......... 1,292,988 1,078,798 775,793 188,445 37,648 - - - - - 82,615 68,201 49,569 11,201 2,276 12 $1,000 under $1,500. 0 .. 0 .. ••• 0" 0 ... 0 2,426,670 3,047,987 1,634,140 1,069,613 213,519 136,9CY7 192,774 164 ,288 9,348 1,845 162,049 204,747 108,721 72,906 14,395 23 $1,500 under $2,000••...............• 2,431,232 4,237,823 1,994,975 1,728,796 344,635 429,159 752,382 514,995 149,017 30,088 187,351 328,D64 149,956 137,444 27,347 34 $2,000 under $2,500•.•...............· 3,078,559 6,922,726 3,178,049 2,890,502 575,180 933,923 2,102,024 1,414,809 429,922 86,092 228,410 513,113 208,788 243,329 48,471 4
5 $2,500 under $3,000...... . .........• 3,452,029 9,505,225 4,210,705 4,107,080 817,847 1,463,928 4,054,792 2,512,129 1,028,154 205,352 249,249 681,809 239,921 358,190 71. 739 56 $3,000 under $3,500........ 0 .... 0" o. 3,867,430 12,592,640 5,383,703 5,594,041 1,120,604 2,013,805 6,575,130 3,744,525 1,957,864 390,533 256,608 834,106 246,459 484,350 97,574 67 $3,500 under $4,000.. 0 .............. 0 4,057,107 15,219,849 6,527,673 6,692,852 1,346,691 2,619,817 9,837,296 5,195,432 3,299,872 658,409 212,388 797,170 244,435 452,966 92,317 78 $4,000 under $4,500••...............• 3,959,609 16,818,643 7,139,046 7,404,211 1,489,975 2,945,716 12,527,228 6,177,854 4,620,203 921,797 142,359 604,364 176,369 347,345 71,103 89 $4,500 under $5,0CI0.................• 3,585,645 17,010,192 6,921,884 7,754,769 1,559,856 2,890,378 13,723,435 6,232,492 5,569,795 1,111,971 103,208 488,594 138,485 288,575 58,930 9
10 $5,000 under $6,000......•...•......• 5,108,368 27,910,808 lO f 262,715 13,782,379 2,770,109 4,491,165 24,558,938 9,680,553 11,445,966 2,284,220 56,CY75 304,033 64,191 199,159 41,278 1011 $6,000 under $7,000 .................• 3,331,451 21,524,454 6,763,313 11,821,062 2,385,403 3,063,436 19,800,631 6,507,559 10,581,208 2,120,545 26,400 169,536 32,722 114,667 24,388 1112 $7,000 under $B,OCXJ.................. 2,008,053 14,961,906 4,016,882 8,944,484 1,820,597 1,865,911 13,908,756 3,884,889 8,172,734 1,652,977 12,814 94,496 12,437 63,951 13,669 1213 $8,000 under $9,000 ....•.......•.•.•• 1,186,721 10,032,034 2,359,202 6,324,419 1,301,277 1,112,694 9,409,115 2,288,708 5,856,373 1,197,047 10,281 86,463 11,999 63,683 13,782 1314 $9,000 under $10,000 ...........•.•.•. 720,646 6,808,273 1,436,249 4,479,948 9~2,992 678,854 6,412,890 1,392,000 4,180,665 864,177 3,717 35,431 5,311 25,866 5,997 14
15 $10,OCK) under $15,0CK)•......•.•..•..• 1,215,482 14,390,558 2,452,592 10,096,351 .2,185,166 1,109,457 13,120,684 2,344,119 9,104,208 1,937,566 8,902 107,332 9,549 83,314 21,404 1516 $15,000 under $20,OCK)•..............• 368,492 6,316,307 768,160 4,808,176 -1,145,589 331,080 5,675,901 729,0'76 4,287,170 993,377 3,793 64,341 4,107 52,911 15,967 1617 $20,0CK) under $30,0CK)••.•......•..... 291,668 7,018,963 613,382 5,610,769 1,521,883 258,228 6,216,075 577,446 4,943,679 1,291,791 2,914 70,604 3,172 58,687 21,050 1718 $30,000 under $50,000..... _........•• 161,897 6,067,727 342,787 5,052,115 1,683,981 144,975 5,437,126 324,692 4,522,363 1,460,666 1,477 55,246 1,629 45,529 19,560 1819 $50,000 under $100, OCK) ......•.•..•..•, 70,332 4,651,794 147,010 3,946,268 1,708,710 62,217 4,106,829 137,865 3,492,352 1,473,652 631 41,385 666 34,235 17,963 19
20 $100,000 under $150,0CI0.••....•.•..•• 11,617 1,389,769 23,452 1,170,329 614,555 10,041 1,200,886 21,701 1,016,213 521,726 131 15,778 137 13,330 7,942 2021 $150,000 under $200,000 ..•.•......•.• 3,192 546,951 6,371 452,450 257,014 2,693. 460,661 5,808 383,378 212,916 31 5,286 37 4,380 2,757 2122 $2oo,OCK) under $5oo,OCIO••..........•• 3,234 915,760 6,463 740,497 455,363 2,656 7'..7,521 5,796 605,536 363,303 65 18,764 80 14,483 10,225 2223 $500,000 under $1,000,000•••..•••.•.• 437 293,111 810 234,854 154,785 322 216,779 674 173,456 110,883 21 15,296 29 11,730 9,195 2324 $1,000,000 or more .........•..•••.••• 201 406,532 354 332,333 222,374 110 196,968 241 169,840 102,888 36 86,511 55 55,941 46,363 24
25 Total taxable returns•.....••••• 42,633,060 209, 668,830 66,965,710 115,226,743 26,665,753 26,567,472 161,234,821 53,857,648 85,999,316 19,993,821 1,751,525 5,690,670 1,708,824 3,238,172 755,692 25
Nontaxable returns:26 No adjusted gross income•....•.•..•.• 440,304 11,014,480 723,910 - - 309,432 1802,982 610,354 - - 6,098 111,962 4,866 - - 26
27 Under $600 .•..•.••••...•••.••....•••• 3,939,817 1,294,816 3,317,634 - - 558,410 198,635 1,055,018 - - 255,226 84,092 188,620 - - 2728 $600 under $1,000. 0 o. 0 o. 0 ............ 1,887,553 1,463,870 2,624,079 142 - 830,262 673,678 1,592,153 - - 83,184 61,987 85,869 - - 2829 .$1,000 under $1,500 •••.•...••.•••...• 2,093,925 2,582,741 3,669,343 3,018 - 1,322,535 1,643,324 2,620,840 24 - 88,342 109,019 138,158 - - 2930 $1,500 under $2,OCIO•••.........•..••• 1,775,446 3,119,798 3,768,755 19,818 - 1,351,828 2,380,266 3,039,743 1,077 - 52,058 90,942 102,792 437 - 3031 $2,0CK) under $2,500 ..............•..• 1,233,114 2,781,270 3,162,076 24,770 - 1,068,711 2,414,915 2,825,948 4,139 - 23,218 53,222 58,149 - - 31
32 $2,500 under $3,000.........•........ 1,032,750 2,799,615 2,932,474 18,797 - 936,201 2,539,924 2,715,859 5,301 - 20,667 56,006 56,307 526 - 3233 $3,0CI0 under $3,500 ..•...•....•....•• 740,545 2,386,658 2,367,224 12,839 - 693,715 2,235,907 2,246,162 6,778 - 8,554 27,732 25,090 645 - 3334 $3,500 under $4,000.................• 491,292 1,842,338 1,790,841 6,195 - 470,197 1,764,297 1,725,700 4,864 - 5,051 18,827 19,416 - - 3435 $4,000 under $4,500 .•...............• 243,145 1,030,931 966,505 4,800 - 231,626 982,829 927,406 4,800 - 4,520 18,971 16,301 - - 3536 $4,500 under $5,000•.•..............• 122,561 575,819 505,369 4,730 - 118,014 554,153 493,629 3,857 - (, ) (, ) (' ) - - 36
37 $5,000 under .$6,000 .•..............•• 80,831 435,963 367,494 4,275 - 79,814 430,263 366,274 3,709 - - - - - - 3738 $6,000 under $8,000 •.. ; ..•.....•..... 29,174 196,196 125,935 694 - 27,168 183,295 119,970 694 - - - - - - 3839 $8,000 under $10,000 •..•......•...••• ( ') (' ) (' ) - - (' ) ( ') (' ) - - - - - - - 3940 $10,000 or more •...............•..... 2,467 47,849 6,899 4,480 - 2,097 35,534 6,423 4,110 - 31 1,354 49 - - 40
41 Total nontaxable returns •.....• 14,113,948 319,552,545 26,330,952 104,558 - 8,001,010 315 ,242,997 20,347,879 39,353 - 547,456 3512 ,652 698,354 1,608 - 41
42 Grand total ••...........•.....• 56,747,008 3229,221,375 93,296,662 115,331,301 26,665,753 34,568,482 3176,477,817 74,205,527 86,038,669 19,993,821 2,298,981 36,203,322 2,407,178 3,239,780 755,692 42
43 Returns under $5,()()() .............•....• 42,151,721 3105,297,259 63,594,178 37,525,418 7,505,955 21,324,564 364,350,007 45,809,336 17,095,015 3,406,087 2,171,662 35 ,031,466 2,261,008 2,397,914 484,152 4344 Returns $5,OCK) or more •...............• 14,595,287 123,924,116 29,702,484 77,805,883 19,159,798 13,243,918 112,127,810 28,396,191 68,943,654 16,587,734 127,319 1,171,856 146,170 841,866 271,540 44
See footnotes at end of table. See text for individual returns for I1Explanation of Classifications and Terms" and for "Description of Sample and Limitations of Data."
......Zg~g>t'"
Z8is:t".:l
~
~~00
6~.....to~
~

Table IO.-ADJUSTED GROSS INCOME, EXEMPTIONS, TAXABLE INCOME, AND INCOME TAX, BY MARITAL STATUS OF TAXPAYER, BY RETURNS WlTR STANDARD OR ITEMIZED DEDUCTIONS,AND BY ADJUSTED GROSS INCOME CLASSES-{;o.,i.ued
PART I.-ALL RETURNS-Continued
Returns of heads of household Returns ·of surviving spouse Returns of single persons not head ofhousehold or surviving spouse
Ad justed gross income classesIncome tax Income tax Income tax
Adjusted Taxable liability Adjusted Taxable liability Adjusted Taxable liabilityNumber of gross income Exemption~ income after Number of gross income
Exemptionsincome after Number of gross income Exemptions income after
returns credits returns credits returns credits(Thousand (Thousand (Thoussnd (Thousand (Thoussnd (ThoUBlt1Id (Thousand (Thousand (ThoulJand (Thousand (TholJslJr1d (Thousanddollars) dollars) doJJsr3) dollsr3) dollBu) dollars) dollars) dollBr3) dollars) dollars) dollau) dolllJu)
(16) (17) (18) (19) (20) (21) (22) (23) (24) (25) (26) (27) (28) (29) (30)
Taxable returns:1 $600 under $1,000•..................• 13,516 11,434 8,110 1,963 395 (2) (2) (2) (2) (2) 1,195,857 998,416 717,514 175,205 34,963 12 $1,000 under $1,500.................. 46,039 58,985 34,826 17,357 3,475 2,500 2,894 1,500 937 186 2,079,175 2,588,585 1,324,804 969,064 193,618 23 $1,500 under $2,000.................. 50,078 R9,029 46,273 30,160 5,998 (2) (2) (2) (2) (2) 1,,764,620 3,068,302 1,283,736 1,412,148 281,198 34 $2,000 under $2,500.................. 70,587 159,339 80,228 57,658 11,421 5,000 10,953 5,399 4,187 838 1,840,639 4,137,296 1,468,824 2,155,406 428,357 4.5 $2,500 under $3,000.................• 94,108 259,018 119,237 101,147 20,043 7,506 21,042 10,500 6,995 1,396 1,637,238 4,488,563 1,328,918 2,612,594 519,316 56 $3,000 under $3,500.................. 116,618 379,499 139,332 184,954 36,873 5,551 18,263 6,961 7,421 1,404 1,474,848 4,785,640 1,246,426 2,959,451 594,219 67 $3,500 under $4,000.................• 120,224 451,600 151,155 237,825 47,415 (2) (2) (2) (2) (2) 1,103,178 4,127,982 934,251 2,699,621 548,055 78 $4,000 under $4,500.................. 109,235 461,699 138,288 259,108 51,863 (2) (2) (2) (2) (2) 761,299 3,221,085 645,335 2,174,963 .444,694 89 $4,500 under $5,000.................. 101,335 479,783 124,641 289,867 58,707 4,517 21,146 7,539 9,809 1,913 486,207 2,297,234 418,728 1,596,722 328,334 9
10 ¢5,000 under $6,000.................• 95,749 519,822 125,748 322,577 65,928 2,534 13,912 3,631 8,574 1,717 462,845 2,514,102 388,592 1,806,103 376,967 1011 $6,000 under $7,000.................• 38,230 247,141 50,400 164 ,230 34,215 2,534 16,438 3,961 10,756 2,190 200,851 1,290,708 168,671 950,201 204,065 1112 $7,000 under $8,000.................• 25,166 184,900 34,128 124,693 25,980 (2) (2) (2) (2) (2) 102,156 758,802 82,728 575,0'74 126,336 1213 $8,000 under $9,000........... ; ...... 7,615 63,895 9,409 44,478 9,460 - - - - - 56,131 472,560 49,087 359,886 80,987 1314 $9,000 under $10,000................• 8,135 77,627 10,033 58,172 13,005 - - - - - 29,940 282,325 28,905 215,245 49,814 14
15 $10,000 under $15,000................ 16,571 197,508 23,344 147,611 34,387 1,993 24,049 3,641 16,948 3,586 78,559 940,985 71,942 744,270 188,223 1516 $15,000 under $20,000 ................ 5,909 101,247 8,147 81,254 21,923 614 10,457 1,161 7,938 1,875 27,096 464,361 25,668 378,903 112,447 1617 $20,000 under $30,000................ 5,871 145,536 8,332 118,045 36,757 538 13,450 1,028 11,060 2,960 24,117 573,298 23,404 479,297 169,325 1718 $30,000 under $50,000................ 2,571 97,093 3,634 81,269 31,124 282 11,571 446 9,381 3,362 12,592 466,691 12,384 393,573 169,269 1819 $50,000 \.Ulder $100,000 .......••...... 1,150 76,715 1,753 64,587 30,848 132 8,889 201 7,583 3,506 6,202 417,976 6,525 347,511 182,741 19
20 $100,000 under $150,000.............. 203 23,949 292 19,286 10,602 25 2,880 37 2,515 1,467 1,217 146,276 1,285 118,985 72,817 2021 $150,000 under $200,000 .............. 64 11,067 93 8,633 5,245 12 2,063 23 1,611 903 392 67,874 410 54,448 35,194 2122 $200,000 under $500,000.............. 75 22,397 103 17,354 10,963 14 3,907 25 3,301 2,128 424 123,170 460 99,824 68,745 2223 $500,000 under $1,000,000............ 15 9,837 21 8,162 5,491 14 8,816 16 6,454 4,869 65 42,383 70 35,053 24,348 2324 $1,000,000 or more ................... 3 9,085 3 8,666 4,466 8 17,696 10 15,480 11,417 44 96,273 45 82,406 57,240 24
25 Total taxable returns .......... 929,067 4,138,205 1,117,530 2,449,056 576,584 39,304 234,235 52,994 144,243 48,385 13,345,692 38,370,887 10,228,712 23,395,953 5,291,272 25
Nontaxable returns:26 No adjusted gross income............. 2,583 12,995 2,497 - - (2) (2) (2) - - 121,678 1196,050 105,871 - - 26
27 Under $600........................... 41,093 15,166 34,000 - - (2) (2) (2) - - 3,083,085 995,849 2,038,495 - - 2728 $600 under $1,000.................... 23,555 18,393 25,282 - - 6,995 5,513 10,194 - - 943,557 704,298 910,581 142 - 2829 $1,000 under $1,500.................. 36,051 44,090 51,064 - - 6,523 7,821 8,117 58 - 640,474 778,485 851,166 2,935 - 2930 $1,500 under $2,000.................. 30,543 54,407 55,833 480 - 3,517 6,091 5,430 363 - 337,500 588,092 564,957 17,462 - 3031 $2,000 under $2,500 .................. 8,516 18,846 18,018 922 - (2) (2) (2) - - 131,652 292,035 257,818 19,710 - 31
32 $2,500 under $3,000 .................. 10,525 28,456 22,823 - - ( 2)~; l (2) - - 64,368 172,551 135,118 12,970 - 32
33 $3,000 under $3,500 .................. 3,000 9,525 9,899 - - (2) (2) (2) - 33,259 106,868 82,742 4,842 - 3334 $3,500 under $4,000.................. (2) ( 2) (2) - - (2) (2) (2) - - 14,027 51,893 39,384 1,331 - 3435 $4,000 under $4,500 .................• (2) (2) (2) - - (2) (2) (2) - - 4,499 18,893 14,699 - - 3536 $4,500 under $5,000...........•...... - - - - - - - - - - 4,040 19,204 9,003 873 - 36
37 $5,000 under $6,000.................. (2) (2) (2) - - - - - - - (2) (2) (2) (2) - 3738 $6,000 under $8,000 ......•......•.... (2) (2) (2) - - - - - - - (2) (2) (2) - - 3839 $8,000 under $10,000................. - - - - - - - - - - (2) (2) (2) - - 3940 $10,000 or more ...............•...... 7 520 11 - - 25 431 30 - - 307 10,012 386 371 - 40
41 Total nontaxable returns•...... 160,373 3205,973 234,724 1,402 - 24,616 336,007 36~176 995 - 5,380,493 33,554,919 5,013,819 61,202 - 41
42 Grand total•.....•........•...• 1,089,440 34,344,178 1,352,254 2,450,458 576,584 63,920 3270,242 89,170 145,238 48,385 18,726,185 341,925,806 15,242,531 23,457,155 5,291,272. 42
43 Returns under $5,000................... 881,106 32,549,824 1,073,204 1,181,441 236,190 53,189 3120,731 72,259 35,603 6,770 17,721,200 333,245,221 14,378,370 16,815,439 3,372,754 4344 Returns $5,000 or more ................. 208,334 1,794,354 279,050 1,269,017 340,394 10,731 149,511 16,911 109,635 41,615 1,004,985 8,680,585 864,161 6,641,716 1,918,518 44
See footnotes at end of table. See text for individual returns for "EXplanation of Classifications and Terms" and for "Description of Sample and Limitations of Data."
~
......ZSl<::......g>t"'......z8is:t':l
;;;:><:
~~en
d~......
~

1--
Tabla lO.-ADJUSTED GROSS INCOME, EXEMPTIONS, TAXABLE INCOME, AND INCOME TAX, BY MARITAL STATUS OF TAXPAYER, BY RETURNS WITH STANDARD OR ITEMIZED DEDUCTIONS, .AND BY ADJUSTED OROSS INCOME CLASSES-Conlinuad
PARr II.-RlITURNS WITH srANDARD DEDUCTION
Returns with standard deduction Joint returns of husbands and 'dYes Separate returns of husbands and wives
Income tax Inccme tax Income taxAdjusted gross L'1come classes Adjusted Taxable liability Adjusted Taxable liability Adjusted Taxable liability
Number of gross incomeExemptions income after Number of gross income Exemptions income after Number of gross income Exemptions income after
returns credits returns credits returns credits
, (Thocuand (ThoutJ/Uld (Thousand (Thou~tlnd (Thousand (TholJsand (ThoUIJlU1 d (Tholuand (ThouslI11d (Thousand (ThoU3411d (ThousandclolltJrs) dollllrlf) dol Ian) dollars) dollan) dollars) dollars) dollan) dollars) dollars) dollars) dol Ius)
(1) (2) (3) (4) (5) (6) (7) (8) (9) (10) (11) (12) (13) (14) (15)
Taxable returns:1 $600 under $1,000.................... 1,222,111 1,015,606 733,267 181,298 36,234 - - - - - 76,547 62,768 45,928 10,626 2,161 12 $1,CKX> under $1,500.................. 2,215,342 2,781,601 1,501,316 1,003,540 200,356 134,356 189 ,201 161,227 9,160 1,807 146,442 185,025 98,757 67,907 13,395 23 $1,500 under $2,0CXl.................. 2,038,198 3,546,812 1,659,906 1,533,383 305,.675 355,028 620,316 426,034 132,444 26,542 152,746 267,175 123,490 116,995 23,272 34 $2,CKX> under $2,500.................. 2,487,836 5,581,714 2,582,115 2,442,915 486,872 750,791 1,682,088 1,156,745 357,387 71,666 194,278 436,079 178,358 214,321 42,689 4
5 $2,500 under $3,000.................. 2,702,886 7,439,961 3,300,402 3,396,550 676,869 1,111,158 3,079,354 1,957,817 814,081 162,707 206,231 563,667 202,414 304,793 61,090 56 $3,000 under $3,500.................. 2,833,646 9,223,900 3,879,562 4,424,126 887,928 1,387,572 4,527,633 2,634,767 1,441,238 287,747 199,472 647,861 192,590 390,242 78,682 67 $3,500 under $4,000.................. 2,837,313 10,638,736 4,485,313 5,092,252 1,027,952 1,710,496 6,419,629 3,457,158 2,322,049 463,981 166,223 622,856 193,196 367,271 75,028 78 $4,000 under $4,500.................. 2,544,086 10,801,948 4,495,881 5,226,997 1,055,451 1,806,195 7,677,447 3,815,416 3,095,477 618,164 102,326 434,644 127,140 263,845 54,178 89 $4,500 under $5,000.................. 2,178,607 10,328,818 4,090,386 5,206,421 1,050,050 1,672,465 7,937,203 3,605,664 3,538,492 706,349 75,137 355,293 104,803 214,980 43,965 9
10 $5,000 under $6,000.................. 2,853,056 15,589,245 5,461,291 8,571,567 1,727,905 2,415,063 D,209,939 5,063,165 6,826,848 1,362,575 33,874 182,354 40,315 125,102 25,959 1011 $6,CKX> under $7,000.................. 1,848,080 11,937,346 3,589,329 7,156,925 1,449,950 1,664,014 10,756,120 3,420,357 6,260,866 1,257,239 13,268 84,878 16,109 62,135 13,244 1112 $7,CKX> under $B,OOO • •.••••.•••••••••• 1,151,930 8,578,393 2,194,249 5,528,023 1,DO,798 1,054,665 7,857,912 2,104,098 4,968,471 1,008,102 5,121 37,887 4,696 30,631 6,449 1213 $8,000 under $9,000.................. 686,841 5,810,994 1,300,836 3,931,075 814,103 637,158 5,391,349 1,257,449 3,595,044 738,192 5,087 42,623 6,057 34,022 7,075 1314 $9,000 under $10,CKX>................• 435,161 4,109,003 818,153 2,880,829 604,317 406,213 3,834,659 789,903 2,661,459 553,482 1,554 14,757 2,138 11,843 2,751 14
15 $10,CKX> under $15,000................ 644,037 7,544, Tl4 1,231,258 5,670,625 1,240,144 585,090 6,844,348 1,175,663 5,083,592 1,089,604 2,296 27,366 2,387 23,831 6,231 1516 $15,CKX> under $20,000.•.............. 138,211 2,356,443 273,024 1,945,608 474,167 123,542 2,107 ,390 259,439 1,724,408 406,599 801 13,312 830 12,081 3,757 1617 $20,CKX> under $30,000................ 74,811 1,766,136 147,860 1,543,721 431,448 66,000 1,557,955 139,587 1,352,369 361,971 512 11,823 512 11,055 4,026 1718 $30,000 under $50,000................ 23,681 858,909 47,151 788,112 271,986 21,051 766,285 44,745 700,488 233,593 68 2,536 73 2,429 1,089 1819 $50,CKX> under $100,000............... 4,951 314,438 10,014 299,480 134,257 4,448 281,125 .. 9,476 267,199 116,956 14 915 15 893 518 19
20 $100,000 under $150,000.............. 359 43,014 712 41,942 23,134 330 39,490 687 38,473 20,954 - - - - - 2021 $150,000 Wlder $200,000.............. 48 8,055 82 7,924 4,439 37 6,189 75 6,077 3,461 - - - - - 2122 $200,000 under $500,000 .............. 37 10,628 57 10,533 5,780 30 8,773 51 8,692 4,559 - - - - - 2223 $500,000 under $l,OCXl,OOO............ 1 579 1 576 463 1 579 1 577 463 - - - - - 2324 $l,CKX>,OOO or more ................... 1 1,101 2 1,098 944 1 1,102 2 1,098 944 - - - - - 24
25 Total taxable returns .......... 28,921,230 120,288,154 41,802,167 66,885,520 14,041,222 15,905,704 84,796,086 31,479,526 45,205,989 9,497,657 1,381,997 3,993,819 1,339,808 2,265,002 465,559 25
Nontaxable returns:26 No ad justed gross income ............. - - - - - - - - - - - - - - - 26
27 Under $600........................... 3,909,214 1,283,661 3,280,655 - - 548,890 195,220 1,037,006 - - 253,692 83,723 186,489 - - 2728 $600 under $1,000.................... 1,737,870 1,342,152 2,497,625 142 - 810,148 657,362 1,556,715 - - 78,133 57,802 82,838 - - 2829 $1,000 under $1,500.................. 1,894,746 2,325,491 3,433,344- 2,867 - 1,248,295 1,545,468 2,513,681 24 - 81,302 100,029 131,224 - - 2930 $1,500 under $2,000.................. 1,552,646 2,734,538 3,453,996 16,162 - 1,237,629 2,180,334 2,853,499 906 - 47,507 82,974 97,031 437 - 3031 $2,CKX> under $2,500.................. 1,016,074 2,300,359 2,776,953 19,937 - 907,885 2,058,008 2,520,037 3,847 - 20,677 47,289 54,481 - - 31
32 $2,500 under $3,000............... _... 820,482 2,214,915 2,485,833 8,083 - 760,602 2,054,925 2,323,755 3,539 - 17,667 47,799 52,108 - - 3233 $3,0CXl under $3,500.............••... 568,169 1,828,483 1,946,995 6,579 - 539,004 1,734,530 1,853,781 4,514 - 6,554 21,266 22,091 - - 3334 $3,500 under $4,000.................. 357,991 1,345,705 1,421,563 3,3Tl - 344,419 1,295,197 1,371,768 2,046 - 4,551 16,888 17,916 - - 3435 $4,000 under $4,500 ......... ......... 151,556 642,967 679,974 2,568 - 145,536 617,902 652,574 2,568 - 2,520 10,486 11,802 - - 3536 $4,500 Wlder $5,0CXl .................. 69,823 326,341 334,154 2,068 - 68,327 319,143 326,075 2,068 - (2) (2) (2) - - 36
37 $5,000 Wlder $6,OCXJ.................. 37,034 199,341 197 ,5'18 1,196 - 37,034 199,341 197,578 1,196 - - - - - - 3738 $6,000 under $8,000.................. 8,507 54 ,874 5i-,911 - - 8,007 51,839 51,911 - - - - - - - 3839 $8,000 under $10,000................. - - - - - - - - - - - - - - - 3940 $10,000 or more ...................... 71 816 391 361 - 71 816 391 361 - - - - - - 40
41 Total nontaxable returns ....... 12,124,183 16,599,643 22,563,972 63,340 - 6,655,847 12,910,085 17,258,771 21,069 - 513,110 470,718 658,717 437 - 41
42 Grand total•............•...... 41,045,413 136, B8? , 797 64,366,139 66,948,860 14,041,222 22,561,551 97,706,171 48,738,297 45,227,058 9,497,657 1,89',107 4,464,537 1,998,525 2,265,439 465,559 42
43 Returns Wlder $5,000................... 33,138,596 Tl,703,708 49,039,240 28,569,265 5,727,387 15,538,796 44,790,960 34,223,719 11,729,840 2,338,963 1,832,512 4,046,086 1,925,393 1,951,417 394,460 4344 Returns $5;000 or more ................. 7,906,817 59,184,089 15,326,899 38,379,595 8,313,835 7,022,755 52,915,211 14,514,578 33,497,218 7,158,694 62,595 418,451 73,132 314,022 71,099 44
See footnotes at end of table. See text for individual returns for "Explanation of Classifications and Terms ll and for IlDescription of Sample and Limitations of Data."
......z8<:6c:::>t""
Z8;s:t'j
>-3>><
~~en
d::0
"'"'(0
~
~

Table IO.-ADJUSTED GROSS INCOME, EXEMPTIONS, TAXABLE INCOME, AND INCOME TAX, BY MARITAL STATUS OF TAXPAYER, BY RETURNS WITH STANDARD OR ITEMIZED DEDUCTIONS, AND BY ADJUSTED GROSS INCOME CLASSES-Continuod
PART II. -RETURNS WITH STANDARD DEDUCTION-Continued
Returns of heads of household Returns of surviving spouseReturn::; of single persona not head of
household or surviving spouse
Income tax Income tax Income taxAdjusted gross income classes Adjusted Taxable liability Adjusted Taxable liability Adjusted Exemptions
Taxable liabilityNumber of gross income
Exemptions income after Number of gross income Exemptions income after Number of gross income income afterreturns credits returns credits returns credits
(TholJsand (l'Jousand (lJIolJ.JlI1ld (""olJs~d (Thousand (Thou.Jond (Thousand (Thous/md (Thousand (Thousand (Thousand (Thousand
dollars) dollars) dollars) dollars) dollars) dollars) dollars) dollars) dollars) dollars) dollars) dollars)
(16) (17) (18) (19) (20) (21) (22) (23) (24) (25) (26) (27) (28) (29) (30)
Taxable returns:1 $600 under $1,000 .................... 11,016 9,205 6,610 1,692 340 (' ) (' ) (' ) (' ) (' ) 1,133,548 942,887 680,129 168,905 33,719 12 $1,000 under $1,500.................. 41,522 53,514 32,116 16,004 3,205 (' ) (' ) (' ) (' ) (' ) 1,891,022 2,351,518 1,208,015 909,553 181,768 23 $1,500 under $2,000.................. 35,519 62,590 31,814 24,522 4,872 (' ) (' ) (' ) (' ) ( ') 1,494,881 2,596,686 1,078,553 1,259,395 250,985 34 $2,000 under $2,500.................. 53,065 119,225 61,915 45,386 9,023 3,500 7,825 3,599 3,448 690 1,486,202 3,336,497 1,181,497 1,822,373 362,804 4
5 $2,500 under $3,000.................. 58,061 160,407 76,601 67,861 13 ,475 4,006 11,387 6,001 4,255 849 1,323,430 3,625,147 1,057,569 2,205,560 438,748 56 $3,000 under $3,500 .................. 77,072 251,139 87,667 138,413 27,578 (' ) (' ) ( ') (' ) (' ) 1,169,030 3,795,546 963,338 2,453,891 493,853 67 $3,500 under $4,000 .................. 78.657 294,693 97,975 167,332 33,364 ( ') (' ) ( ') ( ') (' ) 880,937 3,297,738 735,184 2,233,957 455,250 78 $4,000 under $4,500 .................. 68,662 290,130 82,705 178,446 35,728 (' ) (' ) (' ) (, ) (' ) 566,403 2,397,707 470,020 1,688,016 347,139 89 $4,500 under $5,000 .................. 60,203 285,180 70,774 185,814 37,828 (' ) (' ) ( ') (' ) (' ) 368,802 1,741,813 305,847 1,262,042 260.918 9
10 $5,000 under $6,000.................. 63,732 345,979 80,729 230,678 47,275 ( ') ( ') ( ') (' ) ( ') 338,353 1,840,046 274,351 1,381,835 290,674 1011 $6,000 under $7,000•....••••.•••••.•• 29,197 188,065 38,960 130,311 27,176 (' ) ( ,) (' ) (' ) (' ) 139,567 895,302 110,542 695,290 150,616 1112 $7,000 under $8,0~0•.•.••..•••.•..•.• 20,589 151,687 28,621 107,906 22,554 ( ') (' ) ( ') ( ') (' ) 70,549 523,485 55,334 415,836 92,634 1213 $8 ,000 under $9,000••.•.••.•.••....•• 5,098 43,265 6,089 32,852 7,028 - - - - - 39,498 333,757 31,242 269,157 61,808 1314 $9,000 under $10,000................. 5,618 53,305 6,713 41,263 9,261 - - - - - 21,776 206,282 19,399 166,264 38,824 14
15 $10,000 under $15,000 ...............• 9,136 107,420 12,586 85,698 20,269 549 6,737 880 5,309 1,155 46,966 558,903 39,742 472,195 122,885 1516 $15,000 under $20,000...............• 2,590 44,615 3,140 38,885 11,029 192 3,150 346 2,612 616 11,086 187,976 9,268 167,622 52,166 1617 $20,000 under $30,000................ 1,225 29,009 1,639 26,145 8,486 143 3,446 314 2,989 808 6,931 163,903 5,809 151,162 56,157 1718 $30,000 under $50,000...............• 343 12,317 501 11,473 4,568 (' ) (' ) (' ) (' ) (' ) 2,183 76,478 1,758 72,535 32,327 1819 $50,000 under $100,000............... 79 4,766 110 4,578 2,252 21 1,334 34 1,278 564 389 26,298 378 25,532 13,967 19
20 $100,000 under $150,000 .............. - - - - - - - - - - 29 3,524 25 3,470 2,180 2021 $150,000 under $200,000.............. 2 333 2 329 190 - - - - - 9 1,533 5 1,518 788 2122 $200,000 under $500,008.............. 1 429 2 426 362 - - - - - 6 1,426 5 1,416 859 2223 $500,000 under $1,000,000............ - - - - - - - - - - - - - - - 2324 $1,000,000 or more ................... - - - - - - - - - - - - - - - 24
25 Total taxable returns .......... 621,387 2,507,273 727,269 1,536,014 325,863 20,545 86,520 27,551 50,987 11,078 10,991,597 28,904,452 8,228,010 17,827,524 3,741,069 25
Nontaxable returns:26 No adjusted gross income ............. - - - - - - - - - - - - - - - 26
27 Under $600........................... 40,093 14,996 33,100 - - (' ) (, ) (' ) - - 3,064,536 988,648 2,022,559 - - 2728 $600 under $1,000 .................... 20,538 15,821 23,162 - - 6,495 5,077 9,594 - - 822,556 606,089 825,316 142 - 2829 $1,000 under $1,500.•...............• 30.556 36,897 45,080 - - 5,506 6,565 7,207 58 - 529,087 636,530 736,153 2,784 - 2930 $1,500 under $2,000.................. 24~027 42,597 48,023 420 - 2,517 4,313 4,230 363 - 240,966 424,320 451,213 14,037 - 3031 $2,000 under $2,500.................. 5,999 13,132 14,398 497 - (' ) (' ) (' ) - - 80,996 180,842 186,794 15,594 - 31
32 $2,500 under $3,000.................. 4,492 12,221 12,573 - - ( ') ( ') (' ) - - 37,232 98,653 95,930 4,544 - 3233 $3,000 under $3,500•................. 2,500 7,984 8,699 - - ( ') ( ') (' ) ( ') - 19,611 63,058 61,524 1,491 - 3334 $3,500 under $4,000 ..•.............•• ( ') (' ) ( ') - - - - - - - 8,021 29,983 28,279 1,331 - 3435 $4 , 000 under $4, 500 ................•. ( ') (' ) ( ') - - - - - - - 2,500 10,451 10,799 - - 3536 $4,500 under $5,000 .......•.....•...• - - - - - - - - - - (, ) ( ') ( ') - - 36
37 $5,000 under $6,000 .••..............• - - - - - - - - - - - - - - - 3738 $6,000 under $8,000.................. (' ) (' ) (' ) - - - - - - - - - - - - 3839 $8,000 under $10,000 ...•.........•.•. - - - - - - - - - - - - - - - 3940 $10,000 or more ...................•.• - - - - - - - - - - - - - - - 40
41 Total nontaxable returns .•..... 130,705 154,449 196,432 917 - 18,027 21,081 26,142 995 - 4,806,494 3,043,310 4,423,909 39,923 - 41
42 Grand total ...•................ 752,092 2,661,722 923,701 1,536,931 325,863 38,572 107,601 53,693 51,982 11,078 15,798,091 31,947,762 12,651,919 17,867,447 3,741,069 42
43 Retu.rns under $5,000 .•....•...........• 613,982 1,677,497 741,610 826,387 165,413 32,557 60,310 44,455 18,001 3,369 15,120,749 27,128,849 12,104,061 14,043,615 2,825,184 4344 Returns $5,000 or more .......•...•....• 138,110 984,225 182,091 710,544 160,450 6,015 47,291 9,238 33,981 7,709 677,342 4,818,913 547,858 3,823,832 915,885 44
See footnotes at end of table. See text for individual returns for "Explanation of Cla::;sifications and Tenns ll and for "Description of Sample and Limitations of Data. n
R5
......ZSl::12>t'"......Z("')
~M
~><~
~c::::
~00-
d~
......~
~

Tabl. IO.-ADJUSTED GROSS INCOME, EXEMPTIONS, TAXABLE L~COME, AND INCOME TAX, BY MARITAL STATUS OF TAXPAYER, BY RETURNS WITH STANDARD OR ITEMIZED DEDUCTIONS, AND BY ADJUSTED GROSS INCOME CLASSES-Con~nuod
P!\RT I II. -fl5TURNS 'NITH ITEMIZED DEDUCTIONS
Returns with itemized deductions Joint returns of husbands and wi ves Separate returns of husbands and wives
Income tax Income tax Income taxAdjusted gross income classes Adjusted
ExemptionsTaxable liability Adjusted Exemptions Taxable liability Adjusted Exemptions
Taxable liabilityNumber of gross income income after Number of gross income income after Number of gross income income after
returns credits returns credits returns credi ts
(Thousand (Thousand (Thousand (Thousand (Thou5tmd (11Iou:1lmd (Thousand (Thousand (Thousand (ThQusand (Thoustmd (ntousanddollars) dollllrl,) dollars) dollars) dollars) dol Ian) dol/us) dol1Brs) dollus) dol IBn) dollBrs) dollars)
(1) (2) (3) (4) ( 5) (6) (7) (8) (9) (10) (11) (12) (13) (14) ( 15)
Taxable returns:1 $600 UI1der $1,000.................... 70,877 63,192 42,526 7,147 1,414 - - - - - 6,068 5,433 3,641 575 115 12 $1,000 under $1,500.................. 211,328 266,386 132,824 66,073 13,163 2,551 3,573 3,061 188 38 15,607 19,722 9,964 4,999 1,000 23 $1,500 under $2,000.................. 393,034 691,011 335,069 195,413 38,960 74,131 132,066 88,961 16,573 3,546 34,605 60,889 26,466 20,449 4,075 34 $2,000 under $2,500.................. 590,723 1,341,012 595,934 447,587 88,308 183,132 419,936 258,064 72,535 14,426 34,132 77,034 30,430 29,008 5,782 4
5 $2,500 under $3,000 .................... 749,143 2,065,264 910,303 710,530 140,978 352,770 975,438 554,312 214,073 42,645 43,018 118,142 37,507 53,397 10,649 56 $3,000 under $3,500.................. 1,033,784 3,368,740 1,504,141 1,169,915 232,676 626,233 2,047,497 1,109,758 516,626 102,786 57,136 186,245 53,869 94,108 18,892 67 $3,500 under $4,()()() ................... 1,219,794 4,581,113 2,042,360 1,600,600 318,739 909,321 3,417,667 1,738,274 977,823 194,428 46,165 174,314 51,239 85,695 1'7,289 78 $4,()()() under $4,500.................. 1,415,523 6,016,695 2,643,165 2,177,214 434,524 1,139,521 4,849,781 2,362,438 1,524,726 303,633 40,033 169,720 49,229 83,500 16,925 89 $4,500 under $5,()()() ................... 1,407,038 6,681,374 2,831,498 2,548,348 509,806 1,217,913 5,786,232 2,626,828 2,031,303 405,622 28,071 133,301 33,682 73,595 14,965 9
10 $5,()()() under $6,()()() .................. 2,255,312 12,321,563 4,801,424 5,210,812 1,042,204 2,0'76,102 11,348,999 4,617,388 4,619,118 921,645 22,201 121,679 23,876 74,057 15,319 1011 $6,0Cl0 under $7,()()() .................. 1,483,371 9,587,108 3,173,984 4,664,137 935,453 1,399,422 9,044,511 3,087,202 4,320,342 863,306 13,132 84,658 16,613 52,532 11,144 1112 $7,0Cl0 under $8,()()() ................... 856,123 6,383,513 1,822,633 3,416,461 689,799 811,246 6,050,844 1,780,791 3,204,263 644,875 7,693 56,609 7,741 33,320 7,220 1213 $8,OCIO under $9,()()() .................. 499,880 4,221,040 1,058,366 2,393,344- 487,174 475,536 4,017,766 1,031,259 2,261,329 458,855 5,194 43,840 5,942 29,661 6,707 1314 $9,000 under $10,()()() ................• 285,485 2,699,270 618,096 1,599,119 328,675 272,641 2,578,231 602,097 1,519,206 310,695 2,163 20,674 3,173 14,023 3,246 14
15 $1O,()()() under $15 ,()()() ................ 571,445 6,845,784 1,221,334 4,425,726 945,022 524,367 6,276,336 1,168,453 4,020,616 847,962 6,606 79,966 7,162 59,483 15,173 1516 $15,()()() under $20,000................ 230,281 3,959,864 495,136 2,862,568 671,422 207,538 3,568,511 469,637 2,562,762 586,778 2,992 51,029 3,277 40,830 12,210 1617 $20,0CI0 under $30,000................ 216,857 5,252,827 465,522 4,067,048 1,090,435 192,223 4,658,120 437,859 3,591,310 929,820 2,402 58,781 2,660 47,632 17,024 1718 $30,000 under $50,000................ 138,216 5,208,818 295,636 4,264,003 1,411,995 123,924 4,670,841 279,947 3,821,875 1,227,073 1,409 52,710 1,556 43,100 18,471 1819 $50,()()() under $100,000................ 65,381 4,337,356 136,996 3,646,788 1,574,453 57,769 3,825,704 128,389 3,225,153 1,356,696 617 40,470 651 33,342 17,445 19
20 $100,000 under $150,000.............. 11,258 1,346,755 22,740 1,128,387 591,421 9,711 1,161,396 21,014 977,740 500,772 131 15,778 137 13,330 7,942 2021 $150,000 under $200,000.............. 3,144 538,896 6,289 444,526 252,575 2,656 454,472 5,733 377,301 209 ,455 31 5,286 37 4,380 2,757 2122 $200,000 under $500,()()() .............. 3,197 905,132 6,406 729,964 449,583 2,626 738,748 5,745 596,844 358,744 65 18,764 80 14,483 10,225 2223 $500,000 under $l,()()(),OClO............ 436 292,532 809 234,278 154,322 321 216,200 673 172,879 110,420 21 15,296 29 11,730 9,195 2324 $l,()()(),OOO or more ................... 200 405,431 352 331,235 221,430 109 195,866 239 168,742 101,944 36 86,511 55 55,941 46,363 24
25 Total taxable returns .......... 13,711,830 89,380,676 25,163,543 48,341,223 12,624,531 10,661,768 76,438,735 22,378,122 40,793,327 10,496,164 369,528 1,696,851 369,016 973,170 290,133 25
Nontaxable returns:26 No adjusted gross income ............. 440,304 1.1,014,480 723,910 - - 309,432 '802,982 610,354 - - 6,098 1.11,962 4,866 - - 26
27 Under $6CXJ ........................... 30,603 11,155 36,979 - - 9,520 3,415 18,012 - - (' ) (' ) ( ') - - 2728 $6(X) under $1,()()() .................... 149,683 121,718 126,454 - - 20,114 16,316 35,438 - - 5,051 4,185 3,031 - - 2829 $1,()()() under $1,500.................. 199,179 257,250 235,999 151 - 74,240 97,856 107 ,159 - - 7,040 8,990 6,934 - - 2930 $1,500 under $2,()()() .................. 222,800 385,260 314,759 3,656 - 114,199 199,932 186,244 171 - 4,551 7,968 5,761 - - 3031 $2,0CI0 under $2,500.................. 217,040 480,911 385,123 4,833 - 160,826 356,907 305,911 292 - 2,541 5,933 3,668 - - 31
32 $2,500 under $3,000..................... 212,268 584,700 446,641 10,714 - 175,599 484,999 392,104 1,762 - 3,000 8,207 4,199 526 - 3233 $3,()()() under $3,500 ................... 172,376 558,175 420,229 6,260 - 154,711 501,377 392,381 2,264 - (' ) ( ') (' ) (' ) - 3334 $3,500 under $4,()()() ..................... 133,301 496,633 369,278 2,818 - 125,778 469,100 353,932 2,818 - (' ) ( ') (' ) - - 3435 $4,000 under $4,500 ..................... 91,589 387 ,964 286,531 2,232 - 86,090 364,927 274,832 2,232 - (' ) ( ,) (' ) - - 3536 $4,500 under $5,()()() ................... 52,738 249,478 171,215 2,662 - 49,687 235,010 167,554 1,789 - - - - - - 36
37 $5,()()() under $6,()()() .................. 43,797 236,622 169,916 3,079 - 42,780 230.922 168,696 2,513 - - - - - - 3738 $6,000 under $8,()()() ................... 20,667 141,322 71,024 694 - 19,161 131:456 Q. 68,059 694 - - - - - - 3839 $8,000 under $10,000 ................. (' ) (' ) (' ) - - (' ) (' ) (' ) - - - - - - - 3940 $10,000 or more ............. : ........ 2,396 47,033 6,508 4,119 - 2,026 34,718 6,032 3,749 - 31 1,354 49 - - 40
41 Total nontaxable returns ....... 1,989,765 32 ,952,902 3,766,980 41,218 - 1,345,163 32,332,911 3,089,108 18,284 - 34,346 341,934 39,637 1,171 - 41
42 Grand tota 1..................... 15,701,595 392,333,578 28,930,523 48,382,441 12,624,531 12,006,931 378,771,646 25,467,230 40,811,611 10,496,164 403,874 31,738,785 408,653 974,341 290,133 42
43 Returns under $5,000................... 9,013,125 327 ,593,551 14,554,938 8,956,153 1,778,568 5,785,768 319,559,047 11,585,617 5,365,175 1,067,124 339,150 3985,380 335,615 446,497 89,692 4344 Returns $5,000 or more ................. 6,688,470 64,740,027 14,375,585 39,426,288 10,845,963 6,221,163 59,212,599 13,881,613 35,446,436 9,429,040 64,724 753,405 73,038 527,844 200,441 44
See footnotes at end of table. See text for individual returns for "Explanation of Classifications and Terms" and for lIDescription of Sample and Limitations of Data. 11
......Zt:::I<g>t""
Z88:t'=j
~~
~~UJ.
6~......c.o~
mCA:l

Table IO.-ADJUSTED OROSS INCDME, EXEMPTIONS, TAXABLE INCOME, AND INCOME TAX, BY MARITAL STATUS OF TAXPAYER, BY RETURNS WITH STANDARD· OR ITEMIZED DEDUCTIONS, AND BY ADJUSTED OROSS INCOME CLASSES-Coetinuod
PART 1I1.-RErURNs WITH ITEMIZED DEDUCTIONS-Continued
Returns of heads of household Returns of surviving spouse Returns of single persons not head ofhousehold or surviving spouse
Adjusted gross income· classes Income tax Income tax Income taxAdjusted Exemptions Taxable liability Adjusted Exemptions Taxable liability Adjusted Exemptions Taxable liability
Number of gross income income after Number of gross income income after Number of gross income income afterreturns credits returns credits returns credits
(Thou3and (7'houund (7'hou3and (Thou3and (Thou:'Iand (7'hou3and (Thousand (Thou3and (7'hou3and (Thou3and (7'hou3alld (7'hou3and
dollars) dol lara) dollars) dollars) dollar3) dollars) dollars) dollars) dollau) dollan) dollars) dollars)
(16) (17) ( 18) (19) (20) (21) (22) (23) (24) (25) (26) (27) (28) (29) (30)
Taxable returns;1 $600 under $1,000•.••.•.•••..•••••••• 2,500 2,229 1,500 271 55 0 - - - - 62,309 55,529 37,385 6,300 1,244 12 $1,000 under $1,500................•. 4,517 5,471 2,710 1,353 270 (2 ) (2 ) (2 ) ( 2) (2 ) 188.153, 237.067 116,789 59,511 11,850 23 $1,500 under $2,000•...............•• 14,559 26,439 14,459 5,638 1,126 - - - - - 269.739 471,616 205.183 152,753 30.213 34 $2,000 under $2,500.................. 17,522 40,114 18,313 12,272 2,398 (2 ) (2 ) ( 2) ( 2) (2 ) 354 ,437 800,799 287.327 333,033 65,553 4
5 $2,500 under $3,000....•....••....... 36,047 98,611 42,636 33.286 6.568 3,500 9.655 4,499 2.740 547 313,808 863,416 271.349 407 .034 80,568 56 $3,000 under $3,500............•.•... 39,546 128,360 51,665 46,541 9.295 5,051 16,545 5,761 7,080 1,337 305,818 990.094 283,088 505.560 100,366 67 $3,500 under $4,000..........•.•..... 41,567 156,907 53,180 70,493 14,051 (2 ) ( 2) .. (2) (2 ) (2 ) 222,241 830,244 199,067 465,664 92.805 78 $4,000 under $4,500.................. 40,573 171,569 55,583 80,662 16,135 (2 ) ( 2) (2 ) (2 ) (2 ) 194,896 823,378 175,315 486,947 97,555 89 $4,500 under $5,000............•.••.. 41,132 194,603 53,867 104 ,053 20,879 2,517 11,818 4,240 4,716 923 117,405 555,421 112,881 334,680 67,416 9
10 $5,000 under $6,000•.......•...•.•.•. 32,017 173.843 45,019 91,899 18,653 (2 ) (2 ) (2 ) ( 2) (2 ) 124,492 674,056 114,241 424,268 86.293 1011 $6,000 under $7,000.................• 9,033 59,076 11,440 33,919 7,039 (2 ) ( 2) (2 ) (2 ) (2 ) 61,284 395,406 58,129 254,911 53,449 1112 $7,000 under $8,000•...•............• 4,577 33,213 5,507 16.787 3.426 (2 ) ( 2) (2 ) ( 2) ( 2) 31,607 235,317 27.394 159.238 33,702 1213 $8,000 under $9,000................••. 2,517 20,630 3,320 11,626 2,432 - - - 0 - 16,633 138,803 17,845 90,729 19,179 1314 $9,000 under $10,000................. 2,517 24,322 3,320 16,909 3,744 - - - - - 8.164 76,043 9.506 48,981 10,990 14
15 $10,000 under $15,000................ 7.435 90,088 10.758 61,913 14,118 1,444 17,312 2,761 11,639 2,431 31,593 382,082 32,200 272,075 65,338 1516 $15,000 under $20.000................ 3,319 56,632 5.007 42,369 10,894 422 7,307 815 5,326 1,259 16,010 276,385 16,400 211,281 60.281 1617 $20,000 under $30,000................ 4,646 116,527 6,693 91,900 28.271 395 10,004 714 8,071 2,152 17,186 409,395 17,595 328,135 113,168 1718 $30,000 under $50,000................ 2,228 84,776 3,133 69.796 26,556 246 10,278 375 8,195 2,954 10,409 390,213 10,626 321,038 136,942 1819 $50,000 under $100,000............... 1,071 71,949 1,643 60,009 28,596 111 7,555 167 6,305 2,942 5,813 391,678 6,147 321,979 168,774 19
20 $100.000 under $150,000.............. 203 23,949 292 19,286 10,602 25 2,880 37 2,515 1,467 1,188 142,752 1,260 115,515 70,637 2021 $150.000 under $200.000.............. 62 10,734 91 8,304 5,055 12 2,063 23 1,611 903 383 66,341 405 52.930 34,406 2122 $200.000 under $500.000.............. 74 21,968 101 16,928 10.601 14 3,907 25 3,301 2.128 418 121,744 455 98.408 67.886 2223 $500,000 under $1,000,000............ 15 9,837 21 8.162 5,491 14 8,816 16 6.454 4,869 65 42.383 70 35.053 24.348 2324 $1,000,000 or more ................•.• 3 9,085 3 8,666 4,466 8 17,696 10 15,480 11,417 44 96,273 45 82,406 57.241 24
25 Total taxable returns •........• 307,680 1,630,932 390.261 913,042 250,721 18,759 147,715 25,443 93,256 37,307 2,354,095 9,466,435 2,000,702 5.568,429 1,550,203 25
Nontaxable returns:26 No adjusted gross income•............ 2,583 12,995 2,497 - 0 ( 2) ( 2) (2 ) - - 121,678 1196,050 105,871 - - 26
27 Under $600....... , ................... (2 ) (2 ) (2 ) - - - - - - - 18,549 7,201 15,936 - - 2728 $600 under $1.000.................... 3,017 2,572 2,120 - - (2) (2 ) ( 2) - - 121,001 98,209 85,265 - - 2829 $1,000 under $1,500...................... 5,495 7,193 5,984 - - ( 2) (2 ) ( 2) - - 111,387 141.955 115,013 151 - 2930 $1,500 under $2,000.................. 6,516 11;810 7,810 60 - (2 ) (2 ) (2 ) - - 96,534 163,772 113,744 3,425 - 3031 $2,000 under $2,500.................. 2,517 5,714 3,620 425 - (2 ) (2 ) (2 ) - - 50.656 111,193 71,024 4,116 - 31
32 $2,500 under $3,000.................. (~1033 16,235 10,250 0 - (2 ) (2 ) ( 2) - - 27,136 73,898 39,188 8.426 - 3233 $3,000 under $3,500.................. ( 2) ( 2) - - (2 ) (2 ) (2 ) - - 13,648 43,810 21,218 3,351 - 3334 $3,500 under $4,000................. , (.2) ( 2) ( 2) - 0 (2 ) (2 ) (2 ) - - 6,006 21,910 11,105 - - 3435 $4,000 under $4,500.................. (2 ) (2 ) (2 ) - 0 ( 2) (2) (2 ) - - 1,999 8,442 3,900 - - 3536 $4,500 under $5,000.................. - - - - - - - - - - 3,051 14,468 3,661 873 - 36
37 $5,000 under $6,000 .................... ( 2) (2 ) ( 2) - 0 - 0 - - - (2 ) ( 2) ( 2) ( 2) - 3738 $6,000 under $8.000.................. 0 - - - - - - - - (2 ) ( 2) ( 2) - - 3839 $8,000 under $10,000 ..................... 0 - - - - - - - - - (2 ) ( 2) ( 2) - - 3940 $10.000 or more ....................... 7 520 11 - - 25 431 30 - - 307 10.012 386 371 - 40
41 Total nontaxable returns ......... 29,668 351,524 38.292 485 - 6,589 314,926 10,034 - - 573,999 3511,609 589.910 21,279 - 41
42 Grand total ....................... 337,348 31,682,456 428,553 913.527 250,721 25,348' 3162,641 35,477 93,256 37,307 2,928,094 39,978,044 2,590,612 5,589,708 1,550.203 42
43 Returns under $5,000.................... 267.124 '872,327 331,594 355,054 70,777 20,632 360,421 27,804 17,602 3,401 2.600,451 36,116,372 2,274,309 2,771,824 547,570 4344 Returns $5,000 or more .................... 70.224 810,129 96,959 558,473 179,944 4,716 102,220 7,673 75,654 33,906 327,643 3,861,672 316,303 2,817,884 1,002,633 44
See text for individual returns for "Explanation of Classifications and Tenns" and for "Description of Sample and Limitations of Data."1AdJu!3ted gross deficit.2Samp le variability of this item is too large to warrant showing it separately. However, this value is included in each totaL3AdJusted gross income less adjusted gross deficit.
~
.....Z
~g>t"".....Z
~tz:j
~
~~en
d~
......CO
~

Tabl. It.-EXEMPTIONS BY MARITAL STATUS OF TAXPAYER AND BY ADoIUSTED GROSS INCOME CLASSES
All returns Joint returns of husbands and wives
Re turns wi th Number of returns by number of exemptions other than age Dr blindness Returns withexemptions for exemptions for
age and/or blindness Number of Six or lDOre age and/or blindnessAdjusted gross income classes Total Total exemptions Number of
Aggregate
number of number of Number of other than Number of returnsnumber of Number of
returns exemptions exemptions age or One Two Three Four Five exemptions exemptions exemptionsNumber of
for blindness Number of other thanNumber of
forreturns returns returns
age and age or age andblindness blindness blindness
(I) (2) (3) (4) (5) (6) (7) (8) (9) (1O) (11) (I2) (13) (14) (15) (16)
Taxable returns:I $600 under $1,000................ 1,292,988 1,292,988 - - 1,292,988 1,292,988 - - - - - - - - - - 12 $1,000 under $1,500.............. 2,426,670 2,723,566 46,697 46,697 2,676.869 2,176,471 250,199 - - - - - 136,907 273,814 - - 23 $1,500 under $2 ,000.............. 2,431,232 3,324,951 144,668 144,668 3,180,283 1,682,181 749,051 - - - - - 429,159 858,318 - - 34 $2,000 under $2,500 .............. 3,078,559 5,296,748 204,360 204,360 5,092,388 1,640,940 861,409 576,210 - - - - 933,923 2,358,015 78,464 78,464 4
5 $2,500 under $3,000.............. 3,452,029 7,017,841 257,467 297,605 6,720,236 1,489,264 990,407 639,274 333,084 - - - 1,463,928 4,186,882 144,813 183,951 56 $3,OCKJ under $3,500.............. 3,867,430 8,972,838 291,521 367,054 8,605,784 1,329,599 1,128,974 710,943 604,162 93,752 - - 2,013,805 6,240,875 185,659 259,172 67 $3.500 under $4,000.............. 4,057,107 10,879,455 262,502 334,918 10,544,537 994,506 1,120,056 843,623 715,560 383,362 - - 2,619,817 8,659,053 192,202 264,118 78 $4,OCKJ under $4,500.............. 3,959,609 11,898,410 220,967 286,848 11,611,562 686,271 1,073,016 794,784 800,918 436,487 168,133 1,008,800 2,945,716 10,296,423 163,051 228,414 89 $4,500 under $5,()(X).............. 3,585,645 11,536,474 187,577 237,865 11,298,609 461,423 923,139 743,029 798,953 428,846 230,255 1,421,779 2,890,378 10,387,486 140,178 189,449 9
10 $5,()(X) under $6,()(X).............. 5,108,368 17,104,525 201,151 255,411 16,849,114 414,485 1,377,558 1,114,477 1,169,368 670,585 361,895 2,305,685 4,491,165 16,134,255 155,179 208,438 1011 $6,(X)() under $7 ,()(X).............. 3,331,451 11,272 ,189 119,525 146,277 11,125,912 190,101 954,003 760,484 774,204 406,899 245,760 1,615,042 3,063,436 10,845,932 87,794 114 ,546 1112 $7,(X)() under iB,()(X) .............. 2,008,053 6,694,804 85,052 113,725 6,581,0'79 104,682 634,686 448,510 447,30'1 233,260 139,608 905,967 1,865,911 6,474,815 62 ,878 91,051 1213 $8,(X)() under $9,CXXJ.............. 1,186,721 3,932.004 63,636 82,316 3,849,688 55,295 401,980 257,215 266,487 127,323 78,421 516,225 1,112,694 3,814,513 49,506 67,186 1314 $9,000 under $10,000............. 720,646 2,393,749 38,518 52,670 2,341,0'79 25,029 261,327 156,893 146,269 79,488 51,640 340,201 678,854 2,320,000 30,388 44,540 14
15 $10,000 under $15,000............ 1,215,482 4,087,654 108,848 144,467 3,943,187 79,624 385,528 252,477 270,631 145,671 81,551 524,197 1,109,457 3,906,860 74,660 lo:J,425 1516 $15,()(X) under $20,OClO............ J68,492 1,280,266 45,430 61,367 1,218,899 28,062 109 ,837 72,934 79 ,635 49,051 28,973 188,566 331,080 1,215,127 32,220 48,015 1617 $20,000 under $30,000............ 291,668 1,022,304 42,001 56,696 965,608 24,513 86,214 54,814 62,597 39 ,103 24,427 158,322 258,228 962,410 28,744 43,345 1718 $30,()(X) under $50,()(X) ............ 161,897 571,310 26,734 36,776 534,534 13,099 50,868 29,686 32,878 21,105 14,261 93,604 144,975 541,154 19,627 29 ,60'1 1819 $50,()(X) under $loo,(X)()........... 70,332 245,016 15,755 21,520 223,496 6,408 24,950 12 ,354 12,576 7,994 6,050 39 ,852 62,217 229,775 11,558 17,240 19
20 $loo,()(X) under $150,()(X) .......... 11,617 39,087 3,347 4,497 34,590 1,317 4,633 1,919 1,865 1,018 865 5,700 10,041 36,168 2.409 3,554 2021 $150, (X)() under $200, ()(X) . ......... 3,192 10,619 1,043 1,437 9,182 403 1,374 496 410 282 227 1,493 2,693 9,680 774 1,166 2122 $200,000 under $500,000.......... 3,234 10,772 1,148 1,571 9,201 462 1,417 453 387 272 243 1,638 2,656 9.660 814 1,232 2223 $5oo,()(X) under $1,000,000........ 437 1,350 185 247 1,103 95 196 59 36 31 20 140 322 1,123 112 174 2324 $1,()(X),000 or more ............... 201 590 82 106 484 71 61 29 15 13 12 79 110 402 38 62 24
25 Total taxable returns ...... 42,633,060 111,609,510 2,368,214 2,899,098 108,710,412 12,697,289 11,390,883 7,470,663 6,517,342 3,124,542 1,432,341 9,127,290 26,567,472 89,762,740 1,461,068 1,983,149 25
Nontaxable returns:26 No adjusted grosa income ......... 440.304 1,206,517 71,338 89,957 1,116,560 111,082 164,793 63,218 49,847 34·,JJ5 17 ,029 115,175 309,432 1,017,257 42,787 61,406 26
27 Under $600 ....................... 3,939,817 5,529,390 296,871 361,886 5,167,504 3,244,363 410,225 145,635 78,619 33,643 27,332 183,095 558,410 1,758,363 127,199 190,697 2728 $600 under $1,000................ 1,887,553 4,373,465 464,836 577,049 3,796,416 777,057 688,086 220,892 101,820 54,042 45,656 303,021 830,262 2,653,589 192,164 302,388 2829 $1 1 0Cl0 under $1,500.............. 2,093.925 6,115,572 543,777 681,105 5,434,467 30'1,788 943,936 453,965 206,454 103,502 78,280 533,586 1,322,535 4,368,067 264,685 399,517 2930 $1,500 under $2,OClO.............. 1,775,/.46 6,281,259 422,348 579,176 5,702,083 109,521 394,384 715,574 314,284 139,797 101,886 700,951 1,351,828 5,066,239 310,473 464,313 3031 $2,000 under $2,500.............. 1,233,114 5,270,126 253,625 389,590 4,880,536 46,261 205,490 113 ,143 515,547 205,472 147,201 994,318 1,068,711 4,709,914 204,341 337,265 31
32 $2,500 under $3,000.............. 1,032,750 4,887,457 144 ,270 229,183 4,658,274 20,163 111,067 61,871 324,584 J04,303 210,762 1,410,513 936,201 4,526,431 124,599 209,005 3233 $3,(X)() under $3,500......... ; .... 740,545 3,945,373 63,020 98,215 3,847,158 9,086 41,866 20,187 71,605 330,178 267,623 1,756,469 693,715 3,743,604 51,888 85,583 3334 $3,500 under $4,()(X) .............. 491,292 2,984,735 24,732 36,869 2,947,866 3,506 14,667 6,551 25,728 77,893 362,947 2,402,996 470,197 2,876,166 20,209 31,329 3435 $4,CXXJ under $4,500.............. 243,145 1,610,841 11,152 18,247 1,592,594 (1) 10,633 (') 11 ,526 22,760 195,238 1,405,458 231,626 1,545,677 10,652 17,747 3536 $4,500 under $5,000.............. 122,561 842,281 8,614 12,661 829,620 (I) 6,102 2,559 3,017 10,016 98,833 745,557 118,014 822,715 7,097 11,144 36
37 $5,CXXJ under $6,000.............. 80,831 612,490 3,051 6,084 606,406 (') 5,035 (1) 2,500 4,071 68,208 563,964 79,814 610,456 2,534 5,567 3738 $6,000 under $8,000.............. 29,174 209,891 2,517 5,033 204,858 (I) 4,517 (') 2,517 (1) 18,645 173,327 27,168 199,950 2,517· 5,033 3839 $8,000 under $10,000............. 1,024 4,024 - - 4,024 (1) - (I) - (1) - - (I) (I) - - 3940 $10,000 or ~re .................. 2,467 11,498 342 402 11,096 238 342 456 278 339 814 5,999 2,097 10,705 201 261 40
41 Total nontaxable returns ... 14,113,948 43,884,919 2,310,493 3,085,457 40,799,462 4,633,656 3,001,143 1,808,029 1,708,326 1,322,340 1,640,454 11,294,429 8,001,010 33,913,133 1,361,346 2,121,255 41
42 Grand total ................ 56,747,008 155,494,429 4,678,707 5,984,555 149,509,874 17,330,945 14,392,026 9,278,692 8,225,668 4,446,882 3,072,795 20,421,719 34,568,482 123,675,873 2,822,414 4,104,404 42
43 Returns under $5,000 .... ~ .......... 42,151,721 105,990,287 3,920,342 4,993,953 100,996,334 16,J86,00J 10,087,500 6,112,947 4,955,708 2,658,388 1,951,175 12,981,718 21,324,564 76,348,888 2,260,461 3,313,962 4344 Returns $5,000 or more ............. 14,595,287 49,504,142 758,365 990,602 48,513,540 944,942 4,304,526 3,165,745 3,269,960 1,788,494 1,121,620 7,440,001 13,243,918 47,326,985 561,953 790,442 44
See footnotes at end of table. See text for individual returns for "Explanation of Classifications and Terms" and for "Description of Sample and Limitations of Data. 11
......Zt:l......<:......t:lc::::>t"'......
~~t<j
~><
~~en
d~~~
~
0)01
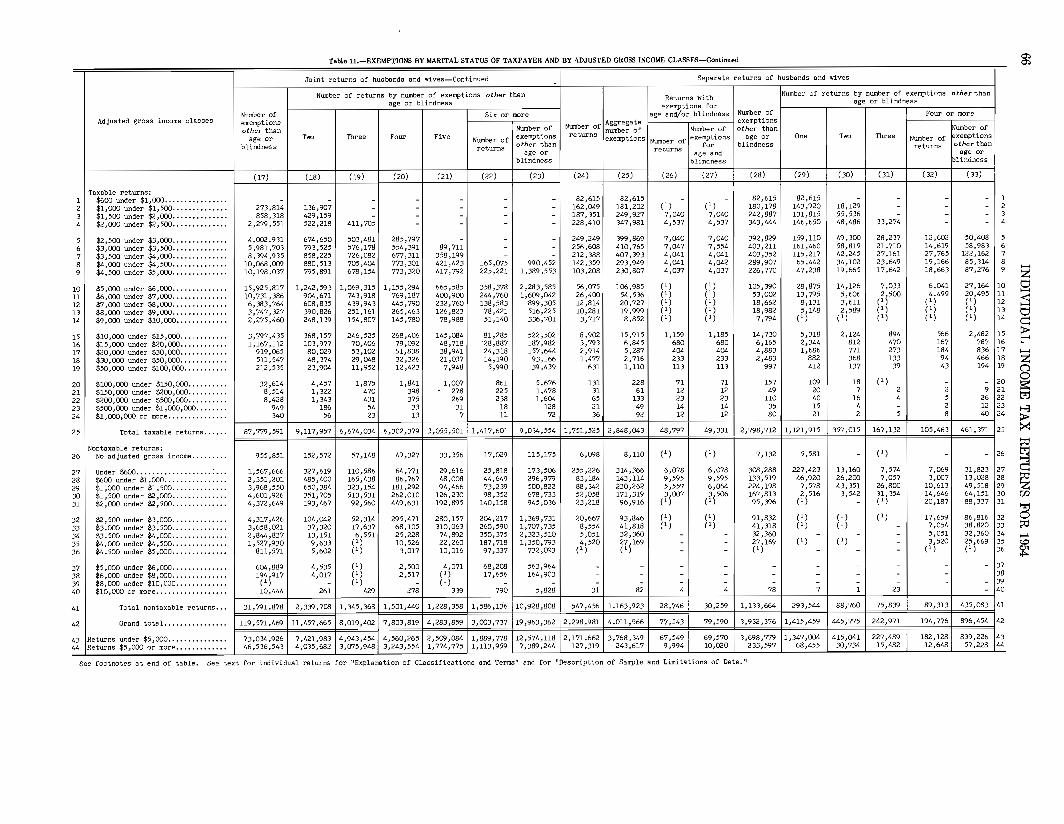
Table 11.-EXEMPTIONS BY MARITAL STATUS OF TAXPAYER AND BY ADJUSTED GROSS INCOME CLASSES-Continued
Joint returns of husbands and wives-Continued Separate returns of husbands and wives
Number of returns by number of exemptions other than Returns withNumber of returns by number of exemptions other than
age or blindness exemptions forage or blindness
Number of Six or more age and/or blindness Number of Four or moreAdjusted gross income classes exemptions Aggregate exemptions
other than Number of Number of number of Number of other than !Number of
age or Two Three Four Five exemptions returns exemptions exemptions age or One Two Three exemptionsNumber of Number of Number of
blindness returnsother than for blindness returns other than
age or returns age and age Drblindness blindness !blindness
(l7) (18) (19) (20) (21) (22) (23) (24) (25) (26) (27) (28) (29) (30) (Jl) (32) (33)
Taxable returns:1 $600 under $1,000 ......•.••.••... - - - - - - - 82,615 82,615 - - 82,615 82,615 - - - - 1
2 $1,000 under $1,500...•.•.••.•••. 273,814 136,907 - - - - - 162,049 181,202 (1) (11 180,178 143,920 18,129 - - - 2
3 $1,500 under $2,000••.•••••••.... 858,318 429,159 - - - - - 187,351 249,927 7,040 7,040 242,887 131,815 55,536 - - - 3
4 $2,000 under $2,500••..••••••..•• 2,279,551 522,218 411,705 - - - - 228,410 347,981 4,537 4,537 343,444 146,650 48,486 33,274 - - 4
5 $2,500 under $3,000 ....•.•..•...• 4,002,931 674,650 503,481 285,797 - - - 249,249 399,869 7,040 7,040 392 ,829 159,110 49,300 28,237 12,602 50,408 5
6 $3,000 under $3,500.••.....••.... 5,981,703 793,525 576,178 554,391 89,711 - - 256,608 410,765 7,047 7,554 403,211 161,460 58,819 21,710 14,619 58,983 6
7 $3,500 under $4,000.............. 8,394,935 858,225 726,082 677,311 358,199 - - 212,388 407,393 4,041 4,041 403,352 115,217 42,245 27,161 27,765 122,162 7
8 $4,000 under $4,500......•••.•.•. 10,068,009 880,513 705,404 773,301 421,423 165,075 990,452 142,359 293,949 4,041 4,042 289,907 65,442 34,102 23,649 19,166 85,314 8
9 $4,500 w:.der $5,000.•••.•.••.•••. 10,198,037 795,891 678,154 773,320 417,792 225,221 1,389,553 103,208 230,807 4,037 4,037 226,770 47,238 19,665 17,642 18,663 87,276 9
10 $5,000 under $6,000.............. 15,925,817 1,242,593 1,069,315 1,155,294 665,585 358,378 2,283,585 56,075 106,985 (1 ) (1 ) 105,390 28,875 14,126 7,033 6,041 27,164 10
11 $6,000 under $7,000.....•.....•.. 10,731,386 904,671 743,918 769,187 400,900 244,760 1,609,042 26,400 54,536 (1) (1) 53,002 13,795 5,606 2,500 4,499 20,495 11
12 $7,000 under $8,000........•...•• 6,)83,764 608,835 439,943 445,790 232,760 138,583 899,305 12,814 20,727 (1 ) (1) 18,662 8,131 3,611 (1) (1) (1) 12
13 $8,000 under $9,000.............. 3,747,327 390,826 251,161 265,463 126,823 78,421 516,225 10,281 19,999 (1) (1) 18,982 5,148 2,589 (l) (1) (1) 13
14 $9,000 under $10,000 .....•..•.... 2,275,460 248,139 154,807 145,780 78,988 51,140 336,701 3,717 8,852 (l) (1) 7,794 (l) (1) (l) (1) (1) 14
15 $10,000 under $15,000....••...... 3,797,435 368,157 246,525 268,406 145,084 81,285 522,502 8,902 15,915 1,159 1,185 14,730 5,318 2,124 894 566 2,482 15
16 $15,000 under $20,000 ...•......•. 1,167,112 103,977 70,406 79,On 48,718 28,887 187,982 3,793 6,845 680 680 6,165 2,344 812 470 167 787 16
17 $20,000 under $30,000 ..........•. 919,065 80,029 53,102 61,838 38,941 24,318 157,644 2,914 5,287 404 404 4,883 1,686 771 273 184 836 17
18 $30,000 under $50,000.......••.•• 511,547 48,374 29,048 32,326 21,037 14,190 93,166 1,477 2,716 233 233 2,483 882 368 133 94 466 18
19 $50,000 under $100,000........•.. 212,535 23,904 11,952 12,423 7,948 5,990 39,439 631 1,110 113 113 997 412 137 39 43 194 19
20 $100,000 under $150,000........•. 32,614 4,457 1,875 1,841 1,007 861 5,676 131 228 71 71 157 109 18 (1) - - 20
21 $150,000 under $200,000 .......... 8,514 1,322 470 398 278 225 1,478 31 61 12 12 49 20 7 2 2 9 21
22 $200,000 under $500,000....•••••• 8,428 1,343 431 375 269 238 1,604 65 133 23 23 110 40 16 4 5 26 22
23 $500,000 under $1,000,000..•....• 949 186 54 33 31 18 128 21 49 14 14 35 15 4 - 2 12 23
24 $1,000,000 or more ....•.•....•... 340 56 23 13 7 11 ?2 36 92 12 12 80 21 2 5 8 40 24
25 Total taxable returns ...•.. 87,779,591 9,117,957 6,674,034 6,302,379 3,055,501 1,417,601 9,034,554 1,751,525 2,848,043 48,797 49,331 2,798,712 1,121,915 357,015 167,132 105,463 461,371 25
Nontaxable returns:26 No adjusted gross income ....••... 955,851 152,572 57,148 49,327 33,356 17,029 115,175 6,098 8,110 (1 ) {1 } 7,132 5,581 - (1) - - 26
27 Under $600.....•.•...••••.•••.•.• 1,567,666 327,619 110,586 64,771 29,616 25,818 173,506 255,226 314,366 6,078 t>,078 308 ,288 227,423 13,160 7,574 7,069 31,823 27
28 $600 under $1,000....•••....••.•. 2,351,201 485,400 165,438 86,767 48,008 44,649 296,979 83,184 143,114 9,595 9,595 133,519 46,920 26,200 7,057 3,007 13,028 28
29 $1,000 under $1,500.••••.•••.•••• 3,968,550 650,384 323,154 181,292 94,466 73,239 500,822 88,342 230,262 5,557 6,064 224,198 7,578 43,351 26,800 10,613 49,518 29
30 $1,500 under $2 ,000•...•••.•••.•• 4,601,926 351,705 513,531 262,010 126,230 98,352 678,733 52,058 171,319 3,007 3,506 167,813 2,516 3,542 31,354 14,646 64,151 30
31 $2,000 under $2,500..•••••••••••• 4,372,649 193,467 92,560 449,631 192,895 140,158 945,036 23,218 96,916 {'} (1) 95,396 (1 ) - (1) 20,187 88,337 31
32 $2,500 under $3,000..•.••.•.••.•• 4,317,426 104,042 52,314 295,471 280,157 204,217 1,369,731 20,667 93,846 (1 ) (1) 91,832 (1 ) (1) (1) 17,659 86,816 32
33 $3,000 under $3,500.....•..•••••• 3,658,021 37,320 17,637 68,105 310,063 260,590 1,707,735 8,554 41,818 (l) {1} 41,318 (1 ) (l) - 7,054 38,820 33
34 $3,500 under $4,000...••••••••••• 2,844,837 13,151 6,551 25,228 74,892 350,375 2,323,510 5,051 32,360 - - 32,360 - - - 5,051 32,360 34
35 $4,000 under $4,500.............. 1,527,930 9,633 (1 ) 10,526 22,260 187,718 1,350,793 4,520 27,169 - - 27,169 (l) (1) - 3,520 25,669 35
36 $4,500 under $5,000 .••••.•••••••• 811,571 5,602 (1 ) 3,017 10,016 97,337 732,093 (1) (1) - - (1) - - - (1) (l) 36
37 $5,000 under $6,000.•••.••.•••••. 604,889 4,535 (1) 2,500 4,071 68,208 563,964 - - - - - - - - - - 37
38 $6,000 under $8,000..•....•.•.... 194,917 4,017 (1 ) 2,517 (1 ) 17,656 164,903 - - - - - - - - - - 38
39 $8,000 under $10,000.•...•..•.... (1) - (1 ) - (1 ) - - - - - - - - - - - - 39
40 $10,000 or more•.•......•••.••... 10,444 261 429 278 339 790 5,828 31 82 4 4 78 7 1 23 - - 40
41 Total nontaxable returns ... 31,791,878 2,339,708 1,345,368 1,501,440 1,228,358 1,586,lj6 10,928,808 547,456 1,163,923 28,746 30,259 1,133,664 293,544 88,760 75,839 89,313 435,083 41
42 Grand total •••••••••...•.•. 119,571,469 11,457,665 8,019,402 7,803,819 4,283,859 3,003,737 19,963,362 2,298,981 4,011,966 77,543 79,590 3,932,376 1,415,459 445,775 242,971 194,776 896,454 42
43 Returns under $5,000..••.•.•.•.•.•• 73,034,926 7,421,983 4,943,454 4,560,265 2,509,084 1,889,778 12,574,118 2,171,662 3,768,349 67,549 69,570 3,698,779 1,347,004 415,041 227,489 182,128 839,226 43
44 Returns $5,DOO or more•.•..•....... 46,536,543 4,035,682 3,075,948 3,243,554 1,774,775 1,113,959 7,389,244 127,319 243,617 9,994 10,020 233,597 68,455 30,734 15,482 12,648 57,228 44
See footnotes at end of table. See text for individual returns for l1Explanation of Classifications and Terms ll and for llDescription of Sample and Limitations of Data. '1
g;
Z8-<......t:ic::::>t"""......z8a::trj
~:><
~~Zw
d~......
~

Tabl. ll.-EXEMPTIONS BY MARITAL STATUS OF TAXPAYER AND BY ADJUSTED GROSS INCOME CLASSES-Con';n.ed
Returns of heads of household ~~turns of surviving spouse
Number ofexemptions
forage and
blindness
Returns ..lithexemptions for
age and/or blindness
Number ofreturns
Aggregatenumber ofexemptions
Four or more
Number ofreturns
I I INumber ofNumber of returnsexemptionsother than
age orblindness
ThreeT""
Number of returns by number of exemptions other thanage or blindness
OneNumber ofexemptions
forage and
blindness
Number ofreturns
Returns withexemptions for
age and/or blindness I Number of~ exemptions
other thanage or
blindness
Aggregatenumber ofexemptions
Number ofreturns
Adjusted gross income classes
(34) (35) (36) (37) (38) (39) (40) (41) (42) (43) (44) (45) (46) (47)
Taxable returns:$600 under $1,000 .$1,000 under $1,500 ..$1,500 under $2.CXXJ .$2,COO under $2,500 .
51 $2,500 under $3,000 ~ ..6 $3,000 under $3,500 .7 $3,500 under $4,000 _ .8 $4,000 under $4,500 .9 $4 ,500 under $5,000 .
10 $5,000 under $6,000 00 ..
11 $6,000 under $7,000 ..12 $7,000 under $8,000 .13 $8,000 under $9,OOO ~ .14 $9,000 under $10,CXJO .
15 $10,CXJO under $15,000 .16 $15,000 under $20,000 ..17 $20,000 under $30,000 .18 $30,000 under $50,000 .19 $50,000 under $100,000 .
20 $100,000 under $150,CXJO .21 $150,CXJO under $200,CXXJ .22 ,$200,000 under $500,CXJO .23 $500,000 under $1,000,000 ..24 $l,CXJO,OOO or rore .
25 I Total taxable returns .
Nontaxable returns:26 I No adjusted gross income .
27 Under $600 00 ..
28 $600 under $1,000 .29 $1,000 under $1,500 .30 $1,500 under $2,000 .31 $2,000 under $2,500 .
32 $2,500 under $3,OOO~ . .•...•.••..•.•..••.....•......•.•33 $3,CXJO under $3,500 .34 $3,500 under $4,000 .35 $4,000 under $4;500 .36 $4,500 under $5,000 .
13,51646,03950,07870,587
94,108116,618120,221109 ,235101,335
95,74938,23025,166
7,6158,135
16,5715,9095,8712,5711,150
203647515
3
929,067
2,583
41,09323,55536,05130,543
8,'516
10,5253,000
(1)(1 )
13,51658,04477,123
133,713
198,729232,220251,925230,481207,736
209,58183,99956,88015,68116,722
38,90613,57913,8866,0572,921
486155171
355
1,862,551
4,161
56,66642,13885,10793,05430,030
38,03816,498(1)(l)
(l)2,489
3,0004,023
(1 )3,0174,034
2,5003,0683,534
(1 )(1 )
3,4561,1161,753
834407
752122
21
39,336
2,5342,5346,9844,517
(1)
(l)2,489
3,0004,540
(1 )3,0174,034
3,0003,0683,534
(1 )(1)
3,5031,1161,753
838414
752122
21
40,411
2,5342,5346,9844,517
(1 )
13,51658,04475,134
131,224
195,729227,680249,936227,464203,702
206,58180,93153,34614,66415,733
35,40312,46312,133
5,2192,507
411134149
334
1,822,140
4,161
54,13239,60478,12388,53728,513
38,03816,498(l)(1)
13,51634 ,03425,02224,999
25,53137.05323,03219,57225,062
13,4896,5625,533
(l)(1 )
3,4601,6581,356
989380
812423
62
262,991
(1)
31,55411,0066,9844,017
(1)
12,00525,05630,539
42,03252,567?2 ,67266,61455,179
58,70524,13513,6036,0497,590
9,2362,5453,233
949442
682135
31
483,279
(1)
7,5399,549
19,0624,016
(1 )
2,516
(l)
15,049
20,04622,49919,52019,03217,594
19,0386,0334,013
(1)(1)
2,6961,345
889256202
291312
3
148,773
(1)
(1 )2,5008,005
16,032(1 )
(1 )
6,4994,4995,0004,0173,500
4,517(1)(1 )
1,179361393377126
25653
34,024
(1 )(1 )(1 )6,4785,499
5,9933,000
(1 )(1 )
25,99617,99623,0001'1,56815,500
18,568(1 )(1 )
5,3831,6801,6441,564
637
107292012
146,272
(1 )(1)(1)28,39222,996
26,95816,498(1)(1 )
(l)2,500
(1 )5,000
7,5065,551
(1)(1 )4,517
2,5342,534
(l)
1,993614538282132
251214148
39,304
(1 )
(1)6,9956,5233,.517
(1)
989(1 )(l)(l)
(l)2,500
(1 )8,999
17,50011,601(l)(1 )12,566
6,0516,602
(1)
6,0681,9341, ?lL
743336
6139422716
88,325
(1 )
(1)16,99013,5289,050
(1 )
3,946(1 )(l)(l)
(1)
2,506(l)(1)
(1 )
(l)(1 )
827143
(1 )110
50
184
713
6
7,713
(1 )
(1 )4,0064,000
(l)(1 )
(1 )(1 )
(l)
2'
506
1
5(1) 6(l) 7
- 8(1) 9
10
(1) III(1) 12- 13- 14
1'344115166 16(1) 17
121 1857 19
8,335 I 25
(1) 26
(1) 274,006 284,000 29
(1) 30(1) 31
32(1) 33(1) 34
- 35- 36
zI:j
~8e;»t'"
Z(1o~t.".l>-3;»><~
~~en~o~......c.o~
37383940
$5,000 under $6,000 .$6,000 under $8,000 .$8,000 under $10,000 .$10,000 or more .
(1)(1 )
(l)(1 )
18
(1 )(1 )
18
(1 )(1) (l)
25 51-1
37- 38- 391 40
41 Total nontaxable. returns I 160,373 391,207 18,086 18,086 I 373,121 56,101 I 45,727 30, .575 27,970 133,84 1 24,616 60,291 12,064
42 Grand total I 1,089 ,440 2,253,758 57,422 58,497 I 2,195,261 319,092 I 529,006 179,348 61,994 280,113 63,920 148,616 19,837
i~ I~:~:~: ~~~$~;~~~:::::::::::::::::::::::::::::::::: 881,106208,334
1,788,677465,081
38,62718,795
39,1441 1,749,53319,353 445,728
283,9221 401,88835,170 127,118
144,31135,037
50,98511,009
228,90251,211
53,18910,731
120,43028,186
17,0862,751
19,1201433,313 44
See footnotes at end of table. See text for individual returns for '1Explenation of Classifications end Terms ll and for "Description of Sample and Limitations of Data. 1I
~

Tabi. 1l.-EXEMPnDNS BY MARITAL 8TATU8 OF TAXPAYER AND BY ADJUSTED GROSS INCOME CLASSE8-Continued
Returns of surviving spouse-Continued Returns of single persons not heed of household or surviving spouse
rfumber of returns by number of exemptions other than Returns withNumber of returns by number of exemptions other than
age or blindness exemptions forage or bl1 ndness
Number of four or more age and/or blindness Number of Four or moreAdjusted gross income classes exemptions Number of
Aggregate exemptionsother than Number of number of Number of other than Number of
One Two Three exemptions returns exemptions exemptions One Two Three exemptionsage or Number of Number of age or Number ofblindness other than for blindness other than
returns returns age and returnsage or age or
blindness blindness blindness
(48) (49) (50) (51) (52) (53) (54) (55) (56) (57) (58) (59) (60) (61) (62) (63)
Taxable returns:1 $600 under $1,000•..........•••..••.....•• (1 ) (1 ) - - - - 1,195,857 1,195,857 - - 1,195,857 1,195,857 - - - - 12 $1,000 under $1,500....................... 2,500 2,500 - - - - 2,079,175 2,208,006 45,673 45,673 2,162,333 1,996,b17 83,158 - - - 23 $1,500 under $2,000•........•.••..•.•..... (1 ) (1 ) - - - - 1,764,620 2,139,559 135,639 135,639 2,003,920 1,525,320 239,300 - - - 34 $2,000 under $2,500....................... 8,499 (1) 3,499 - - - 1,840,639 2,448,040 118,370 118.370 2,329,670 1,467,790 256,667 116,182 - - 4
5 $2,500 under $3,000......•...•......•••..• 14,994 4,018 (1 ) (1) (1 ) (1 ) 1,637,238 2,214,861 100,108 101,108 2,113,753 1,300,605 223,937 85,510 27,186 108,744 56 $3,000 under $3,500....................... 11,084 (1 ) 3,033 (1 ) (1 ) (1) 1,474,848 2,077,377 94,275 95,271 1,982,106 1,129,568 221,030 90,056 34 ,194 140,310 67 $3,500 -"lder $4,000.......•••..•......•.•• (1 ) (1 ) (1 ) - (1 ) (1) 1,103,178 1,557,084 63,770 64,270 1,492,814 855,757 146,414 70,860 30,147 131,649 78 $4,000 wder $4,500••......••.•••.•......• (1 \ - (1 ) - - - 761,299 1,075,557 50,858 51,375 1,024,182 601,257 90,787 46,699 22,556 101,254 89 $4,500 under $5,000....................... 11,566 - 2,501 (1 ) (1 ) (1 ) 486,207 697,879 38,328 39,345 658,534 389,123 49,903 28,139 19,042 85,188 9
10 $5,000 under $6,000...••...•..•.•........• 6,051 (1 ) (1 ) (1 ) (1 ) (1 ) 462,845 647,653 41,877 42,378 605,275 371,604 61,117 18,591 11,533 55,664 10
11 $6,000 under $7,000.....•.••••...••......• 5,602 (1 ) (l) (1) (1 ) (1 ) 200,851 281,120 26,129 26,129 254,991 168,744 19,074 7,533 5,500 25,500 1112 $7,000 under $8,000•....•.............•..• (1 ) (1 ) (1) (l) - - 102,156 137,880 16,075 16,575 121,305 90,519 7,619 3,017 1,001 6,497 1213 $8,000 under $9,000..............•..•....• - - - - - - 56,131 81,811 12,096 13,096 68,715 49,081 2,516 3,534 1,000 4,000 1314 $9,000 under $10,000•......••..•••.••....• - - - - - - 29,940 48,175 6,083 6,083 42,092 22,836 5,056 1,048 1,000 6,000 14
15 $10,000 under $15,000.•.•....•..•...•....• 4,724 118 1,282 402 191 836 78,559 119,905 28,746 29,010 90,895 70,728 4,729 1,960 1,142 4,829 1516 $15,000 under $20,000••.•................• 1,768 (1) 214 184 167 739 27,096 42,781 11,271 11,390 31,391 24,011 2,289 529 267 1,215 1617 $20,000 under $30,000•......•........•..•• 1,642 (l) 166 117 206 910 24,117 39,007 11,028 11,122 27,885 21,422 2,015 433 247 1,134 1718 $30,000 under $50,000•....•..•..•......... 622 93 107 (1 ) (1 ) (1 ) 12,592 20,640 5,930 5,977 14,663 11,135 1,070 210 177 758 1819 $50,000 under $100,000..........••.••..••. 279 46 47 25 14 64 6,202 10,874 3,627 3,696 7,178 5,570 420 136 76 360 19
20 $100,000 under $150,000....••••••••.••..•• 40 (1) 15 - - - 1,217 2,144 774 776 1,368 1,117 75 11 14 68 2021 $150,000 under $200,000.......•••.•......• 35 2 2 3 5 20 392 684 232 234 450 357 22 8 5 25 2122 $200,000 under $500,000•.••.•••••....•...• 34 7 3 1 3 18 424 766 282 286 480 392 20 5 7 33 2223 $500,000 under $1,000,000................. 14 14 - - - - 65 116 44 44 72 60 3 2 - - 2324 $1,000,000 or more ............. : .......... 10 7 - 1 - - 44 75 25 25 50 41 2 - 1 5 24
25 Total taxable returns ............... 79,990 13,472 15,409 6,261 4,162 16,917 13,345,692 17,047,851 811,240 817,872 16,229,979 11,298,911 1,417,223 474,463 155,095 673,233 25
Nontaxable returns:26 No adjusted gross income .................. (') (1 ) - - - - 121,678 176,453 27,550 27,550 148,903 103,465 11,679 5,035 (1 ) (1) 26
27 Under $600•.••••.•••....••.•••............ (1) (1 ) - - - - 3,083,085 3,397,492 160,560 162,077 3,235,415 2,983,383 61,907 26,475 11,320 48,793 2728 $600 under $1,000•..•.......•.....•.....•. 12,984 4,~06 (1) (1 ) (1 ) (1 ) 943,557 1,517,634 256,537 258,526 1,259,108 714,625 166,448 44,897 17,587 76,896 2829 $1,000 under $1,500.........•.....•.....•• 9,528 4,518 (1) (1 ) - - 640,474 1,418,608 262,551 264,540 1,154,068 288,708 230,134 95,006 26,626 120,074 2930 $1,500 under $2,000•.....•...•...........• 7,550 (1 ) (1) (1) (l) (1 ) 337,500 941,597 102,851 105,340 836,257 101,487 34,622 153,640 47,751 204,606 3031 $2,000 under $2,500....................... (1 ) - (1 ) (1 ) - - 131,652 429,698 45,730 48,254 381,444 44,227 10,006 17,569 59,850 264,498 31
32 $2,500 under $3,000•.......•••.••.......•• 3,946 - - (1 ) (1 ) (1 ) 64,368 225,196 18,164 18,164 207,032 18,663 3,501 6,541 35,663 161,744 3233 $3,000 under $3,500....................... (1 ) (1 ) (1) (1 ) - - 33,259 137,902 9,632 10,132 127,770 7,584 3,048 (1 ) 20,594 107,991 3334 $3,500 under $4,000••.......•.......•....•• (1 ) - (1 ) - - - 14,027 65,642 4,006 4,506 61,136 3,506 (1 ) - 9,522 55,632 3435 $4,000 under $4,500...•................••• (l) - - - (1 ) (1 ) 4,499 24,496 (1 ) (1 ) 23,996 (1 ) - - 3,500 22,997 3536 $4,500 under $5,000••..........•.....•..•• - - - - - - 4,040 15,005 (1 ) (1 ) 13,488 (1 ) (1 ) (1 ) (1 ) (1 ) 36
37 $5,000 under $6,000••.••.•..•............• - - - - - - (1 ) (1 ) (1 ) (l) (1 ) (1 ) - - - - 3738 $6,000 under $8,000....................... - - - - - - (1 ) (1 ) - - (1 ) (1 ) (1 ) - (l) (1 ) 3839 $8,000 under $10,000•..••.............•.•• - - - - - - (1 ) (1 ) - - (1 ) (l) - - - - 3940 $10,000 or more ........................... 50 - 25 - - - 307 642 136 136 506 231 52 - 24 171 40
41 Total nontaxable returns ............ 46,193 14,041 3,552 4,534 2,489 11,446 5,380,493 8,356,365 890,251 901,759 7,454,606 4,269,970 523,396 351,713 235,414 1,082,705 41
42 Grand total ......................... 126,183 27,513 18,961 10,795 6,651 28,363 18,726,185 25,404,216 1,701,491 1,719,631 23,684,585 15,568,881 1,940,619 826,176 390,509 1,755,938 42
43 Returns under $5,000........................ 101,310 25,102 14,548 8,534 5,005 21,510 17,721,200 23,963,943 1,536,619 1,552,157 22,411,786 14,729,975 1,834,040 789,159 368,026 1,646,254 4344 Returns $5,000 or more ...................... 24,873 2,411 4,413 2,261 1,646 6,853 1,004,985 1,440,273 164,872 167,474 1,272,799 838,906 106,579 37,017 22,483 109,684 44
See text for individual returns for "Explanation of Classifications and Terms" and for lIDescription of Sample and Limitations of Data. II
lSample variability of "this :!."tem is teo large to tmrrlJnt Ghom.ng it separately. However, this value is inclUded in each total.
~
.....Zt::l
3t::l
~t"'
Z8a::trj
;;><
~c::::~en
d~.....to
~

Tabla 12.-cAPITAL GAINS AND LOSSES, SHORT- AND LONG·TERM. AND CAPITAL LOSS CARRYOVER. BY ADJUSTED GROSS INCOME CLASSES
Returns wi. th net loss from sales of capital assets Returns nth net gain from sales of capital assets
Ne.t loss Short-term Long-term TotalTotal (a fter carryover)number of from sales Net loss
returns of capital from sales Capital Net gain Short-termLong-term Capital
with gain ~ssets after of capitalNet Net Net Net loss from sales (after carryover) loss
Adjusted gross income classes or loss Number of statutory assets short-term short-term long-term long-term carryover of capital Net Net carryoverfrom sales returns 11mtation beforc
capital cspi tal capital from assets Net Net long-term long-term from(deducted statutory capital
gain loss 1949-53 Number of sho=,t-term short-term 1949-53of capitalfrom gross limitation gain loss
(10~) (1O~) returns in adjusted capital capital capital capitalaasets grosa gain lossincome) income gain loss
(H)(~) (H)(~)
(Thou$Mld (ThocI/IMld (ThOll$and (Thouallnd (Thou$and (Thou$and (Thousllnd (Thouund (Thouund (ThOlJSLJrld (ThouslJ11d (Thousand (Thou:JlJ11ddollarll) dollattl) dollars) dol Ian) dollan) dollau) dollars) dollan) dollars) do JlaTIJ) dollan) dolllltlJ) dollars)
(1) (2) (3) (4) (5) (6) (7) (8) (9) (10) (11) (12) (13) (14) (15) (16)
Taxable returns:1 $600 under $1,000.•••••••••••••••• 19,028 3,006 948 2,405 - 50 - 2,355 - 16,022 3,635 637 - 6,069 37 - 12 $l,OC)() under $1,500............... 44,633 11,624 7,456 14,951 - 7,334 - 7,617 6,838 33,009 10,410 1,823 383 17,555 - - 23 $1,500 under $2,000............... 63,317 13,233 8,191 15,507 103 4,874 - 10,736 6,974 50,084 20,156 940 - 38,433 - - 34 $2,(XX) under $2,500....•........•. 91,877 18,679 10,725 22,326 37 16,863 828 6,329 13,852 73,198 34 ,017 2,728 5,948 68,521 - - 4
5 $2,500 under $3,000••••••••••••••• 102,277 26,390 13,379 28,488 230 8,618 74 20,174 7,669 75,887 42,370 3,781 1,973 79,149 - 3,394 56 $3,()(X) under $3,500............... 108,988 18,273 12,829 43,989 - 33,657 245 10,577 26,905 90,715 43,590 1,974 1,802 85,308 139 641 67 $3,500 under $4,()(X)............... 140,098 25,239 13,697 32,374 1,088 10,054 - 23,408 8,983 114,859 67,208 8,882 20 116,676 - - 78 $4,()(X) under $4,500•.•...•......•. 146,766 34,839 18,563 40,747 429 15,142 1,058 27,092 9,6'n 111,927 70,594 7,608 136 126,954 423 - 89 $4,500 under $5,()(X).•............. 123,191 29,796 15,058 40,277 95 27,243 3,910 17,039 16,837 93,395 59,262 5,104 2,940 111,257 - 699 9
10 $5,0C)() under $6,()(X)............... 262,215 55,207 27,670 82,425 277 47,329 1,691 37,065 27,970 207,008 152,244 9,244 1,640 287,813 86 - 1011 $6,000 under $7,000••••••••••••••• 205,150 45,638 26,313 91,175 490 55,748 4,158 40,076 51,784 159,512 113,075 16,861 3,997 198,044 810 3,787 1112 $7,000 under $8,000••.•••••••••••• 169,430 33,012 15,020 46,029 627 22,726 3,164 27,092 17,299 136,418 113,650 13,256 1,472 202,633 187 1,7.13 1213 $8 ,000 under $9 ,000••••••••••••••• 121,247 30,663 14,634 30,083 1,274 8,968 763 23,151 4,895 90,584 86,855 15,586 895 143,578 71 659 1314 $9,()(X) under $10,000.............. 110,543 23,292 14,447 67,435 28 71,239 15,987 12,212 51,551 87,251 75,058 11,347 160 130,391 1,404 180 14
15 $10,CX)() under .$15,000........" .... 309,113 61,848 36,192 129,079 917 78,972 7,072 58,096 65,268 247,265 370,790 48,215 11,016 660,443 2,142 8,684 1516 $15,000 under $20,000.....•.•..... 141,755 30,229 18,875 68,844 807 49,334 4,947 25,265 43,231 111,526 235,366 31,808 7,689 417,013 1,105 6,548 1617 $20,000 under $30,000•••.•.•••••.• 142,984 31,580 21,011 89,402 1,675 64,922 9,085 35,241 54,070 111,404 314,511 32,004 13,909 582,159 1,619 14,569 1718 $30,000 under $50,000.....•.•••... 98,944 21,651 15,111 80,154 1,390 70,745 17,296 28,094 63,210 77,293 336,954 35,099 12,166 617,871 995 15,499 1819 $50,000 under $100,000............ 52,252 10,037 7,617 50,036 1,112 43,715 10,736 18,170 39,008 42,215 398,766 24,928 19,549 769,309 1,039 16,314 19
20 $100,000 under $150,000........... 9,678 1,488 1,102 7,725 126 5,720 1,299 3,430 3,987 8,190 190,331 8,052 7,448 372,342 168 5,422 2021 $150,000 under $200,000........... 2,807 394 327 8,591 13 7,525 1,089 2,169 7,404 2,413 103,003 3,602 3,641 202,550 53 2,308 2122 $200 ,()(x) under $500 ,CX)()........... 2,967 375 303 4,293 34 3,295 804 1,836 2,775 2,592 243,357 6,152 5,062 479,473 1 2,780 2223 $5OO,OC)() under $l,ooo,OC)()......... 418 46 39 2,466 1 1,860 436 1,042 1,660 372 107,300 3,253 2,189 210,287 2 1,898 2324 $l,()(X),OC)() or more ................ 196 32 30 3,,475 - 3,421 820 874 3,352 164 166,997 700 1,419 334,014 - 776 24
25 Total taxable returns ....... 2,469,874 526,571 299 ,537 1,002,276 10,753 659,354 85,462 439,140 535,199 1,943,303 3,359,499 293,584 105,454 6,257,842 10,281 85,871 25
Nontaxable returns:26 No adjusted gross income.......... 85,969 24.,598 16,821 56,874 2' 30,404 1,131 27,604 26,137 61,371 117,850 3,949 7,423 235,229 - 37 26
27 Under $600........................ 61,851 21,635 11,749 25,655 875 11,206 2 15,325 7,844 40,216 20,495 1,981 29 37,054 - - 2728 $600 under $1 ,()(X) ................. 78,322 17,452 9,238 21,856 16 13,889 - 7,984 9,688 60,870 26,775 2,030 670 50,472 157 709 2829 $1,000 under $1,500............... 103,375 17,639 11,679 27,024 1,548 18,397 2,530 12,704 14,633 85,736 46,757 2,479 486 89,238 95 - 2930 $1,500 under $2,000............... 87,424 19,083 10,197 13,855 - 6,246 254 7,863 4,309 68,341 38,157 794 158 74,884 - 91 3031 $2,000 under $2,500............... 61,123 10,524 4,729 7,652 - 419 - 7,234 19 50,599 32,059 1,503 - 61,109 - - 31
32 $2,500 under $3,000......•.•...... 52,568 10,614 6,160 12,095 1,529 7,128 347 6,843 8,024 41,954 24,080 1,493 425 45,880 143 791 3233 $3,000 under $3,500............... 28,860 6,090 3,988 14,833 9 11,103 337 4,075 2,598 22,770 25,765 6,041 436 39,884 - 281 3334 $3,500 under $4,000............... 19,088 4,984 dl974 18,326 - 7,423 - t~1903 ~ir3
14,104 14,021 1,768 - 24,557 26 - 3435 $4,000 under $4,500............... 8,083 (ll (1) - (1 ) (1) 5,532 3,088 - - 6,176 - - 3536 $4,500 under $5,000............... 3,068 (') (1 ) (1 ) - - - (1 ) - (1 ) (1 ) - - (1 ) - - 36
37 $5,()(X) under $6,000............... 10,042 (1 ) (1 ) (l) - - - (1 ) - 9,036 6,759 438 - 12,641 - - 3738 $6,()(X) under $8 ,()(x) • •••••••••••••• 3,529 - - - - - - - - 3,529 5,438 - - 10,877 - - 3839 $8,()(X) under $10,000.............. (1) - - - - - - - - (1 ) (1 ) (1 ) - (1 ) (1 ) - 3940 $10, ()(X) or' more................... 1,531 820 773 9,303 .58 5,176 517 4,702 7,493 711 9,573 1,033 149 17,230 - 312 40
41 Total nontaxable returns .... 605,357 137,513 79,909 211,645 4,037 115,415 5,297 105,564 90,468 467,844 372,363 25,176 9,776 705,872 863 2,221 l 41
42 Grand total ................. 3,075,231 664,084 379,446 1,213,921 14,790 774,769 90,759 544,704 625,667 2,411,147 3,731,862 318,760 115,230 6,963,714 11,144 88,092 42
43 Returns under $5,000................ 1,429,906 316,766 179,910 443,334 5,961 234,U74 10,895 226,117 180,710 1,113,140 700,586 55,515 22,829 1,314,999 1,020 6,643 4344 Returns $5,000 or more .............. 1,645,325 347,318 199,536 770,587 8,829 540,695· 79,864 318,587 444,957 1,298,007 3,031,276 263,245 92,401 5,648,715 10,124 81,449 44
See footnotes at end of table. See text for individual returns for IIExplanation of Classifications and Terms ll and for "Description of Sample and Limitations of Data."
.....Zt:1.....~
~t'".....
~tz:j
~><
~c:::~C/J.
d~.....CO
~
m

Tabl. 12.-CAPITAL GAINS AND LOSSES, SHORT· AND LONG·TERM, AND CAPITAL LOSS CARRYOVER, BY ADJUSTED GROSS INCOME CLASSES-ConLin.ed
Returns with net gain from sales of capital assets-Continued
Returns with normal tax and surtax Returns wi. th al ternative tax
Net gainShort-term Long-term Net gain Short-term Net 10ng-
from sales(after carryover)
Capital from sales (after carryover) Net Capital t~rm capitalAdjusted gross income classes of capital
Net NetNet Net loss of capital long-term loss gain in
assets long-term long-term carryover assets Net Net capital carryover excess ofNumber of short-term short-term Number of short-term short-termin adjusted capital capital from in adjusted gain from net short-returns capital capi tal returns capital capital (10~)gross gain loss 1949-53 gross 1949-53 term capital
income gain loss(10~) (10~) income gain loss loss
(Thousand (Thouund (Thousand (Thousllr1ld (Thoul!umd (Thousand (Thousand (Thousand (Thousand (11Jousand (Thoulland (Thousanddollars) dollarll) doll/Ju) dolllUs) dollars) dollan) dollars) doJ.1ars) doll/Jrs) dollars) dollan) dollars)
(17) (18) (19) (20) (21) (22) (23) (24) (~5) (26) (27) (28) (29) (30)
Taxable returns:1 $600 under $1,000..•..•.•.•••.•••••.•.••••••••••••.••. 16,022 3,635 637 - 6,069 37 - 12 $1,000 under $1,500................................... 33,009 10,410 1,823 383 17,555 - - 23 $1,500 under $2,000•.••.•..•••.••.••••.•••...•••.•...• 50,084 20,156 940 - 38,433 - - 34 $2,000 under $2,500................................... 73,198 34,017 2,728 5,948 68,521 - - 4
5 $2,500 under $3,000................................... 75,887 42,370 3,781 1,973 79,149 - 3,394 56 $3,000 under $3,500................................... 90,715 43,590 1,974 1,802 85,308 139 641 67 $3,500 under $4,000................................... 114,859 67,208 8,882 20 116,676 - - 78 $4,000 under $4,500................................... 111,927 70,594 7,608 136 126,954 423 - (Alternative tax not applicable) 89 $4,500 under $5,000................................... 93,395 59,262 5,104 2,940 111,257 - 699 9
10 $5,000 under $6,000................................... 207,008 152,244 9,244 1,640 287,813 86 - 1011 $6,000 under $7,000................................... 159,512 113,075 16,861 3,997 198,044 810 3,787 1112 $7,000 under $8,000................................... 136,418 113,650 13,256 1,472 202,633 187 1,713 1213 $8,000 under $9,000................................... 90,584 86,855 15,586 895 143,578 71 659 1314 $9,000 under $10,000. ~ ................................ 87,251 75,058 11,347 160 130,391 1,404 180 14
15 $10,000 under $15,000................................. 247,265 370,790 48,215 11,016 660,443 2,142 8,6841/ 1516 $15,000 under $20,000................................. III ,498 235,357 31,808 7,688 416,994 1,105 6,548 (1 ) (1 ) - (1 ) (1 ) - (1) 1617 $20,000 under $30,000................................. 105,509 298,537 29,789. 13,436 554,168 1,619 14,143. 5,895 15,974 2,215 473 27,991 426 27,518 1718 $30,000 under $50,000................................. 58,446 264,027 27,328 9,417 484,805 995 11,388 18,847 72,927 7,771 2,749 133,066 4,111 130,317 1819 $50,000 under $100,000................................ 6,436 99,919 8,327 4,409 189,669 1,039 3,178 35,779 298,847 16,601 15,140 579 ,640 13,136 564,500 19
20 $100,000 under $150,000............................... 473 15,461 1,038 1,202 30,265 168 1,024 7,717 174,870 6,954 6,246 342,077 4,398 335,831 2021 $150,000 under $200,000............................... 95 6,137 532 331 11,648 53 96 2,318 96,866 3,070 3,310 190,902 2,212 187,592 2122 $200,000 under $500,000............................... 79 6,896 334 73 13,200 1 35 2,513 236,461 5,818 4,989 466,273 2,745 461,284 2223 $500,000 under $1,000,000............................. 9 3,091 167 8 5,860 2 - 363 104,209 3,086 2,181 204,427 1,898 202,246 2321- $1,000,000 or more ........................... :' ........ 6 7 - - 15 - - 158 166,990 700 1,419 333,999 776 332,580 24
25 Total taxable returns ........................... 1,869,685 2,192,346 247,369 68,946 3,979,448 10,281 56,169 73,618 1,167,153 46,215 36,508 2,278,394 29,702 2,241,886 25
26 Returns under $5,000.................................... 659,096 351,242 33,477 13,202 649,922 599 4,734 - - - - - - - 2627 Returns $5,000 or more .................................. 1,210,589 1,841,104 213,892 55,744 3,329,526 9,682 51,435 73,618 1,167,153 46,215 36,508 2,278,394 29,702 2,241,886 27
See text for individual returns for lIExplanation of Classifications and Terms" and for "Deacription of Sample and Limitations of Data. nISample variability of this item is too large to warrant showing it separately. However, this value is included in each total.
-::Jo
.....Z
~.....g>t'".....Z
~t:rj
~~
~~00
~...~

Tabl. 13.-SELECTED SOURCES OF INCOME BY STATES AND TEilRITORIES
(Returns l'7i th adjusted gros~ income)
Combined business or Combined partnershipCombined net gain end Combined rents and Income taxSalaries and wages Dividends Interest received professional net loss from salea of royal ties net income Adjusted
Number of (after exclusions) (after exclusions) profit and lossnet profit and loss capital assets and loss gross liabili ty
returns, inclJme afterSta tes and Territories creditstaxable am Amount Amount Amount Amount Amount Number of
_untNumber of Amount
nontaxable Number of Number of Number of Number of Number ofreturns (Thoul'fllnd returns (TPtou:Jand returns (Thousand returns (Thousand returns (Thousand returns (Thousltnd returns (Thousand (1'houS8nd (Thousand
dollars) dolltJrs) dollars) dollars) dollars) mIlars) doll.us) dolillu) dollars)
(1\ (2) (3) (4) (5) (6) (7) (8) (9) (10) (11) (12) (13) (14) (15) (16) (17)
,1 Alabama ...................... 713,389 653,502 2,072,119 24,906 41,507 36,756 ' 16,075 79,128 155,520 18,821 91,119 21,467 19,229 44,610 29,444 2,445,188 223,474 12 Arizona...................... 279,907 243,054 860,189 15,088 29,906 28,418 14,773 35,794 126,150 7,583 49,342 13,190 20,665 25,325 17,695 1,133,078 122,154 23 Arkansas..................... 390,897 329,128 934,117 13,406 20,342 19,569 10,173 70,325 123,430 17,270 75,508 11,611 21,057 34,989 26,079 1,221,340 112,351 34 California ................... 4,733,521 4,162,508 17,210,871 378,554 722,954 710,385 325,284 538,982 1,714,679 177,693 930,998 353,115 431,916 525,127 459,319 22,023,493 2,712,536 45 Colorado................•.... 522,393 452,318 1,617,838 35,620 57,280 75,920 36,572 83,274 210,858 24,371 109,064 40,691 45,124 60,631 45,933 2,137,817 242,683 5
6 Connec ticut.................. 919,793 846,328 3,548,579 96,795 237,500 170,439 46,165 77 ,304 255,194 20,684 116,896 52,324 55,068 87,471 29,283 4,330,913 579,527 67 Delaware..................... 140,208 126,432 482,991 13,879 91,226 19,535 7,003 14,725 31,564 2,732 15,289 8,010 12,083 12,502 8,071 659,777 122,882 78 District of Columbia......... 346,729 314,206 1,181,913 29,695 69,510 45,707 23,869 15,089 67,590 4,880 40,156 21,640 25,840 23,103 22,894 1,474,718 198,493 89 Florida 2..................... 1,093,433 949,248 3,054,541 75,903 188,208 117,819 68,023 142,993 343,323 32,450 150,240 69,467 126,785 114,646 75,643 4,069,109 441,261 9
10 Georgia ...................... 886,480 8m,756 .2,622,063 38,218 77,823 47,346 23r~-02 110,786 189,589 23,006 128,653 34,626 36,061 62,764 44,256 3,149,890 310,837 10
11 Hawaii ....................... 196,816 187,621 599,785 13 ,572 21,844 20,733 4,829 18,197 45,902 5,233 16,196 7,639 5,857 9,347 15,157 719,347 73,684 1112 Idaho........................ 199,676 149,766 479,922 9,371 8,227 25,475 15,016 68,731 176,807 13,831 48,106 21,587 13,035 14,839 5,337 750,695 68,057 1213 Illinois..................... 3,664,301 3,254,036 13,469,222 255,601 454,673 371,148 138,887 439,992 1,251,622 126,463 711,500 197,424 217,112 352,324 221,191 16,597,198 2,131,725 1314 Indiana....................•. 1,528,812 1,319,705 4,963,500 76,482 86,485 148,201 46,339 280,250 642,639 42,076 196,775 84,357 49,276 120,685 68,968 6,103,459 684,031 1415 Iowa ......•.................. 949,318 670,917 2,090,982 55,815 54,076 112,026 50,529 308,334 714,858 51,539 210,487 123,282 65,832 87,061 67,040 3,276,360 324,799 15
16 Kansas ..............••....•.. 733,946 585,459 2,013,832 44,386 41,077 70,422 23,511 191,700 415,117 31,533 121,434 44,095 33,809 89,002 85,873 2,748,186 285,953 1617 Kentucky..................... 797,181 688,817 2,200,511 45,480 73,740 54,526 19,731 143,912 253,744 28,945 137,693 27,301 29,373 52,698 33,112 2,'772,582 279,260 1718 Louisiana.................... 726,310 653,345 2,264,6:i..2 32,316 51, '778 39,853 17,605 85,747 209,563 21,370 125,261 24,384 36,C41 74,040 77,390 2,800,016 301,572 1819 Maine........................ 337,30l 301,393 833,789 25,558 42,068 46,488 12,056 47,228 99,941 5,769 13,589 16,221 7,218 31,310 8,475 1,031,944 94,161 1920 ldaryland..................... 1,084,152 999,461 3,832,164 72,255 133,742 123,632 43,484 85,128 253,111 23,559 122,754 37,577 50,322 78,542 53,174 4,531,032 511,408 20
21 ldassachusetts................ 1,946,708 1,801,351 6,352,475 167,508 356,321 278,668 83,264 146,293 437,440 33,428 147,334 78,734 72,879 178,910 18,009 7,553,935 861,447 2122 Michigan..................... 2,631,029 2,408,442 10,411,090 147,328 245,856 293,880 98,051 273,795 709,256 68,182 411,703 118,862 120,816 219,179 126,336 12,194,265 1,523,997 2223 Minnesota .... " ............... 1,109,306 903,991 3,125,745 67,340 100,804 142,717 43,54? 236,786 505,188 41,693 166,887 76,156 46,469 89,820 45,587 4,(J77,055 428,629 2324 Mississippi.................. 336,270 296,262 858,371 11,936 18,520 22,414 8,936 53,445 99,360 10,752 48,255 10,439 15,472 26,637 20,766 1,076,518 93,956 2425 Missouri ..................... 1,443,093 1,212,909 4,351,298 103,730 176,547 137,471 51,527 286,423 488,425 45,259 222,004 86,817 73,860 131,284 88,968 5,494,885 636,757 25
26 Montana ..•.•................. 218,442 180,805 598,337 15,401 8,826 23,475 9,240 48,651 139,112 12,703 57,219 20,082 9,994 21,501 13 ,928 840,262 89,707 2627 Nebraska..................... 497,166 359,574 1,129,753 27,857 34,671 42,129 17,312 147,544 310,141 24,400 96,662 38,911 26,046 47,856 42,411 1,666,113 176,026 2728 Nevada....•................•. 89,406 80,658 325,728 3,616 15,052 7,402 3,748 11,061 22,951 3,716 18,835 5,296 13,658 9,421 6,717 410,893 55,585 2829 New Hampshire................ 215,998 196,957 618,513 16,165 32,101 38,763 13,125 20,112 51,854 4,231 13,789 7,793 8,485 19,818 4,080 750,875 74,769 2930 New Jersey...........•.•..... 2,140,475 1,954,331 8,167,475 165,114 293,675 204,181 81,998 173,790 527,703 54,217 283,151 98,511 1m, 779 185,181 70,362 9,626,661 1,166,222 30
31 New Mexico.........•....•.•.. 211,876 187,142 650,155 9,835 10,245 18,058 7,017 31,194 70,842 8,988 40,413 8,543 7,926 21,530 14,612 804,415 82,691 3132 New york..................... 6,347,819 5,789,067 23,428,426 490,261 1,363,748 771,500 344,972 551,755 1,676,085 196,836 1,142,716 322,009 515,018 450,208 145,875 28,907,625 3,643,412 3233 North Carolina............... 1,102,039 986,436 2,949,780 48,601 84,364 62,261 23,662 162,438 284,065 33,441 146,550 30,135 32,818 68,882 54,576 3,591,944 3(Y.,673 3334 North Dakota ••••••••••••••••• 200,647 124,198 336,212 12,584 5,032 20,245 7,565 91,441 155,742· 9,293 30,135 20,524 8,627 16,634 6,354 552,491 45,446 3435 Ohio......................... 3,218,821 2,908,083 11,788,474 201,564 362,075 350,534 116,116 377,885 944,288 73,393 371,386 134 ,239 136,543 267,353 176,835 13,985,208 1,670,881 35
36 Oklahoma ..................... 663,978 557,291 1 / 855,788 34,731 52,889 52,510 22,842 141,821 257,289 26,017 115,288 33,640 54,008 81,018 61,084 2,440,907 257,366 3637 Oregon......•................ 578,796 498,540 1,861,153 34,076 42,452 91,765 30,181 95,411 216,923 38,182 174,293 42,024 40,554 54,668 33,342 2,427,856 270,500 3738 Pennsylvania..•.............. 4,115,703 3,766,431 13,555,403 269,164 579,507 33~i)13 11~ir6 359,169 963,378 97,148 494,645 152,351 165,248 28~i ;36 14~i~03 16,167,247 1,871,750 3839 Puerto Rico........ : ......... 21,325 21,325 54,364 - - - - - - - - 54,759 1,230 3940 Rhode Island•....•........... 317,935 291,168 968,779 17,747 51,211 35,378 12,074 22,159 61,130 5,299 22,333 9 / 942 14,004 27 / 627 8,649 1,145,238 133,240 40
41 South Carolina ............... 518,343 471,811 1,434,280 17,659 26,889 37,777 17,350 64,192 113,444- 14,189 56,526 16,019 10,884 32,629 26,177 1,697,197 140,929 4142 South Dakota••...•........... 224,952 150,006 397,094 9,910 8,728 24,667 9,425 87,420 152,749 13,542 49,122 36,350 19,046 23,751 15,939 653,976 55,392 4243 Tennessee..............•..... 908,671 820,340 2,628,814 28,635 55,527 69,644 26,572 127,681 19?,039 23,923 107,712 26,986 29 / 023 68,565 45,731 3,115,501 297,279 4344 Texas........................ 2,536,573 2,233,784 7,963,361 126,362 215,859 191,571 85,746 435,069 835,751 95,593 498,552 138,088 223,714 296,860 325,343 10,248,638 1,208,671 4445 Utah..•.•...•.....•...•.•..•. 247,331 219,420 740,004 12,224 14,587 28,696 6,564 33,805 87,308 9,814 41,733 14,861 11,833 21,946 8,837 916,952 83,989 45
46 Vermont••••..•............... 128,901 108,057 310,817 14,937 26,702 21,470 7,110 23,519 29,397 2,249 5,627 8,506 3,973 12,592 2,456 395,251 33,979 4647
:;~~i~~~i:::::::::::::::::: 1,105,919 1,008,399 3,408,110 61,465 117,691 84,561 29,763 110,602 199,713 31,163 154,256 44,601 46,341 76,068 48,711 4,040,840 415,799 4748 982,470 871,605 3,419,205 57,034 71,627 163 ,451 63,255 128,413 365,180 39,428 191,858 70,407 60,366 90,232 48,408 4,263,326 500,075 4849 West Virginia.....•.....•.. ,. 568,245 523,142 1,643,326 28,570 36,740 28,806 8,499 52,125 116,717 16,154 40,748 17,163 17,305 45,547 26,910 1,909,683 184,974 4950 Wisconsin.................... 1,324,829 1,108,429 4,004,932 94,839 115,885 194,767 54,178 256,061 547,269 39,505 147,107 97,057 48,162 136,583 59,021 5,008,957 531,899 5051 Wyoming••.•.......•.•........ 108,252 92,356 314,983 5,999 7,714 11,328 3,328 22,018 34,162 6,2m 21,730 9,357 6,943 17,737 14,666 405,817 45,083 51
52 Total. ..•...•. " •..••.. 56,305,881 49,827,310 185,985,785 3,655,092 7,035,811 6,071,526 2,345,459 7,409,697 17,883,102 1,758,753 8,729,629 2,984,411 3,249,497 4,927,333 3,099,015 230,401,432 26,707,201 52
See text for individual returns for "Explanation of Classifications and Terms" and for "Description of Sample and Limitations of Data. II
lSample variability of this item is too large to w.arrant showing it separately. However, this value ia included in each total.2Inc1udes Canal Zone.'Includes Alaska.
......Z~;:l
~t"'......z8~t"j
~~
~c::::
~CIJ
d~
I-"<.0enIi>-
-.::JI-"
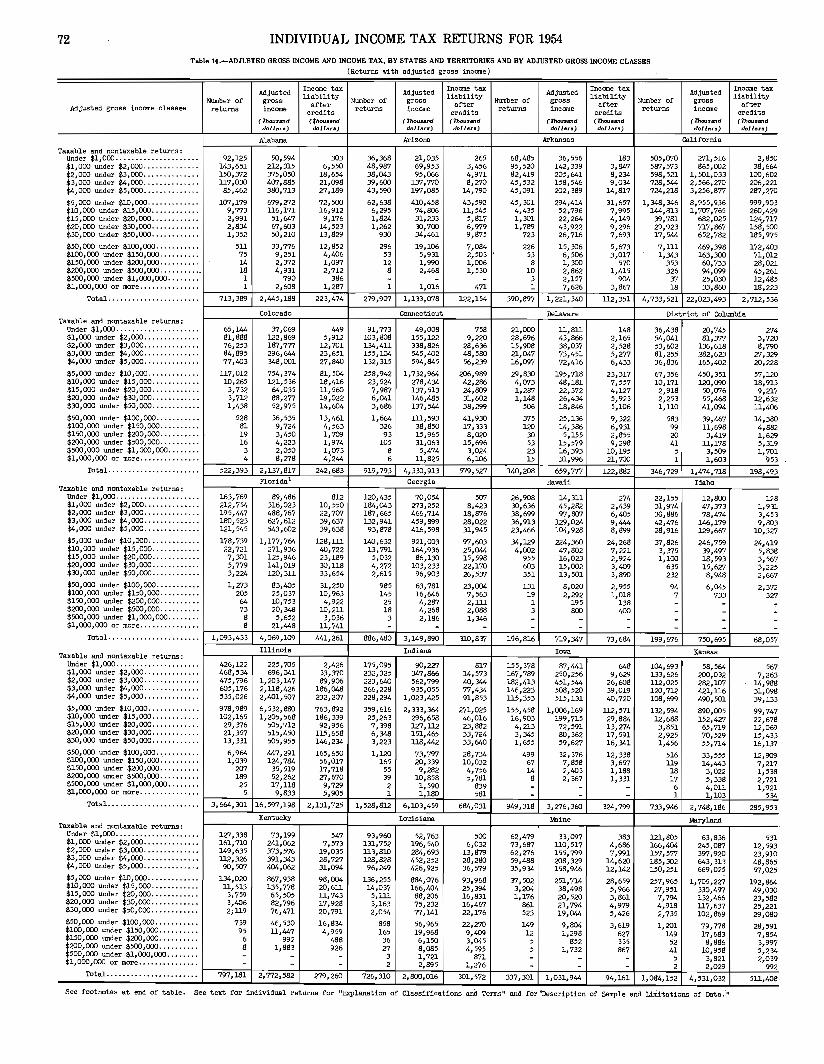
72 INDIVIDUAL INCOME TAX RETURNS FOR 1954Table H.-ADJUSTED GROSS INCOME AND INCOME TAX, BY STATES AND TERRITORIES AND BY ADJUSTED GROSS INCOME CLASSES
(Returns with adjusted gross income)
Income tax Adjusted Income tax Adjusted Income tax Adjusted Income taxAdjusted liability liability liability liabilityNumber of gross Number of gross after Number of grOSB after Number of gross afterAdjusted gross income classes returns income after returns income returns income returns incomecredits credits cred1ts credits
(ThouslI1Id (tho..,und (ThoLllJlInd (Thousand rJ1lousll1ld (Thou8lJtld (Thousand (ThousanddollllrlJ) dolllln,) dolllln) daHlin) dollau) dollau) dollau) dol lara)
Alabama Arizona Arkansas California
Taxable and nontaxable returns:68,485 36,556 183 505,070 271,516 2,850Under $1,000 ..................... 92,125 50,594 303 36,368 21,035 265
$1,000 under $2,000 .............. 143,651 212,315 6,550 48,987 69,953 3,456 95,520 142,339 3,847 587,573 865,002 38,664$2,000 under $3,000 .............. 150,372 375,050 18,654 38,043 95,066 4,971 82,419 205,641 8,234 598,521 1,501,033 100,602$3,000 under $4,000 .............. 117,030 407,885 21,098 39,600 137,770 8,270 45,532 158,546 9,034 728,544 2,566,270 206,221$4,000 under $5,000 .............. 85,462 380,713 27,189 43,590 197,085 14,790 45,091 202,389 14,817 724,218 3,256,877 287,270
$5,000 under $10,000 ............. 107,179 679,272 72,500 62,638 410,458 43,592 45,301 294,414 31,657 1,348,346 8,955,936 999,903$10,000 under $15,000 ............ 9,773 116,171 16,912 6,295 74,806 11,545 4,435 52,796 7,995 144,813 l,?rJ7,765 260,429$15,000 under $20,000 ............ 2,991 51,647 9,176 1,824 31,233 5,817 1,301 22,264 4,149 39,'781 682,025 124.,717$20,000 under $30,000............ 2,834 67,603 14,523 1,262 30,700 b,rr19 1,789 43,922 9,296 29,923 717,867 158,500$30,000 under $50,000......••.... 1,352 50,210 13,829 930 34,461 9,875 723 26,716 7,693 17,544 652,782 185,975
$50,000 under $100,000 .•......•.. 511 33,776 12,852 296 19,106 7,084 226 15,306 5,673 7,111 It69,398 172,403$100,000 under $150,000 .......... 75 9,251 4,406 53 5,931 2,503 53 6,506 3,017 1,343 163,300 71,012$150,000 under $200,000 ..••.•.... 14 2,372 1,097 12 1,990 1,006 8 1,300 570 353 60,733 28,021$200,000 under $500,000 .......... _ 18 4,931 2,712 8 2,468 1,530 10 2,862 1/4~ 326 94,099 45,261$500,000 under $1,000,000 ........ 1 790 386 - - - 3 2,157 904 37 25,030 12,485$1,000,000 or more ............... 1 2,608 1,287 1 1,016 471 1 7,626 3,867 18 33,860 18,223
Total ...................... . 713,389 2,445,188 223,474 279,907 1,133,078 122,154 390,897 1,221,340 112,351 4,733,521 22,023,493 2,712,536
Colorado CoIUlecticut Delaware District of ColumbiaTaxable and nontaxable returns:
Under $l,OClO ..................... 65,144 37,069 449 91,773 49,008 758 21,OClO 11,811 148 36,438 20,745 274$1,000 under $2,000 .............. 81,888 122,869 5,912 103,808 155,122 9,220 28,696 43,866 2,165 54,041 81,377 3,720$2,000 under $3,000.............. 76,253 187,777 12,701 134,411 338,826 28,636 15,908 38,037 2,528 53,602 136,618 8,790$3,OClO under $4,OClO....... : ...... 84,895 296,644 23,651 155,104 545,402 48,580 21,047 73,451 5,277 81,255 282,623 27,329$4,OClO under $5,OClO .............. 77,403 348,001 27,840 132,315 594,845 56,239 16,097 72,416 6,433 36,836 165,402 20,228$5,000 under $10,000 ............. 117,012 754,374 81,504 258,942 1,732,964 206,989 29,830 195,718 23,317 67,356 1..50,351 57,120$10, 0Cl0 under $1.5,000 ............ 10,265 121,536 18,416 23,524 278,434 42,286 4,0'73 48,181 7,557 10,171 120,090 18,913$15,000 under $20,000 ......•.•... 3,732 64,035 ll,560 7,987 137,513 24,809 1,287 22,372 4,127 2,918 50,0'76 9,217$20,000 under $30,000 ............ 3,712 88,277 19,022 6,041 146,485 31,602 1,148 26,434 5,923 2,253 55,468 12,632$30,000 under $50,000 ............ 1,438 52,975 14,604 3,686 137,544 38,299 506 18,846 5,106 1,110 41,094 11,406
$50,OClO under $l00,OClO........... 528 36,535 U,461 1,664 ill, 593 41,930 375 25,136 9,322 583 39,467 14,380$100,000 under $150,000 .•......•. 81 9,724 4,563 326 38,850 17,333 120 14,386 6,931 99 11,698 4,882$150,000 under $200,000 ......•... 19 3,450 1,709 93 15,965 8,020 30 5,155 2,855 20 3,419 1,629$200,000 under $500,000 ......•.•. 16 4,223 1,974 105 31,063 15,696 53 15,579 9,298 41 11,178 5,319$500,000 under $l,OOO,OClO ........ 3 2,050 1,0'73 8 5,474 3,024 23 16,393 10,195 5 3,509 1,701$l,OClO,OOO or more ............... 4 8,278 4;244 6 11,825 6,106 15 31,996 21,700 1 1,603 953
Total ....................... 522,393 2,U7,817 242,683 919,793 4,330,913 579,527 140,208 659,777 122,882 346,729 1,474,718 198,493F1.orida1 Georgia Hawaii Idaho
Taxable and nontaxable returns:Under $l,OClO ..................... 163,769 89,486 812 120,435 70,054 507 26,908 14,311 274 22,155 12,800 128$1,000 under $2,000 .............. 212,754 316,023 10,550 184,043 273,252 8,423 30,636 45,282 2,439 31,974 47,373 1,931$2,000 under $3,000 .............. 195,447 488,767 22,707 187,665 466,714 18,876 38,699 97,807 6,405 30,886 78,474 3,453$3,000 under $4,000 .............. 180,523 627,612 39,637 132,941 459,899 28,022 36,913 129,024 9,444 42,476 146,179 9,803$4,OClO under $5,OClO .............. 121,545 543,602 39,638 93,878 416,598 31,945 23,466 104,928 8,899 28,916 129,667 10,327$5,000 under $10,000 ............. 178,739 1,177,764 128,1ll 140,632 921,003 97,603 34,129 224,360 24,268 37,826 246,759 24,419$10,000 under $15,000............ 22,721 271,936 40,722 13,791 164,936 25,044 4,002 47,802 7,221 3,375 39,497 5,838$15,000 under $20,000 ............ 7,301 125,946 23,189 5,032 86,130 15,598 955 16,023 2,924 1,100 18,593 3,567$20,000 under $30,000 ............ 5,779 141,019 30,118 4,272 103,233 22,170 603 15,002 3,409 635 15,6Z7 3,225$30,000 under $50,000 ............ 3,224 120,311 33,654 2,615 96,903 26,537 351 i3,501 3,890 232 8,948 2,667$50,000 under $100,000 ........... 1,273 83,405 31,250 985 63,781 23,004 131 8,020 2,955 94 6,045 2,372$100,000 under $150,000 .......... 205 25,037 10,963 145 16,646 7,563 19 2,292 1,018 7 733 327$150,000 under $200,000 .......... 64 10,753 4,922 25 4,287 2,1ll 1 195 138 - - -$200,000 under $500,000 .......... 73 20,348 10,211 18 4,268 2,088 3 800 400 - - -$500,000 under $l,OClO,OOO ........ 8 5,652 3,036 3 2,186 1,346 - - - - - -$l,OClO,OOO or more ............... 8 21,448 11,741 - - - - - - - - -
Total ....................... 1,093,433 4,069,109 441,261 886,480 3,149,890 310,837 196,816 719,347 73,684 199,676 750,695 68,057Illinois Indiana Iowa KansasTaxable and nontaxable returns:
Under $1,000 ..................... 426,122 225,705 2,426 175,095 90,227 817 155,378 87,441 648 104,693 58,564 567$1,000 under $2,000 .............. 468,534 696,041 33,370 232,325 347,866 14,573 167,789 250,256 9,629 133,626 200,032 7,263$2,000 under $3,000 ......•....... 475,796 1,203,147 89,906 223,640 562,799 40,344 182,413 451,544 26,608 112,025 282,107 14,988$3,000 under $4,000 .............. 605,176 2,ll8,426 186,048 266,228 935,055 77,434 146,223 508,520 39,019 120,712 421,116 31,098$4,000 under $5,000 .............. 535,026 2,401,50'7 232,207 228,294 1,023,425 91,853 ~,353 515,131 40,720 108,699 490,501 39,133$5,000 under $10,000.........•.•. 978,989 6,532,880 763,892 359,616 2,333,364 271,025 155,458 1,006,169 112,571 132,594 890,005 99,747$10,000 under $15,000 ............ 102,165 1,205,568 186,339 25,263 296,658 46,016 16,903 199,715 29,884 12,688 152,4Z7 22,678$15,OClO under $20,OClO ............ 29,376 505,712 92,956 7,398 127,112 23,882 4,213 72,591 13,Z74 3,851 65,719 12,069$20,000 under $30,000 ............ 21,357 515,450 115,658 6,348 151,465 33,7<4 3,345 80,362 17,591 2,925 70,529 15,433$30, 0Cl0 under $50,OClO............ D,331 505,955 146,234 3,223 118,442 33,640 1,655 59,6Z7 16,341 1,456 55,714 16,137$50,(X)() under $100,000 .., ......... 6,964 447,291 165,650 1,120 73,797 28,734 499 32,376 12,338 516 33,555 12,909$100,000 under $150,000 •........• 1,039 124,784 56,017 165 20,339 10,032 67 7,858 3,657 119 14,443 7,217$150,000 under $200,000 .......... 207 35,519 17,718 55 9,282 4,756 14 2,403 1,188 18 3,022 1,538$200,000 under $500,000 ....•..... 189 52,262 27,670 39 10,858 5,781 8 2,367 1,331 17 5,338 2,721$500,(X)() under $l,(X)(),OClO ........ 25 17,118 9,729 2 1,590 839 - - - 6 4,011 1,921$1,OClO, 0Cl0 or more ............... 5 9,833 5,905 1 1,180 581 - - - 1 1 103 534
Total ....................... 3,664,301 16,597,198. 2,131,725 1,528,812 6,103,459 684,031 949,318 3,276,360 324,799 733,946 2,748,186 285,953Kentucky Louisiana Maine Maryland
Taxable and nontaxable returns:Under $1,000 ..................... 127,338 73,199 547 93,960 52,763 500 62,479 33,097 383 121,805 63,836 531$1,000 under $2,000 .............. 161,710 241,062 7,573 131,752 196,540 6,032 73,687 110,517 4,686 166,404 245,087 12,593$2,000 und~r $3,000 .............. 149,635 373,576 19,035 113,810 284,693 13,879 62,276 155,799 7,991 157,577 397,920 23,910$3,000 under $4,000 .............. 112,326 391,343 28,727 128,828 452,252 28,280 59,488 208,329 14,620 185,302 643,313 48,865$4,000 under $5,000 .............. 90,50'7 404,062 31,094 96,249 426,925 36,579 35,934- 158,946 12,142 150,251 669,025 57,025$5,000 under $10,000 ...•.•......• 134,020 867,938 98,004 U6,255 884,076 93,968 37,502 251,714 28,659 257,965 1,705,227 192,864$10,000 under $15,000 ..•.•.•..... 11,513 135,778 20,611 14,037 166,404 25,394 3,204 38,498 5,966 27,951 330,497 49,030$15,OClO under $20,(X)() ............ 3,759 65,505 ll,743 5,1ll 88,206 16,831 1,176 20,520 3,861 7,794 132,466 23,582$20,000 under $30,000 ............ 3,406 82,796 17,928 3,163 75,232 16,467 861 21,794 4,979 4,918 117,637 25,221$30,000 under $50,000 ............ 2jll9 76,471 20,791 2,054 77,141 22,176 523 19,044 5,426 2,735 102,869 29,080$50,000 under $100 /000 ........... 739 46,530 16,834 858 56,965 22,270 149 9,804 3,619 1,201 79,778 28,591$100,000 under $150,000 .......... 95 ll,447 4,959 165 19,968 9,409 12 1,298 627 149 17,683 7,854$150,000 under $200,000.......... 6 992 488 36 6,150 3,045 5 852 335 52 8,886 3,997$200,000 under $500,000 .......... 8 1,883 926 27 8,085 4,595 5 1,732 867 41 10,958 5,234$500,(X)() under $1,OOO,(X)() ........ - - - 3 1,721 871 - - - 5 3,821 2,039$1,OOO,(X)() or more ............... - - - 2 2,895 1,276 - - - 2 2,029 992
Total ....................... 797,181 2,772,582 279,260 726,310 2,800,016 301,572 337,301 1,031,944 94,161 1,084,152 4,531,032 511,408
See footnotes at end of table. See text for individual returns for "Explanstion of Classifications and Terms ll and for ''Description of SBmp1e and Limitations of Data."
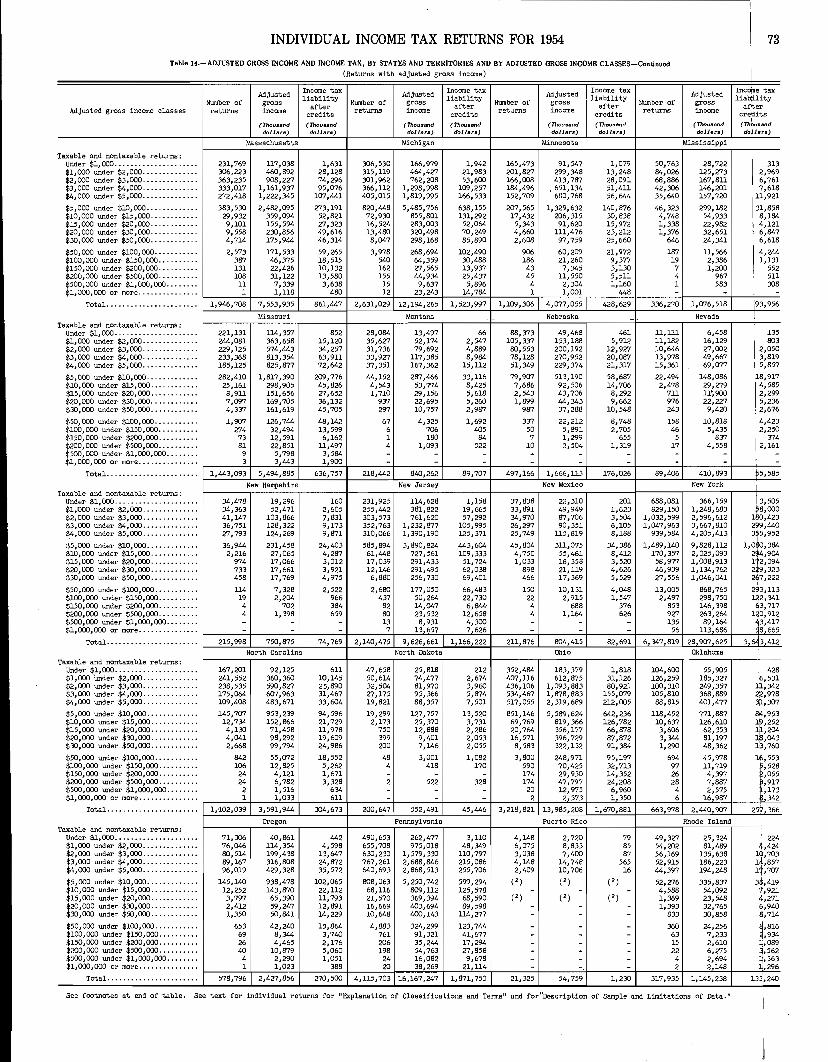
INDIVIDUAL INCOME TAX RETURNS FOR 1954
Table 14.-AOJUSTED GROSS INCOME AND INCOME TAX, BY STATES AND TERRITORIES AND BY ADJUSTED GROSS INCOME CLASSES-CoeLiouad
(Returns with adjusted gross income)
73
AdjustedIncome tnx Adjusted Income tax Adjusted IncOOIe tax Adjusted Incobe taxliability liability liability liab~lity
Number of gross after Number of grossafter NUmber of gross after Number of gross
afterAdjusted gross income classes returns income credits returns incomecredits returns income credits returns income credits
(ThoUlJltod (Thouund ('nIoulJlJnd (Thouund (11Jouumd (Thou!'lfJOd (Thoulland (Th~usanddollan) doJlllrtJ) dol IttI'll) dollorll) dol lars) dol lars) doJJlJnlJ dopars)
Massachusetts Michigan Minnesota Mississippi
Taxable nnd nontaxable returns:
IUnder $1, 000 .......... ........... 231,769 117,038 1,631 306,530 166,979 1,942 165,473 91,547 1,079 50,763 28,722 313$1,000 under $2,000 .............. 306,223 460,892 28,128 315,119 464,427 21,983 201,827 299,348 13,248 84,026 125,273 2,969$2,000 under $3,000 .............. 363,235 908,227 74,296 301,962 762,208 53,600 166,008 413,787 28,091 68,886 167,811 6,761$3,000 under $4,000 .............. 333,017 1,161,937 95,076 366,112 1,298,998 109,257 184,496 , 651,134 51,411 42,306 146,201 7,618$4,000 under $5,000 .............. 272,418 1,222,345 107,441 405,015 1,819,995 166,533 152,709 680,768 56,644 35,640 157,720
111
'921$5,000 under $10,000 ............. 383,530 2,482,095 273,191 820,448 5,485,756 638,155 207,565 1,329,632 140,876 46,323 299,182 31,858$10,000 under $15,000 ............ 29,932 359,094 52,821 72,930 855,801 131,292 17,432 206,315 30,838 4,748 54,933 8,164$15,000 under $20,000 ............ 9,101 155,594 27,323 16,524 283,003 52,064 5,343 91,620 15,972 1,338 22,982 4,121$20,000 under $30,000 ............ 9,558 230,856 49,616 13,480 320,498 70,249 4,660 lll,476 23,212 1,376 32,651 6,847$30,000 under $50,000 ............ 4,714 175,944 46,314 8,047 298,168 85,890 2,608 97,759 25,660 646 24,341 6,618
$50,000 under $100,000 ........... 2,573 171,533 59,265 3,978 268,694 102,490 906 60,209 21,972 187 11,566
I4,244
$100,000 under $150,000 .......... 387 46,375 18,515 540 64,359 30,488 186 21,260 9,377 19 2,386 1,131$150,000 under $200,000 .......... 131 22,426 10,132 162 27,565 13,937 43 7,345 3,130 7 1,200 i 552$200,000 under $500,000 .......... 108 31,122 13,580 155 44,934 25,437 45 11,550 5,511 4 967 511$500,000 under $1,000,000 ........ 11 7,339 3,638 15 9,637 5,896 4 2,304 1,160 1 583 308$1,000,000 or more ............... 1 1,118 480 12 23,243 14,764 1 1,001 448 - - -
Total ....................... 1,946,708 7,553,935 861,447 2,631,029 12,194,265 1,523,997 1,109,306 4,077,055 428,629 336,270 1,0'76,518 193,956
Missouri Montana - - Nebraska NevadaTaxable and nontaxable returns:
Under $1,000 ..................... 221,131 114,357 852 28,084 13,497 66 88,373 49,468 461 11,111 6,458 135$1,000 under $2,000 .............. 244,081 363,658 15,120 35,627 52,174 2,547 105,337 153,188 5,912 11,182 16,129
I 803$2,000 under $3,000 .............. 229,125 574,443 34,257 31,736 79,692 4,869 80,553 200,192 12,927 10,646 27,002 2,050$3,000 under $4,000 .............. 233,368 813,354 63,911 33,927 117,385 8,984 78,128 270,952 20,087 13,978 49,667 3,819$4,000 under $5,000 .............. 185,125 825,877 72,642 37,351 167,362 15,ll2 51,349 229,374 21,317 15,361 69,077 \ 5,857
$5,000 under $10,000 ............. 282,410 1,817,390 209,776 44,152 287,466 33,116 79,90'7 513,190 58,687 22,494 148,086 ~8,917$10,000 under $15,000 ............ 25,161 298,905 45,826 4,543 53,774 8,425 7,666 92,506 14,706 2,478 29,279
14
'585$15,000 under $20,000 .........•.. 8,911 151,656 27,652 1,710 29,156 5,618 2,543 43,706 8,292 711 11',900 2,299$20,000 under $30,000 ............ 7,097 169,705 36,132 937 22,695 5,260 1,699 44,343 9,662 976 22,227 5,236$30,000 under $50,000 ............ 4,337 161,619 45,705 297 10,757 2,9@:7 987 37,268 10,548 243 9,420 : 2,676
$50, 000 under $100,000 ........... 1,90'7 126,744 48,142 67 4,325 1,692 337 22,212 8,748 158 10,818 4,423$100,000 under $150,000 .......... 274 32,494 13,599 6 706 405 50 5,891 2,705 46 5,435 2,250$150,000 under $200,000 .......... 73 12,591 6,162 1 180 84 7 1,299 655 5 837 374$200,000 under $500,000 .......... 81 22,851 11,497 4 1,093 522 10 2,504 1,319 17 4,558
12,16:
$500,000 under $1,000,000 ........ 9 5,798 3,584 - - - - - - - -$1,000,000 or more ............... 3 3,443 1,900 - - - - - - - - -
Total .................. ..... 1,443,093 5,494,885 636,757 218,442 840,262 89,707 497,166 1,666,113 176,026 69,406 410,893 ~5,585
New Hampshire New Jersey New Mexico New York ITaxable and nontaxable returns:
\ 3,505Under $1,000 ..................... 34,478 19,296 160 231,925 114,628 1,158 37,838 22,310 201 688,081 366,159$1,000 under $2,000.............. 34,363 52,471 2,605 255,442 381,822 19,665 33,891 49,949 1,623 829,150 1,248,683 $8,000$2,000 under $3,000 .............. 41,147 103,866 7,831 303,573 761,620 57,292 34,970 fr"1,706 3,504 1,032,599 2,596,612 1$0,423$3,000 under $4,000 .............. 36,751 128,322 9,173 352,763 1,232,@:77 105,995 26,297 90,351 6,105 1,047,963 3,667,810 2$9,440'fI.,OOO under $5,000 .............. 27,793 124,269 9,871 310,066 1,390,190 125,371 25,749 115,819 8,188 939,584 4,205,413 3$5,952
'~5,000 under $10,000 ............. 36,944 231,458 24,403 585,894 3,890,824 443,604 45,804 311,075 34,386 1,489,140 9,828,112 l,O~O,384$10,000 under $15,000 ............ 2,216 27,065 4,287 61,448 727,561 109,333 4,750 55,461 8,412 170,357 2,025,093 ~4,904$15,000 under $20,000 ............ 974 17,066 3,012 17,039 291,433 51,724 1,033 18,358 3,520 58,977 1,008,913 112,094$20,000 under $30,000 ............ 733 17,661 3,921 12,146 291,495 62,038 898 21,119 4,626 46,939 1,134,762 29,323$30,000 under $50,000 ............ 456 17,769 4,975 6,880 256,730 69,401 466 17,369 5,529 27,556 1,046,041 267,222
$50,000 under $100,000 ........... 114 7,328 2,522 2,680 177,050 66,4ij3 150 10,131 4,048 13,005 868,765 ti3,113$100,000 under $150,000 ....•..... 19 2,204 966 437 50,264 22,730 22 2,915 1,547 2,497 296,750 2,341$150,000 under $200,000 .......... 4 702 364 82 14,047 6,844' 4 688 376 853 146,398 13,717$200,000 under $500,000 .......... 4 1,398 659 80 23,532 12,658 4 1,164 626 927 263,264 1 0,912$500,000 under $1,000,000 .•...... - - - 13 8,931 4,300 - - - 135 89,164 43,417*1,000,000 or more ............... - - - 7 13,657 7 626 - - - 56 113 686 18 665
Total .. , ................... . 215,996 750,875 74,769 2,140,475 9,626,661 1,166,222 211,876 804,415 82,691 6,347,819 28,907,625 3,643,412North Carolina North Dakota Ohio Oklahoma
Texab1e and nontaxable returr.s:Under $1,000 ........ , ............ 167,201 92,125 611 47,658 25,818 212 352,464 183,379 1,818 104,600 55,905 428$1,000 Under $2,000 .............. 241,552 360,360 10,145 50,614 74,477 2,674 407,116 612,875 31,126 126,259 165,327 ~,531t,2,000 under $3,000 ...•..•....... 236,535 590,827 25,890 32,504 81,970 3,960 436,106 1,093,883 80,921 100,310 249,357 ,342~.3,OOO under $4,000 .............. 175,064 607,963 31,467 27,175 95,366 5,874 534,467 1,878,683 155,079 105,810 368,889 2';2,976$4,000 under $5,000 .............. 109,408 483,671 33,604 19,821 88,357 7,501 517,055 2,319,689 212,005 66,615 401,477 J,l,307
$.5,000 under $10,000 ............. 145,707 953,239 94,596 19,299 127,757 13,520 851,146 5,589,624 642,236 118,452 771,887 ~,953
$10,000 under $15,000 ............ 12,734 152,866 21,729 2,173 25,370 3,731 69,769 619,366 126,782 10,637 126,610 ~,252$15,000 under $20,000 ............ 4,130 71,458 11,978 750 12,666 2,286 20,764 356,177 66,876 3,606 62,353 ,204$20,000 under $30,000 ...........• 4,041 96,292 19,609 399 9,401 2,053 16,571 396,729 87 ,872 3,344 61,197 J.lJ,043$30,000 under $50,000 ...........• 2,668 99,794 24,986 200 7,146 2,055 8,583 322,132 91,384 1,290 48,362 lP,760
$50,000 under $100,000 ...•....... 842 55,072 18,552 48 3,001 1,082 3,600 248,971 95,197 694 45,978 1~,553$100,000 under $150,000 .......... 106 12,625 5,262 4 416 170 590 70,425 32,713 97 11,719 5,528$150,000 under $200,000 .......... 24 4,121 1,671 - - - 174 29,930 14,352 26 4,397 ~,055$200,000 under $500,000 .......... 24 6,782 3,326 2 522 326 174 47,797 24,208 28 7,887 , ,917$500,000 under $1,000,000 .... .... 2 1,516 634 - - - 20 12,975 6,960 4 2,575 ~:173$1,000,000 or more ............... 1 1,033 611 - - - 2 2 373 1 350 6 16987 342
Total ..... .................. 1,.102,039 3,591,944 304,673 200,647 552,491 45,446 3,218,821 13,985.. 208 1,670,861 663,978 2,440.. 907 251,366
Oregon Pennsylvsnia Puerto Rico Rhode Island ITaxable and nontaxable returns:
Under $1,000 ..................... 71,306 40,861 442 490,653 262,477 3,110 4,148 2,720 79 49,327 25,324 224$1,000 under $2,000 .............. 76,046 114,354 4,596 655,708 975,016 48,349 6,075 8,833 85 54,202 61,469 4,424$2,()()() under $3,000 .............. 80,514 199,438 13,647 630,230 1,579,330 110,797 3,038 7,400 87 56,169 135,636 1@,703$3,000 under $4,000 ..•...•....... 89,167 316,808 24,872 767,261 2,688,846 215,066 4,146 14,746 565 52,915 186,223 1~,857$1.. ,000 under $5,000 .............. 96,019 429,328 35,572 640,693 2,868,513 255,706 2,409 10,706 16 44,397 194,248 li,707
$5,000 under $10,000 ....•........ 145,140 938,476 102,065 808,063 5,250,742 599,294 (2) ( 2) (2) 52,276 335,837 3~,419$10,000 under $15,000 ............ 12,252 143,870 22,112 68,116 809,112 125,576 - - - 4,588 54,092 1,921$15,000 under $20,000 ............ 3,797 65,390 11,793 21,570 369,394 68,590 (2) ( 2) (2) 1,369 23,548 4,271:20,000 under $30,000 ............ 2,412 59,247 12,891 16,669 403,694 69,596 - - - 1,393 32,765 ~,940
30,000 under $50,000 ............ 1,350 50,841 14,229 10,648 400,143 114,277 - - - 633 30,858 ,714
$50,000 under $100,000 ........... 653 42,240 15,864 4,883 324,299 123,744 - - - 360 24,256 a,816$100,000 under $150,000 ......•.•. 69 8,344 3,740 761 91,321 '+1,677 - - - 63 7,233 ~,934$150,000 under $200,000 ...••..... 26 4,465 2,176 206 35,244 17,294 - - - 15 2,610 ~,089$200,000 under $500,000 ......•... 40 10,879 5,060 198 54,763 27,656 - - - 22 6,275 ~,562$500,000 under $1,000,000 ........ 4 2,290 1,051 24 16,062 9,676 - - - 4 2,694 ,363$1,000,000 or more ............... 1 1,023 388 20 36,269 21,114 - - - 2 2,148 lj,296
Total ...................... . 576,796 2,427,856 270,500 4,115,703 16,167,247 1,871,750 21,325 54,759 1,230 317,935 1,145,238 133;,240
See footnotes at end of table. See text for individual returns for "Explanation of Classifications and Terms" and for "Description of sample and Limitations of Data."
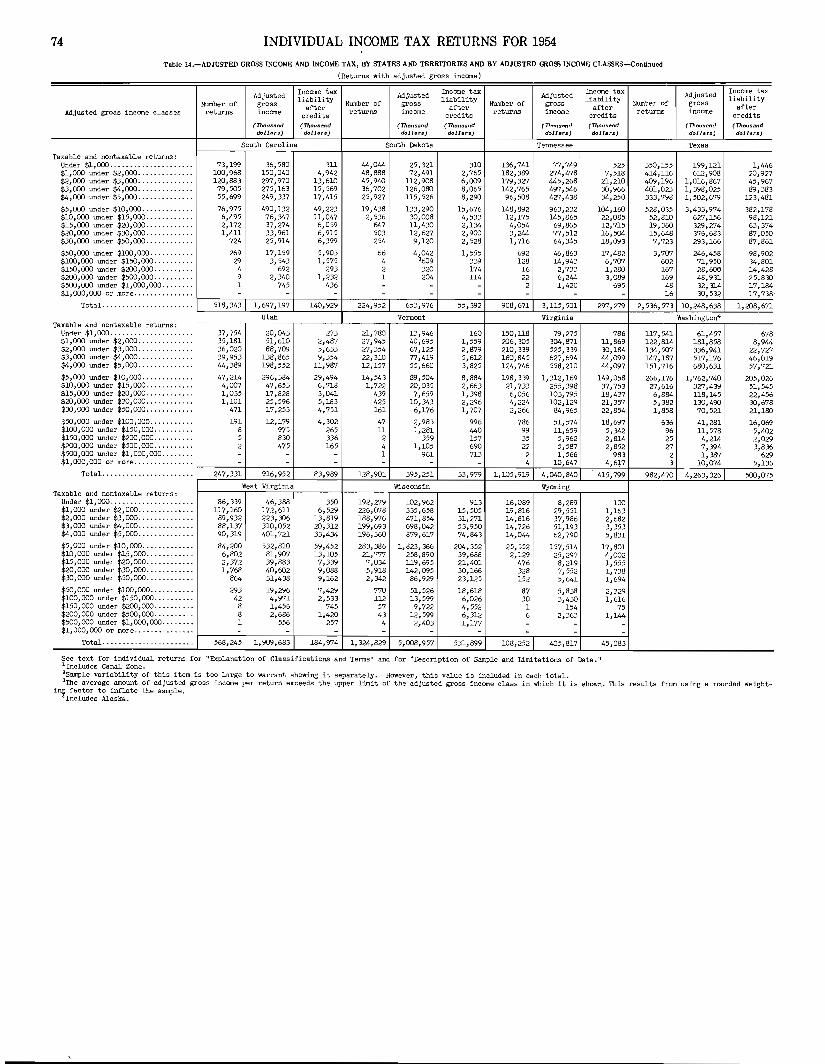
74 INDIVIDUAL INCOME TAX RETURNS FOR 1954
Tobl. H.-ADJUSTED GROSS INCOME AND INCOME TAX, BY STATES AND TERRITORIES AND BY ADJU5TED GROg;; INCOME CLASSES-Continued
(Returns with adjusted gross income)
Income tax AdjustedIncome tax Adjusted Income tax Adjusted Income tax
Adjusted liability liability liability liabilityNumber of Nwnber of Number of gross Nwnber of grossgross after
E;ross after after afterAdjusted groas income classes returns income returns income credits
returns income credits returns income creditscredits(17lo11sand (Thousand (Thol1sand (Thol1sand (Thollsand (Thousand (Thousand (ThousanddollMs) dollars) dol',us) dollars) dollars) dollars) dollar:s) dollars)
South Carolina South Dakota Termessee Texas
Taxable and nontaxable returns:Under $1,000 .................. ... 73,199 36,580 3ll 44,044 25,321 310 136,741 77,749 525 350,155 199,121 1,446$1,000 W1der $2,000 .......... .... 100,968 150,040 4,942 48,888 72,491 2,765 182,389 274,478 7,518 414,116 612,908 20,927$2,000 W1der $3,000 ......... ..... 120,883 297,970 13,610 45,940 112,908 6,009 179,327 445,268 21,210 409,196 1,016,867 45,967$3,000 W1der $4,000 .............. 79,505 275,163 15,569 36,702 126,080 8,065 142,765 497,546 30,966 401,023 1,398,025 89,383$4, 000 under $5, 000 .............. 55,699 249,337 17,415 25,927 li5,526 8,290 96,508 427,438 34,250 333,798 1,502,679 123,481
$5,000 under $10,000 ............. 76,975 490,132 49,223 19,438 133,290 15,676 148,892 963,232 104,160 528,035 3,433,974 382,178$10,000 under $15,000 ............ 6,495 76,347 ll,047 2,536 30,008 4,533 12,175 145,865 22,085 52,810 627,156 98,121$15,000 under $20,000............ 2,172 37,274 6,059 647 11,430 2,134 4,054 69,865 12,715 19,360 329,274 63,374$20,000 under $30,000 ............ 1,411 33,961 6,915 503 12,627 2,900 3,244 77,512 16,504 15,648 376,683 87,050$30,000 under $50,000 ............ 724 25,914 6,399 254 9,120 2,528 1,716 64,345 18,093 7,723 293,166 87,861
$50,000 under $100,000 ........... 269 17,159 5,903 66 4,042 1,555 692 46,863 17,482 3,707 246,458 98,902$100,000 under $150,000 .......... 29 J,543 1,575 4 '609 339 128 14,943 6,707 602 71,950 34,801$150,000 under $200,000 .......... 4 692 293 2 320 174 16 2,733 1,280 167 28,600 14,428$200,000 under $500,000 .......... 9 2,340 1,232 1 204 ll4 22 6,244 3,089 169 48,931 25,830$500,000 Wlder $1,000,000 ........ 1 745 436 - - - 2 1,420 695 48 32,314 17,184$1,000,000 or more ............... - - - - - - - - - 16 30,532 17,738
Total ....................... 518,343 1,697,197 140,929 224,952 653,976 55,392 908,671 3,115,501 297,279 2,536,573 10,248,638 1,208,671
utah Vermont Virginia Washington4
Taxable and nontaxable returns;Under $1,000 ..................... 37,754 20,043 273 21,780 13,946 160 150,ll8 79,275 786 117,~41 61,457 678$1,000 Wlder $2,000 .............. 35,181 51,610 2,487 27,945 40,695 1,559 206,305 304,871 1l,869 122,B14 181,858 8,944$2,000 Wlder $3,000 .............. 36,020 88,709 5,633 27,354 67,125 2,879 210,339 525,339 30,184 134, ~307 336,941 22,727$3,000 Wlder $4,000 .............. 39,953 138,865 9,354 22,310 77,419 5,612 180,845 627,694 44,099 147,187 517,176 46,019$4,CXJO Wlder $5,000 .............. 44,389 198,552 ll,987 12,157 55,660 3,825 124,746 558,210 44,097 151, '716 680,631 57,721
$5,000 Wlder $10,000 ............. 47,214 296,384 29,494 14,543 89,504 8,884 198,339 1,312,169 149,058 266,176 1,762,740 205,026$10,000 under $15,000 ............ 4,007 47,653 6,718 1,722 20,035 2,663 21,733 255,398 37,753 27,616 327,439 51,545$15,000 Wlder $20,000 ............ 1,035 17,828 3,041 439 7,659 1,398 6,056 103,795 18,437 6,884 118,145 22,456$20,000 under $30,000 ............ 1,101 25,596 5,183 425 10,343 2,296 4,224 102,129 21,357 5,382 130,490 30,678$30,000 under $50,000 ............ 471 17,253 4,751 161 6,176 1,707 2,266 84,965 22,854 1,858 70,521 21,180
$50,000 under $100,000 ........... 191 12,179 4,302 47 2,983 996 786 51,574 18,697 636 41,281 16,069$100,000 under $150,000 .......... 8 975 265 11 1,281 440 99 11,659 5,342 96 11,578 5,402$150,000 Wlder $200,000 .......... 5 830 336 2 359 157 35 5,962 2,814 25 4,214 2,029$200,000 Wlder $500,000 .......... 2 475 165 4 1,105 690 22 5,587 2,852 27 7,394 3,836$500,000 Wlder $1,000,000 ........ - - - 1 961 713 2 1,566 983 2 1,387 629$1,000,000 or more ............... - - - - - - 4 10,647 4,6:1;.7 3 10,074 5,136
Total ....................... 247,331 916,952 83,989 128,901 395,251 33,979 1,105,919 4,040,840 415,799 982,470 4,263,326 500,075
West Virginia Wisconsin WyomingTaxable and nontaxable returns:
Under $1,000 ..................... 86,339 46,388 350 192,279 102,962 913 16,089 8,289 100$1,000 under $2,000 .............. 117,160 172,6ll 6,529 226,078 335 J 658 15,505 19,816 29,551 1,163$2,000 under $3,000 .............. 89,932 223,306 13,819 188,976 471,854 31,271 14,816 37,986 2,682$3,000 under $4,000 .............. 88,137 310,052 20,312 199,693 698,042 53,950 14,726 51,193 3,353$4,000 Wlder $5,000 .............. 90,319 401,721 33,434 196,360 879,617 74,843 14,044 62,790 5,831
$5,000 under $10,000............. 84,200 532,810 59,452 283,386 1,823,366 204,352 25,552 157,514 17,801$10,000 under $15,000 ............ 6,802 81,907 13,105 21,777 258,890 39,688 2,129 25,297 4,002$15,000 under $20,000 ............ 2,372 39,883 7,339 7,034 119,695 21,401 476 8,219 1,555$20,000 Wlder $30,000 ............ 1,768 40,602 9,088 5,918 142,095 30,166 328 7,552 1,738$30,000 under $50,000 ............ 864 31,438 9,162 2,342 86,929 23,125 152 5,641 1,694
$50,000 under $100,000 ........... 293 19,296 7,429 770 51,526 18,618 87 5,838 2,329$100,000 under $150,000 .......... 42 4,971 2,533 ll2 13,599 6,026 30 3,430 1,616$150,000 under $200,000 .......... 8 1,456 745 57 9,722 4,552 1 154 75$200,000 under $500,000 .....•.... 8 2,686 1,420 43 12,599 6,312 6 2,363 1,144$500,000 Wlder $1,000,000 ........ 1 556 257 4 2,403 1,177 - - -$1,000,000 or more ....... ' ....... - - - - - - - - -
Total ........... ........... , 568,245 1,909,683 184,974 1,324,829 5,008,957 531,899 108,252 405,817 45,083
See text for individual returns. for lIExplanation of Classifications and Terms n and for "Description of Sample and Limitations of Dat&."J. Includes Canal Zone.2Sample variability of this item is too large to warrant showing it separately. However, this v&lue is included in each totaLJThe average amount of adjusted gross income per return exceeds the upper limit of the adjusted gross income class in which it is sholm. This results from using a rOWlded weight-
i~I~:~~~~st~;~;~te the sample.

INDIVIDUAL INCOME TAX RETURNS FOR 1954
Table I~.-RETURNSWlTR SELF·EMPLOYMENT TAX-ADJUSTED GROSS INCOME .~ND SELF·EMPLOYMENT TAX, BY ADJUSTED GROSS INCOME CLASSES
75
Returns with self-employment tax Returns with self-employment taxbut wi tilout income tax
2,531 302 J 046651 111,445616 174}33781 53,53130 62,760
4,211,656 4 22 ,510,439 1,148,895 4 2,063,570
Adjusted gross income classes
1 No adjusted gross income .•.....................................................
2 Under $600 .3 $600 under $1,000 .4 $1,000 under $1,500 .5 $1,500 under ~;2,Ooo .6 $2,000 under $2,500 .
7 $2,500 under $3,000 .8 $3,000 under $3,500 .9 $3,500 under $4,000 .
10 $4,000 under $4,500 .n $4,500 under $5,000 .
J.2 ~5,000 under $6,000 .J.3 $6,000 under $7,000 .14 $7,000 under $8,000 .15 :1;8,000 under $9,000 .16 ~,9,OOO under $10,000 .
17 ~,10,000 under $15,000 .18 $15 J Ooo under $20,000 .J.9 $20,000 under $30,000 .20 $30,000 under $50,000 .2.1 $50,000 under $100,000 ..
22 $100,000 under $150,000 ..23 .7>150,000 under $200,000 .24 $200,000 under $500,000 .25 $500,000 under $l,OOOJooo .26 $1,000,000 or more .
27 Total .
Number ofreturns
(1)
13 ,305
89,829224,318318,161359,380345 J 486
366,493351,353305,975273,830213,792
331 J 647226,415160,985118,26289,423
217,07082,45868,00436,39215,169
Adjustedgrossincome
(ThOU!lJJnd
dollars)
(2)
135,900
41,316176,942401,386632,036778,356
1,004,362I J 141 J 419l,145 J 5341,161,9681,013,465
1,823,0251,466 J 335I, 198 J 9791,000,984
844,610
2,614,0571,416,4281,622,503I J 363,462
995,053
Self-employment tax
(ThoU8lJnddollars)
(3)
756
1,6705,294
10,95215 , 99419,181
24,73326,70125,05223,22318,288
29,30720,63515,33311,1888,684
22,4468,7977,2423,9591,644
2717166
83
301,498
Number ofreturns
(4)
13,305
89,829181,461230,087210,398136,807
124 J 34377 J 69142,35424,754
7,262
7,783(2)(2 )
no
Adjustedgrossincome(Thou~lIl1d
dollllr!J)
(5)
41 J 316142 J443286,785369,954309,606
337,242250,081158,695104,95834,140
41 J 886(2)(2 )
1,247(')(2)(')(2 )
325
ISe1f-emp~oy
ment tal<
(ThousatJddollars)
(6) I!756
1,670 24,B39 37,845 49, b8 57,776 6
,.
8,i194 75,824 83,837 92, i09 10
~91 n,699 12
(') 13
(2) II _ i~- 16
(10 1718192021
I
53,404 27
See text for individual returns for "Explanation of Classifications and Terms ll and for "Description of Sample and Limitations of Data. II
1Adjusted gross defiei t.2Sample variability of this item is too large to warrant showing it separately. However, this value 1s included in each total.3Less than $500.4Adjusted gross income less adjusted gross deficit.
445805 0 ~57 - 6

76 INDIVIDUAL INCOME TAX RETURNS FOR 1954
Tabl. 16.-RETURNS WITH SELF·EMPLOYMENT TAX-ADJUSTED GROSS iNCOME AND SELF·EMPLOYMENT TAX, BY STATES AND TERRITORiES
(Returns with adjusted gross income)
1 A],abdffi3 •••••••••••••••••••••••••••••••••••••••••••••••••••••••••••••••.••••••••••••••••••••••••••••.•••••••••••••••••••••••••••••.•
2 Arizona .••.......•..........•...••.......•.•...•..............••......•.....•.•.•.....••••••.••••••........•...•..•••..•.•...•.....3 Arkansas..............•.....•....•••••.............•.....•...•••...•................•...••.•.••.•.•..............••••••••••...•..•.4 California .........................................•......•...........•.....................•.•...•••.•..........•.....•...........5 Colorado...........•............•............•..............................................••.•..................••..•..•........•
11 Hawaii ..................•.........................................................................................................•12 Idaho•.................................•........................•...............................................•..........••..•...13 Illinois.......................•................................................................................................ , ..14 Indiana ........................................................................................................•.•........•..•.....15 Iowa ...............•...............................•........................................•................................•.•...
36 Oklahoma..............................................•...................................................•...•....................37 Oregon , '............................................•....•...38 Pennsylvania..................................................................................................................••.•.39 Puerto Rico '" , ..•.................................. " .................•......•.•...40 Rhode Island .
31 New Mexico " " . '" ...........•....•..... " ......................•.•..32 New york...............................................................................................................•...........33 North Carolina .....................................................................•..................•.........................•..34 North Dakota ............•..............•................•..........................................................................35 Ohio.....................•...........•............•.•.......•.•....................•..................................•..•.....•...
Number of Adjusted Self-employreturns with gross ment taxseIf_emp1oy_ tncomement tax (Thousand (Thouund
dollars) dollan)
(1) (2) (3)
50,036 228,168 3,117 123,273 128,772 1,792 237,917 152,736 2,237 3
389,70'1 21439 1926 29 1621 442 1617 252,276 2 1991 5
62 1771 3641579 4 1654 68,448 47,148 629 7
13,692 85,559 916 8102,720 497 1 99/.. 7,127 9
67,271 352,024 4,2m 10
9,910 64,190 627 1128,433 125,615 2,112 12
258,543 1,602,577 19 1909 13120,366 594,843 8,5~ 1486,494 421,795 6,347 15
61,001 336,859 4,394 1662,525 299,723 4,113 1756,900 323,709 3,867 1830,541 111,019 1,763 1960,701 340,690 4,488 20
119,609 560,919 8,115 211~1840 1,076,863 12,844 22
88,445 434 1041 6,419 2329,260 128,513 2 1050 24
100,258 531,883 6 1958 25
17,261 103,208 11395 2641,253 193,081 2,890 27
6,185 46,870 522 2816,926 60,944 1,144 29
156,437 806,541 11,618 30
14,002 83,561 1,096 31482,700 2,734 1423 39,942 32
79,662 342,689 4 1815 3315,778 67,019 1,0'14 34
204,137 1,093,422 15,175 35
70,010 328,543 4,811 3659,752 353,657 4,647 37
269,357 1,414,402 19,719 3839
19,676 82,954 1,3m 40
32,458 152,045 2,112. 4120,308 90,861 1,539 4261,761 283,367 3,778 43
217,370 1,184,343 14 ,275 44171775 99,475 1,397 45
9,960 33,279 553 4669,672 351,516 4 1591 47S7,720 475,602 5,922 4835,841 145,60'1 2,070 49
106,082 50'1,264 7,929 506,274 35,722 409 51
4,194,635 22,5721816 304,591 52
states and Territories
Total..................•.................................................•................... , " .. " ........•................52
46 Vermont.............................................................................................................•...•..........47 Virginia ..............................................................•...........................................................•48 Washington2.................................................•......................................•............................ '"49 West Virginia ...............................................................•.................•..............•.......•.........•...50 Wisconsin '.......................................................................•...............•...............•.51 Wyoming...............................................................•..........................................•••..••...........
41 Soutil Carolina ............................•....•................................................................•..........•......•42 South Dakota '........................................•...................................................•.................43 Tennessee.... . .........................................................................................•.•.....•.•.•..............44 Texas ...................................................................................................•.............•.........•..45 Utah.......................•..••...........•........•........•••••....•........•.................•....•••...•..•••••...•..•••••••••
6 Connecticut........•............................•........•........................•.................•.•.....•.•..........••.•.•....7 Delaware................•..•.............•......•...•...............•........•...•.••...................•..•..•...•....•.•..•.•...•8 District of Columbia ..........•.............•......................•...............•...•..........................•...............•9 F1orida 1....................................................................................................•.................•....
10 Georgia ·........................................................•... " . "
26 J.tontana .......................................•............................•..............•.•...............•......................•27 Nebraska ..............................................................•...•.............•.•..............................•.........28 Nevada ....................•.........................................•.............•....................................•.•.........29 New Hampshire " " " , " ' ......................•............•....•.••30 New Jersey..•..............................................•.................................. " .............•..... ' .....•.•...•...
21 Massachusetts...........................................................................................•.......•...............•..22 Michigan....................................•.................•..........•...................................•.........•.•..•••.•.•23 Minnesota..............................•.............................•...............................•......................•.•.•..24 Mississippi..........................•........................................•...............................•.............•.•.. ,.25 Missouri ...........................•..........................................•......•.......... ·....................•............••
16 Kansas ..........................................................•............................................•.....................17 Kentucky...................•..................................................................................................••.•.18 Louisiana....................•....................•....................................................•...................•.....•.19 Maine......................................................•.................................................................•.•.•.20 Maryland ......................•.................................................................................•...•....•.•.•....•
See text for individual returns for rrExplanation of Classifications and Terms rr and for "Description of Sample and Limitations of Data."lIncludes Canal Zone.2Inc1udes Alaska.

HISTORICAL TABLES
INDIVIDUAL RETURNS, 1945-1954Page
17. Number of returns by major characteristics, adjusted gross incomeand deficit, and tax_ _______________________________________ 79
18. Returns with income tax-number, adjusted gross income, incometax, and average tax, by adjusted gross income classes_ _________ 80
19. Sources of income by type____________________________________ 8120. Selected sources of income by adjusted g\oss income classes_ _______ 8221. Itemized deductions by type__________________________________ 8422. Returns with adjusted gross income-number, adjusted gross in-
come, and income tax, by States and Territories .. ____ 8,)
77


INDIVIDUAL INCOME TAX RETURNS FOR 1945-1954
Tabl. 17.-NUMBER OF RETURNS BY MAJOR CHARACTERISTICS, ADJUSTED OROSS INCOME AND DEFICIT, AND TAX. 1945-1954
79
Items 19541 1953 1952 1951 1950 1949 1948 1947 1946 1945
Number of returns} tota1 2 •••••••••••••••••••••••• 56,747 J OO8 57,838,184 56,528,817 55,447,009 53,060,098 51,814,124 52,072,006 55,099,008 52,816,547 49j932,783
Returns with adjusted gross income, totaL ..... 56,306,704 57,415,885 56,107,089 55,042,597 52,655,564 51,301,910 51,745,697 54,799,936 52,600,470 49;750,991Taxable returns ..........•................... 1+2,6.19,755 45,206,129 43,866,832 42,636,797 38,186,682 35,628,295 36,411,248 41,578,.524 37,915,696 42)650,502Nontaxable returns ..................•........ 13,686,949 12,209,756 12,240,257 12,405,800 14,468,882 15,673,615 15,334,449 13,221,412 14,684,774 7;100,489
Returns with no adjusted gross income, tota1.2 .. 440,304 422,299 421,728 404,412 404,534 512,214 326,309 299,072 216,0771181' 79~
Returna with only self-employment tax .....•... 13,305 17,022 9,441 11,813 - - - - -Nontl..xable returns.2 ..•........•..........•... 426,999 405,277 412,287 392,599 404,534 512,214 326,309 299,072 216,077 181,792
Number of- ITaxable returns .....•.....•.........•.......... '.2,633,060 45,223,151 43,876,273 42,648,610 38,186,682 35,628,295 36,411,248 41,578,524 37,915,696 42;650,502Nontaxable returns 2.......•....•.•...........•. 14,113,948 12,615,033 12,652,544 12,798,399 14,873,416 16,185,829 15,660,758 13,520,484 14,900,851 7 i282, 281
Returns with itemized deductions 2....•....•••.• 15,701,595 14,426,417 12,835,776 11,581,696 10,320,298 9,691,340 8,828,927 10,401,107 8,753,179 8)478,590Taxable .......•......•...................••.. 13,711,830 12,932,132 11,462,609 10,212,822 8,724,546 7,899,061 7,297,843 8,990,964 7,566,176 7;800,550Nontaxable.2 .......................•...•.•.... 1,989,765 1,494,285 1,373,167 1,368, FJ14 1,595,752 1,792,279 1,531,084 1,410,143 1,187,003 r78
,040
Returns with standard df::duction................ 41,045,413 43,411,767 43,693,041 43,865,313 42,739,800 42,122,78'_ 43,243,079 44,697,901 44,063,368 41454,193Taxable ...•. '" .. , ..................••.... " . 28,921,230 32,291,019 32,413,664 32,435,788 29,462,136 27,729,234 29,113,405 32,587,560 30,349,520 34j849,952Nontaxable ..•........•..•.•......•.•...••.... 12,124,183 11,120,748 11,279,377 11,429,525 13,277,664 14,393,550 14,129,674 12,110,341 13,713,848 6
1
604;241
Number of returns by source of income: I
Positive income:43~ 888,743Salaries and wages ........................... 49,925,305 50,FJ13,912 49,842,862 48,538,699 46,147,211 44,167,831 45,000,595 47,657,623 45,699,845
}Dividends) .....•.............•...........•.... 3,681,007 4,495,133 4,218,722 4,038,391 3,668,423 3,656,582 3,321,922 3,448,646 3,306,931 4 k952,101Interest received:3...........•.•............. 6,124,385 5,579,720 5,196,439 4,824,056 4,410,271 4,714,567 3,963,527 3,885,126 3,636,477Annuities and pensions ...•...•............... 730,279 735,471 634,881 598,330 525,514 545,768 377,317 329,518 308,957 275,423Income from esta tes and trusts ....••......... 368,806 426,823 425,669 432,106 387,298 353,347 328,386 319,118 328,605 .291,859
Business profit ........•.......•...••..••.... 6,320,812 6,121,471, 5,791,797 6,127,629 5,876,922 5,817,827 6,387,370 6,266,638 6,301,650 5.,276,269Partnership profit .................•...•..... 1,588,046 1,649,591 1,625,320 1,692,545 1,872,550 1,971,001 1,636,218 1,902,081 1,584,734 Ij421,871Net gain from sales of capital assets .....•.. 2,411,147 1,987,723 2,034,196 2,132,037 1,895,963 1,439,221 1,694,230 1,866,853 2,244,938 1~671,192Net gain from sales of other property .......• 135,062 93,741 98,738 100,765 117,067 123.254 136,132 121,431 137,267 j 83,288Rents and royalties net income ...... , ......•. 3,863,618 4,061,630 3,865,368 3,835,620 3,727,762 3,606,363 3,174,410 3,163,086 3,106,963 3 125,981other sources", ...••..•....•...•.... , ......•. 5,019,718 1,861,744 1,888,988 2,353,892 2,278,576 2,288,711 2,012,844 2,079,988 2,038,630 lj853,076
I
Losses: !\
Business loss .........•...........•.......... 1,464,726 1,281,395 1,080,870 1,047,713 988,465 896,247 820,474 774,649 642,131 ' 570,572Partnership loss ........ , .............•...... 228,949 241,505 208,170 219,839 2~0,928 278,292 173,721 183,111 115,186 ·108,247Net loss from sales of capital assets ...•.... 664,084 789,370 665,727 582,413 668,038 697,010 586,123 610,349 502,457 391,561Net loss from sales of other property •••.•.•. 207,456 151,152 124.402 180,335 182,540 160,209 103,112 98.030 85,473 79,707Rents and royalties net loss .•...•....•.....• 1,143,837 1,,192,880 1,054,992 977,980 899,337 873,636 821,073 852,354 770,224 692,692Net operating loss ,deduction' .......•....•. , . 34,781 38,205 29,987 30,570 - - - - - -Loss from estates and trusts .•....•.......... 12,258 - - - - - - - - I -I
(Thouund dol18l"5) IAmOUnt of adjusted gross income, total ........... 230,235,855 229,863,409 216,087,449 203,097,033 179,874,478 161,373,205 164,173,861 150,295,275 134,330,006 120j 301,131
Taxable returns ......••......•........•........ 209,668,830 212,421,184 198,531,784 185,171,964 158,545,122 138, 566,406 142.056,885 135,301,876 118,050,027 117 561,661Nontaxable returns ......•........••...•..•..... 20,567,025 17,442,225 17,555,665 17,925,069 21,329,356 22,806,799 22,116,976 14,993,399 16,279,979 2 739,470
Amount of adjusted' gross deficit, total .•...••... 1,014,480 1,155,153 797,541 760,5.48 726,202 799,280 657,847 559,193 247,206 \292,472Returns with only self-employment tax .........• 35,900 46,003 23,425 23,912 - - - - - -Nontaxable returns ..•..•.••.•••.•.............. 978,580 1,109,150 774,116 736.636 726,202 799,280 657,847 559,193 247,206 1292,472
Amount of taxable income .•....•••.•.••........•.. 115,331,301 - - - - - - - - -Amount of tax liability, totaL ....•...•.•....... 26,967,251 29,657,273 28,020,288 24,439,073 18,374,922 14,538,141 15,441,529 18,076,281 16,075,913 17,050,378
Income tax (after credits) ..................... 26,665,753 29,430,659 27,802,831 24,227,'780 18,374,922 14,538,141 15,441,529 18,076,281 16,075,913 17,050,378Self-employment tax ............•..•............ 301,498 226,614 217,45'7 211,293 - - - - - I -
1For neVi definitiOn of taxable and nontaxable returns for 1954, see page 23.<Includes returns with no information, 1945-52.JExc1udes returns Form 1040A or W-2 with this source of income which was reported as other income.4Includes returns 1040A or W-2 showing wages not subject to income tax. withholding, dividends, and interest, not exceeding $100 per return, reported in one sum as'Not available prior to 1951.
other Jcome.I

80 INDIVIDUAL INCOME TAX RETURNS FOR 1945-1954
Tabla 18.-RETURNS WlTH INCOME TAX-NUMBER, ADJUSTED GROSS INCOME, INCOME TAX, AND AVERAGE TAX, BY ADJUSTED GROSS INCOME CLASSES, 1945.1954
Adjusted gross incane classes 1954' 1953 1952 1951 1950 1949 1948 1947 1946 1945
NUMBER OF RETURNS
$500 under $1,000 ................................ - - - - - - 1,526,161 2,790,569 3,153,212 4,842,819$600 under $1,000 ................................ 1,292,988 1,361,444 1,420,812 1,610,092 1,570, 113 1,538,868 - - - -$1,000 under $1,500 .............................. 2,426,670 2,632,034 2,760,133 2,754,588 2,663,366 2,742,856 2,619,795 4,178,487 4,744,514 7,041,008$1,500 under $2,000 .............................. 2,431,232 2,787,231 2,963,805 3,1l5,581 3,333,412 3,385,746 3,628,233 5,660,010 5,928,686 7,175,731$2,000 under $2,500 .............................. 3,078,559 3,335,910 3,568,839 3,814,784 4,132,168 4,418,528 4,683,599 6,439, III 6,072,182 6,348,181
$2,500 under $3,000 .............................. 3,452,029 3,685,629 3,883,813 4,178,241 4,585,740 4,750,944 4,914,112 6,171,703 5,310,256 5,252,169$3,000 under $4,000 .............................. 7,924,537 8,202,537 8,552,203 8,858,530 8,668,606 8,076,430 8,280,683 8,695,846 6,677,207 6,737,442$4,000 under $5,000 .............................. 7,545,254 7,666,402 7,279,244 6,949,135 5,740,400 4,727,478 4,880,174 3,818,891 2,757,501 2,612,825$5,000 under $10,000 ............................. 12,355,239 12,490,576 10,609,222 8,699,138 6,114,699 4,837,794 4,666,206 2,837,585 2,331,853 1,885,471
$10,000 under $15,000 ............................ 1,215,482 1,158,199 983,014 831,819 679,114 581,572 599,545 486,961 452,271 353,346$15,000 under $20,000 ............................ 368,492 348,741 324,088 295,919 256,019 220,420 236,438 201,300 192,540 155,308$20,000 under $30,000 ............................ 291,668 264,008 252,333 248,459 223,482 181,989 192,771 160,010 156,674 129,195$30,000 under $50,000 ............................ 161,897 150,981 152,900 149,837 136,462 105,718 114,526 89,158 88,918 74,254$50,000 under $100,000 ........................... 70,332 60,260 65,396 67,447 62,689 46,130 52,725 38,049 39,101 33,495
$100,000 under $150,000 .......................... 11,617 } 12,461 14,114 { 12,045 11,564 8,028 9,619 6,353 6,373 5,530$150,000 under $200,000 .......................... 3,192 4,008 3,948 2,723 3,122 2,057 1,994 1,726$200,000 under $500,000 .......................... 3,234 2,692 3,195 3,905 4,058 2,572 2,975 2,018 1,997 1,673$500,000 under $1,000,000 ........................ 437 372 416 523 623 379 415 302 323 258$1,000,000 or more ............................... 201 145 148 171 219 120 149 114 94 71
Total ...................................... 42,633,060 44,159,622 42,833,675 41,594,222 38,186,682 35,628,295 36,411,248 41,578,524 37,915,696 42,650,502
(Thousand dollars)ADJUSTED GROSS INC(ID;
$500 under $1,000 ................................ - - - - - - 1,272,455 2,152,141 2,425,223 3,794,336$600 under $1,000 ................................ 1,078,798 1,146,237 1,191,714 1,354,605 1,310,810 1,289 ,971 - - - -$l,(XX) under $1,500 .............................. 3,047,987 3,299,462 3,463,102 3,452,761 3,381,544 3,474,249 3,347,031 5,295,621 6,021,539 8,839,562$1,500 under $2,000 .............................. 4,237,823 4,865,679 5,176,783 5,446,167 5,818,935 5,925,589 6,347,058 9,974,180 10,435,174 12,537,887$2, (XX) under $2,500 .............................. 6,922,726 7,493,336 8,030,291 8,578,144 9,290,893 9,926,073 10,528,563 14,507,256 13,659,829 14,236,038
$2, 500 under $3,000 .............................. 9,505,225 10,156,359 10,717,097 11,530,006 12,652,390 13,084,856 13,535,912 16,951,476 14,545,694 14,394,603$3,000 under $4,000 .............................. 27,812,489 28,746,397 29,930,509 30,946,234 30,154,986 28,027,897 28,714,750 29,914,610 22,924,649 23,142,517$4,000 under $5,000 .............................. 33,828,835 34,370,599 32,575,069 31,016,829 25,557,691 21,029,837 21,709,135 16,917,330 12,205,197 11,541,980$5,000 under $10,000 ............................. 81,237,475 81,752,818 68,763,095 55,838,698 39,046,068 30,970,696 29,818,294 18,433,619 15,288,504 12,273,236
$10,000 under $15,000 ............................ 14,390,558 13,718,699 ll, 677, 403 9,923,727 8,148,940 6,971,830 7,200,668 5,870,665 5,460,356 4,267,146$15,000 under $20,000 ............................ 6,316,307 5,983,194 5,561,110 5,0'78,155 4,396,990 3,783,153 4,054,251 3,455,452 3,306,371 2,668,955$20,000 under $30,000 ............................ 7,018,963 6,355,250 6,084,077 6,003,939 5,391,864 4,376,718 4,642,297 3,847,922 3,769,976 3,108,042$30,000 under $50,000 ............................ 6,067,727 5,682,lll 5,757,lZl 5,651,016 5,144,080 3,976,070 4,313,111 3,351,904 3,347,687 2,798,339$50,000 under $100,000 ........................... 4,651,794 3,994,325 4,340,235 4,500,312 4,192,517 3,074,224 3,516,082 2,525,752 2,593,410 2,232,799
$100,000 under $150,000 .......................... 1,389,769 } 1,638,413 1,863,390 {1,440,965 1,386,519 961,006 1,153,456 759,938 761,223 661,464$150,000 under $200,000 .......................... 546,951 687,244 676,791 466,140 534,345 352,644 340,333 295,289$200,000 under $500,000.......................... 915,760 753,081 891,963 1,100,454 1,141,235 718,256 836,689 574,611 563,822 476,340$500,000 under $1,000,000 ........................ 293,111 252,379 278,810 349,694 419,462 254,332 Zl4,704 201,811 216,896 169,744$1,000,000 or more ..............................• 406,532 275,263 289,224 344,640 433,407 255,509 258,0'72 214,946 184,145 123,384
Total ...................................... 209,668,830 210,483,602 196,590,999 183,243.590 158,545,122 138, 566,406 142,056,885 135,301,eJ76 1lB,050,OZl 117,561,661
INCOME TAX LIABILITY (AFTER CREDITS)
$500 under $1,000 ................................ - - - - - - 37,706 99,608 112,705 138,405$600 under $1,000 ................................ 37,648 46,165 46,964 50,542 40,337 38,437 - - - -$1,000 under ~1,500.•.•.•..••.•••.•••••.••.•••.•. 213,519 255,864 Zl1,039 241,320 197,079 191,102 187,415 387,787 432,817 575,916$1,500 under 2,000 .............................. 344,635 449,872 477,751 461,740 413,125 394,473 435,023 844,726 848,468 1,071,730$2,000 under $2,500 .............................. 575,180 695,210 748,512 721,975 647,870 650,080 704,578 1,291,807 1,142,625 1,344,942
~2,500 under $3,000 ...........................•.. 817,847 988,259 1,022,509 998,321 890,984 875,700 914,648 1,510,628 1,227,337 1,424,8623,000 under $4,000 .............................. 2,467,295 2,871,975 2,941,669 2,728,262 2,177,241 1,919,402 1,990,235 2,767,106 2,099,586 2,569,494
$4,000 under $5,000.............................. 3,049,831 3,545,531 3,323,844 2,919,638 2,043,783 1,609,178 1,687,046 1,761,421 1,277,523 1,507,599$5,000 under $10,000 ............................. 9,210,378 10,443,227 8,849,348 6,607,556 3,983,698 3,039,306 2,960,914 2,550,665 2,160,867 2,119,569
$10,000 under $15,000 ............................ 2,185,166 2,358,268 2,024,375 1,594,410 1,157,379 951,897 1,002,044 1,172,385 1,105,837 1,025,393$15,000 under $20,000 ............................ 1,145,589 1,233,380 1,158,592 978,921 757,996 625,709 684,138 850,451 824,524 775,181$20,000 under $30,000 ............................ 1,521,883 1,566,556 1,520,467 1,387,758 1,121,239 869,647 945,484 1,167,726 1,160,281 1,086,667$30,000 under $50,000 ............................ 1,683,981· 1,786,009 1,830,556 1,677,416 1,382,086 1,022,535 1,136,288 1,277,688 1,291,755 1,202,778$50,000 under $100,000........................... 1,708,710 1,645,090 1,811,292 1,778,160 1,517,006 1,062,365 1,247,160 1,186,450 1,223,315 1,156,298
$100,000 under $150,000 .......................... 614,555 } 812,499 934,889 { 687,725 613,196 407,379 503,298 411,090 410,973 387,962~150,000 under $200,000 .......................... 257,014 356,130 328,914 216,042 256,026 201,928 192,264 180,328
200,000 under $500,000 .......................... 455,363 414,246 495,864 612,801 602,558 369;969 441,954 340,804 327,245 293,392$500,000 under $1,000,000 ........................ 154,785 149,012 164,964 211,452 239,881 148,465 155,866 122,749 lZl,671 109,962$1,000,000 or more ............................... 222,374 169,496 180,196 213,653 260,550 146,459 151,715 131,263 110117 79 900
Total ...................................... 26,665,753 29,430,659 27,802,831 24,227,780 18,374,922 14,538,141 15,441,529 18,0'76,281 16,075,9U 17,050,378
(Dollarll)AVERAGE INC(ID; TAX PER TAXABLE RETURN
$500 under $1,000 ................................ - - - - - - 25 36 36 29$600 under $1,000 ................................ 29 34 33 31 26 25 - - - -$1,000 under $1,500 .............................. 88 97 98 88 74 70 72 93 91 82$1,500 under $2,000 .............................. 142 161 161 148 124 117 120 149 143 149$2,000 under $2,500 .............................. 187 208 210 189 157 147 150 201 188 212
$2,500 under $3,000 ............................... i37 268 263 239 194 184 186 245 231 Zll$3,000 under $4,000 .............................. 311 350 344 308 251 238 240 318 314 381$4,000 under $5,000 .............................. ;,r:s 462 457 420 356 340 346 461 463 577$5,000 under $10,000 ............................. 836 834 760 651 628 635 899 927 1,124
$10,000 under $15,000 ............................ 1,798 2,036 2,059 1,917 1,704 1,637 1,671 2,408 2,445 2,902$15,000 under $20,000............................ 3,109 3,537 3,575 3,308 2,961 2,839 2,894 4,225 4,282 4,991$20,000 under $30,000 ............................ 5,218 5,934 6,026 5,585 5,017 4,779 4,905 7,298 7,406 8,411$30,000 under $50,000 ............................ 10,402 11,829 11,972 il,195 10,128 9,672 9,922 14,331 14,527 16,198$50,000 under $100,000 ........................... 24,295 27,300 ZI,697 26,364 24,199 23,030 23,654 31,182 31,286 34,522
$100,000 under $150,000 .......................... 52,901 } 65,203 66,238 { 57,096 53,026 50,745 52,323 64,708 64,487 70,156$150,000 under $200,000 .......................... 80,518 88,855 83,312 79,340 82,007 98,166 96,421 104,477$200,000 under $500,000 .......................... 140,805 153,880 155,200 156,9Z1 l4a,486 143,845 148,556 168,882 163,868 175,369$500,000 under $1,000,000 .......................... 354,199 400,570 396,548 404,306 385,042 391,728 375,581 406,454 395,266 426,209$1,000,000 or more ............................... 1,106,338 1,168,938 1,217,541 1,249,433 1,189,726 1,220,492 1,018,221 1,151,430 1,171,457 1,125,352
Average income tax ......................... 625 666 649 582 481 408 424 435 424 400
lFor new definition of taxable returns for 1954, aee page 23.

INDIVIDUAL INCOME TAX RETURNS FOR 1945-1954
Tabl. 19.-S0URCES OF INCOME BY TYPE, 1945-1954
81
Sources of income 1954 1953 1952 1951 1950 1949 1948 1947 1946 1945
(1Jtoulland doHlIrtJ) IReturns with adjusted gross income:
Positive income:
:~~~;:~s~~~.~~~~~::::::::::::::::::::::::::185,794,926 187,607,862 174,193,394 160,336,699 138,956,127 124,798,953 125,814,826 114,736,671 99,144,074 91J~58/219
7,030,900 5,804,993 5,834,215 6,030,895 6,130,906 5,218,206 4,939,627 4,278,371 3,670,587 }Interest received' ........................... 2,349,915 2,021,869 1,822,337 1,684,015 1,582,898 1,511,555 1,279,044 1,115,258 1,064,219 3,906,025
Annulties and pensions ....................... 799,292 670,329 581,672 499,306 429,767 441,969 293,103 226,330 231,309 ~94,685Income from estates and trusts ............... 683,434 1,686,754 1,700,139 1,739,064 1,689,754 1,435,302 1,307,280 1,227,282 1,106,134 945,594
Business prof!t .............................. 19,218,571 18,646,959 18,180,679 18,131,463 16,846,649 15,613,095 18,029,409 16,370,491 16,004,322 12,~72,022Partnership profit ........................... 8,973,893 8,784,424 8,799,142 8,852,180 8,554,469 7,894,590 : 8,043,862 8,231,785 8,083,097 7,195,884-Net gain from sales of capital assets ........ 3,614,012 2,473,486 2,761,088 3,185,644 3,181,051 1,866,459 2,455,675 2,410,102 3,296,217 2''175,701Net gain from sales of other property ....... 104,930 60,359 102,826 83,761 101,494 100,690 106,571 97,121 121,384
1,7~~;i;iRents and royalties net income ............... 3,497,917 3,605,573 3,432,513 3,299,948 3,183,655 3,024,215 2,572,772 2,201,090 1,903,726Other sources4 ............................... 679,067 889,025 794,878 1,199,951 1,008,812 1,030,824 748,276 645,294 749,093 595,186
Total .................................. 232,746,855 232,251,633 218,202,883 205,042,926 181,665,582 162,956,058 165,590,445 151,539,795 135,374,162 121,1~5,369
Losses:360,118Business loss ................................ 1,293,519 1,073,477 1,009,459 939,922 840,420 635,138 646,141 519,098 442,906
Partnership loss ............................. 259,724 266,799 241,285 231,766 223,547 248,785 166,030 152,156 108,554 86,503Net loss from sales of capital assets ........ 362,625 437,849 348,557 268,802 313,886 331,192 285,844 279,314 233,156 181,669Net 'loss from sales of other property ........ 129,023 111,682 89,145 126,056 132,306 101,086 82,481 67,003 67,271 t9,963Rents and royalties net loss ................. 401,740 457,509 383,212 342,834 280,980 266,667 236,092 226,940 192,270 15,992Net operating loss deduct10n' ................ 58,829 40,891 43,724 36,511 - - - - -
I =Loss fran estates and trusts ................. 5,540 - - - - - - - -Total .................................. 2,511,000 2,388,207 2,115,382 1,945,891 1,791,139 1,582,868 1,416,588 1,244,511 1,044,157 864,245
Adjusted gross income.......................... 230,235,855 229,863,409 216,087,449 203,097,033 179,874,478 161,373,205 164,173,861 150,295,275 134,330,006 120,)((1, 131
Returns with no adjusted gross income: IPositive income:
I
Salaries and wages ........................... 157,697 126,058 145,638 144,998 116,998 84,195 66,576 67,076 29,585 41,580Dividends ..............•..................... 16,966 23,286 25,409 25,120 26,793 28,021 31,273 16,819 3,270 } 18,625Interest received ............................ 20,315 20,780 24,562 18,200 12,706 16,275 14,406 10,156 2,843Annuities and pensions ....................... 6,777 (6 ) 2,139 503 2,048 1,439 1,315 502 825 (6 jIncome from estates artd trusts ............... (6 ) 4,722 11,096 22,361 10,318 8,066 7,287 3,399 1,529 (6
Business profit .............................. 16,041 30,740 14,314 31,078 16,785 16,451 19,360 10,078 7,005 J;].,462Partnership profit ........................... 30,150 18,476 34,656 18,865 21,038 17,638 20,163 16,797 2,558 12,862Net gain from sales of capital assets ........ 117,850 65,040 74,777 96,777 77,520 69,061 43,987 42,195 22,344 j2,332Net gain from sales of other property ....... 2,881 2,526 13,770 5,142 1,694 5,602 4,607 4,013 1,295 :3,903Rents and royalties net income ............... 38,375 53,693 56,583 53,415 40,797 35,417 26,650 26,579 8,668 Jj3,321Other sources ................................ 11,624 19,731 6,958 8,598 10,262 9,965 6,814 4,332 1,997 4,872
I
Total .................................. 420,382 365,487 409,902 425,057 336,959 292,130 242,438 I 201,946 81,919 1~,817
Losses: iBusiness loss ................................ 1,015,290 940,584 873,919 756,666 758,250 763,734 644,436 519,812 248,514 29~,074Partnership loss ............................. 218,518 248,916 150,234 227,316 187,740 189,353 149,679 143,121 29,254 6. ,445Net loss from sales of capital assets ........ 16,821 24,888 16,905 16,373 16,742 19,501 12,725 18,281 16,974 lil,856Net loss from sales of other property ....... 70,035 70,954 50,624 78,267 53,140 72,716 66,844 56,080 25,131 5~, 169Rents and royalties net loss ................. 27,802 73,894 24,892 38,322 47,293 46,104 26,599 23,845 9,251 1~,745Net operating loss deduction:; ................ 86,136 161,411 90,865 68,668 - - - - - -Loss from estates and trusts ................. (6 ) - - - - - - - - I -
Total .................................. 1,434,862 1,520,647 1,207,439 1,185,612 1,063,165 1,091,408 900,283 761,139 329,124 435,289
Adjusted gross deficit .......................... 1,014,480 1,155,153 797,541 760,548 726,202 799,280 657,847 559,193 247,206 29t,472
lExcludes wages of less than $100 per return from which no income tax was withheld, reported on Form 1040A or W-2 'as other income.2Excludes dividends reported on Form 1040A or W-2, and for 1945-53 dividends received through partnerships and fiduciaries.'Excludes interest of less than $100 per return reported on Form 1040A or W-2.4Includes wages not subject to income tax withholding, dividends, and interest, not exceeding $100 per return, reported in one sum as other income on Form 1040A or W-2.'Not available prior to 1951.6sa.mple variability of this item is too large to werrant showing it separately. However, this value is included in each total.
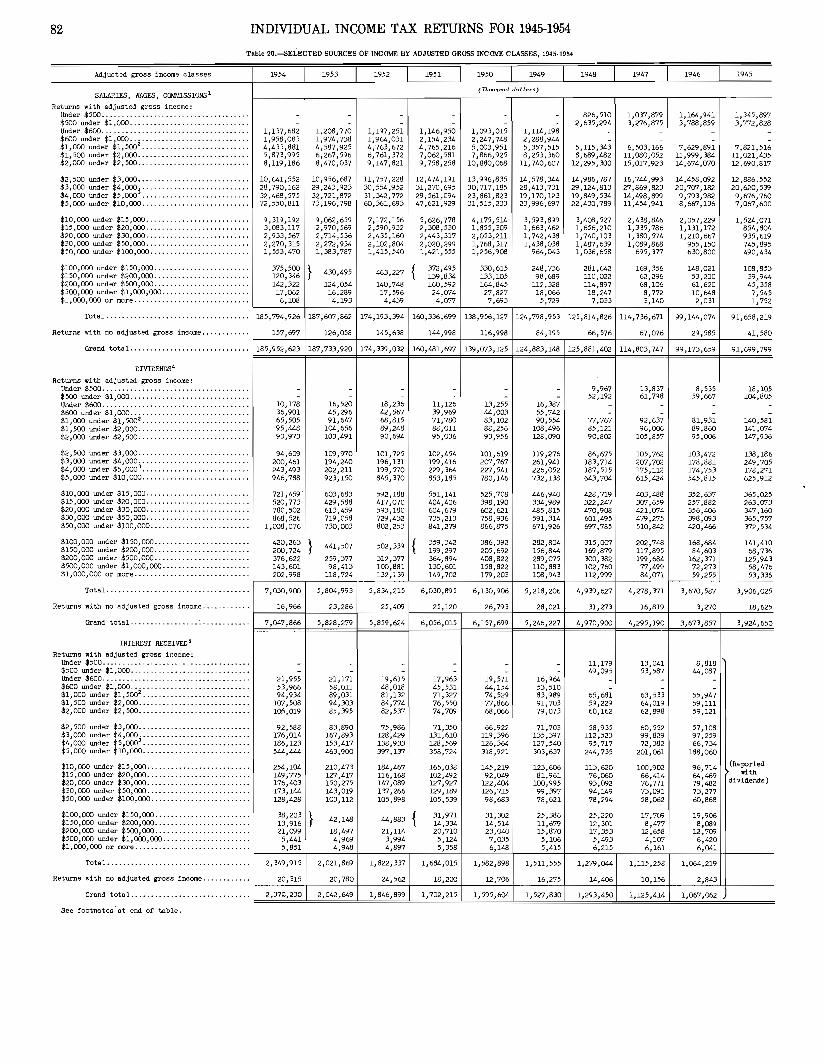
82 INDIVIDUAL INCOME TAX RETURNS FOR 1945-1954
Table 20.-SELECTED SOURCES OF INCOME U¥ ADJUSTED GROSS INCOME CLASSES, 1945-1954
Adjusted gross income classes 1954 1953 1952 1951 1950 1949 1945 1947 1946 I 1945
SALARIES, WAGES. GOMMISSIONS'
(Thou!Jsnd riollars)
Returns wi th adjusted gross income:Under $500 ..................................... - - - - - - 826,510 1,037,879 1,164,941 1,345,897$500 under $1,000 ......................... ..... - - - - - - 2,635,294 3,276,875 3,788,859 3,772,828Under $600 ..................................... 1,137,682 1,20S,770 1,197,251 1,146,950 1,093,015 1,114 J 198 - - - -
:~go~~~e~1$~oo2::: :::: ::: ::::::: :::: ::: :: : 1,958,083 1,974,738 1,964,031 2,154,234 2,247 J 748 2,288,944 - - - -4,433,881 4,587,925 4,763,672 4,765,216 5,003,951 5,357,515 5,115,343 6,503,166 7,629,891 7,821,516
$1,500 under $2,000 ............................ 5,873,995 6,267,596 6,761,372 7,062,581 7,866,925 8,253,360 8,689,482 11,080,052 11,999,384 11,021,435$2,000 under $2,500 ............................ 8,119,lS6 8,470,037 9,147,821 9,758,258 10,880,068 11,740,607 12,295,300 15,017,923 14,674,070 12,690,817
$2,500 under $3,000 ............................ 10,641,552 10,956,687 11,757,228 12,474,191 13,996,835 14,578,344 14,9S6,787 16,744,993 14,458,092 12,886,552
:~:ggg :::~ :1;gggj:::::::::::::::::::::::: ::: 28,790,162 29,243,923 30,554,952 31,270,695 30,717,185 28,413,731 29,124,813 27,869,823 20,707,182 20,620,53932,468,575 32,721,872 31,342,772 29,561,094 23,861,S23 19,170,123 19,849,534 14,498,899 9,793,982 9,676,760
$5,000 under $10,000 ........................... 72,550,811 73,196,79S 60,361,693 47,621,929 31,515,233 23,996,697 22,430,789 11,454,941 8,667,136 7,067,600
$10,000 under $15,000 ........ . .. ............... 9,319,192 9,062,659 7,172,156 5,626,778 4,175,514 3,593,899 3,408,527 2,438,846 2,057,229 1,524,071$15,000 under $20,000 .......................... 3,083,117 2,970,569 2,590,932 2,30S,530 1,855,309 1,663,462 1,656,210 1,335,786 1,131,172 854,804$20,000 under $30,000 ....... . ... .. .. . . ...... ... 2,933,567 2,714,536 2,435,160 2,443,317 2,053,211 1,742,438 1,740,103 1,380,574 1,210,667 935,619$30,000 under $50,000 .......................... 2,270,315 2,272,934 2,102,804 2,020,299 1,768,317 1,438,038 1,487,639 1,089,868 955,150 745,895$50,000 under $100,000 ..... .................... 1,553,470 1,383,787 1,415,540 1,421,555 1,256,908 964,043 1,036,658 695,377 630,800 490,434
$100,000 under $150,000 ........................ 375,500 } 430,495 463,227 { 372,495 330,615 248,736 281,642 169,356 148,021 108,853$150,000 under $200,000 ........................ 120,346 139,834 133,105 98,689 110,022 62,296 53,200 39,944$200,000 under $500,000 ........................ 142,322 124,054 140,748 160,592 164,845 112,328 114,897 68,106 61,620 45,358$500,000 under $1,000,000 ...................... 17,062 16,289 17,596 24,074 27,827 18,066 18,247 8,772 10,648 7,545$1,000,000 or more .... , ........................ 6,108 4,193 4,439 4,077 7,693 5,729 7,033 3,140 2,031 1,752
Total .................................... 185,794,926 187 ,6Cfl ,862 174,193,394 160,336,699 138,956,127 124,798,953 125,814,S26 114,736,671 99,144,074 91,658,219
Returns with no adjusted gross income ............ 157,697 126,058 145,638 144,998 116,998 84,195 66,576 67,076 29,585 41,580
Grand total ................. ............. 185,952,623 187,733,920 174,339,032 160,481,697 139,073,125 124,883,148 125,881,402 114,S03,747 99,173,659 91,699,799
DIVIDENDS'
Returns with adjusted gross income:Under $500 ............................... ...... - - - - - - 9,967 13,837 8,535 18,105$500 under $1,000 ............ ........... ....... - - - - - - 52,192 61,798 59,667 104,805Under $600 ...................... _.............. 10,178 16,520 18,236 11,126 13,255 16,387 - - - -$600 under $1,000 .............................. 36,901 45,296 42,567 39,969 44,003 55,742 - - - -$1,000 under $1,5002 ...................... , .... 65,505 91,647 68,815 71,780 83,102 90,554 77,767 92,637 81,931 140,581$1,500 under $2,000 ............................ 95,448 104,656 89,248 S8,011 88,256 108,496 85,121 96,006 89,S60 141,074$2,000 under $2,500 ............................ 93,973 103,491 90,694 95,036 93,956 128,090 90,802 105,857 95,006 147,936
$2,500 under $3,000 ............................ 94,609 109,970 101,725 102,454 101,619 119,276 86,675 105,762 103,472 138,186$3,000 under $4,000 ............................ 200,461 194,240 196,131 199,416 2(17,767 261,941 183,714 207,702 178,881 249,705$4,000 under $5,000 3........................... 243,493 202,211 199,570 229,364 227,541 226,052 187,515 175,112 174,753 178,271$5,000 under $10,000 ........................... 946,788 923,150 845,370 853,185 780,146 732,138 643,704 615,424 545,815 625,912
$10,000 under $15,000 .......................... 721,459 603,683 592,188 551,141 525,708 446,940 428,719 403,488 352,637 365,025$15,000 under $20,000 .......................... 520,773 429,588 417,070 404,406 398,190 334,989 322,247 3(17 ,659 257,882 263,073$20,000 under $30,000 .......................... 780,502 613,459 593,180 604,679 602,621 485,815 470,908 421,07L 356,406 347,160$30,000 under $50,000 .......................... 868,526 719,058 729,432 735,213 758,936 591,314 601,495 479,275 398,093 365,757$50,000 under $).00,000 ......................... 1,008,076 730,003 802,253 841,279 866,875 671,926 697,7S5 510,842 420,466 372,534
$100,000 under $150,000 ........................ 420,263 } 441,507 502,339 { 359,342 386,392 282,804 315,OCfl 202,748 168,684 141,410$150,000 under $200,000 ........................ 200,724 199,297 205,692 156,844 169,879 117,895 84,603 68,736$200,000 under $500,000 ........................ 376,622 259,377 312,377 364,894 408,S22 289,075 300,38~ 199,684 162,371 125,943$500,000 under $1,000,000 ................... ... 143,601 98,413 100,881 130,601 158,822 110,883 102,760 77,499 72,273 58,476$1,000,000 or more ............................. 202,998 118,724 132,139 149,702 179,203 108,943 112,999 84,071 59,255 53,336
Total .................................... 7,030,900 5,804,993 5,834,215 6,030,895 6,130,906 5,218,206 4,939,627 4,278,371 3,670,587 3,906,025
Returns with no adjusted gross income ......... , .. 16,966 23,286 25,409 25,120 26,793 28,021 31,273 16,819 3,270 18,625
Grand totaL ...... .......... ............. 7,047,866 5,828,279 5,B59,624 6,056,015 6,157,699 5,246,227 4,970,900 4,295,190 3,673,857 3,924,650
INTEREST REGEIVED'
Returns with adjusted gross income:Under $500 ..................................... - - - - - - 11,179 13,041 8,81S$500 under $1,000 ................. _............ - - - - - - 49,095 53,587 44,087Under $600 ..................................... 21,955 21,171 19,615 17,963 19,571 16,964 - - -$600 under $1,000 ............................ _. 53,966 58,011 48,018 45,531 44,154 53,510 - - -$1,000 under $1,5002 ........................... 94,934 89,031 81,132 71,327 74,529 83,989 65,681 63,533 55,947$1,500 under $2,000 ............................ 107,508 94,303 84,774 76,550 77,866 91,703 59,229 64,019 59,111$2,000 :.mder $2,500 ............................ 106,019 85,395 82,537 74,709 68,066 79,073 60,162 62,898 59,121
$2,500 under $3,000 ............................ 92,588 83,890 75,986 71,350 66,922 71,703 58,935 60,552 57,108
:~;g~ ::~:~ :~;gggj:::::::::::::::::::::::::::176,014 167,893 128,429 131,610 119,396 135,397 112,523 99,829 97,259186,123 153,417 138,933 128,569 126,364 127,540 95,717 72,382 66,734
$5,000 under $10,000 ........................... 544,444 463,900 397,137 358,724 318,921 303,637 244,735 201,061 188,060
$10,000 under $15,000 .......................... 254,104 210,473 184,467 165,038 145,219 123,606 113,620 100,902 96,714 (Reported
$15,000 under $20,000 .......................... 149,775 127,417 116,168 102,492 92,049 81,961 76,060 66,414 64 ,469 with$20,000 under $30,000 .......................... 176,403 150,275 147,089 127,927 122,404 100,995 93,092 76,771 79,482 dividends)
$30,000 under $50,000 .......................... 173,144 143,019 137,266 129,189 126,715 99,397 94,149 73,091 73,277$50,000 under $100,000 ......................... 128,428 103,112 105,898 105,539 98,683 7S,621 78,294 58,062 60,868
$100,000 under $150,000 ........................ 38,203 } 42,148 44,883 { 31,971 31,302 25,386 25,220 17,7(8 19,906$150,000 under $200,000 ................... _.... 13 ,916 14,334 14,514 11,679 12,301 8,477 8,089$200,000 under $500,000 ........................ 21,099 18,497 21,114 20,710 23,040 15,870 17,353 12,658 12,709$500,000 under $1,000,000 .... , .. , .............. 5,441 4,969 3,994 5,124 7,035 5,106 5,493 4,107 6,420$1,000,000 or more ............................. 5,851 4,948 4,897 5,358 6,148 5,415 6,215 6,161 6,041
Total .................................... 2,349,915 2,021,869 1,822,337 1,684,015 1,582,898 1,511,555 1,279,044 1,115,258 1,064,219
Returns with no adjusted gross income ............ 20,315 20,780 24,562 18,200 12,706 16,275 14,406 10,156 2,843
Grand total ............................. 2,370,230 2,042,649 1,846,899 1,702,215 1,595,604 1,527,830 1,293,450 1,125,414 1,067,062
See footnotes at end of table.

INDIVIDUAL INCOME TAX RETURNS FOR 1945-1954
Table 20.-SELECTED SOURCES OF INCOME BY ADJUSTED OROSS INCOME CLASSES, 1945.1954-Continued
83
Adjusted gross income classes 1954 1953 1952 1951 1950 1949 1948 1947 1946 1~45
BUSINESS PROFIT (Thousand doHars) IRetwns with adjusted gross income:
Under $500 ............ .................... "'" - - - - - - 76,949 95,729 93,708 :104,131$500 under $1,000 .................. ............ - - - - - - 431,734 469,456 522,234
r37 ,93~Under $600 .............. .............. ......... 140,399 122,992 105,506 llO,282 114,250 142,904 - - -$600 under $1,000 ..................... ......... 351,725 314,162 300,727 295,736 324,0C4 365,642 - - -$1,000 under $1,5002
....•••....•....•.•.•...... 727,315 669,633 672,572 726,071 760,470 675,216 663,773 927,023 962,166 a91,498$1,500 under $2,000 ............................ 874,895 899,563 922,504 963,095 1,028,686 1,108,237 1,191 1 803 1,156,495 1,198,703
~~~ ;~i~$2,000 under $2 J 500 ............................ 982,191 990,469 995,599 1,143,414 1,112,835 1,177,748 1,242,922 1,297,021 1,270,771
$2,500 under $3,000 ............................i
1,068,887 1,117,768 1,137,327 1,199,742 1,148,598 1,183,369 1,286,909 1,223,001 1,210,8831,~~~;~;~:~:ggg :~:~ :~;g~3:::::::::::::::::::::::::::
2,030,897 2,161,646 1,994,450 2,137,886 1,987,815 1,873,273 2,118,114 2,056,996 1,974,6031,659,320 1,738,647 1,608,172 1,643,200 1,512,663 1,467,623 1,676,585 1,561,826 1,426,547 1,Poo,881
$5,000 under $10,000 ........................... 4,587,587 4,437,881 4,087,451 3,845,706 3,433,953 3,208,082 3,824,838 3,553,866 3,292,959 2,~56,694
$10,000 under $15,000 ... . ........ ...... .. .... .. 2,214,622 2,073,531 1,952,696 1,845,160 1,672,108 1,401,008 1,752,694 1,480,375 1,406,127 1,i05,146$15,000 under $20,000 .......................... 1,326,095 1,244,881 1,207,256 1,111,531 960,517 803,714 998,677 790,126 786,973 1642,021$20,000 under $30,000 .............. ............ 1,447,476 1,290,636 1,338,082 1,252,849 1,124,333 673,342 1,065,369 789,329 812,440 659,595$30,000 under $50,000 ....................... ... 1,103,839 965,832 1,105,699 1,030,518 915,644 646,675 809,288 562,105 592,011 483,745$50,000 under $100,000 ........... . . ......... . .. 546,550 472,823 563,419 592,568 518,650 336,899 471,90'7 294,896 331,981 296,036
$100,000 under $150,000 ........................ 97 ,073 } 109,996 138,078 { 120,883 108,929 62,852 97,849 55,609 66,5531
68'579$150,000 under $200,000 .. ...................... 25,205 45,980 45,033 24,904 39,342 18,237 21,588 30,043
$200,000 under $500,000 ................. ....... 25,587 28,707 37,901 49,098 42,470 27,131 43,201 25,951 25,239 32,631$500,000 under $1,000,000 ...................... 4,815 3,950 8,703 10,149 10,005 6,919 7,665 6,767 2,275 6,327$1,000,000 or more ........... .................. 3,893 3,622 4,537 5,593 5,684 7,352 9,602 5,684 4,569 4,700
Total ...................... " ............ 19,218,571 18,646,959 18,180,679 18,131,463 16,846,649 15,613,095 18,029,409 16,370,491 16,004,322 12,\72,022
Returns with no adjusted gross income. " ......... 16,041 30,740 14,314 31,078 16,785 16,451 19,360 10,078 7,005 11,462I
Grand total ............ .................. 19,234,612 18,677,699 18,194,993 18,162,541 16,863,434 15,629,546 18,048,769 16,380,569 16,011,327 12,~83,484
PARTNERSHIP PROFIT
Retwns with adjusted gross income:IUnder $500 ......... ............................ - - - - - - 8,618 14,826 9,883 9,765
$500 under $1,000 .............................. - - - - - - 61,416 75,237 57,430 !67,731Under $600 ..................................... 15,958 28,178 19,096 16,706 21,497 29,511 - - - -$600 under $1,000 .......... .................... 42,612 41,165 30,079 46,311 60,550 76,898 - - - -$1,000 under $1,500 2........................... 78,154 122,912 99,112 96,667 141,159 184,555 116,436 157,358 112,106 i26,003$1,500 under $2,000 ............. ............... 109 ,592 136,585 122,307 160,234 194,078 247,548 178,756 246,248 185,085 162,895$2,000 under $2,500 ............................ 139,110 191,775 167,412 200,335 258,331 289,089 217,559 325,522 234,72? ~98,665
$2,500 under $3,000 ............................ 195,356 189,498 208,154 262,254 296,255 301,493 272,664 363,194 299,286 b2,466
:~:ggg :~:~ :~:ggg;:::::::::::::::::::::::::::499,378 486,679 481,653 588,258 590,004 631,215 502,040 701,011 546,468 416,415524,379 543,540 523,664 519,093 533,726 568,877 531,716 526,409 457,915 $69,608
$5,000 under $10,000 ........................... 1,918,999 1,907,899 1,897,693 1,737,359 1,671,464 1,605,933 1,596,027 1,651,083 1,499,254 1,315,963
$10,000 under $15,000 .......................... 1,188,504 1,114,341 1,116,743 1,051,772 979,046 908,351 970,018 1,000,096 1.022,357 ~64,155$15,000 under $20,000 .......................... 795,926 766,303 794.807 705,792 655,394 588,482 676,680 678,497 736,366 ~39,952$20,000 under $30,000 .......................... 1,106,191 1,071,845 995,687 980,999 928,450 778,864 855,453 639,632 916,083 827,912$30,000 under $50,000 .......................... 1,085,314 1,019,460 1,0'78,931 1,075,101 945,936 772,636 871,434 786,330 919,140 $51,198$50,000 under $100,000 ......................... 845,697 754,121 824,082 860,375 790,584 596,862 768,871 590,699 736,462 r6
'221
$100,000 under $150,000................ ......... 226,849 } 287,404 324,103 { 263,131 232,832 158,266 212,467 145,297 175,976 97 ,647$150,000 under $200,000 .................. ...... 76,267 120,821 104,599 66,021 82,026 52,200 73,504 73,969$200,000 under $500,000 ...... .................. 97 ,57O 63,977 94,503 130,461 120,174 69,628 97,443 57,732 78,034 92,958$500,000 under $1,000,000 ...................... 18,696 7,504 12,179 22,340 20,875 12,524 18,456 13,859 14,394 24,013$1,000,000 or more ........................ ..... 9,141 9,238 6,737 11,971 9,513 5,795 5,782 4,555 8,605 6,148
Total .......... .......................... 8,973,693 8,784,424 8,799,142 8,852,180 8,554,469 7,894,590 8,043,662 8,231,785 8,083,097 7'f95 ,884
Returns with no adjusted gross income ............ 30,150 18,476 34,656 18,865 21,038 17,636 20,163 16,797 2,558 12,862
Grand total .............................. 9,004,043 8,802,900 8,833,798 8,871,045 8,575,507 7,912,228 8,064,025 8,248,582 8,085,655 7,208,746
RENTS AND ROYALTIFS NIT INCOME IReturns with adjusted gross income: I
Under $500 ..................................... - - - - - - 30,184 43,155 29,500 37,485$500 under $1,000 .............................. - - - - - - 123,187 127,450 113,590 i26,918Under $600 ..................................... 41,127 45,824 50,957 48,165 50,527 57,607 - - - -$600 under $1,000 .............................. 104,290 124,392 126,348 122,690 123,492 141,386 - - -
~44,96;$1,000 under $1,500 2 ••••••••••.•.••..•.•.•.•.•• 188,819 222,799 205,770 186,913 193,824 210,344 153,703 144,671 135,545$1,500 under $2,000 ............................ 187,277 202,593 180,549 184,474 191,576 196,083 152,144 147,834 135,918 126,525$2,000 under $2,500 ............................ 179,552 177,305 193,229 163,802 192,682 179,564 146,120 151,639 135,626 ~27,946
$2,500 under $3,000 ............................ 159,779 156,324 164,104 178,832 168,665 175,012 133,420 142,594 142,956 126,403$3,000 under $4,000 ............................ 257,957 326,616 298,717 286,648 296,103 321,801 264,848 258,636 220,856 208,136$4,000 under $5,000' ........................... 279,887 286,677 309,033 269,209 274,183 271,163 202,593 178,584 148,711 ~31,424$5,000 under $10,000 ........................... 826,065 825,030 703,666 725,908 634,310 565,413 480,429 392,360 323,549 90,757
$10,000 under $15,000 .......................... 331,573 334,700 305,6'.,.2 275,666 266,130 239,904 212,988 176,005 149,281 123,609$15,000 under $20,000 .......................... 169,840 207,260 182,740 164,292 157,472 141,043 135,127 100,992 87,128 75,516$20,000 under $30,000 .......................... 243,355 226,338 220,726 203,403 191,722 164,552 159,037 113,766 97,968 81,306$30,000 under $50,000 .......................... 225,645 218,637 205,145 201,880 186,746 156,417 152,596 98,054 81,962 168 ,285$50,000 under $100,000 ....................... :. 168,164 157,403 165,823 157,566 143,211 115,131 121,602 75,248 61,925 50,391
$100,000 under $150,000 ........................ 54,837 } _55,024 70,415 { 49,728 46,093 36,687 41,248 20,541 15,717 15,063$150,000 under $200,000 ........ ........... ..... 16,968 24,002 20,212 18,466 18,526 7,725 6,917 I 6,962$200,000 under $500,000........................ 23,660 22,779 30,245 36,128 31,614 24,432 26,793 15,739 12,333 110,986$500,000 under $1,000,000 ...................... 7,544 7,812 9,747 10,807 6,065 6,563 10,975 4,042 1,674 1,257$1,000,000 or more ............................. 11,577 7,638 9,457 5,835 5,028 2,651 5,050 2,035 2,548 2,195
Total .................................... 3,497,917 3,605,573 3,432,513 3,299,948 3,183,655 3,024,215 2,572,772 2,201,090 1,903,726 1, 'i58,131
Returns with no adjusted gross income ............ 38,375 53,693 56,583 53,415 40,797 35,417 26,650 26,579 8,668 13,321
Grand total ............. ; ................ 3,536,292 3,659,266 3,489,096 3,353,363 3,224,452 3,059,632 2,599,422 2,227,669 1,912,394 1, +71,452
lExcludes wages of less than $100 per return from which no income tax was withheld, reported on Form 1040A or W-2 as other income.2For 1945, this class includes nontaxable returns with income exceeding the dass limit.'For 1946-52, this class includes nontaxable returns with income exceeding the class limit."Excludes dividends reported on Form 1040A or W-2, and for 1945-53 dividends received through partnerships and fiduciaries. For 1945, includes interest reported on FOnD 1040.5Excludes interest of less than $100 per return reported on Form 1040A or W-2. I

84 INDIVIDUAL INCOME TAX RETURNS FOR 1945-1954
Tabl. 21~ITEMIZEDDEDUCTIONS BY TYPE, 1945-195f
Itemized deductions 1954 1953 1952 1951 I 1950 1949 1948 1947 1946 1945
(Thouaand dollara)
152,4761,051,477
694,7821,245,6031,448,208
932,956
178,0961,300,137
738,3641,324,6091,638,1511,098,326
250,4261,633,553
913,9221,625,6011,969,6411,394,818
241,5691,817,912
1,000,4391,619,3701,878,0801,300,516
227,5961,837,156
1,224,(X)41,952,7312,029,5501,482,699
306,5722,097,950
1,494.. 9282,199,9402,258,0091,556,294(Not
available)
2,221,3533,167,7783,114,7392,133,130
367,5172,552,035
392,6442,878,234
2,735,3593,639,1533,552,4482,391,339
444,2452,730,760
3,.201,2874,076,6303,891,1732,971,172
87,960
Returns with adjusted gross income:Interest paid .Taxes ....... ..•................................Contributions .Medical and dental expenses .Child care .Losses from fire, storm, other casualty, ortheft ... , ..•..•••.•...•.•..•.••••••.•••...•.•.
Other deductions .f--=----=----j-.......:....---'---\------''-----'-----+----t------'------'---1f--'----=---+----'---'---\-------'----'-t---'------'-----j-------'----'-
5,525,4926,277,6837,787,9627,857,8888,753,73811,856,37813,556,55215,589,17717,403,227Total , .F=====I==========F==========I==========l=======1====~=f==~====I========={====='===f=========
7971,748
2,0983,7771,8032,820
1,2476,025
6621,846
8311,405.
4,2865,9543,9393,307
3,4494,746
3,2928,2082,6513,711
2,44810,843
5,2448,1862,2445,111
1,3503,734
1,2282,021
4,0845,3762,3334,164(Not
available)
6,1237,9181,7445,104
(')5,905
4,1178,2894,1695,873
(1 )(1)507
3,2558,7321,3744,276
(')
(')
Returns with no adjusted gross income:Interest paid .Taxes .Contributions , .Medical and dental expenses .Child care .Losses from fire, stann, other casualty, or
theft .Other deductions .
f---+------'---'------+------'-+-----+-------C..--j--'--+---'--+--------'---f----=---+--------'--13,04412,01525,68231,15325,87119,20326,45626,79925,41618,953Total , , ,
F======I=========F=~==I=======t========t====~9========I========={=~~f==========Grand total . 17,422,180 15,614,595 13,583,351 11,882,834 9,932,896 8,779,609 7,889,041 7,813,644 6,289,698 5,538,536
lSample varability of this item is too large to warrant showing it separately. However, this value is included in each total.

INDIVIDUAL INCOME TAX RETURNS FOR 1945-1954 85
Table 22~RETURNSWITH ADJUSTED GROSS INCOME-NUMBER, ADJUSTED GROSS INCOME, AND INCO~ TAX, BY STATES AND TERRITORIES, 1945-1954
States and Terri tor1es 1954 1953 1952 1951 1950 1949 1948 1947 1946 1945
NUMBER OF RETURNS
Ala.bama .......................................... 713,389 731,401 710,102 706,228 634,960 610,931 616,539 643,182 609,799 1 605 ,871Arizona .......................................... 279,907 269,193 263,008 235,389 214,002 203,174 206,128 215,898 201,375 184,246Arkansas ...•.................................... . 390,897 399,806 384,817 366,990 344,316 326,192 304,152 330,597 317,400 310,517California ................................. ...... 4,733,521 4,640)312 4,598,269 4,290,151 4,078,066 3,998,611 4,060,087 4,536,857 4,382,029 '-;,083,251Colorado ................................... ...... 522,393 527,275 509,876 501,563 471,209 459,267 440,969 491,025 439,460 403,785
Connecticut ................ ...................... 919,793 932,475 903,371 896,247 870,345 826,426 871,497 924,812 904,255 1837,399Delaware ..........................', .............. 140,208 142,296 139,153 134,674 128,079 120,793 122,255 126,584 122,107 107,709District of Columbia ............................. 346,729 358,314 397,855 371,578 373,762 396,604 339,450 431,551 418,468 386,412F1orida1 ....•...••••.••••••....•..•......•. '" .•• 1,093,433 1,051 /866 979,277 904,277 822,036 770,284 749,657 773,670 721,943 690,505Georgia .......................................... 886,480 920,035 884,181 844,144 770,782 725,497 741,220 762,366 758,773 l 751,585
Hawaii ........................................... 196,816 200,739 198,799 189,836 179,871 182,803 182,227 206,054 191,218 190,431Idaho ............................................ 199,676 200,197 204,223 199,127 191,116 187,650 190,204 208,128 192,884 1180,678Illinois ......................................... 3,664,301 3,780,956 3,702,881 3,711,052 3,593,433 3,619,255 3,690,962 3,871,396 3,711,882 3.,471,774Indiana .......................................... 1,528,812 1,582,879 1,560,771 1,521,399 1,464,200 1,409,222 1,441,605 1,489,451 1,426,205 1'338,572Iowa ............................................. 949,318 960,696 956,125 953,011 938,132 954,663 923,294 948,755 916,945 837,040
Kansas ........................................... 733,946 744,285 735,424 709,666 669,904 654,528 645,843 677,835 637,397 : 638,076KentucKy ......................................... 797,181 823,859 800,819 781,023 715,431 679,542 713,550 726,498 670,579 636,487Louisiana ........................................ 726,310 745,188 706,734 674,174 637,844 623,020 619,475 663,422 639,996 ' 635,463Maine ............................................ 337,301 341,047 341,265 328,614 320,488 322,300 336,902 344,861 326,599 311,807Mary1and2 ......................................... 1,084,152 1,220,258 1,240,098 1,309,272 1,162,059 1,104,645 958,698 960,602 918,281
1873 '857
Mass8chusetts .................................... 1,946,708 2,013,856 2,010,392 1,965,876 1,931,414 1,902,361 1,947,809 2,040,169 1,998,784 1~858,647
Michigan ..... ~ ................................... 2,631,029 2,706,164 2,550,756 2,555,269 2,477,041 2,333,558 2,410,194 2,707,237 2,444,609 2,273,787Minneoota ........................................ 1,109,306 1,136,124 1,114,900 1,082,642 1,076,359 1,064 / 193 1,066,112 1,113,143 1,080,195 r, 992,060Mississippi ............ " ........................ 336,270 345,964 331,583 320,712 291,822 282,1.72 281,508 293,580 288,542 298,510Missouri ......................................... 1,443,093 1,467,128 1,432,531 1,398,118 1,345,958 1,358,024 1,287,540 1,396,876 1,342,278 1,308,035
Montana .......................................... 218,442 221,685 219,313 218,104 208,597 210,026 210,143 213,085 203,0501
185 '907Nebraska ......................................... 497,166 501,474 502,089 502,962 478,657 475,954 466,438 503,212 468,480 460,076NeV'ada ........................................... 89,406 84,721 82,165 69,903 65,544 61,605 63,581 72,909 71,079 65,174New H&Jnpshire .................................... '215,998 222,857 216,777 216,956 210,103 201,461 211,073 220,524 214,420 !,194,999New Jersey ....................................... 2,140,475 2,191,420 2,117,199 2,089,995 2,008,440 1,941,010 1,993,768 2,061,056 2,028,646 l r981,047
New Mexico ....................................... 211,876 211,922 204,076 194,157 179,164 175,767 155,756 154,001 145,943 140,033New York3 ..... " ................................. 6,347,819 6,510,765 6,435,'701 6,299,130 6,123,930 6,106,261 6,203,398 6,537,319 6,343,055 6~063,750North Carolina ................................... 1,102,039 1,099,125 1,067,239 1,034,528 958,858 906,710 901,457 918,643 910,445
1842 ,833
North Dakota ..................................... 200,647 201,670 211,000 203,780 198,629 217,305 198,521 201,465 188,034 175,955Ohio •••...•..........•••.•..••••••••.•..•.••.•. , . 3,218,821 3,365,384 3,254,058 3,207,570 3,066,256 2,977,078 3,090,503 3,213,264 3,106,666 ~,953,543
IOklahoma ......................................... 663,978 674,504 652,877 675,187 606,613 600,921 577,105 625,258 593,569 ' 571.796Oregon ........................................... 578,796 582,873 586,167 574,454 552,769 541,639 557,588 616,911. 553,967 518,109Pennsy1V'ania ..................................... 4,115,70,3 4,261,351 4,217,689 4,180,637 4,060,469 3,974,815 4,073,136 ' 4,193,136 4,127,644 3,872,854Puerto Rico ...................................... 21,325 (4) (4) (4) ( 4) (4) (4) (4) (4) (4 )Rhode Island ..................................... 317,935 333,802 331,571 335,221 327,753 321,008 331,699 342,760 339,076
1315
'963South Carolina ................................... 518,343 525,688 514,812 490,804 452,555 428,338 424,012 454,974 402,279 400,838South Dakota ..................................... 224,952 220,008 221,491 222,991 215,239 214,937 212,645 213,445 196,414 !.192,316Tennessee ........................................ 908,671 928,575 873,469 856,721 804,601 771,088 769,354 795,462 755,103 695,825Texas ............................................ 2,536,573 2,492,889 2,454,639 2,374,600 2,237,638 2,124,368 2,037,366 2,243,691 2,111,121 1,988,628Utah .•.•...•..•.•.•..•.•....•......•......••••.•• 247,331 248,910 249,544 241,693 225,356 216,304 221,326 232,765 224,578 '214,841
Verm.ont .......................................... 128,901 133,947 132,687 131,591 126,495 127,061 131,103 133,032 131,2971
113'448
:~~~i~~~~;:::::::::::::::::::::::::::::::::::::: 1,105,919 1,100,376 1,082,020 1,001,078 956,580 917,380 905,559 918,801 861,239 817,140982,470 994,502 979,781 953,480 910,934 906,292 902,167 1,018,941 997,732 959;667
West Virginia .................................... 568,245 607,584 610,803 589,091 599,684 596,898 618,189 611,357 573,963 ',545,803Wisconsin ........................................ 1,324,829 1,353,327 1,335,781 1,319,702 1,285,947 1,267,743 1,285,103 1,332,645 1,279,962 Ij209,941Wyoming •..•.•••••••••••• , ..• , ••.•.• , ........ "., • 108,252 111,093 106,711 106,318 101,191 101,625 99,279 96,535 90,191 82,206
Total ...................................... 56,305,881 57,422,765 '56,316,869 55,041,685 52,664,631 51,499,609 51,788,146 54,809,740 52,579,956 49,769,196
ADJUSTED GROSS INCWE (Thousand dollars) II
Alabama .......................................... 2,445,188 2,451,310 2,287,810 2,247,438 1,836,199 1,634,742 1,679,746 1,523,984 1,322,550 1;210,859Arizona .......................................... 1,133,078 1,065,139 1,028,023 853,869. 747,769 642,640 660,433 564,075 490,704 426,052Arkansas ......... .- .............................. . 1,221,340 1,178,792 1,064,449 1,075,003 948,913. 859,742 808,796 758,538 671,122 1592,339California ....................................... 22,023,493 20,861,528 20,100,403 17,781,044 15,558,376 13,978,169 14,307,829 13,248,199 12,420,324 10,989,863Colorado ......................................... 2,137,817 2,072,906 1,924,615 l,800,6B4 1,609,065 1,454,809 1,333,092 1,285,366 1,062,470 949,265
Connecticut ...................................... 4,330,913 4,275,815 3,901,967 3,656,371 3,219,023 2,651,537 2,901,236 2,683,657 2,409,761 2'~78'897Delaware ......................................... 659,777 691,070 652,433 603,774 545,893 448,332 485,791 402,502 369,826 99,012District of Columbia ............................. 1,474,718 1,488,832 1,666,677 1,465,478 1,418,048 1,376,898 1,128,555 1,276,150 1,153,335 "93,047,F1orida1 ..•..•••......••.........•....•.•..••..•. 4,069,109 3,807,180 3,447,667 3,068,460 2,594,907 2,263,498 2,184,806 1,979,727 1,925,713 1,1669,373Georgia .......................................... 3,149,890 3,080,357 3,040,741 2,670/ 363 2,308,074 2,064,459 2,060,766 1,834,569 1,794,224 1,1546,107
Hawaii ........................................... 719,347 705,874 662,698 653,248 583,616 540,858 586,944 585,771 477,568 522,070Idaho ............................................ 750,695 676,761 685,693 669,047 580,309 529,931 519,785 486,631 443,830 376,559Illinois ......................................... 16,597,198 16,558,187 15,797,279 15,291,223 13J 469,090 12,510,306 12,959,004 11,839,400 10,314,057 9,p26,694Indiana .......................................... 6,103,459 6,309,457 5,865,932 5,542,162 4,816,972 4,374,124 4,364,014 3,970,316 3,459,664 3,tL6O,005Iowa ............................................. 3,276,360 3,282,905 3,098,004 3,057,144 2,887,396 2,735,521 2,736,718 2,573,459 2,153,414 1,775,146
Kansas ........................................... 2,748,186 2,687,459 2,556,368 2,372,300 2,075,564 1,888,733 1,948,127 1,829,340 1,502,964 1,~48,436Kentucky ......................................... 2,772,582 2,783,890 2,625,929 2,389,652 2,116,609 1,829,511 1,934,941 1,754,365 1,453,125 1,,294,558Louisiana ........................................ 2,800,016 2,731,283 2,515,010 2,307,898 2,079,747 1,895,155 1,841,078 1,662,1% 1,485,655 1,360,598Maine ............................................ 1,031,944 1,066,856 1,036,442 924,022 847,446 781,219 825,415 746,'701 670,226 1'>18,253Mary1and2 ........................................ 4,531,032 4,828,309 4,716,487 4,528,162 3,817,212 3,381,243 3,036,471 2,694,318 2,412,911 2'r48 ,457
Massachusetts .................................... 7,553,935 7,809,602 7,494,638 6,882,:364 6,309,165 5,912,113 5,949,883 5,324,Q1.4 5,008,564 4,594,761Michigan ......................................... 12,194,265 12,619,118 10,847,852 10,414,660 9,204,619 7,760,425 8,175,360 7,380,259 6,332,542 5,1748,698Minnesota ........................................ 4,077,055 4,010,779 3,911,846 3,608,219 3,429,054 2,993,559 3,071,655 2,936,788 2,448,952 2,~46,778Mississippi ...................................... 1,076,518 1,058,530 1,012,679 954,077 820,156 743,415 743,541 673,561 602,284 ~70,868Missouri ......................................... 5,494,885 5,639,955 5,181,397 4,889,219 4,346,393 4,152,012 3,784,449 3,602,099 3,217,094 2,~20,759
Montana .......................................... 840,262 811,641 784,291 772,597 694,052 629,115 664,243 593,867 490,014 t09,214Nebraska ......................................... 1,666,113 1,703,5% 1,636,387 1,648,425 1,474,351 1,356,295 1,402,937 1,348,932 1,133,081 80,087Nevada ........................................... 410,893 368,385 365,899 277,413 257,323 200,747 217,275 229,985 212,170 i77,485New Hampshire .................................... 750,875 760,947 663,649 657,231 578,200 515,591 565,176 506,288 457,343 il92,882New Jersey ....................................... 9,626,661 9,623,391 8,855,507 8,256,719 7,307,069 6,453,503 6,628,354 6,036,480 5,523,596 5,~25,042
New Mexico ....................................... 804,415 805,671 792,097 696,934 620,901 531,172 472,944 391,122 343,841 294,776New York" ........................................ 28,907,625 28,338,061 26,946,431 25,421,567 22,977,615 21,202,910 21,437,148 20,015,459 18,577,158 16,816,795North Carolina ................................... 3,591,944 3,503,692, 3,358,545 3,150,874 2,759,007 2,335,0'..4 2,359,574 2,098,719 1,946,057 1,~23,637North Dakota ..................................... 552,491 581,462 591,704 617,192 549,467 565,172 610,211 546,809 437,914 hO,589Ohio ............................................. 13,985,208 14,793,481 13,298,984 12,579,855 10,711,935 9,636,409 10,095,564 9,053,107 7,994,638 7,~87,283
See footnotes at end of table.
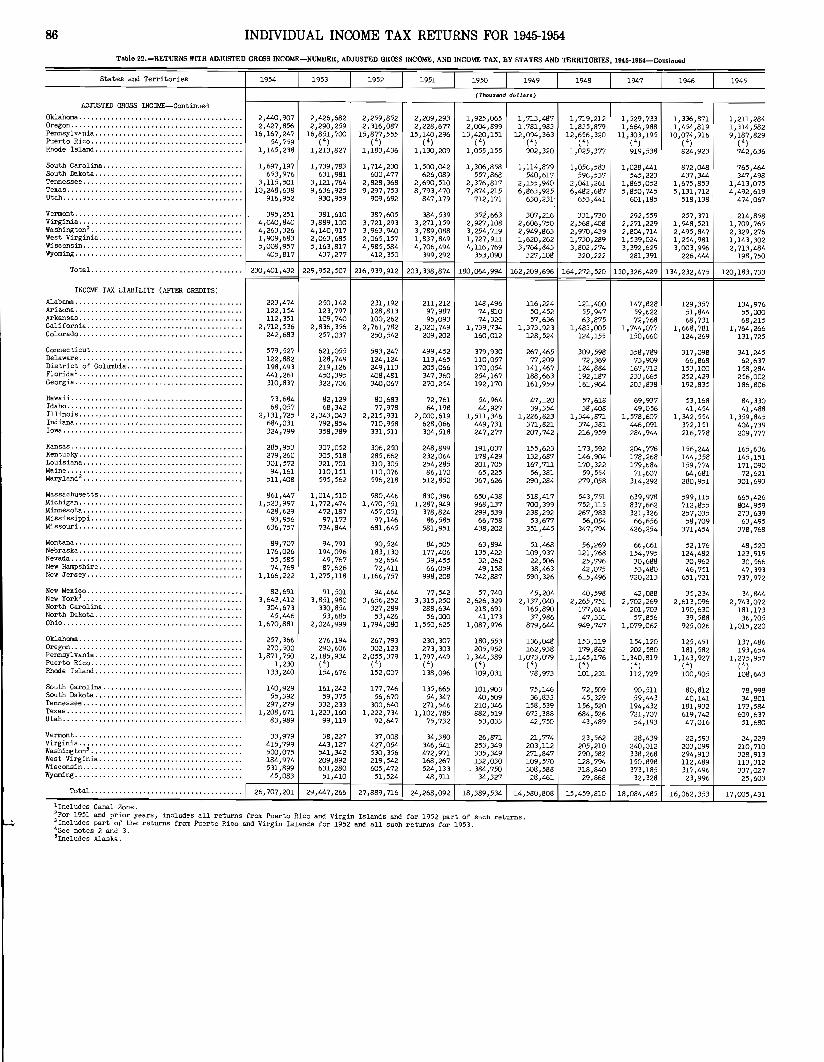
86 INDIVIDUAL INCOME TAX RETURNS FOR 1945-1954
Tabl. 22.-RETURNS WITH ADJUSTED GROSS INCOME-NUMBER, ADJUSTED GROSS INCOME, AND INCOME TAX, BY STATES AND TERRITORIES, 1945-1954-Con.in••d
States and Territories 1954 1953 1952 1951 1950 1949 1948 1947 1946 1945
(ThouslInd dollars)
765,464347,498
1,413,0754,492,619
474,067
1,211,2841,314,5829,187,829
(4)742,636
1,336,8711,454,819
10,074,916(4)824,923
872,048437,344
1,675,8535,131,712
518,138
1,028,441545,223
1,865,0525,850,745
601,185
1,529,7331,664,988
11,303,195(4)919,538
1,056,583596,537
2,041,2616,482,687
653,441
1,719,2121,835,879
12,656,320(4)
1,025,377
1,114,879540,617
2,155,9406,863,925
630,231
1,713,4871,781,983
12,094,363(4)902,320
1,500,042626,089
2,690,5108,793,470
847,179
2,209,2932,228,677
15,140,296(4)
1,130,209
1,714,230600,477
2,828,3689,297,753
909,692
2,259,8522,316,087
15,877,555(4)
1,183,436
1,739,783631,981
3,121,7649,636,925
930,959
2,426,6822,290,259
16,851,700(4)
1,213,827
1,697,197653,976
3,115,50110,248,638
916,952
2,440,9072,427,856
16,167,24754,759
1,145,238
ADJUSTED GROSS INCOME-Continued
Oklahoma ..Oregon .......................•.•.........•.......Pennsylvania .........•.......•................•..Puerto Rico ........................•.•...........Rhode Island .........•...........•.......•.......
1,925,0652,004,899
13,420,151(4)
1,055,155
1,306,858557,86e
2,376,8177,874,215
712,171
Vermont ......................•...... ,., .•.. .•.... 395,251 381,610 387,605 384,539 352,663 307,216 331,730 292,559 257,371 214,858
~;~~i~~~~;:::::::::::::::::::::::::::::::::::::: 1;~;~~ i;f~6:~~~ ~:~~~:;~ ~:;~~:~~~ ~:~;~:~~~ ~:~~~;~~~ ~:~~~:~~ t~~:;i~ ~:~~;~~~ ~:;~~:~~~West Virginia... .•. 1,909,683 2,063,685 2,065,157 1,837,849 1,727,911 1,620,262 1,730,289 1,539,024 1,254,981 1,143,302Wisconsin.......... ..•......... ......• 5,OOB,957 5,163,817 4,985,584 4,706,494 4,116,769 3,764,843 3,802,274 3,392,629 3,003,996 2,713,484Wyoming f-__40~5,:...8_1_7+-__4.:.3_7:...,2:...7_7+__4_1...:2:...,3:...5...:°-1-__3_9_9:...,.:.29_2+_--.:...35...:3.:"_090_+-__32.:,7.:,,.:.10.:,8+__3.:.20...:,...:2.:.22
4_--=2.:.81.:.,:...3_9_1+-_...:2...:2_6:....444_+-__1_98...:,:..,7_50
South Carolina ...........•••.....................South Dakota ...........•.••..............•.•.•.•.Tennessee ............•••......••.......•.....•...Texas .............•.•............................Utah ................•.•.........•................
TotaL..................................... 230,401,432 229,952,507 216,939,912 203,338,874 180,064,994 162,209,696 164,272,520 150,326,429 134,232,475 120,183,733
165,636145,151171,090
72,621301,693
665,426804,959273,63963,495
378,768
341,24562,637
158,284256,002186,806
48,520123,919
30,56647,393
737,972
34,8442,743,072
181,17336,705
1,015,220
84,33041,488
1,359,845404,739209,777
137,486193,654
1,275,957(4)108,643
78,99834,801
173,584609,637
51,680
134,97655,00068,215
1,764,266131,725
17,005,431
599,115712,855257,035
58,709371,454
80,81240,141
181,932619,74247,016
317,09866,868
153,100252,429192,835
156,244144}358159,774
64,681280,951
52,176124,482
30,96246,751
651,721
35,2342,613,096
190,63039,588
925,026
129,35751,84468,731
1,668,781124,269
53 }16841,454
1,342,554372,151216,778
125,451181,582
1,143,927(4)100,905
16,062,353
358,78973,909
167,712233,665203,838
639,978837,662321,326
66,656426,254
90,51159,443
194,432721,70754,193
66,661154,795
30,68853,480
720,213
204,776178,268179,684
71,607314,292
69,93749,056
1,578,607446,091284,944
147,82859,62272,768
1, 74!+ ,077150,660
154,120202,580
1,340,819( 4)112,729
42,0882,702,269
201,70357,856
1,079,062
18,084,485
543,751752,115267,983
56,054347,794
56,269121,768
25,79642,075
615,496
309,59872,369
124,884192,187161,964
173,592146,904170,322
59,554279,058
72,50945,329
156,520684,52643,489
40,5982,265,751
177,61447,331
949,747
57,61838,408
1,344,871374,381216,959
121,40055,94763,875
1,483,005124,155
153,119179,862
1,145,176(4)101,231
15,459,810
155,623132,687167,711
56,381290,284
518,417700,399238,292
53,677351,445
51,468109,937
22,50638,463
590,326
75,14636,833
158,539673,38842,750
45,2042,137,040
165,89037,986
879,644
116,22450,45257,636
1,373,923128,524
267,46577,209
141,467188,663161,959
136,048162,938
1,073,079( 4)78,973
47,12039,354
1,226,823371,821207,742
14,580,80B
101,90340,509
210,346882,519
53,033
379,930110,057170,054254,167192,170
191,037178,429201,70565,225
367,626
54,96444,927
1,511,346449,731247,277
148,49674,81074,320
1,739,734160,012
650,438968,137299,53966,758
438,202
63,894135,422
32,26249,158
742,887
57,7402,626,329
218,69141,173
1,087,976
180,553205,952
1,344,389(4)109,031
18,389,.534
499,452113,465205,066347,360270,254
84,505177,406
:19,45566,059
998,208
211,21297,98795,093
2,320,749209,202
72,76164,198
2,000,619628,066304,518
77,5423,315,250
288,63456,000
1,550,625
230,307273,303
1,797,449( 4)138,096
248,899232,064254,28586,170
512,850
830,3961,287,949
378,82486,585
581,951
24,268,092
593,247124,124249,113408,481340,067
231,192128,813100,262
2,761,782250,542
80,68377,978
2,215,931710,958331,511
267,793302,123
2,055,379(4)152,007
94,4643,656,252
327,28953,426
1,794,080
90,524183,130
52,65472,411
1,166,757
177,74656,670
300,.6401,222,734
92,647
306,250285,662310,305110,076596,218
980,4461,470,~51
457,05197,146
681,645
27,889,716
307,052305,518321,701110,151595,562
276,194290,606
2,185,934( 4)154,676
82,12968,342
2,343,043792,854358,389
250,142123,797109,740
2,836,356257,037
621,055128,749219,126450,395322,706
91,5013,851,980
330,85453,685
2,024,999
1,014,5101,772,474
472,18797,173
734,844
161,24259,375
332,2331,223,160
99,119
94,791194,096
49,76787,626
1,275,118
29,447,266
579,527122,882198,493441,261310,837
73.68468,057
2,131,725684,031324,799
285,953279,260301,57294,161
511,408
223,474122,154112,351
2,712,536242,683
82,6913,643,412
304,67345,446
1,670,881
861,4471,523,997
428,62993,956
636,757
140,92955,392
297,2791,208,671
83,989
257,366270,500
1,871,7501,230
133,240
89,707176,026
55,58574,769
1,166,222
26,707,201Total .
Hawaii .Idaho .........•..................................Illinois '.' ., .................•...............Indiana .Iowa .
INCOME TAX LIABILITY (AFfER CREDITS)
Alabama ..............................•...........Arizona .Arkansas , " ........•..........•..California ....•.......... " .Colorado .. '" , .
Connecticut ..................................•.•.Delaware ..........................•..............District of Columbia .Florida l ...•........•.........• '" .....•.........
Georgia .........................................•
Kansas '" .Kentucky '" ..............•...... , .Louisiana , .Maine .Mary1and2 ............•...........................
New Mexico .New York3 ., " , , ,North Carolina .North D9.kota .Ohio ......••.... _...••...............•... _.. ' _ .
Montana .Nebraska ........•..............................•.Nevada .New Hampshire .New Jersey ...................•...............•...
Oklahoma ........•..•.. _ _. _..•.............. _.Oregon .Pennsylvania ...................•..............•.•Puerto Rico ...................................•..Rhode Island ..............•.•....................
South Carolina .South Dakota ...•....•............................Tennessee .............•..... , " .Texas .Utah .
Massachuset ts .Michigan .Minnesota .Mississippi .Missouri , " .
135,66554,347
271,5461,102,785
75,732
·Vermont... 33,979 38,227 37,008 34,380 26,871 21,774 23,562 28,439 22,593 24,229Virginia.. 415,799 443,127 427,054 346,541 253,349 203,112 205,210 240,012 203,099 210,710Washington'...................................... 500,075 541,342 5.30,356 472,971 335,349 271,847 290,582 338,268 294,913 328,913West Virginia.................................... 184,974 209,892 219,542 168,267 132,030 109,570 128,794 150,898 112,489 113.,312Wisconsin.............. 531,899 631,2BO 605,472 524,133 .384,750 308,588 31B,840 373,185 317,496 337,027Wyoming 1--__45...:,_°_83-+ 5_1,:..,4_1_°+-__5_1:...,5_2_4+__48--..:.,9_1_1+__3_4:...,3_2_7+__2_8.:.,_46_1+__2_9.:.,_86_8-+ 32.:,,_3_28-+ 23...:,:..,9_9_6+- 25.:,,_6_03_
lIncludes Canal Zone.2For 1951 and prior years, includes all returns from Puerto Rico and Virgin Islands and for 1952 part of such returns.3Inc1udes part of the returns from Puerto Rico and Virgin Islands for 1952 and all such returns for 1953.4See notes 2 and 3.'InclUdes Alaska.

Synopsis to!I
Tax Laws~or
,
Individual IncorljleI
INCOME AND SELF-EMPLOYMENT TAX LAW TABLES
Income tax: Page
A. Requirement for filing return and exemptions________________ 89B. Income tax rates___________________________________________ 90
Self-employment tax:C. Requirement for filing return and tax rate____________________ 91
88

SYNOPSIS OF LAWS
Table A.-REQUIREMENT FOR FILING RETURN AND EXEMPTIONS UNDER THE INDIVIDUAL INCOME TAX LAW, 1946- 54 1
89
Exemptions4
For single Additiona18
person, headGross income of household,
Federal income tax law Income requirement For married surviving For each(date of enactment) year2 for filing couple fili~ spouse,6 and dependent?
For age Forreturn3 joint return married 65 or blind-
person filing older nessa separate \
Ireturn
Dollars Dollars Dollars Dollars Dollars Dollars
Internal Revenue Code of 1954 (Aug. 16, 1954) .•..... 1954 ..•.• 600 1,200 600 600 600 I 600
Internal Revenue Code of 1939 amended by--Revenue Act of 1951 (Oct. 20, 1951) ......•........
lRevenue Act of 1950 (Sept. 23, 1950) ..•..••..•.... 1948-53 .. 600 1,200 600 600 600
I600
Revenue Act of 1948 (Apr. 2, 1948) ................Revenue Act of 1945 (Nov. 8, 1945) •.•.•.••.•.•.•.• } 1945-47 .. 500 91,000 500 1°500Individual Income Tax Act of 1944 (May 29, 1944) .• ... I ...
IThis table relates only to citizens and resident aliens of theUnited States. For income years prior to 1945, see Statistics ofIncome for 1950, Part 1, pages 308-309.
2Returns are permitted for fiscal years also except on Form W-2for 1945-47 or on Form 104QA for 1948 and subsequent years.
3Gross income includes all gains, profits, and income, derivedfrom whatever source except income that is specifically exemptfrom income tax.
The amount of income for which married persons are reqUired tofile a return is the separate gross income of husband or wife.Husband and wife file separate returns unless they elect to combine their income and file a joint return. A joint return may befiled even though one spouse has no income. For 1948 and thereafter, a joint return is permitted if one spouse dies during theyear and the survivor does not remarry. A joint return is notallowed if either spouse is a nonresident alien or if husband andwife have different tax years. The marital status is determinedas of the last day of the income year or as of the date of deathif one spouse dies during the year.
A person with less than the required amount of gross income,which includes wages subject to withholding of income tax, shouldfile a return to claim refund of tax withheld unless such incomeis included in a joint return. Also, an individual with less thanthe indicated amount of gross income should file to claim refundof any payments made on declaration of estimated tax.
For filing requirement of individuals having net earnings of$400 or more from self-employment after Dec. 31,1950,see table C.
4Exemption for the taxpayer and additional exemptions for ageand blindness are determined from the marital status at the closeof the year (or at death of a spouse), but exemption for dependentsis determined from tests regarding gross income,suppor~and otherqualifications. No proration of exemption is required because ofdeath during the year of a taxpayer, his spouse, or a dependent.
Exemptions are termed "normal-tax exemption" and "surtax exemption" for 1945 and "exemption" for 1946 and thereafter.
Exemptions are allowed as a credit against net income for bothnormal tax and surtax prior to 1954, except as stated in notes 9and 10 for the year 1945. For 1954, exemptions are allowed as adeduction in computing taxable income.
SA citizen whose gross income is principally from sources within a possession of the United States, even though filing a Jointreturn,is allowed only one exemption of $500 for 1945-47 and [$600for 1948 and thereafter.
6Head of household status applicable for tax years beginningafter Oct. 31,1951 and surviving spouse status applicable fon taxyears beginning after Dec. 31, 1953. !
?An exemption for a dependent is allowed each closely relateddependent specified by law, over half of whose support was receivedfrom the taxpayer and whose gross income for the tax year was lessthan $500 for 1945-50, or less than $600 for 1951-53. [
For 1954, exemption is allowed for a dependent over half of !hosesupport was provided by the taxpayer and whose gross income was lessthan $600,except that the gross income test is disregarded in thecaSe of a child who is under 19 years or who was a student. Ifthe dependency tests are otherwise met, certain specified relateddependents may live outside the taxpayer's household, but any eitherdependent must live in the taxpayer's home. An exception t9 thesupport test for a dependent is made under the multiple su~port
agreement provision. .Dependents must be either a citizen of the United States or a
resident of the United States, Mexico, Canada,or for 1954 a resident of Panama or Canal Zone,or a resident of the Republic o~ thePhillipines who was born to or adopted. by a serviceman b~fore
July 5, 1946.Credit for dependent is not allowable to citizens whose gross
income is principally from sources within a possession of theUnited States. I
8Additional exemptions are allowed only to the taxpayer and, ifa joint return is filed, his spouse. '
9Each spouse is allowed $500"surtax exemption"and $500 "norjnaltax exemption," except that for 1945 where the adjusted gross· income of one spouse was less than $500, the combined "normal~taxexemptiou'was the sum of the adjusted gross income of such sp~useand the $500 exemption of the other spouse.
l~xemption for each dependent is a "surtax exemption" for ~945
and allowed against net income for surtax purposes only.

90 SYNOPSIS OF LAWS
Table B.-MINIMUM AND MAXIMUM INCOME TAX RATES UNDER INDIVIDUAL INCOME TAX LAW, 1945-541
Tax rateJ
Surtax rate5 for- Combined normaltax and surtax
~owest bracket of Highest bracket of rates 9 at-surtax income, not surtax income,over- over-
(a) $2,000 for (a) $200,000 for MaximumFederal income tax law Income year 2 married person married person rate(date of enactment) Normal filing separately, filing separately, Lowest Highest limita-tax rate' and single person and single person bracket bracket tionlU
(b) :1;2,000 for (b) $300,000 for of surtro<pf surts.>head of household6 head of household 6
(c) $4,000 for (c) $400,000 forincome income
married couple married couplefiling jointly,? filing jointly,?and surviving and survivingspouseS spouseS
Percent Percent Percent Percent Pet'cent Percent
Internal Revenue Code of Calendar year 1954 ........... - - - 20.0 91.0 87.01954 (Aug. 16, 1954) .
Internal Revenue Code of1939 amended by--
lCalendar years 1952-53 .•.....
Revenue Act of 1951Fiscal years beginning after 3.0 19.2 89.0 22.2 92.0 88.0
(Oct. 20, 1951).Oct. 31, 1951 and endingbefore Jan. 1, 1954.
Calendar year 1951 ........•.. 3.0 17.4 88.0 20.4 91.0 87.2
Fiscal years beginning after 3.0 17.0 88.0 20.0 91.0 87.0Sept. 30, 1950 and ending
Revenue Act of 1950before Nov. 1, 1951.
Calendar year 1950 ........... 3.0 17.0 88.0 17.4 84.4 80.0(Sept. 23, 1950) . Fiscal years ending afterDec. 31, 1949 and before 3.0 17.0 88.0 16.6 82.1 77.0Oct. 1, 1950.
Revenue Act of 1948 Calendar years 1948-1949 .....(Apr. 2, 1948).
Revenue Act of 1945 Calendar years 1946-1947 .•..• 3.0 17.0 88.0 19.0 86.5 85.5(Nov. 8, 1945).
Individual Income Tax Calendar year 1945 •.•........ 3.0 20.0 91.0 23.0 94.0 90.0Act of 1944 (May 29,1944) .
lThis table relates only to rates for citizens and residents ofthe United States. It does not cover the optional tax althoughthe same rates are used to produce the optional tax as are otherwise used (for 1954 optional tax table, see page 114). For taxrates prior to 1945, see Statistics of Income for 1950. Part 1,pages 308-309 and 318-321.
2 In case of a change in tax rates during a fiscal year other thanthose listed, the total tax is prorated according to the portionof time in the tax year under each rate.
JFor 1946 through calendar year 1950, the normal tax and surtaxrates produced a tentative tax which was subject to reduction asdescribed in note 9.
On joint returns of married persons for 1945-47, normal tax andsurtax rates were applied to the combined income. For 1948-53,both rates were applied to one-half of the net income reduced byone-half of the applicable credits against net income and the result multiplied by two. For 1954, on joint returns and returnsof surviving spouse, the single combined tax rate is applied toone-half of the taxable income and the result multiplied by two.
4The normal tax rate applies to normal tax net income which isnet income less the credit for partially tax-exempt interest andthe exemption allowed for normal tax.
5Surtax rates apply to surtax net income which is net income lessthe exemptions allowed for surtax.
6Head of household status is applicable for tax years beginningafter Oct. 31, 1951.
?Prior to 194~the lowest bracket of surtax income fora marriedcouple filing jointly is $2,000 and the highest bracket is $200,000.
SSurviving spouse status is applicable for tax years beginningafter Dec. 31, 1953 and ending after Aug. 16, 1954.
9For 1946 through calendar year 1950, the combined rates shownare after tax reductions and the rates so computed are rounded.For 1946 and 1947 the tentative normal tax and surtax are reducedby 5 percent thereof. For tax years beginning after Dec. 31, 1947and ending before Oct. 1, 1950, the combined tentative normal taxand surtax is reduced by 17 percent of the first $400, plus 12percent of the next $99,600, plus 9.75 percent of the excess over$100,000. For calendar year 1950, the tentative normal tax andsurtax are reduced by 13 percent of the first $400, plus 9 percentof the next $99,600,plus 7.3 percent of the excess over $100,000.
laThe combined normal tax and surtax shall not exceed the indicated percentofnetincome for 1945-53,or taxable income for 1954.

SYNOPSIS OF LAWS
Table C......REQUlREMENT FOR FILING RETURN AND TAX RATE UNDER THE SELF-EMPLOYMENT TAX LAW, 1951-54
91
Self-employment Maximum self- Tax rate on se~f-Federal self-employment tax laiv Income year1 net earnings 2 employmen-t employment incbme
(date of enactment) requirement for income sUbject to tal{4filing return3
Dollars Dollars PercentInternal Revenue Code of 1954 amended by--
Social Security Amendment of 1954 (Sept. 1, 1954) ........ Fiscal years ending 400 4,200 3after 1954
I
Internal Revenue Code of 1954 (Aug. 16, 1954) .•........•••. 1954 .••..•...•..... 400 3,600 3
Internal Revenue Code of 1939 amended by--
21 1/ 4Social Security Act Amendment of 1950 (Aug. 28, 1950) .... 1951-53 ............ 400 3,600
lReturns are permitted for taxable years other than a calendaryear.
2If net earnings from self-employment are less than $400, theyare disregarded.
For the calendar year 1954 and prior years, net earnings fromself-employment are the gross income derived from trade or businessreduced by allowable deductions attributable thereto, plus sharesof partnership income or loss, but exclude income from servicesas a public official, employee,railroad worker, minister, ormember of religious order, and income from farming, certain professions, dividends, interest, real estate rentals except thoseof dealers,and gain or loss from sales of capital assets or otherproperty neither inventoriable nor held primarily for businesssales.
For a fiscal year ending in 1955, self-employment earnings wereextended to include income of farmers, arChitects, accountants,funeral directors, and professional engineers. Ministers andmembers of religious orders who had not taken the vow of poverty,and Christian Science practitioners may elect coverage as selfemployed persons.
445805 0 -57 -7
ICasualty losses on business property, net operating losses for
other years, and personal exemption are not allowable deductionsfor the computation of self-employment earnings in any year. I
3A citizen or resident of the United States, or a resideni ofPuerto Rico or the Virgin Islands having net earnings from sJlf-employment of $400 or more is required to file a return. I
If husband and wife both have self-employment earnings, eachmust report his net earnings independently, even though a jqintreturn is filed. ~.
4Self~employment income subject to tax is the smaller of (a)self-employment net earnings, or (b) the maximum self-emplo entincome indicated in the table reduced by any wages received fromwhich social security tax was withheld by the employer. I
On a joint return where both spouses are self~employed, the 'taxrate is applied separately to the amount of self-employment in~omesUbject to tax reported by each spouse. I


Facsimiles of
Individual Incomk!
Tax Returnr
for 195tf

Pllge
Form 1040: Individual Income Tax Return_________________________ 9,15Schedule C, Business or Profession_____________________ 115Schedule D, Sales of Property _________________________ 1191040F, Farm Income and Expense______________________ 121
Form 1040A: Individual Income T'1x Return _______________________ 12594
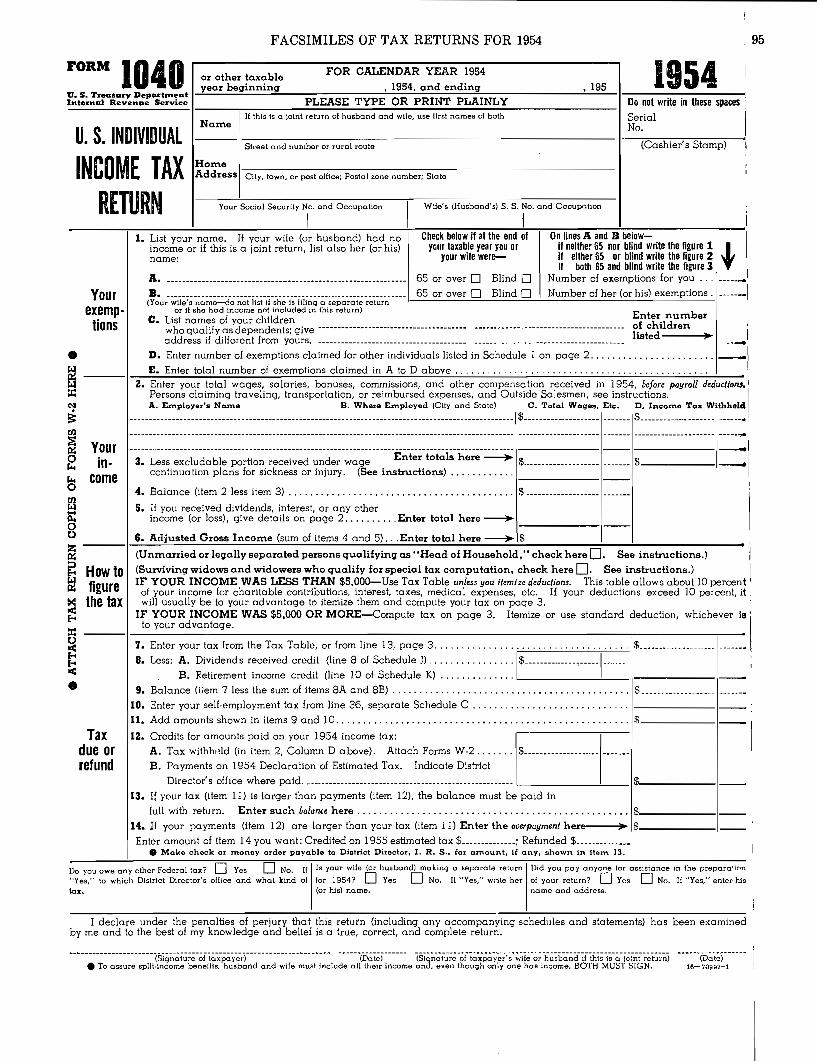
FACSIMILES OF TAX RETURNS FOR 1954 95
------4
1954
(Cashier's Stamp) i
$ ------------------- -------
Street and number or rural route
If this is a joint return of husband and wife, U6e Hrst names of bothName
HomeAddress City, town, or post oHice; Postal zone number; State
(Unmarried or legally separated persons qualifying as "Head of Household," check here D. See instructions.)
(Surviving widows and widowers who qualify for special tax computation, check here D. See instructions.)IF YOUR INCOME WAS LESS THAN $5,OOo-Use Tax Table unless you itemize deductions. This table allows about 10 percent
of your income for charitable contributions, interest. taxes, medical expenses, etc. If your deductions exceed 10 percent, itwill usually be to your advantage to itemize them and compute your tax on page 3.
IF YOUR INCOME WAS $5,000 OR MORE-Compute tax on page 3. Itemize or use standard deduction, whichever isto your advantage.
4. Balance (item 2 less item 3) , , , , , , , . , , , , , .
5. II you received dividends, interest, or any otherincome (or loss), give details on page 2 ... ".", .Enter total here----'
1------1--6. Adjusted Gross Income (sum of items 4 and 5) ... Enter total here ----. $
- ----_._----.-- - - -------- - - ------ -------_._---_•••_-------- - - A •••• ._. •••• - - _ • - - - • ~
2. Enter your total wages, salaries, bonuses, commissions, and other compensation received in 1954, before payroll deductiom.Persons claiming traveling, transportation, or reimbursed expenses, and Outside Salesmen, see instructions.A. Employer's Ncune B, Where Employed (Clty and State) C. Total Wages, Etc. D. Income Tax WithheIcl
---- --------------------- ---------------------------- --- ----- ---- -- -------- ------------------------- $-----------.-------- ----- -- $------------. ------ - ------
------.. -- ------- ----- --- --- ---- -- --------------------- ------ --- -- ---- -------- ------ ------------- --- - \-------1---1·-------1-3. Less excludable portion received under wage Enter totals here ----. $ $ 1_
continuation plans for sickness or injury. (See instructions) .1-------1---
7. Enter your tax from the Tax Table, orfrom line 13, page 3 .. , , 1$ -------8. Less: A. DlVldends received credit (Ime 8 of Schedule n 1$ , 1 _
B. Retirement income credit (Ime 10 of Schedule K) , ,. , ,,_9. Balance (item 7 less the sum of items 8A and 8B) , , . , .. , , . , , . , , , $ •
10. Enter your self-employment tax from line 36, separate Schedule C , . , , , , 1-------1---
11. Add amounts shown in items 9 and 10 ,., , , $ 1 _
12. Credits for amounts paid on your 1954 income tax:A. Tax withh'1ld (in item 2, Column D above). Attach Forms W-2 $ _
B. Payments on 1954 Declaration of Estimated Tax. Indicate DistrictDirector's office where paid. . , -'-__ $ ,,__
13. If your tax (item 11) is larger than payments (item 12). the balance must be paid infull with return. Enter such balance here .. ",.", , , " $ 1__
14. If your payments (item 12) are larger than your tax (item II) Enter the overpayment here .. $ 1__
Enter amount of item 14 you want: Credited on 1955 estimated tax $ ; Refunded $ _• Make check or money order payab10 to District Director, I. R. S .• Eor amount, i£ any. shown in item 13.
1040
Yourin
come
Yourexemp
tions
Taxdue orrefund
u. S. INDIVIDUAL
INCOME TAXRETURN Your Social Security N,O' and Occupation I Wife's (Husband's) S. S. roo and Occupation i
-------,--l.-L-is-t-y-·o-u-r.:....n-a-m-e-.-l-f-y-o-u-r-w-jf-e-(-o"-r-h-u-s-b-a-n-d-)-h-a-d-n-o---:-':"C:-he-C:-k":'"be""':I-OW--:":il-a":'"t:7th-e-e-n"7d-'o":'"I---;---::O:-n"7li:-n-es-A=-a-n"7d-::B~be""':l-ow----------I
income or if this is a joint return, list also her (or his) your taxable year you or II neither 65 nor blind write the figure 1 ~name: your wile were- II either 65 or blind write the figure 2
II both 65 and blind write the figure 3A. .____ 65 or over [] Blind [] Nwnber of exemptions for you ... 1
B. --------- ---- -- -- ------- --- -- ------- __ ----- __ -- _-- __ -- _-- ,_6_5_0_r_o_v_e_r.=O=--_B_li_n_d...:O=---,-_N_u_m_b_e_r_o_f_h_e_r_(:...o_r_h_is:...)_e_x_e_m...:p:...t_io_n_s_·1-----_1
(Your wile's nome-do not list if she ls filing a separate return ,-or if she hod income not included in this return) Enter number
C. List names of your childrenwho qualify as dependents; give --------------------------------------- ------------.-------------------------- of childrenaddress if different from yours. listed----'l~~
D. Enter number of exemptions claimed for other individuals listed in Schedule 1 on page 2, , , , , , , . , , , _
E. Enter total r,umber of exemptions claimed in A to D above, .
FORMor other taxable FOR CALENDAR YEAR 1954year beginning • 1954. and ending , 195"U. s. Tl'ecsDry DepCll't.ment I....'-=.:=-====~ --:--_----'....:c:'::-''-'--=-=-'-:--'-:-=-~ .:.....:..:...:_I -:
Internal Revenge Service PLEASE TYPE OR PRINT PLAINLY Do not write in these spaces iSerial \No.
•~:t:N
==rn~ll::oI<.<
a~-ll.oo~ll::
~ How to... figure~ the taxE-<
:r::~t::<•
Do you owe any other Federal lax? DYes D No. If Is your wife (or husband) making a separate return Did you pay anyone {or aasistance in the preparation
"Yes," to which District Director's office and what kind of for 1954? DYes D No. If "Yes," wJile her of your return? 0 Yes D No. If "Yes," enter histax. (or his) name. name and address.
I declare under the penalties of perjury that this return (including any accompanying schedules and statements) has been examinedby me and to the best of my knowledge and belief is a true, correct, and complete return.
ao, • -- - - - - -(Siq;-~t~;~-~i t;;-;p~):-;I~)---. ----- -- ----------_. ------d5~"t;)------ (Sig~-~t-~;~ ·~rt;;~-p~),w;r":;·;if;-~; -h~;t-;;~~iii tht; -i~-;;- j~~t ~;'t~~~)
• To assure aplil.income beneJlls. husband and wife must iRclude all their income and. even though only one has income, BOTH MUST SIGN.---- --iD;;'t~j- -- ---
16-70997-1

96 FACSIMILES OF TAX RETURNS FOR 1954
Paqe 2Schedule A. INCOME FROM DIVIDENDS (First see Schedule J)
1. Enter amount of dividends reported on line 6 of Schedule 1. 1$---.-----.------------------Z. Enter total of all other dividends; itemize below, listing name of corporation and amount. . '-:- 1
_______________• • . . .._••• .. . .______ _ Enter total here~ $ ._.. _ .
Schedule B.-INCOME FROM INTERESTName of payor Amount Name of payor II Amount
~ :~::::: ~~~: :~: ~~::~::: ~:: :::::::::::::::::~:: ~---~-----~~~~::~::::::::::: ::~:::::::::::::~:::::::::::::::::::::::::::::: $-- - --- -- .--.-.-- -----. --______________--'- ---'-'- -=E:.:n.:..:t:.:e:..r..:to.::.t:.:a=l~h:.:e=r:..:~:......:: _. _
Schedule C Summary.-PROFIT (OR LOSS) FROM BUSINESS. FARMING, AND PARTNERSHIP
1. Business profit (or loss) from' separate Schedule(s) C, line(s) 24 - 1$ .__Z. Farm profit (or loss) from separate schedule, Form 1040F . _
3. pa;:::~:i:t~~:~o::~o:~:r~s~~~:-~~~:--~~-~~:--~~-~~~~~-~_.._~_~:_._:~_~~ .._~~_~~_~: .._~~_~: ~ .._~4. Total of lines 1, 2, and 3 ..•........... , , , , , , , ,. $ • _
5. Less: Net operating loss deduction (Attach statement) , ..•...... , . '-- 1
6. Net profit (or loss) (line 4 less line 5)", ,., """ " .. , , ,."., .. ,., , __. ._
Schedule D.-GAINS AND LOSSES FROM SALES OR EXCHANGES OF PROPERTY1. From sale or exchange of property other than capital assets (from separate Schedule D) " . , .. " , .•. _2. From sale or exchange of capital assets (from sepa.rate Schedule D) , , , , .....• _
Schedule E.-INCOME FROM PENSIONS OR ANNUITIES (See instructions)
Pcul I.-General Rule
1. Investment in contract ..........•.. $, 1 4. Amount received this year. , , . , . $ 1
2. Expected return, ' I$ijl------I 5. Amount excludable (line 4 multi-3. Percentage of income to be excluded plied by line 3) , $ 1_...:.(l:.:in:.:e.:...,:l_d::;i;.,v.::.id::,e:.:d.:....:b,:.y,.;l.:..:in.::.e:.:2"");.,._._._._._'_'_.._._._.-'-_-::-----:----:......;,%"---''--6_._T_a_x-:a:-b_l_e_p,-o,;.,r_t-:-io_n......;,(e-:-x_c_e_ss......;,o_f_li_n..:e_4.:....:0..:v.::.e':..• .::.li;:,n..:e,;.,5.:..:)..:...;.. .::..,;.,.:..';.,'';.,' _
Part II.-Where your cost will be rccove::,ed wi~hin three years and your employer has contributed part of the cost
1. Cost of annuity (amounts paid in) ... , $ • .0.__ .nh 4. Amount received this year .... _.1 $..-- 1
2. Cost received tax·free in past years.. S. Taxable income (excess of line 43. Remainder of cost (line 1 less line 2) __ $. .__________ over line 3) , _. , , , , , , .
Schedule F.-INCOME FROM RENTS AND ROYALTIES
1_ Kind and localion of properly 2. Amount of renl orroyalty
3. Depreciation (explai n inSchedule H) or depletion
4. Repairs (a!lachitemized list)
5. Olher expenses (a!lachitemized lisl)
----- -'- ._-_._--- _.- ------_. __._-----_.-_. $- ---- ------------ ---.-- - $--- ---_._-_.------------ $.---------_.- ---------- - $- ._----_._--.---.---- --
-----------------_·_-_·_----------_·--·---1-------1-------1-------1-------11. Totals $ $ $ $
Z. Net profit (or loss) (column 2 less sum of columns 3, 4, and 5) , , .. , , , . , . , , .Schedule G.-INCOME FROM OTHER SOURCES INCLUDING ESTATES AND TRUSTS
1. Estate or trust (Name and address) ........•.•.••••..•.....•••.••..........•..• , .....•. , ........••••....2. Other sources (state nature) , , . , , , .
TOTAL INCOME (OR LOSS) FROM ABOVE SOURCES (Enter here and as item 5, page 1) .. , $
Schedule H.-EXPLANATION OF DEDUCTION FOR DEPRECIATION CLAIMED IN SCHEDULE F
I. :~7~ho~:nrS~~~~~d~~ b~~~i:3:'I~~~t~~a~~~:~ofnondepreciable properly
2. Dale acquired3. Cost or other
basis4. Depreciation al·lowed (or allowable)
in prior years5, Method 6. Rate ('fa)
or lite (years)7. Depreciation
lor this year
-. ------------ ----- $- - ..... ---------- - $- --------------- -- -- --------- ------ -- ---.- --- ----------- $- -_.--.._- --------
Sch. I.-EXEMPTIONS FOR INDIVIDUALS WITH GROSS INCOME OF LESS THAN $600. OTHER THAN WIFE AND CHILDREN
I. Name of individual. Also give address if dill.rent from yours 2. Relalionship3. Did individual have
gross income of $600or more in 19541
4. If answer to 3 is "No" enter amount speol forindividual's support in 1954 by-
r~~ ~i~~ (e~~~n)~'I~ lfo~~ Others, and by individualwrite "all" from own funds
---_._---------------.--- $ ..__ ._-._------- -------- $------------- ------ --_.-
Enter here and as item ID, pags 1, the number of individuals claimed above .••••• , ••••••••••••............ , , INOTE.-If exemption is based on your being de=~gnotedas the O:le to claim a dependent, the necessoOry multiple support agreement must be attache::!.
15-i099j-1

FACSIMILES OF TAX RETURNS FOR 1954 97Page 3
ITEMIZED DEDUCTIONS-FOR PERSONS NOT USING TAX TABLE OR STANDARD DEDUCTION.
If Husband and Wife (Not Legally Separated) File Separate Returns and One Itemizes Deductions, the Other MU3t Also Itemize.
Describe deductions and slGle to whom pc.~d.. I: mOre space is needed. Qttach additionCl1 sheets
Contr!butions
Interest
Taxes
Total Contributions (not to exceed 20 percent of item 6, page 1. except where contributions tochurches, schools, and hospitals are included). (See instructions) $ _
~~:~:~~~~~:~-~:~-~~~-~ ~-~--~~-~~~::--~:-:-~-:~~~:_~--~ _::::~ ~-~-~--- ~~_:~_:~:-~_:_:~~_:::_-~&~~~Total Interest ••_. ,
~:::~:~~~::-~~--:-:~-~~:--:-~-~--::~--~~~_~~ -:--:_-~~:~~_-----==~ ~~~:~-~:-:~~:-::-:-:::E_______---+_T_o;:..t:..;;a..;.I_T...:a...:x;;.;e_s...:....:...;....;....:.. ..:.'_. ..:.'....:...:....;....:.. ..:.. ..:.. ..:.'...:.._...;....;....:.._.,-'..:.'...:.....:...;....;....:.. ..:.. ..:..,-'..:.'...:.....:...;....;....:.." ,-'..:.'...:.._...;....;....:.. ..:..,-'_....:.._._.,,:,._." _._._._._._. ..:.'..:.:'_'_'_'_'_'1--------------------- ----•••
Do not entor any expense compensated by insurcnce or otherwise A. l\fedicine and Drugs B.Oth...
Total Allowable Losses (not compensated by insurance or otherwise) _
::::::::::-:::::::-:::::::::::::::::::::::::::::::::::::::::::::::::::::::::::::::::::::::::t==Miscellaneous
Medical anddental expense
(II ooer 65. 3U
inslrucUon3)
Losses from'fire, storm, orother casualty,or theft
I. Net Expenses (Attach itemized list) $ • $ _
2. Enter in Column A, 1 percent of item 6, page 1 '- 1
3. Enter in Column B, excess of Column A, line lover line 2 .........•........ ) 14. Total of Column B, lines 1 and 3•.••••••..................•............ $ _
5. Enter 3 percent of item 6, page 1 l..- I
6. Allowable amount (excess of line 4 over line 5). (See instructions for limitationa) .
__C_h_i_ld_c_ar_e_...;I_E_xp_e...:(:;;.A;;.;~;,;;sa;;.~;;.;0h;..:r..:~:.:fa=r.:;:e;..:~;,;;f:.:~;,;;~:.::i!:..f:..~e:...~;.;....;~..;.~..:.~..:..c.:...e:...r.:..t~...;~...;~..;..o..:..t.:..~,-e~:...;.d...;.e...;.p..;..e..:..n,;,..d.:...e..:..~;.;~...;s...;.(s..:..e,;,..e.:...i:..~:...S~;.;~...;~...;~t..:.~o..:.. n,;,..s'-')..:.,".:...;....;~..:..o..;..t,;,..to.:...:...~:...;~;.;~...;~..:.~d..:.. ..:.~.:...6,-.0:...~:...;'.~ 1 _
::-::::::::::::::::::::::-::::::::::-:::::::::::::::::::::::::::::::~ :~::::::: ::::::::::::::::::::::t==Total Miscellaneous Deductions .
TOTAL DEDUCTIONS (Enter on line 2 of Tax Computation. below) " $
TAX COMPUTATIONI; Enter Adjusted Gross Income as shown in item 6, page 1 . . . . . . . . . . . . . . . . . . . . . . . . . . . . . . . . . . . . . . . . . . . . . . . .. $----------- ---- _Z. If deductions are itemized above, enter total of such deductions. If deductions are not itemized and line 1. abooe. i3
$5.000 or more: (a) married persons filing separately enter $500; (b) all others enter 10 percent of line I, butnot more than $1.000 ...•••.......•......•........•....••.•••••••••.........•....•......••.••.•••••. 1 1 _
3. Subtract line 2 from line 1. Enter the difference here $-------------------- _4. Multiply $600 by total number of eAemptions claimed in item IE, page 1. Enter result here /--- 11__
S. Subtract line 4 from line 3. Enter the difference here. This is your Taxable Income $
6. If you are Q single pe..son, a Jnarried person filing saporately, or a head of household-Single persons and married persons filing sepo.rately uss Tax Rats Schedule I in the instructions to figure taxon amount on line 5; heads of household U3e Tax Rate Schedule II $ .1 _
7. If this is a joint return, or if you qu.O-lify to file as a surviving widow or widower- I~~~ ~:e;::;~~~fS~h::~~~t ~nt.~i::n~~1'~~·l;~~3· 't~' ii~'u'r~' ~~~. ~~. ~~~~~; .~~ 'I;~~ .; '(~i :::.$..------------------
(c) Multiply amount on line 7 (b) by 2 $
8. If alterriotivs tax is applicable, enter the tax from separate Schedule D 'I~$'-- I _Disragard lines 9 through 12, and copy on line 13 the same figt;;re y~u entered on line 6, 7 (c), or 8, unless you
used itemized deductions.
So En~, hore i=omo la, poymonm 10 a foreign ronn", 0' U_S_ "",,",,ion (A11a,h Fo= 1116) - r----m--m--------10. Enter here any income tax paid at source on tax-free covenant bond interest _
11. Enter here credit for partial1y tax·eAempt interest (See bstructions for limita.tion) .12. Add the hgure3 on bes 9, 10, ar..d 11. Enter the total hera $ 11__
13. Subtrod.lin", 12 from line 6, 7 (c), or 8, whichever is applicable. Enter difference here a;1d 03 Hem 7. page 1 .. $16 70997-1

98 FACSIMILES OF TAX RETURNS FOR 1954
Page 4
Schedule I.-EXCLUSION AND CREDIT FOR DIVIDENDS RECEIVED FROMQUALIFYING DOMESTIC (U.S.) CORPORATIONS. (See instructions)
A B
1. Name of corpcrationdeclaring dividend: Amount receivedbefore 8/1/54
Amount receivedafter 7/31/54
- ----- -•• -- ---- ----- -. --_.--- ---••-- ---------- -._-- -------- -------- --- --_._----------••_._._------. __.---- -- -.- - $- ---- --- --- ---- -_.- - -- ----- $- -- ----- --- -- ------ - --- ----
2. Total. $. .__._ $ . __
~: ~:~:n~:~~~~i~~.~f. ~~~.' .. ~~.~I~.~~~I.~s~~~.f~~s.t .t~. ~~~'. ~ ~.n.~ ~~~~~~'. ~f. ~~~: ~~ .~I ~: : : :: $ $ ... 1==5. Enter in Column B, the amount from Column A, line 4.................................................... 1__
6. Total dividends to be entered on line L Schedule A, page 2 (total of Column B, lines 4 and 5) •...•••..••...... $ _
7. (a) 4% of amount on line 4, Column B, ~~~~I.~.~.~~~.~~~~~~~ ....•..................•.••.•.•........ $ 1__
(b) Tax shown on line 6, 7 (c). or 8, page 3, less the amount, if any, on line 9, page 3; or, if Tax Table is used,
(c) :h~ t:fXt~:~:: i:'C:=:~~i~~ ~: .~~~~ '~;' :f·~;t~~~~;i~~· ~~~ ;~ ~~~I;~~~;~,' ;i~~ '~~,' ~~;1~~~1~'~ .(~~;~~ 'I:~~ ;~ ;~. $"------1--the case of a joint return). . . . . . . . . . . . . . . . . . . . . . . . . . . . . . . . . . . . . . . . . . . . . . . . . . . . . . . . . . . . . . . . . . . . . . . .. $, -!-__
(Taxable income, for those using the Tax Table to compute tax, is the amount shown in item 6, page L less10% thereof and less the deduction for exemptions (item I E, page I, multiplied by $600))
8. Enter here and as item 8A, page I, the smallest of the amounts on lines 7 (a). 7 (b). or 7 (c). above $l.,;..... ~~_
NOTE: If both husband and wife have qualifying dividends, an exclusion shall be allowed to each on line 3 to the extent of the dividendsreceived but not to exceed $50 each.
Schedule K.-CREDIT FOR RETIREMENT INCOME. (See instructions for definitions and other details)
DNo
B
Dyeso NoDYes
rf"separate return, use Column B only. If joint return, use one column for husband and Ione' for wife. A
Did you receive earned income in excess of $600 in each of any 10 calendar years beforethe taxable year 1954? .
If answer above is "Yes" in either column, furnish all information below in that column.
1. Retirement income for taxable year:(a) For taxpayers under 65 years of age:
Enter only income received from pensions and annuities under public retirementsystems. (Do not enter pensions, annuities, and retirement pay from Armed Forces). $ 1 $ 1
(b) For taxpayers 65 years of age and older:Enter total of pensions and annuities, retirement pay from Armed Forces, interest,r~nts, and dividends included in gross income in this return .............•........ $ 1 $-,------11--
Lhnitation on Retirement Income2. Enter here amount shown in line 1 or $1,200, whichever is lesser ...•.•••••••••••..... $ $ _
3. Deduct:(a) Amounts received in taxable year as pensions or annuities under the Social
Security Act, the Railroad Retirement Acts, and certain other exclusions fromgross income. (See instructions) .. • . __ . __ .__
(b) Compensation for personal services received in the taxable year 1954 in excess of $900.(Line 3 (b) does not apply to persons 75 years of age or over.) I
4. Total of lines 3 (a) and 3 (b) $ "
5. Balance (line 2 minus line 4) ..........••••••••••••••••••••••••••••••••.•....... '1 $6. Tentative credit (20 percent of line 5) .......•••.•..••••••••••.•••.••.•.•.......... $
7. Tctal tentative credit on this return (total of columns A and B, line 6) ..•........... '1
Limitation on Retirement Credit
8. Amount of tax shown as item 7, page 1 '" ...•••.•.......... 1$ 1 1
Less: Credit for dividends from line 8, Schedule J, above ..... L. --'--_--J,
9. Balance of line 8. . . . . . . . . . . . . . . . . . . . . . . . . . . . . . . . . . . . . . . . . . . . . . . . . . . . . . . . . . . . . . . . . . . . . . . . . . . . . . . . . . .. $ _
10. Retirement income credit. Enter here and as item 8B, page 1, the amount on line 7 or line 9, whicheveris smaller. . . . . . . . . . . . . . . . . . . . . . . . . . . . . . . . . . . . . . . . . . . . . . . . . . . . . . . . . . . . . . . . . . . . . . . . . . . . . . . . . . . . . . . . . .. $
Statement of Person (other than taxpayer) Preparing ReturnI declare under the penalties of perjury that I prepared this return for the person(s) named herein; and that this return (including any
accompanying schedules and statements) is, to the best of my knowledge and beiief, a true, correct, and complete return based on all theinformation relating to the matters required to be reported in this return of which I have any knowledge.
(Individual or Firm Signature) (A.ddress)u. S. GOVERNMENT PRINTING OFFICE 16-70997-1
(Dote)

FACSIMILES OF TAX RETURNS FOR 1954 99
HELPFUL INFORMATION ON
How to
prepare your•income tax
return
You can save money for yourself ana
the Government, if you- i
File )'our return early
Make sure the figures are right
Under the new law, the final date for
filing is April 15, but taxpayers wh~wait until the last minute often make
costly mistakes.I
Give yourself time to double checkI
every figure on your return-this will
save time and money in the long ruJ
If you need help or more formr
(including Form 1040-£5 for decla
ration of 1955 estimated tax), go t~the nearest Internal Revenue Service
Office.
ON FORM 1040 FOR 1954Commissioner.
IRS Pub-3
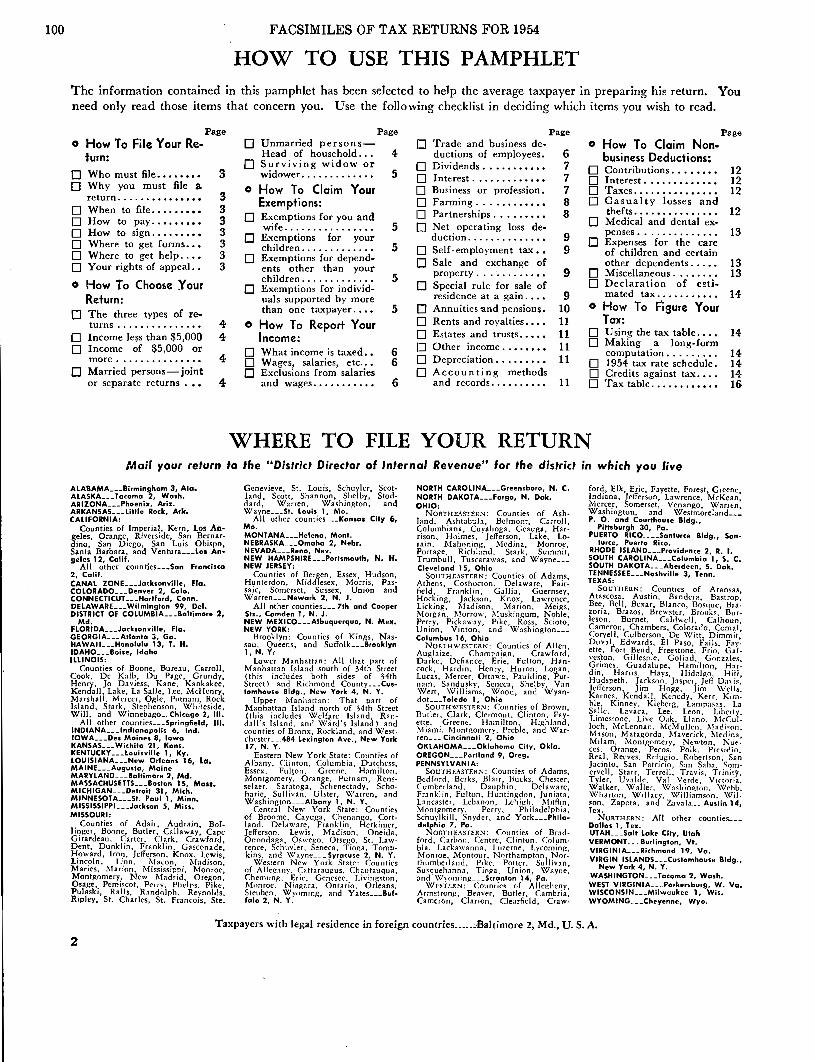
100 FACSIMILES OF TAX RETURNS FOR 1954
HOW TO USE THIS PAMPHLETThe information contained in this pamphlet has been selected to help the average taxpayer in preparing his return. Youneed only read those items that concern you. Use the following checklist III deciding which items you wish to read.
Page
o How To File Your Return:
[] Who must file........ 3[] Why you must file a
return. . . . . • • • • • • • • • • 3[] When to file......... 3[] How to pay ..•••• ~ • 3[] How to sign......... 3[] Where to get forms... 3[] Where to get help.... 3[] Your rights of appeal. • 3
o How To Choose 'fourReturn:
o The three types of re-turns .. , . . . . .• . . • ••• 4
o Income Jess than $5,000 4o Income of $5,000 or
more. ............•• 4o Married persons- joint
or separate returns • •• 4
Pageo Unmarried persons-
Head of household... 4-o Surviving widow or
widower............. 5
o How To Claim YourExemptions:
o Exemptions for you andwife................ 5o Exemptions for yourchildren ..... , . . ... . . 5o Exemptions for dependents other than yourchildren. . . . . . . . ....• 5o Exemptions for individuals supported by morethan one taxpayer.... 5
o How To Report YourIncome:
o What income is taxed. • 6o Wages, salaries, etc... 6o Exclusions from salaries
and wages........... 6
Pageo Trade and business de-
ductions of employees. 6o Dividends. . • . • • • • • • • 7o Inttrest. . . . . . . . • • • • • 7o Business or profession. 7o Farming. . . .•••••••• 8[] Partnerships. . . . • • • • • 8[J Net operating loss de-
duction. .. ..••• 9o Self-employment tax.. 9o Sale and exchange of
property. . . .. .. ...•• 9[] Special rule for sale of
residence at a gain. . • • 9o Annuities and pensions. 10o Rents and royalties.... 11o Estates and trusts..... 11o Other income........ 11o Depreciation......... 11o Accounting methods
and records.......... 11
Page
o How To Claim Non-business Deductions:
o Contribu tions. . • • • • • • 12o Interest............. 12o Taxes............... 12o Casualty losses and
thefts............... 12o Medical and dental ex-
penses. . . . . . . . . . . •. • 13o Expenses for the careof children and certainother dependents. . • • • 13o Miscellaneous. . . • . . . • 13
o Declaration of esti·mated tax........... 14-
o How To Figure YourTax:
[] Using the tax table.... 14-o Making a long-formcomputation. . . ... ..• 14-
o 1954 tax rate schedule. 14o Credits against tax. •. • 11o Tax table. ..••••••••• 16
WHERE TO FILE YOUR RETURNl.1ail your return to the "District Director of Internal Revenue" for the district in which you live
ALABAMA Birmingham 3, Ala.AlASKA Tocoma 2, Wash.ARIZONA Phoenix, Ariz.ARKANSAS- __ Little Rack, Ark.CALIFORNIA:
Counties of Imperjal, Kern. 1.os Angeles. Orange. Riverside. San Bernar~dina. San Diego, San Luis Obispo.Santa Barbara, and Ventura Lol An..seles 12, CCilif.
All other counties San Francisco2, Calif.CANAL ZONE Jacksonville, Fla.COLORADO Denver 2, Calo.CONNECTICUT Hartford, Conn.DElAWARL __Wilmington 99, Del.DISTRICT OF COLUMBIA Battimare 2,
Md.FLORIDA Jacksanville, Fla.GEORGIA Atlanta 3, Ga.HAWAIL._Honolulu 13, T. H.IDAHO Boise, IdahoILLINOIS:
Counties of Boone, Bureau. Carroll.Cook. De Kalb. Du Page, Grundy,Henry, Jo Daviess. Kane, Kanka1cee,Kendall. Lake, La Salle, Lee. McHenry,.Marshall. Mercer, Ogle. Putnam, Rockhland, Stark, Stephenson. Whiteside.Will. and Winnebago_. Chicago 2, U1.
All other counties Springfield, III.INDIANA lndianapolis 6, Ind.IOWA Des Moinn 8, IowaKANSAS Wichita 21, Kans.KENTUCKY Louisville 1, Ky.lOUISIANA New Orleans 16, La.MAINE Augusta, MaineMARYLAND. __ Baltimare 2, Md.MASSACHUSETTS- __ Baston 1S, Mas••MICHIGAN Oetrait 31, Mich.MINNESOTA St. Paul I, Minn.MISSISSIPPL __Jacksan S, Miss.MISSOURI:
Countie.l; of Adair. Audrajn. Bollinger. Boone. Butler. Callaway, CapeGirardeau, C:arter. Cl:trk, Crawford.Dent, Dun1clin, Franklin. Gasconade.Howard. Iron, Jefferson, Knox. Lewis.lincoln, Linn, l\facon. MadisonMaries•.Marion. Mississippi, 1\fonroe'Montgomery, New J\.·ladrid, Ore,gon:Osage, Pemi~cot, Perry. Phelf"ls. PikePulaski, Ralls. Randolph. Revnolds:Ripley, St. Charles, St. Francois, Ste.
Genevieve. St. Louis. Schuyler. Scotland, Scott, Shannon. Shelby, Stod·dard, Warren, Washington, andWayne St. Louis 1, Mo.
All other counties Kansas Cny 6,Ma.MONTANA._.Helena, Mant.NEBRASKA Omaha 2, Nebr.NEVADA Reno, Nev.NEW HAMPSHIRL __Portsmouth, N. H.NEW JERSEY:
H~~~~J~e~, 0~I~dd1:~~x.Es~~~·rr~,udpoa~:saic, Somerset, Sussex, Union andWarren Newark 2, N. J.
All other counties .7th and CooperSis., Camden 1, N. J.NEW MEXICO Albuquerque, N. Mex.NEW YORK:
Brooklyn: Counties of Kings, Nas·sau, Queens, and Suffolk BrooklynI, N. Y,
Lower Manhattan: All that part ofM anhaltan Island south of 34th Street(this includes both sides of 34thStreet) and Richmond County Cus-tomhouse Bldg., New York 4, N. Y.
Upper ~fanhattan: That part ofManhattan Island north of 34th Street(this includes Wel(;l.re Island. RandaB's Island. and Ward's Island) andcounties of Bronx, Rockland, and Westrhester__ .484 Lexington Ave., New York17, N. Y.
Eastern New York State: Counties ofAlbany. r.Iinton, Columbia, Dutchess,Essex. Fulton. Greene. Hamilton,11ontgomery. Orange. Putnam, Rensselaer, Saratoga. Schenectady, Scho.harie, Sullivan. Ulster, '\X'arren, andWashington Albany I, N. Y.
C.entral New York State: Countiesof Broome, Cayuga, Chenango. Cortland. Delaware, 'Franklin, Herkimer,Jefferson. Lewis, 1\1adison, Oneida,Onondaga. Oswego. Otse~o, St. Lawrence, Schuvler. Seneca, Tio,ga. Tomp-kins, and Wfayne Syracuse 2, N. Y.
Western New York State: C:ountiesof Alle,e::tny. C:attaraugus. Chautauqua,Chemung. Erie, Genesee. Livingston,J\..fnnroe. Niagara. Ontario. Orleans.Steuhen, Wyoming, and Yates Buf..falo 2, N. Y.
NORTH CAROLlNA Greensbara, N. C.NORTH DAKOTA Farga, N. Oak.OHIO:
NORTHE..... STERN: Counties of Ashland. Ashtab"h, Belmont. Carroll,Columbiana, Cuyahoga, Geauga, Har·rison. Holmes, jefferson, Lake, Lorain, Mahoning, .Medina, Monroe,Porta,£e, Richland, Stark, Summit,Trumbull, Tuscltr(\was. and Wayne _Clevelond 15, Ohio
SOUTHE.,\STERN: Counties of Adams,Athens, Coshocton, Delaware, Fajr·field. Franklin, GaBia, Guernsey,Hocking, Jackson, Knox. Lawrence,Licking, l\Iadison, M~rion, Meigs,MOIgan. 1o.Iorrow, ~fusklOgum, Nohle,Perry, Pickau:ay. Pike, Ross, Scioto,Union, Vinton, and Washington _Columbus 16, Ohio
NOf-:THWESTF.RN: Counties of Allen,Auglaize. ChamI:!.aign, Crawford.Darke. Defiance, Erie. Fulton, Han·cock, Hardin, Henry, Huron. Logan,Lucas. Mercer, Ottawa, Paulding, Put·nam, Sandusky, Seneca, Shelby. Van\'V"ert, \Villiams, \'V"ood, and Wyanodot Toledo 1, Ohio
SOUTH\VESTERN: C:ollnties of Brown,Butler, Clark, Clermont. Clinton, Fayette. Greene. Hamilton, Hi~hland,
Miami, Monl,gom('ry. Preble, and \'V"ar·ren Cincinnati 2, OhioOKlAHOMA Oklahoma City, Okla.OREGON Porlland 9, Oreg.PENN5YlVAN IA,
SOUTHEASTERN: Counties of Adams.Bedford. Berks, Blair, Bucks. Chester,C:umberland. Dauphin. Delaware.Franklin, fulton, Huntingdon, juniata,I.ancaster. Lebanon, Lehigh. Mifflin,1\1ont,gomery, Perry, Philadelphia,Schuylkill, Snyder, and YorL __Philadelphia 7, Pa.
NORTHEASTERN: Counties of Brad·ford, C:arbon. C:entre. Clinton. l.olum·bj~, Lackawanna, Luzerne, Lycoming,Monroe. Montour. Northampton. Northumberland, Pike. Potter. Sulliv3n.Su!'quehanna, Tin,ga. Union, \'V"ayne,and \'V"ynm in~ Scrc;-nton 14, Po.
\'V"HTJ:RN: C:ountle.c; of Allecheny.Armstron~. Beaver, Butler. C:ambria.Camt:Iun, Clarion, Clearfield, Craw-
ford, Elk, Erie. Fayette, Forest. GIeene,Indiana, jefferson. Lawrence, McKean,:Mercer. Somerset, Venan~o, Warnn.Washington, and \'V"estmordand _P. O. and Courthouse Bldg.,
Pittsburgh 30, Pa.PUERTO RICO. Santurce Bldg., San-
turce. Puerto Rico.RHODE ISLAND__ .Pravidence 2, R. I.SOUTH CAROLINA Calumbia I, S. C.SOUTH DAKOTA Abe,deen, S. Dak.TENNESSEL._Nashville 3, Tenn.TEXAS:
SOUTHERN: Counties of Aransas,Ata.l;cosa, Austin, Bandera. Bastrop,Bee., Belt, Bexar, Blanco, Bosque, Bra·zorla, Brazos, Brewster, Brooks. Burleson, Burnet, Caldwell, Calhoun,Cameron, Chambers, Colorado. Comal.C:oryell, Culberson. De \X'itt, Dimmit,Duval. Edwards, EI Paso, Falls. Fay.ette, Fort Bend, Freestone, Frio, Galveston, Gillespie, Goliad. GonzalesGrimes. Guadalupe. Hamilton, H~r:din. Harris, Hays, Hidalgo, Hill,Hudspeth, Jackson, Jasper, Jeff Da\i~,Jefferson, Jim Hogg, Jjm \Vells.karnes .. Kendall Kenedy, Kerr. Kim·hIe. Kinney. Kleberg, LamJ:'la5as, LaSCl:lle. Lavaca, Lee. Leon. tiberty,LImestone, Live Oak. Llano. McC:ulloch, McLennan. McMullen. Madic:on,Mason, Matagorda, Maverick, l\ledina,Milam. Ivlontgomery. Newton, 1'\'u('ces. Orange. Pecos. Polk. PIr ... iclio.Real, Re('ves. Refugio, Robert~on. SanJacinto, San PatriCIO, San Saha. Somervell, Starr. Terrell, Travis, Trinity,Tyler. Uvaln.e. Val Verne, Viclmta,Walker. Waller. Washin,'?,tnn, \X1ehb.\'V"harton, Willacy. \X'ilJiam~nn. \'Vil.son. Zapata, and Zavala.__ Auslin 14,Tex.
NORTHERN: All other counties _Dallas 1, Tex.UTAH Salt Lake City, UtahVERMONT Burlington, Vt.VIRGINIA Richmand 19, Va.VIRGIN ISLANDS Customhouse Bldg.,
New York 4, N. Y.WASHINGTON Tacoma 2, Wash.WEST VIRGINIA__ .Pa,kersbu,g. W. Va.WISCONSIN Milwaukee 1, Wis.WYOMING Cheyenne, Wyo.
Taxpayers with legal residence in foreign countries "Baltimore 2, Md., U. S. A.
2
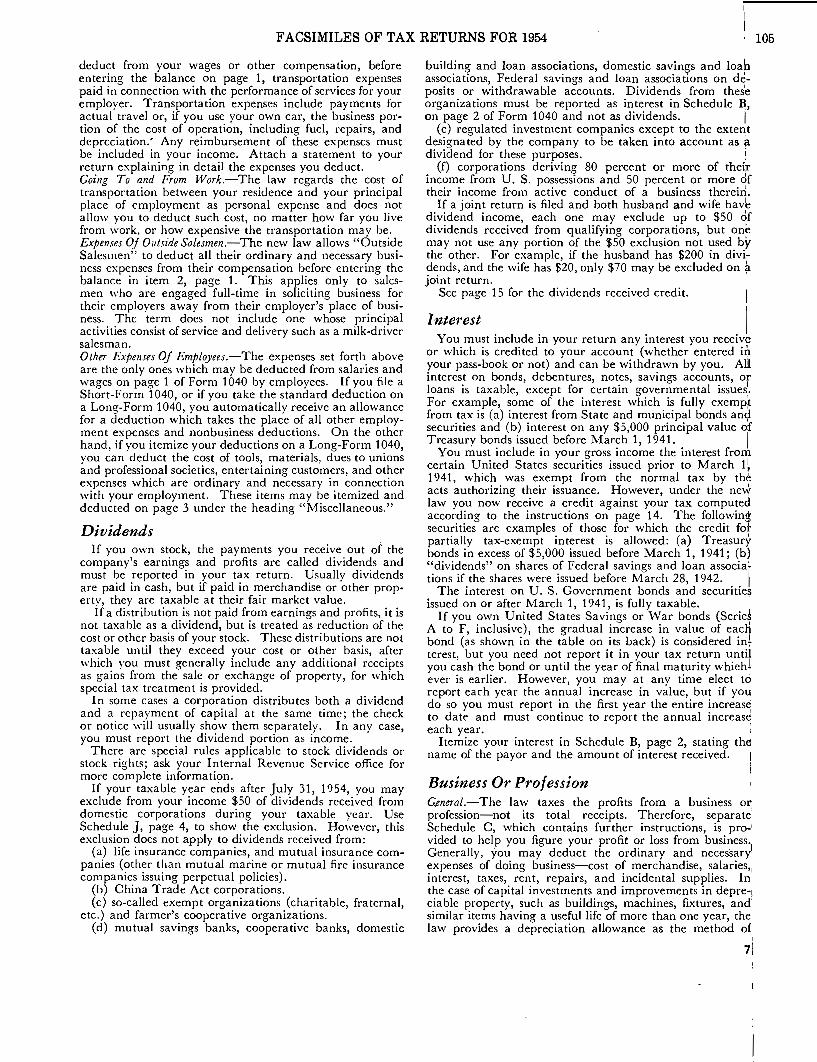
FACSIMILES OF TAX RETURNS FOR 1954 105
deduct from your wages or other compensation, beforeentering the balance on page 1, transportation expensespaid in connection with the performance of services for youremployer. Transportation expenses include paymcnts foractual travel or, if you use your own car, the business portion of the cost of operation, including fuel, repairs, anddeprcciation.' Any reimbursement of these expenscs mustbe included in your income. Attach a statement to yourreturn explaining in detail the expenses you deduct.Going To and From Work.-The law regards the cost oftransportation between your residence and your principalplace of employment as personal expense and does notallow you to deduct such cost, no matter how far you livefrom work, or how expensive the transportation may be.Expenses OJ Outside Salesmen.-The new law allows "OutsideSalesmen" to deduct all their ordinary and necessary business expenses from their compensation before entering thebalance in item 2, page 1. This applies only to salesmen who are engaged full-time in soliciting business fortheir employers away from their employer's place of business. Thc term does not include one whose principalactivities consist of service and delivery such as a milk-driversalesman.Other Expenses OJ Employees.-The expenses set forth aboveare the only ones which may be deducted from salaries andwages on page 1 of Form 1040 by cmployees. If you file aShort-Form 1040, or if you take the standard deduction ona Long-Form 1040, you automatically receive an allowancefor a deduction which takes the place of all other employment expcnses and nonbusiness deductions. On the otherhand, if you itemize your deductions on a Long-Form 1040,you can deduct the cost of tools, materials, dues to unionsand professional societies, entertaining customers, and otherexpenses which are ordinary and necessary in connectionwith your employment. These items may be itemized anddeducted on page 3 under the heading "Miscellaneous."
DividendsIf you own stock, the payments you receive out of the
company's earnings and profits are called dividends andmust be reported in your tax return. Usually dividendsare paid in cash, but if paid in merchandise or other propertv, they are taxable at their fair market value.
If a distribution is not paid from earnings and profits, it isnot taxable as a dividend, but is treated as reduction of thecost or other basis of your stock. These distributions are nottaxable until they exceed your cost or other basis, afterwhich you must generally include any additional rcceiptsas gains from the sale or exchange of property, for whichspecial tax treatment is provided.
In some cases a corporation distributes both a dividendand a repayment of capital at the same time; the checkor notice will usually show them separately. In any case,you must report the dividend portion as income.
There arc special rules applicable to stock dividends orstock rights; ask your Internal Revenue Service office formore complete information.
If your taxable year ends after July 31, 1954, you mayexclude from your income $50 of dividends received fromdomestic corporations during your taxable year. UseSchedule J, page 4, to show the exclusion. However, thisexclusion docs not apply to dividends received from:
(a) life insurance companies, and mutual insurance companies (other than mutual marine or mutual fire insurancecompanies issuing perpetual policies).
(b) China Trade Act corporations.(c) so-called exempt organizations (charitable, fraternal,
etc.) and farmer's cooperative organizations.(d) mutual savings banks, cooperative banks, domestic
building and loan associations, domestic savings and 10abassociations, Federal savings and loan associations on deposits or withdrawable accounts. Dividends from thes~organizations must be reported as interest in Schedule B,on page 2 of Form 1040 and not as dividends. I
(e) regulated investment companies except to the extentdesignated by the company to be taken into account as ~dividend for these purposes. i
(f) corporations deriving 80 perc~nt or more of theirincome from U. S. possessions and 50 percent or more dftheir income from active conduct of a business therein.
If a joint return is filed and both husband and wife havedividend income, each one may exclude up to $50 ofdividends received from qualifying corporations, but onbmay not use any portion of the $50 exclusion not used bythe other. For example, if the husband has $200 in dividends, and the wife has $20, only $70 may be excluded on ~joint return. I
See page 15 for the dividends received credit. I
Interest IYou must include in your return any interest you receive
or which is credited to your account (whether entered inyour pass-book or not) and can be withdrawn by you. AU!.interest on bonds, debentures, notes, savings accounts, orloans is taxable, except for certain governmental issuesl
•
For example, some of the interest which is fully exemp~from tax is (a) interest from State and municipal bonds an<;lsecurities and (b) interest on any $5,000 principal value ofTreasury bonds issued before March 1, 1941. I
You must include in your gross income the interest fromcertain United States securities issued prior to March 1~1941, which was exempt from the normal tax by theacts authorizing their issuance. However, under the ne~law you now receive a credit against your tax computedaccording to the instructions on page 14. The followingsecurities are examples of those for which the credit fOfpartially tax-exempt interest is allowed: (a) Treasurybonds in excess of $5,000 issued before March 1, 1941; (b)"dividends" on shares of Federal savings and loan associa~1
tions if the shares were issued before March 28, 1942.The interest on U. S. Government bonds and securities
issued on Or after March 1, 1941, is fully taxable. IIf you own United States Savings or War bonds (Serid
A to F, inclusive), the gradual increase in value of eachbond (as shown in the table on its back) is considered intterest, but you need not report it in your tax return untilyou cash the bond or until the year of final maturity whiehlever is earlier. However, you may at any time elect toreport each year the annual increase in vallie, but if yoJdo so you must report in the first year the entire increaseto date and must continue to report the annual increaseeach year. '
Itemize your interest in Schedule B, page 2, stating thename of the payor and the amount of interest received. I
;
Business Or ProfessionG.eneral.-The law taxes the profits from a business o~
profession-not its total receipts. Therefore, separateSchedule C, which contains further instructions, is pro-!vided to help you figure your profit or loss from business'
lGenerally, you may deduct the ordinary and necessaryexpenses of doing business-cost of merchandise, salaries"interest, taxes, rent, repairs, and incidental supplies. Inthe case of capital investments and improvements in depre-lciable property, such as buildings, machines, fixtures, and'similar items having a useful life of more than one year, the,law provides a depreciation allowance as the method of
I
71

106 FACSIMILES OF TAX RETURNS FOR 1954
deducting the cost over the life of the property. For furtherinformation on depreciation, see page 11.
If some of your expenses are part business and part personal, you can deduct the business portion but not the p~r
sonal portion. For instance, a doctor who uses his car halffor business can deduct only half the operating expenses.
Everyone engaged in a trade or business and making payments to another person of salaries, wages, commissions,interest, rent, etc., of $600 or more in the course of suchtrade or business during his taxable year must file information returns, Forms 1096 and 1099, to report such payments.If a portion of such salary or wage payments was reportedon a Withholding Statement (Form W-2), only th", remainder must be reported on Form 1099. Informationreturns are not required unless the payments are made inthe course of business. '
I ndividuals in business may under certain conditions electto report and pay income tax on such business income onthe same basis as a domestic corporation. For full detailsconsult your Internal Revenue Service office,
Accrual-Method Taxpayers Only-Prepaid blcome and ReservesJor Estimated Expenses.-Under the new law a taxpayer usingthe accrual method of accounting in a trade or business mayelect to take prepaid income into account proportionatelyin the year of receipt and subsequent taxable years (not toexceed five), and may elect to deduct for the taxable year anaddition to a reserve for estimated expenses. Prepaid incomeis income received in a transaction in which you undertaketo render services, furnish goods or other property, or allowthe use of property beyond the end of the taxable year.
An election to deduct additions to reserves for estimatedexpenses applies to expenses part or all of which wouldbe taken into account for subsequent taxable years butare attributable to income received in the current taxableyear. In order to qualify as a deduction it is necessary thatsuch expenses be estimated with reasonable accuracy. Theelection to take estimated expenses into account does notapply to expenses attributable to income which you electto treat as prepaid income nor does it apply to additions toreserves for bad debts. For additions to reserves for baddebts see separate Schedule C.
For more information concerning the requirements tomake elections with respect to prepaid income and estimated expenses (and the detailed statements which mustbe submitted when making the election) consult yourInternal Revenue Service office.
Fm'mingFor the assistance of farmers, a separate schedule, Form
1040F, is provided and must be used by all farmers whoreport on the cash method. This form is optional withfarmers who keep books on the accrual method.
Farmers must report as business income all Governmentpayments, such as milk subsidy and conservation paymentsand amounts received under the Soil Conservation andDomestic Allotment Act, as amended, section 303 of theAgricultural Adjustment Act, as amended, and the SugarAct of 1937. A taxpayer may elect to treat as incomeloans received from the Commodity Credit Corporation.If he does so, he must continue to report them as incomeunless he secures permission to change.
Farmers who market produce through a cooperativeshould add any patronage dividends received in thetaxable year to their gross receipts from farming. Farmerswho buy, through a cooperative, implements, gasoline,seed, fertilizer, or other items for use in their businessshould either reduce the cost of such items by the amount
8
of patronage dividends received or add the patronagedividends to income. Patronage dividends received asrebates on purchases of items not used in your businessshould be omitted fmm your return. Patronage dividendsare considered paid when remitted in cash, merchandise,stock certificates, or when credited to you.
If livestock are sold or exchanged because they are diseased, or if property is sold or disposed of to meet acreagelimitations under Federal reclamation laws, the sale or disposition may be treated as an involuntary conversion provided proceeds are reinvested in similar property. Suchreinvestment must generally be made within a year.
Soil and Water Conservation Expenditures.-If you are en"gaged in the business of farming, you may deduct certainexpenditures made by you (including any amount paid onany assessment levied by a soil or water conservation ordrainage district to defray expenditures made by suchdistrict) for soil or water conservation and the preventionof erosion if such expenditures are in respect of land usedby you in your farming operations. The term expenditures means expenditures (a) for the treatment or movingof earth, including but not limited to leveling, grading,terracing, contour furrowing; (b) the construction, control,and protection of diversion channels, drainage ditches,earthen dams, watercourses, outlets, and ponds; (c) theeradication of brush; and (eI) the planting of windbreaks.You may not deduct expenditures for the construction, installation, or improvement of facilities which are subjectto the allowance for depreciation.
The allowable deduction for anyone year may notexceed 25 percent of your gross income from farming butany excess may be carried over to succeeding years withthe same limit applying to those years. The phrase "grossincome from farming" means the gross income of the farmerfrqm the production of crops, fruits or other agriculturalproducts or from livestock and includes such income froma farm other than the one on which expenditures for soiland water conservation or for the prevention of erosionwere made.
To claim a deduction for these expenditures you must(a) elect to do so for the first taxable year which began afterDecember 31, 1953, and ended after August 16, 1954 forwhich such expenditures are paid; or, (b) secure consentfrom the Internal Revenue Service. Once you have electedto do so, you must continue to treat these expenditures asdeductions in all future taxable years unless you secure consent from the Internal Revenue Service to change.
Partnership
A partnership does not pay income tax in the firm'sname. Each partner must report in his personal tax returnhis share of his partnership's income and pay tax on it.
Include in Schedule C Summary, page 2 of Form 1040,your share of the ordinary net income (whether actuallyreceived by you or not) or the net loss of a partnership,joint venture, or the like, whose taxable year ends withinthe year covered by your return. Other income and deductions to be carried to your individual return are shownin Schedule K of the partnership return.
If the partnership is engaged in a trade or business, theindividual partner may be subject to the self-employmenttax on his share of the partnership's self-employment income. In such a case the partner's share of partnershipself-employment net earnings (or loss) should be enteredon line 30, separate Schedule C.

FACSIMILES OF TAX RETURNS FOR 1954
Net Operatil1-g LossIf, in 1954, your business or profession lost money instead
of making a profit or if you had a casualty loss, or a lossfrom the sale or other disposition of deprccia ble property(or real property) used in your trade or business, you canapply these losses against your other 1954 income. If theselosses exceed your other income, the excess of this "net operating loss" may be carried back to offset your income for1952 or 1953, and any remaining ex.cess may be carried forward a~ainst your income for the years 1955 throu!!,h 1959.If a carryback entitles you to a refund of prior year taxes, askthe District Director for Form 1045 to claim a quick refund.For further information, see section 172 of the I nternal Revenue Code of 1954 and section 122 of the 1939 Code.
If you had a loss in preceding years which may be carriedover to 1954, you should claim a net operating loss deduction on line 5 of Schedule C Summary, page 2, of Form 1040whether or not there arc other itcms to be entered, and filea concise sta tement setting forth this computa tion.
Self-em-ploymellt TaxEvery self-employed individual will have to file an annual
return of his self-employment income on Form 1040 if hehas at least $400 of net earnings from self-employment in histaxable year, even though he may not have sufficient incometo require the filing of an income tax return.
If your income is derived solely from salary or wages, orfrom dividends and interest on investments, capital gains,annuities, or pensions, you will have no self-employmentincome and no self-employment tax to pay.
Generally, if you carryon a business as a sole proprietor,'or if you render service as an independent contractor, or as amember of a partnership or similar organization, you willhave self-employment income.
The computation of your self-employment tax is made onseparate Schedule C which, with attached Schedule C-a,should be filed with your individual income tax return.The self-employment tax is a part of the income tax ..
Any declaration of estimated tax required to be filed need110t include estimated tax on self-employment income.
Sale alld Exchange of PropertyIf you sell your'house, car, furniture, securities, real estate,
or any other kind of property, you must report any profiton your tax return. Generally, such profits are capitalgains if the property was not held for sale to customers inthe ordinary course of business. Separate Schedule D isprovided to compute capital gains and losses, and theresults from other transactions in property.Sale oj Homes, EtC.-GENERAL RULE.-The law requires youto report any gains from the sale or exchange of your residence or other nonbusiness property, but does not allowyou to claim any loss from the sale of a home or other assetwhich was not held for the purpose of producing income.You·r gain from the sale of this kind of property is thedifference between (1) the sales price and (2) your originalcost plus the cost of permanent improvements. If depreciation was allowed or allowable during any period becauseyou rented the house or used part of it for business purposes,then the original cost must be reduced by the amount ofdepreciation which was allowed or allowable.SPECI.'\L RULE FOR SALE OF RESIDENCE AT A GAIN.-If youwId' or exchanged your residence during 1954 at a gain andwithin one year after (or before) the sale, you purchased<lnd occupied another residence, none of the gain is taxableif the cost of the new residence equals or exceeds the adjusted sales price of the old residence. See, however, in-
445805 0 - 57 - 8
structions below for information to be furnished. If in-,stead of purchasing another residence, you begin construction of a new residence (either one year before or withidone year after the sale of your old residence) and occupy itnot later than 18 months after the sale, none of the gain:upon the sale is taxable if your cost of construction plus:the cost of land (acquired within the period beginning onel
year before the sale and ending 18 months after the sale)equals or exceeds the adjusted sales price of the old residence.
I f the adjusted sales price of your old residence exceeds the'cost of your new residence, the gain on the sale is taxable to!the extent of such excess. The adjusted sales price is the,gross selling price less co.mmissi.ons and the .cxl?c~SeS foriwork perfon:ncd on the reslden~c 111 ordel- to assist 111 Its s~le'l
such as selling and redecorating expenses. Redecoratlnglexpenses, however, must be for work performed during the'90-day period ending on the day on which a conti-act to sell'is entered into, and must be paid within 30 days after date'l·of sale.
For example, assume your adjusted sales price is $15,0001for a residence which cost you $10,000 and you purchasea new residence for $14,000. The taxable portion of yourlgain is ('mly $1,000, the difference between the adjusted Isales price of your original residence and the purchase'price of the new residence. The nontaxable portion of the,gain of $4,000 serves to reduce the basis of the new propertY'iTlwrefore in any future transaction its adjusted basis wouldbe $10,000 (cost of $14,000 less non-taxable gain of $4,000).'
Special rules apply if (a) a part of your old or new:residence is used for rental or business purposes, (b) you Isell within one year more than one property used as yourprincipal residence, (c) the shares of the husband and wife'in the old and new residences are not identical, (d) you,own more than one residence at the same time, or (e) you Iacquired your new residence because your old residence Iwas destroyed by a casualty (such as fire) or condemned.Consult your In ternal Revenue Service office for assistance I
in reporting the disposal of such property. iIf you sold or exchanged your residence, report the details!
of the sale in separate Schedule D. If you do not intend to 'replace, or if the period for replacement h<ls passed, report.,the details in the year of sale. If you have acquired andoccupied your new residence, enter in column (h) of Schedule D only the amount of taxable gain, if any, and attachstatement shO\ving the purchase price, date of purchase, Iand date of occupancy.
H you have decided to replace, but have not done so, orif you are undecided, you should enter"None" in column (h)of Schedule D. When you do replace within the required Iperiod, you must advise the District Director, giving fLllldetails. When you decide not to replace, or the period has I
passed, you must file an amendecl return, if you previously,filed a return. Since any additional tax due will bear in- Iterest from the d lie date of the original return until paid, 'it is advisable to file the amended return for the year of sale I
as promptly as possible.The running of the I-year period or the 18-month period I
will be suspended during the time, if any, in which yOll serve ion active duty in the Armed Forces after the date of sale of 'the old residence and during an induction period, pursuantto a call or order for an indefinite period or for more than90 days. This suspension applies only where your servicebegins before the end of the I-year period or the 1?-monthperiod, as the case may be, and cannot extend such periodbeyond a date which falls 4 years after the date of sale.
H your residence is destroyed or condemned, or even ifyou sell because of the threat of condemnation, you may been titled to the benefit of other provisions of law which giveyou a longer time in which to buy a new residence. If you I
9
108 FACSIMILES OF TAX RETURNS FOR 1954
require more information about your particular case, youshould apply to your Internal Revenue Service office.Nonbusiness Bad Debts.-If you fail to collect a personal loan,you can list the bad debt as a "short-term capital loss" provided the loan was made with a true expectation of collecting. So-called loans to close relatives, which are really inthe nature of gifts, must not be listed as deductible losses.
Annuities and PensionsNoncontributory Annuities.-The full amount of an annuity or.a pension of a retired employee, where the employee didnot contribute to the cost and was not taxable on his employer's contributions, must be included in his gross income. The total of the payments received during his taxable year should be shown on line 6, Part I of Schedule E.Other Annuities.-Amounts received from other annuities,pensions, endowments, or life insurance contracts for areason other than the death of the insured, whether p~dfor a fixed number c.f years or for life, may have a portionof the payment excluded from gross income. The followingtypes are included under this rule: (a) pensions where tl{eemployee has either contributed to its cost or has beentaxed on his employer's contributions, (b) amoun(s paid fora reason other than the death of the insured under anannuity, endowment, or life insurance contract, and (c)amounts paid to a beneficiary, through an option in thepolicy or otherv"ise, in installments or in a lump sum undera life insurance contract at a date or dates later than theinsured's death where the death occurred on or afterAugust 17, 1954.
Schedule E on Form 1040 and the following instructionsshould enable you to compute the taxable portion of theannuity. If you are receiving payments on more than onepension or annuity, fill out a separate schedule for each one.General Rule Jor Annuities
In general, amounts received from annuities and pensions are included in income to the extent they exceed theexclusion described below. You may exclude from yourincome an amount found by using the following formula:
Investment in the contract X a ment receivedExpected return p y
This formula means that you divide the investment inthe contract by the expected return and multiply theresult by the payment received under the annuity, pension,or contract. Formula terms are explained below."Illvestment in the contract" is, in general, the total amount ofthe premiums or other consideration paid (the amount contributed by you plus the contributions made by your employer on which you were previously taxable) for the contract as of the annuity starting date. This investment mustbe reduced by the amounts received under the investmentbefore the annuity starting date to the extent excludable[wm gross income under prior income tax law. The"annuiry starting date" is the first day of the first period forwhich a payment is received as an annuity under the contract; except that if the date was before January 1, 1954,then the annuity starting date is considered January 1, 1954."Expected return"-There are two methods for determiningexpected return depending on the type of contract. •
(a) If the contract provides for amounts to be receivedfor a fixed number of years, then the expected return is thetotal amount 'of the payments to be received after theannuity starting date.
(b) If the contract provides for amounts to be received forthe life of the annuitant, then the expected return is foundby multiplying the amount of the annual payment by themultiple applicable to the age and sex of the annuitant asof the annuity starting date. Special multiples are applicable in the case of payments under joint and survivor an-
10
nuities. The multiples are set out in actuarial tables whichwill be furnished by your Internal Revenue Service officeupon request."Payment received" is the total amount received for a yearunder the contract.
Example: D purchased a life annuity on January 1,1952,for $15,000 which provides for annual payments of $1,200beginning January 1, 1953. The multiple applicable inD's case as of January 1, 1954, is 15.0. During the year1953, D received tax-free under the existing tax laws $750($1,200 less 3% of $15,000). The amount of each paymentwhich D is to exclude from his gross income beginning withthe 1954 payment is $950, determined as foll.ows:Annual payment. . . . . . . . . . . . . . . . •. . . . . . . . .. . . . . .. 51,200Investment in the contract __ . _ $15, 000Less: Amount recovered tax free in prior years _ 750
Investment in the contract as of 1/1/54, the annuitystarting date as defined above , $14, 250
Expected return (51,200X 15.0) _. _ _.. 518,000The amount to be excluded based on the formula above:
$14250 .518:000 X 51,200 which equals 5950
D will include in his income $250 ($1,200-$950) in theyear 1954 and each subsequent year as long as he lives.
Special Rule Jor Certain Types oj Employees' AnnuitiesThere is a special rule provided for amounts received as
employees' annuities where part of the cost is contributedby the employ{!r and the amount contributed by the employeewill be returned within 3 years from the date (whether ornot before January 1, 1954) of the first payment receivedunder the contract. If both of these conditions are met, thenall the payments received under the contract are to be excluded from gross income until the employee recovers hiscost (the amount contributed by him plus the contributionsmade by the employer on ".-hich the employee was previously .taxable); thereafter all amounts received under thecontract are fully taxable. This method of computing taxable income also applies to employee's beneficiary if employee died before receiving any annuity or pension payments.
Example: An employee receives $200 a month under anannuity. While he worked, he contributed $4,925 towardthe cost of the annuity. His employer also made contributions toward the cost of the annuity. The retired employeewould be paid $7,200 during his first 3 years, which amountexceeds his contribution of $4,925. Therefore, he excludesfroin gross income all the payments received from theannuity until he has received $4,925. All paymentsreceived thereafter are fully taxable.
Other Types oj AnnuitiesAmounts Received Under Life-Insurance Policies By Reason OJDeath.-In general, a lump sum payable at the death of theinsured under a life insurance policy is excludable fromthe gross income of the recipient. \\Then, however, thebeneficiary of a life insurance contract leaves a sum ondeposit with the insurer, and receives interest on it underan agreement with the insurer the interest is includible inits entirety in the beneficiary's gross income. If the beneficiary receives, through his option or otherwise, installmentpayments at dates later than the insured's death he or shemay be taxed on a part of the amount or amounts so received.
Special rules also apply in the case of joint and survivorannuities where the first annuitant died in 1951, 1952, or1953; where a refund feature is involved; where amounts arereceived under an annuity, endowment, or life insurancecontract, if such amount is not received as an annuity; andin cases which have not been otherwise explained in theinstructions. See your Internal Revenue Service office formore detailed instructions.

FACSIMILES OF TAX RETURNS FOR 1954
11 1,
Rents and RoyaltiesIf you are not engaged in selling real estate to customers
but receive rent from property owned or controlled by you,or royalties from copyrights, mineral leases, and similarrights, report the total amount received in Schedule F on)Jage 2 of Form 1040. If property, other than cash, wasreceived as rent, its fair market value should be reported.
You are entitled to various deductions which are indicated in Schedule F. In the case of buildings you can deduct depreciation, as explained elsewhere in these instructions. Ifyou have depletion, consult your Internal RevenueService office for more detailed information.
You can also deduct all ordinary and necessaryexpenditures on the property such as taxes, interest, repairs, insurance agent's commissions, maintenance, and similaritem~. However, you cannot deduct capital investments orimprovements. For example, a landlord can deduct thecost of minor repairs but not the cost of major improvements such as a new roof or remodeling.
Expenses, depreciation, and depletion should be listed intotal in the columns provided in Schedule F. . .If You Rent Part of Your House, Etc.-If you rent out only partof your property, you can deduct only a similar portion ofthe expenses. For example, if you rent out one-half ofyourhome, and live in the other half, you can deduct only one-half of the depreciation and other expenses. .
Room rent and other space rentals should be reported asbusiness income in separate Schedule C if services are rendered to the occupant; otherwise, report such income inSchedule F. If you are engaged in the business of sellingreal estate, you should report rentals receivad in separateSchedule C.
Estates and TrustsIf you' are a beneficiary of an estate or trust, report in
your personal tax return any of its income which is requ~red
to be distributed to you or which has been paid or creditedto your account for the taxable year. The administrator,executor, or trustee should advise you what to report.
Include in Schedule G of your return your share of suchincome (whether actually received by you or not) of anestate or trust for its taxable year which ends with or withinthe year covered by your return. Subtract from your shareof such income any depreciation on estate or trust propertywhich is allocable to you and show the net amount (orloss). There may be distributiQns (other than ordinaryincome) by an estate or trust, such as capital gains, dividends,etc., which are properly reportable in other schedules inyour return. The fiduciary should advise you of such itemsrequiring this special treatment.
Other IncomeIf you cannot find any specific place on your return to list
certain types of income, you should report it in Schedule G,page 2. This is the proper place to report amounts receivedas alimony, support, prizes; or recoveries of bad debts, taxes,
I etc., which reduced your tax in a prior year.I
DepreciationThe law does not allow you to deduct the full cost of your
capital investments or improvements in the year made infiguring your profits from rents, royalties, businesses andprofessions. For most property with a life longer than oneyear, with the exception of land, the law provides for a deduction from gross income called "depreciation" as themethod of recovering your cost (less any salvage value) overthe useful life of the asset.What is "Useful Life"?-The useful life of an asset can bemeasured in units of production or machine hours (for
machinery), in miles of operation (for automotive equip~ment), etc., but the ordinary practice is to measure usefullife in years. Business experience, engineering informationland other relevant factors provide a reasonable basis forestimating the useful life of property. For your guidance;comprehensive tables of "average useful lives" of variouskinds of buildings, machines, and equipment in manxindustries and businesses have been published in a bookletcalled Bulletin F, which you can buy for 30 cents from th~
Superintendent of Documents, Government Printing OfficejWaShington 25, D. C. !Figuring the Deduction-STRAIGHT LINE METHOD.-The mostcommon method of computing depreciation is the "straight~line" method. It allows for the deduction of cost in equalannual amounts over the useful life of the property, withonly salvage value remaining at the end of its useful life!To figure the deduction add the cost of improvements tQthe cost (or other basis) of the asset and deduct both theestimated salvage value and the total depreciation allowedor allowable in past years. Divide the result by the numbetof years of useful life remaining to the asset-the answeris the depreciation deduction. ISpecial Rulesfor New Assets Acquired After December 31, 1953'-1New assets acquired by the taxpayer after 1953 and theportion of the basis of property attributable to construc~tion or reconstruction by the taxpayer after 1953 may b~
depreciated under methods proper in the past or under;additional methods provided in the new law. Thesemethods (which may be employed only with respect to tan4gible assets having a useful life of three years or more) are!
(a) "Declining balance method."-The deduction is com-Iputed by applying a uniform rate to the cost or other basisof the asset reduced by depreciation previously allowed orallowable. This rate cannot exceed twice the straight linerate computed without regard to salvage value. I
(b) "S~m of theyears-digits metllOd."-The deduction is thecost or other basis of the asset (reduced by estimated salvagdvalue) multipled by the number of years of useful life re-~maining to it (including the year of the deduction) dividediby the sum of all the digits corresponding to the years o~
the asset's estimated useful life (in the case of a 3-year lifel
such sum would be 6, that is 1+2+3). I(c) "Other methods."-Other methods may be employed
subject to special limitations; for details consult your Inter-Inal Revenue Scrvice office.
Accounting Methods and RecordsYour return must be on the "cash method" unless you
keep books of account. "Cash method" means that all!items of taxable income actually or constructively received:during the year (whether in cash or in property or services)1and only those amounts actually paid during the year for:deductible expenses are shown. Income is "constructive~Y"1
received when it is credited to your account or set aSidefor you and may be drawn upon by you at any time.,Uncashed salary or dividend checks, bank interest creditedlto your account, matured bond coupons, and similar itemswhich you can immediately turn into cash are "construc·'tively received" even though you have not actually con-Iverted them into cash.
An "accrual method" means that you report income whenlearned, even if not received, and deduct expenses when lincurred, even if not paid within the taxable period. I
If you keep accounting records, your return must be onthe same method as your records. The method used inkeeping your records may be the cash receipts and dis-lbursements method, or an accrual method, so long as in-'come is clearly reflected. However, in most cases you must,secure consent of the Commissioner before changing youraccounting method.

110 FACSIMILES OF TAX RETURNS FOR 1954
HOW TO CLAIM NONBUSINESS DEDUCTIONS
InterestIf you itemize deductions on a Long-Form 1040, you
can deduct interest you paid on your personal debts, suchas bank loans or home mortgages. Interest paid onbusiness debts should be reported in separate Schedule Cor Schedule F, page 2, of Form 1040. Do not deductinterest paid on money borrowed to buy tax-exemptsecurities or single-premium life insurance. Interest paidon behalf of another person is not ded uctible unless you werelegally liable to pay it. In figuring the interest paid on amortgage on your home or on an installment contract forgoods for your personal use, eliminate such items as carrying charges and insurance, which are not deductible, and
Hunting licenses, dog licensesAuto inspection feesWater taxesTaxes paid by you for another
person
Auto license feesState capitation or poll taxesState gasoline taxes
enforceable obligationA life insurance loan, if interest
is added to the loan and youreport on the cash basis
A life insurance loan, if you paythe interest in cash
Delinquent taxes
taxes which may be deductible but which should be itemized separately.
The new law provides a deduction for interest paid forpurchasing personal property (such as automobiles,radios, etc.) on the installment plan where the interestcharges are not separately stated from other carryingcharges. This deduction is equal to 6 percent of theaverage unpaid monthly balance under the contract.Compute the average unpaid monthly balance by addingup the unpaid balance at the beginning of each monthduring the year and dividing by 12. The interest deduction may not exceed the portion of the total carryingcharges attributable to the taxable year.rou CAN Deduct Interest On:Your personal note to a bank or
an individualA mortgage on your homerou CANNa T Deduct Interest On:Indebtedness of another person,
when you are not legally liablefor payment of the interest
A gambling debt or other non-
TaxesIf you itemize deductions on a Long-Form 1040, you can
deduct most non-Federal taxes paid by you. You candeduct State or local retail sales taxes if under the lawsof your State they are imposed directly upon the consumer,or if they are imposed on the retailer (or wholesaler incase of gasoline taxes) and the amount of the tax is separately stated by the retailer to the consumer. In general,you cannot deduct taxes assessed for pavements or otherlocal improvements, including front-foot benefits, whichtend to increase the value of your property. Consult yourInternal Revenue Service office for circumstances underwhich local improvement taxes may be deducted. If youpaid foreign taxes you may be entitled to a credit againstyour tax rather than a deduction from income.
Do not deduct on page 3 any nonbusiness Federal taxes, orany taxes paid in connection with a business or professionwhich are deductible in Schedule F or separate Schedule C.rou CAN Deduct:Personal property taxesReal estate taxesState income taxesState or local retail sales taxesrou CAXNO T Deduct:Any Federal excise taxes on your
personal expenditures, such astaxes on theater a<infissions,furs, jewelry, cosmetics, railroad tickets, telephone, etc.
Federal social security taxes
Casualty Losses and TheftsIf you itemize deductions on a Long-Form 1040, you
can deduct your net loss resulting from the destruction ofyour property in a fire, storm, automobile accident, shipwreck, or other losses caused by natural forces. Damageto your car by collision Or accident can be deducted if duemerely to negligent driving but cannot be deducted if dueto your willful act or your willful negligence. You canalso deduct in the year of discovery losses due to theft, butnot losses due to mislaying or losing articles.
You should determine the amount of any casualty loss bycomparing the fair market value of the property just beforeand just after the casualty. This loss or the adjusted basisof the property, whichevcr is lower, should then be reducooby any insurance or other reimbursement to arrive atyour deductible loss. Explain in attached statement.
If your 1954 casualty losses exceed your 1954 income, theexcess may be carried back as a "net operating loss" tooffset your income for 1952. If the loss carried back
Social clubsLabor unionsChambers of commercePropaganda organizations
Nonprofit organizations primarily engaged in conductingresearch or education for thealleviation and cure o[ diseasessuch as tuberculm:is, cancer,multiple sclerosis, musculardystrophy, cerebral palsy,poliomyelitis, and diseases ofthe heart, etc.
rou CANNOT Deduct Gifts To:Relatives, friends, other indi
vidualsPolitical organizations or candi
dates
ContributionsIf you itemize deductions on a Long-Form 1040, you can
deduct gifts to religious, charitable, educational, scientific,or literary organizations, and organizations for the prevention of cruelty to children and animals, unless the organization is operated for personal profit, conducts propagandaor otherwise attempts to influence legislation, or participates or intervenes in any political campaign on behalfof any candidate for public office. You can deductgifts to fraternal organizations if they are to be usedfor charitable, religious, etc., purposes. You can alsodeduct gifts to veterans' organizations, or to a governmentalagency which will use the gifts for public purposes. Acontribution may be made in money or property (notservices). If in property, it is measured by the fair marketvalue of the property at the time of contribution.
For the contribution to be deductible, the recipient of thecontribution must have been organized or created in theUnited States or its possessions, or under our law. Thelaw does not allow deductions for gifts to individuals, or toother types of organizations, however worthy.
In general, the deduction for contributions may notexceed 20 perc~nt of your adjusted gross income.
Under the new-law, there is a special additional deductionof up to 10 percent for contributions made to churches, aconvention or association of churches, tax-exempt educational institutions, and tax-exempt hospitals, which mustbe computed as explained below. If all your contributionswere to these churches, schools, and hospitals, yOlI can deductup to 30 percent of your adjusted gross income. To compute the deduction for contributions you should first figurethe contributions to these special institutions to the extentof 10 percent of your adjusted gross income and theamount in excess of 10 percent should be added to the othercontributions to which the 20 percent limitation applies.Attach a schedule showing this computation.
While you can deduct gifts to the kind of organizationslisted below, you cannot deduct dues or other paymentsto them for which you receive personal benefits. Forexample, you can deduct gifts to a YMCA but not dues.
Some examples of the treatment of contributions are:rou CAN Deduct Gifts T~:Churches, including assessmentsSalvation ArmyRed Cross, community chestsNonprofit schools and hospitalsVeterans' organizationsBoy Scouts, Girl Scouts, and
other similar organizations
12

FACSIMILES OF TAX RETURNS FOR 1954 111
is stolen from youLoss or damage of property by
flood, lightning, storm, explosion, Or freezing
transitDamage by rust or gradual ero
sionAnimals or plants damaged or
destroyed by disease
Medical and Dental ExpensesIf you itemize deductions on a Long-Form 1040 you can
deduct, within the limits described below, the amount youpaid during the year (not compensated for by hospital,health or accident insurance) for medical or dental expensesfor yourself, your wife, or any dependent who received overone-half of his support froin you. If you pay medicalexpenses for a dependent who gets over half of his supportfrom you, you can deduct the payments even though youare not entitled to a deduction for an exemption for thatdependent because he haq more than $600 of gross income.
You can deduct amounts paid for the prevention, cure,correction, or treatment of a physical or mental defect orillness. If you pay someone to perform both nursing anddomestic duties, you can deduct only that part of the costwhich is for nursing.
You can deduct the cost of transportation primarily forand essential to medical care, but you cannot deduct anyother travel expense even if it benefits your health. Mealsand lodging may not be treated as medical expense whileaway from home receiving medical treatment unless theyare part of a hospi tal bill.Figuring the Deduction.-You can deduct only those medicaland dental expenses which exceed 3 percent of your adjusted gross income. However in figuring these expenses,the amount paid for medicine and drugs may be taken intoaccount only to the extent it exceeds 1 percent of youradjusted gross income, item 6, page 1. There is a scheduleprovided on page 3 to make this computation.Limitations.-The deduction may not exceed $2,500 multiplied by the number of exemptions other than theexemptions for age and blindness. In addition there is amaximum limitation as follows:
(a) $5,000 if the taxpayer is single and not a head ofhousehold or a qualifying surviving widow or widower;. (b) $5,000 if the taxpayer is married but files a separatereturn; or
(c) $10,000 if the taxpayer files ajoint return, or is a headof household or a qualifying surviving widow or widower.Special Rule For Persons 65 Or Ouer.-If either you or your wifewere 65 or over, the maximum limitation for amounts spentis the same as set out above. However, amounts deductible'for medical and dental expenses for you and your wife arenot restricted to the excess over 3 percent of your adjustedgross income. In effect, the 3 percent rule may be disregarded. But the amounts spent by you for your medicineand drugs are still limited to the excess of 1 percent of youradjusted gross income, and amounts spent by you for yourdependents' medical expenses are deductible only to theextent they exceed 3 percent of your adjusted gross income.Special Rule For Decedents.-In the case of a decedent, expenses for medical care may be treated as paid by thedecedent at the time incurred, if such expenses are paidfrom his estate within one year after his death, and providedthey are not deducted in computing the decedent's taxableestate for Federal estate tax purposes. 1£ the expenses are
Entertaining customersTools and suppliesFees to employment agencies
Travel ordered or suggested byyour doctor for rest or change
Premiums on life insurance
allowable for estate tax purposes, but it is preferred todeduct them for income tax purposes, there must be filedwith the Form 1040 a statement that this amount has notbeen c1aimcd in the estate tax return, and a waiver of theright to have this amount allowed at any time for estate taxpurposes.
Any expense claimed as a deduction for the care of children and certain other dependents should not be included I
in your computation of the deduction for medical expense.!Tau CAN Deduct Payments To or For: IDoctors, dentists, nurses, and hos- calor surgical appliances,
pitals braces, etc.Drugs or medicines X-ray examinations Or treatmentTransportation necessary to get Premiums on health and accident
medical care insurance, and hospital or med-Eyeglasses, artificial teeth, medi- ical insurancerou CANNOT Deduct Payments For:Funeral expensesCemetery plotIllegal operations or drugs
Expenses For the Care of Children and CertainOther Dependents
Generally, there is allowed a deduction not to exceed atotal of $600 for expenses paid by a woman or a widower(including men who are divorced or legally separatedunder a decree and who have not remarried) for the careone or more dependents if such care is to enable the taxpayer to be gainfully employed or actively to seek gainful employment. For this purpose, the term "dependent"is limited to the following persons for whom the taxpayeris entitled to a deduction for an exemption:
(a) a child or stepchild of the taxpayer who is under I12 years of age; or
(b) a person who is physically or mentally incapable ofcaring for himself, regardless of age.
The deduction is not allowable to the extent the payments I
are made to an individual who the taxpayer claims as adependent.
In the case of a woman who is married, the deduction isallowed only if she files a joint return with her husband;and the deduction is reduced by the amount (if any) bywhich their combined adjusted gross income exceeds $4,500.If the husband is incapable of self-support because mentallyor physically defective these two limitations do not apply.
If the person who receives the payment performs dutiesother than dependent care, only that part of the paymentwhich is for the dependent's care may be deducted.
MiscellaneousIf you itemize deductions on a Long-Form 1040, you can
deduct several other types of expenses under the heading"miscellaneous."
If you work for wages or a salary, you can deduct theordinary and necessary expenses which you incur for youremployer's benefit and which have not been claimed onpage 1. For example, if your job requires you to furnishsmall tools, you can deduct the cost of such tools.Tau CAN Deduct Cost Of:Safety equipmentDues to union or professional
societiesrou CANNOT Deduct Cost Of:Travcl to and from work Bribes and illegal paymentsEntertaining friends Educational expenses
You can deduct all ordinary and necessary expensesconnected with the production or collection of income, orfor the management or protection of property held for theproduction of income.
If you are divorced or legally separated and are makingperiodic payments of alimony or separate maintenance iunder a court decree, you can deduct these amounts. i
used tomay be
exceeds your 1952 income, the excess may beoffset your 1953 income. Any remaining excesscarried over to the years 1955-1959, inclusive.
I Tau CAN Deduct Losses On:Property such as your home,
clothing, or automobile destroyed or damaged by fire
Property, including cash, whichTau CANNOT Deduct Losses On:Personal injury to yourself or
another personAccidental loss by you of cash or
other personal propertyProperty lost in storage Or in
13I

112
._-----_._------------ -
FACSIMILES OF TAX RETURNS .FOR 1954
Periodic payments made after August 16, 1954, under either(a) a written separation agreement entered into after thatdate or (b) a decree for support entered after March 1, 1954,are also deductible. Such payments must be included inthe wife's income. However, you cannot deduct lump-sumsettlements, specific maintenance payments for support ofminor children, or any voluntary payments not under acourt order or a written separation agreement.
You may not deduct gambling losses in excess of gambling winnings. If you are a tenant-stockholder in a cooperative housing corporation, you can deduct your shareof its payments for interest and real-estate taxes.
Declaratiom of Estimated TaxFor many taxpayers the withholding tax on wages is not
sufficient to keep them paid up on their income tax. Thelaw requires every individual (including an alien who is aresident of Puerto Rico during the entire taxable year) tofile a Declaration of Estimated Tax, Form 1040-£S, and tomake quarterly payments in advance of filing the annualincome tax return if:
(a) his gross income can reasonably be expected to consist of wages subject to withholding and of not more than$100 from other sources and to exceed-
(1) $5,000 for a single individual who is not a head ofhousehold or a surviving widow or widower or for a marriedindividual not entitled to file a joint declaration;
(2) $10,000 for a head of household or a surviving widowor widower; or
(3) $5,000 for a married person entitled to file a jointdeclaration and the total income for both husband andwife can reasonably be expected to exceed $10,000; or
(b) his gross income can reasonably be expected toinclude more than $100 from sources other than wagesand to exceed the sum of $600 multiplied by the number ofexemptions plus $400.
The District Director will mail Form 1040-£S, as far as ispractical, to each person who may need it. Anyone elserequired to file should obtain the form from an InternalRevenue Service office in time to file by April 15, 1955.Farmers may postpone filing their declarations for 1955,until January 15, 1956.
HOW TO FIGURE YOUR TAXUsing the -Tax Table.-To relieve the average taxpayerfrom computing the tax, th(" law provides a table whichshows the correct tax for any income up to $5,000. If youfile a Short-Form 1040, use the Tax Table on page 16, todetermine your tax. The table is based on the same ratesused in a Long-Form 1040 computation. If your actual
deductions are larger than 10 percent of your income, youmay file a Long-Form. 1040 and claim them.Making a Long-Form Computation.-To figure your tax onthe amount on either line 5 or line 7(a), page 3, of Long-.Form 1040, use the schedule below.
1954 Tax Rate Schedule
I. FOR ALL TAXPAYERS EXCEPT UNMARRIED (OR II. ONLY FOR UNMARRIED (OR LEGALLY SEPARATED)LEGALLY SEPARATED) PERSONS QUALIFYING AS HEAD TAXPAYERS WHO QUALIFY AS HEAD OF HOUSEHOLD
OF HOUSEHOLD /IJ the amount on line' or 7 (a) is: Enter on line 6 or 7 (b): 1/ tpe amount on line' is: Enter on line 6:Not Over $2,000 20% of the amount on line 5 or 7 (a) Not over $2,000 " 20% of the amOunt on line 5.Over $2,000 but nOt Over $4,000 $400, plus 22% of excess over $2,000 9ver $2,000 but nOt Over $4,000 ..••.$400, plus 21% of excess over $2,000Over $4,000 but nOt over $6,000 .. , .$840, plus 26% of excess over $4,000 ,Over $4,000 but nOt Over $6,000 .••.. $820, plus 24% of excess Over $4,000Over $6,000 but nOt over $8,000 $1,360, plus 30% of excess over $6,000 / Over $6,000 but nOt over $8,000 $1,300, plus 26% of excess Over $6,000Over $8,000 but not over $10,000 $1,960, plus 34% of excess over $8,000 ,Over $8,000 but not over $10,000 $1,820, pi us 30% of excess over $8,000Over $10,000 but nOt Over $12,000 .. $2,640, plus 38% of eXCeSS over $lO,OOP Over $10,000 but nOt Over $12,000 $2,420, plus 32% of eXCeSS over $10,000Over $12,000 but not Over $14,000 .. $3,400, plus 43% of eXCeSS Over $12,000 Over $12,000 but nOt Over $14,000 $3,060, plus 36% of exCess Over $12,000Over $14,000 but not Over $16,000 .. $4,260, plus 47% of eXCeSS Over $14,POD Over $14,000 but nOt Over $16,000 $3,780, plus 39% of eXCess over $14,000Over $16,000 but not Over $18,000 .. $5,200, plus 50% of excess Over $16,000 Over $16,000 but nOt Over $18,000 $4,560, plus 42% of eXCeSS over $16,000Over $18,000 but not Over $20,000 .. $6,200, plus 53'70 of eXCeSS Over $18£000 Over $18,000 but not over $20,000 $5,400, plus 43% of excess over $18,000Over $20,000 but not Over $22,000 .. $7,260, plus 560/0 of exceSS Over $2Q,OOO Over $20,000 but nOt Over $22,000 $6,260, plus 47% of excess Over $20,000Over $22,000 but not Over $26,000 .. $8,380, plus 59% of exCeSS Over $22,000 Over $22,000 but not Over ~24,OOO $7,200, plus 49% of excess Over $22,000Over $26,000 but not Over $32,000 .. $10,740, plus 62% of excess Over $26,000 Over $24,000 but not Over $28,000 $8,180, plus 52% of excess over $24,000Over $32,000 but not Over $38,000 .. $14,460, plus 65% of eXCeSS Over $32,000 Over $28,000 but nOt Over $32,000 $10,260, plus 54% of exCess Over $28,000Over $38,000 but not Over $44,000 .. $18,360, plus 69% of eXCeSS Over $38,000 Over $32,000 but not Over $38,000 $12,420, plus 58% of eXCeSS Over $32,000Over $44,000 but nOt Over $50,000 .. $22,500, plus 72% of eXCeSS Over $44,000 Over $38,000 but not Over $44,000. , . $15,900, plus 62% of excess Over $38,000Over $50,000 but nOt Over $60,000 .. $26,820, plus 75% of eXCeSS Over $50,000 Over $44,000 but not Over $50,000 $19,620, plus 66% of eXCeSS Over $44,000Over $60,000 but nOt Over $70,000 .. $34,320, plus 78% of excess Over $60,000 Over $50,000 but not Over $60,000 $23,580, plus 68% of eXCeSS over $50,000Over $70,000 but not Over $80,000 .. $42,120, plus 81% of excess Over $70,000 Over $60,000 but nOt over $70,000 $30,380, plus 71% of excesS Over $60,000Over $80,000 but nOt Over $90,000 .. $50,220, plus 84% of exCeSS Over $80,000 Over $70,000 but nOt Over $80,000 $37,480, plus 74% of excess Over $70,000Over $90,000 but nOt Over $100,000. $58,620, plus 87% of eXCeSS Over $90,000 Over $80,000 but not Over $90,000 $44,880, plus 76% of excess Over $80,000Over $100,000 but not Over $150,000.$67,320, plus 89% of exceSS Over $100,000 Over $90,000 but nOt Over $100,000 .. $52,480, plus 80% of eXCeSS Over $90,000Over $150,000 but not Over $200,000 .$111 ,820, pi us 90% of excessOver $150,000 Over $100,000 but not Over $150,000. $60,480, plus 83% of exCeSS Over $100,000Over $200,000 ..•••.•• , , ••••..•.•.$156,820, pius 91%ofeXCeSS Over $200,000 Over $150,000 but not Over $200,000 .$101 ,980, pi us 87% of excess Over $150,000
Over $200,000 but not over $300,000. $145,480, plus 90% of excess Over $200,000Over $300,000 $235,480, plus 91%ofexcessover$3oo,OOO
Credits Against TaxCredit For Foreign Taxes.-If you claim credits for such taxes,you should submit with your return Form 1116 which contains a schedule for the computa.tion of the credit withappropriate instructions. This form may be obtained fromyour Internal Revenue Service ·office..Credit For Partially Tax-Exemptlnterest.-lf you itemize yourdeductions, you may deduct oTl-"ijne 11, page 3, a creditfor partially tax-exempt interest, This credit is 3 percent
14
of the partially tax-exempt interest included in grossincome. See instructions on page 7 for the type ofsecurities for which a credit is allowed. The credit maynot exceed the lesser of (a) 3 percent of the taxable income(line 5, page 3, Form 1040, or line 20, separate Schedule D(twice line 20 in the case of a joint return or the return of asurviving widow or widower), whichever is applicable) forthe taxable year or (b) the amount of tax less the creditfor taxes paid to foreign countries and possessions of theU. S. and the credit for dividends received.
FACSIMILES OF TAX RETURNS FOR 1954
Base for computation of credit. . . . . . . . . . . . . . . . . . . . . • • $400,
Retirement income credit 20 percent of $400 .•••.• " $80 I
Total retirement income ........••..••.....••••••. $1,300
But the retirement income is limited to .........•...•••... $1,200Less:Railroad retirement pension. . . . . . . . . . . . . . . . . . .• $500Earned income in excess of $900 ($1,200-$900). " 300 $800
The amount of the retirement income used for the credit Icomputation may not exceed $1,200 reduced by: I
(a) any amount received and excluded from gross "income as a pension or annuity under the Social Security Actand Railroad Retirement Acts and by tax-exempt pensions 'I
or annuities. This reduction does not include that part ofa pension or annuity which is excluded from gross income Ibecause it represents, in effect, a return of capital or tax-free I
proceeds of a like nature. Moreover, this reduction doesnot include amounts excluded from gross income which arereceived as compensation for injuries or sickness or underaccident or health plans; and
(b) in the case of any individual who is not 75 before theclose of the taxable year, any amount of earned income inexcess of $900 received in the taxable year.
Example: Assume that a qualified individual, who ismarried and over 65 but not 75, has the following itemsof income for 1954:
Credit For Withholding Tax.-Itemize the taxes withheld initem 2, page 1, and report the total amount as item 12A,page 1. If you have lost any Withholding Statement, ask Iyour employer for a copy. If you cannot furnish Withholding StatemJents for all taxes withheld from you, attach I
an explanation,
Credit For F. I. C. A. Tax.-If more than $72 of F. I. C. A.(Social Security) employee tax was withheld during 1954because you received wages from more than one1employer, the excess Ishould be claimed as a credit against /income tax. Enter Iany excess of F. I. C. A. tax withheld over $72 in the i"Income Tax Withheld" column of item 2, page 1, andwrite "F. I. C. A. tax" in the "Where Employed" column.If a joint return compute the credit separately.
Credit For Estimated Tax Pa)'ments.-If you paid any estimated tax on a Declaration of Estimated Tax (Form1040-ES) for 1954, report the total of such payments asitem 12B on page 1. If on your 1953 return you had anoverpayment which you chose to apply on your 1954 taxinclude this in item 12B.
B:J.lance Of Tax Or Rejund.-After figuring your tax eitherfrom the Tax Table or from the long-form computation,enter the amount as item 7, page 1. Enter as item 10the amount of your self-employment tax shown on line35, separate Schedule C. Show as item 13 any balance youowe, or as item 14 the amount of any overpayment due you, 'after taking credit for the amounts entered as item 12.
5700600
$700
500
400600 I
1,200
The credit is computed as follows:Retirement income incJudes-
Dividend income ..........................•....•..•Rental income ...........................•..•••••••
Dividend income after exclusion ........................•Pension under the Railroad Retirement Act (entirely ex-
cludable from gross income) .Disability payments under a workmen's compensation act
(entirely excludable from gross income) .....•.......••••Rental income (Gross) .............................••••Earned at odd jobs ................................•••
Credit For Dividends Received.-The new law provides acredit against tax for dividends received from domesticcorporations after July 31, 1954. This credit is equal to4 percent of the dividends in excess of those which youmay exclude from your gross income (see page 7). Thecredit may not exceed the lesser of:
(a) the total income tax reduced by the foreign taxcredit; or
(b) 2 percent of the taxable income (4 percent for taxable years ending after December 31,1954).Schedule J has been provided to compute the dividendcredit. Dividends from certain types of corporations donot qualify for either the credit for dividends received orfor the exclusion previously explained. These corporationsare the same corporations as those listed on page 7under the explanation of the dividend exclusion. Thecredit does not apply to a nonresident alien who is notengaged in trade or business in the United States and whosegross income from sources within the United States is notmore than $15,400.
Example: Assume a single individual with no dependentshad gross income consisting of salary of $3,300 and dividends of $3,050 received from domestic corporations afterJuly 31; 1954 ($50 of the dividends are excluded from grossincome). The credit is computed as follows:Adjusted gross income ($3,000+$3,300) $6,300Standard deduction. . . . . . . . . . . . . . . . . . . • • . . . . . . . . . . . 630
$5,670One exemption. . . . . . . . . . . . . . . • • • . . . • . • . . . . . . . . . . . . 600
Taxable income. . . . . . . . . . . . . . . . . . • . . . . . . . . . . . . . . .. $5, 070
Tax before credi t. . . . . . . . . . . . . . . . . . . . . . . . . . . . . . . . .. $1, 118. 20Dividends received credit: 4 percent of $3,000 or $120 but
limited to 2 percent of $5,070 or. . . . . . . . . . . . . . . . . . . 101. 40
Net tax liability. . . . . . . . . . . . . . . . . . . . . . . . . . . . .. $1, 016.80
Credit For Retirement Income.-Under the new law you mayqualify for a retiremen t income credit if you received earnedincome in excess of $600 in each of any 10 calendar yearsnot necessarily consecutive-before the beginning of yourtaxable year. If you qualify, you are entitled to a creditfor retirement income you are now receiving. If yourdeceased husband (or wife) would qualify for this credit, ifliving, you may claim the credit even though you did notmeet the earnings test. If a husband and wife both qualifyand each has retirement income, each one is entitled tothe credit.
The credit is 20% of the retirement income (as definedbelow) with a maximum limit of $240 for each qualifiedindividual. The credit may not exceed your tax (item 7,page 1) reduced by the dividends received credit in itemBA, page 1. Schedule K of the returnjs provided to makethis computation.
Retirement income for the purpose of the credit means
(a) In the case of an individual who is 65 years of age orover before the close of his taxable year, income from pensions, annuities, interest, rents, and dividends, which wereincluded in gross income in your return. (Gross incomefrom rents for this purpose means gross receipts from rentswithout reduction for depreciation or any other expenses.)
(b) In the case of an individual who is not 65 years ofage before the close of his taxable year, only that incomereceived from pensions or annuities under a public retirement system (one established by the Federal Government,a State, county, city, etc., but not including one established by the United States for members of the ArmedForces).
15

114 FACSIMILES OF TAX RETURNS FOR 1954
8 ormore165
$0 $0 $0 $0 $00 0 0 0 00 0 0 0 00 0 0 0 00 0 0 0 00 0 0 0 00 0 0 0 00 0 0 0 00 0 0 0 00 0 0 0 00 0 0 0 00 0 0 0 00 0 0 {) 00 0 0 0 04 0 0 0 08 0 0 0 0
13 0 0 0 017 0 0 0 022 0 0 0 026 0 0 0 031 0 0 0 035 0 0 0 040 0 0 0 044 0 0 0 049 0 0 0 053 0 0 0 058 0 0 0 065 0 0 0 074 0 0 0 083 0 0 0 092 0 0 0 0
101 0 0 0 0110 0 0 0 0119 0 0 0 0128 8 0 0 0137 17 0 0 0146 26 0 0 0155 35 0 0 0164 44 0 0 0173 53 0 0 0182 62 0 0 0191 71 0 0 0200 80 0 0 0209 89 0 0 0218 98 0 0 0227 107 0 0 0236 116 0 0 0245 125 5 0 0254 134 14 0 0263 143 23 0 0272 152 32 0 0281 161 41 0 0290 170 50 0 0299 179 59 0 0308 188 68 0 0317 197 77 0 0326 206 86 0 0335 215 95 0 0344 224 104 0 0353 233 113 0 0362 242 122 2 0371 251 131 11 0380 260 140 20 0389 269 149 29 0398 278 158 38 0407 287 167 47 0416 296 176 56 0
TAX TABLE FOR CALENDAR YEAR 1954FOR PERSONS WIT~ INCOMES UNDER 55,000 NOT COMPUTING TAX ON PAGE 3 OF FORM 1040
Read down the shaded CQlumns below until you lind the line covering the a1justed gross income you entered in item 6, page 1, Form 1040. Then read across to the appropriatecolumn headed by the number corresponding to the number 01 exemptions claimed in item 1E, page 1. Enter the tn you lind there in item 7, page 1.
":'::')f.J<itjiq<i~M~)~:· A~d the.nu.mber of exempti~ns .. ·,.:If,total)ricl)Jlle)n'·· And the number of exemptions claimed in item IE, page I, is-:,:"teriv6;paiwLis,,-· c1aomed 'n lIem IE, page 1, 05-. 't'Jlt&6;!:p~.gc:'e.,~1;-'J05C:S:d__~_-o-__----,=--__--:-__---. .,--_--:-_....,...._--,_---,-_
•.I.•.•.•.•A.:••·.I.··1.•.!.I,·•.~,.·.•.•.•.•.·,.·.•.•·.l.'."lii '3:'% ~•.•.•.\.'.,.l.I.':~I~~ ~:;:~;;; :::£J;;,~L:,,: :::£t;;:;I.~,,: ._ •• '·'·:':<lhaif:""'·· """ ,."",::·<Ihan··>:· person: head of person: head of: couple person: head of : couple
.......... -: -.-.- ,., ' ' :·::::::~:::~:>::/:::::>.t:-~;.:--·:· :'.:: flllng:a house· I filing :a house-: ,fl!lng filing ~a house-: .fl!lng
~1;1~;i,~ '~ ";t; 'g i~:fi~1;1. :;~~ :.;; I,;~; :,;;; ;~;;: ~;H ;i~ :~:1'.0725 8 0 0 0~375!2,400 310 i 310 190 i 190 i 190 70 J 70 70
>125750 13 0 0 02,40012,425 314: 314 194: 194 : 194 74 74 74... 750j7~ 17 0 0 02~4~5+2,450 319 i 319 ~~~ 1 ~g~ i ~~~ 79 79 79.i: \~~>;~ ~ ~ ~l:;lr;':~ ~;~ 1 ~;~ 208: 208 ! 208 ~~ ~~ ~~
~'I;.sl";!l:!! ! ! !t~i!~!t!!! m! mm! 11! 'm :!! :!! :!!..,....
~2550 ... ··.'.. '.:.',..'..,·.::,:..•,....•,:...:!t:.57.·..05.:...::.,.,..... 49 0 0 02;600 'I 2,625 3.')0: 350 230 230 230 110 110 110"" 53 0 0 '0 >2/6252.659. 355 : 355 235 235 235 115 115 115
/~'1S1;.~lt 58 0 0 02,650i2;675359: 359 239 239 239 119 119 1191;000 ··1/625 62 0 0 0 ,2,675 :2,700 364 : 364 244 2H 244 124 124 1241;025: 1,050 67 0 0 02,700:2,725 368: 368 248 248 248 128 128 1281050 1 015 71 0 0 0 2725 )2750 373: 373 253 253 253 133 133 133l' 015 ··:··1'100 76 0 0 0 Z:isoii775 377: 377 257 257 257 137 137 137
~:1~~lt:I~~J ~~ g g gt~~~!t~~g ~~~ 1 ~~~ ~~~ ~~~ ~~~ ~:~ ~:~ ~:~1,159: 1,1'75 89 0 0 02,820. ,2,~50 391 391 271 271 271 151 151 151
t;~·tii~~; ~ ~ ~~::~~l;:~~ ~g~ ~g~ ;~~, ;~~ ;~~ ~~~ ~~~ ~~~1225 . 1250 103 0 0 0 .2,9001 2,925 405 404 284 284 284 164 164 164i:2<50l.!275 107 0 0 0 2;9252;950 410 409 289 289 289 169 169 1691'2{~:1;~99 112 0 0 o 2;?50> 2;975 415 414 293 293 293 173 173 173
k~~ .k~~; g~ ? g gis::~tg~~ :~~ :~~ ~g~ ~g~ ~g~ ~~~ ~~~. g~.1;350 1;375 125 5 0 0 >3;05(),a, 100 437 435 314 314 314 194 194 194.1/3751lJ()'J 130 10 0 0~;~~~r~,150 447 445 323 323 323 203 203 203i;(i)Ol••~5 134 14 0 03{150 3,200 457 454 332 332 332 212 212 212
t~~~\Gll; m~i ! g 1.;i:1~\ tli mi* i* mmmmll~'" jl'i~llll !l g !':.•.:.•.:.•.•.•:.3.,a3~.,:.:·.•.•:.·:.'.l55.•.:•.•:f..••.•:.o:.•.•.•.•.·•.•.•.\.I".::•.•:ia3..•.:,:.•.••,.:.:.;~o5.••.:0•.•.·•.i.•:•.•:.: i5~3'1 i5~3~0!
2
roJ4 loll ro'! l2
i8J4' li
8'! lig;!h~~l) '. j,~25 170 50 0 ..
,.•,., •.•.~.':•.•:~.52.•••~...•.•.•.:.... :.•.•.•:.•..•~, .,' .•.:~g .•.•,.... g~ ~~ g 0;lt6003
;650 54g 539 414 413 413 .293 293 29~I 6751 100 184 64 0 g:tZ~;.i~.;f~~ ~~6 ~g~ :~: :~~ :~I ~?I ~?I ~?1
I'\li~ mil i i.!;;~! til· mmmmf!l III f!l206 86 0 0 615 605 483, 479 476 356, 356 356211 91 0 0 625 615 493 489 485 365 365 365215 95 0 0 635 624 503 498 494 374 374 374220 100 0 0 645 634 513 508 503 383 383 383224 104 0 0 655 643 523 517 512 392 392 392229 109 0 0 665 653 533 527 521 401 401' 401233 113 0 0 674 662 542 536 530 410 410 410238 118 0 0 684 671 552 545: 539 420 419 419242 122 2 0 694 681 562 555: 548 430 429 428
~gr nr Ii g~;~~Qli4nt~(l ~n ?gg ~~~ 1 ~~: i ~~~ :gg :~~ :~~
1111, ~ft i~ ~ iri~iii miii Hi! ill !il mimm
IImm~ !1111~! mml!!!lli ~!,mim* Tbls eohalDJI JD&7 aIBo be lI8ed b1 a 8unlvine widow or widower wbo meels eet'aain qualifications which are e~plajned In the in8trudions.
u. $. GOVERNMENT PlINTrNG O"ICI. 1.6-"-70993-1

FACSIMILES OF TAX RETURNS FOR 1954 115
SCHEDULE C F8J~r
u. S. Treasury DepadmenlIntel'nal Revenue Sel'vice
PROFIT (OR LOSS) FROM BUSINESS OR PROFESSION(For Computation of Self-Employment T90X, see Page 3)
PARTNERSHIPS AND JOINT VENTURES SHOULD FILE ON FORM 10651954
For Calendar Year 1954 or other taxable year beginningOwner's Name and Address (from Form 1040)
, 1954, and ending , 195
(Principal product or service)
G. How many months in the year didyou own this business? -1Did you own this business on Decem~ber 31, 1954? 0 Yes 0 No~Was this a seasonal business whicK
B. Business name ------------------------------------------------------------------------------------------------------ was closed for more than lw6C. Number of places of business ---------------------------------------------------------------------------------- months during the year? 0 Ye$D. Did you pay social security taxes for any employees for any quarter of 1954? 0 Yes 0 No. 0 No. IE. Enter your employer identification number, if any _------------------------------------------------------ I
F. Business address: . . .. j(Street and number or rural route) (CUy, lown. post office) (County) (Slate)
Item (see instructions-page 2)A. Principal business activity
Line (see instructions-page 2) I1. Total receipts $ , less allowances, rebates, and returns $------------------------ $---------------------------- -------i2. Inventory at beginning of year $________________________ I3. Merchandi~epurchased $---------------. less any items withdrawnI~ i
from busmess for personal use $ . . $________________________ ,
4. Cost of labor (do not include salary paid to yourself) ---------.-------------.- IS. Material and supplies • ._ ,
6. Other costs (explain in Schedule 0-2) .7. Cost of goods manufactured or purchased (total of lines 3,4,5, and 6) 1 1
8. Total of line 2 plus line 7 $ _
9. Enter inventory at end of year ....•.••••••.••.................................. , _
10. Cost of goods sold (line B less line 9) 1 1 _11. Gross profit (line 1 less line 10) .•••••..••....................................................... $ .~
OTHER BUSINESS DEDUCTIONS12. Salaries and wages not included in line 4 (except any paid to yourself) $ _
13. Rent on business property _. _
14. Interest on business indebtedness. _ _
IS. Taxes on business and business property ..; _
16. Losses of business property (attach statement). . . . . . . . . . . . . . . . . . . . . . . . . . . . . . . . .. . _
17. Bad debts arising frpm sales or services _
18. Depreciation and obsolescence (explain in Schedule C-1) . _
19. Repairs (explain in Schedule 0-2) ..• _20. Depletion of mines, oil and gas wells, timber, etc. (attach schedule) _
21- Amortization of emergency and grain storage facilities (attach statement) _. _
22. Other business expenses (explain in Schedule 0-2) '-- 1
23. Total of lines 12 to 22 ~ 1 .1 _
24. Enter net profit (or loss) (line II less line 23). Also enter on line 25, page 3 of this schedule, and on line I,
Schedule C Summary. Form 1040 $
Schedule C-l. EXPLANATION OF DEDUCTION FOR DEPRECIATION CLAIMED ON LINE 18
1. Kind of property (if buildings. state material ofwhich constructed). Exclude land and other
nondepreciable property
2. Dateacquired
3. Cost orother basis
4. Depreciation allowed (or allowable)
in prior years5. Method 6. Rate (%)
or life (years)7. Depreciation
for this year
.,.------------------------------------- ------ -- - ------------- -- ---- - $------------ -- ---- - $--- -----------_.--- -----------.- .-.- -_ .. --- -------- -- ------- $._---- -- .--------------
---~---------------------------------------------------------------- -------------------- -------------------- -------------------- --- ----------------- -------------- -- --- -----Schedule C-Z. EXPLANATION OF LINES 6, 19, AND ZZ
AmountAmount Une No. Explanation-------'----------1------
ExplanationUne No.
1
----- -- --- - - --- -- ---- -- ---- ------- ----------- -.---.--------- $-------- ----.------------ --- ---- ----- -------------.--- ---- -------. -- ------ ---------- - $---- ------------ --------. i
------------1--·------------- .-- --------------------------.-- --.-------------- ---- ----- ----------- - ------------- ----------------------------------- ------- --------------.---- I16-70905-1 i

116 FACSIMILES OF TAX RETURNS FOR 1954
INSTRUCTIONS Page 2
If you owned a business, or practiced a profession, you shouldfill in separate Schedule C on other side and enter the net profit(or loss) on line I, Schedule C Summary. page 2, Form 1040.
Separate Schedule C should include income from (1) sale ofmerchandise, or products of manufacturing, mining, and construction; (2) business service; and (3) professional service. In general,you should report any income in the earning of which you haveincurred expenses for material, labor, supplies, and the like. Afarmer keeping his books of account en the accrual method mayinclude the income in such schedule from the sale of products ofagriculture in lieu of including such income in Form 1040F.
Item A-Business Activity.-State the general classification ofbusiness activily, as well as the principal product or service. Forexample, "Wholesale food," "Retail men's appore1," "Manufacture of upholstered wooden household furniture," "Transportationby truck," "Broker, real estate," "Contractor--earpenter work,""Physician," etc. Do not use such terms as "partnership," "owner,""student," etc. The "principal business activily" is the one whichaccounts for the largest percentage of your total receipts. Alltrades and businesses except those specifically excluded are subject to self-employment tax.
Item E-Employer Identification Number.-This is thenumber given on Form 941, Employer's Quarterly Federal TaxReturn, which you file as an employer.
Item F-Business Address.-Do not use home address asbusiness address unless business is actually conducted from home.
Line I-Total Receipts.-You should include all incomederived from your trade or business. Enter in the space providedsuch items as returned sales, rebates, and allowances from the saleprice or service charge.
If you have dividend income from stocks held by you in theordinary course of carrying on your trade or business, such dividendsmust be considered together with your dividends from stocks regularly held for investment purposes in computing your dividendexclusion and credit.
Installment Sales.-If you use the installment method of reporting income from sales, you should attach to your return a scheduleshowing separately for the years 1951, 1952, 1953, and 1954 thefollowing: (a) Gross sales; (b) cost of goods sold; (c) gross profits;(d) percentage of profits to gross sales; (e) amounts collected; and(f) gross profits on amount collected.
COST OF GOODS SOLDLines Z-lO.-If you are engaged in a trade or a business in
which the production, purchase, or sale of merchandise producesincome, you should take inventories of merchandise and materialson hand at the beginning and end of the taxable year in order toreflect the gross prolits correctly. The usual methods of valuinginventory are (a) cost and (b) cost or market whichever is lower.The method properly adopted for the first year in which inventoryis taken must be continued unless permission to change is securedfrom the Commissioner. Application for permission to change themethod of valuing inventories must be made in writing and filedwith the Commissioner within 90 days after the beginning of thetaxable year in which it is desired to ellect a change. You shouldenter the letters "C" or "C or M" immediately before the amountcolumn if inventories are valued either at cost, or at cost or marketwhichever is lower.
Other methods for valuing inventories of material or merchandiseare provided for dealers in securities, for farmers, for miners, formanufacturers who produce more than one product from a singleprocess, and for retail merchants using the "retail method."
A special method based on cost, LIFO, is allowable only if youfile an application on Form 970 with your return for the first yearused. The requirements for adopting and using the LIFO method'are set forth on Form 970. Thereafter, you should attach a separateschedule showing: (a) a summary of all inventories; (b) with respectto inventories computed under the LIFO method, the computation ofquantities and cost by acquisition levels.
OTHER BUSINESS DEDUCTIONSLine lZ-8alaries and Wages.-You should enter all salaries
and wages not included as "Cost of Labor" in "Cost of GoodsSold." Do not deduct any salary or wages for your own servicesor services of others not performed in connection with your business.
Line 13-Rent on Business Property.-Rents paid or accruedon business properly in which you have no equily are deductible.Do not include rent for a building, or any part, which you occupysolely for residential purposes.
Line 14--Interest on Business Indebtedness.-Interest onbusiness indebtedness to others is deductible. Do not includeinterest to yourself on capital invested in or advanced to the business.
Line IS-Taxes on Business and Business Property.-Includetaxes paid or accrued on b1Jsiness properly or incurred for carryingon your business. Federal import duties and Federal excise andstamp taxes are deductible if paid or incurred in carrying on atrade or business. Do not include taxes assessed against localbenefits of a kind tending to increase the value of the properlyassessed, as for paving, sewers, front foot benefits, etc.
Line 16-Losses of Business Property.-You may deduct lossesof business properly by fire, storm, or other casually, or theft, notcompensated by insurance or otherwise and not made good byrepairs claimed as a deduction. Attach a statement showing adescription of the properly, date acquired, cost, subsequent improvements, depreciation allowable since acquisition, insurance,salvage value, and deductible loss.
Line 17-Bad Debts Arising From Sales or Services.-Includedebts, or portions thereof, arising from sales or professional servicesthat have been included in income, which have been definitelyascertained to be worthless, or such reasonable amount as has beenadded to a reserve for bad debts within the taxable year. A debtpreviously deducted as bad which reduced your tax in a prior year,if subsequently collected, must be returned as income for the yearin which collected.
Line Ill--Depreciation and Obsolescence.-You may deducta reasonable allowance for exhaustion, wear and tear, andobsolescence of properly used in the trade or business. Foradditional information regarding depreciation, especially on newproperly acquired or constructed after December 31, 1953, seedepreciation section in the instructions for Form 1040.
1£ a deduction is claimed on account of depreciation, you shouldfill in Schedule C-l. In case obsolescence is included, state separately amount claimed and basis upon which it is computed. Thevalue or cost of land must not be included in this schedule, andwhere land and buildings were purchased for a lump sum, the costof the building subject to depreciation must be established. Theadjusted properly accounts and the accumulated depreciationshown in the schedule should be reconciled with those accountsas reflected on your books.
Line 19-Repairs.-You may deduct the cost of incidentalrepairs, including labor, supplies, and other items, which do notadd to the value or appreciably prolong the life of the property.Expenditures for new buildings, machinery, equipment, or forpermanent improvements or betterments which increase the valueof the properly are chargeable to capital accounts. Expendituresfor restoring or replacing properly are not deductible, since suchexpenditures are chargeable to capital accounts or to depreciationreserve depending on how depreciation is charged on your books.
Line Zo--Depletion of Mines, Oil and Gas Wells, Timber,Etc.-If a deduction is claimed on account of depletion, you shouldprocure from your District Director Form M (mines and other naturaldeposits), Form 0 (oil and gas), or Form T (timber), fill in and filewith return. If complete valuation data have been filed withquestionnaire in previous years, then file with your return inlormation necessary to bring depletion schedule up to date, settingforth, in lull, statement of all transactions bearing on deductionsfrom or additions to value of physical assets during the taxableyear with explanation of how depletion deduction for the taxableyear has been determined. (See sections 615 and 616 of the Internal Revenue Code of 1954 for election to capitalize or deductexpenditures for exploration and development of mineral properties.)
Line Zl-Amortization.-If you elect the deduction with respectto the amortization of the adjusted basis 01 (a) any emergencyfacility with respect to which the Government has issued a certificateof necessily, or (b) a grain storage facilily, a statement of the pertinent facts should be filed with your election. (See sections 168and 169 of the Internal Revenue Code of 1954.)
For the election to amortize research or experimental expendituresnot subject to depreciation or depletion, see section 174 of the Code.
Line ZZ-Other Business Deductions.-You should include allordinary and necessary business expenses for which no space isprovided in the schedule. Any deduction claimed should beexplained in Schedule C-2. Do not include cost of business equipment or furniture, expenditures for replacements, or for permanentimprovements to properly, or personal living and lamily expenses.
Soil and Water Conservation Expenditures.-Taxpayersengaged in the business of farming may under certain conditionsexpense amounts paid for soil and water conservation. For moredetailed instructions, see the instructions for Form 1040.
Net Operating Loss Deduction.-Any net operating lossdeduction should be entered in Schedule C Summary, Form 1040,instead of in this schedule.
Accrual-Method Taxpayers Only.-If you have (a) receiptswhich constitute prepaid income, or (b) reserves for estimated ex-penses, see the instructions for Form 1040. 16-70995-1

FACSIMILES OF TAX RETURNS FOR 1954
_IMPORTANT-If you have more than one business, a separate page 1 must be completed for each business., 3 should be completed and filed showing the aggregate net profit from such businesses.
(See Instnu:tions-Page 4)COMPUTATION OF SELF-EMPLOYMENT TAX
(Fol' old-age and IIUl'vivOl'lI inl1l1'anc:e)
Page 3I
However, only one page
NAME OF SELF·EMPLOYED PERSON (a separate schedule musl be Iiled lor each self-employed person)
STATE BUSINESS ACTIVITIES, IF ANY. SUBJECT TO SELF-EMPLOYMENT TAX (for example: Restaurant, Building Contractor)
Line (See instrhctions-Page 4)II
25.
26.
Net profit (or loss) shown on line 24, page 1 (Enter aggregate amount if more thanone business). .. .. .. .. . . .. . . . . .. . . . . .. . . . . . . . . .. . . .. . . . . . . . . . . . . . . . . . . . . . . . . . . . .. $ _
Losses of bLiness property shown on line 16, page 1 1 --' 1
003,600
i27. Total of lin~s 25 and 26 '1 $-------------.----- ------t28. Less: Net idcome (or loss) from excluded services or sources included in line 27. . . . . . . . . . . . . . . . . . . . . . . . . . . . . . ---.l
I ,Specify excluded services or sources . . _
29.
30.
I
INet earnings from self-employment (line 27 less line 28). . . . . . . . . . . . . . . . . . . . . . . . . . . . . . . . . . . . . . . . . . . . . . . . .. $ _1 I
Net earnings (or loss) from self-employment from partnerships, joint ventures, etc. (from column 11, Schedule IK, Form 1065) 1 -\-_--.,'
i
31. Total net earnings (or loss) from self·employment (line 29 plus line 30) , $ 1 __1
(If total oflnet earnings is under $400, do not make any entries below) i
32. Maximum dmount subject to self-employment tax " $
33. Less: Wages paid to you during the taxable year which were subject to withholding forold-age anq survivors insurance. (If such wages exceed $3,600, enter $3.600) .
34. Maximum Jmount subject to self-employment tax after adjustment for wages 1_$ --''--__ I
35.
36.
self-emPlorent income subject to tax-Line 31 or 34, whichever is smaller '1$
Self-emploYment tax-3 percent of amount on line 35. Enter here and as item 10, page I, Form 1040 $
195 •
IMPORTANT-FILL IN ITEMS BELOW COMPLETELY BUT DO NOT DETACH
,
o ICalendar Year 1954o 'Other Taxable Year Beginning • , 1954, and Ending ,
SCHEDULE e:-a (Fo.... 1040)U. S. Tre.....ry Departmeatlalel'Da! ReveDDe Service
1
i I------------------7------------------------------------------------------------------------------------------------f----
u. s. R~;o~I~Ier~~ld~A~~~~!~!I~~~~u~~~e) INCOME 1954;Siale Business Activities Subject To Self-Employment Tall:
2.
Business Addr~ss (Street and Number, City or Town, Postal Zone Number, Slole)3.
4. PRINT BELOl NAME AND ADDRESS OF SELF-EMPLOYED PERSON
5. g~.T~rWJJg~ ~9.f1tJ SECURITY ACCOUNT NUMBER
IN LINE 4 • I 000 I 00 \ 0000
(City or Tovh>, Postal Zone Number. State)
Name as shown on Social Security Account Number Card.
HOME ADDRESS (Street and Number. or Rural Route)
!
6. Enter Total EarningsFrom Self Employment iShown on Line 31 above $. "
7. Enter Wages Shown on 'Line 33 above $ •
8. Enter Self-EmploymentIncome Shown on Line 35 above ... $ •
-......!.-----------------------------'----------------------:-1&-::--:7::0Il=96~

118 FACSIMILES OF TAX RETURNS FOR 1954
Page 4PURPOSE OF THIS FORM
Schedule C .(Form 1040).-Schedule C serves two purposes.First, it provides for the determination of net profit (or loss) frombusiness or profession to be used in computing income tax. Second,it provides for the computation of the self-employment tax in accordance with Chapter 2 of Subtitle A of the Internal Revenue Codeof 1954.
Schedule C-a (Form 1040).-The lower portion of page 3,Schedule C, which is designated as Schedule C-a (Form 1040). isdesigned to provide the Social Security Administration with theinformation on sell-employment income necessary for old-age andsurvivors insurance purposes.
MORE THAN ONE TRADE OR BUSINESSIf an individual is engaged in more than one trade or business,
his net earnings from sell-employment are the total of his net earningsfrom self-employment 01 each trade or business carried on by him.Thus, the loss sustained in one trade or business will operate toreduce the income derived from another trade or business.
JOINT RETURNSWhere husband and wile lile a joint return, page 3 01 Schedule C
(Form 1040) should show the name of the one with sell-employmentincome. Where husband and wife each have self-employmentincome, a separate Schedule C must be attached for each. In suchcases the total of amounts shown on line 24 of each separate scheduleshould be entered on line I, Schedule C Summary, page 2, Form1040, and the aggregate self-employment tax (line 36) should beentered as item 10, page 1, Form 1040.
COMMUNITY INCOMEFor the purpose of computing net earnings from self-employment,
if any of the income from a trade or business is community income,all the income from such trade or business is considered the incomeof the husband unless the wile exercises substantially all the management and control of the trade or business, in which case all ofsuch income is considered the income of the wife.
II separate returns are filed by the husband and wife, a completeSchedule C should be attached to the return of the one with selfemployment income. Community income included on such aschedule must, however, be allocated between the two returns (online I, Schedule C Summary, page 2, Form 1040) on the basis of thecommunity property laws.
In computing his aggregate net earnings from self-employment,a partner should include his entire share of such earnings from apartnership. No part of that share may be attributed to the partner's wife (or husband) even though the income may, under Statelaw, be community income.
FISCAL YEARSFor liscal years ending after December 31, 1954, the amounts of
$3,600 appearing on lines 32 and 33, page 3, in the computation'of the sell-employment tax should be changed to $4,200.
If you are a Christian Science practitioner, architect, accountant,funeral director, engineer. minister, member of a religious order, ora larmer, reporting on a fiscal year basis, consult your nearestInternal Revenue Service ollice for the recent changes in the lawwhich allect your liability for self-employment tax.
SCHEDULE C-a (Form 1040)To assure proper credit to your account, be sure to enter your
name and social security account number on Schedule C-a (Form1040) exactly as they are shown on your social security card. Ifyou do not have a social security account number, you must getone. These account numbers are obtainable from any of theapproximately 500 Social Security Administration offices throughout the country. The telephone directory or your local post officewill give you the address. Do not delay filing your return beyondthe due date even though you have not obtained your social securityaccount number.
Regardless of whether a joint or separate returns on Form 1040are filed by husband and wife, Schedule C-a (Form 1040) should'show only the name of the one with the self-employment income.If both had net earnings from self-employment, a separate ScheduleC-a must be filed by each.
u. s. GOVERNMENT PRINTING OffiCE 16-70U95-1
INSTRUCTIONS FOR CALENDAR YEAR 1954
SELF·EMPLOYMENT TAX 7. Properly gains and losses.-Gain or loss (A) from the sale orexchange of a capital asset, (E) to which sections 631 and 1231are applicable, or (C) from the sale, exchange, involuntary con·version, or other disposition 01 property if such property is neither(1) stock in trade or other property of a kind which would properlybe includible in inventory if on hand at the close 01 the taxableyear, nor (2) property held primarily for sale to customers in theordinary course 01 the trade or business.
Net operating losses.-In determining the net earnings fromself-employment, no deduction for net operating losses of other yearsshall be allowed.
4. Employees and public o££iciaIs.-Income from the performance of service as:
(a) a public official, including a notary public;(b) an employee or employee representative under the railroad
retirement system; or(c) an employee. "Employee" includes among others:
(1) an agent-driver or commission driver engaged indistributing meat, vegetable, fruit, and bakery products, beverages (other than milk). or laundry or drycleaning services;
(2) a full-time life insurance salesman;(3) a home worker performing work subject to licensing
requirements under State law; and(4) traveling or city salesmen generally, engaged upon
a full·time basis for their principals (except lor sidelinesales activities on behalf of another person).
Note.-The income of an employee over the age of 18 fromthe sale 01 newspapers or magazines to an ultimate consumeris subject to the sell-employment tax if the income consists ofretained profits from such sales.
5. Real estate rentals.-Rentals from real estate, except rentalsreceived in the course of a trade or business as a real estate dealer.Payments for the use or occupancy of rooms or other space whereservices are also rendered to the occupant, such as rooms in hotels,boarding houses, apartment houses furnishing hotel services, touristcamps, tourist homes, or space in parking lots, warehouses, orstorage garages do not constitute rentals from real estate and therefore are included in determining net earnings from sell-employment;
6. Interest and dividends.-Dividends on shares of stock, andinterest on bonds, debentures, notes, certificates, or other evidencesof indebtedness, issued with interest coupons or in registered formby a corporation, or by a government or political subdivision thereof,unless received in the course of a trade or business as a dealer instocks or securities; and
EXCLUSIONS
In determining the amount of net earnings from self-employmentreport on line 28 income from the following sources or deductionsattributable thereto:
1. Certain pro£essions.-Income from the performance of serviceas a physician, lawyer, dentist, osteopath, veterinarian, chiropractor, naturopath, optometrist, Christian Science practitioner,architect, certified public accountant, accountant registered orlicensed as an accountant under State or municipal law, full-timepracticing public accountant, luneral director, or profeSSional engineer; or income from the performance of such service by apartnership;
2. Religious services.-Incomefrom the performance of serviceby a duly ordained, commissioned, or licensed minister of a churchin the exercise of his ministry or by a member of a religious orderin the exercise 01 duties required by such order;
3. Farming.-Income from farming or from any other businessin which, if the business were carried on exclusively by employees,the major portion of the services would constitute agricultural labor;
In general, every individual deriving income during the taxableyear Irom a trade or business carried on by him or from a partnership of which he is a member is subject to the self-employment tax,the computation of which is made on lines 25 through 36.
"Net earnings from self-employment" (line 31) is the gross incomederived by an individual from any trade or business carried onby him, less the allowable deductions attributable to such trade orbusiness, plus his share of self-employment net earnings (or loss)from a partnership of which he is a member.
No Deductions for Personal Exemptions.-The deductions forpersonal exemptions are not allowable in determining the netearnings from sell-employment.

FACSIMILES OF TAX RETURNS FOR 1954 119I
SCHEDULE D U. S. Treasury Deparhnent--Internal Revenue Service
GAINS ANI}' LOSSES FROM SALES OR EXCHANGES OF PROPERTYUSE WITH INDIVIDUAL, FIDUCIARY, OR PARTNERSHIP RETURNS
1954For Calendar Year 1954, or other taxable year beginning , 1954, and ending • 195Name and Address ICheck type of relurn liIed:
I D Form D Form1040 1041 D Form
1065
(I) PROPERTY OTHER THAN CAPITAL ASSETS
h. Gain or loss (column d Iplus column e less sumof columns f and g)
g. Expense of sale
e. Depreciation f. Cost or otherb. Dato allowed (or basis and cost of
a. Kind of property (if necessary. attach statemont acquired c. Dato d. Gross sales price allowable) since subsequent im-of descriptive details not shown below) (mo., ':l~~,(~~j' (contract price) acquisition or provements (if not
i day. yr.) (ar.:~~\~h~~~~e) pU~~~~~~~i;~~)Ch) '--- ---1------1------1-----1-----1-------
1. ----------------l---------------------- ----------- ----------- $---.-------------- $------------------ $------------------ $----------------- $------------------------I----------------------1-.-.---------------.--- ----------- ----------- ------.------------ ---------.--------- ------------------- --.---------------- -_.- --.---..--------------..!------------.-.-----------.-----------------. ----------- -------.--- -----------..------ -----..------------ ------------------- -------------------1------
2. Net gain (or loss), Enter here and on line 1, Schedule D, Form 1040, or as item 8 (a), page I, Form 1041, or as
item 11, pag~ 1, Form 1065 , .. " $
I (II) CAPITAL ASSETSI Short-TerIn Capital Gains and Losses-Assets Held Not More Than 6 Months I
:~::E~~~l~t:jI~Et!~~~UL-CjS,j~-L:lid~~~E \:E:-::::~~~~ '-~~?)::-:::-~~~ ~:::~::L~;~-L~:~ i5. Enter unused capital loss carryover from 5 preceding taxable years (Attach stateInent) 1--------6. Net short-term gain (or loss) from lines 3,4, and 5. Enter here and in Schedule D. Form 1041, or as item 26, page
1. Form 1065 · $I Long-TerIn Capital Gains and Losses-Assets Held More Than 6 Months
8. Enter the full amount of your share of net long.term gain (or loss) from partnerships and fiduciaries 1--------9. Net long-terrJ gain (or loss) from lines 7 and 8. Enter here and in Schedule D, Form 1041, or as item 27, page
1. Form 1065l '" $
• LINES 10 TJiROUGH 25 NOT APPLICABLE TO FIDUCIARIES AND PARTNERSHIPSb. Lossa. GainGain or Loss To Be Taken Into Account
10. Enter net short-term gain (or loss) from line 6 , $-------111. Enter net 10nJ-term gain (or loss) from line 9 $-------1Use lines 12 thrdugh 15 only if gains exceed losses in lines 10 and 11.
12. Enter short.tetm gain (line 10, col. a) reduced by any long-term loss (line II, col. b) $--------1:13. Enter long-term gain (line 11, col. a) reduced by any short-term loss (line 10. col. b) $-------14. Enter 50 percent of line 13 $-------15. Enter here and on line 2, Schedule D, Form 1040, the sum of lines 12 and 14 I~$~ .I~
Use lines 16 an& 17 only if losses exceed gains in lines 10 and 11.I
16. Enter the excess of losses over gains on lines 10 and 11 $ _
17. Enter here and on line 2, Schedule D, Form 1040, the sInallest of the follOwing: (a) the amount on line 16; (b) tax
able income computed without regard to capital gains and losses and the deduction for exemptions; or (e) $1.000 .. $
COMPUTATION OF ALTERNATIVE TAX FOR INDIVIDUALS (ForIn 1040)I (See instructions on other side as to when the alternative tax applies)
18. Enter from pope 3, Form 1040, the income from line 5 if separate return or line 7 (a) if joint return $ _
19. Enter amountifrom line 14, column a, above, if separate return, or half of such amount if joint return 1 _
20. Balance (line 18 less line 19) , $ _
21. Enter tax on Q.mount on line 20 (Use applicable Tax Rate Schedule in Form 1040 Instructions) $ _
22. If joint return) multiply amount on line 21 by two $ _
23. Enter 50 percrnt of line 19 $ _
24. If joint return, multiply amount on line 23 by two , $ _
25. Alternative tax (line 21 plus line 23 if separate return; line 22 plus line 24 if joint return). If smaller than amount
on line 6 or line 7(c). page 3. Form 1040, enter this alternative tax on line 8. page 3. Form 1040 $
NOTE.-In lines 18 to 25 the treatment in the case of a joint return Js also applicable to a return of a surviving widow or widower. 16-7091)0-1

120 FACSIMILES OF TAX RETURNS FOR 1954
INSTRUCTIONI-(Refel'ences ue 10 Ihe Inlel'nal Revenue Code of 1954)GAINS AND LOSSES FROM SALES OR EXCHANGES OF
PROPERTY.-Report details in schedule on other side."Capital assets" defined.-The term "capital assets" means
property held by the taxpayer (whether or not connected with histrade or business) but does NOT include--
(a) stock in trade or other property of a kind properly includiblein his inventory if on hand at the close of the taxable year;
(b) property held by the taxpayer primarily for sale to cu·s.tamers in the ordinary course of his trade or business;
(c) property used in the trade or business of a character whichis subject to the allowance for depreciation provided insection 167;
(d) real property used in the trade or business of the taxpayer;(e) certain government obligations issued on or after March I,
1941, at a discount, payable without interest and maturingat a fixed date not exceeding one year from date of issue;
(I) certain copyrights, literary, musical, or artistic composi-tions, etc.; or
(g) accounts and notes receivable acquired in the ordinarycourse of trade or business for services rendered or fromthe sale of property referred to in (a) or (b) above.
In connection with (b) above, the law allows dealers in securitiescapital gain or loss treatment with respect to certain securitieswhich were clearly identified as being held for investment. Also,in the case of a taxpayer other than a corporation, certain realproperty subdivided for sale may be treated as capital assets.Sections 1236 and 1237.
If the total distribution to which an employee is entitled underan employees' pension, bonus, or profit-sharing trust plan exemptfrom tax under section 501 (a), is received by the employee in onetaxable year, on account of the employee's separation from the service, the aggregate amount of such distribution, to the extent itexceeds the amounts contributed by the employee, shall be treatedas a long-term capital gain. See section 402.
A capital gain dividend, as defined in section 852 (relating totax on regulated investment companies), shall be treated by theshareholder as a long-term capital gain.
Gain on sale of depreciable property between husband and wifeor between a shareholder and a "controlled corporation" shall betreated as ordinary gain. Section 1239.
A transfer (other than by gift, inheritance, or devise) by anindividual "holder" of all substantial rights evidenced by a patent,or an undivided interest therein, shall be considered the sale orexchange of a capital asset held for more than 6 months.
Gains and losses from transactions described in section 1231(see below) shall be treated as gains and losses from the sale orexchange of capital assets held for more than 6 months if the totalof these gains exceeds the total of these losses. If the total of thesegains does not exceed the total of these losses, such gains and lossesshall not be treated as gains and losses from the sale or exchangeof capital assets. Thus, in the event of a net gain, all these trans·actions should be entered in the "long-term capital gains and losses"portion of Schedule D. In the event of a net loss, all these transactions should be entered in the "property other than capital assets"portion of Schedule D, or in other applicable schedules on Forms1040, 1041, or 1065.
Section 1231 deals with gains and losses arising from-(a) sale, exchange, or involuntary conversion, of land (includ
ing in certain cases unharvested crops sold with the land)and depreciable property if they are used in the trade orbusiness and held for more than 6 months,
(b) sale, exchange, or involuntary conversion of livestock heldfor draft, breeding, or dairy purposes' (but not includingpoultry) and held for 1 year or more,
(c) the cutting of timber or the disposal of timber or coal towhich section 631 applies, and
(d) the involuntary conversion of capital assets held more than6 months.
See sections 1231 and 631 for specific conditions applicable.Description of properly listed.-State follOWing facts: (a) For
real estate (including owner-occupied residences), location anddescription of land and improvements; (b) for bonds or other evidences of indebtedness, name of issuing corporation, particularissue, denomination, and amount; and (c) for stocks, name of corporation, class of stock, number of shares, and capital changesaffecting basis (including nontaxable distributions).
Ba.sis.-In determining gain or loss in case of property acquiredafter February 28, 1913, use cost, except as specially provided.The basis of property acquired by gift after December 31, 1920, isthe cost or other basis to the donor in the event of gain, but, in theevent of loss, it is the lower of either such donor's basis or the fairmarket value on date of gift. Generally the basis of propertyacquired by inheritance is the fair market value at time of acquisition which usually is the date of death. For special cases involvingproperty acquired from a decedent, see section 1014. In the case ofsales and exchanges of automobiles and other property not used in
your trade or business, or not used for the production of income,the basis for determining gain is the original cost plus the cost ofpermanent improvements thereto. No losses are recognized for in·come tax purposes on the sale and exchange of such properties.In determining GAIN in case of property acquired before March I,1913, use the cost or the fair market value as of March I, 1913,as adjusted, whichever is greater, but in determining LOSS usecost as adjusted.
Sale of a personall'eSidence.-See Form 1040 instructions forspecial rules applicable to sale or exchange of your residence.
Losses on securities becoming worthless.-If (a) shares ofstock become worthless during the year or (b) corporate securitieswith interest coupons or in registered form become worthless duringthe year, and are capital assets, the loss therefrom shall be can·sidered as from the sale or exchange of capital assets as of the lastday of such taxable year.
Nonbusiness debts.-If a debt, such as a personal loan, becomestotally worthless within the taxable year, the loss resulting therefromshall be considered a loss from the sale or exchange, during thetaxable year, of a capital asset held for not more than 6 months.Enter such loss in column (h) and describe in column (a) in theschedule of short-term capital gains and losses on other side. Thisdoes not apply to (a) a debt evidenced by a corporate security withinterest coupons or in registered form and (b) a debt acquired inyour trade or business.
Classification of capital gains and losses.-The phrase"short-term" applies to gains and losses from the sale or exchange ofcapital assets held for 6 months or less; the phrase "long-term"applies to capital assets held for more than 6 months.
Treatment of capital gains and losses.-Short-term capitalgains and losses will be merged to obtain the net short-termcapital gain or loss. Long-term capital gains and losses (taken intoaccount at 100 percent) will be merged to obtain the net longterm capital gain or loss. If the net short-term capital gain exceedsthe net long-term capital loss, 100 percent of such excess shall beincluded in income. If the net long-term capital gain exceeds thenet short-term capital loss, 50 percent of such excess shall beincluded in income. In the case of a fiduciary, see section 1202.
Limitation on allowable capital losses.-If the sum of all thecapital losses exceeds the sum of all the capital gains (all suchgains and losses to be taken into account at 100 percent), thensuch capital losses shall be allowed as a deduction only to theextent of (1) current year capital gains plus (2) the smaller of eitherthe taxable income of the current year (or adjusted gross income iftax table is used) or $1,000. For this purpose taxable income is'computed without regard to capital gains or losses or the deductionfor exemptions. The excess of such allowable losses over the sumof items (1) and (2) above is called "capital loss carryover" (notapplicable to partnerships). It may be carried forward and treatedas a short-term capital loss in succeeding years. However, thecapital loss carryover of each year should be kept separate, sincethe law limits the use of such carryover to the five succeeding years.In offsetting your capital gain and income of 1954 by prior yearloss carryovers, use any capital loss carryover from 1949 beforeusing any such carryover from 1950 or subsequent years. Any1949 carryover which cannot be used in 1954 must be excluded indetermining total loss carryover to 1955 and subsequent years.
Collapsible corporations.-Gain from the sale or exchange ofstock in a collapsible corporation is not a capital gain. Section 341.
"Wash sales" losses.-Losses from the sale or other dispositionof stocks or securities are not deductible (unless sustained in connection with the taxpayer's trade or business) if, within 30 daysbefore or after the date of sale or other disposition, the taxpayerhas acquired (by purchase or by an exchange upon which theentire amount of gain or loss was recognized by law) or has enteredinto a contract or option to acquire, substantially identical stockor securities.
Losses in transactiOns between certain persons.-No deduction is allowable for losses from sales or exchanges of propertydirectly or indirectly between (a) members of a family, (b) a corporation and an individual (or a fiduciary) owning more than 50percent of the corporation's stock (liquidations excepted), (c) agrantor and fiduciary of any trust, (d) a fiduciary and a beneficiaryof the same trust, (e) a fiduciary and a fiduciary or beneficiary ofanother trust created by the same grantor, or (I) an individual anda tax-exempt organization controlled by the individual or hisfamily.
ALTERNATIVE TAX.-If the net long-term capital gainexceeds the net short-term capital loss, or in the case of only along-term capital gain, individual taxpayers (a) filing separate returns with taxable income exceeding $18,000, or (b) filing joint reoturns or as surviving widows or widowers with taxable income exceeding $36,000, or (c) filing as head of household with taxableincome exceeding $24,000, will usually find it to their advantageto compute the alternative tax on the other side. The alternativetax, if less than the tax computed on page 3 of Form 1040, shall bethe tax liability. GPO 1&--70__1

FORM 1040 Fu.S. Treasury DepartmentInternal Revenue Service
Attach This Form to YourIncome Tax Return Form1040 and File It With theDistrict Director 01 InternalRevenue lor Your District.
FACSIMILES OF TAX RETURNS FOR 1954
SCHEDULE OF FARM INCOME AND EXPENSESFor Calendar Year 1954
Or other taxable year beginning . , 1954, and ending . , 195.-
Name _. .._. _.._. . ._ _._ _ . ._Address __... __ . .._._.. . . . . . . _. ..Location of farm or farms _. __ _._. .__ . ._._. .__Number of acres in each farm _.._ _ __._._..__._. _.. . _ _. _
1954II Your Accounts Are Kepi onthe Cash Method, Fill InPages 1 and 2.II You Keep Books on ailAccrual Method and Desireto Use This Form, Fill InPages 2 and 3 Instead.
FARM INCOME FOR TAXABLE PERIOD COMPUTED ON THE CASH RECEIPTS AND DISBURSEMENTS METHOD
(See Instructions on Schedule D (Form 1040) for tax treatment of certain livestock held for draft, breeding, or dairy purposes)
I. SALE OF LIVESTOCK RAISED 2. SALE OF PRODUCE RAISED 3. OTHER FARM INCOME
Kind Quantity Amount Kind Quanlily Amount Items Amount
Cattle .Horses .Mules .Sheep .Swine .Fur-bearing
animals .Chickens .Turkeys .Ducks .Goats .Bees .Other (specify):
-----.._-- $----------_. Grain $ _Hay _. • . _Cotton ._•• ._••• •• _Tobacco _. • ._. _Vegetables _ _Frui ts and nuts. _Dairy products. . _Eggs _Meat products. • . _Poul try, dressed . • _Wool . •__• _Honey •.. •• . _Sirup and sugar. __•• -__•__••.• .
Other (specify):
Mdse. rec'd for produce.. $ .. 'Machine work _Hire of teams . _Breeding fees .__. _Rent rec'd in crop shares . _Wood and lumber •• _Other forest products . _
Agricultural programpayments : _
Patronage dividends, rebates or refunds, ifnot reported elsewherein return __••• .__• ._
Other (specify):
-----------.-.-.---- ----------1------11------------··_-_··_---- ----------1------/1---·---------------·------------------1-----TOTAL $ ._. _
(Enter on line 1 of summary below)
TOTAL $ . ..__. _(Enler on line 2 of summary below)
4. SALE OF LIVESTOCK AND OTHER ITEMS PURCHASED
TOTAL. . . . . . . . . . . .. $ .__. _(Enler on line.3 of summary below) ,
I. Descriplion 2. Dale acquired. I I 5. Depreciation al· \6. Profil (column 3 plu.
3. Gross sales.proce 4 Cost or olher basis lowed (or allqwable) column 5 minus(contracl pllce)' s'"~:r~1q~:s;~1~or column 4)
---------·--------------------o----·-----~----------------------.- ------------------ $---.--.---.•------- $------------------ $------------------- $------------------
- ----- ------- ----. -----_. ----------- --- -- -- ~ ----- ------------ -- --- ----- --- ---------- - -- ------- ------ ----- ------- ------------- - ----- ------------- -- - - ---- -- -- ------------ t
--..-----..-..-----.-.---.-.------.-----.---.--.--...-------.-..-- ------------------ --------------------. ---------------.-.-.. _···_----_·_···----·-1-----TOTAL (enter on line 4 of summary below) $
SUMMARY OF INCOME AND DEDUCTIONS COMPUTED ON THE CASH RECEIPTS AND DISBURSEMENTS METHOD
1. Sale of livestock raised ............... $------------ ------16. Expenses (from page 2) ............... $______c_____ ------
2. Sale of produce raised ................ ----_...__...._- --....._- 7. Depreciation (from page 2) .........•.. ........_--_........--- ------3. Other farm income ................... -------------- 8. Other deductions (specify):4. Profit on sale of livestock and other ........--------------_.._---------------------_....------------- --_........_------- ----_...
items purchased .................... ------_ ..._-------- ..---_.._-------_.._---_....._-----_ ...----------S. GROSS PROFITS. .............. . $ 9. TOTAL DEDUCTIONS. . ........... $ -10. Net farm profit (or loss) (line 5 minus line 9) to be reported in Schedule C Summary, Form 1040 .. $
16 709~S-1

122 FACSIMILES OF TAX RETURNS FOR 1954
FARM EXPENSES FOR TAXABLE: YEAR (See Instructions)(Do not inclucle personal or living expenses or expenses not attributable to produclion ollarm income, such as taxes, insurance, repairs, elc., on your dwelling)
Page 2
I. lIems 2. Amount 3. ttems(Conlinued)
4. Amount(Continued)
Rent of farm, part of farm, or pasturage $ . ...__Freight, yardage, express, and trucking _Automobile upkeep (farm share) _
Amortization of grain storage facilities (at-tach statement) . _
Soil and water conservation expenses (at-tach statement showing computation) .. _
Other farm expenses (specify):
Labor hired $ ~__ .Feed purchased ._. _Seed and plants purchased ._. .__. _Machine hire .._._..Supplies purchased . . __Cost of repairs and maintenance ._.._. .__ ..Breeding fees __..__. ._._.. _Fertilizers and lime .. : _.. . ..__. __..Veterinary and medicine for livestock _.. .... .. ....._.... . ..... . . .._. . _. ... ._._...._
Gasoline, other fuel and oil for farm busi-ness -.- .._ -..- ..__ ..__. ._-- ..--.- .. ._.__
Storage and warehousing _._. . . . _. __._. . . __Taxes __ . ._.__._ . ._.._._ _ . __._._ ._._._. .
Insurance on property (except your dwell-ing) ---- . __ .. _.. _. .._.. ._._..__. .-- ..--- .. _.__
Interest on farm notes and mortgages _._._. . . _..__. ._ .._ _..__._. __. __
Water ~::::~:~~c~~~:sn:::~~h(:::~ron l~-~~-~-~~·~~~::;;-~~·~~;~-~(~~~~-:~~~~d)-:~·;~~~·;·:~~~~-;-'I(accrual method)) $
DEPRECIATION (See Instructions)
I. Kind ot property (il buildings,state material (If which conslrucled). Exclude land andolher nondepreciable properly
2. Daleacquired 3. Cost or Olhu basis 4. Dep,edalion allowed (or
. allowable) in prior years 5. Method 6. Rale (%)or lile (yea,s).
7. Depredalion forlhis year
_______________________. - __.._.____ $ . I$.._._ _ ._..__ .. .. . __ .. . $_. . _
-------------------------------- - --------- ------------------------ --------------------_ .. -- - -- ~- -------------------- - ---- ---------.----------- --~-------~---- ---------
-------------------------------- ---------- --~------------------ ---- ------------------------- ---------------_._------- ------------------------- ----- --------------------
::=::::::::::::::_::=::::::: :::::::::: ::::::::~::::::::::::::: ::::::::::::::_::::::::::::::::::::::::::::::::- ::::::_:::::=_::::::::I:::-:_:::::::::::::::::::----- ---------- ------------.-. - .----.-.-- --.---. --------------- - -- •• ---. --••-•• - •••----- - -- •••••• -. --- -- ----. --. -, -- ••- 00·- .---..- .•--."--., _1 . __. _
..-----------------------_.----- ---------. ----------------------_.- ---------------------_._. _. _. _._-_.--------_. ---_. ----------_.-------.-_... \_.- ._._---------._-.-----
i~~~~~~~~//~~~~~~~~~~: ~~~~~::~~: ~~~~~~~~~~;:~;:::~~~~ ~~~~:::~~:~/~~\~~~~~:~:::::::~~~~~~:~:: :~~~~:~~>:~:~:~~~l~::~+~:~:~~~:________________________________ - _~ ------ 0 ----- • ~ • _
--------------.-----.---.------. ---------. ---------.---------.--------------------.----...-- -----.--....--.--.------' ---------.---..-.--------t-------------------------~~~~~~~~~~~~~~~~~~~~~~~~~~~~~~~~ ~~~~~~~~~~ ~~~~~~~~~~~~~~~~~~~~~~~~~ ~~~~~~~~~~~~=~~~~~~~~~~~ ~~~~~~~~~~~~~~~~~~~~~~~~~ ~~~~~~~~~~~~~~~~~~~~~~~~~ ~~~~~~~~~~~~~~~~~~~~~~~~~-------------------------------- ---------- ------------------------- ------------------------- ------------------------- ------------------------- --------------- ..------~--_______________________________ - - __ - - ---------- 0 - _
1ti 'C9~..s 1

FACSIMILES OF TAX RETURNS FOR 1964
FARM INVENTORY FOR INCOME COMPUTED ON AN ACCRUAL METHOD(Do not Indude certain livestock held for draft. breeding. or C1alrr purposes. See ,Instructions on Schetlule D (lForm 11140}.)
Page 3
II
123·
On Hand at Beginning Purchased During Vear Raised During Vear. I Consumed or lost I Sold DUling Vear On Hand at End of VearOf~cripli(1n of Vear During Vear
(Kind of livestock, crops,
Qti~;-I Inventory valueor other products) Quan- Amount paid Quan- Inventory value Quan- Inventory value Quan- Amount received Quan- Inverotory valuetily lily tity tily lity
------------------------~------- $--------------- _.--.- $-------------- ----- $--------------- ------ $------------- -=. $------------- ------ $-------------
-------------------------- ------ ----------------- ------ ---------------- ------ ----------------- ------ ---------------- ------ ---------------- ------ --------------- I-------------------------- ------ ------------.---- ------ ---------------- ------ ----------------- ------ ----------------- ------ ----------------- ------ ----------------- I
~~~~~~~~~~~~~~~~~~~~~~=~ ~~~~~~ :~~~~~~~~~~~~~~~~ ~~~~~~ ~~~~~~~~~~~~=~~~ ~~~~~~ ~~~~~~~~~~~~~~~~~ ~~~~~~ [~~~~~~~~~~~~~~ ~~~~~~ ~~~~~~==~~~~~~~ ~~~~~~ ~~~~~~~~=~~~~= i-------------------------- ------ ---------------- ------ ---------------- ------ ----------------- ------ ----------------- ------ ------.---------- ------ ----------------- I
~~~~~~~~~~~~~~~~~~~~~~~~~: ~~~~~~ ~~~~~~~~~~~~~~~~~ ~~~~~~ ~~~~~~~~~~~~~~~~~ ~~~~~~ ~~~~~~~~~~~~~~~~~ ~~~~~~ ~~~~=~~~~=~~~~~ ~~~~~~ ~~~~~~~~~=~~~~~ ~~~~~~ ~~~~~=~=~~== I-----.---.---------------- ------ --------.------- ------ ----------------- ------ ----------------- ------ ---------------- ------ ----------------- ------ -------------- I
~~~~~~~~~~~~~~~~~~~~~~~~~I~~~~ ~~~~~~~~~~~~~~~~: ~~~~~~ ~~~~~~::~~:~~:~~~ ~:~~~: ~~~~~~~~=~~~~~~~ ~~~~~~ ~~:~~~~~:~~~~~~~ ~~~~:~ ~~~~~:~~~~=~~~~~ ~~~~~~ ~:~~~~~~==~~---I:::::~~:~~~~~~~~~~:~~~~~~~ ~~~~~~ ~~~~~~~~~~~~~~~~~ ~~~~~~ ~~~~~~~~~~~~~~~~l~~~~ ~~~~~~~~~~~~~~~~ ::~~~~ ~~~~=~~~~~~~~~ ~~~:~~ ~~~--~~~~~~~~~~~ ~~~~~~ ~~:~~~~:~~~~~~~::,----.-------------.------- ------ ---------------- ------ ----------------- ------ --.-------------- ------ ----------------- ------ ----------------- ------ ----------------- I
~~~~~~~~~~~~~~~~~~~~~~~~~~ ~~~~~~ ~~~~~~~~=~~=~~~ ~~~~~~ ~~~~~~~~::~~~~~~~ ~~~~:r~~~~~~~~~~::~~ ~~~~:~ ~~~~~~=~~~~~~~~~ ~~::~~ ~~==~~~~:~~~~~~ ~~~~~~ ~~~~~~~~~~~~~~~:
-------------------------- ------1----1TOTALS .... _ .•••. $ _
(Enter on line 4)$--~-----------(Enter on Ii ne 5)
$-------------- $--------------- $--_..._--------(En:er on line 2)
$---------------(Enler on line I)
SUMMARY OF INCOME AND DEDUCTIONS COMPUTED ON AN ACCRUJ:.L METHOD
1. Inventory of livestock, crops, and products at end ofyear ..•.............. _ ,.. _.
2. Sales of livestock, crops, and products during year ..la. Other miscellaneous receipts (specify):
$------------ ------ 7. Expenses (from page 2) .... $. _8. Depreciation (from page 2). ." _9. Other deductions (specify):
-------------------.---------------...--------------------------------------1-----1---/13. TOTAL ••• _ •••••. _ • _ •.•. _ •.. _ .•..•.......•. $ _
4. Inventory of livestock, crops, andEproducts at beginning of year .. _ . $__. ._._
S. Cost of livestock and products pur- [\_'_chased during year. . . . . . . . . . . . . . . 1 _
6. Gross profits (line 3 minus the sum of lines 4 and S}.. $--------------------------------------1----·1--
10. TOTAL DEDUCTIONS .. $' 1-'-_
11. Net farm profit (or loss) (line 6 minus line 10) to be reported in Schedule C Summary, Form 1040... $l(r-'lO~98 1
445a05 0 -51-9

124 FACSIMILES OF TAX RETURNS FOR 1954
INSTRUCTIONS Page 4Supplies purchased.-Cost of twine, spray material, poisons, dis
infectant, cans, barrels, baskets, egg cases, bags, and other similarfarm supplies purchased.
Cost of repairs and maintenance.-Amounts expended for repainand maintenance of farm buildings (except your dwelling), fences,drains, and other farm improvements, and for repairs and maintenance of farm machinery and equipment; cost of small tools ofshort life such as shovels, rakes, etc. Amounts expended for replace"ments of, or additions to, farm machinery, farm buildings, or otherfarm equipment of a permanent nature are not deductible.
Fertilizers and lime.-Cost of commercial fertilizers, lime, an4manure purchased during the year, the benefit of which is of shortduration.
Taxes.--State and local taxes. Do not deduct Federal incometaxes; estate, inheritance, legacy, succession, and gift taxes; nortaxes assessed for any improvement or betterment tending to increase the value of the property assessed. Do not deduct taxes onyour dwelling or household property and other personal taxes.
Insurance.-Cost of all insurance on farm buildings (except yourdwelling) and improvements, equipment, crops, and livestock.
Interest on farm notes and mortgages.-Interest paid on farmmortgages and other obligations incurred to carry on farming.
Water rent, electricity, and telephone.-The farm share of theseexpenditures. Do not deduct personal expenses.
Rent of farm, part of farm, or pasturage.-Rent paid in cash.A tenant farmer paying rent to his landlord in the form of cropsraised on the farm (under a cropshare agreement) may not deductas rent the value of the crop given to the landlord, but the tenantmay deduct all amounts paid by him in raising the crop.
Automobile upkeep.-For automobiles used exclusively in farmoperations, all expenses of operation, repair, and depreciation. Forautomobiles used both for farm and for personal transportation, onlythat part of the expense corresponding to the farm use may bededucted.
Soil and water conservation expenses.--See instructions to Form1040 for explanation of these expenses.
Other farm expenses.-Fees paid for advertising farm products;expenditures for stamps, stationery, account books, and other officesupplies purchased for farm use; expenditures for travel in connection with the farm and similar expenditures. Amounts expended forpurchase of automobiles, farm machinery, fann buildings, or otherfarm equipment of a permanent nature are not deductible.
Depreciation.-Allowance for depreciation of buildings, improvements, machinery, or other farm equipment of a permanent nature.In computing depreciation do not include the value of farm land northe land on which farm buildings are located. Do not deduct repairsor depreciation on the dwelling you occupy or on your personal orhousehold equipment. Do not claim as a separate item depreciationon livestock or any. other property included in your inventory.Depreciation, however, may be claimed on livestock acquired forwork, breeding, or dairy purposes which are not included in yourinventory of livestock purchased or raised for sale. See the instructions to Form 1040 for methods of computing depreciation.
Losses.-Losses of farm buildings, machinery, and other farmproperty not included in your inventory, resulting from fire, storm,or other casualty and not compensated for by insurance or otherwise.Losses of property included in your inventory are taken care of bythe reduced amount of the inventory at the close of the year. Thetotal loss of a prospective crop by frost, storm, flood, or fire, is notdeductible. When reporting on the cash basis, the value of animalsraised by you and lost by death is not deductible, while in the caseof animals purchased and lust by death, the cost less depreciationallowed or allowable is deductible.
Amortization.-If you elect the deduction with respect to theamortization of the adjusted basis of a grain storage facility, astatement of the pertinent facts should be filed with your election.(See section 169 of the Internal Revenue Code of 1954.)
Net operating loss deduetions.-Every fanner claiming a netoperating loss deduction shall file with his return a concise statementsetting forth the amount of the net operating loss deduction claimedand all material facts. The deduction should be entered in Schedule·C Summary, Form 1040, instead of on Form 1040F.
Fiscal year farmers.-If you report income on a fiscal year basisand your year ends after December 31, 1954, consult your localInternal Revenue Service office for the recent changes in the lawwhich affect your liability for self-employment tax.
u. S. GOVU...ltNT PRINTING O"'CE 16-70998-1
CASH RECEIPTS AND DISBURSEMENTS METHODA farmer reporting on the basis of cash receipts and disbursements
shall include in his gross income for the taxable year ( 1 ) the amountof cash or the value of merchandise or other property received fromthe sale of livestock and produce which were raised during the taxable year or prior years, (II) the profits from the sale of any livestockor other items which were purchased, and (3) gross income fromall other sources. The farm expenses will be the actual amounts paidout during the taxable year.
METHOD OF ACCOUNTINGFarmers may compute their income either on the cash receipts and
disbursements method or the accrual method, but whichever methodis adopted in filing their first return must be followed until theconsent of the Commissioner is received to change the method.
INCOMEAll the farm income from whatever source must be reported in this
schedule. Anything of value received instead of cash, such as groceries received in exchange for produce, must be treated as incometo the extent of its market value.
The value of farm produce consumed by the farmer and hisfamily need not be reported as income; but expenses incurred inI'aising such produce must not be claimed as deductions.
Recoveries for hail and fire insurance on growing crops shouldbe included in gross income.
Rents received in crop shares shall be reported in income in theyear in which the crop shares are reduced to money or the equivalent of money.
A taxpayer electing to include in gross income amounts receivedduring the year as loans from Commodity Credit Corporationshould file with his return a statement showing details of such loans.(See section 77 of the Internal Revenue Code of 1954.)
Report gains and losses from sales or exchanges of capital assetsand other property in separate Schedule D (Form 1040).
The term "farm" embraces the fann in' the ordinarily acceptedsense, and includes stock, dairy, poultry, fruit, truck farms, and allland used for farming operations. A person cultivating or operatinga farm for recreation or pleasure, the result of which is a continualloss from year to year, is not regarded as a farmer.
EXPENSES AND OTHER DEDUCTIONSIn general, a farmer who operates a fann for profit is entitled to
deduct from gross income as necessary expenses all amounts actuallyexpended in carrying on the business of farming, except those whichrepresent capital investment. The following is a list of such expenses(taken from the classification appearing on page II of this formthough any other equally descriptive classification may be used):
Labor hired.-Amounts paid for regular fann labor, piece work,contract labor, and other fonns of hired labor. Do not deduct thevalue of your own labor or that of your wife. Only that part of theboard which is purchased for hired labor should be deducted. Thevalue of products furnished by the farm and used in the board ofhired labor is not deductible. Rations purchased for laborers or sharecroppers are deductible. Do not deduct amounts paid to personsengaged in household work, except to the extent that the services ofsuch persons are used in boarding and otherwise caring for farmlaborers. Services of such employees engaged in caring for thefanner's own household are not deductible.
Feed purchased.-Cost of grain, hay, silage, mill feeds, other concentrates and roughages purchased, and amounts paid for grinding,mixing, and processing of feed.
Machine hire.-Amounts paid for threshing, combining, silofilling, baling, ginning, and other machine hire.
ACCRUAL METHODFor a farmer reporting on the accrual method, the gross profits
are obtained as indicated in summary of income and deductions onpage 3 of this form. The farm expenses will be the actual expensesincurred during the year, whether paid or not.
Farmers who compute income on an accrual method and useinventories, may value their inventories according to the "fann-pricemethod," which provides for the valuation of inventories at marketprice less direct cost of disposition. If the use of the "farm-pricemethod" of valuing inventories for any taxable year involves achange in method of valuing inventories from that employed in prioryears, pennission for such change shall first be secured from theCommissioner. Fanners raising livestock may value their inventoriesof animals according to either the "fann-price method" or the "unitlivestock price method."

FACSIMILES OF TAX RETURNS FOR 1954 125
Read instructions carefully.
IU. S. INDIVIDUAL INCOME TAX RETURN
I 1954Complete both sides of form.Please print. If you use this form, the Internal Revenue Service will compute your tax.
---~,
l~~~~,1. NAME I
f-Wzu Taxp~yer's Your Wife's (Husband's) i
,w- 2. WIFE'S (HUSBAND'S) NAME i::;:> 7. Social Se-I ~C';lf-~
, j
It III curity No. ;;~
1
~w 3. HOME ADDRESS (NUMBER AND STREET OR RURAL ROUTE) (a) ~:(b) e8. Wages ~ .. VI
w:J <: ' 0<DZ .. , ,}oW 9. Tax (a) ~ ~:(b)
, c:'CII::, ·ii.e IIt> (CITY, TOWN. OR POST OFFICE) (ZONE) (STATE) Withheld+-.. , ,
:Jw .. ,III It 10. Other (a) ,~ ~:(b) , r!!'.... I«..J ~
<:Vl
Iw< "---'- Income .~ : , "0Itz 4. (Check) o Single o Morried ,1'.50«;,or-' I'" ':::: '(b) I~UI-It
I Credit +- >.~' ,
t,
·w , - ,1Ilf- ------(a) <: 1
'z 5. Is this a joint return? DYes o No o ,(b) i,
:J_ 12. Exclusion~ ~:,
, : I« 6. Is wife (husband) filing separately? DYes o No List your exemptions on other side •0 • ,
'<;fI DECLARE UNDER THE PENALTIES OF PERJURY THAT THIS 15 A TRUE. CORRECT. (FOR USE OF INTERNAL REVENUE SERVICE) I
I~ AND COMPLETE RETURN TO THE BEST OF MY KNOWLEDGE AND BELIEF. C ,B
TAXPAYER'S SIGNATURE AND DATE IF JOINT RETURN. WIFE'S (HUSBAND'S) SIGNATURE,,
::;:TO - - - - - - - - - - - - - - - jR- - - - - - - - - - - - - --1It
0Ii.
: ..1
13. EXEMPTIONS FOR YOURSELF A:...:N=D---,-W:c.:.IF:..:E::....>.:(O:::.:.:R....:Hc.:..::.US=.:B:.:.Ac.:.N:...:=D..:..) I_ET.'.':X,~~~~~-
(a) For your own exemption, write the FIGURE 1 ..
(b) If you were 65 or over at the end of 1954, write the FIGURE 1 ..
(c) If taxpayer was blind at the end of 1954, write the FIGURE 1 ..
(d) If your wife (or husband) had no income in 1954, or if this is a joint return, write the FIGURE 1 for her (or his) exemption--", _'_
(e) If she (or he) is claimed as an exemption in (d) above and was 65 or over at the end of 1954, write the FIGURE 1 ..
~he (or he) is claimed as an exemption in (d) above and was blind at the end of 1954, write the FIGURE 1 )l- 1__
14 EXEMPTIONS FOR YOUR CHILDREN AND OTHER DEPENDENTS (List below)
Name (also give address if different from yours) I-~nsw~r ONLY for dependents othe~th~~ildren I• Enter Figure 1 in the last column to right for each name Relationship 01 dependent Amount YOU spent for
. have gross dependen!'s supporl. Amount <pen I by OTHERSlisted. ,"come of $600 If lOOo/, write "Ali" Including dependenl
Of more? 0.
~
~..~
~
I ~
15. Enter total number of exemptions listed in items 13 and 14 above. ~

126 FACSIMILES OF TAX RETURNS FOR 1954
FOR EMPLOVEES EARNING LESS THAN $5,000The enclosed card, Form 1040A, offers a simple way for employees receiving less than $5,000 totalincome to file their 1954 U. S. income tax returns.
To use this form:
Fill out the copy on other side for your records.
Transfer answers from your copy to card.
Read instructions below. Be sure you qualify. If you don't, obtain and file a Form 1040.
Sign the card and mail it, together with your withholding statements (Forms W-2), to yourDistrict Director in the envelope provided. The Internal Revenue Service will figure your taxand send you a check for any refund due you or a bill for any amount you owe.
iThe tax table shown below is only for your information. You do not use this table in preparing Form l040A. The Internal)Revenue Service will use the table to figure your tax. The table allows you about 10% of your income as deductions.
NOTE This 10% allowance takes the place of deductions which are allowed only if you itemize your deductions on Form 1040, such as thedeductions for charitable contributions, interest, taxes, losses, medical expenses, miscellaneous items, and the new deduction for childcare expenses. If your deductions exceed 10% of your income, it will be to your advantage to use Form 1040 and itemize them.
1234
GENERAL INSTRUCTIONS
Who Must File.-Every citizen or resident of theUnited States under 65 who had $600 ($1,200if 65 or over) or more gross income.
Who May Use U. S. Individuallnc:ome TaxReturn, Form I040A.-If your total gross income was less than $5,000 and consisted entirelyof wages reported on Withholding Statements(Forms W-2) and not more than $100 total ofother wages, dividends, and interest, you mayuse this form. A husband and wife may file ajoint return if their combined incomes do notexceed these limits. If you had income fromany other sources, you may not use this formbut must file your return on Form 1040. Likewise, Form 1040 must be used (1) in making aseparate return of a married person domiciled ina community property State, (2) if husband orwife itemizes deductions, (3) if you claim thestatus of head of household or surviving widowor widower, or (4) if you wish to claim credit fordividends received or retirement income.
When to FUe.-On or after January 1, 1955,but not later than April 15, 1955.
Where to File.-With the District Director ofInternal Revenue lor your district.
Where to Get Forms.-If you need a Form 1040you can get one from any Internal Revenueoffice, and from most banks and post offices.Your employer will furnish you with a Withholding Statement.
Married Couple-Advantage of Joint Return.-A husband and wife may make a jointreturn even though one has no income. To assure any benefits 01 the split-income provisions,they should file a joint return. Both husbandand wife must sign a joint return. A joint return on Form 1040A never results in more taxthan separate returns.
Sic:k Pay Exc:lusion.-If an employer continues to pay wages to"an employee under a wagecontinuation plan while the employee is absentfrom work due to injury or sickness, such payments may be excluded from the employee'sincome, but only to the extent they do not exce'eda weekly rate of $100. However, the exclusiondoes not apply to the first seven calendar days ofan absence due to sickness unless the employeeis hospitalized for at least one day during theperiod of sickness.
TAX TABLE INTERNAL REVENUE SERVICE WILL USE TO FIGURE YOUR TAX
II JOur total And the numbel 'lIl nemlllions Is-- llJ'llurtofal And the num~r of elemptions b-Incornei_ Income's- , , 3Al\dWODU
AndJll\l'~ And~u .re-.~
1,,, Sinaleor Sina1eur: ... Sinr'tflt: A • 0"
At lust But I",, 3
m.~ Atleart Bvtlena married
•~~~:d j ~:~~r: '~~ed! ~~~r:, 5 7 more
"," .."'""," filir.isepa- ::r~:; 1 j~~~fr ,~~j j ;:~~'rrately
-- Yflur Ialis- 'to\lrta_is-
$0 $675 $0 $0 $0 $0 $2, 325 $2, 350 $301 $181 $181 $61 $61 $0 $0 $0 $0 $0675 700 4 0 0 0 2, 350 2, 375 305 185 185 65 65 0 0 0 0 0700 725 8 0 0 0 2, 375 2, 400 310 190 190 70 70 0 0 0 0 0725 750 13 0 0 0 2, 400 2, 425 314 194 194 74 74 0 0 0 0 0750 775 17 0 0 0 2,425 2,450 319 199 199 79 79 0 0 0 0 0775 800 22 0 0 0 2, 450 2, 475 323 203 203 83 83 0 0 0 0 0800 825 26 0 0 0 2, 475 2, 500 328 208 208 SS 88 0 0 0 0 0825 850 31 0 0 0 2,500 2.525 332 212 212 92 92 0 0 0 0 0850 875 35 0 0 0 2,525 2.550 337 217 217 97 97 0 0 0 0 0875 900 40 0 0 0 2, 550 2, 575 341 221 221 101 101 0 0 0 0 0900 925 44 0 0 0 2, 575 2,600 346 226 226 106 106 0 0 0 0 0925 950 49 0 0 0 2, 600 2,625 350 230 230 110 110 0 0 0 0 0950 975 53 0 0 0 2, 625 2, 650 355 235 235 115 115 0 0 0 0 0975 1,000 58 0 0 0 2, 650 2,675 359 239 239 119 119 0 0 0 0 0
1,000 1.025 62 0 0 0 2, 675 2, 700 364 244 244 124 124 4 0 0 0 01,025 1,050 67 0 0 0 2, 700 2, 725 368 248 248 128 128 8 0 0 0 01,050 1.075 71 0 0 0 2,725 2, 750 373 253 253 133 133 13 0 0 0 01,075 1.100 76 0 0 0 2, 750 2, 775 377 257 257 137 137 17 0 0 0 01.100 1.125 80 0 0 0 2, 775 2, 800 382 262 262 142 142 22 0 0 0 01,125 1,150 85 0 0 '0 2,800 2, 825 386 266 266 146 146 26 0 0 0 01, ISO- 1.175 89 0 0 0 2,825 2,850 391 271 271 151 151 31 0 0 0 01,175 1,200 94 0 0 0 2, 850 2, 875 395 275 275 155 155 35 0 0 0 01,_ 1,225 98 0 0 0 2, 875 2,900 400 280 280 160 160 40 0 0 0 01.225 1.250 103 0 0 0 2, 900 2, 925 405 284 284 164 164 44 0 0 0 01.250 1,275 107 0 0 0 2, 925 2, 950 410 289 289 169 169 49 0 0 0 01,275 1,300 112 0 0 0 2, 950 2, 975 415 293 293 173 173 53 0 0 0 01.300 1.325 116 0 0 0 2,975 3, 000 420 298 298 178 178 58 0 0 0 01.325 1,350 121 1 0 0 3, 000 3, 050 427 305 305 185 185 65 0 0 0 01,350 1.375 125 5 0 0 3, 050 3, 100 437 314 314 194 194 74 0 0 0 01.375 1.400 130 10 0 0 3.100 3, 150 447 323 323 203 203 83 0 0 0 01.400 1,425 184 14 0 0 3, 150 3,fOO 457 332 332 212 212 92 0 0 0 01.425 1.450 139 19 0 0 3, 200 3, 260 467 341 341 221 221 101 0 0 0 01,450 1.475 143 23 0 0 3.250 3,300 476 350 350 230 230 110 0 0 0 01,475 1.500 148 28 0 0 3.300 3,350 486 359 359 239 239 119 0 0 0 01,500 1.525 152 32 0 0 3, 350 3,400 496 368 368 248 248 128 8 0 0 01.525 1.550 157 37 0 0 3, 400 3.450 506 377 377 257 257 137 17 0 0 01.550 1,575 161 41 0 0 3, 45& 3, 500 516 386 386 266 266 146 26 0 0 01,575 1.600 166 46 0 0 3,500 3, 550 526 395 395 275 275 155 35 0 0 01.600 1,625 170 50 0 0 3,550 3, 600 536 404 404 284 284 164 44 0 0 01.625 1.650 175 55 0 0 3,600 3,650 546 414 413 293 293 173 53 0 0 01,650 1,675 179 59 0 0 3,650 3, 700 556 424 422 302 302 182 62 0 0 01.675 1,700 184 64 0 0 3, 700 3, 750 566 43-l 43' 311 311 191 71 0 0 01.700 1,725 ISS 68 0 0 3, 750 3, 800 575 443 440 320 320 200 80 0 0 01.725 1.750 193 73 0 0 3.800 3,850 585 453 449 329 329 209 89 0 0 01,750 1,775 197 77 0 0 3,850 3,900 595 463 458 338 338 218 98 0 0 01.775 1. BOO 202 82 0 0 3, 900 3,950 605 473 467 347 347 227 107 0 0 0I,BOO 1,825 206 86 0 0 3, 950 4.000 615 483 476 356 356 236 116 0 0 01.825 1.850 211 91 0 0 4,000 4,050 625 493 485 365 365 245 125 5 0 01,850 1.875 215 95 0 0 4,050: 4,100 635 503 494 374 374 254 134 14 0 01,875 1.900 220 100 0 0 4.100 4,1SO 645 513 S03 383 383 263 143 23 0 01.900 1,925 224 104 0 0 4.150 4,200 655 523 512 392 392 272 152 32 0 01,9%5 1.950 229 109 0 0 4.200 4,250 665 533 521 401 401 281 161 41 0 01,950 ,1,975 233 113 .0 0' 4.250, 4.300 674 .542 530 410 410 290 170 50 ,0 .01.975 2,000 238 118 0 0 4.300 4,350 6B4 552 539 420 419 299 179 59 0 02,000 2,025 242 122 2 0 4•.350 4, 400 694 562 548 430 428 308 ISS 68 0 02, 025 2, 050 247 127 7 0 4,400 4.450 704 572 557 440 437 317 197 77 0 02, 050 2, 075 251 131 11 0 4.450 4.500 714 582 566 450 446 326 206 86 .0 02,075 2, 100 256 136 16 0 4.500 4.550 724 592 575 460 455 335 215 95 0 02, 100 2, 125 260 140 20 0 4.550 4._ 734 602 584 470 464 344 224 104 0 02,125 2, 150 265 145 25 0 4._ 4,650 744 612 593 480 473 353 233 113 0 02, 150 2, 175 269 149 29 0 4.650 4, 700 754 622 602 490 482 362 242 122 2 02, 175 2, 200 274 154 34 0 4.700 4,750 764 632. 611 500 491 371 251 131 11 02, 200 2,225 278 158 38 0 4,750 4.800 773 641 620 509 500 380 260 140 20 02,225 2, 250 283 163 43 0 4, BOO 4,_ 783 651 629 519 509 389 269 149 29 02, 250 2, 275 287 167 47 0 4.850 4.900 793 661 638 529 518 398 278 158 38 02, 275 2,300 292 172 52 0 4.900 4, 950 803 671 647 539 527 407 287 167 47 02,:100 2,325 296 176 56 0 4,950 5,000 813 681 656 549 536 416 296 176 56 0
For.rn lOtOA InstrucUODB16-707<2-1

FACSIMILES OF TAX RETURNS FOR 1954 127
INSTRUCTIONS I'OR mONT 01' I'ORM l040A
Item 7.-Enter your social security number and your wife's (husband's) social security number, if any, even though she (he) filesa separate return.Items 8 _d 9.-Enter the total amount of your wages subject toincome tax and the total amount of income tax withheld as shown onyour Withholding Statements, Forms W-2.Item lO.-Enter all other taxable income from wages, dividends, orinterest. Exclude dividends received from corporations in theUnited States up to $50. This exclusion does not apply to dividendsreceived from mutual savings banks or building and loan associations. If joint return and both husband and wife had dividendincome, each is entitled to a $50 exclusion provided it is appliedagainst his individual dividend income. If the sum of items 10 (a)and 10 (b) exceeds $100, you must file a Form 1040.Item ll.-If more than $72 of F.I.C.A. (Social Security) employeetax was withheld during 1954 because you worked for more thanone employer, enter the excess, and it will be credited against yourIncome tax. Figure separately for husband and wife.Item 12.-See "Sick Pay Exclusion" in general instructions. Ifyou received such payments and your employer has not excludedthem from the amount of wages shown on your withholding state·ment (Form W-2), enter your exclusicn here. Enclose a state·ment showing your computation and your name and address.Items 8(b) to 12(b).-Complete these items only if this is a jointreturn. The signatures of both taxpayer and his wife (or husband)are required on joint returns.
INSTRUCTIONS I'OR BACK 01' I'ORM 1040AItems 13(a) to (fl.-Fill out these items to receive credit for yoUrexemptions and those of your wife (or husband). Marital stahl.s,age, and blindness must be determined as of December 31, 1954,except that if the wife or husband of the taxpayer died during theyear, the determination is made as of the date of death.!Item 14.-Fill in this schedule to receive credit for your children,stepchildren, and other dependents. Each dependent must meetall of the following tests:
a. Received more than one-half of his or her support from you (orfrom wife or husband if this is a joint return).
b. Received less than $600 gross income. (This test does lI.otapply to your children or stepchildren who are under 19 or who arestudents.) ,
c. Did not file a joint return with her husband (or his wife). I
d. Was either a citizen, or resident of the United States or a resi·dent of Canada, Mexico, the Republic of Panama or the Canal Zone.
e. Either (1) had as his principal place of abode your home aildwas a member of your household; OR (2) was related to you (odohusband or wife if this is a joint return) in one of the following ways:Child Sister Mother-in-law The following' ifStepchild Grandchild Father-in·law related by bloOd:Mother Stepbrother Brother·in·law Uncle iFather Stepsister Sister·in-law Aunt I
Grandparent Stepmother Son·in-law Nephew IBrother Stepfather Daughter-in·law Niece
FRONT YOUR COpy
Read instructions carefully.Complete both sides of form.Please print.
U. S. INDIVIDUAL INCOME TAX RETURNII you use this form, the Internal Revenue Service will compute your tax. 11954!-Ill II 1. Name I§~ 2. Wife's (Husband's) Name ~ Taxpayer', IYour Wife', (Husband',) i""0: 7. Social $e. (a) (b) lJ 001
l;;1ll1ll .-. I~~.. curityNo.7"" ~
~ III 3. Home Addres, (Number and Street or Rural Route) (a) ---.: (b) ~V)~ ~ 1 c::-__---::-_-=_----: ----:c::-----: ----:-:- I-"'8=--....W=--a::;g""e::''---_..-._I..-;,.-______ c : l);:e>~ 1- 9. Tax (a) ~ ; (b) I c1'Cl:::o:~ (City, Town, or Po,t Office) (Zone) (State) Withheld. i·; 'ii~ I
~ 0: 10. Other (a) .~ ..1(b) Il'~ !~~ 1--------------------------1 Income. '.. ' GlO I
~~ 4. (Check) 0 Single 0 Married 111. Special (a) ~ !'(b) ~d ICr d· >..' 0.,
ui~ e It i: : c~
:i?; 5.'s this a joint return? 0 Yes 0 No I (a) 0 : (b) 0--------12. Exclilsion..-. ---.: CI
<o 6. Is wife (husband) filing separately? 0 Yes 0 No • list your exemptions on other side.~ 1o I declare under the penalties of perjury that this is a true, correct, and complete return (FOR USE OF INTERNAL. REVENUE SERVICE)
to the best of my knowledge and belief.
Taxpayer', Signature and Date III joint reIurn, Wife's (Husband's) Signatureand Date
BACK YOUR COpyI
13. EXEMPTIONS FOR YOURSELF AND WIFE (OR HUSBAND)I EXEMp-
TIONS
(a) For your own exemption, write the FIGURE 1 =-I
--(b) II you were 65 or over at the end of 1954, write the FIGURE 1 .. --(c) If taxpayer was blind at the end of 1954, write the FIGURE 1 =- --(d) II your wife (or husband) had no income in 1954, or if this is a joint return, write the FIGURE 1 for her (or his) exemption--" --(e) II she (or he) i, claimed as an exemption in (d) above and was 65 or over at the end of 1954, write the FIGURE 1 .. 1-: -(I) II she (or he) i, claimed as an exemption in (d) above and was blind at the end of 1954, write the FIGURE 1 =-
14. EXEMPTIONS FOR YOUR CHILDREN AND OTHER DEPENDENTS (List below)
Name (also give address if different from yours) Answer ONLY for dependents other than children
• Enter Figure 1 in the last column to right for each name Relationship Old dependenl I Amounl YOU spenl lor Amounl spenl by OTHERShave grossincome 01 ;600 dependenl's support. including dependenllisted.
Of more? If 100%, wrile "All"
I \E II,
--;-...I
--..-.-'--...
_.,. --15. Enter fatal number of exemptions listed In items 13 and 14 abave. =-


INDEX
B
c
iCapital gains and losses--Continued ,page
Net short-term capital gain or loss ..• 5, 25-26, 28,69-70
Returns with alternative tax •••.•••.•. 5, 24-26, 29,56-58, 70
Returns with net gain from sales of capital . :assets ••••.......• 6, 8, 25-26, 28, 34-35, 37; 41,
45, 52, 69-71Returns with net loss from sales of capital' i
assets ....•••••.•• 6, 8, 25-26,28,34-35,37,41,45, 52, 69-71
Returns with normal tax and surtax ••••..• 24, 28-29,56-58, 90
Short-term, definition of................... I 26Synopsis of Federal tax laws affecting...... I 91
Casualty losses ....•..•.••••.•. 7, 27, 29, 34-35, 48, 84Characteristics of the year..................... 5Charts.......................................... 7-8Child care 7, 9, 27, 34-35, 48, 84Citizens and resident aliens.................... 9,28Classifications of individual returns........... 23-24Community property income •••.•.••...••.•.••••••• 10,24Comparative data, 1953 and 1954. (See also .
Historical data.)............................. I 5Computation of tax •••. 6, 10, 15,17, 23-24, 28-29, 89-91Contributions, charitable: i
Amount deducted •.•• 6, 9, 15, 26, 34-35,48, 55, 84Exceeding 20% limitation .••.•..•.••....••. 6, l{, 27Under 10% limitation........................ l~, 27Under 20% limitation 9, 15, 27
Credit on 1955 estimated tax ..•.•....•... 30, 39, 4j, 47iJ
D !Declaration of estimated tax.................... 5,30Deductions:
Child care 7, 9, 27, 34-35, 48, 84Contributions ..•. 6, 9, 15, 26-27, 34-35, 48, 55, 84Expenses as outside salesman ....••....• 9-10, 25, 28Gifts 6, 9, 15Interest paid •......••.•.•• 6, 26-27, 34, 48, 55,84Itemized ..•.•••.... 5-6,8,10-11,23, 25-27, 33-34,
48, 55, 63, 79, 84Losses from fire, storm, other casualty, ~
theft ..•..••...•..•....•..•.• 7, 27, 29, 34-35, 48Medical and dental expenses (including drug I
costs) .•..... 6-7, 9, 16-17, 27, 34-35, 48, 55,84Net operating loss ••••.. 6, 8, 25-26, 29, 34-351 37,
41, 45, 79, 81Nonbusiness .••.......•.•• 5,8,10,26-27,34-35, 55Other ........•.•..•.••••.•. ; . . . . •. 9, 27, 34, 48, 84Sick-pay exclusions .....•...•..•. 6,9-10,12,24-25Standard ..• ,.: ....•..•. 6, 10-11, 23, 28, 34, 61, 79Taxes ..•........•...•......• , • . . • . • . . .• •• •. . 6, 27Total •••.•••.... : ..........•..... 11, 34,48, 79, 84Transportation expenses not reimbursed .•...• 9,10,
. . 25, 28Deficit, adjusted gross .••• 5, 28, 33-35, 38, 75, 79, 81Dependents:
Defined .........•... ~ .•..•.•....• 8-9, 24, 27-28, 89Students ...' . . . . . . . . . . . .. . . . . . . . . . . • . . . . . • • • . . 9, 28Test for determinih'g .... .'. • . • . . . . . . . . . • . • . . • 9, 28
, • ~. I
3328267010
34-35,79, 8158, 80
A PageAccounting period •••....•......•.•.......••••. 10, 90-91Adjusted gross deficit •..•. 5, 28, 33-35, 38, 75, 79, 81Adjusted gross income:
Amount ..•.......• 5-6, 11, 24-28, 33-35, 38, 42, 46,48, 58-64, 71-86
By marital status ..•...•.. 5, 8, 9-11, 23, 27, 59-68By States and Territories ..•.•••..•••. 24, 71-74, 76Classes ...•......... 12-19, 21-23, 33, 35-54, 58-70,
72-75, 80, 82-83Composi tion. . . •.... . .. . • •.• • . •.• • • • • •...• • . . . . . • . . 8Definition of 6, 9, 28For returns with alternative tax ..••. 5, 24, 26, 29,
56-58, 70For returns with itemized deductions ...•.•.• 5-6, 8,
10-11, 23, 25-28, 33-34,48, 54-55, 63, 79, 84
For returns with self-employment tax .• 5-6, 9, 23-24Groups •••.•...•.........•.........•....••... 7-8, 10Percentage distribution .•...•........•.•..•• 7-8, 33Sources. • . . . . . . . • . . . . . . . . . •. 23-26, 33-47, 79, 81-83
Aggregated and simple distributions of number ofreturns, adjusted gross income, and tax lia-bility .•••.•••......••••••... " .••...••..•••..
Aliens ....•.•.• , . . . . . . •. . . .. .• .. . . •• . . . . • . . . . . . . 9,Alimony and separate maintenance payments....... 9,Alternative tax ...•••.....•...•. 5,24-26,29, 56-58,Amended returns ....•.•...•.....•.•..•...........Annuities and pensions 6, 8-9, 17, 19, 26,
37, 41, 45, 53,Average tax ........•••.•....•...•.....•.•...••..
Business or profession:Deductible expenses.... .••.••••... .•.•.. .•.. 25-28Income. • • • • . . . . . • • . • . . • . . . • • • • • . . . . • . . . .. 6, 8-9, 27Net profit or net loss ...•..• 25, 34-36, 40, 44, 51,
71, 79, 81, 83
Capital assets:Long-term. . • . •• . . . . . . . . . . . •. . . • . . • . •• • .•• . •• 26, 69Net gain and/or net loss from sales .••. 6, 8, 25-26,
28, 34-35, 37, 41, 45, 52, 69-71Short-term.... '" . •. •. . . . . • . • . .• . ••. • . . . •. .. 26, 69
Capital gains and losses:Capital loss carryover ......••..•.••.••. 25-26, 69-70Description " ...••.•.•.. : ...•• " . . . 25-26Excess of net long-term capital gain over
net short-term capital loss .......•..••.• 5,. 25-26,28-29, 70
Fiduciary income inclusion of............... 25-26Long-term, definition of.................... 26Net gain or loss from sales of capital
assets •••.••••..•. 6', 8, 25-26, 28, 34-35, 37, 41,. 45, 52, 69-71
Net long-term capital' gain or loss •••. 5, 25-26, 28,69-70
129
I
I

130 INDEX
E
Page
JJoint returns of husbands and wives •••.••• 6, 10-13,15,
23, 27-28, 36-43, 56, 59,61, 63, 65-66, 89-90
I
8,· 17-18, 2828-29, 56-58,
90-91Period of time covered ••...••..••..•..•.•.• 8, 90-91
Insurance as reimbursement of medical expenses.. 1726-27
Interest from tax-free covenant bonds. (Seealso Tax paid at source.)..................... 29
Interest paid ....•.••..•...•••. 6,26-27,34,48, 55, 84Interest received ••.•...••. 6,25-26,29,34-36,40,44,
50, 71, 79, 81Internal Revenue Code of 1954 .••.• III, 8-10, 12, 15-16,
24, 26, 28, 89-91Introduction. . •• •• ••• . .. • . •••. •• •••• •. • . •. •.•• .• 1Itemized deductions:
Explanation of ••...•••••..•••.•••••.•.•••• 23, 26-27Nonbusiness •........•....•.. 5, 8,10, 26-27, 48, 55Returns with ••.•.•.••.•• 6, 10-11, 33-34,48, 54, 63
Income. (See Adjusted gross, Gross, Other,Sources of, Taxable.)
Income earned over period of years ....•••...••.• 8-9, 17Income from estates and trusts (fiduciaries).... 6, 8,
13, 25-26, 34-35, 38,42, 46, 54, 79,81
Income tax before credits •..••••••••••••. 29,42,46,49Income tax laws. (See also Internal Revenue
Code of 1954.)................................ 87-92Income tax liability .••• 5, 7, 9-10, 29, 33, 39, 43, 47,'
49, 56-64, 71-74, 79-80, 86Income tax liability after credits •••••• 29, 33, 39, 43,
47, 49, 56-64, 71-74, 79-80, 86Income taxes paid to foreign countries and
United States possessions ..•. 5, 8, 12, 29,43, 47, 49Individual income tax provisions for 1954:
Gross income, 65 and older...•..•.•..•Income tax rates .•••..... 5, 8, 10-11,
Page21-23
589
6, 8,79-815, 30
94-12787-91
89, 9110, 2947, 4995-127
40, 44,50,71
Credit for ........••.. 5-6,8-10,12-15,29,38,42,46, 49, 56-57
Eligible for exclusion .••..•••.•.•••.•. 13-14, 25-26Foreign and domestic ••. -•••••••••••••••. " .,. 25, 29Total ..••••••••...••• 5-6, 8, 10, 13-15, 38, 42, 46,
49, 56-57, 79, 81
27-28, 65,67, 87
Amount of •••••••••••• 9-12, 26-28, 36-44,46-47,49,59-'64, 89
Marital status •••.•.•••••••• 5, 10-12, 23, 27-28, 89Number 11-12, 27-29, 65-68, 89Other than age and/or blindness ••••••• 24-25, 27-28,
65-68, 89Per capita 5, 12, 24, 27-28, 89Personal 8-12, 27-28, 89
Expenses as outside salesman..•.••••••••.•. 9-10, 25, 28Explanation of classifications and terms........ 23-27
.FFacsimiles of income tax returns .•••.•••.•••••••Federal tax laws, synopsis of •....••.•••••••••••Filing requirements •••••••••••.••••••.••...••.••Fiscal year returns ••••••••••••.•••••••••••••••.Foreign tax credit .•••••••.•••• 5, 8,13,29,43,Forms (1040 and 1040A) ••• 1, 10-14, 21-26, 28-30,
Effective tax rates. (See also Tax rates.) ••.•.Employee's death benefits .........•.•.••••.•••.•Estates and trusts, income and/or loss from••..•
25-26, 34-35, 38, 42, 46, 54,Estimated tax ••••••••....••...••....••..•.•••.•.Exemptions:
Age and/or blindness ••.. 8, 11-12, 17-19,
Description of sample and limitations of data .••Dividends received:
After exclusions •••••• 10, 14, 25-26, 35-36,
269, 15
6, 8-928, 89
87-929
Laws, synopsis of Federal tax ..•.•..••...•.•.•••Life insurance ••..•••.•.•.••••••••.••••...••••••Long-form returns. (See Forms.)Long-term capital assets ••••••••..••..•.•••...•• 26, 69Long-term capital gain or loss, net ••••.•.•••. 5, 25-26,
28-29, 70Losses, casualty ..••••••••..••• 7, 27, 29, 34-35, 48, 84
MMajor characteristics of 1954................... 5Marital status .•......•.••.•• 5, 8-11, 23, 27, 59-68, 89Married persons:
Deductions. . • . . • • • . • • • • • • • • • • • . • • • • . . . • . • • • • 9-12Returns of .••.•••.• 9-12, 17, 23-24, 27, 56, 59, 61,
63, 65, 67-68, 89-90Tabulation of returns for................... 11
Maximum rate limitation•••••••••..••••..•••••••• 28,90Medical and dental expenses:
Cost of medicine and drugs •••..••.••.•• 9, 16-17, 27Deductions for 6-7, 9, 16-17, 27, 34-35Insurance compensation for ••••..•••••••••• 17, 26-27Total. •••••.•••.•• 6-7, 9, 16-17, 27, 35, 48, 55, 84
Methods of taxpayment........................... 5-6
NNet capital gain or loss. (See Capital gains
and losses.)Net deficit. (See Adjusted gross deficit.)
L
79-8090-91
79
HHeads of household ••••••• 5, 9-12, 23-24, 27-28, 57, 60,
62-64, 67, 89-90(See "Statistics ofHistorical data, 1913-1944.
Income for 1950, Part 1.")Historical data, 1945-1954: ~
Adjusted gross deficit ....... ;.............. 79, 81Adjusted gross income....................... 79-86Adjusted gross income classes •••••••••• 79-80, 82-83Average income tax per taxable return....... 80Deduct ions. • • . • • • • • • • • • • • • • • • • • • • . . • • • . . . • • • 79, 84Effective income tax ra~e................... 90Laws, synopsis of Federal tax............... 89-91Losses. • • . • • • • • • • • • • • • • . • • • • • • . • • • • • • • • • • • • • 79, 81Nontaxable returns.......................... 79Number of returns......................... 79-80, 85Sources of income......................... 79, 81-83States and Territories...................... 85-86Tax liability (income and self-employment
tax) •••••••••••..•••.••••••••••••••••.••••Tax rates (1944-1954) •••••••.•••••••••••••••Taxable returns •••.•••••••••••••••••••••••••
Husbands, returns of. (See also Married personsand Marital status.) •• 9-12, 27, 59, 61, 63, 65-66, 89
G
Gambling losses and profits •••••.•.•••••••.••••.Gifts ••••.••••••.•••...••••..•...•..••....••••. 6,Gross income: (See also Adjusted gross income.)
Exclusions from ••.•••.••••••.•••••.••••••••.Requirements for filing .•.•••..•••••••••••••

INDEX!
131
S
Salaries and wages •••••••••• 6,8, 10, 12,24-25, 29-30,34-36, 40, 44, 50, 71,$
Sales of capital assets, net gain or net loss... 6, S,25-26, 28, 34-35, 37, 41, 45,
52, 69-71, 79, 81Sales of property other than capital assets, net ,
gain or net loss ••••••••• 6,8,28,34-35,37,41,41'52, 79, tl1
Sample, 'description of. ••.•• • .•••••• .••••••• •••• 21-22Scholarship and fellowship grants............... '9Self-employment tax .•••••••••• 5-6, 9, 23-24, 29, 75-7G,
79, 91Separate returns of husbands and wives •••••••• 9-12, 16,
23-24, 27, 56, 59, 61, 63,66, 89-90
Page6, 25,81, 8381, 83
2~43, 47
RReceipts, total, from business or profession•.••
34-36, 71,Receipts, tota~from partnership •.. 6, 34-36, 71,Recovery of bad debts •.•.•.........•....•...•.•.Refunds. . .. . .. . . . . . . . . • . • . .. • . •• 5-6, 28, 30, 39,Rents and royalties:
Deductions for••..•..........•..•..... ;..... 28-29Definition of.. . . . . . . • . . . . . . . . . . • . . . . . • . . . . . 26Interest relating to........................ 27Net profit or net loss from ••.• 6, 8, 26, 34-35, 37~
41, 45, 53, 71, 79, 81, 83Requirements for filing......................... 89, 91Resident aliens................................. 9, 28Retirement income and credit ••.•• 5,7-8,10, 17-19, 29~
38, 42, 46, 49, 50Returns from which data were tabulated •••.....•• 1,9-10Returns, method of, taxpayment used.............. 5~6
Revenue Acts amending Code...................... 89-91Rewards. (See Prizes and awards.) I
Royalties, rents and .•.....• 6,8,26-29,34-35, 37, 4~,45, 53, 71, 79, 81, 83
Short-form returns. (See Forms.)Short-term capital assets •.••.•••••••••••••.•••• 26,69Short-term capital gain or loss, net •••••••• 5-6,24-26,
28-29, 69-10Sick pay exclusions ••.•.•••••••••••.. 6, 9-10, 12, 24-?5Simple and aggregated distributions of number
of returns, adjusted gross income, and taxliability '.................... 33
Single persons, returns of •••• 9, 11-12, 27, 56, 60, 6f,64, 68, 89-90
Size of deduction............................... 23, 55Size of source................................ 23, 50-54Sole proprietors. (See also Business or pro-
fession.) •••••••••••• " •••••.•• '. • • • • . • • • • • • • • • 9, 21
' 5Sources of income or loss comprising adjusted
gross income ••••..•••••••••••• 23-24, 34-47, 79, 81-83Split-income rate •••.•••••••••••••••••••••• 5, 9, 11,28Standard deduction••••••••• 6, 10-11, 23, 28, 34, 61,75State and local taxes........................... 6State and municipal bonds....................... I 6States and Territories ••••••••••••• 24, 71-74, 76, 85~86Summary, general. (See Major characteristics.) I
Surtax:Amount of................................... 56-57Defined .•••• '. • • • • • • • • • • • • . • • • • • • • • . • • • • • • • • . 29. 'Percent limitation of taxable income........ :90Rates 8, 24, 28-29, '58Returns with................................ 56-58
Surtax net income. (See Taxable income.)SUrviving spouse••.••••••••• 9-12, 23-24, 27-28, 56, 60,
62, 64, 67-68, 89~90
Sweepstake winnings............................. i26Synopsis of tax laws for individual income...... 87~92
PageNet gain and/or loss from sales of capital
assets ...•••.•..•. 6, 8, 25-26, 28, 34-35, 37, 41, 45,52, 69-71, 79, 81
Net gain and/or loss from sales of propertyother than capital assets ...••....•.•..••.• 26, 79, 81
Net income. (See Taxable income.)Net operating loss deduction ••••• 6-8, 25-26, 29, 34-35,
37, 41, 45, 79, 81Net profit or loss from business or profession.. 25,
34-36, 40, 44, 51, 71, 79, 81, 83Net profit or loss from partnerships ••••.. 6, 25, 34-36,
40, 44, 51, 71, 79, 81, 83Net profit or loss from rents and royalties..... 6, 8,
26, 34-35, 37, 41, 45,53, 71, 79, 81, 83
No adjusted gross income (deficit), returns with 5, 23,33, 36-55, 59-69, 75, 77, 81-84
Nonbusiness deductions •..•.•• 5,8,10,26-27,34-35, 55Nontaxable and taxable returns combined 5,11-15,
18-19, 33-57, 59-69, 71-74, 79Nontaxable returns .•....•••• 5, 10-12, 23, 33-57, 59-69,
71-74, 79Normal tax...................................... 8, 90Normal tax and surtax •.........• 8, 24, 28-29, 56-58, 90Normal tax net income. (See Taxable income.)Number of exemptions •........•.• 11-12, 27-29, 65-68, 89Number of exemptions classes ..••.........• 24, 65-68, 89Number of returns. (See the specific classifi-
cations of interest.)Number of returns filed •......•.•.•.• 5-7, 11, 21, 33-36
oOperating loss deduction, net •••. 6-8, 25-26, 29, 34-35,
37, 41, 45, 79, 81Optional return, Form 1040A••.....• 1, 10-11,21-26,28,
125-127Optional standard deduction. (See also Standard
deduction.) ..........................••• 10, 23-24, 28Optional tax 5, 10, 24, 28-29Other deductions 9, 27,.34, 48, 84Other sources of income •..•......• 8, 14,26,34-35,38,
42, 46, 79, 81Other "Statistics of Income" Publications for
1954.......................................... IVOverpayment (refund, or credit on 1954 estimated
tax) 5-6, 30, 39, 43, 47
p
Partially tax-exempt interest credit ••• 5, 8, 25-26, 29,39, 43, 47, 49
Part year returns............................... 10, 29Partnerships:
Deductible expenses......................... 25Dividends received.......................... 6, 25Net profit or net loss •...•.•. 6,25,34-36,40,44,
51, 79, 81, 83Payments on 1954 declaration of tax ••••.. 30,39,43,79Pensions. (See Annuities and pensions.)Percentage distribution of number of returris,
adjusted gross income, and tax liability.. • • • • 33Percentage increase or decrease in number of
returns, income, deficit, and taxes: 1954 and1953•.•....••..•..••.•.......... '" . .•. . • .. •. • 5
Personal exemptions............................. 9-11Prior years, compensation for ••......•.•.•• 25-26,69-70Prizes and awards... . • • • • • • . . . . . . . • • • • • • . • • • • . .• 8-9, 26Property ether than capital assets, sales of •• 6, 8, 28,
34-35, 37, 41, 45, 52, 79, 81
/
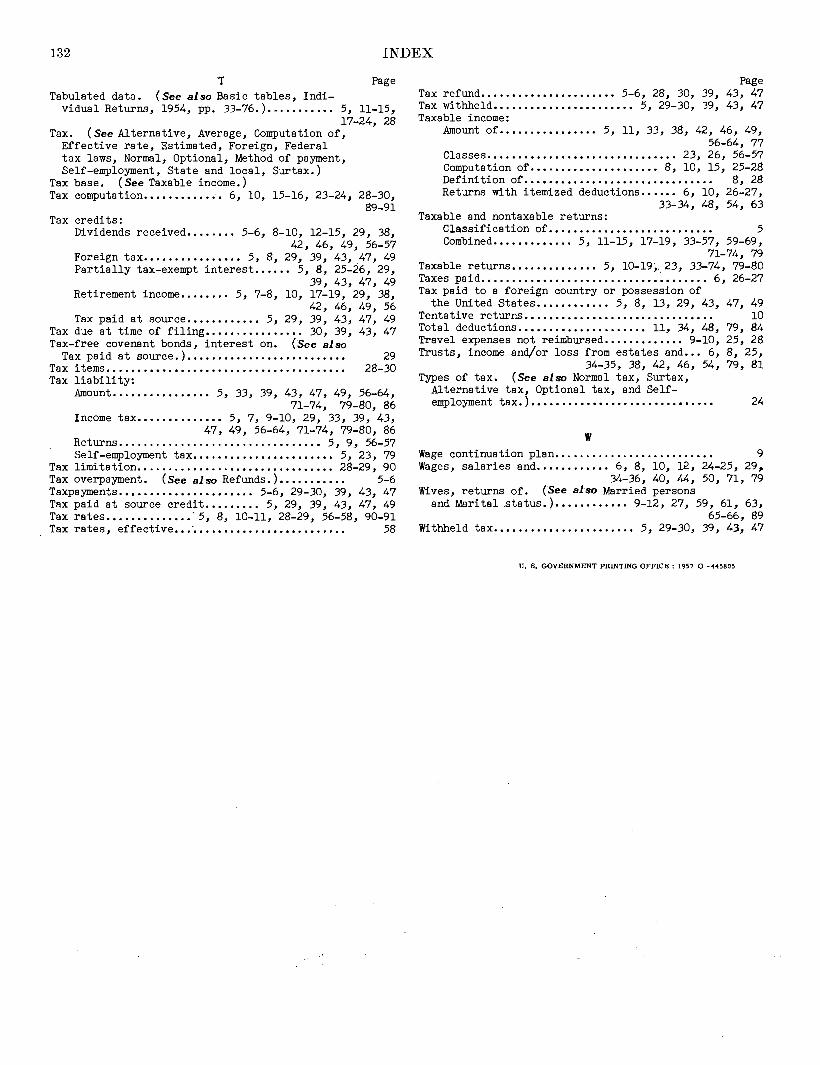
132 INDEX
24
4910
79, 8425, 288, 25,79, 81
Page39, 43, 4739, 43, 47
W
Wage continuation plan••.•.••... " . . • . . . • • . . . • • • 9Wages, salaries and•••••••••••• 6,8, 10, 12, 24-25, 29,
34-36, 40, 44, 50, 71, 79Wives, returns of. (See also Married persons
and Marital status.) 9-12, 27, 59, 61, 63,65-66, 89
Withheld tax 5, 29-30, 39, 43, 47
Taxable and nontaxable returns:Classification of........................... 5Combined••••••••••••• 5, 11-15, 17-19, 33-57, 59-69,
71-74, 79Taxable returns •••••••••••••• 5, 10-19~ 23, 33-74, 79-80Taxes paid••••••••••.•••••••••••••••••• ~ ••••••• 6, 26-27Tax paid to a foreign country or possession of
the United States •••••••••••• 5, 8, 13,29,43, 47,Tentative returns •••••••••••••••••••••••••••••••Total deductions..................... 11, 34, 48,Travel expenses not reimbursed ••••••••••••• 9-10,Trusts, income and/or loss from estates and ••• 6,
34-35, 38, 42, 46, 54,Types of tax. (See also Normal tax, Surtax,
Alternative tax, Optional tax, and Self-employment tax.) •••••••.••••••••••••••••••••••
Tax refund•.•••••••••••••••••••• 5-6, 28, 30,Tax withheld••••••••••••••••••••••• 5, 29-30,Taxable income:
Amount of •••••••••••••••• 5, 11, 33, 38, 42, 46, 49,56-64, 77
Classes ••••••••••••.•••••••••••••••••• 23, 26, 56-57Computation of..................... 8, 10, 15, 25-28Defin1tion of............................... 8, 28Returns with itemized deductions •••••• 6, 10,26-27,
33-34, 48, 54, 63
Page
2928-30
TTabulated data. (See also Basic tables, Indi-
vidual Returns, 1954, pp. 33-76.) ••••••••••• 5, 11-15,17-24, 28
Tax. (See Alternative, Average, Computation of,Effective rate, Estimated, Foreign, Federaltax laws, Normal, Optional, Method of payment,Self-employment, State and local, Surtax.)
Tax base. (See Taxable income.)Tax computation••••••••••••• 6, 10, 15-16, 23-24, 28-30,
89-91Tax credits:
Dividends received••••.••• 5-6, 8-10, 12-15, 29, 38,42, 46, 49, 56-57
Foreign tax•••••••••••••••• 5, 8, 29, 39, 43, 47,49Partially tax-exempt interest •••••• 5, 8, 25-26, 29,
39, 43, 47, 49Retirement income •••••••• 5, 7-8, 10, 17-19, 29, 38,
42, 46, 49, 56Tax paid at source •••••••••••• 5, 29, 39, 43, 47, 49
Tax due at time of filing •••••.•••••••••• 30, 39, 43, 47Tax-free covenant bonds, interest on. (See also
Tax paid at source.) ••••••••••••••••••••••••••Tax items •••••••••••••.•••••••••••••••••••••••••Tax liability:
Amount .••••••••••••••• 5, 33, 39,43,47, 49, 56-64,71-74, 79-80, 86
Income tax •••••••••••••• 5,7,9-10, 29, 33, 39, 43,47, 49, 56-64, 71-74, 79-80, 86
Returns •......•...•.............•••••••• 5, 9, 56-57Self-employment tax•••.•••••••••••.••••••• 5, 23, 79
Tax limitation••.••....•••...••••••••.•••••••• 28-29, 90Tax overpayment. (See also Refunds.)......... • • 5-6Taxpayments 5-6, 29-30, 39, 43, 47Tax paid at source credit ••••••••• 5,29, 39, 43,47,49Tax rates ••.••••••••••• · 5, 8, 10-11,28-29, 56-58, 90-91Tax rates, effective •••-......................... 58
U. S. GOVERNMENT PRINTING OFFICE: 1957 0 -445805


Characteristicsof the Year
Income Tax Underthe 1954 Code
Selection of Sampleand Limitations of Data
Explanation ofClassifications and Terms
Tables
Synopsis of Laws
Facsimiles ofIncome Tax Returns
For ease of locating major sections of the
book, black indicators have been placed
in line with the arrows. Fanning the
pages brings the indicators into easy view.