Embed Size (px)
Citation preview
Statistics South Africa Private Bag X44
Pretoria 0001 South Africa
170 Thabo Sehume (Andries) Street Pretoria 0002
User information services: (012) 310 8600 Fax: (012) 310 8500
Main switchboard: (012) 310 8911 Fax: (012) 321 7381
Website: www.statssa.gov.za Email: [email protected]
i
Editor’s comment The month of June is known for cold weather conditions as it marks the beginning of the winter season. To South Africans, June is known as “Youth Month” as it commemorates the youth that raised their voices against the previous government’s education policies. This is the month in which the Soweto uprising occurred 37 years ago.
It appears that the youth’s struggle continues, as today’s youth are faced with a different kind of struggle. They face challenges with social and economic issues such as unemployment, HIV and AIDS, gender equality, poverty, and education.
Our nation has a rich history, part of which is embroidered in the statistics that also seek to make sense of the current economic environment. Let us continue to be part of the youth that use statistics as a tool for informed and evidence-based decision making.
In this month’s issue, we continue with the special focus on the Census 2011 results based on provinces. Our attention this month is given to Mpumalanga province.
Statistics presented in this issue were sourced from statistical releases published in May and June 2013. To access detailed results on any of the sectors featured in this issue, please visit our website at www.statssa.gov.za
Have a nice read!

iii
CONTENTSEditor’s comment ............................................................................... iCrossword puzzle ............................................................................. ivCensus educational article: Mpumalanga ....................................... 1Primary industries ............................................................................. 7
Mining: Production and sales ......................................................................7
Secondary industries ........................................................................ 9Manufacturing: Production and sales ..........................................................9
Selected building statistics of the private sector .......................................10
Electricity generated and available for distribution ...................................12
Tertiary industries ........................................................................... 13Wholesale trade sales ...............................................................................13
Retail trade sales ......................................................................................15
Motor trade sales ......................................................................................16
Food and beverages .................................................................................17
Tourist accommodation .............................................................................18
Tourism and migration ..............................................................................19
Civil cases for debt ....................................................................................22
Liquidations and insolvencies ...................................................................23
Land transport ...........................................................................................25
Prices ................................................................................................ 26Producer price index (PPI) ........................................................................26
Consumer price index (CPI) ......................................................................28
Glossary ........................................................................................... 31
iv
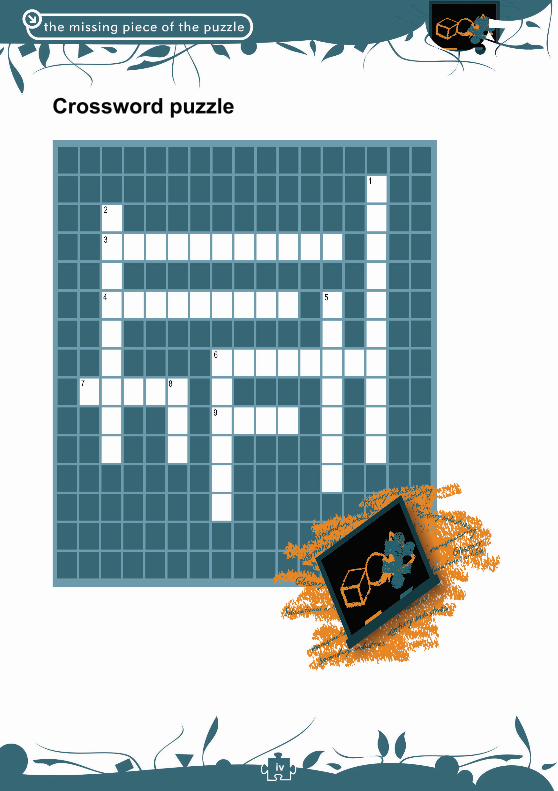
Crossword puzzle
v
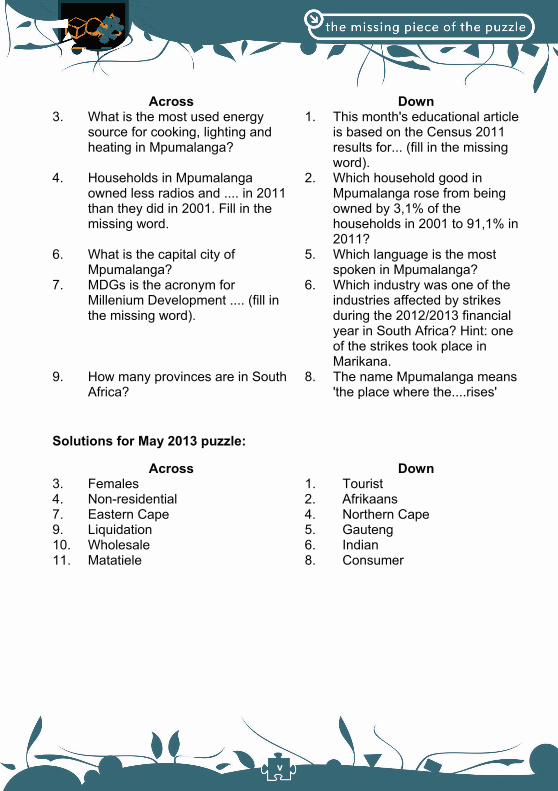
Across Down3. What is the most used energy
source for cooking, lighting and heating in Mpumalanga?
1. This month's educational article is based on the Census 2011 results for... (fill in the missing word).
4. Households in Mpumalanga owned less radios and .... in 2011 than they did in 2001. Fill in the missing word.
2. Which household good in Mpumalanga rose from being owned by 3,1% of the households in 2001 to 91,1% in 2011?
6. What is the capital city of Mpumalanga?
5. Which language is the most spoken in Mpumalanga?
7. MDGs is the acronym for Millenium Development .... (fill in the missing word).
6. Which industry was one of the industries affected by strikes during the 2012/2013 financial year in South Africa? Hint: one of the strikes took place in Marikana.
9. How many provinces are in South Africa?
8. The name Mpumalanga means 'the place where the....rises'
Solutions for May 2013 puzzle:
Across Down3. Females 1. Tourist 4. Non-residential 2. Afrikaans 7. Eastern Cape 4. Northern Cape 9. Liquidation 5. Gauteng 10. Wholesale 6. Indian 11. Matatiele 8. Consumer

1
Census educational article: Mpumalanga IntroductionMpumalanga is home to the well-known nature reserve, the Kruger National Park. The province lies in eastern South Africa, north of KwaZulu-Natal and borders Swaziland and Mozambique. The name Mpumalanga means the place where the sun rises in isiSwati, isiXhosa, isiNdebele and isiZulu, which are some of the languages spoken in Mpumalanga. The capital city of Mpumalanga is Mbombela, previously known as Nelspruit.
One of the top performing industries in Mpumalanga is the mining industry. The province is rich in coal reserves and produces most of the country’s coal which is used for generation of electricity. The province also has an abundance of citrus and many other subtropical fruits such as mangoes, avocados, litchis, bananas, pawpaws, granadillas and guavas. Mbombela is the second-largest citrus fruit producing area in South Africa and is responsible for one-third of the country's export in oranges.
In this article we explore some of the Census 2011 results relating to Mpumalanga.
Geography and Demography Land area and population With a total land area of 76 495 square kilometres, Mpumalanga is the second-smallest province (in size) after Gauteng, constituting 6,3% of South Africa's land area and with a population of just over 4 million people, which constitutes 7,8% of South Africa’s population. The population of Mpumalanga increased from 3 365 554 in 2001 to 4 039 939 in 2011.
In comparison with previous censuses 1996 and 2001, and Community Survey 2007, Census 2011 shows that there are more females than males (48,6% male and 51,4% female) living in the province.
Black Africans make up most of the population in Mpumalanga, with a proportion of 90,7% in 2011 followed by whites (7,5%), coloureds (0,9%), Indian/Asian (0,7%) and other races make up (0,2%) of the population.
2
Mpumalanga province shows a decline in the proportion of the population aged 0–14 (from 37,2% in 1996, 35,8% in 2001 and 31,2% in 2011). The proportion of persons aged 15–64 increased from 59,9% in 2001 to 64,1% in 2011 while persons aged 65 years or older) slightly increased by 1% over the period.
LanguagesCensus 2011 results show that there are a number of languages spoken in Mpumalanga. The most frequently spoken language in many households is isiSwati (27,7%) followed by isiZulu (24,1%), Xitsonga (10,4%), isiNdebele (10,1%) and Sepedi (9,3%).
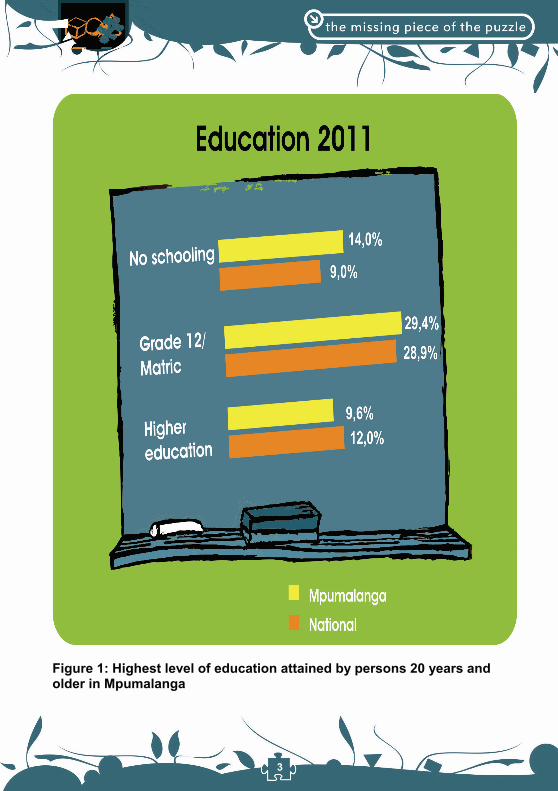
Education Since 1996, there has been a slight increase in the proportion of people in Mpumalanga attending school among those aged 5 to 24 years (from 73,5% in 2001 to 74,8% in 2011). In 2011, 29,4% of the population aged 20 years and older in the province had matric or grade 12 as their highest level of education. This is a significant increase from the 14,9% and 17,7% recorded in 1996 and 2001 respectively. Census 2011 also shows that only 9,6% completed some form of higher education. Although a larger proportion of the population has attained some level of education, 14,0% had no schooling in 2011. Overall, the Census 2011 results show an increase in the proportion of the population that completed grade 12/ matric and higher education and a decline in the population with no schooling.
3
Figure 1: Highest level of education attained by persons 20 years and older in Mpumalanga
4
Unemployment rate Unemployment rate (based on the official definition of unemployment) was 31,6% for the province compared to 29,8% nationally.
HousingCensus 2011 shows that there was an increase in the proportion of households residing in formal dwellings across the province (from 72,2% in 2001 to 83,8% in 2011). In contrast, the proportion of households living in informal dwellings decreased from 14,8% in 2001 to 10,9% in 2011; while proportions of those living in traditional dwellings decreased significantly from 21,6% in 2001 to 4,5% in 2011.
Ownership of household goods Over the years, the trend in type of household goods owned has changed. As seen from the Census 2011 results, many households have less radios and landline phones but there is an increased number of those owning cellphones and computers.
5
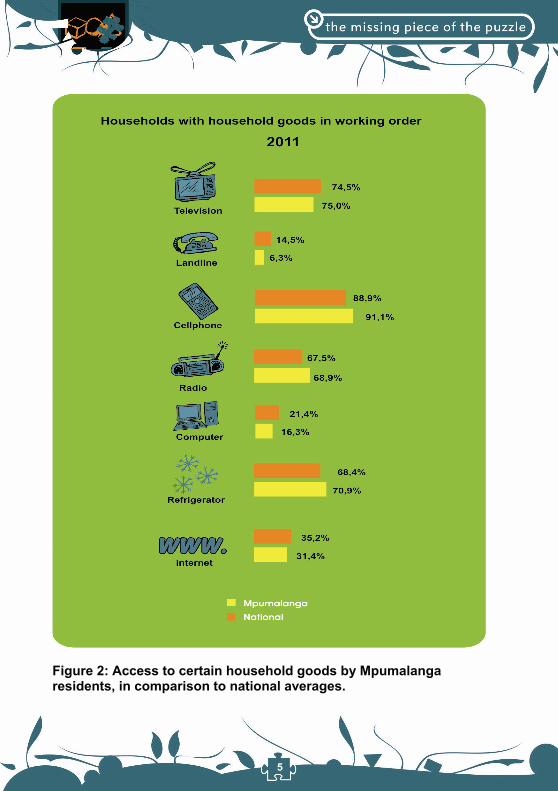
Figure 2: Access to certain household goods by Mpumalanga residents, in comparison to national averages.
6
Radios – Census 2011 results show a decline in the proportion of households owning radios (from 73,3% in 2001 to 68,9% in 2011).
Landline telephones – The proportion of households owning landline telephones declined from 14,4% in 2001 to 6,3% in 2011.
Televisions – Census results show that there was an increase in the proportion of households owning television sets (from 49,1% in 2001 to 75% in 2011).
Computers – The proportion of households owning computers increased from 4,3% in 2001 to 16,3% in 2011.
Refrigerators – Census 2011 shows an increase in the proportion of households owning refrigerators (from 49,4% in 2001 to 70,9% in 2011).
Cellphones – The proportion of households with cellphones increased from 31,1% in 2001 to 91,1% in 2011.
Internet – The proportion of households with access to internet is around 30% across the province.
Household services Electricity – The proportion of households using electricity as the main source of energy for lighting, heating and cooking increased across the province. In 2011, 86,4% of households used electricity for lighting, 57,6% used it for cooking while 69,3% used electricity for heating. These results suggest that more than half of the population in Mpumalanga has access to electricity.
Piped water – In 2001, there was an increase in the proportion of households having access to piped water in their dwelling or yard (from 56,5% in 2001 to 71,7% in 2011). Census 2011 shows a decline in the proportion of households having access to piped water on a communal stand (from 29,2% in 2001 to 15,8% in 2011), and those with no access to piped water (from 14,3% in 2001 to 12,6% in 2011).
Refuse removal – The proportion of households whose refuse is removed by the local authority or a private company was 43,7% in 2011, an increase from 37% in 2001. The percentage of those making use of communal refuse
7
dumps or who remove their refuse themselves was 47,6% in 2011, a decrease from 52,5% in 2001. The proportion of households with no form of rubbish disposal services was 7,9% in 2011, compared to 10,5% in 2001.
Although there was an increase in the proportion of households whose refuse is removed by local authority or private company, the figures suggest that less than half of the households in Mpumalanga have access to this service.
Toilet facilities – Census 2011 results show that 45,2% of households in Mpumalanga had flush or chemical toilets, and those with no toilet facilities was 6,3%.
Conclusion
Mpumalanga constitutes 7,8% of the South African population, making it the sixth largest province in terms of population. Almost all the household services, the literacy and unemployment rate seem to have improved.
References 1. Statistics South Africa. 2012. Census products. Available online at:
http://www.statssa.gov.za
2. Statistics South Africa. 2012. Census 2011 Community Profiles in SuperCROSS. Accessible online at http://interactive.statssa.gov.za/superweb/login.do
Primary industries Mining: Production and sales Mining production decreases South Africa's government has initiated a beneficiation process. This is a process of turning minerals into finished products, in order to contribute to job creation and economic growth. Instead of exporting minerals to other
8
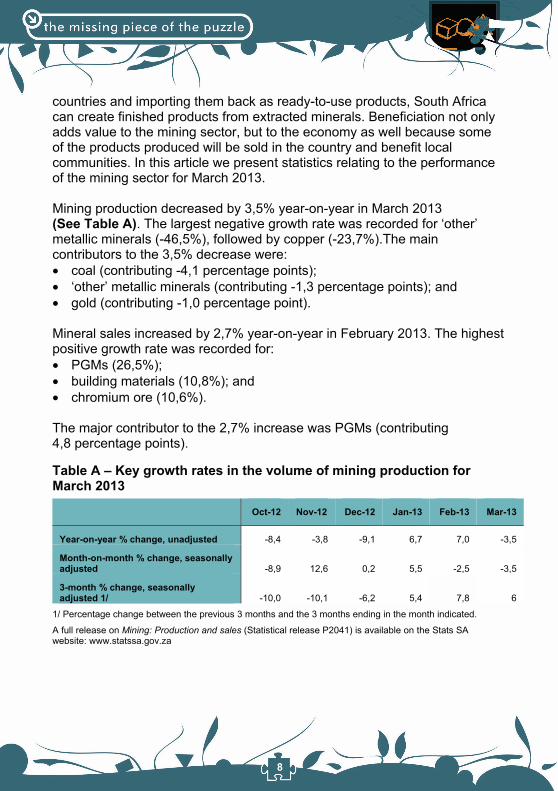
countries and importing them back as ready-to-use products, South Africa can create finished products from extracted minerals. Beneficiation not only adds value to the mining sector, but to the economy as well because some of the products produced will be sold in the country and benefit local communities. In this article we present statistics relating to the performance of the mining sector for March 2013.
Mining production decreased by 3,5% year-on-year in March 2013 (See Table A). The largest negative growth rate was recorded for ‘other’ metallic minerals (-46,5%), followed by copper (-23,7%).The main contributors to the 3,5% decrease were: coal (contributing -4,1 percentage points); ‘other’ metallic minerals (contributing -1,3 percentage points); and gold (contributing -1,0 percentage point).
Mineral sales increased by 2,7% year-on-year in February 2013. The highest positive growth rate was recorded for: PGMs (26,5%); building materials (10,8%); and chromium ore (10,6%).
The major contributor to the 2,7% increase was PGMs (contributing 4,8 percentage points).
Table A – Key growth rates in the volume of mining production for March 2013
Oct-12 Nov-12 Dec-12 Jan-13 Feb-13 Mar-13
Year-on-year % change, unadjusted -8,4 -3,8 -9,1 6,7 7,0 -3,5
Month-on-month % change, seasonally adjusted -8,9 12,6 0,2 5,5 -2,5 -3,5
3-month % change, seasonally adjusted 1/ -10,0 -10,1 -6,2 5,4 7,8 6
1/ Percentage change between the previous 3 months and the 3 months ending in the month indicated.
A full release on Mining: Production and sales (Statistical release P2041) is available on the Stats SA website: www.statssa.gov.za
9
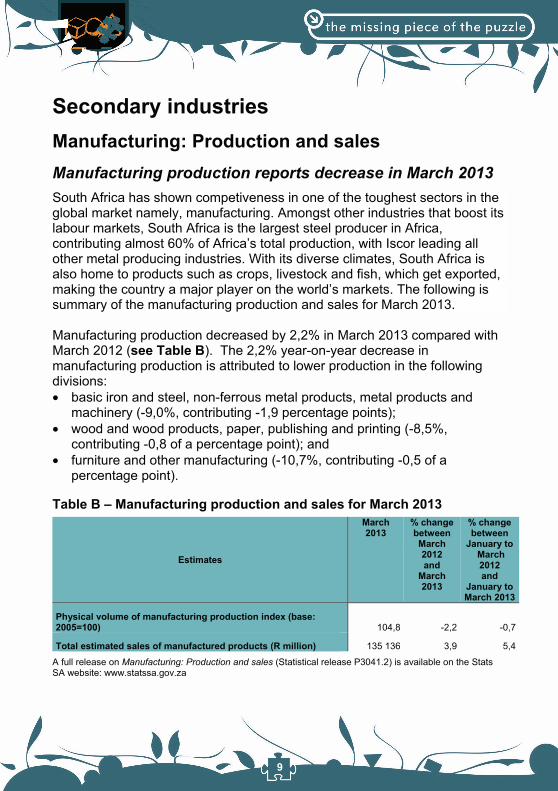
Secondary industries Manufacturing: Production and sales Manufacturing production reports decrease in March 2013 South Africa has shown competiveness in one of the toughest sectors in the global market namely, manufacturing. Amongst other industries that boost its labour markets, South Africa is the largest steel producer in Africa, contributing almost 60% of Africa’s total production, with Iscor leading all other metal producing industries. With its diverse climates, South Africa is also home to products such as crops, livestock and fish, which get exported, making the country a major player on the world’s markets. The following is summary of the manufacturing production and sales for March 2013.
Manufacturing production decreased by 2,2% in March 2013 compared with March 2012 (see Table B). The 2,2% year-on-year decrease in manufacturing production is attributed to lower production in the following divisions: basic iron and steel, non-ferrous metal products, metal products and
machinery (-9,0%, contributing -1,9 percentage points); wood and wood products, paper, publishing and printing (-8,5%,
contributing -0,8 of a percentage point); and furniture and other manufacturing (-10,7%, contributing -0,5 of a
percentage point).
Table B – Manufacturing production and sales for March 2013
Estimates
March 2013
% change between March 2012and
March 2013
% change between
January to March 2012and
January to March 2013
Physical volume of manufacturing production index (base: 2005=100) 104,8 -2,2 -0,7
Total estimated sales of manufactured products (R million) 135 136 3,9 5,4
A full release on Manufacturing: Production and sales (Statistical release P3041.2) is available on the Stats SA website: www.statssa.gov.za
10
Selected building statistics of the private sector More building plans passed for additions and alterations
Construction usually involves building a new residential or non-residential building from scratch. However, there’s another part of construction which might not be as popular as these two: additions and alterations. Additions to a building refer to the inclusion of a new room, structure or space to an already existing building, such as adding a garage to a residential building. Alterations on the other hand refer to changing a certain portion of an already existing building. Presented in this article are the selected building statistics of the private sector for March 2013.
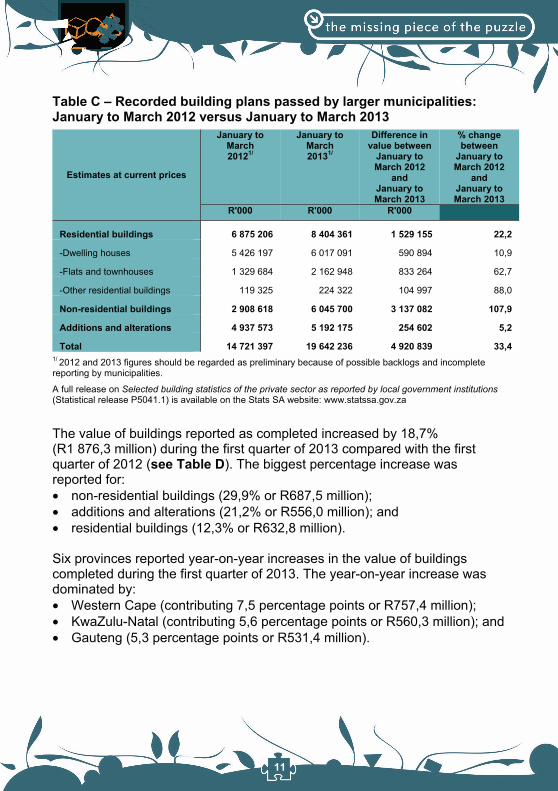
The value of recorded building plans passed increased by 33,4% (R4 920,8 million) during the first quarter of 2013 compared with the first quarter of 2012 (see Table C). The biggest increase was reported for: non-residential buildings (107,9% or R3 137,1 million); residential buildings (22,2% or R1 529,2 million); and additions and alterations (5,2% or R254,6 million).
Six provinces reported year-on-year increases in the value of building plans passed during the first quarter of 2013. The increase in the value of building plans passed was dominated by Gauteng (contributing 23,9 percentage points or R3 512,8 million).
11
Table C – Recorded building plans passed by larger municipalities: January to March 2012 versus January to March 2013
Estimates at current prices
January to March 20121/
January to March 20131/
Difference in value between
January to March 2012
andJanuary to March 2013
% change between
January to March 2012
andJanuary to March 2013
R'000 R'000 R'000
Residential buildings 6 875 206 8 404 361 1 529 155 22,2
-Dwelling houses 5 426 197 6 017 091 590 894 10,9
-Flats and townhouses 1 329 684 2 162 948 833 264 62,7
-Other residential buildings 119 325 224 322 104 997 88,0
Non-residential buildings 2 908 618 6 045 700 3 137 082 107,9
Additions and alterations 4 937 573 5 192 175 254 602 5,2
Total 14 721 397 19 642 236 4 920 839 33,4 1/ 2012 and 2013 figures should be regarded as preliminary because of possible backlogs and incomplete reporting by municipalities.
A full release on Selected building statistics of the private sector as reported by local government institutions (Statistical release P5041.1) is available on the Stats SA website: www.statssa.gov.za
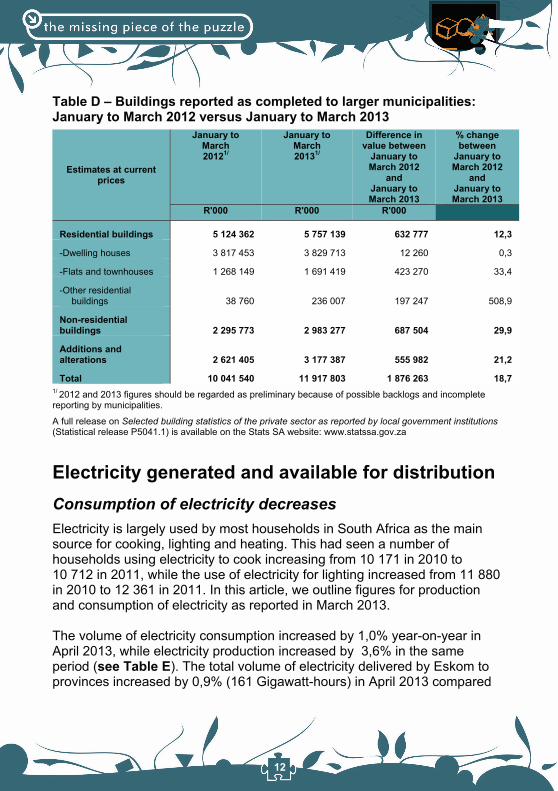
The value of buildings reported as completed increased by 18,7% (R1 876,3 million) during the first quarter of 2013 compared with the first quarter of 2012 (see Table D). The biggest percentage increase was reported for: non-residential buildings (29,9% or R687,5 million); additions and alterations (21,2% or R556,0 million); and residential buildings (12,3% or R632,8 million).
Six provinces reported year-on-year increases in the value of buildings completed during the first quarter of 2013. The year-on-year increase was dominated by: Western Cape (contributing 7,5 percentage points or R757,4 million); KwaZulu-Natal (contributing 5,6 percentage points or R560,3 million); and Gauteng (5,3 percentage points or R531,4 million).
12
Table D – Buildings reported as completed to larger municipalities: January to March 2012 versus January to March 2013
Estimates at current prices
January to March 20121/
January to March 20131/
Difference in value between
January to March 2012
andJanuary to March 2013
% change between
January to March 2012
andJanuary to March 2013
R'000 R'000 R'000
Residential buildings 5 124 362 5 757 139 632 777 12,3
-Dwelling houses 3 817 453 3 829 713 12 260 0,3
-Flats and townhouses 1 268 149 1 691 419 423 270 33,4
-Other residential buildings 38 760 236 007 197 247 508,9
Non-residential buildings 2 295 773 2 983 277 687 504 29,9
Additions and alterations 2 621 405 3 177 387 555 982 21,2
Total 10 041 540 11 917 803 1 876 263 18,7 1/ 2012 and 2013 figures should be regarded as preliminary because of possible backlogs and incomplete reporting by municipalities.
A full release on Selected building statistics of the private sector as reported by local government institutions (Statistical release P5041.1) is available on the Stats SA website: www.statssa.gov.za
Electricity generated and available for distribution Consumption of electricity decreases Electricity is largely used by most households in South Africa as the main source for cooking, lighting and heating. This had seen a number of households using electricity to cook increasing from 10 171 in 2010 to 10 712 in 2011, while the use of electricity for lighting increased from 11 880 in 2010 to 12 361 in 2011. In this article, we outline figures for production and consumption of electricity as reported in March 2013.
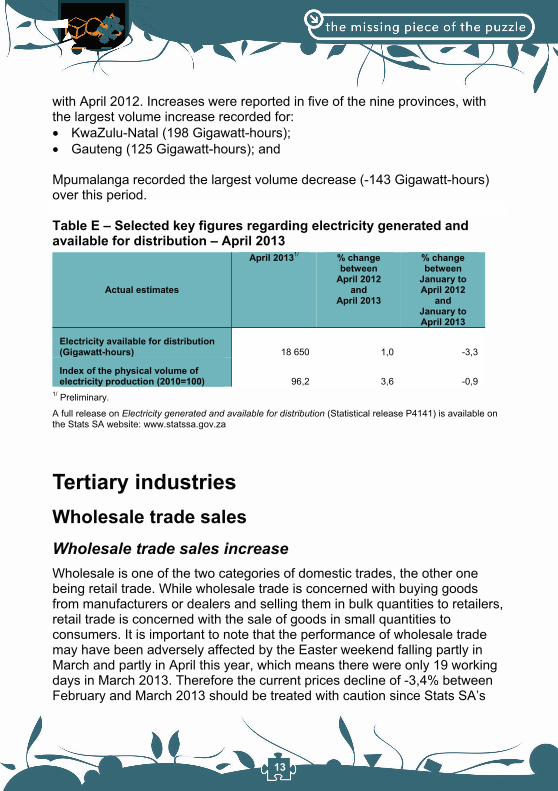
The volume of electricity consumption increased by 1,0% year-on-year in April 2013, while electricity production increased by 3,6% in the same period (see Table E). The total volume of electricity delivered by Eskom to provinces increased by 0,9% (161 Gigawatt-hours) in April 2013 compared
13
with April 2012. Increases were reported in five of the nine provinces, with the largest volume increase recorded for: KwaZulu-Natal (198 Gigawatt-hours); Gauteng (125 Gigawatt-hours); and
Mpumalanga recorded the largest volume decrease (-143 Gigawatt-hours) over this period.
Table E – Selected key figures regarding electricity generated and available for distribution – April 2013
Actual estimates
April 20131/ % change between
April 2012 and
April 2013
% change between
January to April 2012
andJanuary to April 2013
Electricity available for distribution (Gigawatt-hours) 18 650 1,0 -3,3
Index of the physical volume of electricity production (2010=100) 96,2 3,6 -0,9
1/ Preliminary.
A full release on Electricity generated and available for distribution (Statistical release P4141) is available on the Stats SA website: www.statssa.gov.za
Tertiary industries Wholesale trade sales Wholesale trade sales increase Wholesale is one of the two categories of domestic trades, the other one being retail trade. While wholesale trade is concerned with buying goods from manufacturers or dealers and selling them in bulk quantities to retailers, retail trade is concerned with the sale of goods in small quantities to consumers. It is important to note that the performance of wholesale trade may have been adversely affected by the Easter weekend falling partly in March and partly in April this year, which means there were only 19 working days in March 2013. Therefore the current prices decline of -3,4% between February and March 2013 should be treated with caution since Stats SA’s
14
current methodology for the current prices of wholesale trade does not adjust for shifts in timing of Easter. So when Easter is spread over the end of March and the beginning of April, it is advisable to consider the two months together (once the April results become available). In this article, we report on the wholesale trade performance for March 2013.
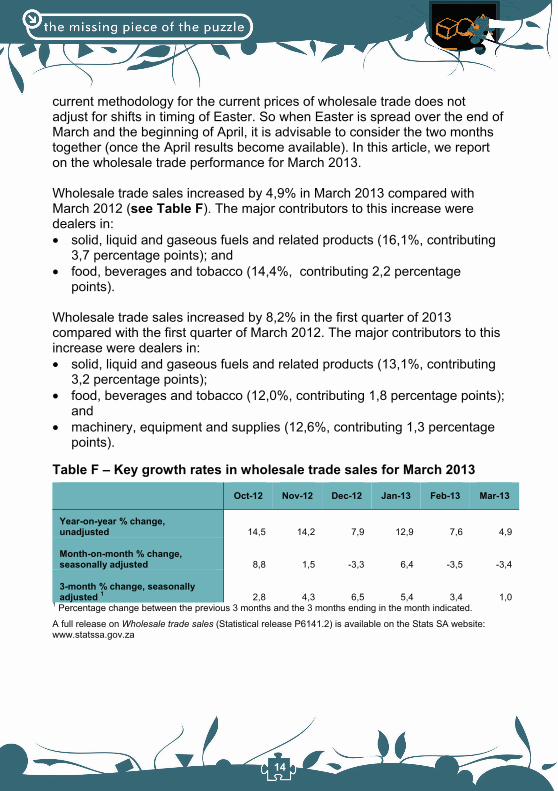
Wholesale trade sales increased by 4,9% in March 2013 compared with March 2012 (see Table F). The major contributors to this increase were dealers in: solid, liquid and gaseous fuels and related products (16,1%, contributing
3,7 percentage points); and food, beverages and tobacco (14,4%, contributing 2,2 percentage
points).
Wholesale trade sales increased by 8,2% in the first quarter of 2013 compared with the first quarter of March 2012. The major contributors to this increase were dealers in: solid, liquid and gaseous fuels and related products (13,1%, contributing
3,2 percentage points); food, beverages and tobacco (12,0%, contributing 1,8 percentage points);
and machinery, equipment and supplies (12,6%, contributing 1,3 percentage
points).
Table F – Key growth rates in wholesale trade sales for March 2013
Oct-12 Nov-12 Dec-12 Jan-13 Feb-13 Mar-13
Year-on-year % change, unadjusted 14,5 14,2 7,9 12,9 7,6 4,9
Month-on-month % change, seasonally adjusted 8,8 1,5 -3,3 6,4 -3,5 -3,4
3-month % change, seasonally adjusted 1 2,8 4,3 6,5 5,4 3,4 1,0
1 Percentage change between the previous 3 months and the 3 months ending in the month indicated.
A full release on Wholesale trade sales (Statistical release P6141.2) is available on the Stats SA website: www.statssa.gov.za
15
Retail trade sales Retail trade sales rise by 2,8% When the rand drops, as it fell nearly by 3% to the US dollar at the end of May 2013, it is often received with mixed reactions by different markets. This is because some businesses are affected negatively whereas others benefit from the situation. While the weakened rand boosted miners who pay most of their costs in rands and sell their products in dollars, local retailers who rely heavily on imports to fill their shelves were hit hard. Below are the statistics of retail trade sales for the month of March 2013.
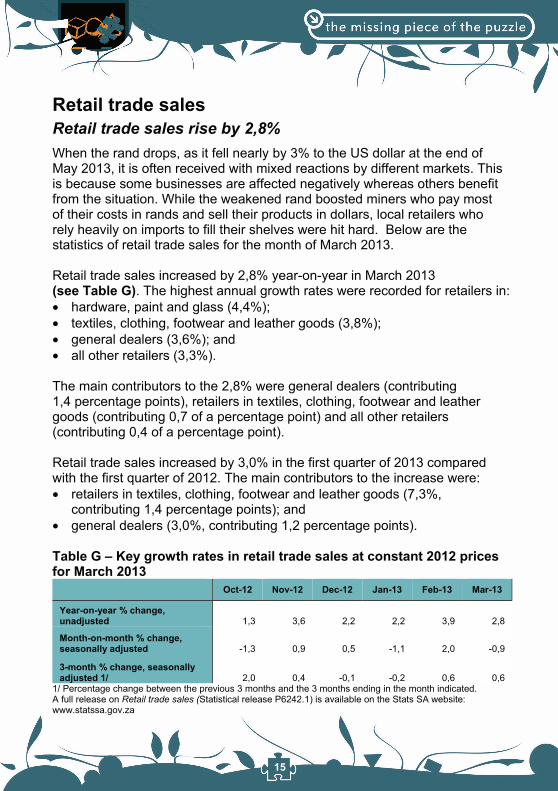
Retail trade sales increased by 2,8% year-on-year in March 2013 (see Table G). The highest annual growth rates were recorded for retailers in: hardware, paint and glass (4,4%); textiles, clothing, footwear and leather goods (3,8%); general dealers (3,6%); and all other retailers (3,3%).
The main contributors to the 2,8% were general dealers (contributing 1,4 percentage points), retailers in textiles, clothing, footwear and leather goods (contributing 0,7 of a percentage point) and all other retailers (contributing 0,4 of a percentage point).
Retail trade sales increased by 3,0% in the first quarter of 2013 compared with the first quarter of 2012. The main contributors to the increase were: retailers in textiles, clothing, footwear and leather goods (7,3%,
contributing 1,4 percentage points); and general dealers (3,0%, contributing 1,2 percentage points).
Table G – Key growth rates in retail trade sales at constant 2012 prices for March 2013
Oct-12 Nov-12 Dec-12 Jan-13 Feb-13 Mar-13
Year-on-year % change, unadjusted 1,3 3,6 2,2 2,2 3,9 2,8
Month-on-month % change, seasonally adjusted -1,3 0,9 0,5 -1,1 2,0 -0,9
3-month % change, seasonally adjusted 1/ 2,0 0,4 -0,1 -0,2 0,6 0,6
1/ Percentage change between the previous 3 months and the 3 months ending in the month indicated. A full release on Retail trade sales (Statistical release P6242.1) is available on the Stats SA website: www.statssa.gov.za
16
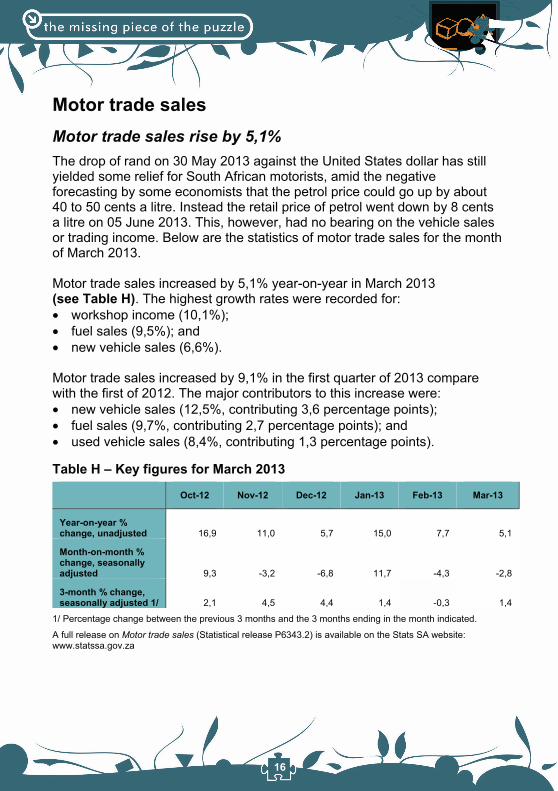
Motor trade sales Motor trade sales rise by 5,1% The drop of rand on 30 May 2013 against the United States dollar has still yielded some relief for South African motorists, amid the negative forecasting by some economists that the petrol price could go up by about 40 to 50 cents a litre. Instead the retail price of petrol went down by 8 cents a litre on 05 June 2013. This, however, had no bearing on the vehicle sales or trading income. Below are the statistics of motor trade sales for the month of March 2013.
Motor trade sales increased by 5,1% year-on-year in March 2013 (see Table H). The highest growth rates were recorded for: workshop income (10,1%); fuel sales (9,5%); and new vehicle sales (6,6%).
Motor trade sales increased by 9,1% in the first quarter of 2013 compare with the first of 2012. The major contributors to this increase were: new vehicle sales (12,5%, contributing 3,6 percentage points); fuel sales (9,7%, contributing 2,7 percentage points); and used vehicle sales (8,4%, contributing 1,3 percentage points).
Table H – Key figures for March 2013
Oct-12 Nov-12 Dec-12 Jan-13 Feb-13 Mar-13
Year-on-year % change, unadjusted 16,9 11,0 5,7 15,0 7,7 5,1
Month-on-month % change, seasonally adjusted 9,3 -3,2 -6,8 11,7 -4,3 -2,8
3-month % change, seasonally adjusted 1/ 2,1 4,5 4,4 1,4 -0,3 1,4
1/ Percentage change between the previous 3 months and the 3 months ending in the month indicated.
A full release on Motor trade sales (Statistical release P6343.2) is available on the Stats SA website: www.statssa.gov.za
17
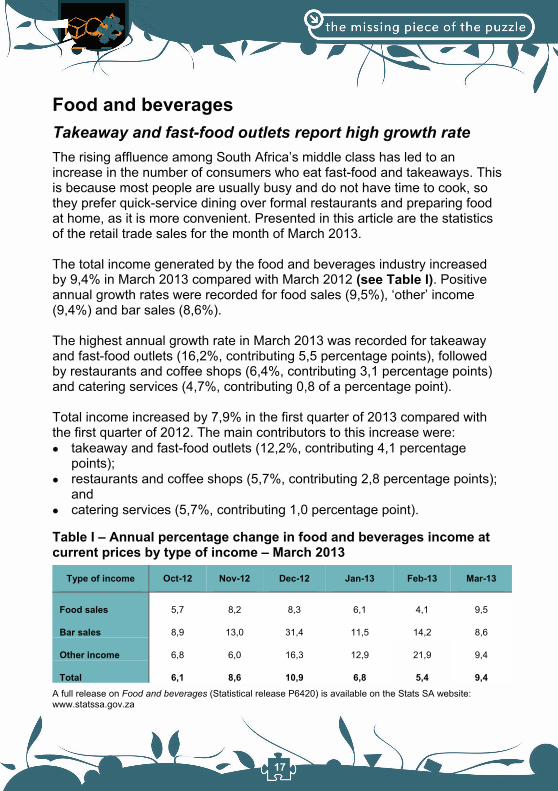
Food and beverages Takeaway and fast-food outlets report high growth rate The rising affluence among South Africa’s middle class has led to an increase in the number of consumers who eat fast-food and takeaways. This is because most people are usually busy and do not have time to cook, so they prefer quick-service dining over formal restaurants and preparing food at home, as it is more convenient. Presented in this article are the statistics of the retail trade sales for the month of March 2013.
The total income generated by the food and beverages industry increased by 9,4% in March 2013 compared with March 2012 (see Table I). Positive annual growth rates were recorded for food sales (9,5%), ‘other’ income (9,4%) and bar sales (8,6%).
The highest annual growth rate in March 2013 was recorded for takeaway and fast-food outlets (16,2%, contributing 5,5 percentage points), followed by restaurants and coffee shops (6,4%, contributing 3,1 percentage points) and catering services (4,7%, contributing 0,8 of a percentage point).
Total income increased by 7,9% in the first quarter of 2013 compared with the first quarter of 2012. The main contributors to this increase were: takeaway and fast-food outlets (12,2%, contributing 4,1 percentage
points); restaurants and coffee shops (5,7%, contributing 2,8 percentage points);
and catering services (5,7%, contributing 1,0 percentage point).
Table I – Annual percentage change in food and beverages income at current prices by type of income – March 2013
Type of income Oct-12 Nov-12 Dec-12 Jan-13 Feb-13 Mar-13
Food sales 5,7 8,2 8,3 6,1 4,1 9,5
Bar sales 8,9 13,0 31,4 11,5 14,2 8,6
Other income 6,8 6,0 16,3 12,9 21,9 9,4
Total 6,1 8,6 10,9 6,8 5,4 9,4 A full release on Food and beverages (Statistical release P6420) is available on the Stats SA website: www.statssa.gov.za
18
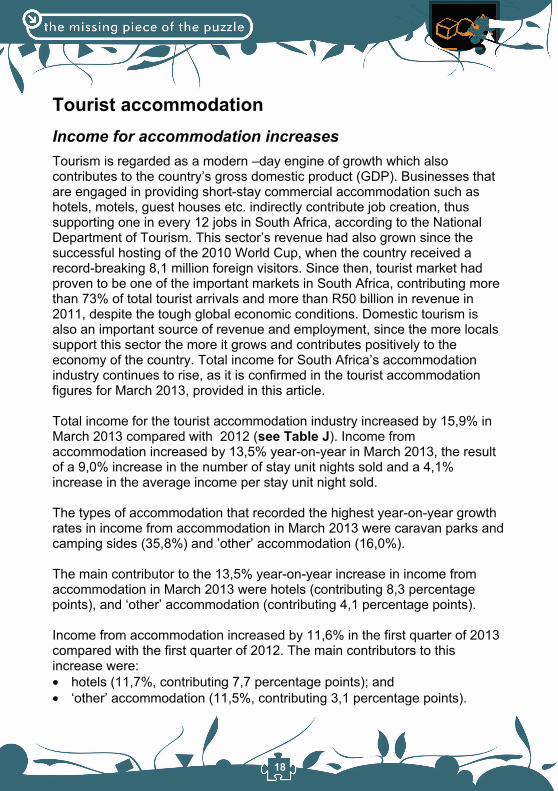
Tourist accommodation Income for accommodation increases Tourism is regarded as a modern –day engine of growth which also contributes to the country’s gross domestic product (GDP). Businesses that are engaged in providing short-stay commercial accommodation such as hotels, motels, guest houses etc. indirectly contribute job creation, thus supporting one in every 12 jobs in South Africa, according to the National Department of Tourism. This sector’s revenue had also grown since the successful hosting of the 2010 World Cup, when the country received a record-breaking 8,1 million foreign visitors. Since then, tourist market had proven to be one of the important markets in South Africa, contributing more than 73% of total tourist arrivals and more than R50 billion in revenue in 2011, despite the tough global economic conditions. Domestic tourism is also an important source of revenue and employment, since the more locals support this sector the more it grows and contributes positively to the economy of the country. Total income for South Africa’s accommodation industry continues to rise, as it is confirmed in the tourist accommodation figures for March 2013, provided in this article.
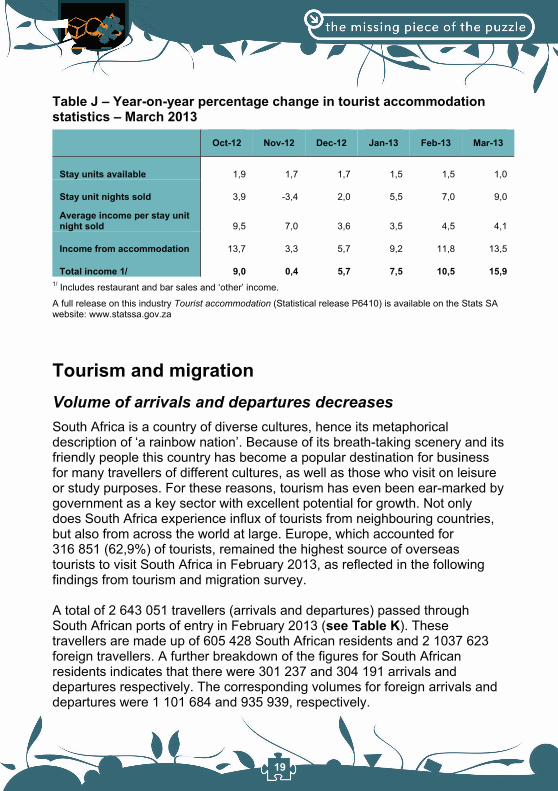
Total income for the tourist accommodation industry increased by 15,9% in March 2013 compared with 2012 (see Table J). Income from accommodation increased by 13,5% year-on-year in March 2013, the result of a 9,0% increase in the number of stay unit nights sold and a 4,1% increase in the average income per stay unit night sold.
The types of accommodation that recorded the highest year-on-year growth rates in income from accommodation in March 2013 were caravan parks and camping sides (35,8%) and ’other’ accommodation (16,0%).
The main contributor to the 13,5% year-on-year increase in income from accommodation in March 2013 were hotels (contributing 8,3 percentage points), and ‘other’ accommodation (contributing 4,1 percentage points).
Income from accommodation increased by 11,6% in the first quarter of 2013 compared with the first quarter of 2012. The main contributors to this increase were: hotels (11,7%, contributing 7,7 percentage points); and ‘other’ accommodation (11,5%, contributing 3,1 percentage points).
19
Table J – Year-on-year percentage change in tourist accommodation statistics – March 2013
Oct-12 Nov-12 Dec-12 Jan-13 Feb-13 Mar-13
Stay units available 1,9 1,7 1,7 1,5 1,5 1,0
Stay unit nights sold 3,9 -3,4 2,0 5,5 7,0 9,0
Average income per stay unit night sold 9,5 7,0 3,6 3,5 4,5 4,1
Income from accommodation 13,7 3,3 5,7 9,2 11,8 13,5
Total income 1/ 9,0 0,4 5,7 7,5 10,5 15,9 1/ Includes restaurant and bar sales and ‘other’ income.
A full release on this industry Tourist accommodation (Statistical release P6410) is available on the Stats SA website: www.statssa.gov.za
Tourism and migration Volume of arrivals and departures decreases South Africa is a country of diverse cultures, hence its metaphorical description of ‘a rainbow nation’. Because of its breath-taking scenery and its friendly people this country has become a popular destination for business for many travellers of different cultures, as well as those who visit on leisure or study purposes. For these reasons, tourism has even been ear-marked by government as a key sector with excellent potential for growth. Not only does South Africa experience influx of tourists from neighbouring countries, but also from across the world at large. Europe, which accounted for 316 851 (62,9%) of tourists, remained the highest source of overseas tourists to visit South Africa in February 2013, as reflected in the following findings from tourism and migration survey.
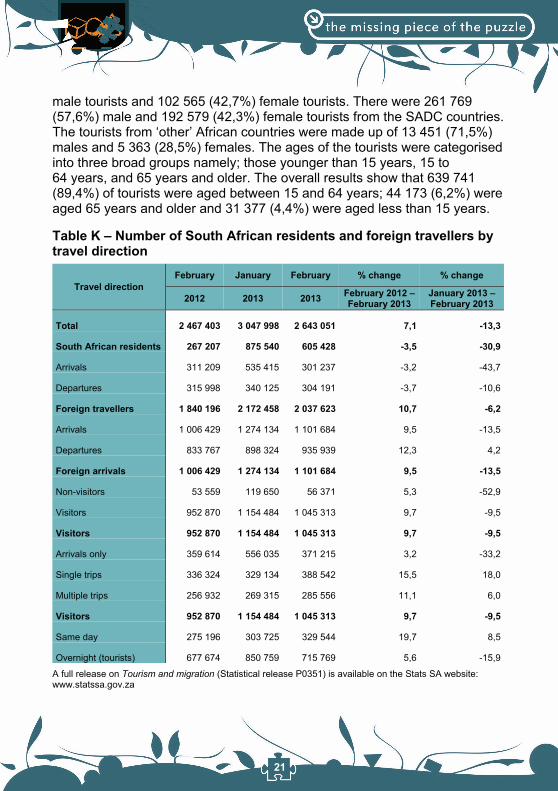
A total of 2 643 051 travellers (arrivals and departures) passed through South African ports of entry in February 2013 (see Table K). These travellers are made up of 605 428 South African residents and 2 1037 623 foreign travellers. A further breakdown of the figures for South African residents indicates that there were 301 237 and 304 191 arrivals and departures respectively. The corresponding volumes for foreign arrivals and departures were 1 101 684 and 935 939, respectively.
20
Mode of travel
Travellers who cross South African borders rarely use trains since they are mainly used for transporting goods. In February 2013, road transport was the most common mode of travel used by 1 852 286 (70,1%) out of the 2 643 051 travellers. The total number of travellers who used air transport was 779 188 (29,5%). The arrivals data on South African residents show that 104 485 (34,7%) came by air and 195 180 (64,8%) came by road.
In February 2013, 218 387 (90,8%) overseas tourists arrived in the country by air whilst 20 475 (8,5%) came in by road. This is in contrast to the number of tourists from the Southern African Development Community (SADC) countries who came into South Africa predominantly by road [416 863 (91,7%)].
Regional and national distribution
In February 2013, the distribution of overseas tourists who came to South Africa was as follows: Europe, 151 091 (62,9%); Asia, 37 613 (15,6%); North America, 28 340 (11,8%); Central and South America, 10 620 (4,4%); Australasia, 9 110 (3,8%); and Middle East, 3 613 (1,5%).
Virtually all tourists from Africa came from the SADC countries, [454 820 (96,0%)].
Purpose of visit
In February 2013, majority [653 997 (91,4%)] of tourists were in South Africa for holidays compared to only 38 035 (5,3%), 16 790 (2,3%) and 6 947 (1,0%) of tourists who were in South Africa on transit; for business and study purposes respectively. A detailed analysis reveals that of all the tourists from each of the overseas regions, at least 65,0% came to South Africa for holidays.
Sex and age distribution
In February 2013, there were 413 874 (57,8%) male and 301 139 (42,1%) female tourists. The overseas tourists were made up of 137 546 (57,2%)
21
male tourists and 102 565 (42,7%) female tourists. There were 261 769 (57,6%) male and 192 579 (42,3%) female tourists from the SADC countries. The tourists from ‘other’ African countries were made up of 13 451 (71,5%) males and 5 363 (28,5%) females. The ages of the tourists were categorised into three broad groups namely; those younger than 15 years, 15 to 64 years, and 65 years and older. The overall results show that 639 741 (89,4%) of tourists were aged between 15 and 64 years; 44 173 (6,2%) were aged 65 years and older and 31 377 (4,4%) were aged less than 15 years.
Table K – Number of South African residents and foreign travellers by travel direction
Travel directionFebruary January February % change % change
2012 2013 2013 February 2012 – February 2013
January 2013 – February 2013
Total 2 467 403 3 047 998 2 643 051 7,1 -13,3
South African residents 267 207 875 540 605 428 -3,5 -30,9
Arrivals 311 209 535 415 301 237 -3,2 -43,7
Departures 315 998 340 125 304 191 -3,7 -10,6
Foreign travellers 1 840 196 2 172 458 2 037 623 10,7 -6,2
Arrivals 1 006 429 1 274 134 1 101 684 9,5 -13,5
Departures 833 767 898 324 935 939 12,3 4,2
Foreign arrivals 1 006 429 1 274 134 1 101 684 9,5 -13,5
Non-visitors 53 559 119 650 56 371 5,3 -52,9
Visitors 952 870 1 154 484 1 045 313 9,7 -9,5
Visitors 952 870 1 154 484 1 045 313 9,7 -9,5
Arrivals only 359 614 556 035 371 215 3,2 -33,2
Single trips 336 324 329 134 388 542 15,5 18,0
Multiple trips 256 932 269 315 285 556 11,1 6,0
Visitors 952 870 1 154 484 1 045 313 9,7 -9,5
Same day 275 196 303 725 329 544 19,7 8,5
Overnight (tourists) 677 674 850 759 715 769 5,6 -15,9
A full release on Tourism and migration (Statistical release P0351) is available on the Stats SA website: www.statssa.gov.za
22
Civil cases for debt Number of civil summonses decrease With the high unemployment rate coupled with other economic and social problems such as inadequate education and extreme differences in income and wealth, most South Africans find themselves sinking more into debt as they attempt to achieve better living standards. Furthermore, consumers cannot repay the creditors because they are not in a good financial state to do so. As a result their debts grow bigger everyday because of the interests, which are extra charges on the original debt. In order to keep you abreast of information relating to debt in South Africa, Statistics South Africa (Stats SA) conducts a monthly sample survey of civil cases recorded and civil summonses issued for debt, for which March findings are tabled below.
The total number of civil summonses issued for debt decreased by 33,4% in the first quarter of 2013 compared with the first quarter of 2012 (see Table L). A year-on-year decrease of 38,6% was recorded in March 2013.
The categories that contributed to the 33,4% decrease were: services (contributing -11,6 percentage points); money lent (contributing -10,9 percentage points); and ‘other’ debts (contributing -6,6 percentage points).
The total number of civil judgements recorded for debt decreased by 33,1% year-on-year in the first quarter of 2013. A 35,5% decrease was recorded in March 2013 compared with March 2013.
The categories which influenced the 33,1% decrease were civil judgements relating to: money lent (contributing -21,3 percentage points); services (contributing -3,9 percentage points); and goods sold (contributing -3,5 percentage points).
The total value of civil judgements recorded for debt increased by 4,6% in the first quarter of 2013 compared with the same period in 2012. A year-on-year increase of 8,2% was recorded in March 2013.
23
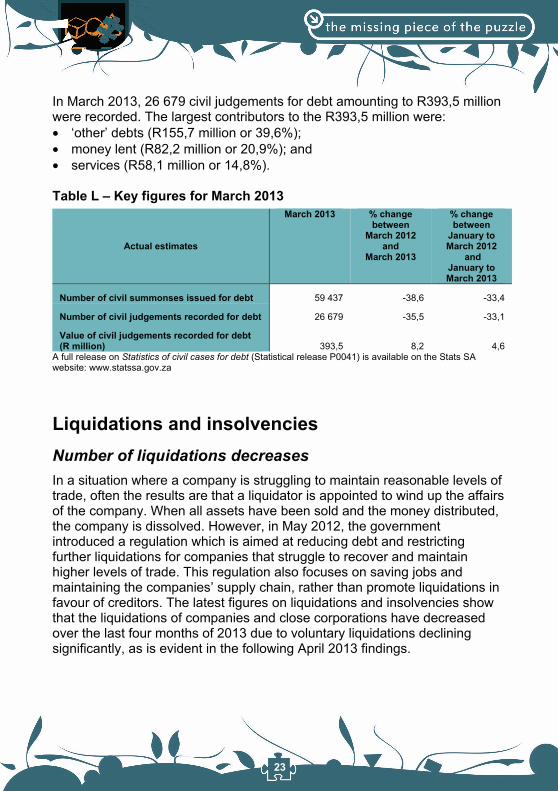
In March 2013, 26 679 civil judgements for debt amounting to R393,5 million were recorded. The largest contributors to the R393,5 million were: ‘other’ debts (R155,7 million or 39,6%); money lent (R82,2 million or 20,9%); and services (R58,1 million or 14,8%).
Table L – Key figures for March 2013
Actual estimates
March 2013 % change between
March 2012 and
March 2013
% change between
January to March 2012
and January to March 2013
Number of civil summonses issued for debt 59 437 -38,6 -33,4
Number of civil judgements recorded for debt 26 679 -35,5 -33,1
Value of civil judgements recorded for debt (R million) 393,5 8,2 4,6
A full release on Statistics of civil cases for debt (Statistical release P0041) is available on the Stats SA website: www.statssa.gov.za
Liquidations and insolvencies Number of liquidations decreases In a situation where a company is struggling to maintain reasonable levels of trade, often the results are that a liquidator is appointed to wind up the affairs of the company. When all assets have been sold and the money distributed, the company is dissolved. However, in May 2012, the government introduced a regulation which is aimed at reducing debt and restricting further liquidations for companies that struggle to recover and maintain higher levels of trade. This regulation also focuses on saving jobs and maintaining the companies’ supply chain, rather than promote liquidations in favour of creditors. The latest figures on liquidations and insolvencies show that the liquidations of companies and close corporations have decreased over the last four months of 2013 due to voluntary liquidations declining significantly, as is evident in the following April 2013 findings.
24
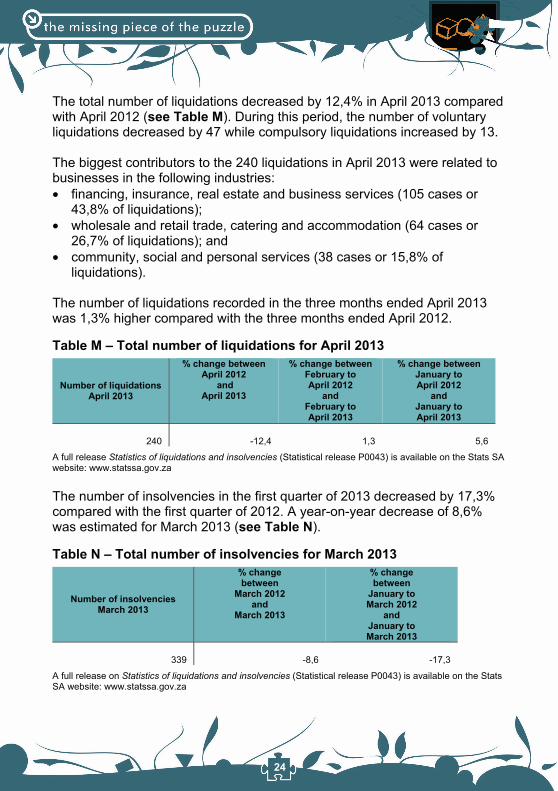
The total number of liquidations decreased by 12,4% in April 2013 compared with April 2012 (see Table M). During this period, the number of voluntary liquidations decreased by 47 while compulsory liquidations increased by 13.
The biggest contributors to the 240 liquidations in April 2013 were related to businesses in the following industries: financing, insurance, real estate and business services (105 cases or
43,8% of liquidations); wholesale and retail trade, catering and accommodation (64 cases or
26,7% of liquidations); and community, social and personal services (38 cases or 15,8% of
liquidations).
The number of liquidations recorded in the three months ended April 2013 was 1,3% higher compared with the three months ended April 2012.
Table M – Total number of liquidations for April 2013
Number of liquidations April 2013
% change between April 2012
and April 2013
% change between February to April 2012
andFebruary to April 2013
% change between January to April 2012
andJanuary to April 2013
240 -12,4 1,3 5,6
A full release Statistics of liquidations and insolvencies (Statistical release P0043) is available on the Stats SA website: www.statssa.gov.za
The number of insolvencies in the first quarter of 2013 decreased by 17,3% compared with the first quarter of 2012. A year-on-year decrease of 8,6% was estimated for March 2013 (see Table N).
Table N – Total number of insolvencies for March 2013
Number of insolvencies March 2013
% change between
March 2012 and
March 2013
% change between
January to March 2012
andJanuary to March 2013
339 -8,6 -17,3
A full release on Statistics of liquidations and insolvencies (Statistical release P0043) is available on the Stats SA website: www.statssa.gov.za
25
Land transport Number of passenger journeys decrease The Land transport survey is a monthly survey conducted by Stats SA on the land transportation industry. It covers passenger and freight transportation. Passenger transportation includes: railway, buses (scheduled, school, safari and sightseeing buses), hired cars with drivers, and metered taxis. Freight transportation on the other hand includes trains which transport goods and trucks. The results of the survey are used to compile estimates of the gross domestic product (GDP) and its components as well as an analysis of comparative business and industry performance. Detailed in this article are the statistics of the land transport survey for the month of March 2013.
Freight transport
The volume of goods transported (payload) decreased by 0,6% in March 2013 compared with March 2012 (see Table O). The corresponding income increased by 2,6% over the same period. Income from freight transportation increased by 6,4% in the first quarter of 2013 compared with the first quarter of 2012. The main contributors to this increase were: primary mining and quarrying products (9,7%, contributing
3,2 percentage points); manufactured food, beverages and tobacco products (7,6%, contributing
1,0 percentage point); and containers (18,1%, contributing 0,9 of a percentage point).
Table O – Year-on-year percentage change in freight transportation
Oct-12 Nov-12 Dec-12 Jan-13 Feb-13 Mar-13
Freight payload -4,6 4,1 -0,5 5,0 4,5 -0,6
Freight income 2,3 10,2 4,2 9,6 7,1 2,6 A full release on Land transport survey (Statistical release P7162) is available on the Stats SA website: www.statssa.gov.za
Passenger transport
The number of passenger journeys decreased by 3,1% in March 2013 compared with March 2012 (see Table P). The corresponding income increased by 20,7% over the same period.
26
Table P – Year-on-year percentage change in passenger transportation
A full release on Land transport survey (Statistical release P7162) is available on the Stats SA website: www.statssa.gov.za
PricesProducer price index (PPI) PPI was 5,4% in April 2013 In its simplest terms, producer price index (PPI) is a weighted index of prices measured at the wholesaler or producer level. While consumer price index (CPI) measures price changes from the buyer’s perspective, the producer price index (PPI) focuses on measuring price changes from the perspective of the seller. However, whenever goods are sold to the retailers at a higher cost, the strain is automatically passed on to the consumers. Key findings of the index for March 2013 are presented in this article.
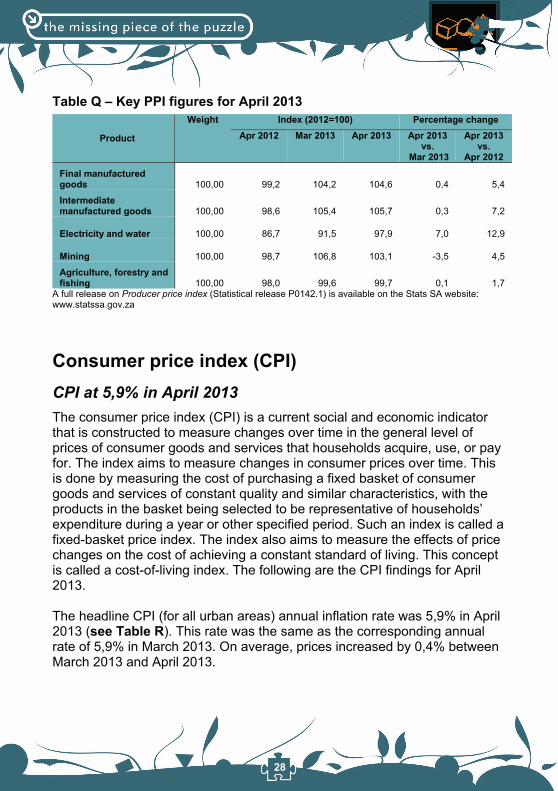
The annual percentage change in the PPI for final manufactured goods was 5,4% in April 2013 compared with 5,7% in March 2013 (see Table Q) . From March to April 2013 the PPI for final manufactured goods increased by 0,4%.
The main contributors to the annual rate of 5,4% were food products, beverages and tobacco products (6,1% year-on-year, contributing 2,0 percentage points) and coke, petroleum, chemical, rubber and plastic products (5,8% year-on-year, contributing 1,0 percentage points).
The main contributors to the monthly increase of 0,4% were food products, beverages and tobacco products (0,7% month-on-month, contributing 0,2 of a percentage point) and metal, machinery, equipment and computing equipment (1,0% month-on-month, contributing 0,2 of a percentage point).
The annual percentage change in the PPI for intermediate manufactured goods was 7,2% in April 2013 compared with 7,7% in March 2013. From
Oct-12 Nov-12 Dec-12 Jan-13 Feb-13 Mar-13
Passenger journey 4,8 0,3 -3,5 9,2 5,3 -3,1
Passenger income 17,7 15,5 14,2 16,5 16,8 20,7
27
March to April 2013 the PPI for intermediate manufactured goods increased by 0,3%.
The main contributors to the annual rate of 7,2% were chemicals, rubber and plastic products (6,7% year-on-year, contributing 2,7 percentage points) and basic and fabricated metals (5,2% year-on-year, contributing 1,5 percentage points).
The main contributor to the monthly increase of 0,3% was chemicals, rubber and plastic products (1,0% month-on-month, contributing 0,4 of a percentage point).
The annual percentage change in the PPI for electricity and water was 12,9% in April 2013 compared with 11,4% in March 2013. From March to April 2013 the PPI for electricity and water increased by 7,0%. The main contributors to the annual rate of 12,9% were electricity (13,2% year-on-year, contributing 10,9 percentage points) and water (5,1% month-on-month, contributing 0,9 of a percentage point).
The annual percentage change in the PPI for mining was 4,5% in April 2013 compared with 8,6% in March 2013. From March to April 2013 the PPI for mining decreased by 3,5%. The main contributor to the annual rate of 4,5% was non-ferrous metal ores (7,3% year-on-year, contributing 3,3 percentage points).
The main contributors to the monthly rate of -3,5% were gold and other metal ores (-6,8% month-on-month, contributing -1,6 percentage points) non-ferrous metal ores (-3,4% month-on-month, contributing -1,6 percentage points).
The annual percentage change in the PPI for agriculture, forestry and fishing was 1,7% in April 2013 compared with 0,4% in March 2013. From March to April 2013 the PPI for agriculture, forestry and fishing increased by 0,1%. The main contributor to the annual rate of 1,7% was agriculture (1,3% year-on-year, contributing 1,0 of a percentage point).
The main contributor to the monthly rate of 0,1% was forestry (0,6% month-on-month, contributing 0,1 of a percentage point).
28
Table Q – Key PPI figures for April 2013
Product
Weight Index (2012=100) Percentage change Apr 2012 Mar 2013 Apr 2013 Apr 2013
vs. Mar 2013
Apr 2013 vs.
Apr 2012
Final manufactured goods 100,00 99,2 104,2 104,6 0,4 5,4
Intermediate manufactured goods 100,00 98,6 105,4 105,7 0,3 7,2
Electricity and water 100,00 86,7 91,5 97,9 7,0 12,9
Mining 100,00 98,7 106,8 103,1 -3,5 4,5
Agriculture, forestry and fishing 100,00 98,0 99,6 99,7 0,1 1,7
A full release on Producer price index (Statistical release P0142.1) is available on the Stats SA website: www.statssa.gov.za
Consumer price index (CPI) CPI at 5,9% in April 2013 The consumer price index (CPI) is a current social and economic indicator that is constructed to measure changes over time in the general level of prices of consumer goods and services that households acquire, use, or pay for. The index aims to measure changes in consumer prices over time. This is done by measuring the cost of purchasing a fixed basket of consumer goods and services of constant quality and similar characteristics, with the products in the basket being selected to be representative of households’ expenditure during a year or other specified period. Such an index is called a fixed-basket price index. The index also aims to measure the effects of price changes on the cost of achieving a constant standard of living. This concept is called a cost-of-living index. The following are the CPI findings for April 2013.
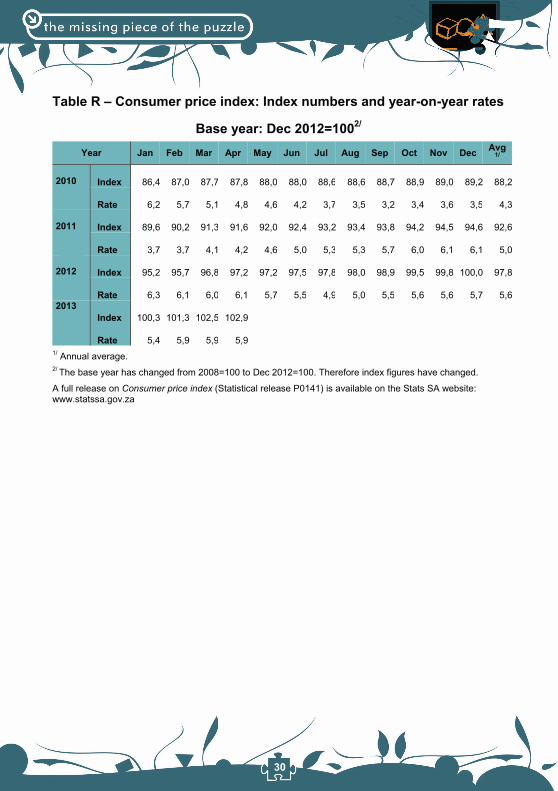
The headline CPI (for all urban areas) annual inflation rate was 5,9% in April 2013 (see Table R). This rate was the same as the corresponding annual rate of 5,9% in March 2013. On average, prices increased by 0,4% between March 2013 and April 2013.
29
The food and non-alcoholic beverages index increased by 0,5% between March 2013 and April 2013. The annual rate increased to 6,2% in April 2013 from 5,7% in March 2013. The following components in the food and non-alcoholic beverages index decreased: vegetables (3,2%); fruit (1,0%); sugar, sweets and desserts (1,0%); fish (0,9%); bread and cereals (0,7%); hot beverages (0,6%); milk, eggs and cheese (0,2%); and cold beverages (0,2%).
The oils and fats, and meat components decreased by -1,0% and -0,4% respectively.
The alcoholic beverages and tobacco index increased by 1,2% between March 2013 and April 2013, mainly due to increases in excise duties. The annual rate increased to 6,5% in April 2013 from 5,8% in March 2013.
The transport index increased by 0,5% between March 2013 and April 2013, mainly due to a 12 cent a litre increase in the price of petrol. The annual rate increased to 6,2% in April 2013 from 7,5% in March 2013.
The miscellaneous goods and services index increased by 0,4% between March 2013 and April 2013. The annual rate decreased to 7,5% in April 2013 from 7,4% in March 2013.
The provinces with an annual inflation rate lower than or equal to headline inflation were KwaZulu-Natal (5,8%), Northern Cape (5,7%), Western Cape (5,6%), Free State (5,6%) and Eastern Cape (5,4%). The provinces with an annual inflation rate higher than headline inflation were Limpopo (6,4%), Gauteng (6,1%) and North West (6,0%).
30
Table R – Consumer price index: Index numbers and year-on-year rates
Base year: Dec 2012=1002/
Year Jan Feb Mar Apr May Jun Jul Aug Sep Oct Nov Dec Avg 1/
2010 Index 86,4 87,0 87,7 87,8 88,0 88,0 88,6 88,6 88,7 88,9 89,0 89,2 88,2
Rate 6,2 5,7 5,1 4,8 4,6 4,2 3,7 3,5 3,2 3,4 3,6 3,5 4,3
2011 Index 89,6 90,2 91,3 91,6 92,0 92,4 93,2 93,4 93,8 94,2 94,5 94,6 92,6
Rate 3,7 3,7 4,1 4,2 4,6 5,0 5,3 5,3 5,7 6,0 6,1 6,1 5,0
2012 Index 95,2 95,7 96,8 97,2 97,2 97,5 97,8 98,0 98,9 99,5 99,8 100,0 97,8
Rate 6,3 6,1 6,0 6,1 5,7 5,5 4,9 5,0 5,5 5,6 5,6 5,7 5,62013
Index 100,3 101,3 102,5 102,9
Rate 5,4 5,9 5,9 5,91/ Annual average. 2/ The base year has changed from 2008=100 to Dec 2012=100. Therefore index figures have changed.
A full release on Consumer price index (Statistical release P0141) is available on the Stats SA website: www.statssa.gov.za
31
Glossary
Primary industries
Gigawatt-hour (gWh): one gigawatt-hour of electricity is equal to one million kilowatt-hours. A kilowatt-hour is the basic unit of electrical energy equal to one kilowatt of power supplied to or taken from an electric circuit steadily for one hour. One kilowatt-hour equals one thousand watt-hours.
Index of physical volume of manufacturing production: also known as a production index, is a statistical measure of the change in the volume of production. The production index of a major group is the ratio between the volume of production of a major group in a given period and the volume of production of the same major group in the base period.
Index of physical volume of mining production: a statistical measure of the change in the volume of production. The production index of a mineral group is the ratio between the volume of production of a mineral group in a given period and the volume of production of the same mineral group in the base period.
Index of the physical volume of electricity production: a statistical measure of the change in the volume of production of electricity in a given period and the volume of production of electricity in the base period.
Industry: a group of establishments engaged in the same or similar kinds of economic activity.
PGMs – Platinum group metals: include platinum; iridium; osmiridium, palladium; rhodium; ruthenium and osmium.
Sales: total value of sales and transfers-out of goods mined by the mining establishments and the amounts received for installation, erection or assembly or other services.
Secondary industries
Additions and alterations: extensions to existing buildings as well as internal and external alterations of existing buildings.
32
Blocks of flats: a structure, usually multi-storey, consisting of a number of dwellings sharing the same residential address, and usually sharing a common entrance, foyer or staircase.
Dwelling houses: a free-standing, complete structure on a separate stand or a self-contained dwelling-unit, e.g. granny flat, on the same premises as existing residence. Out-buildings and garages are included.
Other residential buildings: include institutions for the disabled, boarding houses, old age homes, hostels, hotel, motels, guest houses, holiday chalets, bed and breakfast accommodation, entertainment centres and casinos.
Residential buildings: dwelling houses, flats, townhouses and other residential buildings.
Tertiary industries
Acknowledgements of debt: a statement by a person/debtor in which he admits that he owes money to an individual or a company or a bank.
Average income per stay unit night sold: average rate per stay unit (i.e. rate per room in a hotel or powered site in a caravan park) is calculated by dividing the total income from accommodation by the number of stay unit nights sold in the survey period.
Catering services: enterprises involved in the sale and supply of meals and drinks prepared on the premises on a contract basis and brought to other premises chosen by the person ordering them, to be served for immediate consumption to guests or customers. Include bars, taverns, other drinking places, ice-cream parlours, etc.
Civil judgements: decisions taken in a civil matter or a dispute between two people or parties.
Civil summonses: notices to appear before the court of law where a dispute between two parties or people has to be heard, i.e. not for criminal offence.
Enterprise: a legal entity or a combination of legal units that includes and directly controls all functions necessary to carry out its sales activities.
33
Foreign traveller: a person who resides outside South Africa and visits the country temporarily.
Income from accommodation industry: income from amounts charged for rooms or equivalent. Other income is excluded (e.g. income from meals).
Income from bar sales: refers to income from liquor sales.
Income from food sales: refers to income from the sale of meals and non-alcoholic drinks.
Income from restaurant and bar sales: income from meals, banqueting and beverages and tobacco sales.
Insolvency: refers to an individual or partnership which is unable to pay its debt and is placed under final sequestration. The number of insolvencies does not refer to the number of persons involved, as a partnership which is unable to pay its debt is regarded as one insolvency, irrespective of the number of partners.
Liquidation: refers to the winding-up of the affairs of a company or close corporation when liabilities exceed assets and it can be resolved by voluntary action or by an order of the court.
Microdata: data gathered on a small scale, such as data on an individual.
‘Other’ African countries: refers to all non SADC African countries.
Other income: includes all income not earned from food sales or bar sales.
Other SADC: refers to the thirteen countries, excluding South Africa, that belong to the Southern African Development Community.
Professional services: refer to medical doctors, dentists, advocates, attorney, auditors, accountants, architects, engineers, hospital services etc.
Promissory notes: written undertaking, signed by a person or party, to pay money to another person or to be the bearer of such a note on a specific date or on demand.
34
Restaurants and coffee shops: enterprises involved in the sale and provision of meals and drinks, ordered from a menu, prepared on the premises for immediate consumption and with provided seating.
Retailer: a retailer is an enterprise deriving more than 50% of its turnover from sales of goods to the general public for household use.
Retail trade: includes the resale (sale without transformation) of new and used goods and products to the general public for household use.
Stay unit: unit accommodation available to be charged out to guests, for example, a powered site in a caravan park or a room in a hotel.
Stay unit night sold: total number of stay units occupied on each night during the survey period.
Takeaway and fast-food outlets: enterprises involved in the sale and provision of meals and drinks, ordered from a menu, prepared on the premises for takeaway purposes in a packaged format, at a stand or in a location, with or without provided seating.
Total income: includes income from food sales, income from bar sales and other income.
Tourism: comprises the activities of persons travelling to, and staying in places outside their usual environment, for not more than one consecutive year, for leisure, business and other purposes not related to the exercise of an activity remunerated from within the place visited.
Tourist: a visitor who stays at least one night in the place visited.
Traveller: any person on a trip between two or more countries or between two or more localities within his/her country of residence.
Voluntary liquidation: takes place when a company or close corporation, by own choice, resolves to wind-up its affairs.
Wholesale trade: Includes the resale (sale without transformation) of new and used goods and products to other wholesalers, retailers, agricultural, industrial, commercial, institutional and professional users either directly or through agents on a fee or contract basis.
35
PricesAnnual percentage change: change in the index of the relevant month of the current year compared with the index of the same month in the previous year expressed as a percentage.
Consumer price index (CPI): an index that measures the price of a fixed basket of consumer goods and services.
Inflation rate: annual percentage change in the CPI for all items of the relevant month of the current year compared with the CPI for all items of the same month in the previous year expressed as a percentage.
Monthly percentage change: change in the index of the relevant month compared to the index of the previous month expressed as a percentage. Year-on-year: A term used frequently in investment research and other reports to mean ‘compared with the same period in the previous fiscal year’.