Embed Size (px)
Citation preview

D E PA RT M E N T O F P R I M A RY I N D U S T RY A N D R E S O U R C E S
STATUS OF KEY NORTHERN TERRITORY FISH STOCKS REPORT 2015
Fishery Report No. 118

Statusof KeyNorthernTerritoryFish StocksReport2015

STATUS OF KEY NORTHERN TERRITORY FISH STOCKS REPORT 2015
June 2017
Northern Territory Government Department of Primary Industry and Resources GPO Box 3000 Darwin NT 0801 www.nt.gov.au

© Copyright
Northern Territory Government 2017
This work is copyright. Except as permitted under the Copyright Act 1968 (Commonwealth) no part of this publication may be reproduced by any process, electronic or otherwise, without the specific written permission of the copyright owners. Nor may information be stored electronically in any form whatsoever without such permission.
Disclaimer
While all care has been taken to ensure that information contained in this Fishery Report is true and correct at the time of publication, changes in circumstances after the time of publication may impact on the accuracy of its information.
The Northern Territory of Australia gives no warranty or assurance, and makes no representation as to the accuracy of any information or advice contained in this Fishery Report, or that it is suitable for your intended use.
You should not rely upon information in this publication for the purpose of making any serious, business or investment decisions without obtaining independent and/or professional advice in relation to your particular situation. The Northern Territory of Australia disclaims any liability or responsibility or duty of care towards any person for loss or damage caused by any use of or reliance on the information contained in this publication.
June 2017
Bibliography
Northern Territory Government (2016). Status of Key Northern Territory Fish Stocks Report 2015. Northern Territory Government. Department of Primary Industry and Resources. Fishery Report No. 118.
ISSN (print): 2205-6629 ISSN (online): 2205-6661
Fishery Report No. 118 ISSN (print): 0158-2224 ISSN (online): 2205-667X
STATUS OF KEY NORTHERN TERRITORY FISH STOCKS REPORT 2015
iii
DIRECTORS MESSAGE
Northern Territory fisheries are diverse in their area of operation and the species they target. From recreational anglers targeting Barramundi in freshwater billabongs to commercial trawl fishers targeting a range of tropical snapper species on the continental shelf and on the high seas, the Territory provides some of the best fishing experiences in the world.
It is the responsibility of the Fisheries Division of the Department of Primary Industry and Resources as the steward of these resources, to manage and utilise them for the benefit of all Territorians, both present and future generations, to the best of our abilities, based on the best science available.
This is the third Status of Key Northern Territory Fish Stocks Report produced by the Department following the national template for the Status of Key Australian Fish Stocks Reports which was first produced in 2012 and subsequently released every two years since. The change to the national reporting framework has been undertaken to improve the reporting of the status of shared stocks with other jurisdictions and to follow the national standard in species stock status reporting that is more rigorous than the process previously used in the Fishery Status Reports.
The Status of Key Northern Territory Fish Stocks Report covers 12 key species that underpin the Territory’s wild-catch fisheries. It focuses on the ongoing sustainability of the harvest from these species, thereby providing scientific assessments of the status of the stocks.
The Report provides a scientifically robust and simple tool to inform fishers, seafood consumers, managers, policy makers and the broader community about the status of the key wild-caught fish stocks in the Northern Territory.
Glenn Schipp

FISHERY REPORT NO. 118
iv
Contents
Directors Message ............................................................................................................................................. iii
INTRODUCTION ..................................................................................................................................... 5
FISH STOCKS .......................................................................................................................................... 6
FISHING METHODS .............................................................................................................................. 13
REFERENCES ........................................................................................................................................ 24
OVERVIEW OF NORTHERN TERRITORY MANAGED FISHERIES ................................................................ 25
Mud Crab Scylla serrata and S. olivacea .......................................................................................................... 35
Sandfish Holothuria scabra .............................................................................................................................. 42
The Australian Blacktip Shark Carcharhinus tilstoni and the Common Blacktip Shark C. limbatus ................ 46
Barramundi Lates calcarifer ............................................................................................................................. 51
Black Jewfish Protonibea diacanthus .............................................................................................................. 56
King Threadfin Polydactylus macrochir ........................................................................................................... 61
Spanish Mackerel Scomberomorus commerson .............................................................................................. 66
Grey Mackerel Scomberomorous semifasciatus ............................................................................................. 71
Crimson Snapper Lutjanus erythropterus ........................................................................................................ 76
Goldband Snapper Pristipomoides multidens ................................................................................................. 81
Golden Snapper Lutjanus johnii ....................................................................................................................... 85
Saddletail Snapper Lutjanus malabaricus ........................................................................................................ 90
GLOSSARY ........................................................................................................................................................ 96

STATUS OF KEY NORTHERN TERRITORY FISH STOCKS REPORT 2015
5
INTRODUCTION
The tropical waters of the Northern Territory (NT) are home to a wide variety of economically, socially and culturally important fish species. The Fisheries Division of the Department of Primary Industry and Resources (DPIR) is responsible for the ecologically sustainable development of these aquatic resources and publishes regular updates on their condition.
This report provides the status of key fish stocks in the NT following the format of the Status of Key Australian Fish Stocks Reports 20141. The term ‘fish’ is used here to describe animals caught by wild-capture fisheries and includes crustaceans (such as Mud Crabs), echinoderms (such as Sea Cucumbers), finfish and sharks. Regional differences in common names for the same fish species have led to the development of the Australian Fish Names Standard (www.fishnames.com.au). This naming convention applies capitals to the titles of most commercially important fish species (and species groups) and is employed here to facilitate comparisons with other jurisdictional reports.
Fisheries management considers a range of factors beyond the harvest of the target species. These include the effects of fishing on the marine environment, the economic performance of fisheries and the governance structures, which control how they operate. Although these issues are considered in each stock status classification, this information is typically given in the form of comments regarding the effects of fishing on the marine environment and environmental effects on fish stocks. These summaries are included in response to the increasing interest in the state of fish stocks, the sustainability of fisheries and the health of the marine environment from fishers, seafood consumers, policy makers and the broader community.
Territorians value the healthy state of our fisheries. Many Aboriginal communities have strong customary links with the aquatic environment and rely on fish for food, culture and development opportunities. Our commercial fisheries and the aquaculture industry are valued at around $60 million per annum and provide high quality seafood (such as Mud Crabs, tropical snappers, Barramundi, shark and mackerel) to restaurants and retail markets.
New and innovative aquaculture projects have recently begun in partnership with local companies and remote Aboriginal communities. Advances in culture methods for Sea Cucumbers, Giant Clams and Tropical Rock Oysters have been encouraging, with pilot studies underway at Groote Eylandt, Goulburn Island and the Tiwi Islands.
Recreational fishing is also an intrinsic part of the NT lifestyle, with quality fishing experiences attracting many visitors and supporting a major guided fishing industry. Annual expenditure by recreational fishers and the guided fishing industry is estimated at over $100 million.
All NT managed fisheries have governance structures in place to control the harvest rate and minimise environmental impacts. Nonetheless, careful monitoring and management must continue in order to ensure the sustainable and optimal use of our aquatic resources, particularly in high-use areas near major population centres. For example, concerns regarding overfishing of Black Jewfish and Golden Snapper stocks near Darwin have led to the development of a new set of management controls to address this emerging problem. Ongoing vigilance is also required to prevent the introduction of aquatic pests and diseases into NT waters.
As a custodian of the aquatic resources of the NT, DPIR works with a diverse range of stakeholder groups (such as fishing guides, commercial fishers, recreational fishers, aquaculture enterprises and Aboriginal land councils) to promote fisheries and aquaculture development and facilitate access and sharing of fisheries resources. Representatives from these groups also provide advice to a number of management advisory groups and committees associated with specific fisheries or user groups.

FISHERY REPORT NO. 118
6
Fisheries compliance is generally undertaken by the Water Police Section of the NT Police, Fire and Emergency Services, with the Australian Fisheries Management Authority being responsible for compliance in two offshore fisheries managed by DPIR. Indigenous marine ranger groups also play an increasingly valuable role in monitoring our fisheries and coastlines; DPIR provides training and support to enhance the skills and capacity of ranger groups to undertake these tasks.
FISH STOCKS
The Status of Key Northern Territory Fish Stocks Report 2015 focuses on the status of biological stocks of fishes wherever possible; hence, it is important to distinguish between biological stocks and fisheries. Biological stocks are discrete populations of a fish species, usually in a given geographical area and with limited interbreeding with other biological stocks of the same species. Although one fish species may exist in many locations around Australia (or worldwide), fish caught in different areas may come from separate biological stocks. Individual biological stocks may be found in a single jurisdiction or may be shared across two or more jurisdictions. In some cases, individual biological stocks may also extend into the high seas.
The number and geographic range of individual biological stocks can vary greatly between species. For example, Australian Blacktip Sharks consist of two expansive stocks, one extending from Western Australia into the western NT and another extending from the eastern NT into western Queensland and down the eastern seaboard. By contrast, Barramundi consist of numerous, localised stocks, most of which are confined to individual river catchments. Because separate biological stocks have limited connectivity, fishing one stock may not affect the others. Hence, it is important to assess each biological stock separately, wherever possible.
Biological stocks are natural resources, and different biological stocks may have different natural abundance, growth rates and mortality rates. Different biological stocks may also be influenced by different environmental factors, depending on where they occur. Consequently, the amount of fish (of a given species) that can be sustainably harvested from one biological stock may be very different to that from another stock.
Fisheries differ from fish stocks in that they are management units engaged in the harvest of fish. Fisheries are typically defined in terms of the people involved, the species caught, the area of water or seabed fished, fishing methods and the types of boats used2. A single biological stock may be caught by one or a number of fisheries. Similarly, a single fishery may catch one or a number of different species, from one or more different biological stocks.
A key measure of fisheries management performance is the status of the fish stocks—the natural resource on which the fisheries depend. Therefore, this report provides status classifications for fish stocks. Where possible, this takes into account the impacts of all fisheries at the level of individual biological stocks. Where the stock delineation is not known (that is, it is not known exactly where one biological stock finishes and the next begins) or the numbers of biological stocks for a species are very high, reporting has been undertaken at the level of either the jurisdiction or the management unit. The level of reporting (biological stock management unit or jurisdiction) for each species is presented at the beginning of each chapter, along with the rationale for this choice. In these reports, the term ‘stock’ is used generically to refer to all three levels of stock status assessment—biological stocks, management units and populations assessed at the jurisdictional level. In future, most species currently assessed at the management unit or jurisdictional level will be assessed at the biological stock level, wherever research has revealed the biological boundaries of the stocks.

STATUS OF KEY NORTHERN TERRITORY FISH STOCKS REPORT 2015
7
Stock status classification system In general, stock status classifications assess whether the current abundance (i.e. number or biomass) of fish in a stock is at an adequate level and whether the level of fishing pressure (the amount of fish being removed through fishing) is adequately controlled through management.
The abundance of a wild fish stock is usually compared with an estimate of the abundance of that same stock before fishing began. Abundance is considered to be adequate if there is sufficient adult stock remaining, such that the production of juveniles (recruitment) is not significantly reduced. That is, the abundance of adults has not been depleted to the point where there is an increased risk of recruitment failure. This level of adult abundance will vary between different species of fish.
In terms of fishing pressure, stock status considers whether the current level of fishing pressure is adequately constrained, such that stock abundance is not reduced to a point where production of juveniles is significantly reduced. Where information is available, the level of fishing pressure includes consideration of Indigenous and recreational (including charter) fishing as well as commercial fishing.
The classification system used here combines information on both the current stock size and the level of catch into a single classification for each stock (Table 1; Figure 1). To classify stocks into one of these categories, the current abundance and level of fishing pressure are compared with defined biological reference points (see ‘Reference points’, below). Each stock is then classified as a sustainable stock, transitional–recovering stock, transitional–depleting stock, overfished stock or environmentally limited stock.
Stocks are classified as environmentally limited if the spawning stock biomass has been reduced to the point where average recruitment levels are significantly reduced, primarily as a result of substantial environmental changes/impacts or disease outbreaks (that is, the stock is not recruitment overfished). Fisheries management must have also responded appropriately to the environmental change in productivity.
For ease of interpretation, the classifications are also depicted by a colour-coding system. An ‘overfished stock’ classification (red) indicates that a management response is required to ensure the sustainability of the stock in question.
The term ‘sustainable stock’ refers specifically to the biological status of fish stocks and does not take into account broader ecological or economic considerations. A sustainable stock classification is given to stocks that are above the biological limit reference point of ‘recruitment overfished’ (see below) and for which the level of current fishing mortality is considered unlikely to cause the stock to become recruitment overfished. Given the focus of this report on stock status, the term does not have the broader meaning of such terms as ‘ecologically sustainable’ or ‘ecologically viable’, which consider the sustainability of the entire ecosystem and the role of specific stocks in the function of the ecosystem3.

FISHERY REPORT NO. 118
8
Table 1. Stock status terminology for the Northern Territory status of key fish stocks reports
Stock status Description Potential implications for management of the stock
Sustainable Stock for which biomass (or biomass proxy) is at a level sufficient to ensure that, on average, future levels of recruitment are adequate (i.e. not recruitment overfished) and for which fishing pressure is adequately controlled to avoid the stock becoming recruitment overfished.
Appropriate management is in place.
↑
Transitional–recovering
Recovering stock—biomass is recruitment overfished, but management measures are in place to promote stock recovery and recovery is occurring.
Appropriate management is in place and the stock biomass is recovering.
↓
Transitional–depleting
Deteriorating stock—biomass is not yet recruitment overfished, but fishing pressure is too high and moving the stock in the direction of becoming recruitment overfished.
Management is needed to reduce fishing pressure and ensure that the biomass does not deplete to an overfished state.
Overfished Spawning stock biomass has been reduced through catch so that average recruitment levels are significantly reduced (i.e. recruitment overfished). Current management is not adequate to recover the stock, or adequate management measures have been put in place but have not yet resulted in measurable improvements.
Management is needed to recover this stock; if adequate management measures are already in place, more time may be required for them to take effect.
Environmentally limited
Spawning stock biomass has been reduced to the point where average recruitment levels are significantly reduced, primarily as a result of substantial environmental changes/impacts, or disease outbreaks (i.e. the stock is not recruitment overfished). Fisheries management has responded appropriately to the environmental change in productivity.
Appropriate management is in place.
Undefined Not enough information exists to determine stock status.
Data required to assess stock status are needed.

STATUS OF KEY NORTHERN TERRITORY FISH STOCKS REPORT 2015
9
Figure 1. Diagrammatic representation of stock status classification system, with relative fishing mortality (the ratio of current fishing mortality to the fishing mortality that would cause the stock to become recruitment overfished) on the x axis and relative spawning biomass (the ratio of current spawning biomass to the recruitment overfished spawning biomass limit) on the y axis
* Note that part of the transitional–recovering block has been marked as ‘overfished’. This represents stocks for which adequate management measures have been put in place, but these have not yet resulted in measurable improvements. Since environmentally limited stocks are not below the limit reference point as a result of fishing pressure, they are not included in this diagram.
Reference points Biological reference points help to identify when stock abundance is too low or fishing pressure is too high. Formal reference points in a fishery generally include targets to indicate where we would like to be and limits to show what to avoid. Stock assessments usually produce estimates of abundance and fishing pressure over time, which can be assessed against biological reference points. The use of reference points to guide management decisions is consistent with the Food and Agriculture Organization Code of conduct for responsible fisheries4.
Limit reference points The limit reference points used to determine stock status for management response vary between fisheries and management agencies. In this report, ‘recruitment overfished’ is used as the biological limit reference point for determining whether or not a fish stock is overfished. ‘Recruitment overfished’ is defined as:
The point at which a stock is considered to be recruitment overfished is the point where the spawning stock biomass has been reduced through catch so that average recruitment levels are significantly reduced.
The percentage of the unfished abundance that is considered to represent a recruitment overfished state can vary across species and stocks, based on differences in biology. Although limit reference points may also include economic considerations, or precautionary buffers against measurement uncertainty, these additional measures are not included in the strict definition of biological limit reference points used here.

FISHERY REPORT NO. 118
10
With respect to fishing pressure, for a stock to be classified as a sustainable stock, the current level of fishing pressure must be at a level considered to be unlikely to cause the stock to become recruitment overfished—that is, recruitment overfishing should not be occurring.
Target reference points Target reference points correspond to levels of biomass and fishing pressure that are considered to be ideal. Generally, fisheries management aims to ensure that stocks are maintained at these levels and away from limit levels. Target reference points commonly incorporate management objectives, such as maximising the sustainable yield or economic returns. For example, the Commonwealth Fisheries Harvest Strategy Policy seeks to maintain fish stocks, on average, at a target biomass equal to the biomass that would produce maximum economic yield5.
There is no single agreed national target level, so it is not yet possible to include quantitative information based on targets in stock status determinations. Although the stock status determinations provided in these reports rely on limit reference points, it is envisaged that, in the future, stock status classification will consider stock status in relation to targets as well as limits.
Defining stock status—weight-of-evidence approach Assessing the status of fish stocks can be a difficult task. The methods used to monitor and assess stock status vary, ranging from simple catch levels to complex stock assessments. Smaller-volume and lower-value stocks and fisheries often have fewer data available or limited resources to undertake quantitative stock assessments. If targeted catch from a stock is very low, or a species is only taken in small numbers as byproduct, it may not be cost-effective to invest in the development of resource-intensive quantitative stock assessment models. However, robust stock status assessments can be made without having quantitative stock assessments.
A weight-of-evidence approach is achieved by systematically considering a range of biological and fisheries information. The approach provides a structured, scientific process for assembly and review of indicators of biomass status and levels of fishing mortality. For most fish stocks, particularly in the smaller fisheries, only a subset of the types of evidence is available and/or useful. Expert judgment plays an important role in stock status determination, with an emphasis on documenting the key evidence and rationale for the decision. The decision-making process is undertaken separately for abundance and fishing pressure.
The lines of evidence used in the weight-of-evidence approach include:
• Empirical indicators, including catch, effort, catch rate, size- or age-based indicators, and spatial and temporal distribution of the fishery.
• Risk assessments. • Fishery-independent surveys. • Quantitative stock assessment models. • Harvest strategies.
Stock assessments Stock assessments are one of the main sources of information for determining stock status. Stock assessments are mathematical and statistical models that are used to predict the stock abundance and response to fishing. They typically incorporate information on growth, natural mortality, the stock–recruitment relationship and carrying capacity, and data from fishery-dependent sources (for example, catch and fishing effort) and fishery-independent sources (for example, surveys). The outputs of these assessments generally include an indication of the unfished stock abundance (that is, how big the stock was before fishing began), current stock abundance and current fishing pressure. In combination with biological reference points, the information from a stock assessment can be used to determine the stock status classification.

STATUS OF KEY NORTHERN TERRITORY FISH STOCKS REPORT 2015
11
Abundance: Stock assessments of different species use different ways of expressing current stock size because of differences in biology and management systems. Abundance descriptors may include spawning stock biomass, total biomass, or egg/pup production. However, regardless of the type of descriptor used, the basic premise is that, for the stock to be classified as a sustainable stock, the level of abundance (biomass) must be above the level that results in the stock being recruitment overfished. This means that the abundance of adults will not have been reduced to the point where there is increased risk of recruitment failure.
Fishing pressure: In some cases, estimates of fishing mortality are explicitly stated for a stock, where they are available. In these cases, the actual fishing mortality can be compared with fishing mortality limits set by management rules to determine whether current fishing pressure is likely to cause the stock to become recruitment overfished. In other cases, stock assessment models are used to determine total allowable catches (TACs), which are designed to ensure that the stock remains at (or will return to) an adequate size—often defined by target reference points. In these cases, it is useful to compare the catch from a stock with that recommended by the TAC. If the catch is below or equal to a biologically meaningful TAC, the current level of fishing pressure is unlikely to cause the stock to become recruitment overfished.
Effects of fishing on the marine environment The stock status classification provided for each stock does not take into account the effects of fishing on the marine environment. As discussed previously, these elements of the broader concept of ecologically sustainable development tend to be considered at the fishery level, rather than at the stock level. Although no formal classification has been given, the effects of fishing on the marine environment are briefly explored in each species’ chapter and the measures that have been put in place to mitigate detrimental effects are described.
Assessments of Northern Territory fisheries under the Environment Protection and Biodiversity Conservation Act 1999 The environmental performance of NT managed fisheries that have an export component and/or operate in Commonwealth waters is assessed under the Environment Protection and Biodiversity Conservation Act 1999 (EPBC Act).
The Australian Government’s Department of the Environment assesses a fishery’s management arrangements for consistency with the EPBC Act using criteria listed in the Guidelines for the ecologically sustainable management of fisheries (2nd edition)3. The guidelines outline specific principles and objectives to ensure a strategic and transparent way of evaluating the ecological sustainability of fishery management arrangements. The guidelines include the principles that:
• A fishery must be conducted in a manner that does not lead to overfishing; for those stocks that are overfished, the fishery must be conducted such that there is a high probability that the stock(s) will recover.
• Fishing operations should be managed to minimise their impact on the structure, productivity, function and biological diversity of ecosystems6.
An assessment is undertaken if:
• product from the fishery is to be exported, • the fishery is to operate in Commonwealth waters, and/or • the fishery is to be managed by the Commonwealth.

FISHERY REPORT NO. 118
12
Part 13A Export
An Australian native wildlife specimen can only be exported for commercial purposes if it is approved for export from a program, such as an approved wildlife trade operation, or is included in the list of exempt native specimens.
Part 13 Species and Communities
Under part 13 of the EPBC Act, it is an offence to harm listed threatened species (except a conservation-dependent species) in Commonwealth waters unless a fisher has obtained a permit or the management arrangements for the fishery are accredited under the Act. Management arrangements can be accredited under Part 13 if the Environment Minister is satisfied that:
• The management arrangements require individual fishers to take all reasonable steps to avoid killing or injuring a member of a species protected under the EPBC Act (that is, a threatened species, a listed migratory species, a listed marine species or cetacean).
• The fishery does not, or is not likely to, adversely affect the conservation status of protected species, or affect the survival and recovery of listed threatened species6.
NT managed fisheries that have undergone EPBC Act assessments (and can export product) include the Aquarium Fishery, the Demersal Fishery, the Mud Crab Fishery, the Offshore Net and Line Fishery, the Spanish Mackerel Fishery, the Timor Reef Fishery and the Trepang Fishery. Details of these assessments are not presented in the species chapters of this report because they relate to the operation of individual fisheries rather than the stock status of individual species. The reader can, however, access all EPBC Act assessments for NT managed fisheries from: http://www.environment.gov.au/marine/fisheries/nt-managed-fisheries.
Environmental effects on stocks Many fish stocks vary naturally as a result of the effects of the environment, even in the absence of fishing. For example, recruitment of Barramundi can be affected by rainfall7, 8. Weather events, ocean currents, changes in climate and disease can all affect fish abundance. Where links have been established between environmental factors and stock abundance for a given species, they are outlined in the species chapters.
Non-fishing factors that affect the sustainability of fish stocks Human activities unrelated to fishing can have a substantial impact on the sustainability of fish stocks—for example, the clearing of mangroves for coastal development. Although the impacts of human activities are not discussed on a species-by-species basis, these factors may, in some cases, have a greater impact on fish stocks than fishing.
What to expect in each species report Each chapter describes the distribution of stocks of key species in the NT and provides stock status classifications for each. In cases where biological stock delineation is known and the number of discrete biological stocks is small, information is presented at the level of biological stocks. Otherwise, information is presented at the management unit or jurisdictional level.
Catch estimates for each stakeholder group that harvests key species are provided in summary tables. The reader is advised that there are significant differences in the currency of catch data for the commercial, recreational and Indigenous fishing sectors. Historical catch estimates for recreational and Indigenous fishers cannot be assumed to be representative of current catches due to the inherent variability in annual catches seen in the tropics (primarily due to differences in wet season rainfall).

STATUS OF KEY NORTHERN TERRITORY FISH STOCKS REPORT 2015
13
Additional catch per unit effort information for some commercial fisheries is presented where relevant. The effects of fishing on the marine environment (and associated mitigation measures) are also summarised, as are the environmental factors which affect fish stocks.
Reporting period These reports present calendar year data to the end of 2015 and the results of stock assessments based on data collected to that point.
FISHING METHODS
Fishing gear and methods are designed to take into account the particular characteristics and behaviour of the target species, including their feeding, spawning, shoaling and migratory behaviour, their ecology or relationship with their habitat and their herding behaviour. The catchability of each species depends on the action of the gear; the composition of the catch from a particular fishing area may, therefore, depend on the type of gear used. The information presented here is based on the 1993 authoritative Australian fisheries resources9 and is updated to reflect changes in fishing techniques and management over the past 20 years.
Nets Fishing nets are used in a wide variety of configurations and designs, depending on the species targeted. Four main types of fishing gear use netting: gillnets and entanglement nets, surrounding nets, seine nets and trawls. The main components of a common net are described below.
The netting or mesh is the panel of net that fish will encounter and be retained in. Modern nets are typically constructed from synthetic fibres, such as monofilament nylon for gillnets and multiple twisted or braided polymer filaments for seine and trawl nets.
The top edge of the net is attached to a rope called the headline, float-line or cork-line. Floats are attached to the headline to provide buoyancy.
The bottom edge of the net is attached by hanging twine to a rope called the footrope or lead-line. Weights or sinkers made of lead or other materials are attached to the footrope and spread the net vertically in the water. The type and number of floats and weights used depends on whether the net is to be positively or negatively buoyant (see below).
Gillnets Gillnets consist of a panel (or panels) of net held vertically in the water column, either in contact with the seabed or suspended from the sea surface. The size of the net mesh determines the size range of the species caught, since smaller fish are able to swim through larger mesh. In most cases, maximum net length and minimum mesh size are regulated. Gillnets are used in offshore and inshore waters and estuaries.

FISHERY REPORT NO. 118
14
Figure 2. A common net
Fish are caught in gillnets in one of three ways:
• Gilled—the fish tries to swim through one or more meshes; if it cannot pass through, it becomes caught behind its gill covers as it tries to back out of the net.
• Wedged—the fish is tightly held in the net around the body by one or more meshes. • Tangled—the fish is caught in the net by some part of its body, such as protruding fins or spines.
Pelagic gillnets (also known as (aka) drifting gillnets) are used in the NT Offshore Net and Line Fishery to target tropical sharks and mackerels. Pelagic gillnets are made up of individual net panels tied together, allowing easy removal or replacement of damaged sections. They are set in open water and can be set with the headline on the sea surface (positively buoyant) or suspended below the surface (negatively buoyant), with one end of the net remaining attached to the vessel.
Figure 3. A pelagic gillnet

STATUS OF KEY NORTHERN TERRITORY FISH STOCKS REPORT 2015
15
Coastal, estuary and river-set gillnets are set in estuaries and the coastal inter-tidal zone. They are used in the NT Barramundi Fishery to target Barramundi and King Threadfin. Estuary-set gillnets are deployed from small dinghies and are typically orientated perpendicular to the direction of the tidal flow. The headline may be staked or anchored at one or both ends.
Seine nets Seine nets usually have two long wings and a section that concentrates and retains the catch. Lengths of rope are added to the end of each of the wings. These ropes are negatively buoyant and extend the working area of the net while adding minimum drag to the hauling operation. The nets work on the principle that fish are reluctant to swim over a moving object in the water and instead try to swim in front of it. The fish are thus herded by the ropes and wing ends into the net.
Beach-seine nets are used by the NT Coastal Net Fishery to target Mullet and Blue Threadfin. The net may have a loose section of netting acting as a bunt area for retaining fish, or may have a bag at one end of the net or in the centre. Beach-seine nets can be set around a known school of fish, or in an area where fish regularly congregate. The net is set from a dinghy or can be walked out in shallow water, with the first length of rope being set perpendicular to the shore, the net set parallel to the shore and the second rope set back to the shore. The ropes are then hauled onto the beach evenly by hand or vehicle, herding the fish into the net. Hauling continues until the net and fish are dragged onto the shore, or the fish are concentrated in the bag.
Figure 4. A beach-seine net

FISHERY REPORT NO. 118
16
Cast nets A cast net, also called a throw net, is a circular net with small weights distributed around its edge. The net is cast or thrown by hand in such a manner that it spreads out on the water and sinks. Fish are caught as the net is hauled back in. Cast nets are popular for catching small bait fish species by recreational anglers and are also used by commercial fishers in the Coastal Net Fishery.
Trawl Trawling is performed in many ways in depths of water ranging from just a few metres to 1000 m. The design of trawl nets is more complex than the basic nets discussed above. Trawls are made up of components that perform specialised functions, as described below:
• Warps are wire ropes connecting the trawl boards to the vessel. They are stored on winch drums for ease of operation.
• Trawl boards (aka otter boards or trawl doors) keep the net open horizontally by acting as hydrodynamic kites. They also provide weight, which is required to keep the trawl at the desired depth of operation.
• Backstrops are short lengths of wire or chain that connect the trawl boards to the sweeps. Sweeps are used on demersal otter trawls to connect the backstrop to the bridle on each side of the net. Bridles connect the sweep on each side of the net to the headline and footrope on the wing ends of the net.
• Ground gear is a wire or chain that is attached to the footrope by short chain droppers. The ground gear has several rubber or steel bobbins and spacers threaded along its length. The purpose of the ground gear is to reduce damage from snagging by lifting the footrope and net clear of the seabed.
• Body panels are the panels of net that make up the body of the trawl; they comprise upper and lower sections.
• The codend or bag is the last section of the net, where fish are collected and held during trawling operations. This area has the smallest mesh size, which determines the size of fish that the trawl will retain. The end of the codend is tied with a quick-release knot so that the fish can be easily emptied from the net.
• The lazy line is sometimes used to pull the codend on board so that it can be emptied.

STATUS OF KEY NORTHERN TERRITORY FISH STOCKS REPORT 2015
17
Figure 5. Trawl net configuration
Demersal otter trawling (aka stern trawling, bottom trawling, otter trawling or trawling) is employed by the NT Demersal Fishery to target tropical snappers. The trawl gear fishes close to the bottom, with the trawl boards, wing-end weights and chain droppers coming in contact with the seabed. The net is held open horizontally by trawl boards being dragged along the seabed, spreading the sweeps, bridles and net wings. These herd the fish towards the net, where they are retained in the codend.

FISHERY REPORT NO. 118
18
Figure 6. Demersal otter trawl gear
Hook and line Hand lines, hand reels and powered reels (aka rod-and-line fishing or deep-water line fishing) are used in the NT Coastal Line Fishery. Hand lines are the simplest form of fishing; they consist of one or more baited hooks attached to a line, which is retrieved by hand. Hand lines are the most common traditional fishing method used by Indigenous fishers. Hand reels can be mounted on the side of a vessel or attached to a rod (rod and line). Rod and line is the predominant method used by recreational fishers in the NT. Reels are used to deploy and retrieve the line and are usually fitted with a drag system (a ‘brake’ system, which is designed to create resistance in the reel as the fish takes out line). To reduce the time and effort involved in setting and hauling the line, electric or hydraulic motors are fitted to some larger reels (powered reels).
Anchored longlines Anchored longlines can be set vertically in the water column (dropline), horizontally along the seabed (bottom-set longline) or horizontally above the seabed (trotline).
Droplines have historically been used to target tropical snappers in the NT Demersal and Timor Reef fisheries. However, they have been replaced by more efficient gear types in recent years (trap and trawl). Droplines consist of a mainline of rope, wire or nylon that is anchored vertically in the water column with a weight on the bottom and floats attached at the surface. Short lengths of twine or nylon called snoods or traces have a clip attached to one end and a hook to the other. When being set for fishing, the desired number of pre-baited snoods (usually between 10 and 100) is clipped at regular intervals along the lower

STATUS OF KEY NORTHERN TERRITORY FISH STOCKS REPORT 2015
19
section of the mainline as it is fed out. Alternatively, the snoods may be permanently attached to the mainline and are baited and lined up in order along individual shooting rails while the vessel is heading for the fishing grounds. When the weight is dropped overboard, they are pulled off the rails in turn as the line is set.
Figure 7. A dropline

FISHERY REPORT NO. 118
20
Demersal longlines (aka bottom-set longlines) are used in the NT Offshore Net and Line Fishery to target Blacktip Sharks; they are also permitted in the NT Demersal and Timor Reef fisheries but are rarely used. One end of the haul-in line has a weight attached to anchor the end of the mainline and the other has a dan buoy (a small buoy, with a flag, used to temporarily mark a position at sea) and float. The line is left to fish for up to 6 hours. Setting and hauling of longlines can be mechanised by hydraulic line setters and haulers, with snoods stored in magazines and a baiting machine that attaches bait to the hooks as the line feeds over the vessel’s stern.
Figure 8. Demersal longline configuration

STATUS OF KEY NORTHERN TERRITORY FISH STOCKS REPORT 2015
21
Trolling Trolling is a simple method of fishing used by the NT Spanish Mackerel Fishery, in which lines with baits or lures are dragged behind a dory or mothership as it moves along at a speed of 2 to 10 knots. It is common for fishers to troll two to four lines behind a dory and up to eight lines from a mothership. A variety of lines, rig designs and lures or baits are used for trolling.
Figure 9. Trolling
Traps and pots Traps and pots are enclosures or devices that entangle or entrap fish, crustaceans or molluscs. Animals are attracted to the enclosure either by bait or because it appears to provide refuge.
Most traps and pots are set on the seabed or riverbed with a haul-in line, surface float or dan buoy to mark their position. They can have one or more entrances on the top or sides, depending on the target species. A line hauler may be used to retrieve the gear for checking and re-baiting.
Fish traps Fish traps can be set in water depths ranging from 2 m to hundreds of metres. They are made in a variety of shapes and sizes, depending on the target species. Most baited traps are set on the seabed, with at least one entrance facing down-current. The traps are left to fish for around 20 minutes to 24 hours.

FISHERY REPORT NO. 118
22
Rectangular traps made of metal with tapered entrances on their sides (towards the base) are used in the NT Timor Reef, Demersal and Coastal Line fisheries to target a range of reef associated fish. The weight of these traps (approx. 100 kg) ensures that they fish on the seabed.
Crab pots There are many different shapes and sizes of crab pots but most are less than 0.5 m3 in volume and 80 cm in any dimension. They are baited and left to fish for around 6 to 24 hours.
Mud Crab pots can be constructed in several ways, but only rigid rectangular pots are used by commercial operators in the NT Mud Crab Fishery. These particular pots have one pair of opposing, horizontally-tapered, side-entry funnels. Some operators fit escape gaps to their pots to reduce the retention of undersized Mud Crabs. Most recreational mud crab fishers use collapsible polyethylene mesh pots with mesh sizes ranging from 25 mm x 25 mm to 50 mm x 50 mm.
Figure 10. Mud Crab pot—rigid rectangular (Butcher et al. 2012)
Diving Diving is used as a means to collect product by the NT Trepang and Aquarium fisheries. Divers in both fisheries rely on surface-supplied air (via an air-line from a compressor on board a support vessel), a method known as hookah diving. Items are collected by hand and stored in netted catch bags until the diver returns to the support vessel.
Hand-held implements Hand-held implements, such as picks, spears, gaffs and landing nets, are used as primary or ancillary fishing gears in the NT. Small steel picks are used to dislodge coral fragments by Aquarium Fishery licensees, while spears are often used by Aboriginal fishers to harvest many fish species. Gaffs and landing nets are commonly used to land large fishes caught on hook and line gear.
Bycatch reduction devices A number of bycatch reduction devices have been developed for Australian fisheries to allow various organisms and objects to exit fishing gear without being brought on board. Licensees in the NT Demersal Fishery fit turtle excluder devices and square-mesh panels to their trawl nets to reduce their environmental footprint and increase their efficiency (through reduced sorting time).
STATUS OF KEY NORTHERN TERRITORY FISH STOCKS REPORT 2015
23
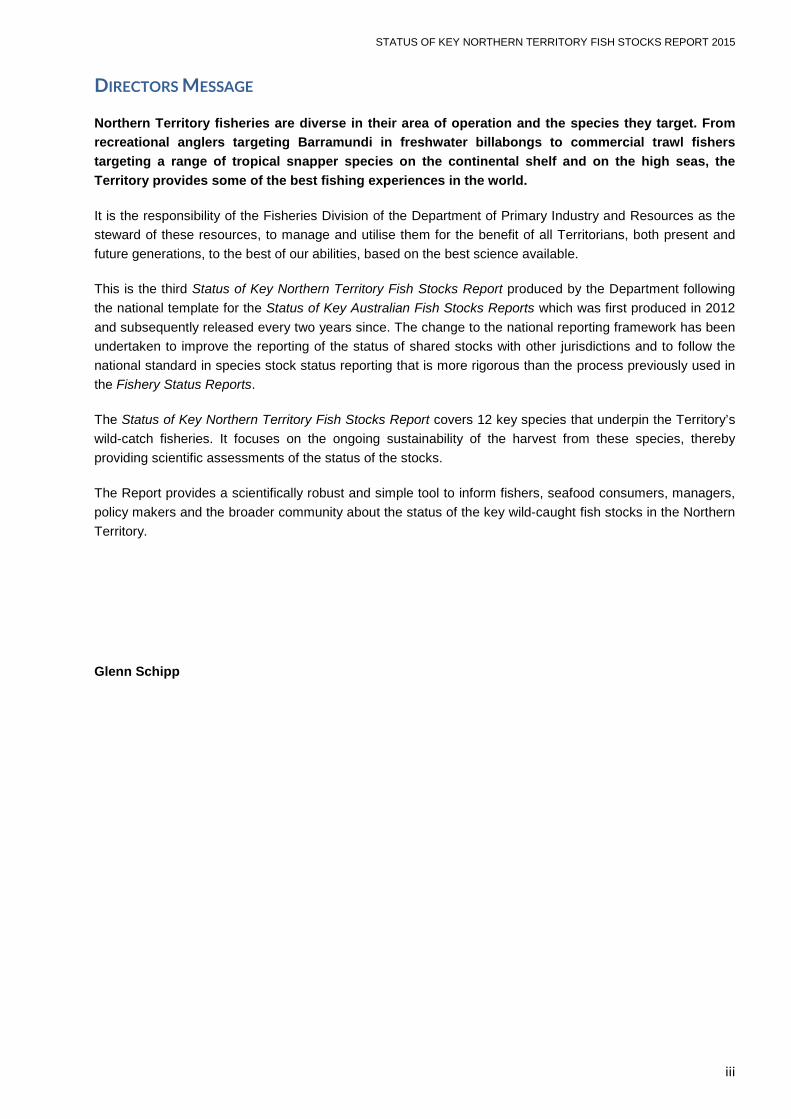
Turtle excluder devices consist of a metal grid across the mouth of the codend, which forces large objects out of the net while allowing smaller target species to be captured, thereby reducing turtle drowning and the retention of sharks, rays and benthic debris.
Square-mesh panels retain their shape under tension and provide a means of escape for smaller fish and non-target species prior to entering in the codend. In some cases, the entire codend is constructed from square-mesh netting, hung to maintain open meshes when the codend fills with catch.
Approximately one quarter of licensees in the NT Mud Crab Fishery fit escape vents to their crab pots. These devices consist of a hard plastic panel with a precision-cut opening, sized to allow the escape of under-sized crabs and small bycatch species while retaining legal-sized crabs.
Figure 11. A typical design of a turtle excluder device in a trawl net
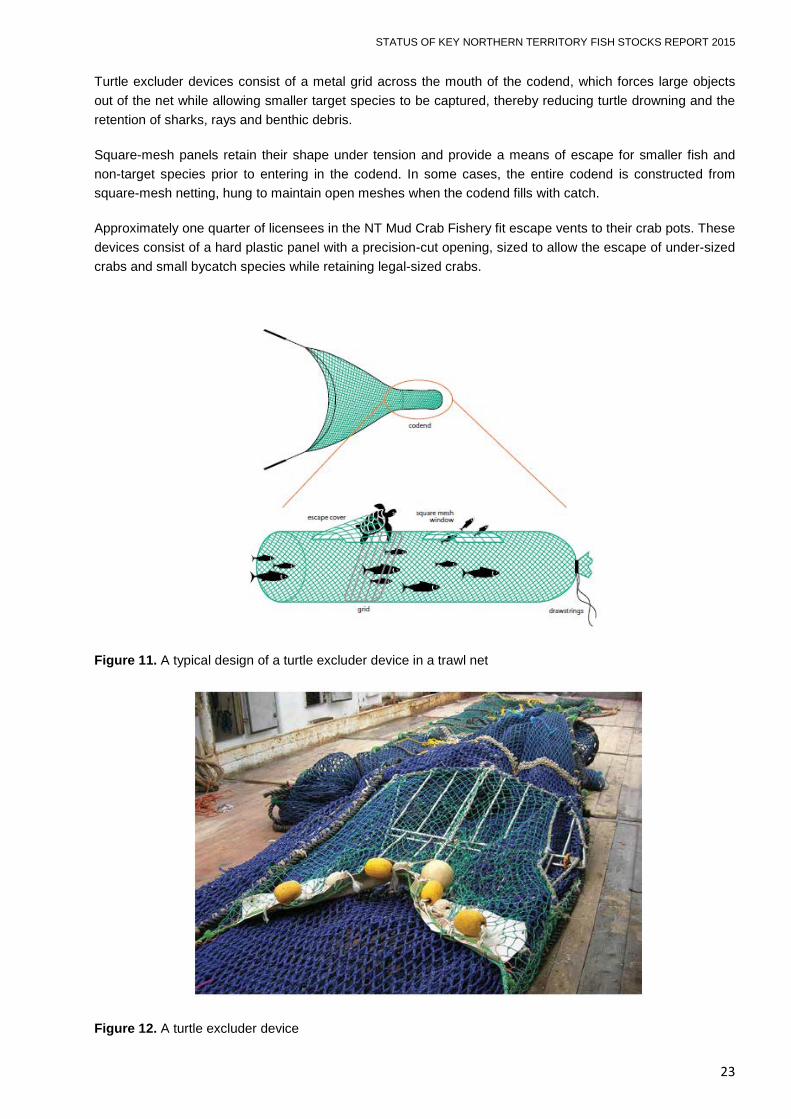
Figure 12. A turtle excluder device

FISHERY REPORT NO. 118
24
REFERENCES
1. Flood, M., Stobutzki, I., Andrews, J., Ashby, C., Begg, G., Fletcher, R., Gardner, C., Georgeson, L., Hansen, S., Hartmann, K., Hone, P., Horvat, P., Maloney, L., McDonald, B., Moore, A., Roelofs, A., Sainsbury, K., Saunders, T., Smith, T., Stewardson, C., Stewart, J. and Wise, B. (eds.) (2014). Status of Key Australian Fish Stocks Reports 2014. Fisheries Research and Development Corporation (FRDC), Canberra.
2. Fletcher, W. J., Chesson, J., Fisher, M., Sainsbury, K. J., Hundloe, T., Smith, A. D. M. and Whitworth, B. (2002). National ESD Reporting Framework for Australian Fisheries: the 'How to' guide for wild capture fisheries. FRDC Project 2000/145, Canberra.
3. Australian Government Department of the Environment and Water Resources (2007). Guidelines for the Ecologically Sustainable Management of Fisheries. 2nd edition, DEWR, Canberra.
4. FAO (1995). FAO Code of Conduct for Responsible Fisheries. FAO, Rome, www.fao.org/docrep/005/v9878e/v9878e00.HTM#76.
5. Australian Government Department of Agriculture, Fisheries and Forestry 2007, Commonwealth Fisheries Harvest Strategy: Policy and Guidelines. DAFF, Canberra.
6. Australian Government Department of Sustainability, Environment, Water, Population and Communities (2012). Fisheries and the Environment. DSEWPaC, Canberra, www.environment.gov.au/coasts/fisheries/index.html#fisheries.
7. Halliday, I. A., Saunders, T., Sellin, M., Allsop, Q., Robins, J. B., McLennan, M. and Kurnoth, P. (2012). Flow Impacts on Estuarine Finfish Fisheries of the Gulf of Carpentaria. FRDC Project 2007/002, Queensland Department of Agriculture, Fisheries and Forestry.
8. Robins, J. B., Halliday, I. A., Staunton-Smith, J., Mayer, D. G. and Sellin, M. J. (2005). Freshwater flow requirements of estuarine fisheries in tropical Australia: a review of the state of knowledge and application of a suggested approach. Marine & Freshwater Research, 56: 343–360.
9. Kailola, P., Williams, M. J., Stewart, P. C., Reichlet, R. E., McNee, A. and Grieve, C. (1993). Australian Fisheries Resources. Bureau of Resource Sciences and FRDC, Canberra.
Image sources Butcher, P. A., Leland, J. C., Broadhurst, M. K., Paterson, B. D. and Mayer, D. G. (2012). Giant mud crab (Scylla serrata): relative efficiencies of common traps and impacts to discards. ICES Journal of Marine Science, 69: 1511–1522.
FRDC
Line drawing: Allison Mortlock, AngelInk 2012.

STATUS OF KEY NORTHERN TERRITORY FISH STOCKS REPORT 2015
25
OVERVIEW OF NORTHERN TERRITORY MANAGED FISHERIES
Fisheries operating in NT waters predominantly harvest marine and estuarine species from tidal waters. For the commercial sector, the outer boundaries of these fisheries vary, extending to 3, 15 or 200 nautical miles (nm) from the coast. Fisheries operating within 3 nm are typically referred to as “inshore” fisheries and almost all of the recreational and Indigenous sectors effort is concentrated in this area. Those fisheries operating out to 15 or 200 nm are referred to as “offshore” fisheries and the commercial sector is responsible for almost all of the effort in this area. Most fisheries span the entire coastline, although some (like the Coastal Net and Timor Reef fisheries) are restricted to discrete regions. Commercial and recreational fishers operating within estuaries must avoid Aboriginal sacred sites and observe any other area restrictions. Additionally, Section 53 of the Fisheries Act 2011 recognises the customary fishing rights of local Aboriginal people, thereby exempting traditional harvest by Aboriginals from most management controls.
In general, fisheries are managed to ensure the ongoing sustainability of harvest from the fish stocks in that fishery. Management of fisheries also aims to optimise resource allocation (balancing social and economic considerations) and to minimise adverse impacts of fishing on the environment. Australian fisheries are managed in line with the United Nations Convention on the Law of the Sea (UNCLOS), which is reflected in the legislation and policy of the Commonwealth, states and territories. FAO Code of Conduct for Responsible Fisheries provides guidelines for the implementation of UNCLOS, with the high-level requirement that:
States should prevent overfishing and excess fishing capacity and should implement management measures to ensure that fishing effort is commensurate with the productive capacity of the fishery resources and their sustainable utilization. States should take measures to rehabilitate populations as far as possible and when appropriate1.
Fisheries managers typically set limits on the amount of fishing effort (including when, where and with what gear catches can be taken—referred to as input controls) or the quantity of catch that can be taken from a stock (referred to as output controls). These decisions are usually based on the best available science at the time of the decision, but may also take into account other factors, such as economics. Fisheries management is generally an adaptive process because fish stocks can be influenced not only by the fishery’s harvest but also by environmental effects and natural variation. Fisheries also change in response to changes in market demands, fuel prices and other factors.
Management arrangements for NT fisheries are primarily developed through advisory groups (or committees) related to specific fisheries or user groups. In most cases, these bodies consist of local representatives. However, the Timor Reef, Demersal and Offshore Net and Line fisheries are jointly managed by the NT and Commonwealth Governments through the NT Fisheries Joint Authority.
Catch and effort statistics for each fishery are derived from compulsory monthly logbooks submitted by commercial and Fishing Tour Operator (FTO) licensees. Recreational and Indigenous catch and effort statistics are derived from periodic surveys. The environmental performance of joint authority fisheries is routinely assessed by fishery observers on board commercial vessels. Furthermore, all fisheries operate in accordance with a number of local, national and international acts, plans and conventions. These include the Territory Parks and Wildlife Conservation Act 2014, the Environment Protection and Biodiversity Act 1999 the National Plan of Action for the Conservation and Management of Sharks 2012, and the Convention on the International Trade in Endangered Species.
All commercial licensees must attend an interview with a fishery manager prior to entering a fishery, or if more than five years have passed since their last interview. The purpose of these interviews is to familiarise the licensee with current legislation, the status of the fishery, fisheries research programs, reporting requirements and any industry codes of conduct or environmental management systems. Regular contact with licensees also allows the fishery manager to keep abreast of any emerging issues in the fishery.

FISHERY REPORT NO. 118
26
The following sub-sections provide a background on each of the primary fisheries in the NT. This includes a description of the area of the fishery, the target species, the allowable gear and the restrictions on catch and/or effort. Catch, byproduct and bycatch statistics are also presented, as are the details of any recent compliance issues.
While most of this information refers to the commercial sector, where other sectors target the same species, the relative importance of these species to each user group (in terms of the catch/harvest fraction and/or the proportion of fishing effort) is provided. Relative (rather than absolute) estimates are given in these instances due to differences in the currency of catch estimates for the different sectors and the inherent variability in annual catches seen in the tropics. Catch statistics FTOs are also expressed in relative terms because the FTO catch is reported by number rather than weight.
A1 Coastal Line Fishery The NT Coastal Line Fishery extends seaward from the high water mark to 15 nm from the low water mark and primarily targets Black Jewfish (Protonibea diacanthus) using hook and line gear. The fishery is divided into two fishing zones. The Western Zone extends from Vashon Head on Cobourg Peninsula to the Western Australia border and the Eastern Zone extends from Vashon Head to the Queensland border. Most fishing activity is concentrated around rocky reefs within 150 km of Darwin.
Licensees are permitted to use several gear types. Rod and line, hand lines, cast nets (for bait only), scoop nets or gaffs can be used throughout the fishery. Droplines and a maximum of five fish traps may also be used beyond 2 nm from the coast. However, fish traps can only be used in the Eastern Zone of the fishery. A maximum of five hooks may be fitted to hand lines and rod and line gear. Droplines may be rigged with a minimum of six and a maximum of 40 hooks. Fish traps and droplines comprise less than 7 per cent of the total catch by licensees.
A total of 139 tonnes (t) of fishes were harvested by Coastal Line Fishery licensees in 2015, with Black Jewfish and Golden Snapper forming most of the harvest (91 per cent and 2.5 per cent, respectively). Grass Emperor (Lethrinus lentjan) and cods were the only byproduct species taken in any significant quantity (1.7 per cent and 1.5 per cent of the respective harvest). No bycatch was reported in this fishery during 2015. The total value of the catch in this fishery is estimated at $1.5 million.
Recreational anglers and FTO clients predominantly use rod and line gear to target the same reef-associated species as licensees, often at the same location. The harvest by these groups is constrained through the use of personal possession limits.
Snappers of the genus Lutjanus account for almost one in four of all fishes caught by recreational fishers in the NT. The retention rate of different species encountered during recreational reef fishing varies markedly, from around 75 per cent for snappers, emperors (Family Lethrinidae) and Black Jewfish to less than 5 per cent for catfish (Family Ariidae) and sharks (primarily Family Carcharhinidae)2. Reef fishing constitutes around 40 per cent of all fishing effort (in hours) expended by FTO clients. The catch composition and retention rate of reef fishes by FTO clients is similar to that of recreational fishers.
Forty five per cent of all fishing events by Indigenous fishers in the NT involve line fishing, with most of this effort (93 per cent) concentrated onshore. Less than 2 per cent of the fishes caught by Indigenous fishers are released, as fishing is undertaken as a subsistence activity3.
Coastal Line Fishery licensees, recreational fishers and FTO clients are all capable of exerting substantial impacts on reef-associated species and recent sustainability concerns have led to the development of new management controls on the harvest of these species.
STATUS OF KEY NORTHERN TERRITORY FISH STOCKS REPORT 2015
27
The primary fishing gear used in the Coastal Line Fishery (hook and line) poses little risk of interaction with threatened, endangered and protected species (TEPS) (such as turtles, dugongs and sawfish) and there were no reported interactions between the Coastal Line Fishery and TEPS in 2015. Similarly, the actions of this fishery are considered to have little impact on other ecosystem components.
There have been few reported problems with compliance in the Coastal Line Fishery and there is no evidence of systematic non-compliance. The primary area of concern is the potential for the black market sale of fish by unlicensed operators. In particular, the illegal sale of Black Jewfish airbags has increased due to the recent higher prices for this product.
A2 Coastal Net Fishery The NT Coastal Net Fishery extends seaward from the high water mark to 3 nm from the low water mark and harvests a range of species including mullets (Family Mugilidae), Blue Threadfin (Eleutheronema tetradactylum), sharks and queenfish (Scomberoides spp.).
The fishery is regionalised and the five licensees can only fish in one of three discrete zones: Darwin (from Cape Hotham to Native Point and Cape Ford to Cape Dooley); Gove (between Cape Arnhem and Cape Wilberforce); or Borroloola (between Bing Bong Creek and Pelican Spit).
Licensees are permitted to use a gillnet of no more than 300 m in length, with a maximum drop of 5 m and a mesh size not exceeding 65 mm. Nets may be anchored at one end only. Licence holders are also permitted to use a cast net with a diameter of not more than 6 m and mesh size not exceeding 25 mm. Based on historical use, one operator is permitted to use a gillnet with a mesh size up to 100 mm. Nets must be cleared in water not less than 30 cm deep to facilitate the release of any bycatch or prohibited species.
A total of 11.7 t of fishes were harvested by Coastal Net Fishery licensees in 2015, 53 per cent of which was mullet and 22 per cent of which was Black-tip Shark. Byproduct species included whiting (Family Sillaginidae), catfish, garfish (Family Hemiramphidae), Blue Threadfin and queenfish. There was no reported bycatch in this fishery during 2015. The total value of the catch in this fishery is estimated at $44,000.
Recreational fishers can use drag nets and cast nets to target fish and prawns for bait or human consumption. Drag nets must not exceed 16 m in length, a 2-m drop, or have a mesh size of more than 28 mm. The dimensional limits for recreational cast nets are the same as those for licensees. The use of nets by recreational fishers and FTO clients account for less than 1 per cent of the fishing effort (in hours) by these groups2. Around 10 per cent of all fishing events by Indigenous fishers in the NT involve the use of some form of net3.
The small number of licensees in the Coastal Net Fishery (five) in conjunction with the restricted area of the fishery limits the risk of interactions with TEPS. There were no reported interactions between the Coastal Net Fishery and TEPS in 2015. Similarly, the actions of this fishery are considered to have little impact on other ecosystem components.
There have been few reported problems with compliance in the Coastal Net Fishery and there is no evidence of systematic non-compliance. The primary areas of concern are the illegal use of nets and the potential for the black market sale of fish by unlicensed operators.
A4 Spanish Mackerel Fishery The NT Spanish Mackerel Fishery extends seaward from the high water mark to the outer limit of the Australian Fishing Zone (AFZ) and targets Spanish Mackerel (Scomberomorus commerson) using trolled lures or baited lines. The primary fishing grounds include waters near Bathurst Island, New Year Island, the Wessel Islands around to Groote Eylandt and the Sir Edward Pellew Group of islands.

FISHERY REPORT NO. 118
28
Licensees typically fish from a mother ship and/or dories, with a maximum of two dories permitted per licence. They may use any number or combination of troll lines, floating hand lines or rods. Operators generally troll two to four lines behind a dory and up to eight lines from a mother boat.
A total 346 t of fish were harvested by Spanish Mackerel Fishery licensees in 2015. Almost all (95 per cent) of this catch was Spanish Mackerel with the other 5 per cent comprising Grey Mackerel. A small number of trevallies were recorded as bycatch during 2015. The total value of the catch in this fishery is estimated at $2.6 million.
Recreational fishers and FTO clients target Spanish Mackerel in waters close to population centres, such as Darwin, Nhulunbuy and Borroloola, using baited hooks and lures. Only 1 per cent of all fishes caught by recreational fishers in the NT are Spanish Mackerel; 50 per cent of these fish are released2. Incidental catches during targeted recreational fishing for Spanish Mackerel include other mackerels (Scomberomorus spp.), trevallies and queenfish, many of which are released alive.
The Spanish Mackerel Fishery is managed through a catch-sharing arrangement between all user groups. This agreement aims to maintain the cumulative harvest of Spanish Mackerel within a precautionary allowable catch of 450 t per annum. The proportion of the allowable catch allocated to each user group was based on historical logbook data and catch estimates from the National Recreational and Indigenous Fishing Survey3 as follows: 76 per cent (342 t) to Spanish Mackerel Fishery licensees, 3 per cent (13.5 t) to Offshore Net and Line Fishery licensees, 1 per cent (4.5 t) to Demersal Fishery licensees, 3 per cent (13.5 t) to FTO licensees, 16 per cent (72 t) to recreational fishers and 1 per cent (4.5 t) to Indigenous fishers.
The primary fishing gear used by the Spanish Mackerel Fishery (trolled lures and baited lines) poses little risk of interaction with TEPS and there were no reported interactions between the Spanish Mackerel Fishery and TEPS in 2015. Similarly, the actions of this fishery are considered to have little impact on other ecosystem components.
There have been few reported problems with compliance in the Spanish Mackerel Fishery and there is no evidence of systematic non-compliance.
A5 Offshore Net and Line Fishery The NT Offshore Net and Line Fishery extends seaward from the high water mark to the outer limit of the AFZ and targets Australian Blacktip Sharks (Carcharhinus tilstoni), Common Blacktip Sharks (C. limbatus), Spottail Sharks (C. sorrah) and Grey Mackerel (Scomberomorus semifasciatus) using pelagic gillnet and longline gear.
Demersal longlines can be used throughout the fishery whereas pelagic gillnets and pelagic longlines can only be used beyond 2 nm and 3 nm of the coast, respectively. Pelagic gillnets are the primary gear used by this fishery and are generally set within 15 nm of the coast. Longlines have not been used in the fishery since 2013, primarily as a result of the drop in shark fin price.
Licensees can use nets up to 2000 m in length, but most choose to use nets in the order of 1000 m to 1500 m. The drop of the net must not exceed 100 meshes and the size of each mesh panel typically ranges from 160 mm to 185 mm when stretched. Pelagic gillnets are weighted and have a buoyed headline. Pelagic longlines must not exceed 15 nm in length and cannot have more than 1000 snoods (hooks) attached. Automated baiting gear is prohibited.
Two of the target species in this fishery, the Australian Blacktip Shark and the Common Blacktip Shark, are very difficult to separate by eye and have traditionally been reported as “Blacktip Shark”. Although the shark

STATUS OF KEY NORTHERN TERRITORY FISH STOCKS REPORT 2015
29
identification skills of many licensees are improving, some grouping still occurs in logbook returns. The grouping convention is also used here so as not to misrepresent the harvest of either species.
A total of 522 t of fishes were harvested by Offshore Net and Line Fishery licensees in 2015. Grey Mackerel formed the bulk of the harvest (78 per cent) followed by the Blacktip Shark group (7 per cent) and Spot-tailed Sharks (2 per cent). The primary byproduct species were Spanish Mackerel (5 per cent), Longtail Tuna (1 per cent) and Hammerhead Sharks (Sphyrna spp.) (1 per cent). Bycatch (by weight) was less than 1 per cent of the harvest during 2015. Non-retained species included the Tawny Shark (Nebrius ferrugineus), rays (Family Dasyatidae), trevallies and queenfish. The proportion and composition of bycatch in this fishery is routinely validated by on-board observers. The total estimated value of the catch in this fishery is $3.6 million.
Grey Mackerel form a minor component (less than 1 per cent) of the overall catch by other fishing parties in the NT. Sharks are taken in significant quantities by Indigenous fishers, the vast majority of whom (93 per cent) fish from shore3. By contrast, sharks are rarely targeted (or retained) by recreational fishers2 or FTO clients. This being the case, there is very little overlap in the harvest activities of the Offshore Net and Line Fishery and other marine user groups.
The Offshore Net and Line Fishery operates beyond the geographical range of many TEPS and so the risk of interaction with this group of species is low. In 2015, licensees reported interactions with 27 sawfish, 13 turtles, 1 mobulid rays, and one dolphin during the course of 588 days of fishing (equating to less than one TEPS interaction per week of fishing). The actions of this fishery are considered to have minimal impact on other ecosystem components.
There have been few reported problems with compliance in this Offshore Net and Line Fishery and there is no evidence of systematic non-compliance.
A6 Demersal Fishery The NT Demersal Fishery extends from 15 nm from the low water mark to the outer limit of the AFZ (excluding the area of the Timor Reef Fishery) and targets a range of tropical snappers (Lutjanus spp. and Pristipomoides spp.) using a variety of gear. Fish traps, hand lines and droplines are permitted throughout the fishery and demersal trawl nets are permitted in two defined zones.
The harvest by the Demersal Fishery is limited through a set of TACs applied to goldband snappers (Pristipomoides spp.) (400 t), red snappers (L. malabaricus and L. erythropterus) (2500 t) and a “grouped fish” category (915 t). The latter group includes all fishes other than Barramundi (Lates calcarifer), King Threadfin (Polydactylus macrochir), Spanish Mackerel, shark and Mud Crabs (Scylla spp.). Any protected species that are caught must also be released.
A total of 3107 t of fishes was harvested by Demersal Fishery licensees in 2015. Red snappers and goldband snappers formed the bulk of the harvest (74 per cent and 9 per cent, respectively) with Painted Sweetlip (Diagramma labiosum) being the primary byproduct species (4 per cent of the total). Reported bycatch (by weight) during 2015 was less than 1 per cent of the dropline and trap harvest and the average bycatch recorded by observers for the trawl harvest in 2015 was 20 per cent. Non-retained species included trevallies, scads (Family Carangidae) and sharks. On-board observers routinely verify the proportion and composition of bycatch in the trawl component of this fishery. The total estimated value of the catch in this fishery is $17.6 million.
Relatively few recreational fishers, Indigenous fishers or FTOs fish outside 15 nm of the NT coast and there is little overlap in the harvest activities of the Demersal Fishery and other marine user groups. However, the

FISHERY REPORT NO. 118
30
numbers of recreational anglers and FTOs fishing these grounds has increased in recent times due to a combination of increases in boat size, technology and weather forecasting.
The Demersal Fishery operates beyond the geographic range of many TEPS and so the risk of interaction with this group of species is low. Turtle excluder devices are required by law and square mesh codends are used voluntarily to reduce the retention of non-target species and increase the value of the landed product. Fishery observers reported eight TEPS interactions during 31 days of fishing in 2015. Bycatch species included sea snakes, Narrow Sawfish (Anoxypristis cuspidata) and a Grey Nurse Shark (released alive). The trawl gear used by the Demersal Fishery does disturb the benthic environment and the area impacted in 2015 was 1.6 per cent of the total areas zoned for trawling.
There have been few reported problems with compliance in the Demersal Fishery and there is no evidence of systematic non-compliance.
A7 Barramundi Fishery The NT Barramundi Fishery operates within 3 nm of the low water mark and targets Barramundi and King Threadfin using gillnets. The inner boundary of the fishery is convoluted, with some rivers (or parts thereof) open to netting and others closed. Licensees are not permitted to set nets within Kakadu National Park, the Mary River Fish Management Zone, Bynoe Harbour, Darwin Harbour or Shoal Bay. Furthermore, operators may not set nets or anchor within the Dugong Protection Area in the south-western Gulf of Carpentaria.
The commercial fishing season extends from 1 February through to 30 September each year, with most of the catch taken from Anson Bay, Van Diemen Gulf, East Arnhem Land, Central Arnhem Land and Limmen Bight. Gillnets set in the open sea must have a mesh size of at least 150 mm (6 inches), while those set in rivers must have a mesh size of at least 175 mm (7 inches). No more than 1000 m of net can be used under a licence and there are restrictions on the amount of spare net that may be stored on board vessels.
A total of 661 t of fishes were harvest by Barramundi Fishery licensees in 2015. Barramundi and King Threadfin formed the bulk of the catch (58 per cent and 38 per cent, respectively), with Blue Salmon (1 per cent), Black Jewfish (>1 per cent) and sharks (>1 per cent) taken as byproduct. Bycatch (by weight) during 2015 was less than 2 per cent of the total harvest. Non-retained species included catfish, Blue Threadfin, queenfish, trevallies and other sharks. The total value of the catch in this fishery is estimated at $4 million.
Recreational fishers target Barramundi using baited hooks and artificial lures, with the latter being more popular2. Around 20 per cent of all fishes caught by recreational fishers in the NT are Barramundi, the highest proportion of any species. Seventy two per cent of all Barramundi caught by this sector are released. Blue Threadfin, King Threadfin, snappers, grunters (Family Terapontidae) and catfish are incidentally caught during targeted recreational fishing for Barramundi.
Approximately 50 per cent of all fishing effort (in hours) expended by FTO clients in the NT is directed towards the capture of Barramundi. The release rate of Barramundi by FTO clients is similar to that of recreational fishers, as is the mix of incidental captures.
The commercial sector is excluded from many estuarine systems and consists of relatively few licensees (14). These factors, in conjunction with restrictions on the length and operation of gillnets, limit the risk of interactions with TEPS. Commercial operators reported interactions with a small number (less than 100) TEPS during 2015. These primarily consisted of saltwater crocodiles and sawfish (Pristis spp.); almost all were released alive. Similarly, the actions of this fishery are considered to have little impact on other ecosystem components.

STATUS OF KEY NORTHERN TERRITORY FISH STOCKS REPORT 2015
31
There were relatively few compliance issues in Barramundi Fishery during 2015 and no evidence of systematic non-compliance. Detected offences related to fishing in closed waters and inadequate marking of gear. Recreational fishing offences that year included exceeding the Barramundi possession limit, retaining undersize Barramundi, removing skin from fillets and fishing in seasonally-closed areas.
A8 Mud Crab Fishery The NT Mud Crab Fishery is confined to the tidal waters of the Top End and targets Mud Crabs (Scylla spp.) using baited pots. Licensees are not permitted to operate in Darwin Harbour and in most creeks adjoining Shoal Bay, Leaders Creek, Kakadu National Park or parts of the Cobourg Marine Park.
There are 98 units of entitlement in the fishery, each permitting the use of up to 30 crab pots (i.e. 2940 pots in total). A licensee must hold at least two units of entitlement (60 pots) to be able to enter the fishery. Most licensees operate in the Gulf of Carpentaria, with a small number based along the Arnhem Land coast or near Darwin. Crab pots are set within estuaries or along the coastal fringe and are checked and re-baited daily.
Licensees may also use restricted bait nets (gillnets) up to 100 m in length to catch fish for use as crab bait. These nets may only be set in the open sea within 3 nm of the coast and the fisher must attend the net at all times. The use of this gear is prohibited between Bing Bong and the Queensland border and in a number of other areas around the coast.
A total 186 t of Mud Crabs were harvested by Mud Crab Fishery licensees in 2015; the estimated value of this catch is $3.7 million. Byproduct species amounted to 1.5 t; 85 per cent of which was catfish and 15 per cent bream. Licensees also caught 24 t of fishes in restricted bait nets. The majority of the catch was mullet (30 per cent), followed by sharks (25 per cent), Blue Salmon (23 per cent) and catfish (21 per cent).
Recreational fishers may harvest Mud Crabs using pots, dillies, spears, crab hooks, hook and line, hand net, cast net or drag net. A gear limit of five pots or dillies per person applies, with a maximum of 10 pots/dillies per vessel. The use of pots and traps accounts for around 15 per cent of fishing effort (in hours) by recreational fishers in the NT2. However, this statistic includes soak times of “cherabin pots” used to target Giant Freshwater Prawns (Macrobrachium spinipes) and Redclaw (Cherax quadricarinatus).
Eighty five percent of Mud Crabs harvested by Indigenous fishers are taken by hand or with spears. These two collection methods account for around 50 per cent of all fishing events by Indigenous fishers in the NT3. Very few FTO clients target Mud Crabs, with “crabbing” constituting around 1 per cent of the reported fishing effort (in hours) by this user group.
The gear used by the Mud Crab Fishery (pots and gillnets) is either highly selective or is operated in such a manner that minimises the risk of interactions with TEPS. There were no reported interactions between the Mud Crab Fishery and TEPS in 2015. Similarly, the actions of this fishery are considered to have little impact on other ecosystem components.
There were few compliance issues in the Mud Crab Fishery in 2015 and there is no evidence of systematic non-compliance. Those offences that were detected included the possession of either under-sized crabs or commercially unsuitable (soft-shelled) crabs.
A12 Aquarium Fish/Display Fishery The NT Aquarium Fish/Display Fishery (the fishery) operates in both tidal and non-tidal waters of the Top End, to the outer limit of the AFZ. The fishery supplies a range of aquarium fishes, plants and invertebrates (including corals) to local and interstate pet retailers and wholesalers. Some specimens are also sold to overseas buyers.

FISHERY REPORT NO. 118
32
Aquarium Fishery licensees can operate in most areas, but must have permission to access private land or sea country. Harvesting is not permitted in designated protected areas, such as Doctor’s Gully and East Point Aquatic Life Reserves in Darwin Harbour, Aboriginal sacred sites, aquaculture farm leases and sanctuary zones.
Aquarium Fishery/Display Fishery licensees can use several types of nets, hand pumps, freshwater pots and hand-held instruments to collect specimens. The harvest consists of a wide range of fish and invertebrates, as well as coral rubble and substrates covered in encrusting organisms (known as “live rock”).
The fishery currently has Wildlife Trade Operation (WTO) accreditation under the EPBC Act, allowing licensees to harvest and export Appendix II CITES listed hard coral species. A Non Detrimental Finding (NDF) was undertaken for CITES listed species harvested in the fishery. The NDF resulted in catch limits for some species. For example, the annual harvest of corals in the NT is limited to between 10 kg and 200 kg (depending on species), while that of giant clams (Tridacna spp.) is restricted to 200 individuals.
Members of the public wishing to collect specimens for personal aquaria must comply with recreational fishing controls, such as minimum legal sizes and personal possession limits.
The small number of Aquarium Fish/Display Fishery licensees (12) in conjunction with the selective fishing methods used, minimises the risk of interactions with TEPS. No interactions between the Aquarium Fish/Display Fishery and TEPS were reported in 2015. Similarly, the actions of this fishery are considered to have little impact on other ecosystem components.
There have been few reported problems with compliance in the Aquarium Fish/Display Fishery and there is no evidence of systematic non-compliance.
A13 Trepang Fishery The NT Trepang Fishery extends seaward from the high water mark to 3 nm from the coast and targets Sandfish (Holothuria scabra; a type of Sea Cucumber), by means of hookah diving. The fishery is managed through individual Total Allowable Catch limits across thirty-two, 60 X 60 nautical mile grids. Most fishing activity is concentrated along the Arnhem Land coast, from Cobourg Peninsula to Groote Eylandt.
Sea Cucumbers may only be taken by hand and must attain a minimum legal size, which differs between species. The number of collectors permitted under a licence is limited to four. Collection is generally restricted to neap tides during the dry season when water clarity improves.
Although licence conditions permit the harvest of all types of sea cucumbers, Sandfish is the only species to have been taken in the last decade.
All six Trepang Fishery licences are owned by a single entity. Sea Cucumbers are not targeted by other fishing parties and so management arrangements for the fishery are negotiated with the single licensee. Four of the six commercial licences were active in 2015.
Selective harvesting by the Trepang Fishery avoids bycatch and poses negligible risk of interaction with TEPS. Similarly, the actions of this fishery are considered to have little impact on other ecosystem components.
The recreational harvest of trepang is not known, but is likely to be low. No trepang catch has been reported by recreational fishers during surveys conducted on this sector.

STATUS OF KEY NORTHERN TERRITORY FISH STOCKS REPORT 2015
33
No catch of trepang by Indigenous fishers was reported during the National Recreational and Indigenous Fishing Survey of northern Australia (Henry and Lyle 2003). Information collected during survey visits suggested that trepang were never used as food by the Indigenous people of the NT.
There have been few reported problems with compliance in the Trepang Fishery and there is no evidence of systematic non-compliance.
A18 Timor Reef Fishery The Timor Reef Fishery operates offshore in a zone covering roughly 8400 nm2 to the north-west of Darwin and targets tropical snappers (Lutjanus spp. and Pristipomoides spp.) using a variety of gear. The majority of the catch is taken using baited traps, but hand lines, droplines and demersal longlines may also be used. Trawl gear is also currently being trialled in the fishery.
The harvest by this fishery is limited through a set of TACs applied to goldband snappers (900 t), red snappers (1300 t) and “group fish” (415 t). The composition of these groups is the same as those for the Demersal Fishery. A total of 806 t of fishes was harvested by licensees in 2015, with goldband snappers and red snappers constituting most of the harvest (38 per cent and 31 per cent of the total, respectively) and Mangrove Jack (Lutjanus argentimaculatus) being the primary byproduct species (6 per cent of the total harvest). The total estimated value of the catch in this fishery is $3.6 million.
Reported bycatch (by weight) in 2015 was less than 1 per cent of the dropline and trap harvest and the average bycatch recorded by observers for trawl gear in 2015 was 26 per cent. Non-retained species included sharks, tropical snappers (Lutjanus spp.), triggerfish (Family Balistidae), Scads (Family Carangidae), Black Tripodfish (Trixiphichthys weberi), Common Saury (Saurida tumbil) and Largehead Hairtail (Trichiurus lepturus). On-board observers routinely validate the proportion and composition of bycatch in this fishery.
Relatively few recreational fishers, Indigenous fishers or FTOs fish outside 15 nm of the NT coast and there is little overlap in the harvest activities of these user groups and the Timor Reef Fishery. However, the numbers of recreational anglers and FTOs fishing these grounds has increased in recent times due to a combination of increases in boat size, technology and weather forecasting.
The Timor Reef Fishery operates beyond the geographic range of most TEPS and so the risk of interaction with this group of species is low. Turtle excluder devices are required by law on trawl vessels and square mesh codends are used voluntarily to reduce the retention of non-target species and increase the value of the landed product. Fishery observers reported three TEPS interactions during 35 days of fishing in 2015. Bycatch species were two sea snakes and a Narrow Sawfish (Anoxypristis cuspidata) (released alive). The trawl gear used in the trial can disturb the benthic environment and the area impacted in 2015 was 1.2 per cent of the fishery area.
There have been few reported problems with compliance in the Timor Reef Fishery and there is no evidence of systematic non-compliance.
D2 Fishing Tour Operator Fishery FTOs assist their clients in the pursuit of a wide range of sport fish in the non-tidal and tidal waters of the Top End to the outer limit of the AFZ. Guide vessels range in size from small dinghies to luxury mother ships. Some operators also utilise fan-propelled “air boats” or helicopters.
Most FTOs are based near coastal population centres (such as Darwin, Nhulunbuy and Borroloola) and operate in areas accessible to the general public. However, some licensees negotiate financial agreements

FISHERY REPORT NO. 118
34
with Aboriginal or pastoral landholders for exclusive rights to access certain areas and, in some cases, build and maintain fishing camps or lodges.
All persons engaged in guided fishing trips in the NT must observe recreational fishing regulations. Clients typically use rod and line gear, rigged with either baited hooks or artificial lures. The latter may be trolled or cast, depending on the target species. Around three quarters of the fish caught by FTO clients are released. Barramundi form the highest proportion of the catch (31 per cent) with other common species, including Golden Snapper (10 per cent), Stripey Snapper (L. carponotatus) (7 per cent), Saddletail Snapper (L. malabaricus) (5 per cent) and Grass Emperor (Lethrinus laticaudus) (5 per cent).
While the survivorship of released Barramundi is high, the same is not true for reef-associated species, such Golden Snapper and Black Jewfish. Both species are susceptible to pressure-induced injuries (barotrauma), with the rate of injury and post-release mortality proportional to capture depth. Concerns regarding the impacts of barotrauma on reef fishes (and other factors) have led to the development of new management controls on the harvest of these species.
The primary fishing gear used by FTO clients (hook and line) poses little risk of interaction with TEPS and there were no reported interactions between FTOs and TEPS in 2015. Similarly, the actions of this fishery are considered to have little impact on other ecosystem components.
References 1. FAO (1995). FAO Code of Conduct for Responsible Fisheries. FAO, Rome,
www.fao.org/docrep/005/v9878e/v9878e00.HTM#76. 2. West, L. D., Lyle, J. M., Matthews, S. R. and Stark, K. E. (2012). A Survey of Recreational Fishing in
the Northern Territory, 2009–10. Fishery Report 109, DPIF, https://dpir.nt.gov.au/__data/assets/pdf_file/0016/233017/fr109.pdf
3. Henry, G. W. and Lyle, J. M. (eds.) (2003). The National Recreational and Indigenous Fishing Survey. FRDC Project 99/158, Australian Government Department of Agriculture, Fisheries and Forestry, Canberra, http://eprints.utas.edu.au/2526/1/Henry_Lyle_Nationalsurvey.pdf.

STATUS OF KEY NORTHERN TERRITORY FISH STOCKS REPORT 2015 MUD CRAB
35
MUD CRAB SCYLLA SERRATA AND S. OLIVACEA
Mark Grubert
Table 1. Stock status determination for Giant Mud Crab
Stock Arafura-West Western Gulf of Carpentaria
Fisheries MCF MCF
Stock status Sustainable Transitional–depleting ↓
Indicators Catch, effort, CPUE Catch, effort, CPUE, fishing mortality
MCF = Mud Crab Fishery; CPUE = Catch per unit effort
Stock structure Two species of Mud Crabs are found in Northern Territory (NT) waters: the Giant Mud Crab (Scylla serrata), which constitutes around 99 per cent of the commercial harvest, and the Orange Mud Crab (S. olivacea), which forms the remainder1. There is no published information on the biology of the Orange Mud Crab in Australian waters; all biological information presented here relates to the Giant Mud Crab only.
Egg-bearing female Giant Mud Crabs migrate up to 95 km offshore to release their offspring2, which average around 5 million per individual3. These features, coupled with a planktonic larval stage that can last for several weeks4, assist in facilitating gene flow between areas. Genetic evidence suggests that there are at least two biological stocks of Giant Mud Crabs in Australian waters: one to the west and another to the south-east of Torres Strait5 (commonly referred to as the Northern Australian and East Coast Biological Stocks, respectively).
Large differences in the commercial catch of Mud Crabs in different regions of the NT in recent years (Figure 2) suggest that there may be further genetic separation within the “northern Australian” stock. The (negative) slope of the line fitted to annual catches from the Gulf of Carpentaria (GoC) over the last four

FISHERY REPORT NO. 118 MUD CRAB
36
years (consistent with the estimated maximum life span of Mud Crabs) is 3.6 times greater than the slope for the corresponding plot for the remainder of the NT coastline. Such a disparity would not be expected if there was strong demographic connectivity across northern Australia. In light of this, stock status of Giant Mud Crabs in NT waters are presented for the Arafura-West and Western GoC stocks, with the point of separation being Cape Grey; 13°00’S, 136°39’E.
Stock status Annual catches by all fishing sectors (where available) are shown in Figure 3, noting that the data is pooled across stocks. The commercial sector accounts for the majority of the Mud Crab harvest in the NT and provides the only continuous time series of catch and fishing effort data for this species. This being the case, the status determinations below are primarily based on information from this sector.
Arafura-West Most fishing effort on the Arafura-West stock occurs within a 150-km radius of Darwin. The only concurrent estimates of the harvest by recreational and Indigenous fishers from the Arafura-West stock are more than a decade old (i.e. 2000–01) and suggest that their combined take accounted for around 40 per cent of the overall harvest at that time6,7. A more recent survey8 confirms the significance of the recreational harvest in this region.
Commercial catches were fairly stable during the decade spanning 2006 to 2015. The average catch during this time was 124 tonnes (t), ranging from 105 t to 149 t (i.e. 85–121 per cent of the 10-year average, respectively). Corresponding catch rates have been more variable, ranging from 0.3 to 0.8 kg/pot-lift, with lower annual catch rates being a function of fisher competition in a few key areas in those years where there was effort displacement from the Western GoC stock.
Relatively stable catches over the last decade, combined with protective management measures (such as minimum size limits), large unfished areas (which may buffer the effects of fishing) and a strong (westward flowing) long-shore wet season current9 (that can facilitate long-distance dispersal of larvae) suggest that the biomass of Giant Mud Crabs within the Arafura-West stock is unlikely to be recruitment overfished and that fishing effort (to the end of 2015) is unlikely to cause this stock to become recruitment overfished.
On the basis of the evidence presented above, the Arafura-West stock is classified as a sustainable stock.
Western Gulf of Carpentaria The Western GoC stock accounts for over 70 per cent of the commercial Giant Mud Crab harvest in the NT over the last 20 years. The combined harvest by recreational and Indigenous fishers from this stock in 2000–01 was relatively low, at around 10 per cent of the overall take6,7. A more recent recreational survey (in 2009–10) confirmed that recreational fishers take a minor fraction (i.e. <5 per cent) of the Western GoC stock8.
Commercial catch rates of Giant Mud Crabs are correlated with environmental variables, with wet season rainfall being the strongest known correlate at lower latitudes10,11. Monsoonal rainfall across many catchments emptying into the GoC has been lower than average since 2013, coinciding with a period of historically low catches (noting that wet-season rainfall across catchments emptying into the Arafura-West stock is generally double that experienced by the Western GoC stock).
A size-age-sex stock synthesis model applied to pooled catch and effort data (to December 2010) for the entire NT showed no indication of reduced average recruitment at low spawning stock sizes12. However, the inclusion of data to December 2015 revealed an emerging pattern of low stock size and subsequent low recruitment over the past few years. An alternative (delay-difference) model, using data specific to the Western GoC stock, was recently developed to assess the recruitment overfishing risk in this management

STATUS OF KEY NORTHERN TERRITORY FISH STOCKS REPORT 2015 MUD CRAB
37
unit13. The outputs of this model suggest that overfishing is not currently occurring but may have occurred between 2009 and 2012. However, the model is sensitive to changes in the catchability of crabs (through changes in fishing practices) and there is some risk that overfishing did occur in 2015, while unfavourable environmental conditions constrained recruitment.
The oceanography of the GoC is different from that of adjacent water bodies in northern Australia (i.e. the Arafura and Coral seas)9,14 and features such as rotating currents (gyres) may restrict the dispersal of larvae in the GoC compared with other sections of northern Australia. While environmental factors do appear to have a significant impact on Giant Mud Crab recruitment, it is possible that intermittent overfishing of the Western GoC stock has occurred in recent years and that overfishing did take place in 2015.
On the basis of the evidence presented above, the Western GoC stock is classified as a transitional–depleting stock.
Table 2. Giant Mud Crab biology15,16
Longevity and Maximum size 3–4 years; 230 mm CW, but rarely exceeds 200 mm CW in most areas
Maturity (50 per cent) 120–150 mm CW
CW = Carapace width
Figure 1. Distribution of reported commercial catch of Giant Mud Crabs in the Northern Territory during 2015

FISHERY REPORT NO. 118 MUD CRAB
38
Figure 2. Commercial catch of Giant Mud Crabs in the Northern Territory by stock from 2000 to 2015
Figure 3. Catch of Giant Mud Crabs in Northern Territory waters by fishing sector from 2000 to 2015
0
300
600
900
1200
2000 2002 2004 2006 2008 2010 2012 2014
Catc
h (t
onne
s)
Arafura-West Western Gulf of Carpentaria
0
300
600
900
1200
1500
2000 2002 2004 2006 2008 2010 2012 2014
Catc
h (t
onne
s)
Commercial Recreational Indigenous

STATUS OF KEY NORTHERN TERRITORY FISH STOCKS REPORT 2015 MUD CRAB
39
The increase in the commercial minimum legal size implemented in 2006 had a significant impact on the fraction of the catch that commercial fishers can retain, particularly in the Gulf of Carpentaria. Any comparison of commercial catches before and after this time must be made with extreme caution.
Table 3. Main features and statistics for the fishing sectors harvesting Giant Mud Crabs in Northern Territory waters during 2015
Fishing sector Commercial Recreational Indigenous
Fishing methods
Trap
Rod and line
Dilly net
Scoop net
Cast net
Beach seine net
Hand collection
Spearfishing
Management methods
Limited entry
Spatial closures
Size limits
Catch limits
Gear restrictions
Protection of berried females
Protection of soft-shelled crabs
Catch
188 t
Recreational: 24 t (2010)10 Fishing tour operators: (<1 t)
69 t (2001)8
Active commercial licences 42
Effects of Giant Mud Crab fishing on the marine environment Giant Mud Crabs are targeted using lightweight traps (known locally as pots) that have minimal impact on the muddy substrates on which they are set. Daily pot checks and frequent pot repositioning further reduce the potential for long-term impacts on benthic communities.
Discard rates of undersized Mud Crabs can be as high as 70 per cent of the total catch in some areas17. Research has demonstrated the value of escape vents in reducing the retention of undersized Mud Crabs and small teleost bycatch in a variety of Mud Crab traps18–20. Around 25 per cent of licensees in the NT voluntarily use escape vents in their wire-mesh pots.

FISHERY REPORT NO. 118 MUD CRAB
40
Environmental effects on Giant Mud Crabs Juvenile Giant Mud Crabs prefer to settle on seagrass rather than on mud or sand21 and also utilise mangrove forests22. Therefore, any significant reduction in these habitat types (through human or natural disturbances, including cyclones) could affect recruitment success.
Commercial catch rates generally show positive correlations with environmental factors, such as rainfall and sea surface temperature, depending on location10. Catch rates are more strongly linked to sea-surface temperatures at higher latitudes and rainfall at lower latitudes. Mud Crabs may potentially benefit from moderate climate change in some areas23. Increased water temperatures at higher latitudes might increase growth rates and reproductive activity. Greater rainfall in the tropics might increase primary and secondary productivity, thereby providing more food for juvenile crabs. Any such benefits will only occur within the physiological tolerances of the particular developmental stage affected.
References 1. Calogeras, C. and Hay, T. (2000). Fishery Status Reports 1999. Fishery Report No. 55, Northern
Territory Department of Primary Industry and Fisheries, Darwin. 2. Hill, B. J. (1994). Offshore spawning by the portunid crab Scylla serrata (Crustacea Decapoda).
Marine Biology, 120: 379–384. 3. Mann, D., Asakawa, T. and Blackshaw, A. (1999). Performance of mud crab Scylla serrata
broodstock held at Bribie Island Aquaculture Research Centre, In: C. P. Keenan and A. Blackshaw (Eds.), Mud Crab Aquaculture and Biology. Proceedings of an international scientific forum held in Darwin, Australia, 101–105, ACIAR Proceedings No. 78.
4. Nurdiani, R. and Zeng, C. S. (2007). Effects of temperature and salinity on the survival and development of Mud Crab, Scylla serrata (Forskål), larvae. Aquaculture Research, 38: 1529–1538.
5. Gopurenko, D. and Hughes, J. M. (2002). Regional patterns of genetic structure among Australian populations of the mud crab Scylla serrata (Crustacea: Decapoda). Marine and Freshwater Research, 53: 849–857.
6. Henry, G. W. and Lyle, J. M. (2003). The national recreational and Indigenous fishing survey. Final Report to the Fisheries Research Development Corporation, Project 99/158, Australian Government Department of Agriculture, Fisheries and Forestry, Canberra. http://eprints.utas.edu.au/ 2526/1/Henry_Lyle_Nationalsurvey.pdf.
7. Coleman, A. P. M. (2004). The National Recreational Fishing Survey: The Northern Territory. Fishery Report No. 72, Northern Territory Department of Business, Industry and Resource Development.
8. West, L. D., Lyle, J. M., Matthews, S. R. and Stark, K. E. (2012). A survey of recreational fishing in the Northern Territory, 2009–10. Fishery Report No. 109, Northern Territory Department of Resources, Darwin.
9. Schiller, A. (2011). Ocean circulation on the North Australian Shelf. Continental Shelf Research, 31: 1087–1095.
10. Meynecke, J. O., Grubert, M. A. and Gillson, J. (2012). Giant Mud Crab (Scylla serrata) catches and climate drivers in Australia—a large scale comparison. Marine and Freshwater Research, 63: 84–94.
11. Meynecke, J. O., Grubert, M. A., Arthur, J. M., Boston, R. and Lee, S. Y. (2012). The influence of the La Niña-El Niño cycle on giant mud crab (Scylla serrata) catches in Northern Australia. Estuarine, Coastal and Shelf Science, 100: 93-101.
12. Grubert, M. A., Saunders, T. M., Martin, J M., Lee, H. S. and Walters, C. J. (2013). Stock assessments of selected Northern Territory fishes. Fishery Report No. 110, Northern Territory Department of Primary Industry and Fisheries, Darwin.
13. Walters, C. J. (2016). Delay difference model for the Western Gulf of Carpentaria Mud Crab Fishery, www.dropbox.com/s/g40r0x9zhgv0h27/Mud Crab full delay difference model.xlsm?dl

STATUS OF KEY NORTHERN TERRITORY FISH STOCKS REPORT 2015 MUD CRAB
41
14. Condie, S. (2011). Modelling seasonal circulation, upwelling and tidal mixing in the Arafura and Timor Seas. Continental Shelf Research, 31: 1427–1436.
15. Knuckey, I. A. (1999). Mud Crab (Scylla serrata) population dynamics in the Northern Territory, Australia and their relationship to the commercial fishery. PhD thesis, Northern Territory University, Darwin.
16. Heasman, M. P. (1980). Aspects of the general biology and fishery of the mud crab Scylla serrata (Forskål), in Moreton Bay, Queensland. PhD thesis, University of Queensland, Brisbane, http://espace.library.uq.edu.au/view/UQ:381994.
17. Ward, T. M., Schmarr, D. W. and McGarvey, R. (2008). Northern Territory Mud Crab Fishery: 2007 stock assessment. Report to the Northern Territory Department of Primary Industry, Fisheries and Mines, and the South Australian Research and Development Institute: Research Report Series No. 244, SARDI, West Beach.
18. Grubert, M. A. and Lee, H. S. (2013). Improving gear selectivity in Australian Mud Crab fisheries. Fishery Report No. 112, Northern Territory Government Department of Primary Industry and Fisheries, Darwin.
19. Rotherham, D., Johnson, D. D., Macbeth, W. G. and Gray, C. A. (2013). Escape gaps as a management strategy for reducing bycatch in net-covered traps for the Giant Mud Crab Scylla serrata. North American Journal of Fisheries Management, 33: 307–317.
20. Broadhurst, M. K., Butcher, P. A. and Cullis, B. R. (2014). Effects of mesh size and escape gaps on discarding in an Australian Giant Mud Crab (Scylla serrata) trap fishery. PLoS ONE, 9(9): e106414, doi:10.1371/journal.pone.0106414.
21. Webley, J. A. C., Connolly, R. M. and Young, R. A. (2009). Habitat selectivity of megalopae and juvenile Mud Crabs (Scylla serrata): implications for recruitment mechanism. Marine Biology, 156: 891–899.
22. Alberts-Hubatsch, H., Lee, S. Y., Diele, K., Wolff, M. and Nordhaus, I. (2014). Microhabitat use of early benthic stage mud crabs, Scylla serrata (Forskål, 1775), in eastern Australia. Journal of Crustacean Research, 34: 604–610.
23. Welch, D. J., Saunders, T., Robins, J., Harry, A., Johnson, J., Maynard, J., Saunders, R., Pecl, G., Sawynok, B. and Tobin, A. (2014). Implications of climate change on fisheries resources of northern Australia, Part 1: Vulnerability assessment and adaptation options. Final Report to the Fisheries Research and Development Corporation, Project 2010/565, James Cook University, Townsville.

FISHERY REPORT NO. 118 SANDFISH
42
SANDFISH HOLOTHURIA SCABRA
Mark Grubert
Table 1. Stock status determination for Sandfish
Stock Northern Territory Sandfish
Fisheries TF
Stock status Undefined
Indicators Catch, effort
TF = Trepang Fishery
Stock structure Sandfish (Holothuria scabra), also commonly known as Trepang, are widespread in the tropical Indo-West Pacific between latitudes 30˚ N and 30 ˚S, but no farther east than Fiji1. They inhabit shallow coastal waters with soft sediments and seagrass beds. Genetic analyses of Sandfish from Northern Territory (NT) waters suggest that there are separate stocks either side of the Wessel Islands2. However, because of the difficulties in obtaining biological information to assess each stock individually, status is reported at the jurisdictional level here.
Stock status The harvest of Sandfish in northern Australia dates back to at least the 1700s, when traders from Makassar (Ujung Pandang) visited the area to fish for this delicacy. Fishing in what is now known as the N T (formerly part of South Australia) declined around 1880, and the South Australian Government ceased issuing licences to Macassans in 19073. Small catches continued until 1945, but exports were negligible from then until the early 1980s. Prior to this downturn, commercial fishing activity was coordinated by European Australians with assistance from the Indigenous people of Arnhem Land. Increasing interest in the late 1980s led to the re-emergence of the Trepang Fishery. Catches of Sandfish peaked at 247 tonnes (t) whole weight in 2000 and fluctuated between 100 t and 200 t for the next seven years. Catches thereafter were comparatively low because of a four-fold decrease in annual fishing effort. Fishers have indicated that this reduction in fishing effort was caused by difficulties in sourcing divers and crew rather than any noticeable decline in Sandfish abundance.
Four of the six commercial licences were active in 2015 and caught 59 t of Sandfish. The zero catch in 2014 was due to zero fishing effort. Catch rates are considered an unreliable indicator of Sandfish abundance at present because of the dynamic and sporadic nature of fishing activities targeting this species.

STATUS OF KEY NORTHERN TERRITORY FISH STOCKS REPORT 2015 SANDFISH
43
The recreational and Indigenous take of Sandfish has not been quantified and is assumed to be negligible. Limited knowledge of the fishery biology of Sandfish, combined with highly variable catch, effort and catch rates in recent years means that it is not possible to confidently classify the status of this species.
On the basis of the evidence provided above, the NT Sandfish stock is classified as an undefined stock.
Table 2. Sandfish biology1,4
Longevity and maximum size Longevity unknown; maximum length 38 cm
Maturity (50 per cent) 16-25 cm (2 years)
Figure 1. Distribution of reported commercial catch of Sandfish in Northern Territory waters during 2015

FISHERY REPORT NO. 118 SANDFISH
44
Figure 2. Commercial catch (whole weight) of Sandfish in Northern Territory waters from 2000 to 2015
Table 3. Main features and statistics for the fishing sectors harvesting Sandfish in Northern Territory waters during 2015
Fishing sector Commercial Recreational Indigenous
Fishing methods
SCUBA or hookah diving
Hand collection
Management methods
Limited entry
Spatial closures
Spatial zoning
Size limits
Gear restrictions
Catch (whole weight)
59 t Unknown Unknown
Active commercial licences 4
Effects of Sandfish fishing on the marine environment Sandfish are typically harvested through hookah diving. The targeted collection method results in little interaction with other benthic species and the wider marine environment.
0
50
100
150
200
250
2000 2002 2004 2006 2008 2010 2012 2014
Catc
h (t
onne
s)

STATUS OF KEY NORTHERN TERRITORY FISH STOCKS REPORT 2015 SANDFISH
45
Environmental effects on Sandfish Sandfish are unable to regulate their ionic balance and populations can experience significant mortality events if exposed to freshwater run-off for extended periods of time. Intense wave action (such as that caused by cyclones) may also cause death or damage to Sandfish inhabiting shallow waters.
References 1. Purcell, S. W., Samyn, Y. and Conand, C. (2012). Commercially Important Sea Cucumbers of the
World. FAO, Rome. 2. Gardner, M. G., Li, X. and Fitch, A. J. (2012). Population genetic structure of sea cucumbers (bêche-
de-mer) in northern Australia. Final report to the Australian Seafood Cooperative Research Centre, project 2008/733.
3. MacKnight, C. C. (1976). The voyage to Marege: Macassan trepangers in northern Australia. Melbourne University Press, Carlton.
4. Vail, L. L. (1989). Trepang resource surveys: Melville Island, Gove Harbour, Croker Island. Northern Territory Museum of Arts and Sciences, Darwin.

FISHERY REPORT NO. 118 BLACKTIP SHARKS
46
THE AUSTRALIAN BLACKTIP SHARK CARCHARHINUS TILSTONI AND THE COMMON
BLACKTIP SHARK C. LIMBATUS
Grant Johnson and Thor Saunders
Table 1. Stock status determination for the Australian Blacktip Shark and the Common Blacktip Shark
Stock North and west coast Gulf of Carpentaria
Fisheries ONLF ONLF
Stock status Sustainable Undefined
Indicators Catch, CPUE, stock reduction analysis
ONLF = Offshore Net and Line Fishery; CPUE = Catch per unit effort
Stock structure In the Northern Territory (NT), the term Blacktip Shark refers to two similar-looking Carcharhinidae (whaler sharks) species: Carcharhinus tilstoni and C.limbatus. The distribution of C. tilstoni is confined to waters off northern Australia (Figure 1), while C. limbatus is globally distributed in tropical and warm temperate waters. In Australian waters, genetic studies have identified two biological stocks of C. tilstoni (a western biological stock extending from the western NT into northern Western Australia and an eastern biological stock extending from the Gulf of Carpentaria (GoC) to the east coast of Queensland and New South Wales (NSW)), and three biological stocks of C. limbatus (one across Western Australia and the NT, one in the GoC and one on the east coast of Queensland and NSW)1.
Carcharhinus limbatus and C. tilstoni are very similar in appearance and have in the past only been taxonomically differentiated by genetic analyses, pre-caudal vertebral counts or differences in size of maturity2,3 .However, a recent study has developed new techniques, which allow the two species to be distinguished in the field; future adoption of these techniques will improve the estimates of the relative proportion of each species in the catch4.
Although the Blacktip Shark species complex comprises two species with differing stock structures, in the NT, stocks of both species share similar boundaries, the first along the north and west coast and a second in the GoC.

STATUS OF KEY NORTHERN TERRITORY FISH STOCKS REPORT 2015 BLACKTIP SHARKS
47
Stock status
North and west coast There is uncertainty in the species composition and magnitude of historical Blacktip Shark catches, with neither species recorded in commercial logbooks from Western Australia. In 2015, 35 tonnes (t) of Blacktip Sharks were caught in the NT from the north and west coast stock (Figure 2).
An assessment of this stock, using a stochastic Stock Reduction Analysis model and including data up to 2011, indicated that it had declined substantially as a result of the high Taiwanese catches in the 1970s and 1980s. The cessation of foreign fishing and more stringent management of the domestic fishery helped the stock to recover, with model outputs estimating biomass at 93 per cent of unfished levels in 2011, which are well within sustainability limits5. This is supported by the results of a mark-recapture study in the NT6 , which suggests that the biomass of this stock is unlikely to be recruitment overfished and that current catch levels are unlikely to cause the biological stock to become recruitment overfished.
On the basis of the evidence provided above, the north and west coast stock is classified as sustainable stocks.
Gulf of Carpentaria The management of the GoC stock is shared by Queensland and the NT through the respective Queensland and NT fisheries joint authorities. From 2002 to 2012, combined catches in these two jurisdictions fluctuated between 200 and 460 t, with the NT accounting for ~40 per cent of the catch. In 2015, only 4 t of Blacktip Shark were caught in the local jurisdiction of this stock, while 59 t were reported from Queensland’s GoC Inshore Finfish Fishery (GoCIFFF). The catch composition data for this fishery is relatively poor with Blacktip Shark often reported in broader catch categories that include the Graceful Shark (C. amblyrhynchoides). The decline in catch over the last three years is, to a certain extent, due to changes in management arrangements to the GoCIFFF. Most notably, there was a 66 per cent decrease in the maximum length of net (from 27 km to 9 km) that could be used in the offshore component of this fishery. In addition, there were also changes to the inshore (within 7 nautical miles off the coast) component of this fishery that reduced the capacity for boats to target Blacktip Sharks.
The inability to assign more accurate catch records to each species makes it difficult to identify catch and effort trends for this species complex. For this reason, the impact of current catch levels on this stock is unknown and there is insufficient information to confidently classify their status.
On the basis of the evidence provided above, the GoC stock is classified as undefined stocks.
Table 2. Blacktip Shark biology3,7-9
Longevity and maximum size C. tilstoni: Males: 13 years; females: 15 years; 200 cm TL*
C. limbatus: 250 cm TL*
Maturity (50 per cent) C. tilstoni: Males: 120 cm TL* (5-6 years); females: 135–140 cm TL(5-6 years);
C. limbatus: Males: 180 cm TL; females unknown*
TL = Total length; *Biological estimates do not account for hybridisation between C. tilstoni and C. limbatus.

FISHERY REPORT NO. 118 BLACKTIP SHARKS
48
Figure 1. Distribution of reported commercial catch of Blacktip Shark by the Offshore Net and Line Fishery in Northern Territory waters during 2015
Figure 2. Catch of Blacktip Shark in Northern Territory waters by the Offshore Net and Line Fishery from 1983 to 2015
0
200
400
600
800
1983 1987 1991 1995 1999 2003 2007 2011 2015
Catc
h (t
onne
s)
North and west coast Gulf of Carpentaria

STATUS OF KEY NORTHERN TERRITORY FISH STOCKS REPORT 2015 BLACKTIP SHARKS
49
Table 3. Main features and statistics for the fishing sectors harvesting Blacktip Sharks in Northern Territory waters during 2015
Fishing sector Commercial Recreational Indigenous
Fishing methods
Pelagic gillnet
Anchored longline
Rod and line
Spearfishing
Hand line
Management methods
Limited entry
Vessel restrictions
Spatial closures
Total allowable effort
Gear restrictions
Possession limits
Catch
39 t Unknown Unknown
Active commercial licences 8
Effects of fishing on the marine environment Blacktip Sharks are mainly targeted using pelagic gillnets and longlines by the Offshore Net and Line Fishery. These gear types are not intended to come into contact with the seabed, so have almost no impact on benthic habitats. The physical characteristics of these gear types, and the way in which they are used to fish, are also selective for the target species, with bycatch making up only a small proportion of the catch10. These gear types do, however, interact with a range of threatened, endangered and protected species (TEPS), such as turtles and dolphins. Although the numbers of reported interactions in the commercial logbooks are low, the impact on the populations of TEPS is unknown or is assessed by the Fisheries Division of the Department of Primary Industry and Resources as negligible to low risk.
Environmental effects on Blacktip Sharks The impact of environmental factors on biological stocks of Blacktip Shark is unknown. These species are adapted to a range of environmental conditions and are therefore likely to be resilient to environmental changes.

FISHERY REPORT NO. 118 BLACKTIP SHARKS
50
References 1. Ovenden J. R., Street R., Broderick, D., Kashiwagi, T. and Salini, J. (2007). Genetic population
structure of black-tip sharks (Carcharhinus tilstoni and C. sorrah) in northern Australia. In: Salini J., McAuley, R., Blaber, S., Buckworth, R. C., Chidlow, J., Gribble, N., Ovenden, J. R., Peverell, S., Pillans, R., Stevens, J. D., Stobutzki, I., Tarca, C. and Walker, T. I. (Eds.). Northern Australian Sharks and Rays: the Sustainability of Target and Bycatch Species. Phase 2, Fisheries Research and Development Corporation, Cleveland, Queensland.
2. Morgan J. A., Harry, A. V., Welch, D. J., Street, R., White, J., Geraghty, P. T., Macbeth, W. G., Tobin, A., Simpfendorfer, C. A. and Ovenden, J. R. (2011). Detection of interspecies hybridisation in Chondrichthyes: hybrids and hybrid offspring between Australian (Carcharhinus tilstoni) and common (C. limbatus) blacktip shark found in an Australian fishery. Conservation Genetics, 13: 455–463.
3. Harry, A. V. (2011). Life histories of commercially important tropical sharks from the Great Barrier Reef World Heritage Area. PhD thesis, James Cook University, Townsville.
4. Johnson, G. J., Buckworth, R. C., Lee, H., Morgan, J. A. T., Ovenden, J. R. and McMahon, C. R. (2016). A novel field method to distinguish between cryptic carcharhinid sharks, Australian blacktip shark Carcharhinus tilstoni and common blacktip shark C. limbatus, despite the presence of hybrids. Journal of Fish Biology, 10:1111/jfb.13102.
5. Grubert, M. A., Saunders, T. M., Martin, J. M., Lee, H. S. and Walters, C. J. (2013). Stock Assessments of Selected Northern Territory Fishes. Fishery Report No. 110, Northern Territory Department of Primary Industry and Fisheries, Darwin.
6. Bradshaw, C. J. A., Field, I. C., McMahon, C. R., Johnson, G. J., Meekan, M. G. and Buckworth, R. C. (2013). More analytical bite in estimating targets for shark harvest. Marine Ecology Progress Series, 488: 221–232.
7. Harry, A. V., Morgan, J. A. T., Ovenden, J. R., Tobin, A., Welch, D. J. and Simpfendorfer, C. (2012). Comparison of the reproductive ecology of two sympatric blacktip sharks (Carcharhinus limbatus and Carcharhinus tilstoni) off north-eastern Australia with species identification inferred from vertebral counts. Journal of Fish Biology, 81: 1225–1233.
8. Harry, A. V., Tobin, A. J., Simpfendorfer, C. A., Welch, D. J., Mapleston, A., White, J., Williams, A. J. and Stapley, J. (2011). Evaluating catch and mitigating risk in a multi-species, tropical, inshore shark fishery within the Great Barrier Reef World Heritage Area. Marine and Freshwater Research, 62: 710–721.
9. Last, P. R. and Stevens, J. D. (2009). Sharks and Rays of Australia. CSIRO Publishing, Collingwood.
10. Halliday, I. A., Ley, J. A., Tobin, A., Garrett, R., Gribble, N. A. and Mayer, D. G. (2001). The effects of net fishing: addressing biodiversity and bycatch issues in Queensland inshore waters. Final Report to the Fisheries Research and Development Corporation, Project 97/206, Queensland Department of Primary Industries, Brisbane.
11. Northern Territory Government (2013). Fishery Status Reports 2011. Fishery Report No. 111, Northern Territory Department of Primary Industry and Fisheries, Darwin.

STATUS OF KEY NORTHERN TERRITORY FISH STOCKS REPORT 2015 BARRAMUNDI
51
BARRAMUNDI LATES CALCARIFER
Graham Schultz and Hock Lee
Table 1. Stock status determination for Barramundi
Stock Northern Territory Barramundi
Fisheries BF
Stock status Sustainable
Indicators Catch, CPUE, length and age frequencies
BF = Barramundi Fishery; CPUE = Catch per unit effort
Stock structure Barramundi are distributed throughout coastal areas of the Indo-West Pacific region – from the eastern edge of the Persian Gulf to southern Japan and southward to northern Australia. In northern Australia, they are found in rivers and along the coast from Exmouth Gulf in Western Australia to northern New South Wales. Although separate biological stocks of Barramundi are considered to exist at the scale of individual river catchments across northern Australia1,2, given the difficulties in obtaining biological information to assess each stock individually, status is reported at the Northern Territory (NT)-wide level. This assessment is based on the river catchments that receive the highest harvest rates (Daly and Mary rivers) (Figure 1) and whose status is assumed to be representative of the highest level of exploitation that occurs on any stock within the NT.
Stock status Following three years of near record commercial catches and catch rates in the Barramundi Fishery between 2010 and 2012, both catch and catch rates declined in 2013 (Figures 2 & 3). This decline was associated with several experienced operators leaving the fishery and a poor wet season (surveys indicate high levels of recruitment during high-rainfall wet seasons3,4). Since then, commercial catches and catch rates have remained stable and well within historical levels. This has coincided with a period of low-rainfall wet seasons. Monitored river catchments have a healthy size and age-distribution of Barramundi and recaptures from tagging programs indicate that the annual harvest rate from all fishing sectors combined is consistently below 5 per cent. This suggests the stock is not considered to be recruitment overfished and the current level of fishing mortality is unlikely to cause the stock to become recruitment overfished.

FISHERY REPORT NO. 118 BARRAMUNDI
52
On the basis of the evidence provided above, the NT Barramundi stock is classified as a sustainable stock.
Table 2. Barramundi biology5
Longevity and maximum size 35 years; 150 cm TL
Maturity (50 per cent) Males: 73 cm TL (2–5 years); females: 91 cm TL (5–7 years)
TL = Total length
Figure 1. Distribution of reported commercial catch of Barramundi in Northern Territory waters during 2015

STATUS OF KEY NORTHERN TERRITORY FISH STOCKS REPORT 2015 BARRAMUNDI
53
Figure 2. Catch of Barramundi in Northern Territory waters by fishing sector from 2000 to 2015
Figure 3. Commercial catch per unit effort (CPUE; kg per 100 m of net per day) for Barramundi in Northern Territory waters from 1983 to 2015
0
400
800
1200
1600
1983 1987 1991 1995 1999 2003 2007 2011 2015
Catc
h (t
onne
s)
Commercial Recreational Fishing tour operators Indigenous
0
10
20
30
40
50
1983 1987 1991 1995 1999 2003 2007 2011 2015
CPU
E (k
g pe
r 100
m o
f net
/day
)

FISHERY REPORT NO. 118 BARRAMUNDI
54
Table 3. Main features and statistics for the fishing sectors harvesting Barramundi in Northern Territory waters during 2015
Fishing sector Commercial Recreational Indigenous
Fishing methods
Gill net
Rod and line
Spearfishing
Hand line
Management methods
Size limits
Limited entry
Spatial zoning
Vessel restrictions
Catch limits
Spatial closures
Temporal closures
Gear restrictions
Possession limits
Catch
383 t Recreational: 155 t (2010)6
Fishing tour operators: 39 t
110 t (2000)
Active commercial vessels 14
Effects of fishing on the marine environment Barramundi are mainly caught using commercial gill nets, which have almost no impact on benthic habitats and are quite selective in their harvest. Reported bycatch in the Barramundi Fishery represents less than 1 per cent of the total catch7 and typically consists of Queenfish, unwanted shark species and catfish. Commercial gill nets have been found to often interact with threatened, endangered and protected species (TEPS). The most common TEPS interactions involve Saltwater Crocodiles (<50 interactions per year), but this is unlikely to impact on populations given that this species has reached carrying capacity in most catchments8. Other TEPS interactions include Largetooth Sawfish, Green Sawfish, turtles and dugongs, but these are less common (<10 per year). The low bycatch and interaction levels with TEPS are supported by observer data collected on board commercial vessels.

STATUS OF KEY NORTHERN TERRITORY FISH STOCKS REPORT 2015 BARRAMUNDI
55
Environmental effects on Barramundi The duration, magnitude and timing of rainfall during the wet season strongly drives biomass and harvest of Barramundi stocks with large, early wet seasons resulting in higher recruitment than smaller wet seasons3,4.
References 1. Keenan, C. P. (1994). Recent evolution of population structure in Australian Barramundi, Lates
calcarifer (Bloch): an example of isolation by distance in one dimension. Australian Journal of Marine and Freshwater Research, 45: 1123–1148.
2. Keenan, C. P. (2000). Should we allow human-induced migration of the IndoWest Pacific fish, Barramundi Lates calcarifer (Bloch) within Australia? Aquaculture Research, 31: 121–131.
3. Halliday, I. A., Saunders, T., Sellin, M., Allsop, Q., Robins, J. B., McLennan, M. and Kurnoth, P. (2012). Flow impacts on estuarine finfish fisheries of the Gulf of Carpentaria. Final Report to the Fisheries Research and Development Corporation, Project 2007/002, Queensland Department of Agriculture, Fisheries and Forestry, Brisbane.
4. Robins, J. B., Halliday, I. A., Staunton-Smith, J., Mayer, D. G. and Sellin, M. J. (2005). Freshwater flow requirements of estuarine fisheries in tropical Australia: a review of the state of knowledge and application of a suggested approach. Marine & Freshwater Research, 56: 343–360.
5. Davis, T. L. O. (1982). Maturity and sexuality in Barramundi, Lates calcarifer (Bloch), in the Northern Territory and south-eastern Gulf of Carpentaria. Australian Journal of Marine and Freshwater Research, 33: 529–545.
6. West, L. D., Lyle, J. M., Matthews, S. R. and Stark, K. E. (2012). A survey of recreational fishing in the Northern Territory, 2009–10, Fishery Report No. 109, Northern Territory Department of Primary Industry and Fisheries, Darwin.
7. Halliday, I. A., Ley, J. A., Tobin, A., Garrett, R., Gribble, N. A. and Mayer, D. G. (2001). The effects of net fishing: addressing biodiversity and bycatch issues in Queensland inshore waters. Final Report to the Fisheries Research and Development Corporation, Project 97/206, Queensland Department of Primary Industries, Brisbane.
8. Fukuda, Y. P., Webb, G., Manolis, C., Delaney, R., Letnic, M., Lidner, G. and Whitehead, P. (2011). Recovery of Saltwater Crocodiles following unregulated hunting in tidal rivers of the Northern Territory, Australia. The Journal of Wildlife Management, 75(6): 1253-1266.

FISHERY REPORT NO. 118 BLACK JEWFISH
56
BLACK JEWFISH PROTONIBEA DIACANTHUS
Lianos Triantafillos
Table 1. Stock status determination for Black Jewfish
Stock Northern Territory Black Jewfish
Fisheries BF, CLF, DF, FTO, TRF, ONLF
Stock status Overfished
Indicators Catch, CPUE, stock reduction analysis
BF = Barramundi Fishery; CLF = Coastal Line Fishery; DF = Demersal Fishery; FTO = Fishing tour operators; TRF = Timor Reef Fishery; ONLF = Offshore Net and Line Fishery. CPUE = Catch per unit effort.
Stock structure Black Jewfish (Protonibea diacanthus) is a widespread Indo-Pacific species, which is found in the area from the Pilbara in Western Australia across northern Australia to the east coast of Queensland. This species has a tendency to aggregate annually in large numbers at well-defined times and is typically found in coastal waters up to a depth of a 100 m (Figure 1). The stock structure for this species has been investigated in the north-western part of its range from the western Gulf of Carpentaria to its southern extent along the West Australian coastline1. The results indicate that separate stocks exist in the waters of the Northern Territory (NT) at the scale of tens of kilometres1. Given the difficulties in obtaining biological information to assess each stock individually, the status is reported at the NT-wide level.
Stock status The most recent stock assessment for this species estimated that both the biomass and egg production of Black Jewfish in NT waters was at 28 per cent of unfished levels2. The model used in this assessment was an update of the 2011 stochastic Stock Reduction Analysis model3 and included data up until 2014. The outputs of this model indicated there was a high probability (98 per cent) that Black Jewfish have been overfished and that current fishing pressure is continuing to cause overfishing (80 per cent)2.
Given the recent new information on the stock structure of this species1, it is likely that the assessment incorporates several stocks. However, the model is driven by the stocks that have the highest harvest rates so their status can be assumed to be representative of the highest level of exploitation that occurs in any stock. The immediate area of concern is in waters around Darwin, where most of the fishing pressure

STATUS OF KEY NORTHERN TERRITORY FISH STOCKS REPORT 2015 BLACK JEWFISH
57
occurs2. The fishing sectors accessing these highly-exploited stocks are those that operate inshore and include the Coastal Line Fishery, fishing tour operators and recreational fishers (Figure 2).
Black Jewfish have also been shown to be highly susceptible to barotrauma when caught in waters deeper than 10 m4,5. Black Jewfish are therefore considered to be recruitment overfished in the waters around Darwin.
Management methods, in the form of catch limits and spatial closures have been implemented to reduce harvest by a recommended 20 per cent to allow for the biomass of Black Jewfish stocks to recover3. This level of fishing pressure is expected to allow the stocks to recover from their recruitment overfished state; however, measurable improvements in biomass are yet to be detected.
On the basis of the evidence provided above, the NT Black Jewfish stock is classified as an overfished stock.
Table 2. Black Jewfish biology4
Longevity and Maximum size 15 years; 150 cm TL, 30 kg
Maturity (50 per cent) 89 cm TL (2 years)
TL = Total length
Figure 1. Distribution of reported commercial catch of Black Jewfish in Northern Territory waters during 2015

FISHERY REPORT NO. 118 BLACK JEWFISH
58
Figure 2. Catch of Black Jewfish in Northern Territory waters by fishing sector from 2000 to 2015
Figure 3. Commercial catch per unit effort (kg per hook hour) for the Northern Territory Coastal Line Fishery from 2000 to 2015
0
50
100
150
200
250
300
350
2000 2002 2004 2006 2008 2010 2012 2014
Catc
h (t
onne
s)
Commercial Fishing tour operators Recreational
0.0
1.0
2.0
3.0
4.0
5.0
6.0
2000 2002 2004 2006 2008 2010 2012 2014
CPU
E (k
g/ho
ok h
our)

STATUS OF KEY NORTHERN TERRITORY FISH STOCKS REPORT 2015 BLACK JEWFISH
59
Table 3. Main features and statistics for the fishing sectors harvesting Black Jewfish in Northern Territory waters during 2015
Sector Commercial Recreational Indigenous
Fishing methods
Gillnet
Rod and line
Trawl
Fish trap
Hand line
Management methods
Spatial zoning
Limited entry
Gear restrictions
Spatial closures
Vessel restrictions
Catch limits
Possession limits
Catch (tonnes)
142 t Recreational 75 t (2010)3
Fishing tour operators 28 t Unknown
Active commercial licences 40
Effects of fishing on the marine environment Black Jewfish are mainly targeted using hand lines and rods. Beyond the removal of a small proportion of bycatch species, there is little evidence to suggest that these types of gear significantly impact on benthic habitats or pelagic ecological communities.
On occasions, commercial quantities of Black Jewfish are taken using commercial gillnets and trawl gear. For more information on the effects of these gear types on the marine environment, see the chapters on Barramundi (commercial gillnets) and Saddletail Snapper (trawl gear).
Environmental effects on Black Jewfish The impact of environmental factors on Black Jewfish is largely unknown; however, juveniles mainly inhabit estuaries and coastal bays, making this phase of their lifecycle sensitive to ocean current strength and direction, rainfall and river flow, and water temperature, salinity and pH2.

FISHERY REPORT NO. 118 BLACK JEWFISH
60
References 1. Saunders T. M., Welch, D., Barton, D., Crook, D., Dudgeon, C., Hearnden, M., Maher, S., Ovenden,
J., Taillebois, L. and Taylor, J. (2016). Optimising the management of tropical coastal reef fish through the development of Indigenous capability. Final Report to the Fisheries Research and Development Corporation, Project 2013/017, Northern Territory Department of Primary Industry and Fisheries, Darwin.
2. Northern Territory Government. (2016). Fishery Status Reports 2015. Fishery Report No. 115, Northern Territory Government Department of Primary Industry and Resources, Darwin.
3. Grubert, M. A., Saunders, T. M., Martin, J. M., Lee, H. S. and Walters, C. J. (2013). Stock Assessments of Selected Northern Territory Fishes. Fishery Report No. 110, Northern Territory Department of Primary Industry and Fisheries, Darwin.
4. Phelan, M. (2008). Assessment of the implications of target fishing on Black Jewfish (Protonibea diacanthus) aggregations in the Northern Territory. Final Report to the Fisheries Research and Development Corporation, Project 2004/004, Northern Territory Department of Primary Industry and Fisheries, Darwin.
5. Welch, D. J., Robins, J., Saunders, T., Courtney, T., Harry, A., Lawson, E., Moore, B. R., Tobin, A., Turnbull, C., Vance, D. and Williams, A. J. (2014). Implications of climate change impacts on fisheries resources of northern Australia. Part 2: Species profiles. Final Report to the Fisheries Research and Development Corporation, Project 2010/565, James Cook University, Townsville.
6. Mounsey, R. P. and Ramm, D. C. (1991). Evaluation of a New Design of a Semi-demersal Trawl. Fishery Report No. 25, Northern Territory Department of Primary Industry and Fisheries, Darwin.

STATUS OF KEY NORTHERN TERRITORY FISH STOCKS REPORT 2015 KING THREADFIN
61
KING THREADFIN POLYDACTYLUS MACROCHIR
Graham Schultz and Hock Lee
Table 1. Stock status determination for King Threadfin
Stock Northern Territory King Threadfin
Fisheries BF
Stock status Sustainable
Indicators Catch, CPUE, length and age frequencies
BF = Barramundi Fishery; CPUE = Catch per unit effort
Stock structure King Threadfin (Polydactylus macrochir) are distributed in northern Australia and southern Papua New Guinea. Within Australia, this species extends from Exmouth in Western Australia to the Brisbane River in the east and is generally found in similar areas as those for Barramundi, such as marine coastal waters, estuaries and river mouths (Figure 1). Separate biological stocks exist between Chambers Bay in the Northern Territory (NT) and the western side of the Gulf of Carpentaria1. Finer-scale sampling conducted in Queensland and Western Australia revealed stocks separated by distances of tens to hundreds of kilometres or by large, coastal geographical features1. The existence of multiple biological stocks in these states suggests that more biological stocks may also be present in the NT, although this remains to be determined. Given the difficulty in obtaining relevant biological and catch-and-effort information to assess each individual biological stock, status is reported at the NT-wide level.
Stock status Recent commercial catches of King Threadfin are lower than those of the previous 15 years, but they are well within historical levels (Figure 2) and coincide with several experienced operators leaving the Barramundi Fishery (King Threadfin are typically harvested as a byproduct of the Barramundi Fishery). Despite lower catches in recent years, catch rates have increased substantially over the last decade, with the 2015 rate being the highest ever recorded (Figure 3). This, combined with data that indicates that monitored river catchments have a healthy size- and age-distribution suggest that the stock is unlikely to be recruitment overfished and that current levels of fishing mortality are unlikely to cause the stocks to become recruitment overfished.
On the basis of the evidence provided above, the NT King Threadfin stock is classified as a sustainable stock.

FISHERY REPORT NO. 118 KING THREADFIN
62
Table 2. King Threadfin biology2
Longevity and maximum size 22 years; 160 cm TL
Maturity (50 per cent) Males: 61 cm TL (2 years); females: 100 cm TL (6 years)
TL = Total length
Figure 1. Distribution of reported commercial catch of King Threadfin in Northern Territory waters during 2015
Figure 2. Catch of King Threadfin in Northern Territory waters by fishing sector from 1983 to 2015
0
100
200
300
400
500
1983 1987 1991 1995 1999 2003 2007 2011 2015
Catc
h (t
onne
s)
Commercial Recreational Fishing tour operators

STATUS OF KEY NORTHERN TERRITORY FISH STOCKS REPORT 2015 KING THREADFIN
63
Figure 3. Commercial catch per unit effort (CPUE: kg per 100 m of net/day) for King Threadfin from 1983 to 2015
0
4
8
12
16
20
1983 1987 1991 1995 1999 2003 2007 2011 2015
CPU
E (k
g pe
r 100
m o
f net
/day
)

FISHERY REPORT NO. 118 KING THREADFIN
64
Table 3. Main features and statistics for the fishing sectors harvesting King Threadfin in Northern Territory waters during 2015
Fishing sector Commercial Recreational Indigenous
Fishing methods
Gill net
Rod and line
Spearfishing
Hand line
Management methods
Size limits
Limited entry
Spatial zoning
Vessel restrictions
Catch limits
Spatial closures
Temporal closures
Gear restrictions
Possession limits
Catch
257 t Recreational: 9 t (2010)3
Fishing tour operators: 1.5 t
Unknown
Active commercial vessels 14
Effects of fishing on the marine environment King Threadfin are mainly caught using commercial gill nets. This type of gear has almost no impact on benthic habitats and is quite selective in its harvest. Reported bycatch represents less than 1 per cent of the total catch4 and typically consists of Queenfish, unwanted shark species and catfish. Commercial gill nets interact with threatened, endangered and protected species (TEPS), with the most common TEPS interactions involving Saltwater Crocodiles (<50 interactions per year). This gear type is unlikely to impact on Saltwater Crocodile populations given that this species has reached carrying capacity in most catchments5. Other TEPS interactions include Largetooth Sawfish, Green Sawfish, turtles and dugongs, but these are less common (<10 per cent). The low bycatch and interaction levels with TEPS are supported by observer data collected on board commercial vessels.

STATUS OF KEY NORTHERN TERRITORY FISH STOCKS REPORT 2015 KING THREADFIN
65
Environmental effects on King Threadfin The duration, magnitude and timing of the wet season has been shown to influence the catchability of King Threadfin6,7 as this species’ main habitat are coastal inshore waters.
References 1. Welch, D. J., Robins, J., Saunders, T. M., Courtney, T., Harry, A., Lawson, E., Moore, B. R., Tobin,
A., Turnbull, C., Vance, D, and Williams, A. J. (2014). Implications of climate change impacts on fisheries resources of northern Australia. Part 2: Species profiles. Final Report to the Fisheries Research and Development Corporation, Project 2010/565, James Cook University, Townsville.
2. Moore, B. R., Welch, D. J. and Simpfendorfer, C. A. (2011). Spatial patterns in the demography of a large estuarine teleost: king threadfin, Polydactylus macrochir. Marine and Freshwater Research, 62: 937−951.
3. West, L. D., Lyle, J. M., Matthews, S. R., Stark, K. E. and Steffe, A. S. (2012). Survey of Recreational Fishing in the Northern Territory, 2009-10. Fishery Report 109, Northern Territory Department of Primary Industry and Fisheries, Darwin.
4. Halliday, I. A., Ley, J. A., Tobin, A., Garrett, R., Gribble, N. A. and Mayer, D. G. (2001). The effects of net fishing: addressing biodiversity and bycatch issues in Queensland inshore waters. Final Report to the Fisheries Research and Development Corporation, Project 97/206, Queensland Department of Primary Industries.
5. Fukuda, Y. P., Webb, G., Manolis, C., Delaney, R., Letnic, M., Lidner, G. and Whitehead, P. (2011). Recovery of Saltwater Crocodiles following unregulated hunting in tidal rivers of the Northern Territory, Australia. The Journal of Wildlife Management, 75(6): 1253-1266.
6. Halliday, I. A., Saunders, T., Sellin, M., Allsop, Q., Robins, J. B., McLennan, M. and Kurnoth, P. (2012). Flow impacts on estuarine finfish fisheries of the Gulf of Carpentaria. Final Report to the Fisheries Research and Development Corporation, Project 2007/002, Queensland Department of Agriculture, Fisheries and Forestry.
7. Robins, J. B., Halliday, I. A., Staunton-Smith, J., Mayer, D. G. and Sellin, M. J. (2005). Freshwater flow requirements of estuarine fisheries in tropical Australia: a review of the state of knowledge and application of a suggested approach. Marine & Freshwater Research, 56: 343–360.

FISHERY REPORT NO. 118 SPANISH MACKEREL
66
SPANISH MACKEREL SCOMBEROMORUS COMMERSON
Graham Schultz and Hock Lee
Table 1. Stock status determination for Spanish Mackerel
Stock Northern Territory Spanish Mackerel
Fisheries SMF, DF, ONLF
Stock status Sustainable
Indicators CPUE, stock reduction analysis, egg production
SMF = Spanish Mackerel Fishery; DF = Demersal Fishery; ONLF = Offshore Net and Line Fishery; CPUE = Catch per unit effort
Stock structure Spanish Mackerel (Scomberomorus commerson) are a widespread Indo-Pacific species found from the Red Sea to Southeast Asia, north to Japan and south to Australia. In Australian waters, they are distributed from Geographe Bay in Western Australia, around northern and eastern Australia, to St Helens in Tasmania. Within this geographic distribution, this species ranges from shallow coastal waters out to the edge of the continental shelf (Figure 1). Genetic data indicates that there are three biological stocks of Spanish Mackerel across northern Australia1; however, evidence from otolith microchemistry, parasite analysis and limited adult movement (at scales greater than 100 km) indicates that there are likely to be a number of smaller biological stocks with limited interaction1–3. Although the Northern Territory (NT) is likely to have multiple biological stocks within its boundaries, given the difficulties in obtaining biological information to assess each stock individually, status is reported at the NT-wide level. This assessment is based on the stocks that are subject to the highest harvest rates and whose status is assumed to be representative of the highest level of exploitation that occurs on any stock within the NT.
Stock status Commercial catches and catch rates of Spanish Mackerel gradually increased from 1986 to 2000; thereafter, they remained relatively stable at an average catch of ~350 tonnes (t) per annum and catch rate of 300 kg per day (Figures 2 and 3). An assessment of this stock, using a stochastic Stock Reduction Analysis model4 and including data up to 2015, indicated that the stock declined substantially as a result of the high Taiwanese catches in the 1970s and 1980s. The cessation of foreign fishing and more stringent management of the domestic fishery helped the stock to recover, with model outputs estimating biomass at 72 per cent of unfished levels in 2015. Despite the decline in catch rate during 2015, current biomass levels are well within sustainable limits and suggest that this stock is not considered to be recruitment overfished and the current level of fishing mortality is unlikely to cause the stock to become recruitment overfished.
On the basis of the evidence provided above, the NT Spanish Mackerel stock is classified as a sustainable stock.

STATUS OF KEY NORTHERN TERRITORY FISH STOCKS REPORT 2015 SPANISH MACKEREL
67
Table 2. Spanish Mackerel biology5, 6
Longevity and maximum size 26 years; 240 cm FL
Maturity (50 per cent) 80 cm FL (~2years)
FL = Fork length
Figure 1. Distribution of reported commercial catch of Spanish Mackerel in Northern Territory waters during 2015

FISHERY REPORT NO. 118 SPANISH MACKEREL
68
Figure 2. Catch of Spanish Mackerel in Northern Territory waters by fishing sector from 1983 to 2015
Figure 3. Commercial catch per unit effort (CPUE; kg per day) of Spanish Mackerel in Northern Territory waters from 1983 to 2015
0
100
200
300
400
500
1983 1987 1991 1995 1999 2003 2007 2011 2015
Catc
h (t
onne
s)
Commercial Recreational Fishing tour operators Indigenous
0
100
200
300
400
500
1983 1987 1991 1995 1999 2003 2007 2011 2015
CPU
E (k
g pe
r day
)
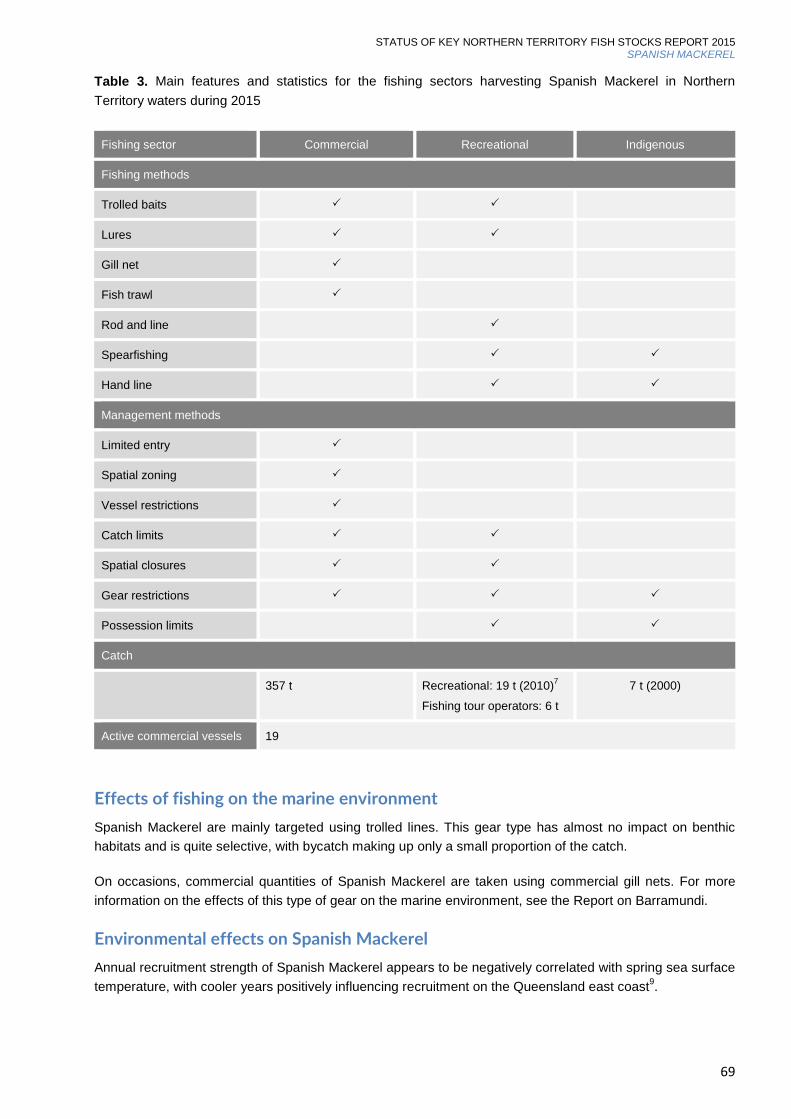
STATUS OF KEY NORTHERN TERRITORY FISH STOCKS REPORT 2015 SPANISH MACKEREL
69
Table 3. Main features and statistics for the fishing sectors harvesting Spanish Mackerel in Northern Territory waters during 2015
Fishing sector Commercial Recreational Indigenous
Fishing methods
Trolled baits
Lures
Gill net
Fish trawl
Rod and line
Spearfishing
Hand line
Management methods
Limited entry
Spatial zoning
Vessel restrictions
Catch limits
Spatial closures
Gear restrictions
Possession limits
Catch
357 t Recreational: 19 t (2010)7
Fishing tour operators: 6 t
7 t (2000)
Active commercial vessels 19
Effects of fishing on the marine environment Spanish Mackerel are mainly targeted using trolled lines. This gear type has almost no impact on benthic habitats and is quite selective, with bycatch making up only a small proportion of the catch.
On occasions, commercial quantities of Spanish Mackerel are taken using commercial gill nets. For more information on the effects of this type of gear on the marine environment, see the Report on Barramundi.
Environmental effects on Spanish Mackerel Annual recruitment strength of Spanish Mackerel appears to be negatively correlated with spring sea surface temperature, with cooler years positively influencing recruitment on the Queensland east coast9.

FISHERY REPORT NO. 118 SPANISH MACKEREL
70
References 1. Moore, B. R., Buckworth, R. C., Moss, H. and Lester. R. J. G. (2003). Stock discrimination and
movements of narrow-barred Spanish Mackerel across northern Australia as indicated by parasites. Journal of Fish Biology, 63: 765–779.
2. Buckworth, R., Newman, S., Ovenden, J., Lester, R. and McPherson, G. (2007). The stock structure of northern and Western Australian Spanish Mackerel. Final Report to the Fisheries Research Development Corporation, Project 1998/159, Northern Territory Department of Primary Industry and Fisheries, Darwin.
3. Lester, R. J. G., Thompson, C., Moss, H. and Barker, S. C. (2001). Movement and stock structure of narrow-barred Spanish Mackerel as indicated by parasites. Journal of Fish Biology, 59: 833–842.
4. Grubert, M. A., Saunders, T. M., Martin, J. M., Lee, H. S. and Walters, C. J. (2013). Stock Assessments of Selected Northern Territory Fishes. Fishery Report No. 110, Northern Territory Department of Primary Industry and Fisheries, Darwin.
5. McPherson, G. R. (1992). Age and growth of the narrow-barred Spanish Mackerel (Scomberomorus commerson Lacepede, 1800) in north-eastern Queensland waters. Australian Journal of Marine and Freshwater Research, 43: 1269–1282.
6. McPherson, G. R. (1993). Reproductive biology of the narrow-barred Spanish Mackerel (Scomberomorus commerson Lacepede, 1800) in Queensland waters. Asian Fisheries Science, 6: 169–182.
7. West, L. D., Lyle, J. M., Matthews, S. R., Stark, K. E. and Steffe, A. S. (2012). Survey of Recreational Fishing in the Northern Territory, 2009-10. Fishery Report 109, Northern Territory Department of Primary Industry and Fisheries, Darwin.
8. Mounsey, R. P. and Ramm, D. C. (1991). Evaluation of a New Design of a Semi-demersal Trawl. Fishery Report No. 25, Northern Territory Department of Primary Industry and Fisheries, Darwin.
9. Welch, D. J., Robins, J., Saunders, T. M., Courtney, T., Harry, A., Lawson, E., Moore, B. R., Tobin, A., Turnbull, C., Vance, D. and Williams, A. J. (2014). Implications of climate change impacts on fisheries resources of northern Australia. Part 2: Species profiles. Final Report to the Fisheries Research and Development Corporation Project 2010/565, James Cook University, Townsville.

STATUS OF KEY NORTHERN TERRITORY FISH STOCKS REPORT 2015 GREY MACKEREL
71
GREY MACKEREL SCOMBEROMOROUS SEMIFASCIATUS
Grant Johnson
Table 1. Stock status determination for Grey Mackerel
Stock North-west Grey Mackerel Gulf of Carpentaria Grey Mackerel
Fisheries ONLF ONLF
Stock status Sustainable Sustainable
Indicators Catch, CPUE stock reduction analysis, harvest rate, fishing mortality
Catch, CPUE, stock reduction analysis, length and age frequencies, harvest rate, fishing mortality
ONLF = Offshore Net and Line Fishery; CPUE = Catch per unit effort
Stock structure Grey Mackerel (Scomberomorous semifasciatus) are found in southern Papua New Guinea and in northern Australia from Shark Bay, Western Australia to northern New South Wales. This species is common around coastal headlands and rocky reefs but is also caught offshore (Figure 1). There are at least five Grey Mackerel biological stocks across northern Australia, two of which reside in Northern Territory (NT) waters. By using multiple approaches (genetics, parasites, otolith stable isotopes and growth data) to identify and define these stocks, it was determined that within NT waters, there was one stock on the north-west coast and another in the Gulf of Carpentaria (GoC) 1-5.
Stock status
North-west Most (73 per cent) of the Grey Mackerel caught in the NT are taken from the north-west stock (Figure 2). An assessment of this stock, using a stochastic Stock Reduction Analysis model and including data up to 2011, indicated that the stock declined substantially as a result of the high Taiwanese catches in the 1970s and 1980s. The cessation of foreign fishing and more stringent management of the domestic fishery helped the stock to recover, with model outputs estimating biomass at 81 per cent of unfished levels in 2011, which are well within sustainability limits6. Supporting this assessment is the fact that catch per unit effort has increased over the last 10 years, while catches have remained relatively consistent (Figure 3). This suggest that this stock in the north-west is not considered to be recruitment overfished and the current level of fishing mortality is unlikely to cause the stock to become recruitment overfished.
On the basis of the evidence provided above, the north-west Grey Mackerel stock is classified as a sustainable stock.

FISHERY REPORT NO. 118 GREY MACKEREL
72
Gulf of Carpentaria (GoC) The management of the GoC stock is shared by Queensland and the NT through their respective fisheries joint authorities. Most of the GoC stock is commercially harvested in Queensland (average 80–95 per cent), where there has been a rising trend in commercial catch rates since targeted fishing began in the 1990s3. Commercial catches and catch rates in Queensland peaked in 2010 and 2012, respectively7. Although the catch rate in this state dropped in 2013 to 54 kg per 100 m of net, it was still above the previous 10-year average of 52 kg per 100 m net7.
Model outputs of the stochastic Stock Reduction Analysis model (that included data from both Queensland and the NT up to 2011) estimated the biomass of the GoC stock was at 74 per cent of the unfished biomass in 2011, which is well within sustainability limits6. The biomass of this stock is therefore not considered to be recruitment overfished. Since then, Queensland has reduced the total allowable effort by two-thirds in the offshore component of the net fishery and also reduced the capacity for boats to target Grey Mackerel in the inshore fishery8. This suggests that the current allowable level of fishing mortality is unlikely to cause the stock to become recruitment overfished.
On the basis of the evidence provided above, the GoC Grey Mackerel stock is classified as a sustainable stock.
Table 2. Grey Mackerel biology9
Longevity and Maximum size 12 years; 120 cm TL
Maturity (50 per cent) Males: 66 cm TL (1–2 years); females: 70 cm TL (2 years)
TL = Total length
Figure 1. Distribution of reported commercial catch of Grey Mackerel in Northern Territory waters during 2015

STATUS OF KEY NORTHERN TERRITORY FISH STOCKS REPORT 2015 GREY MACKEREL
73
Figure 2. Catch of Grey Mackerel in Northern Territory waters from 1985 to 2015
Figure 3. Commercial catch per unit effort (CPUE: kg per days fished) for the north-west Grey Mackerel stock from 1985 to 2015
0
200
400
600
800
1000
1983 1987 1991 1995 1999 2003 2007 2011 2015
Catc
h (t
onne
s)
North-west Gulf of Carpentaria
0
200
400
600
800
1000
1983 1987 1991 1995 1999 2003 2007 2011 2015
CPU
E (k
g pe
r day
s fis
hed)

FISHERY REPORT NO. 118 GREY MACKEREL
74
Table 3. Main features and statistics for the fishing sectors harvesting Grey Mackerel in Northern Territory waters during 2015
Fishing sector Commercial Recreational Indigenous
Fishing methods
Pelagic gill net
Rod and line
Spearfishing
Hand line
Management methods
Limited entry
Vessel restrictions
Spatial closures
Gear restrictions
Effort restrictions
Possession limits
Catch
408 t 10 t (2010)10 Unknown
Active commercial licences 8
Effects of fishing on the marine environment Grey Mackerel are mainly targeted by the Offshore Net and Line Fishery using pelagic gill nets. This gear type has almost no impact on benthic habitats and is quite selective, with bycatch making up only a small proportion of the catch11. This type of gill net does, however, interact with a range of threatened, endangered and protected species (TEPS) such as turtles and dolphins. Although the numbers of reported interactions in the commercial logbooks are low, the impact on the populations of TEPS is unknown but is assessed by the Fisheries Division of the Department of Primary Industry and Resources as a negligible to low risk.
Environmental effects on Grey Mackerel The duration, magnitude and timing of rainfall during the wet season is likely to impact on the overall biomass of species like Grey Mackerel that are dependent on estuaries and coastal bays waters for breeding and feeding12. A widespread reduction in the average rainfall in the GoC region in 2013 through to 2015 is thought to have affected the abundance of a number of commercially important species, including Grey Mackerel. This is because lower than average rainfall in the southern GoC results in decreased freshwater flows, turbidity and primary productivity in near shore areas, which are critical for larval survival and juvenile/adult feeding of Grey Mackerel. A link has been established for other tropical species, such as Barramundi12,13 between higher levels of recruitment (and subsequent harvest levels) with higher than average rainfall during the wet season.

STATUS OF KEY NORTHERN TERRITORY FISH STOCKS REPORT 2015 GREY MACKEREL
75
References 1. Welch, D., Buckworth, R., Ovenden, J., Newman, S., Broderick, D., Lester, R., Ballagh, A., Stapley,
J., Charters, R. and Gribble, N. (2009). Determination of management units for Grey Mackerel fisheries in northern Australia. Final Report to the Fisheries Research and Development Corporation, Project 2005/010. Fishing and Fisheries Research Centre Technical Report No. 4. Fishing and Fisheries Research Centre, James Cook University, Townsville.
2. Welch, D., Newman, S., Buckworth, R., Ovenden, J., Broderick, D., Lester, R., Gribble, N., Ballagh, A., Charters, R., Stapley, J., Street, R., Garrett, R. and Begg, G. (2015). Integrating different approaches in the definition of biological stocks: a northern Australian multi-jurisdictional fisheries example using grey mackerel. Marine Policy, 55: 73-80.
3. Broderick, D., Ovenden, J., Buckworth, R., Newman, S., Lester, R. and Welch, D. (2011). Genetic population structure of grey mackerel Scomberomorus semifasciatus in northern Australia. Journal of Fish Biology, 79: 633-661.
4. Newman, S., Wright, I., Rome, B., Mackie, M., Lewis, P., Buckworth, R., Ballagh, A., Garrett, R., Stapley, J., Broderick, D., Ovenden, J. and Welch, D. (2010). Stock structure of grey mackerel, Scomberomorus semifasciatus (Pisces: Scombridae) across northern Australia, based on otolith isotope chemistry. Environmental Biology of Fishes, 89: 357-367.
5. Charters, R., Lester, R., Buckworth, R., Newman, S., Ovenden, J., Broderick, D., Kravchuk, O., Ballagh, A. and Welch, D. (2010). The stock structure of grey mackerel Scomberomorus semifasciatus in Australia as inferred from its parasite fauna. Fisheries Research, 101: 94-99.
6. Grubert, M. A., Saunders, T. M., Martin, J. M., Lee, H. S. and Walters, C. J. (2013). Stock Assessments of Selected Northern Territory Fishes. Fishery Report No. 110, Northern Territory Department of Primary Industry and Fisheries, Darwin.
7. Lemos, R. T., Wang, Y-G, O'Neill, M. F., Leigh, G. and Helmke, S. (2014). East Queensland Grey Mackerel Stock Assessment. Queensland Department of Agriculture, Fisheries and Forestry.
8. Department of Agriculture, Fisheries and Forestry (2014). Queensland Stock Status Assessment Workshop 2014, 5-6 June 2014. Queensland Department of Agriculture, Fisheries and Forestry, Brisbane.
9. Cameron, D. and Begg, G. (2002). Fisheries biology and interaction in the northern Australian small mackerel fishery. Final Report to the Fisheries Research and Development Corporation, Projects 92/144 & 92/144.02, Department of Primary Industries, Queensland.
10. West, L. D., Lyle, J. M., Matthews, S. R. and Stark, K. E. (2012). A survey of recreational fishing in the Northern Territory, 2009–10, Fishery Report No. 109, Northern Territory Department of Resources, Darwin.
11. Halliday, I. A., Ley, J. A., Tobin, A., Garrett, R., Gribble, N. A. and Mayer, D. G. (2001). The effects of net fishing: addressing biodiversity and bycatch issues in Queensland inshore waters. Final Report to the Fisheries Research and Development Corporation, Project 97/206, Department of Primary Industries, Queensland.
12. Williams, L. E. (2002). Queensland's Fisheries Resources - Current Condition and Recent Trends 1988 - 2000. Department of Primary Industries, Queensland.
13. Robins, J. B., Halliday, I. A., Staunton-Smith, J., Mayer, D. G. and Sellin, M. J. (2005). Freshwater flow requirements of estuarine fisheries in tropical Australia: a review of the state of knowledge and application of a suggested approach. Marine & Freshwater Research, 56: 343–360.

FISHERY REPORT NO. 118 CRIMSON SNAPPER
76
CRIMSON SNAPPER LUTJANUS ERYTHROPTERUS
Julie Martin
Table 1. Stock status determination for Crimson Snapper
Stock Northern Territory Crimson Snapper
Fisheries CLF, DF, TRF
Stock status Sustainable
Indicators Catch, CPUE, stock reduction analysis
CLF = Coastal Line Fishery; DF = Demersal Fishery; TRF = Timor Reef Fishery; CPUE = Catch per unit effort
Stock Structure Crimson Snapper (Lutjanus erythropterus) is a widespread Indo-Pacific species, which is found throughout tropical Australian waters. The species occurs over a wide depth range, from coastal to offshore areas and is fished in waters up to 150 m deep (Figure 1). Genetic studies indicate that within Northern Territory (NT) waters (Timor Sea, Arafura Sea and the Gulf of Carpentaria) the species is comprised of one biological stock1.
Stock status The NT Government manages the commercial harvest of Saddletail Snapper and Crimson Snapper together as ‘red snappers’, using a combined total allowable commercial catch of 3800 tonnes (t).
Crimson Snapper has averaged 22 per cent of the annual red snapper catch over the last decade, with a commercial catch of 684 t in 2015 (Figure 2). This is an increase of 100 per cent of the 2014 catch. Crimson Snapper is assessed on the basis of the status of the main species, Saddletail Snapper, as an indicator for the combined group. Saddletail Snapper was last assessed in 2013 using a stochastic Stock Reduction Analysis model2. The outputs of this model estimated egg production to be around 80 per cent of unfished levels, well above conventional fishery targets2. This stock is therefore not considered to be recruitment overfished. The model outputs also indicated that the current harvest rate of red snapper is below that required to achieve maximum sustainable yield. This level of fishing mortality is unlikely to cause the stock to become recruitment overfished.

STATUS OF KEY NORTHERN TERRITORY FISH STOCKS REPORT 2015 CRIMSON SNAPPER
77
On the basis of the evidence provided above, the NT Crimson Snapper stock is classified as a sustainable stock.
Table 2. Crimson Snapper biology3,4
Longevity and maximum size 42 years; 47 cm SL
Maturity (50 per cent) Males: 27–28 cm SL; females: 35–37 cm SL
SL = Standard length
Figure 1. Distribution of reported commercial catch of Crimson Snapper in Northern Territory waters during 2015

FISHERY REPORT NO. 118 CRIMSON SNAPPER
78
*Recreational catch is not included because Crimson Snapper and Saddletail Snapper have been combined in catch statistics
Figure 2. Catch of Crimson Snapper in Northern Territory waters by fishing sector from 2000 to 2015*
0
200
400
600
800
2000 2002 2004 2006 2008 2010 2012 2014
Catc
h (t
onne
s)
Commercial Fishing tour operators

STATUS OF KEY NORTHERN TERRITORY FISH STOCKS REPORT 2015 CRIMSON SNAPPER
79
Table 3. Main features and statistics for the fishing sectors harvesting Crimson Snapper in Northern Territory waters during 2015
Fishing sector Commercial Recreationala Indigenous
Fishing methods
Rod and line
Vertical line
Dropline
Fish trap
Fish trawl
Management methods
Spatial zoning
Spatial closures
Total allowable catch
Gear restrictions
Possession limits
Catch
684 t
Recreational: 55 t (2010)b
Fishing tour operators: 0.4 t
Unknown
Active commercial licences 19
a Recreational includes the fishing tour operator sector. b Includes the recreational catch of both Crimson Snapper and Saddletail Snapper, which were combined during the 2010 recreational fishing survey5.
Effects of fishing on the marine environment Crimson Snapper are mainly targeted using fish traps and trawl gear. The impacts of fish traps on the benthic habitat are limited to the effects of fish traps on the seabed. To avoid excessive interaction with the seabed, fish traps are set separately and not attached to one another. In 2015, fish traps covered less than 0.0001 per cent of the total fishery area. “Ghost fishing” (i.e. the continued fishing by lost gear) of fish traps is not considered to be significant in terms of either its impact or occurrence. Underwater video observation of fish traps during commercial fishing operations in northern Australia has shown the unimpeded entry and exit of fish from fish traps of the same design as used in the fisheries targeting Crimson Snapper. There are few bycatch issues associated with using fish traps as most bycatch species are released alive.
In the Demersal Fishery, the impact of trawl gear is limited to two trawl zones (Zones A & B). In 2015, the area trawled covered 1.59 per cent of these zones. Trawl gear is also currently being trialled in the Timor Reef Fishery, with trawling covering 2.3 per cent of the fishery area in 2015.
Management objectives for trawl gear specify that bycatch must remain below 35 per cent of the total catch. In 2015, the average bycatch recorded by observers was 20 per cent of the total trawl catch in the Demersal

FISHERY REPORT NO. 118 CRIMSON SNAPPER
80
Fishery and 26 per cent of the total trawl catch in the Timor Reef Fishery. Non-retained species consisted mainly of trevally, scads and small sharks. The catch of larger animals, including rays and large sharks, has significantly declined since the introduction of bycatch reduction devices (BRDs) in 2006. Interactions with threatened, endangered and protected species, including sea snakes, dolphins and turtles has also declined significantly since the introduction of BRDs. Six sea snakes, one Grey Nurse shark (released alive) and one Narrow Sawfish (released alive) were recorded by observers during 2015. Given the area of distribution and estimated population size of these protected species, the impact of fish trawl gear on the stocks of these protected species is likely to be minimal.
Environmental effects on Crimson Snapper Climate change and variability have the potential to impact on fish stocks in a range of ways, including influencing their geographic distribution (for example, latitudinal shifts in distribution). However, it is unclear how climate change may affect risks to the sustainability of this species. Slow-growing and long-lived species, such as Crimson Snapper, are less likely to be affected by short duration environmental changes (of one or a few years), with adult stocks comprising fish recruited over many years.
Changes in ocean chemistry, such as ocean acidification, have the potential to impact on the replenishment rates of fish populations by affecting larval survival7 and also individual growth rates and spawning output8.
References 1. Salini, J., Ovenden, J., Street, R., Pendrey, R., Haryantis, and Ngurah. (2006). Genetic population
structure of red snappers (Lutjanus malabaricus Bloch & Schneider, 1801 and Lutjanus erythropterus Bloch, 1790) in central and eastern Indonesia and northern Australia. Journal of Fish Biology, 68(suppl. B): 217–234.
2. Martin, J. M. (2013). Stock assessment of Saddletail Snapper (Lutjanus malabaricus) in the Northern Territory Demersal and Timor Reef Fisheries. Unpublished Report, Northern Territory Department of Primary Industry and Fisheries, Darwin.
3. Fry, G. and Milton, D. A. (2009). Age, growth and mortality estimates for populations of red snappers Lutjanus erythropterus and L. malabaricus from northern Australia and eastern Indonesia. Fisheries Science, 75: 1219–1229.
4. Fry, G., Milton, D. A., Van Der Velde, T., Stobutzki, I., Andamari, R. and Badrudin, B. S. (2009). Reproductive dynamics and nursery habitat preferences of two commercially important Indo-Pacific red snappers Lutjanus erythropterus and L. malabaricus. Fisheries Science, 75: 145–158. doi:10.1007/s12562-008-0034-4.
5. West, L. D., Lyle, J. M., Matthews, S. R., Stark, K. E. and Steffe, A. S. (2012). Survey of Recreational Fishing in the Northern Territory, 2009-10. Fishery Report No. 109, Northern Territory Department of Primary Industry and Fisheries, Darwin.
6. Henry, G. W. and Lyle, J. M. (2003). The National recreational and indigenous fishing survey. Fisheries Research and Development Corporation Project 99/158, Australian Government Department of Agriculture, Fisheries and Forestry, Canberra. http://eprints.utas.edu.au/2526/1/Henry_Lyle_Nationalsurvey.pdf.
7. Hughes, T. (2010). Marine and Tropical Sciences Research Facility Milestone Report for Program 2.5i.3. The Australian Government Department of the Environment, Water, Heritage and the Arts, Canberra. www.rrrc.org.au/publications/downloads/25i3-JCU-Hughes-T-2010-March-Milestone-Report.pdf.
8. Johnson, J. E. and Welch, D. J. (2010). Marine fisheries management in a changing climate: a review of vulnerability and future options. Reviews in Fisheries Science, 18(1): 106–124.

STATUS OF KEY NORTHERN TERRITORY FISH STOCKS REPORT 2015 GOLDBAND SNAPPER
81
GOLDBAND SNAPPER PRISTIPOMOIDES MULTIDENS
Julie Martin
Table 1. Stock status determination for Goldband Snapper
Stock Northern Territory Goldband Snapper
Fisheries DF, TRF
Stock status Sustainable
Indicators Catch, CPUE, stock reduction analysis
DF = Demersal Fishery; TRF = Timor Reef Fishery; CPUE = Catch per unit effort
Stock structure Goldband Snapper (Pristipomoides multidens) are widely distributed throughout the Indo-Pacific region from Samoa to the Red Sea. In Australia, they occur from Cape Pasley, Western Australia across the north to Moruya, New South Wales. They occur over a wide depth range, but are commercially fished between 80 to 150 m in depth (Figure 1). Analysis of otolith stable isotopes indicates that the Northern Territory (NT) has separate biological stocks within this distribution1,2.
Stock status The total allowable commercial catch for Goldband Snapper is 1300 tonnes (t); 900 t in the Timor Reef Fishery and 400 t in the Demersal Fishery.
In 2015, the total commercial catch of Goldband Snapper was 501 t (Figure 2). The status of Goldband Snapper from the Arafura and Timor seas was assessed in 2011 and 2013 using a stochastic Stock Reduction Analysis model3,4. The outputs of this model estimated egg production to be around 65 per cent of unfished levels, well above conventional target levels. This stock is therefore not considered to be recruitment overfished. The model outputs also indicated that the current level of fishing mortality was below that required to achieve maximum sustainable yield and is unlikely to cause the biological stock to become recruitment overfished.
On the basis of the evidence provided above, the NT Goldband Snapper stock is classified as a sustainable stock.

FISHERY REPORT NO. 118 GOLDBAND SNAPPER
82
Table 2. Goldband Snapper biology5
Longevity and maximum size 30 years; 70 cm FL; 81 cm TL
Maturity (50 per cent) 47 cm FL; 55 cm TL; 8 years
FL = Fork length; TL = Total length
Figure 1. Distribution of reported commercial catch of Goldband Snapper in Northern Territory waters during 2015
Figure 2. Catch of Goldband Snapper in Northern Territory waters by fishing sector from 2000 to 2015
0
200
400
600
800
2000 2002 2004 2006 2008 2010 2012 2014
Catc
h (t
onne
s)
Commercial Fishing tour operators Recreational

STATUS OF KEY NORTHERN TERRITORY FISH STOCKS REPORT 2015 GOLDBAND SNAPPER
83
Table 3. Main features and statistics for the fishing sectors harvesting Goldband Snapper in Northern Territory waters during 2015
Fishing sector Commercial Recreationala Indigenous
Fishing methods
Rod and line
Drop line b
Fish trap
Fish trawl
Management methods
Spatial zoning
Spatial closures
Total allowable catch
Gear restrictions
Possession limits
Catch
501 t
Recreational: 0.5 t (20106)
Fishing tour operators: 0.5 t
Negligible7
Active commercial vessels 16
a Recreational includes the fishing tour operator (FTO) sector. b Dropline fishing constituted less than 1% of the total commercial catch.
Effects of fishing on the marine environment Goldband Snapper are mainly targeted using fish traps, drop lines and trawl gear. The impacts of fish traps and drop lines on the benthic habitat are limited to the effects of drop line weights and fish traps on the seabed. To avoid excessive interaction with the seabed, fish traps are set separately and not attached to one another. In 2015, fish traps covered less than 0.0001 per cent of the total fishery area. “Ghost fishing” (i.e. the continued fishing by lost gear) of fish traps or drop lines is not considered to be significant in terms of either its impact or occurrence. Underwater video observation of fish traps during commercial fishing operations in northern Australia has shown the unimpeded entry and exit of fish from fish traps of the same design as used in the fisheries targeting Goldband Snapper. There are few bycatch issues associated with using fish traps as most bycatch species are released alive.
The impact of trawl gear in the Demersal Fishery is limited to two trawl zones (Zones A and B). In 2015, the area trawled covered 1.59 per cent of these zones. Trawl gear is also currently being trialled in the Timor Reef Fishery, with trawling covering 2.3 per cent of the fishery area in 2015.
Management objectives for trawl gear specify that bycatch must remain below 35 per cent of the total catch. In 2015, the average bycatch recorded by observers was 20 per cent of the total trawl catch in the Demersal Fishery and 26 per cent of the total trawl catch in the Timor Reef Fishery. Non-retained species consisted

FISHERY REPORT NO. 118 GOLDBAND SNAPPER
84
mainly of trevally, scads and small sharks. The catch of larger animals, including rays and large sharks, has significantly declined since the introduction of bycatch reduction devices (BRDs) in 2006. Interactions with threatened, endangered and protected species (TEPS), including sea snakes, dolphins and turtles have also declined significantly since the introduction of BRDs. Six sea snakes, one Grey Nurse shark (released alive) and a Narrow Sawfish (released alive) were recorded by observers during 2015. Given the area of distribution and estimated population size of these protected species, the impact of fish trawl gear on the stocks of these protected species is likely to be minimal.
Environmental effects on Goldband Snapper Climate change and variability have the potential to impact on fish stocks in a range of ways, including influencing their geographic distribution (for example, latitudinal shifts in distribution). However, it is unclear how climate change may affect risks to the sustainability of this species. Slow-growing and long-lived species, such as Goldband Snapper, are less likely to be affected by short duration environmental changes (of one or a few years), with adult stocks comprising fish recruited over many years. Changes in ocean chemistry, such as ocean acidification, have the potential to impact on the replenishment rates of fish populations by affecting larval survival8, and also individual growth rates and spawning output9.
References 1. Newman, S. J., Steckis, R. A., Edmonds, J. S. and Lloyd, J. (2000). Stock structure of the goldband
snapper, Pristipomoides multidens (Pisces: Lutjanidae) from the waters of northern and western Australia by stable isotope ratio analysis of sagittal otolith carbonate. Marine Ecology Progress Series, 198: 239–247.
2. Ovenden, J. R., Lloyd, J., Newman, S. J., Keenan, C. P. and Slater, L. S. (2002). Spatial genetic subdivision between northern Australian and South-East Asian populations of Pristipomoides multidens: a tropical marine reef fish species. Fisheries Research, 59(1–2): 57–69.
3. Grubert, M. A., Saunders, T. M., Martin, J. M., Lee, H. S. and Walters, C. J. (2013). Stock Assessments of Selected Northern Territory Fishes. Fishery Report No. 110, Northern Territory Department of Primary Industry and Fisheries, Darwin.
4. Martin, J. M. (2013). Stock assessment of Goldband Snapper (Pristipomoides multidens) in the Northern Territory Demersal and Timor Reef Fisheries. Unpublished Report, Northern Territory Department of Primary Industry and Fisheries, Darwin.
5. Newman, S. J. and Dunk, I. J. (2003). Age validation, growth, mortality and additional population parameters of the goldband snapper (Pristipomoides multidens) off the Kimberley coast of north-western Australia. Fishery Bulletin, 101(1): 116–128.
6. West, L. D., Lyle, J. M., Matthews, S. R., Stark, K. E. and Steffe, A. S. (2012). Survey of Recreational Fishing in the Northern Territory, 2009-10. Fishery Report 109, Northern Territory Department of Primary Industry and Fisheries, Darwin.
7. Henry, G. W. and Lyle, J. M. (2003). The national recreational and Indigenous fishing survey, Final report to the Fisheries Research Development Corporation, Project 99/158, Australian Government Department of Agriculture, Fisheries and Forestry, Canberra. http://eprints.utas.edu.au/ 2526/1/Henry_Lyle_Nationalsurvey.pdf.
8. Hughes, T. (2010). Marine and Tropical Sciences Research Facility Milestone Report for Program 2.5i.3. The Australian Government Department of the Environment, Water, Heritage and the Arts, Canberra. www.rrrc.org.au/publications/downloads/25i3-JCU-Hughes-T-2010-March-Milestone-Report.pdf.
9. Johnson, J. E. and Welch, D. J. (2010). Marine fisheries management in a changing climate: a review of vulnerability and future options. Reviews in Fisheries Science, 18(1): 106–124.

STATUS OF KEY NORTHERN TERRITORY FISH STOCKS REPORT 2015 GOLDEN SNAPPER
85
GOLDEN SNAPPER LUTJANUS JOHNII
Lianos Triantafillos
Table 1. Stock status determination for Golden Snapper
Stock Northern Territory Golden Snapper
Fisheries CLF, DF, FTO, TRF
Stock status Overfished
Indicators Catch, stock reduction analysis
CLF = Coastal Line Fishery; DF = Demersal Fishery; FTO = Fishing tour operators; TRF = Timor Reef Fishery
Stock Structure Golden Snapper (Lutjanus johnii) are a widespread Indo-Pacific species found from the Pilbara region in Western Australia across northern Australia to the east coast of Queensland. Juveniles form schools that inhabit estuaries whereas adults can be encountered on coastal and offshore reefs. The stock structure for this species has been investigated to the full extent of its Australian range from Western Australia to Queensland, with results indicating that separate stocks exist in the waters of the Northern Territory (NT) at the scale of tens of kilometres1. Given the difficulties in obtaining biological information to assess each stock individually, the status is reported at the NT-wide level.
Stock status The most recent estimates of biomass and egg production of Golden Snapper in NT waters are 18 per cent and 10 per cent of unfished levels, respectively2. These estimates were derived from an update of the 2011 Stochastic Stock Reduction Analysis model3 and included data up to 2014. They are likely to incorporate several stocks given the new information on the stock structure of this species1. However, as the model is driven by the stocks that are subject to the highest harvest rates, stock status at the NT-wide level can be assumed to be representative of the highest level of exploitation that occurs on any stock.
The immediate area of concern is in waters around Darwin, where most of the fishing pressure occurs and where catch and catch rate have substantially declined over the last 10 years2. The fisheries accessing these exploited stocks are those that operate inshore, including the Coastal Line Fishery, the Barramundi Fishery,

FISHERY REPORT NO. 118 GOLDEN SNAPPER
86
fishing tour operators and recreational fishers. Golden Snapper have also been shown to be highly susceptible to barotrauma when caught in waters deeper than 15 m4.
Management methods, in the form of catch limits and spatial closures, were implemented in 2015 to reduce harvest by the recommended 50 per cent to allow for the biomass of Golden Snapper stocks found in waters around Darwin to recover3. This level of fishing pressure is expected to allow these stocks to rebuild; however, measurable improvements in biomass are yet to be detected. Golden Snapper are, therefore, considered to be recruitment overfished in the waters around Darwin.
Stocks of Golden Snapper in waters off Arnhem Land, the Gulf of Carpentaria and distantly offshore from population centres in the NT1 are not considered overfished because they have been subject to low fishing pressure.
Future status reports on this species are likely to include a number of different stocks, with a variety of status classifications within the NT.
On the basis of the evidence provided above, the NT Golden Snapper stock is classified as an overfished stock.
Table 2. Golden Snapper biology4-6
Longevity and maximum size 30 years; 99 cm TL; 15 kg
Maturity (50 per cent) Males: 52 cm TL (7 years); females: 56 cm TL (8 years)
TL = Total length
Figure 1. Distribution of reported commercial catch of Golden Snapper in Northern Territory waters during 2015

STATUS OF KEY NORTHERN TERRITORY FISH STOCKS REPORT 2015 GOLDEN SNAPPER
87
Figure 2. Catch of Golden Snapper in Northern Territory waters by fishing sector from 2000 to 2015
0
20
40
60
80
100
120
140
2000 2002 2004 2006 2008 2010 2012 2014
Catc
h (t
onne
s)
Commercial Fishing tour operators Recreational

FISHERY REPORT NO. 118 GOLDEN SNAPPER
88
Table 3. Main features and statistics for the fishing sectors harvesting Golden Snapper in Northern Territory waters during 2015
Fishing sector Commercial Recreational Indigenous
Fishing methods
Gill net
Rod and line
Fish trawl
Fish Trap
Hand line
Management methods
Spatial zoning
Limited entry
Gear restrictions
Spatial closures
Vessel restrictions
Catch limits
Possession limits
Catch
24.8 t Recreational: 72 t (2010)5
Fishing tour operators: 15 t Unknown
Active commercial vessels 40
Effects of fishing on the marine environment Golden Snapper are mainly targeted using hand lines and rods. Beyond the removal of target and a small proportion of bycatch species using these gear types, there is little evidence to suggest that they significantly impact on benthic or pelagic ecological communities.
On occasion, commercial quantities of Golden Snapper are taken using trawl gear. For more information on the effects of trawl gear on the marine environment, see the chapter on Saddletail Snapper.
Environmental effects on Golden Snapper The impact of environmental factors on Golden Snapper stocks is largely unknown; however, the juvenile and larval phases of this species inhabit estuaries and coastal bays, making these phases of their life cycle vulnerable to changes in ocean current strength and direction, rainfall, river flow, water temperature, salinity and pH4.

STATUS OF KEY NORTHERN TERRITORY FISH STOCKS REPORT 2015 GOLDEN SNAPPER
89
In relation to water temperature, Golden Snapper size and growth rates appear to vary with latitude with fish farther south showing larger body size and faster growth rates. Despite these differences, the age at maturity of Golden Snapper may remain relatively constant across different latitudes8.
References 1. Saunders, T. M., Welch, D., Barton, D., Crook, D., Dudgeon, C., Hearnden, M., Maher, S., Ovenden,
J., Taillebois, L. and Taylor, J. (2016). Optimising the management of tropical coastal reef fish through the development of Indigenous capability. Final Report to the Fisheries Research and Development Corporation, Project 2013/017, Northern Territory Department of Primary Industry and Fisheries, Darwin.
2. Northern Territory Government (2016). Fishery Status Reports 2015. Fishery Report No. 115, Northern Territory Department of Primary Industry and Fisheries, Darwin.
3. Grubert, M. A., Saunders, T. M., Martin, J. M., Lee, H. S. and Walters, C. J. (2013). Stock Assessments of Selected Northern Territory Fishes. Fishery Report No. 110, Northern Territory Department of Primary Industry and Fisheries, Darwin.
4. Welch, D. J., Robins, J., Saunders, T. M., Courtney, T., Harry, A., Lawson, E., Moore, B. R., Tobin, A., Turnbull, C., Vance, D. and Williams, A. J. (2014). Implications of climate change impacts on fisheries resources of northern Australia. Part 2: Species profiles. Final Report to the Fisheries Research and Development Corporation, Project 2010/565, James Cook University, Townsville.
5. Taylor, S., Webley, J. and McInnes, K. (2012). 2010 State-wide Recreational Fishing Survey. Queensland Department of Agriculture, Fisheries and Forestry, Brisbane.
6. Hay, T., Knuckey, I., Calogeras, C. and Errity, C. (2005). Population and Biology of the Golden Snapper. Fishery Report No. 21, Northern Territory Department of Primary Industry and Fisheries, Darwin.
7. Mounsey, R. P. and Ramm, D. C. (1991). Evaluation of a New Design of a Semi-demersal Trawl. Fishery Report No. 25, Northern Territory Department of Primary Industry and Fisheries, Darwin.
8. Cappo, M., Marriott, R. J. and Newman, S. J. (2013). James’s rule and causes and consequences of a latitudinal cline in the demography of John’s Snapper (Lutjanus johnii) in coastal waters of Australia. Fishery Bulletin, 111 (4): 309-324.

FISHERY REPORT NO. 118 SADDLETAIL SNAPPER
90
SADDLETAIL SNAPPER LUTJANUS MALABARICUS
Julie Martin
Table 1. Stock status determination for Saddletail Snapper
Stock Northern Territory Saddletail Snapper
Fisheries CLF, DF, TRF
Stock status Sustainable
Indicators Catch, CPUE, stock reduction analysis
CLF = Coastal Line Fishery; DF = Demersal Fishery; TRF = Timor Reef Fishery; CPUE = Catch per unit effort
Stock structure Saddletail Snapper (Lutjanus malabaricus) is a widespread Indo-Pacific species found throughout the Indo-Pacific region from Fiji to the Persian Gulf and tropical Australian waters. This species occurs over a wide depth range, from coastal to offshore areas and is fished in waters up to 150 m deep (Figure 1). Genetic studies indicate that within Northern Territory (NT) waters (including the Timor Sea, the Arafura Sea and the Gulf of Carpentaria) this species is comprised of one biological stock1, 2.
Stock status The Department of Primary Industry and Resources manages the commercial harvest of Saddletail Snapper and Crimson Snapper together as ‘red snappers’, using a combined total allowable commercial catch of 3800 tonnes (t).
Saddletail Snapper has averaged 78 per cent of the annual red snapper catch over the last decade, with a commercial catch of 1690 t in 2015 (Figure 2). The NT Saddletail Snapper stock was last assessed in 2013 using a stochastic Stock Reduction Analysis model3. The outputs of this model estimated egg production to be around 80 per cent of unfished levels, well above conventional target levels. This stock is, therefore, not considered to be recruitment overfished. The model outputs also indicated that the current harvest rate of Saddletail Snapper is below that required to achieve maximum sustainable yield. This level of fishing mortality is unlikely to cause the stock to become recruitment overfished.

STATUS OF KEY NORTHERN TERRITORY FISH STOCKS REPORT 2015 SADDLETAIL SNAPPER
91
On the basis of the evidence provided above, the NT Saddletail Snapper stock is classified as a sustainable stock.
Table 2. Saddletail Snapper biology4,5,6
Longevity and maximum size 33 years; 68 cm SL
Maturity (50 per cent) Males: 27-28 cm (9 years); females: 35–37 cm SL (9 years)
SL = Standard length
Figure 1. Distribution of reported commercial catch of Saddletail Snapper in Northern Territory waters during 2015

FISHERY REPORT NO. 118 SADDLETAIL SNAPPER
92
Figure 2. Catch of Saddletail Snapper in Northern Territory waters by fishing sector from 2000 to 2015
0
400
800
1200
1600
2000
2000 2002 2004 2006 2008 2010 2012 2014
Catc
h (t
onne
s)
Commercial Fishing tour operators

STATUS OF KEY NORTHERN TERRITORY FISH STOCKS REPORT 2015 SADDLETAIL SNAPPER
93
Table 3. Main features and statistics for the fishing sectors harvesting Saddletail Snapper in Northern Territory waters during 2015
Fishing sector Commercial Recreationala Indigenous
Fishing methods
Rod and line
Vertical line b
Dropline b
Fish trap
Fish trawl
Management methods
Spatial zoning
Spatial closures
Total allowable catch
Gear restrictions
Possession limits
Catch
1690 t
Recreational: 55 t (in 2010)c
Fishing tour operators: 11 t
Unknownd
Active commercial licences 21
a Recreational includes the fishing tour operator (FTO) sector. b Droplines and vertical lines together constituted less than 1% of the total commercial catch. c Includes the recreational catch of both Saddletail Snapper and Crimson Snapper, which were combined during the 2010 recreational fishing survey7. d Saddletail Snappers have been combined in the group “tropical snappers” during surveys8.
Effects of fishing on the marine environment Saddletail Snappers are mainly targeted using fish traps and trawl gear. The impacts of fish traps on the benthic habitat are limited to the effects of fish traps on the seabed. To avoid excessive interaction with the seabed, fish traps are set separately and not attached to one another. In 2015, fish traps covered less than 0.0001 per cent of the total fishery area. “Ghost fishing” (i.e. the continued fishing by lost gear) of fish traps is not considered to be significant in terms of either its impact or occurrence. Underwater video observation of fish traps during commercial fishing operations in northern Australia has shown the unimpeded entry and exit of fish from fish traps of the same design as used in the fisheries targeting Saddletail Snapper. There are few bycatch issues associated with using fish traps as most bycatch species are released alive.
In the Demersal Fishery, the impact of trawl gear is limited to two trawl zones (Zones A and B). In 2015, the area trawled covered 1.59 per cent of these zones. Trawl gear is also currently being trialled in the Timor Reef Fishery, with trawling covering 2.3 per cent of the fishery area in 2015.

FISHERY REPORT NO. 118 SADDLETAIL SNAPPER
94
Management objectives for trawl gear specify that bycatch must remain below 35 per cent of the total catch. In 2015, the average bycatch recorded by observers was 20 per cent of the total trawl catch in the Demersal Fishery and 26 per cent of the total trawl catch in the Timor Reef Fishery. Non-retained species consisted mainly of trevally, scads and small sharks. The catch of larger animals, including rays and large sharks, has significantly declined since the introduction of bycatch reduction devices (BRDs) in 2006. Interactions with threatened, endangered and protected species, including sea snakes, dolphins and turtles has also declined significantly since the introduction of BRDs. Six sea snakes, one Grey Nurse shark (released alive) and a Narrow Sawfish (released alive) were recorded by observers during 2015. Given the area of distribution and estimated population size of these protected species, the impact of fish trawl gear on the stocks of these protected species is likely to be minimal.
Environmental effects on Saddletail Snapper Climate change and variability have the potential to impact on fish stocks in a range of ways, including influencing their geographic distribution (for example, latitudinal shifts in distribution). However, it is unclear how climate change may affect risks to the sustainability of this species. Slow-growing and long-lived species, such as Saddletail Snappers, are less likely to be affected by short duration environmental changes (of one or a few years), with adult stocks comprising fish recruited over many years.
Changes in ocean chemistry, such as ocean acidification, have the potential to impact on the replenishment rates of fish populations by affecting larval survival9, individual growth rates and spawning output10.
References 1. Elliot, N. G. (1996). Allozyme and mitochondrial DNA analysis of the tropical saddle-tail sea perch,
Lutjanus malabaricus (Schneider), from Australian Waters. Marine and Freshwater Research, 47: 869–876.
2. Salini, J., Ovenden, J., Street, R., Pendrey, R., Haryantis and Ngurah (2006). Genetic population structure of red snappers (Lutjanus malabaricus Bloch and Schneider, 1801 and Lutjanus erythropterus Bloch, 1790) in central and eastern Indonesia and northern Australia. Journal of Fish Biology, 68(suppl. B): 217–234.
3. Martin, J. M. (2013). Stock Assessment of Saddletail Snapper (Lutjanus malabaricus) in the Northern Territory Demersal and Timor Reef Fisheries. Unpublished Report, Northern Territory Department of Primary Industry and Fisheries, Darwin.
4. Fry, G. and Milton, D. A. (2009). Age, growth and mortality estimates for populations of red snappers Lutjanus erythropterus and L. malabaricus from northern Australia and eastern Indonesia. Fisheries Science, 75: 1219–1229.
5. Fry, G., Milton, D. A., Van Der Velde, T., Stobutzki, I., Andamari, R., Badrudin and Sumiono, B. (2009). Reproductive dynamics and nursery habitat preferences of two commercially important Indo–Pacific red snappers Lutjanus erythropterus and L. malabaricus. Fisheries Science, 75: 145–158. doi:10.1007/s12562-008-0034-4.
6. O'Neill, M. F., Leigh, G. M., Martin, J. M., Newman, S. J., Chambers, M., Dichmont, C. M. and Buckworth, R. C. (2011). Sustaining productivity of tropical red snappers using new monitoring and reference points. Final Report to the Fisheries Research and Development Corporation, Project 2009/037, Queensland, Department of Employment, Economic Development and Innovation, Brisbane.
7. West, L. D., Lyle, J. M., Matthews, S. R., Stark, K. E. and Steffe, A. S. (2012). Survey of Recreational Fishing in the Northern Territory, 2009-10. Fishery Report No. 109, Northern Territory Department of Primary Industry and Fisheries, Darwin.

STATUS OF KEY NORTHERN TERRITORY FISH STOCKS REPORT 2015 SADDLETAIL SNAPPER
95
8. Henry, G. W. and Lyle, J. M. (2003). The National Recreational and Indigenous Fishing Survey. Fisheries Research and Development Corporation Project 99/158, Australian Government Department of Agriculture, Fisheries and Forestry, Canberra, http://eprints.utas.edu.au/2526/1/Henry_Lyle_Nationalsurvey.pdf.
9. Hughes, T. (2010). Marine and Tropical Sciences Research Facility Milestone Report for Program 2.5i.3. (Fishery Report No. 111, Northern Territory Department of Primary Industry and Fisheries, Darwin), Report to the Australian Government Department of the Environment, Water, Heritage and the Arts, Canberra, www.rrrc.org.au/publications/downloads/25i3-JCU-Hughes-T-2010-March-Milestone-Report.pdf.
10. Johnson, J. E. and Welch, D. J. (2010). Marine fisheries management in a changing climate: a review of vulnerability and future options. Reviews in Fisheries Science, 18(1): 106–124.

FISHERY REPORT NO. 118
96
GLOSSARY
A Aggregation. Group of fish that come together, often to feed or spawn.
Area closure. Closure of a given area/fishing ground, often for a defined period. Used as a tool in the management of a fishery.
Australian Fishing Zone (AFZ). The area extending seaward of coastal waters (that is, from 3 nautical miles from the territorial sea baseline) to the outer limits of the Exclusive Economic Zone (EEZ). In the case of external territories, such as Christmas Island, the AFZ extends from the territorial sea baseline to the outer limit of the EEZ. The AFZ is defined in the Fisheries Management Act 1991, which also specifies a number of ‘excepted waters’, notably in Antarctica and the Torres Strait, that are excluded from the AFZ.
B Benthic. Associated with the bottom of a water body.
Berried female. Female crustacean carrying eggs.
Biodiversity. Biological diversity; variety among living organisms, including genetic diversity, diversity within and between species, and diversity within ecosystems.
Biological reference point. Biomass or fishing mortality level used to guide management decisions. Can be either a ‘target reference point’ or a minimum biologically acceptable limit (‘limit reference point’).
Biological stock. Functionally discrete population that is largely distinct from other populations of the same species and can be regarded as a separate entity for management or assessment purposes.
Biomass. Total weight of a stock or a component of a stock.
Biomass proxy. A relative biomass level used in place of a quantitatively estimated biological reference point when the latter is not available. For example, the biomass that sustains maximum economic yield (BMEY).
Bioregion. ‘A region defined by common oceanographic characteristics in its marine environment, and by climate/rainfall characteristics in its inland river systems’.
Boat-days. A measure of fishing effort. Refers to the number of ‘days’ that a fishing licence holder is permitted to fish/has fished.
Bycatch. A species that is (a) returned to the sea either because it has no commercial value or because regulations preclude it being retained, or (b) is affected by interaction with the fishing gear, but does not reach the deck of the fishing vessel.
Bycatch reduction device (BRD). A device that allows fish and other animals to escape immediately after being taken in or with fishing gear.
Byproduct. A species taken incidentally in a fishery during fishing for another species. The species is retained for sale because it has some commercial value.

STATUS OF KEY NORTHERN TERRITORY FISH STOCKS REPORT 2015
97
C Carapace. The exoskeleton covering the upper surface of the body of a crustacean.
Catch per unit effort (CPUE). The number or weight of fish caught by a unit of fishing effort. Often used as a measure of fish abundance.
Catch rate. See Catch per unit effort.
Coastal waters. The waters extending seaward from the territorial sea baseline to a distance of 3 nautical miles. The states and the Northern Territory have jurisdiction over the coastal waters adjacent to them.
Codend. The closed end of a trawl net.
Cohort. Individuals of a stock born in the same spawning season.
Conservation dependent species. The Environment Protection and Biodiversity Conservation Act 1999 dictates that a native species is eligible to be included in the conservation dependent category at a particular time if, at that time, (a) the species is the focus of a specific conservation program the cessation of which would result in the species becoming vulnerable, endangered or critically endangered; or (b) the following subparagraphs are satisfied: (i) the species is a species of fish; (ii) the species is the focus of a plan of management that provides for management actions necessary to stop the decline of, and support the recovery of, the species so that its chances of long-term survival in nature are maximised; (iii) the plan of management is in force under a law of the Commonwealth or of a state or territory; and (iv) cessation of the plan of management would adversely affect the conservation status of the species.
Continental shelf. The continental shelf has been defined in a number of ways. It can mean the area of relatively shallow water that fringes a continent from the shoreline to the top of the continental slope. The top of the continental slope is often defined by the 200 m isobath. Continental shelf is also a defined maritime zone and comprises the continental shelf where it extends beyond the limit of the Exclusive Economic Zone to the limit of the continental margin. This area is also sometimes referred to as the ‘extended continental shelf’, and its limit is determined by the United Nations Commission on the Limits of the Continental Shelf.
Continental slope. Region of the outer edge of a continent between the relatively shallow continental shelf and the abyssal depths; often characterised by a relatively steep slope.
Cryptic mortality. Substantial mortality of a fish stock, occurring in part of the fishery, that cannot be detected in fishery data.
D Decision rules. Agreed responses that management must make under predefined circumstances regarding stock status. Also called ‘control rules’ or ‘harvest control rules’.
Demersal. Found on or near the benthic habitat (c.f. Pelagic).
Developmental fishery. A fishery managed under developmental fishery permits. Developmental fishing involves fishing in an area of Australian jurisdiction as specified in the permit; activities include (a) assessing the commercial viability of a fishery, and (b) assessing the commercial viability of kinds of fishing activities, vessels or equipment specified in the permit.
Discarding. Any part of the catch that is returned to the sea, whether dead or alive.
E Ecologically sustainable. ‘Use of natural resources within their capacity to sustain natural processes while maintaining the life-support systems of nature and ensuring that the benefit of the use to the present generation does not diminish the potential to meet the needs and aspirations of future generations’.
Ecological risk assessment. A process of estimating the effects of human actions on a natural resource.

FISHERY REPORT NO. 118
98
Ecologically sustainable development (ESD). ESD principles require that: • decision-making processes should effectively integrate both long-term and short-term economic,
environmental, social and equity considerations • if there are threats of serious or irreversible environmental damage, lack of full scientific certainty
should not be used as a reason for postponing measures to prevent environmental degradation • the principle of inter-generational equity: that the present generation should ensure that the health,
diversity and productivity of the environment is maintained or enhanced for the benefit of future generations
• the conservation of biological diversity and ecological integrity should be a fundamental consideration in decision-making and
• improved valuation, pricing and incentive mechanisms should be promoted.
Ecosystem. A complex of plant, animal and microorganism communities that, together with the nonliving components, interact to maintain a functional unit.
Effort. A measure of the resources used to harvest a fishery’s stocks. The measure of effort appropriate for a fishery depends on the methods used and the management arrangements. Common measures include the number of vessels, the number of hooks set, and the number of fishing days or nights.
Effort restriction. Restriction of the permitted amount of fishing effort (for example, the total number of hooks) in a particular fishery; used as a management tool.
Endangered species. Species in danger of extinction because of its low numbers or degraded habitat, or likely to become so unless the factors affecting its status improve. The Environment Protection and Biodiversity Conservation Act 1999 dictates that a native species is eligible to be included in the endangered category at a particular time if, at that time, (a) it is not critically endangered, and (b) it is facing a very high risk of extinction in the wild in the near future, as determined in accordance with the prescribed criteria.
Endemic species. Species that occurs naturally and exclusively in a given place.
Environmentally limited. The agreed national reporting framework for the Status of key Australian fish stocks reports defines the term ‘overfished stock’ as follows: Spawning stock biomass has been reduced to the point where average recruitment levels are significantly reduced, primarily as a result of substantial environmental changes/impacts or disease outbreaks (i.e. the stock is not recruitment overfished). Fisheries management has responded appropriately to the environmental change in productivity.
Environment Protection and Biodiversity Conservation Act 1999 (EPBC Act). Australia’s national environment law. The legislation focuses on protecting matters of national importance, such as World Heritage sites, national heritage places, wetlands of international importance (Ramsar wetlands), nationally threatened species and ecological communities, migratory species, Commonwealth marine areas and nuclear actions.
Escapement. The number, expressed as a percentage, of fish that survive a particular event (for example, predation, natural mortality, fishing mortality), often to spawn.
Exclusive Economic Zone (EEZ). The area that extends from the limit of the territorial sea, which is 12 nautical miles offshore from the territorial sea baseline, to a maximum of 200 nautical miles, measured from the territorial sea baseline. The EEZ is less than 200 nautical miles in extent where it coincides with the EEZ of another country. In this case, the boundaries between the two countries are defined by treaty. Australia has sovereign rights and responsibilities over the water column and the seabed in its EEZ, including the exploration and exploitation of natural resources.
Exploitation rate. The fraction of total animal deaths caused by fishing, usually expressed as an annual value. Can also be defined as the proportion of a population caught during a year.

STATUS OF KEY NORTHERN TERRITORY FISH STOCKS REPORT 2015
99
F Fecundity. Number of eggs an animal produces each reproductive cycle; the potential reproductive capacity of an organism or population.
Fishery-dependent data (survey). Data collected directly on a fish or fishery from commercial fishers, processors and retailers. Common methods include logbooks, fishery observers and port sampling (c.f. Fishery-independent data [survey]). More difficult to interpret than fishery-independent data because the fishery-dependent data are influenced by fishers’ attempts to maximise economic returns.
Fishery-independent data (survey). Data collected by systematic survey, carried out by research vessels or contracted commercial fishing vessels, to gather information independently of normal commercial fishing operations.
Fishing effort. Amount of fishing taking place, usually described in terms of gear type, and the frequency or period of operations (for example, hooks, trawl hours, net length).
Fishing mortality (F). The instantaneous rate of fish deaths due to fishing a designated component of the fish stock. F reference points may be applied to entire stocks or segments of the stocks, and should match the scale of management unit. Instantaneous fishing mortality rates of 0.1, 0.2 and 0.5 are equivalent to 10 per cent, 18 per cent and 39 per cent, respectively, of deaths of a stock due to fishing. See also Mortality, Natural mortality (M).
Fishing power. Effectiveness of a vessel’s fishing effort relative to that of other vessels or in other periods of time. Also used to describe the average fishing mortality per unit of effort of a fishing fleet—this often tends to increase with time as a result of improvements in technology and fisher knowledge.
Fishing season. The period during which a fishery can be accessed by fishers. Sometimes referred to as fishing year.
Fishing year. See Fishing season.
Fork length (FL). Length of a fish measured as the distance between the tip of the snout and the point of the fork or ‘V’ of the tail. Commonly used to record the length of commercial fish because it is little affected by damage to the tail fin (c.f. Total length). Fork length is measured flat, from point to point, not by stretching a tape along the body surface, which would result in a longer measurement for full-bodied fish like tuna. See also Lower-jaw fork length.
G Gear restriction. Restriction on the amount and/or type of fishing gear that can be used by fishers in a particular fishery; used as a management tool.
Generation time. Average time taken for an individual animal to replace itself in a population.
Ghost fishing. Capture of fish in gear—usually nets or traps—that has been lost.
Gross value of production (GVP). A value obtained by multiplying the volume of catch (whole weight equivalent) by the average per unit beach price. In the case of a multispecies fishery, the fishery’s GVP is the sum of the GVP of each species.

FISHERY REPORT NO. 118
100
H Harvest control rules. See Decision rules.
Harvest strategy. A set of management actions necessary to achieve defined biological and economic objectives in a given fishery.
High seas. Waters outside national jurisdictions (that is, outside Exclusive Economic Zones).
Hyperstability. A relationship between catch per unit effort (CPUE) and abundance in which, initially, CPUE declines more slowly than true abundance.
I Incidental catch. See Bycatch
Index of abundance. Relative measure of the abundance of a stock (for example, catch per unit of effort).
Index of annual recruitment. Estimate of the relative number of individuals entering the fishery each year, usually based on a data source dedicated to the purpose.
Individual transferable effort (ITE). Shares of a total allowable effort that are allocated to individuals. They can be traded permanently or temporarily. Analogous to individual transferable quotas in a fishery managed with a total unit allowable catch. Usually issued at the start of a fishing season.
Individual transferable quota (ITQ). Management tool by which portions of the total allowable catch quota are allocated to fishers (individuals or companies). The fishers have long-term rights over the quota, but can trade quota with others. See also Quota.
Input controls. Management measures that place restraints on who fishes (licence limitations), where they fish (closed areas), when they fish (closed seasons) or how they fish (gear restrictions).
Inshore waters. Waters of the shallower part of the continental shelf, usually less than 3 nautical miles from the coast.
Intrinsic productivity. The natural rate of growth of a population, measured as births minus deaths per capita in the absence of environmental constraints on population increase.
J Joint authority. An Offshore Constitutional Settlement arrangement whereby a fishery is managed jointly by the Australian Government and one or more states or territories under a single (Commonwealth, or state or territory) jurisdiction. K Key commercial species. A species that is, or has been, specifically targeted and is, or has been, a significant component of a fishery.
Key threatening process. The Environment Protection and Biodiversity Conservation Act 1999 defines a key threatening process as a process that threatens the survival, abundance or evolutionary development of a native species or ecological community, requiring the formal development of a threat abatement plan. A threatening process is eligible to be treated as a key threatening process if (a) it could cause a native species or an ecological community to become eligible for listing in any category, other than conservation dependent, or (b) it could cause a listed threatened species or a listed threatened ecological community to become eligible to be listed in another category representing a higher degree of endangerment, or (c) it adversely affects two or more listed threatened species (other than conservation dependent species) or two or more listed threatened ecological communities.

STATUS OF KEY NORTHERN TERRITORY FISH STOCKS REPORT 2015
101
L Latency. Fishing capacity that is authorised for use but not currently being used. Depending on how a fishery is managed, latency might appear in effort (for example, unused vessel statutory fishing rights [SFRs], gear SFRs, quota SFRs, permits or nights fishing) or in quota (for example, where total allowable catches [TACs] are not fully caught in a quota-managed fishery). It is a low-cost indicator of fishers’ views about the profitability of a fishery. High levels of latency can suggest that low expected profits in the fishery do not justify fishing. It is likely that fisheries in which latency exists are close to the open-access equilibrium. Apart from being an indicator of efficiency, a high level of latency in a fishery may be detrimental to the fish stock and to any chances the fishery has of being profitable in the future. For example, a significant increase in the market price of a fishery’s product is likely to entice inactive effort into the fishery. In input-controlled fisheries, if enough inactive effort is triggered, the fish stock could be jeopardised and/or profits dissipated as soon as they arise if the fishery is driven to a point of open-access equilibrium. In an output-controlled fishery, this is less of a problem, provided that TACs are set in accordance with appropriate targets.
Limited-entry fishery. Fishery in which the fishing effort is controlled by restricting the number of operators. Usually requires controlling the number and size of vessels, the transfer of fishing rights and the replacement of vessels (c.f. Open-access fishery).
Logbook. Official record of catch-and-effort data completed by fishers. In many fisheries, a licence condition makes the return of logbooks mandatory.
M Mark–recapture. A method for estimating population size and other parameters by tagging and releasing fish, and comparing the ratios of marked (tagged) to unmarked (untagged) individuals in future catches.
Maximum economic yield (MEY). The sustainable catch level for a commercial fishery that allows net economic returns to be maximised. For most practical discount rates and fishing costs, MEY implies that the equilibrium stock of fish is larger than that associated with maximum sustainable yield (MSY). In this sense, MEY is more environmentally conservative than MSY and should, in principle, help protect the fishery from unfavourable environmental impacts that could diminish the fish population.
Maximum sustainable yield (MSY). The maximum average annual catch that can be removed from a stock over an indefinite period under prevailing environmental conditions. MSY defined in this way makes no allowance for environmental variability, and studies have demonstrated that fishing at the level of MSY is often not sustainable.
Migration. Non-random movement of individuals of a stock from one place to another, often in groups.
Minimum size (minimum legal size). Size below which a captured animal may not legally be retained. Usually specified by species. May be varied as a management tool.
Model (population). Hypothesis of how a population functions; often uses mathematical descriptions of growth, recruitment and mortality.
Mortality. Deaths from all causes (usually expressed as a rate or as the proportion of the stock dying each year).
Multispecies fishery. A fishery in which fishers’ profits depend on the catch of more than one species. Fishery data from multispecies fisheries are more difficult to interpret because of uncertainty around the relative targeting of individual species.

FISHERY REPORT NO. 118
102
N Natural mortality (M). Deaths of fish from all natural causes except fishing. Usually expressed as an instantaneous rate or as a percentage of fish dying in a year. See also Fishing mortality (F), Mortality.
Nautical mile (nm). A unit of distance derived from the angular measurement of one minute of arc of latitude, but standardised by international agreement as 1852 metres.
Nominal catch. The sum of the catches that are landed (expressed as liveweight equivalent). Nominal catches do not include unreported discards.
Non-target species. Species that is unintentionally taken by a fishery or not routinely assessed for fisheries management. See also Bycatch, Byproduct.
O Observer. A certified person on board fishing vessels who collects scientific and technical information for the management authority on the fishing operations and the catch. Observer programs can be used for monitoring fishing operations (for example, areas fished, fishing effort, gear characteristics, catches and species caught, discards, collecting tag returns). Observers may or may not have legal coercion powers, and their data may or may not be used for nonscientific purposes (for example, enforcement), depending on the situation.
Oceanic. Open-ocean waters beyond the edge of the continental shelf.
Offshore Constitutional Settlement (OCS). The 1982 package of uniform national, state and territory laws that forms the basis for Australian governments (national, state and territory) to enter into agreements for specified fisheries to be managed by a particular government or group of governments. A fishery might be managed by the Australian Government, one or more state or territory governments, or any combination of the two acting through a joint authority. Fisheries for which OCS arrangements are not in place may be managed under joint control or continue under current management arrangements.
Open-access fishery. Fishery in which there is no limit on the number of operators or vessels allowed to operate in the fishery (c.f. Limited-entry fishery). Such a fishery is liable to suffer the ‘tragedy of the commons’, where a ‘race to fish’ generally leaves a fish stock below its maximum sustainable yield and unable to support an economically sustainable fishery. Under open access, a fishery operates with a harvest and effort that result in total revenue-equalling costs, with no economic profits being generated. The fishing effort employed at this point exceeds the level that would achieve maximum economic yield.
Otoliths. Bone-like structures formed in the inner ear of fish. The rings or layers can be counted to determine age.
Otolith microchemistry. A technique used in fisheries management and fisheries biology to delineate stocks, and characterise movements and natal origin of fish.
Output controls. Management measures that place restraints on what is caught, including total allowable catch, quota, size limits and species.
Overfished stock. The agreed national reporting framework for the Status of key Australian fish stocks reports defines the term ‘overfished stock’ as follows: Spawning stock biomass has been reduced through catch, so that average recruitment levels are significantly reduced (i.e. recruitment overfished). Current management is not adequate to recover the stock, or adequate management measures have been put in place but have not yet resulted in measurable improvements.
Ovigerous. Carrying or bearing eggs.

STATUS OF KEY NORTHERN TERRITORY FISH STOCKS REPORT 2015
103
P Panmictic. A panmictic population is one where all individuals have equal opportunity of mating. This assumes that there are no mating restrictions, either genetic or behavioural, on the population.
Pelagic. Inhabiting surface waters rather than the sea floor. Usually applied to free-swimming species such as tunas and sharks (c.f. Demersal).
Performance indicator (performance measure). Parameter used to assess the performance of a fishery against predetermined sustainability objectives.
Planktonic larval stage. An early life stage of many marine organisms, when larvae are dispersed in the water column before settling on suitable habitat and developing into their adult form.
Population modelling. Mathematical description of a population that is designed to fully simulate the life cycle of animals in that population. Can project the effects on the population of environmental factors or biological characteristics of these animals.
Possession limit. The maximum number of fish that a person is allowed to have in their possession at any time. It discourages the accumulation of large quantities of fish by recreational fishers.
Precautionary approach. Approach to fisheries management where the absence of adequate scientific information should not be used as a reason for postponing or failing to take measures to conserve target species, associated or dependent species and non-target species and their environment.
Pre-recruits. The proportion of a population that has not yet entered a fishery (that is, not able to be caught or retained).
Productivity (biological). An indication of the birth, growth and death rates of a stock. A highly productive stock is characterised by high birth, growth and mortality rates, and can sustain high harvesting rates.
Productivity (economic). The ability of firms or an industry to convert inputs (labour, capital, fuel, etc.) into output. Economic productivity is often measured using productivity indexes, which show whether more or less output is being produced over time with a unit of input. The index is calculated by comparing changes in total output (fish) to changes in total inputs such as fuel, labour and capital.
Protected species. As per the meaning used in the Environment Protection and Biodiversity Conservation Act 1999.
Q Quota. Amount of catch allocated to a fishery as a whole (total allowable catch), or to an individual fisher or company (individual transferable quota).
Quota species. Species for which catch quotas have been allocated.
R Recruit. Usually, a fish that has just become susceptible to the fishery. Sometimes used in relation to population components (for example, a recruit to the spawning stock).
Recruitment failure. A situation in which a population is not able to naturally produce viable offspring as a consequence of physical factors (for example, damaged spawning areas) or biological factors (for example, inadequate numbers of fish).
Recruitment overfished. The point at which a stock is considered to be recruitment overfished is the point at which the spawning stock biomass has been reduced through catch, so that average recruitment levels are significantly reduced.

FISHERY REPORT NO. 118
104
Recruitment overfishing. A level of exploitation that, if maintained, would result in the stock falling to levels at which there is a significant risk of recruitment and stock collapse. The corresponding term for the state of the stock is ‘recruitment overfished’, in which the average annual recruitment to the stock is significantly reduced. Both terms define a limit reference point (for exploitation rate or stock size) beyond which urgent management action should be taken to reduce exploitation and recover the stock.
The following uses of the term provide some guidance to how it should be interpreted and applied.
The FAO fisheries glossary (www.fao.org/fi/glossary/default.asp) defines recruitment overfished as ‘a situation in which … annual recruitment … has become significantly reduced. The situation is characterized by a greatly reduced spawning stock, a decreasing proportion of older fish in the catch, and generally very low recruitment year after year’.
Cooka defines recruitment overfished as a situation in which ‘a reduction in the proportion of fish caught would be more than compensated for by the increased number of recruits to the fishery as a result of increased escapement of mature fish’.
The EPBC Guidelines for the ecologically sustainable management of fisheriesb define recruitment overfishing as occurring ‘where fishing activities are causing a reduction in recruitment in succeeding years and cause the mortality of too many fish in total, too many pre-productive fish, or too many fish that have only spawned a few times. The end result is that the stock can no longer replenish itself adequately’.
Various jurisdictions have defined a biomass limit reference point (BLIM) that also corresponds to this concept of recruitment overfishing. These limit reference points (LRPs) are often related to the biomass at which maximum sustainable yield (MSY) occurs. Examples of LRPs include the following:
BLIM = 0.5BMSY (Commonwealth of Australia). BLIM = 0.5BMSY (or greater) (United States). BLIM is usually defined relative to fishing mortality rates rather than biomass (European Union). BLIM = 0.5BMSY (or greater—for example, for forage fish) (Marine Stewardship Council).
New Zealand explicitly uses the concept of recruitment overfishing, which is defined as occurring ‘when excessive fishing effort or catch reduces the spawning stock biomass to a level below which future recruitment levels may be jeopardised; this spawning biomass level should correspond closely to the biomass limit reference point’.
No jurisdictions appear to have explicitly defined how much recruitment would be reduced to constitute recruitment overfishing, perhaps because recruitment tends to fluctuate much more than overall stock biomass.
Reference point. Indicator of the level of fishing (or stock size); used as a benchmark for assessment (see also Biological reference point).
Relative abundance. The number of living individuals at a point in time, expressed as a fraction of the average number of living individuals estimated before the beginning of fishing.
Risk analysis. Analysis that evaluates the possible outcomes of various harvesting strategies or management options.
a Cook, JG 1984, Glossary of technical terms, in RM May (ed.), Exploitation of marine communities, Springer-Verlag, Berlin, 341–348. b Australian Government Department of the Environment and Water Resources 2007, Guidelines for the ecologically sustainable management of fisheries, 2nd edn, DEWR, Canberra.

STATUS OF KEY NORTHERN TERRITORY FISH STOCKS REPORT 2015
105
S Seasonal closure. Closure of a fishing ground for a defined period; used as a management tool, often to protect a particular component of the stock.
Settlement. Transition from a pelagic larval stage to a substrate-associated juvenile or adult existence.
Shared biological stock. A biological stock that spans the waters of more than one jurisdiction.
Shark finning. The removal and retention of shark fins. The remainder of the body is generally discarded, often still alive. The process has been banned in Australian waters, and management measures are in place to reduce or restrict targeting of sharks for fin markets by illegal, unreported and unregulated fishing.
Size frequency. See Length-frequency distribution.
Spatial closure. A method of fisheries management that prevents fishing in a defined area.
Spawning biomass (SB). The total weight of all adult (reproductively mature) fish in a population.
Species complex. Group of similar species that are often difficult to differentiate without detailed examination.
Species group. See Species complex.
Standardised data. Data that have been adjusted to be directly comparable to a unit that is defined as the ‘standard’ one. Standardised catch-per-unit-effort data are often used as an indicator of fish abundance.
Standard length (SL). The length of a fish measured from the tip of the snout to the posterior end of the last vertebra or to the posterior end of the midlateral portion of the hypural plate.
Statutory fishing right (SFR). Right to participate in a limited-entry fishery. An SFR can take many forms, including the right to access a particular fishery or area of a fishery, the right to take a particular quantity of a particular type of fish, or the right to use a particular type or quantity of fishing equipment.
Stochastic demographic modelling. Stock assessment method used to estimate the intrinsic productivity and response to fishing of fish stocks, based on age structure, allowing for variation in annual recruitment. Mostly used for stock assessment of shark species.
Stock. Within the Status of key Australian fish stocks reports, the term ‘stock’ is used generically in reference to all three levels of stock status assessment—that is, biological stocks, management units and populations assessed at the jurisdictional level. See also Biological stock.
Stock–recruitment relationship. Relationship between the size of the parental biomass and the number of recruits it generates. Determination of this relationship is difficult, and involves studying the population’s size–age composition, and growth and mortality rates.
Stock reduction analysis. A method of inferring the extent to which a fisheries stock is likely to have been reduced by fishing, assuming constant recruitment. Requires only a time series of total catch data, but can also incorporate other information.
Stock synthesis model. A statistical framework for calibration of a population dynamics model, using a range of fishery and survey data. It is designed to accommodate both age and size structure in the population, and multiple stock subareas. Selectivity can be cast as age specific only, size specific in the observations only, or size specific with the ability to capture the major effect of size-specific survivorship. The overall model contains subcomponents that simulate the population dynamics of the stock and fisheries, derive the expected values for the various observed data, and quantify the magnitude of difference between observed and expected data.

FISHERY REPORT NO. 118
106
Sustainable stock. The agreed national reporting framework for the Status of key Australian fish stocks reports defines the term ‘sustainable stock’ as follows: Stock for which biomass (or biomass proxy) is at a level sufficient to ensure that, on average, future levels of recruitment are adequate (that is, not recruitment overfished) and for which fishing pressure is adequately controlled to avoid the stock becoming recruitment overfished.
T Tagging. Marking or attaching a tag to an animal so that it can be identified when recaptured; used to study fish growth, movement, migration, stock structure and size.
Target fishing (targeting). Fishing selectively for particular species or sizes of fish.
Target species. See Key commercial species.
Temporal closure. Closure that is implemented to protect fish stocks during specific stages of their life cycle (for example, while spawning).
Territorial sea (12 nautical mile limit). ‘The Territorial Sea is a belt of water not exceeding 12 nautical miles in width measured from the territorial sea baseline. Australia’s sovereignty extends to the territorial sea, its seabed and subsoil, and to the air space above it. This sovereignty is exercised in accordance with international law as reflected in the Convention on the Law of the Sea.
The major limitation on Australia’s exercise of sovereignty in the territorial sea is the right of innocent passage for foreign ships. The territorial sea around certain islands in the Torres Strait is 3 nautical miles’c.
Territorial sea baseline. The baseline from which all the zones (for example, the Exclusive Economic Zone) of Australia’s maritime jurisdiction are measured. The baseline is defined as the level of lowest astronomical tide, but straight baselines and bay or river closing lines may be drawn further out from the low-water mark to encompass areas such as the mouths of rivers, bays, ports and fringing reefs.
Threatened species. As per the meaning used in the Environment Protection and Biodiversity Conservation Act 1999.
Total allowable catch (TAC). For a fishery, a catch limit set as an output control on fishing (see also Output controls). Where resource-sharing arrangements are in place between commercial and recreational fishers, the term total allowable commercial catch (TACC) applies. The term ‘global’ is applied to TACs that cover fishing mortality from all fleets, including Commonwealth, state and territory fleets.
Total allowable catch (TAC), actual. The agreed TAC for the species with amendments applied, such as carryover or debits from the previous year.
Total allowable commercial catch (TACC). See Total allowable catch (TAC).
Total allowable effort (TAE). An upper limit on the amount of effort that can be applied in the fishery.
Total length (TL). The length from the tip of the snout to the tip of the longer lobe of the caudal fin, usually measured with the lobes compressed along the midline. It is a straight-line measure, not measured over the curve of the body (c.f. Fork length).
Transitional–depleting stock. The agreed national reporting framework for the Status of key Australian fish stocks reports defines the term ‘transitional–depleting stock’ as follows: A deteriorating stock—biomass is not yet recruitment overfished, but fishing pressure is too high and moving the stock in the direction of becoming recruitment overfished.
c Geoscience Australia 2012, Maritime boundary definitions, Geoscience Australia, Canberra, www.ga.gov.au/marine/jurisdiction/maritime-boundary-definitions.html.

STATUS OF KEY NORTHERN TERRITORY FISH STOCKS REPORT 2015
107
Transitional–recovering stock. The agreed national reporting framework for the Status of key Australian fish stocks reports defines the term ‘transitional–recovering stock’ as follows: A recovering stock—biomass is recruitment overfished, but management measures are in place to promote stock recovery, and recovery is occurring.
Trigger points. Pre-specified quantities (total catch, spawning biomass, etc.) that indicate the need for a review of fishery management.
U Undefined stock. The agreed national reporting framework for the Status of key Australian fish stocks reports defines the term ‘undefined stock’ as follows: Not enough information exists to determine stock status.
Unfished biomass. Biomass of a stock that has not been fished (also called the ‘unfished’ or ‘unexploited’ biomass or unfished level).
V Vessel monitoring system (VMS). Electronic device that transmits the identity and location of a vessel.
Virgin biomass. See Unfished biomass.
Vulnerable species. Species that will become endangered within 25 years unless mitigating action is taken. See also Endangered species. The Environment Protection and Biodiversity Conservation Act 1999 dictates that a native species is eligible to be included in the vulnerable category at a particular time if, at that time (a) it is not critically endangered or endangered, and (b) it is facing a high risk of extinction in the wild in the medium-term future, as determined in accordance with the prescribed criteria.
W Warp strike. Incident of seabirds striking trawl gear while interacting with fishing activity. Often results in mortality.
Weight-of-evidence approach. The systematic consideration of a range of biological and fisheries information for assembly and review of indicators of biomass status and levels of fishing mortality, to support a status determination. Lines of evidence used in the weight-of-evidence approach include empirical indicators (catch, effort, catch rate, size- or age-based indicators, spatial and temporal distribution of the fishery), risk assessments, fishery-independent surveys, quantitative stock assessment models and harvest strategies.
Y Yield. Total weight of fish harvested from a fishery.
Yield-per-recruit analysis. Analysis of how growth and natural mortality interact to determine the best size of animals to harvest; for example, it may be more economically beneficial to catch fish when they are young and plentiful, or when they are older and larger but fewer. Biological reference points based on yield-per-recruit analysis will be expected to lack precaution because the potential for reduced future recruitment resulting from decreased parental biomass is not considered.