Embed Size (px)
DESCRIPTION
Status of Tuna Fisheries and Stocks in the Western and Central Pacific Ocean. Oceanic Fisheries Programme (OFP). Overview. Summary of fishery trends through 2011, with some indicators for 2012 Status of the stocks Main tuna stocks Other stock assessments from 2012 - PowerPoint PPT Presentation
Citation preview

Status of Tuna Fisheries and Stocks in the Western and Central Pacific Ocean
Oceanic Fisheries Programme (OFP)

Overview
• Summary of fishery trends through 2011, with some indicators for 2012
• Status of the stocks–Main tuna stocks–Other stock assessments from 2012
• WCPFC (and other) responses

WCPFC Convention Area

0
400,000
800,000
1,200,000
1,600,000
2,000,000
2,400,000
2,800,000
1960
1962
1964
1966
1968
1970
1972
1974
1976
1978
1980
1982
1984
1986
1988
1990
1992
1994
1996
1998
2000
2002
2004
2006
2008
2010
Cat
ch (m
t)
PURSE SEINE
OTHER
POLE-AND-LINE
LONGLINE
WCP-CA Tuna Catch by Gear

WCP-CA Purse Seine Fishery
0
10,000
20,000
30,000
40,000
50,000
60,000
0
400,000
800,000
1,200,000
1,600,000
2,000,00019
60
1963
1966
1969
1972
1975
1978
1981
1984
1987
1990
1993
1996
1999
2002
2005
2008
2011
Estim
ated
Effor
t (da
ys)
Catc
h (m
t)
YELLOWFIN
SKIPJACK
BIGEYE
DAYS

PS Effort from VMS20N – 20S, excluding domestic PS effort for ID and PH
0
10,000
20,000
30,000
40,000
50,000
60,000
70,000
Jan Feb Mar Apr May Jun Jul Aug Sep Oct Nov Dec
VMS
'fish
ing'
day
s
2009
2010
2011
2012

2011 versus 20122011
2012
La Niña
-> El Niño

10
15
20
25
30
35
40
4515
20
25
30
35
40
45
50
2005-1 2005-7 2006-1 2006-7 2007-1 2007-7 2008-1 2008-7 2009-1 2009-7 2010-1 2010-7 2011-1 2011-7 2012-1 2012-7
Trip
Leng
th (D
ays)
TUN
A CP
UE (M
T/Da
y)
TUNA CPUE (Left axis)
Logsheet Trip Length (Right axis)
VMS Trip Length (Right axis)
Trends in PS CPUE into 2012
Preliminary PS catch estimate for 2012 – 1.66 million t

WCP-CA Longline Fishery
0
2,500,000
5,000,000
7,500,000
10,000,000
0
50,000
100,000
150,000
200,000
250,000
300,000
1950
1953
1956
1959
1962
1965
1968
1971
1974
1977
1980
1983
1986
1989
1992
1995
1998
2001
2004
2007
2010
Estim
ated
Effor
t (hu
ndre
d ho
oks)
Catc
h (m
t)
BIGEYE
ALBACORE
YELLOWFIN
HHOOKS

10S
010
N20
N30
N
130E
30S
20S
130E 140E 150E
140E 150E
160E 170E 180
160E 170E 180 170W 160W 150W
170W 160W 150W 140W
140W
30S20S
10S0
10N20N
30N
WCP-CA Longline Fishery

10S
010
N20
N30
N
130E
30S
20S
130E 140E 150E
140E 150E
160E 170E 180
160E 170E 180 170W 160W 150W
170W 160W 150W 140W
140W
30S20S
10S0
10N20N
30N
WCP-CA Longline Fishery

0
5
10
15
20
25
30
1990
1991
1992
1993
1994
1995
1996
1997
1998
1999
2000
2001
2002
2003
2004
2005
2006
2007
2008
2009
2010
2011
CPU
E (k
g/10
0 ho
oks)
Yellowfin
0
5
10
15
20
25
30
35
40
1990
1991
1992
1993
1994
1995
1996
1997
1998
1999
2000
2001
2002
2003
2004
2005
2006
2007
2008
2009
2010
2011
CPU
E (k
g/10
0 ho
oks)
Bigeye
0
5
10
15
20
25
30
35
40
1990
1991
1992
1993
1994
1995
1996
1997
1998
1999
2000
2001
2002
2003
2004
2005
2006
2007
2008
2009
2010
2011
CPU
E (k
g/10
0 ho
oks)
Albacore
WCP-CA Longline Fishery

Status of Stocks Summary
Main tunas

Skipjack • Approximately 1.6 million tonnes in
2010, dominated by purse seine, reduction in 2011, record catch likely in 2012
• Stock decreasing slowly – now about 50% depletion from unexploited level
• Current catches now about MSY• Outlook: stock falling to near MSY
level, 25% of unexploited level
0
2,000,000
4,000,000
6,000,000
8,000,000
1972
1976
1980
1984
1988
1992
1996
2000
2004
2008
Adul
t bio
mas
s (t
onne
s)
0
200,000
400,000
600,000
800,000
1,000,000
1,200,000
1,400,000
1,600,000
1,800,000
2,000,000
1950
1955
1960
1965
1970
1975
1980
1985
1990
1995
2000
2005
2010
Catc
h (t
onne
s)
Other
Purse seine
Pole-and-line
Longline

Yellowfin• Catch plateaued since late 1990s
in spite of increasing PS and LL effort
• Full exploitation potential of yellowfin has been reached
• Stock has decreased steadily• Now approaching 60% depletion
from unexploited level
0
500,000
1,000,000
1,500,000
2,000,000
2,500,000
3,000,000
3,500,000
4,000,000
1952
1956
1960
1964
1968
1972
1976
1980
1984
1988
1992
1996
2000
2004
2008
Adul
t bio
mas
s (t
onne
s)
0
100,000
200,000
300,000
400,000
500,000
600,000
700,000
1950
1955
1960
1965
1970
1975
1980
1985
1990
1995
2000
2005
2010
Catc
h (t
onne
s)
Other
Purse seine
Pole-and-line
Longline
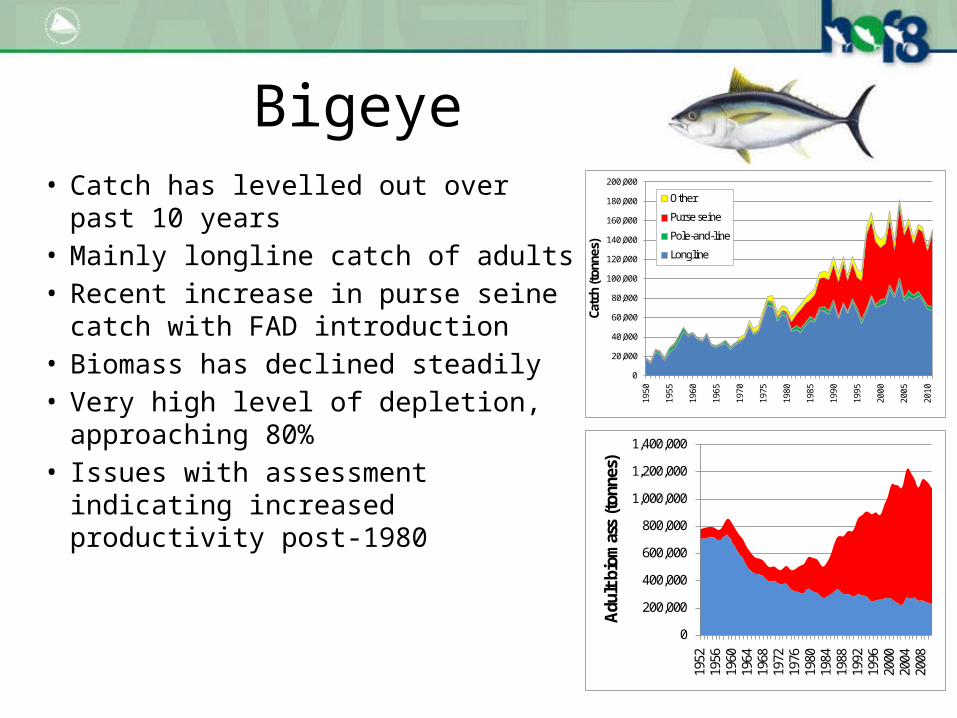
Bigeye• Catch has levelled out over past 10
years• Mainly longline catch of adults• Recent increase in purse seine
catch with FAD introduction• Biomass has declined steadily• Very high level of depletion,
approaching 80%• Issues with assessment indicating
increased productivity post-19800
200,000
400,000
600,000
800,000
1,000,000
1,200,000
1,400,000
1952
1956
1960
1964
1968
1972
1976
1980
1984
1988
1992
1996
2000
2004
2008
Adul
t bio
mas
s (t
onne
s)
0
20,000
40,000
60,000
80,000
100,000
120,000
140,000
160,000
180,000
200,000
1950
1955
1960
1965
1970
1975
1980
1985
1990
1995
2000
2005
2010
Catc
h (t
onne
s)
Other
Purse seine
Pole-and-line
Longline

South Pacific Albacore• Fishery is mainly longline,
catching adult albacore• Catch has doubled since 1995,
30% increase in 2010 over 2009• Biomass has declined steadily
since mid-1960s• Stock depletion due to fishing is
~ 30%• current catches approaching MSY
0
10,000
20,000
30,000
40,000
50,000
60,000
70,000
80,000
90,000
1950
1954
1958
1962
1966
1970
1974
1978
1982
1986
1990
1994
1998
2002
2006
2010
Catc
h (t
onne
s)
Other
Troll
Longline
Driftnet
0
100,000
200,000
300,000
400,000
500,000
600,000
700,000
1961
1965
1969
1973
1977
1981
1985
1989
1993
1997
2001
2005
2009
Adul
t bio
mas
s (t
onne
s)

Stock Status Overview
• All four stocks at or near their lowest observed biomass level

Stock Status Overview
1950 1960 1970 1980 1990 2000 20100
10
20
30
40
50
60
70
80
90
AlbacoreBigeyeSkipjackYellowfin
% re
ducti
on fr
om u
nexp
loite
d

Other Species
• Southwest Pacific striped marlin– Close to MSY in terms of fishing
mortality and biomass• Oceanic whitetip shark
– Strongly overfished, spawning biomass <10% of unexploited level
• Silky shark– Some uncertainties, but probably
overfished with overfishing continuing

WCPFC Responses
• Tropical tuna CMM (interim measures for 2013)– PS effort limited to:
• 2010 levels for PNA EEZs collectively• 2010 or 2001-2004 average for other EEZs with >1,000
days PS effort annually in 2006-2010• Other EEZs – self-nominated effort or catch limits• No increase in effort on the high seas
– FAD closure (3 mo) + 1 mo additional closure or limits on FAD set numbers by flag
– Longline bigeye catch limits for DWFNs

WCPFC Responses
• South Pacific Albacore CMM (2010)– No increase in vessels targeting albacore south of
20⁰S from 2005 or 2000-2004 average levels– SPC members working in a FFA process on
comprehensive zone-based catch limits, but agreement has stalled

WCPFC Responses
• Oceanic Whitetip CMM– No retention or landing, including fins– Live release where possible
• Whale Shark CMM– Prohibition of deliberate PS setting on schools
associated with whale sharks– Where inadvertent setting occurs, take all steps to
ensure safe release