Embed Size (px)
Citation preview
11
Status of Nearshore Status of Nearshore Groundfish in OregonGroundfish in Oregon
22
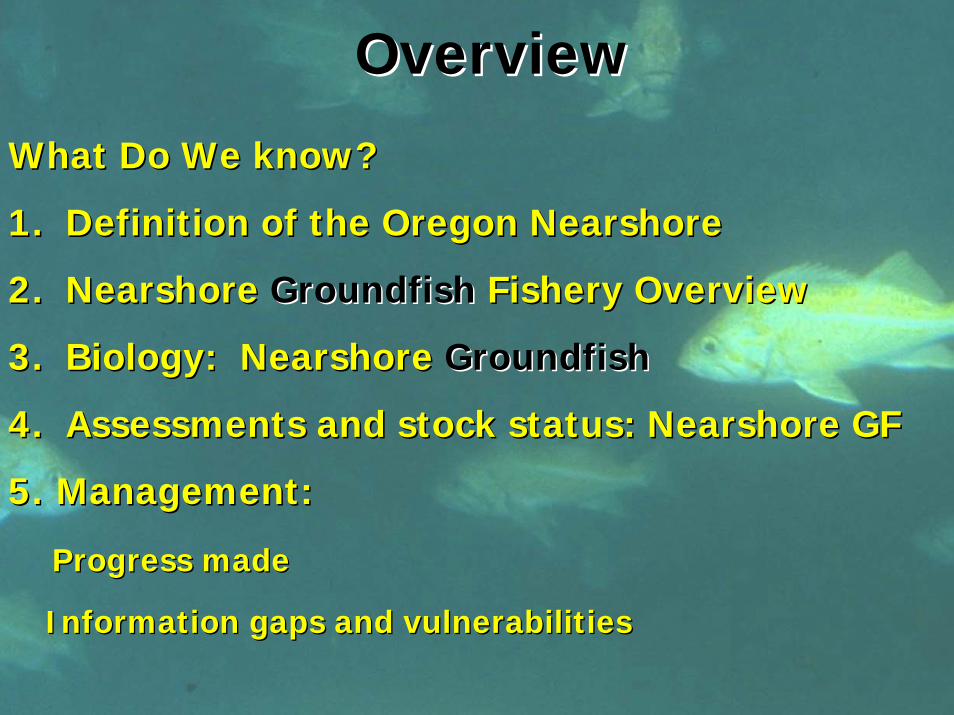
What Do We know?What Do We know?
1. Definition of the Oregon 1. Definition of the Oregon NearshoreNearshore
2. 2. NearshoreNearshore GroundfishGroundfish Fishery OverviewFishery Overview
3. Biology: 3. Biology: NearshoreNearshore GroundfishGroundfish
4. Assessments and stock status: 4. Assessments and stock status: NearshoreNearshore GFGF
5.5. Management: Management:
Progress madeProgress made
Information gaps and vulnerabilitiesInformation gaps and vulnerabilities
OverviewOverview
33
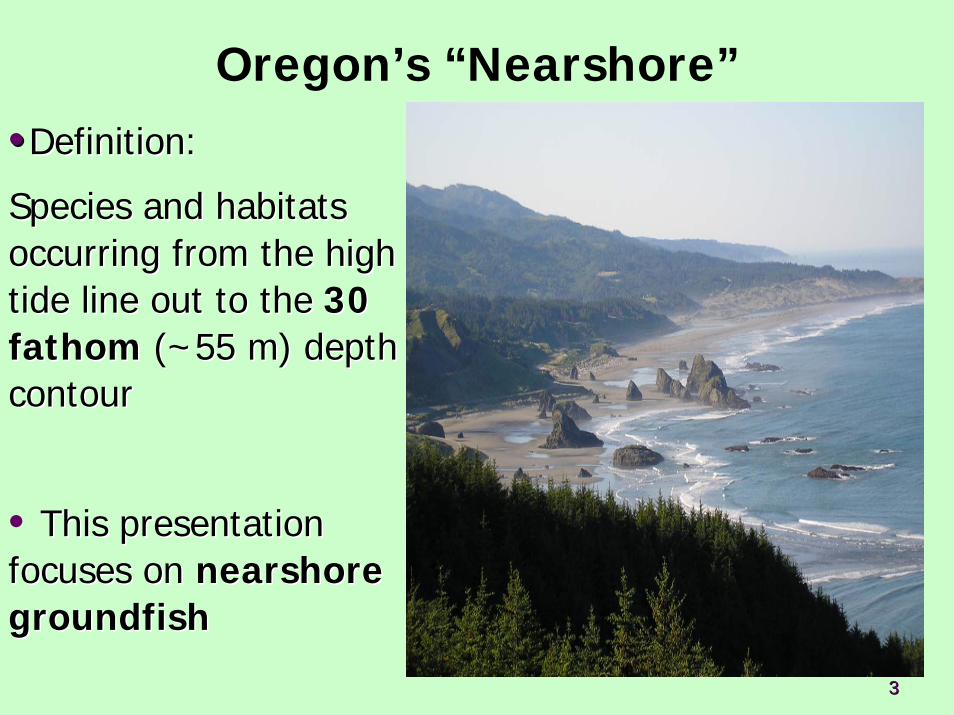
Oregon’s “Nearshore”••Definition: Definition:
Species and habitats Species and habitats occurring from the high occurring from the high tide line out to thetide line out to the 30 30 fathom fathom (~55 m)(~55 m) depth depth contourcontour
• This presentation This presentation focuses on focuses on nearshorenearshoregroundfishgroundfish
44
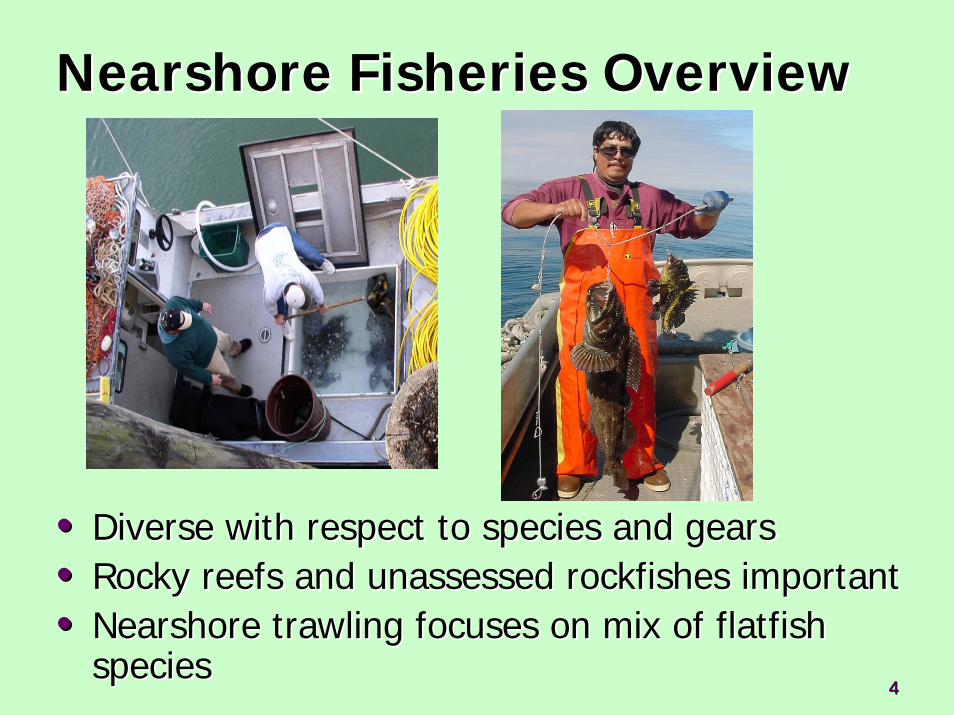
NearshoreNearshore Fisheries OverviewFisheries Overview
•• Diverse with respect to species and gearsDiverse with respect to species and gears•• Rocky reefs and Rocky reefs and unassessedunassessed rockfishes importantrockfishes important•• NearshoreNearshore trawling focuses on mix of flatfish trawling focuses on mix of flatfish
speciesspecies
55
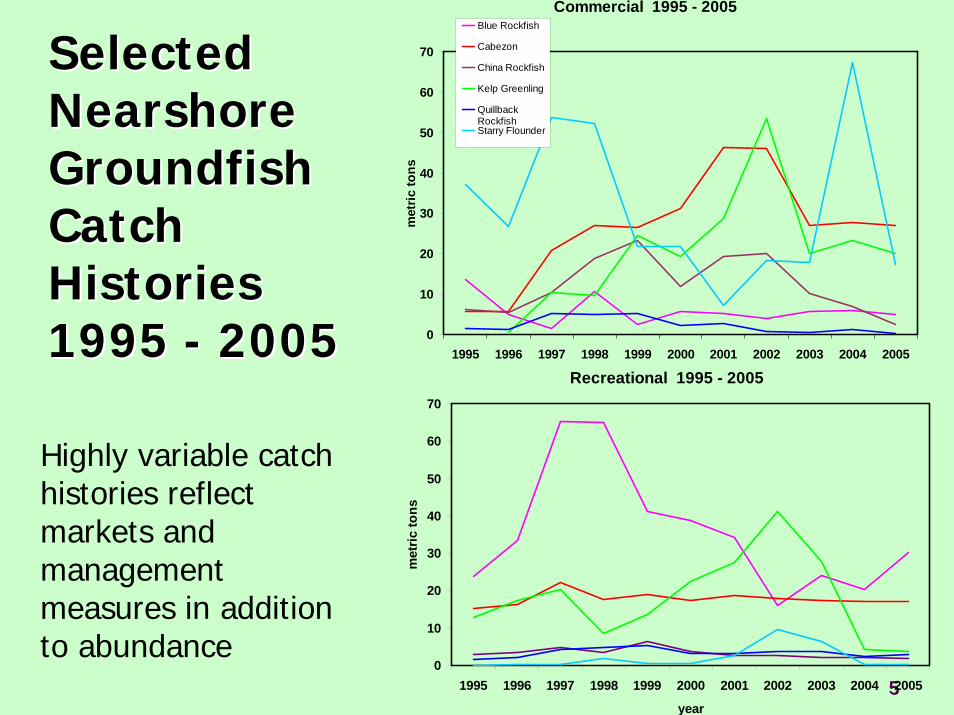
Selected Selected NearshoreNearshoreGroundfishGroundfishCatch Catch Histories Histories 1995 1995 -- 20052005
Highly variable catch histories reflect markets and management measures in addition to abundance
Recreational 1995 - 2005
0
10
20
30
40
50
60
70
1995 1996 1997 1998 1999 2000 2001 2002 2003 2004 2005
year
met
ric to
ns
Commercial 1995 - 2005
0
10
20
30
40
50
60
70
1995 1996 1997 1998 1999 2000 2001 2002 2003 2004 2005
met
ric to
ns
Blue Rockfish
Cabezon
China Rockfish
Kelp Greenling
QuillbackRockfishStarry Flounder
66
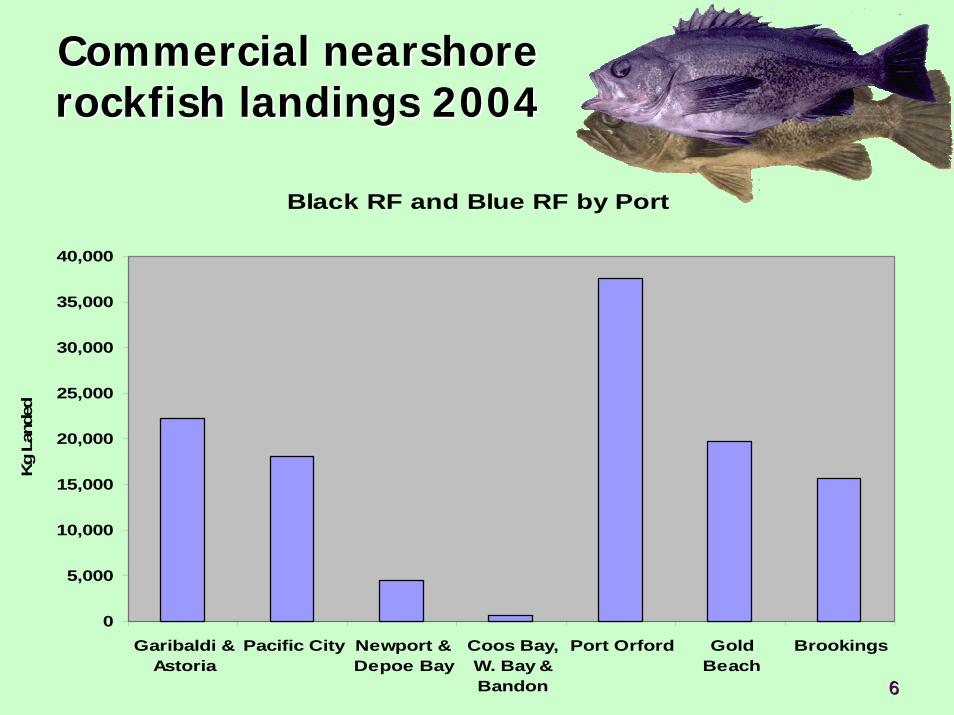
Commercial nearshore Commercial nearshore rockfish landings 2004rockfish landings 2004
Black RF and Blue RF by Port
0
5,000
10,000
15,000
20,000
25,000
30,000
35,000
40,000
Garibaldi &Astoria
Pacific City Newport &Depoe Bay
Coos Bay,W. Bay &Bandon
Port Orford GoldBeach
Brookings
Kg
Land
ed
77
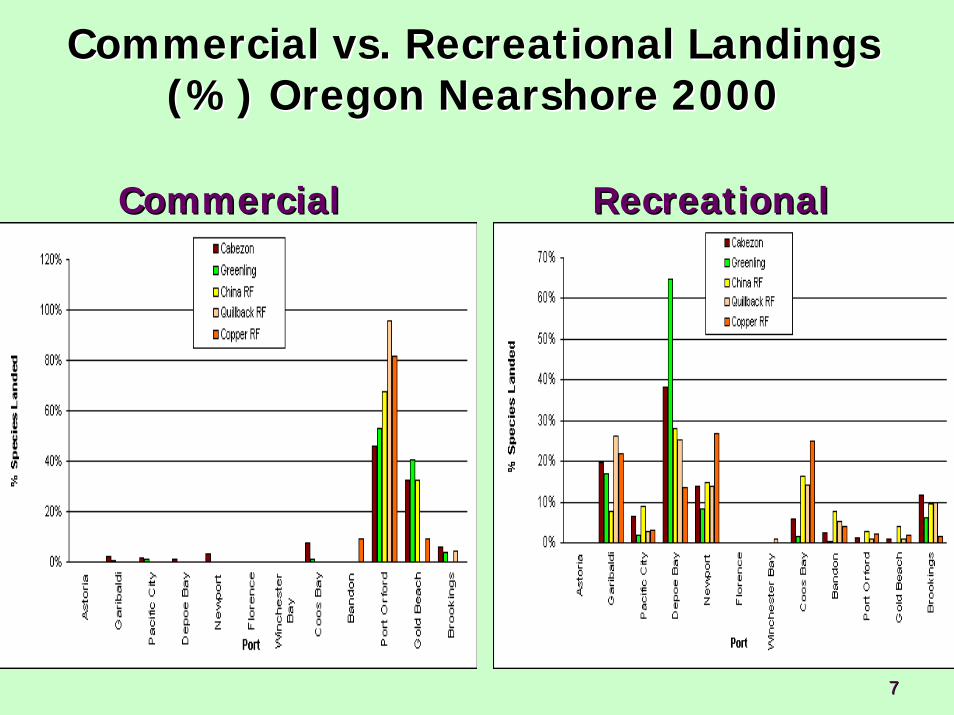
Commercial vs. Recreational Landings Commercial vs. Recreational Landings (%) Oregon (%) Oregon NearshoreNearshore 20002000
Commercial RecreationalCommercial Recreational
88
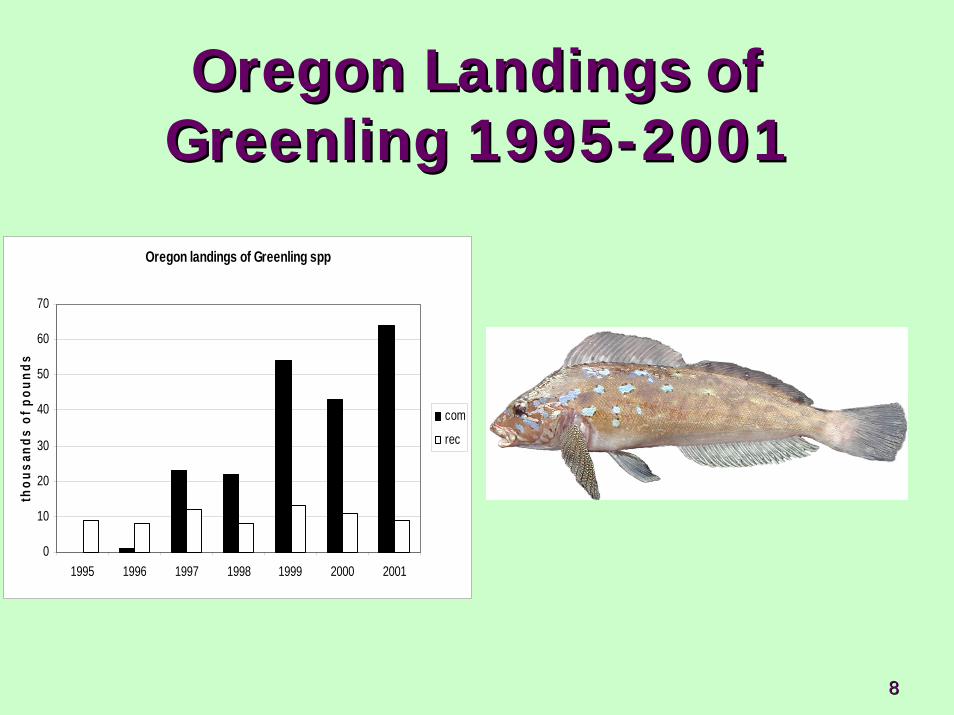
Oregon landings of Greenling spp
0
10
20
30
40
50
60
70
1995 1996 1997 1998 1999 2000 2001
thou
sand
s of
pou
nds
com
rec
Oregon Landings of Oregon Landings of Greenling 1995Greenling 1995--20012001
99
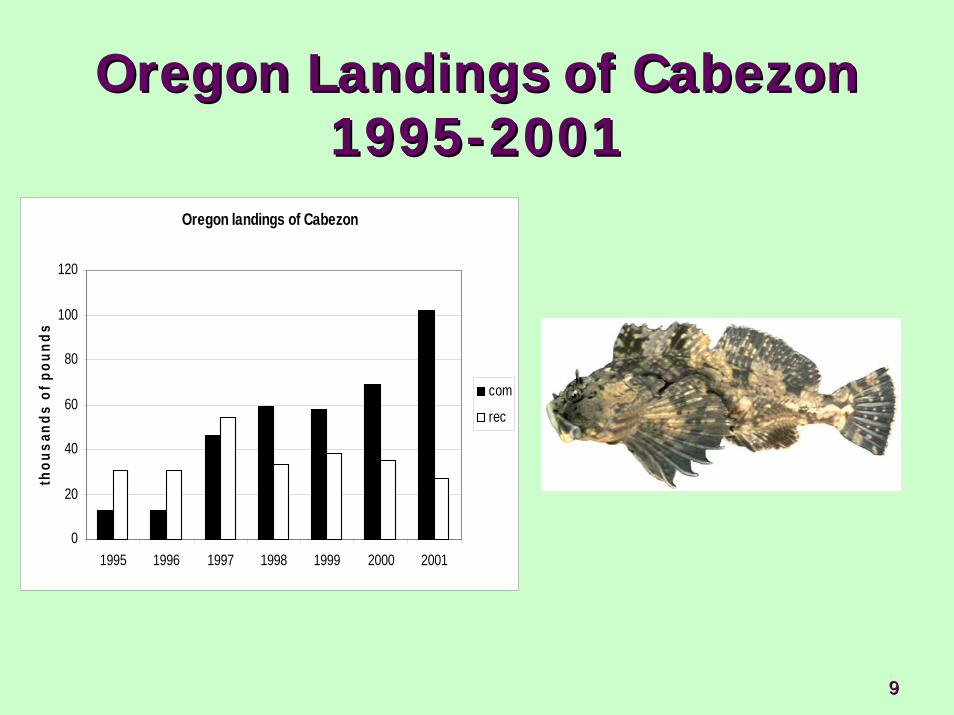
Oregon landings of Cabezon
0
20
40
60
80
100
120
1995 1996 1997 1998 1999 2000 2001
thou
sand
s of
pou
nds
com
rec
Oregon Landings of Oregon Landings of CabezonCabezon19951995--20012001
1010
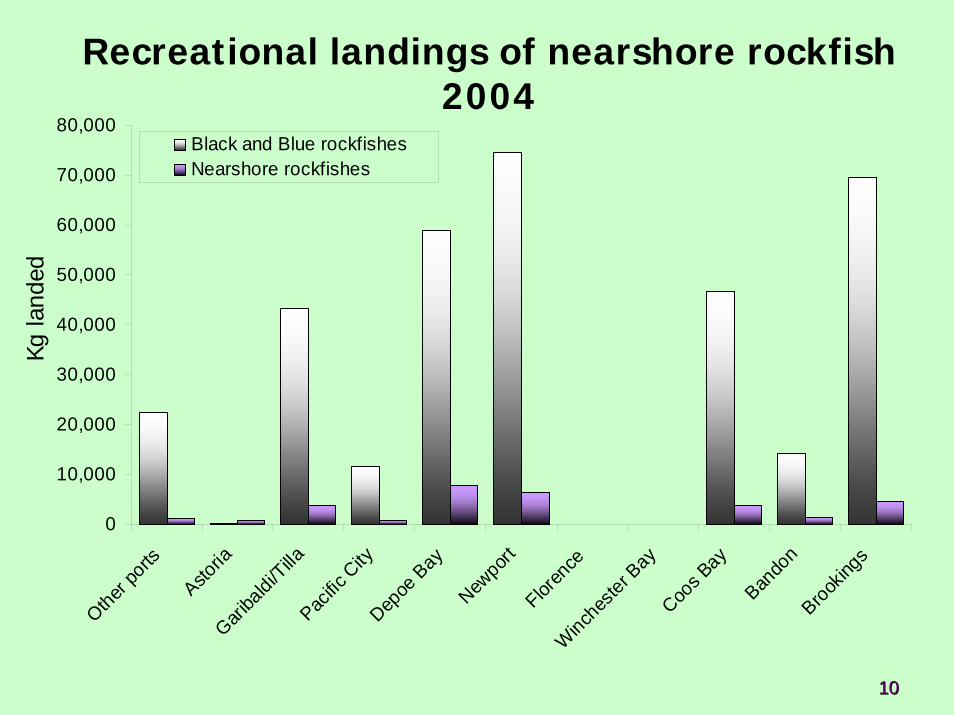
Recreational landings of nearshore rockfish 2004
0
10,000
20,000
30,000
40,000
50,000
60,000
70,000
80,000
Other p
orts
Astoria
Gariba
ldi/Tilla
Pacific
City
Depoe
Bay
Newport
Floren
ceW
inches
ter B
ayCoo
s Bay
Bando
nBroo
kings
Black and Blue rockfishesNearshore rockfishes
Kg la
nded
1111
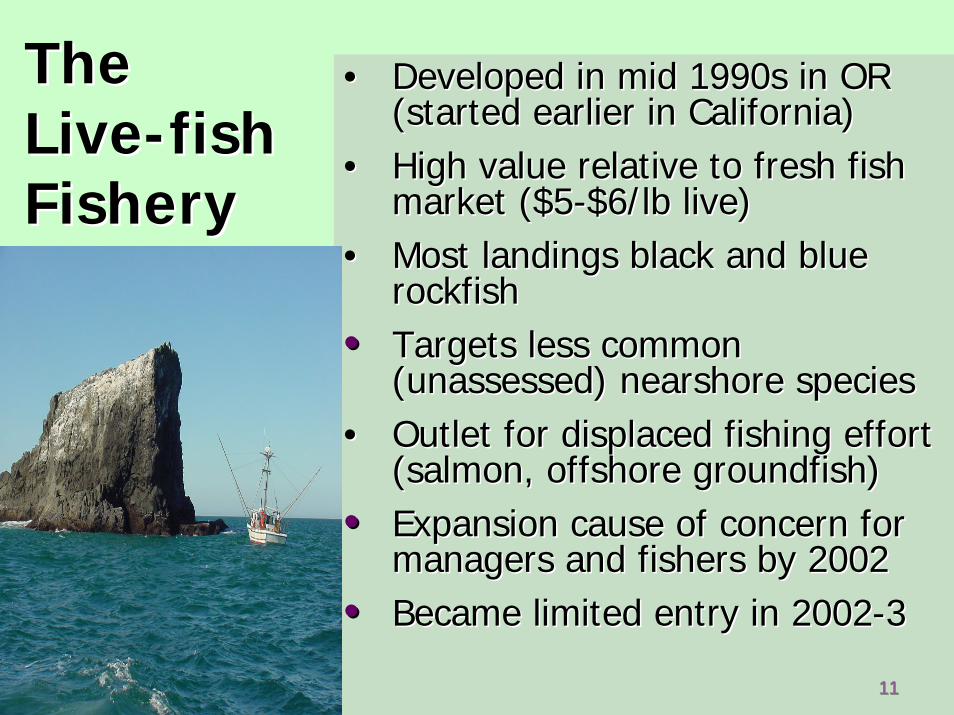
TheTheLiveLive--fish fish FisheryFishery
•• Developed in mid 1990s in OR Developed in mid 1990s in OR (started earlier in California)(started earlier in California)
•• High value relative to fresh fish High value relative to fresh fish market ($5market ($5--$6/lb live)$6/lb live)
•• Most landings black and blue Most landings black and blue rockfishrockfish
•• Targets less common Targets less common ((unassessedunassessed) nearshore species) nearshore species
•• Outlet for displaced fishing effort Outlet for displaced fishing effort (salmon, offshore (salmon, offshore groundfishgroundfish))
•• Expansion cause of concern for Expansion cause of concern for managers and fishers by 2002managers and fishers by 2002
•• Became limited entry in 2002Became limited entry in 2002--33
1212
NearshoreNearshore Fisheries Economic Fisheries Economic Contributions to OregonContributions to Oregon
•• Commercial Commercial nearshorenearshore groundfishgroundfish fishery fishery --$2 million in personal income in 2004$2 million in personal income in 2004
•• Ocean Ocean nearshorenearshore bottomfishbottomfish recreational recreational fishery (excludes salmon, halibut, crab) fishery (excludes salmon, halibut, crab) --$3.66 million in 2004 $3.66 million in 2004
•• Source: The Research Group, Corvallis, Source: The Research Group, Corvallis, 20052005
1313
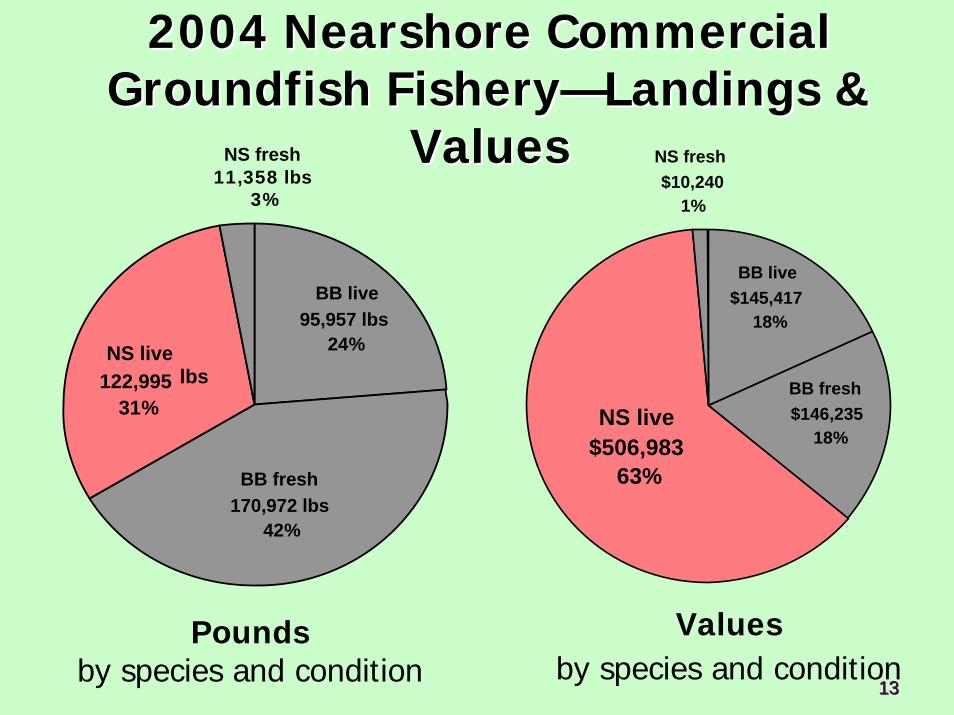
2004 2004 NearshoreNearshore Commercial Commercial GroundfishGroundfish FisheryFishery——Landings & Landings &
ValuesValues
Pounds by species and condition
Valuesby species and condition
NS live$506,983
63%
BB fresh $146,235
18%
BB live $145,417
18%
NS fresh $10,240
1%
BB fresh 170,972 lbs
42%
NS live122,995
31%
BB live 95,957 lbs
24%
NS fresh11,358 lbs
3%
lbs
1414
Biology of Biology of NearshoreNearshoreRockfishesRockfishes
1515
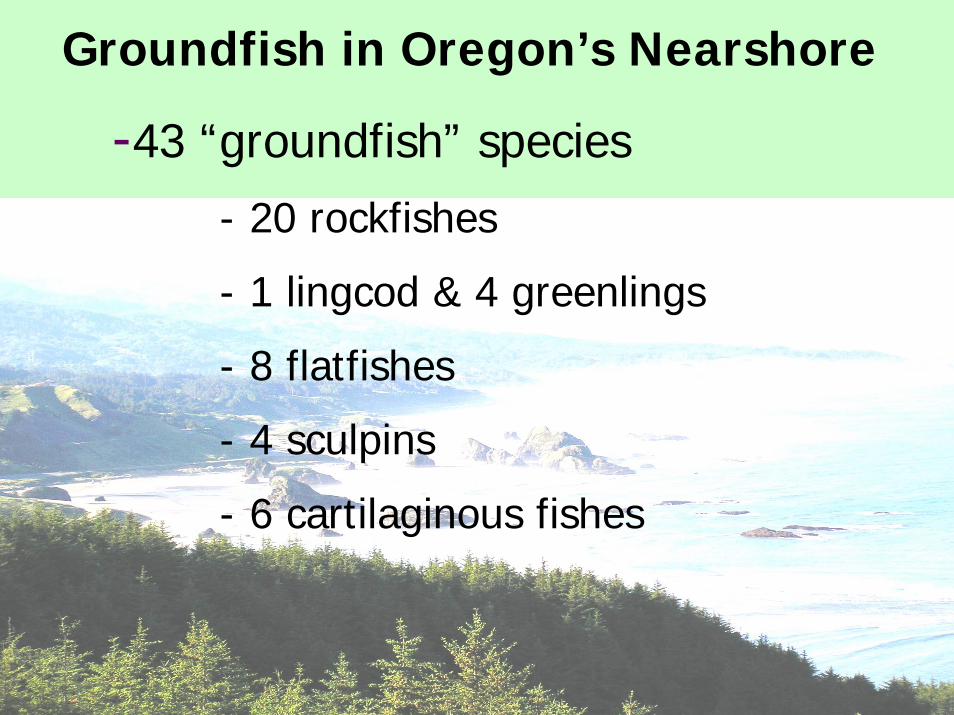
Groundfish in Oregon’s Nearshore
-43 “groundfish” species
- 20 rockfishes
- 1 lingcod & 4 greenlings
- 8 flatfishes
- 4 sculpins
- 6 cartilaginous fishes
1616
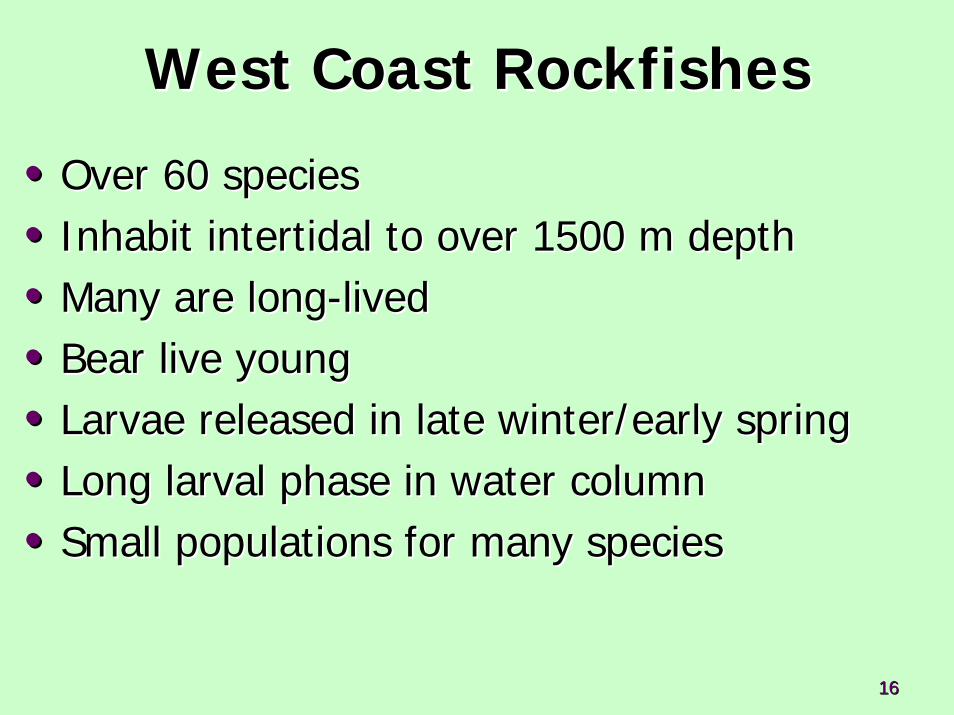
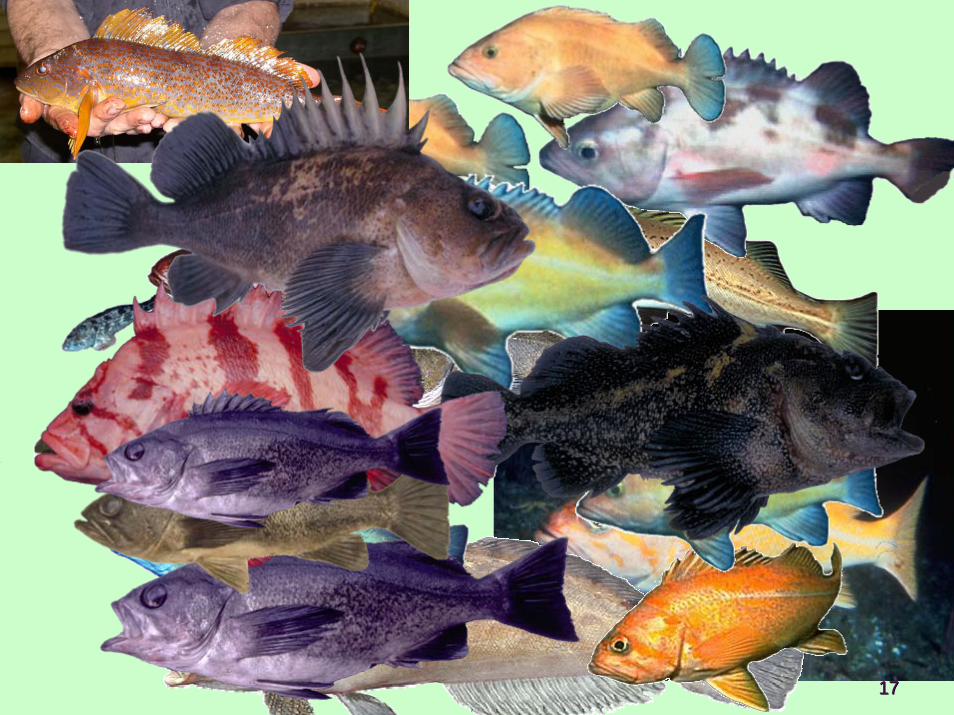
•• Over 60 speciesOver 60 species•• Inhabit Inhabit intertidalintertidal to over 1500 m depthto over 1500 m depth•• Many are longMany are long--livedlived•• Bear live youngBear live young•• Larvae released in late winter/early springLarvae released in late winter/early spring•• Long larval phase in water columnLong larval phase in water column•• Small populations for many speciesSmall populations for many species
West Coast RockfishesWest Coast Rockfishes
1717
1818
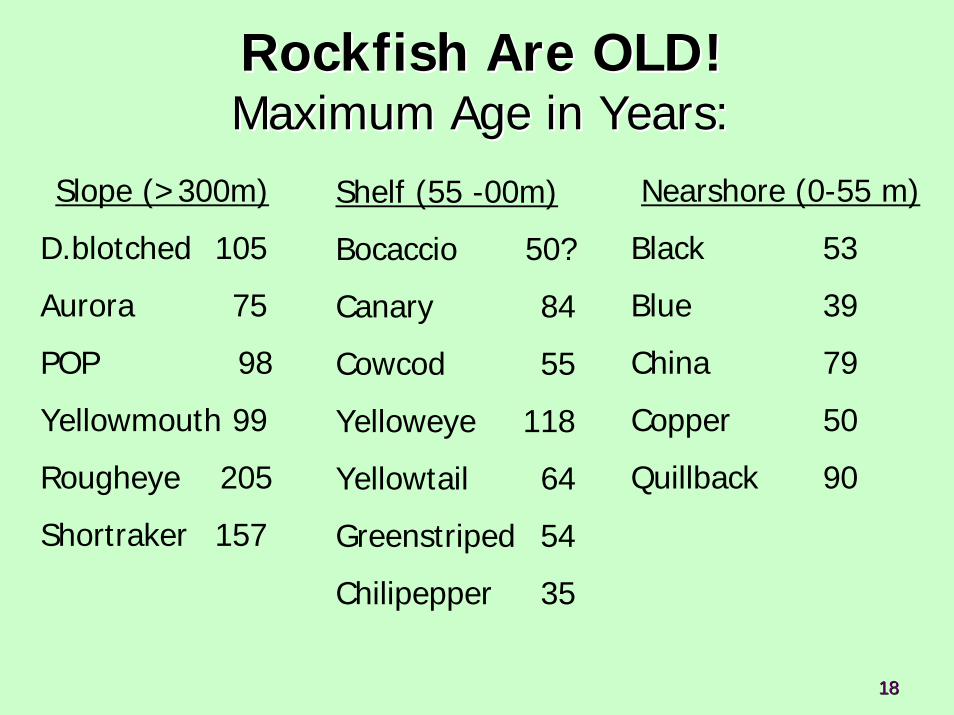
Rockfish Are OLD!Rockfish Are OLD!Maximum Age in Years:Maximum Age in Years:
Slope (>300m)
D.blotched 105
Aurora 75
POP 98
Yellowmouth 99
Rougheye 205
Shortraker 157
Shelf (55 -00m)
Bocaccio 50?
Canary 84
Cowcod 55
Yelloweye 118
Yellowtail 64
Greenstriped 54
Chilipepper 35
Nearshore (0-55 m)
Black 53
Blue 39
China 79
Copper 50
Quillback 90
1919
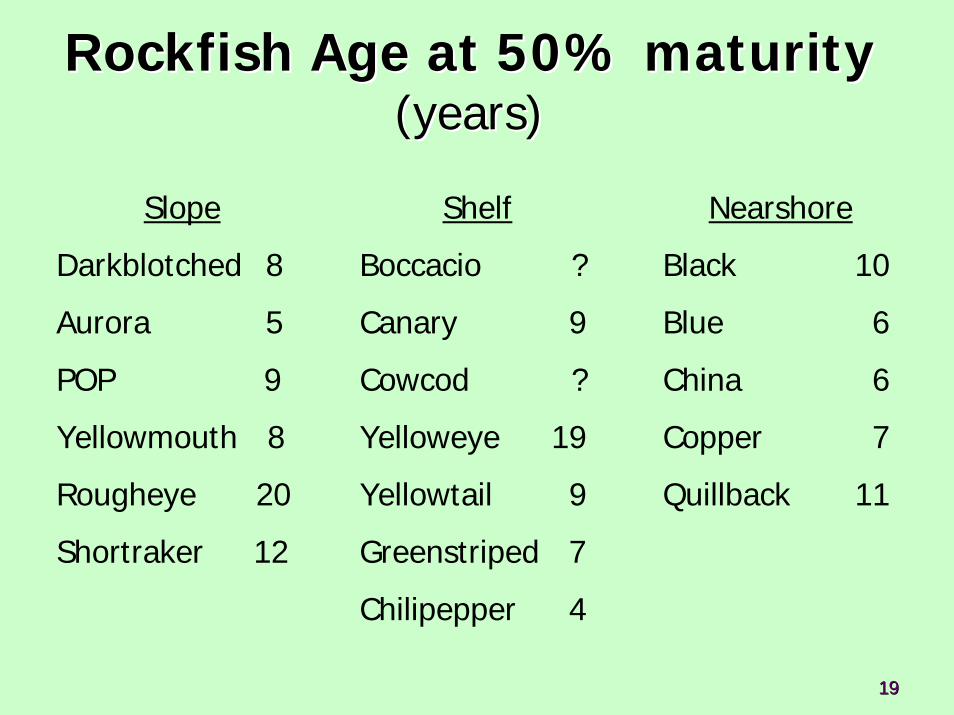
Rockfish Age at 50% maturityRockfish Age at 50% maturity(years)(years)
Slope
Darkblotched 8
Aurora 5
POP 9
Yellowmouth 8
Rougheye 20
Shortraker 12
Shelf
Boccacio ?
Canary 9
Cowcod ?
Yelloweye 19
Yellowtail 9
Greenstriped 7
Chilipepper 4
Nearshore
Black 10
Blue 6
China 6
Copper 7
Quillback 11
2020
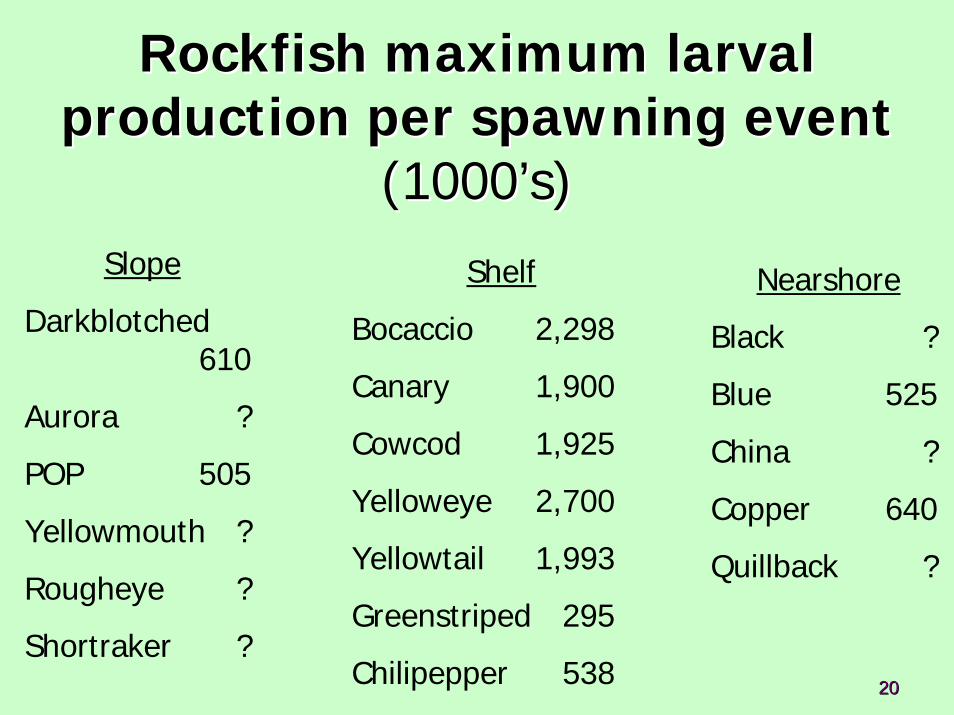
Rockfish maximum larval Rockfish maximum larval production per spawning eventproduction per spawning event
(1000(1000’’s)s)Slope
Darkblotched610
Aurora ?
POP 505
Yellowmouth ?
Rougheye ?
Shortraker ?
Shelf
Bocaccio 2,298
Canary 1,900
Cowcod 1,925
Yelloweye 2,700
Yellowtail 1,993
Greenstriped 295
Chilipepper 538
Nearshore
Black ?
Blue 525
China ?
Copper 640
Quillback ?
2121
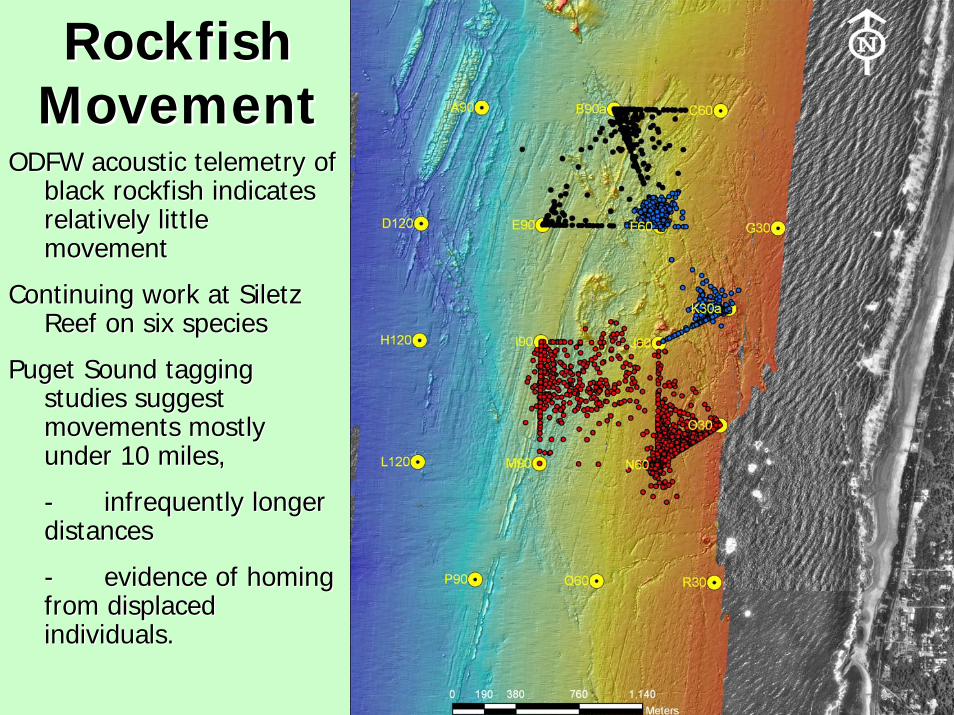
ODFW acoustic telemetry of ODFW acoustic telemetry of black rockfish indicates black rockfish indicates relatively little relatively little movementmovement
Continuing work at Siletz Continuing work at Siletz Reef on six speciesReef on six species
Puget Sound tagging Puget Sound tagging studies suggest studies suggest movements mostly movements mostly under 10 miles, under 10 miles,
-- infrequently longer infrequently longer distancesdistances
-- evidence of homing evidence of homing from displaced from displaced individuals.individuals.
Rockfish Rockfish MovementMovement
2222
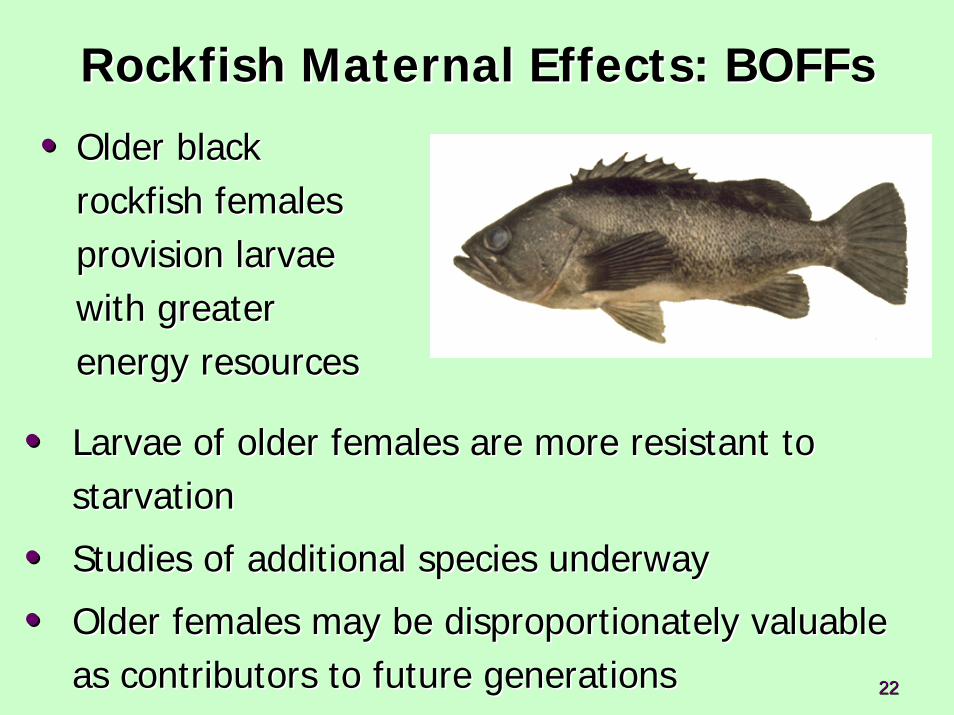
Rockfish Maternal Effects: Rockfish Maternal Effects: BOFFsBOFFs
•• Older black Older black rockfish females rockfish females provision larvae provision larvae with greater with greater energy resourcesenergy resources
•• Larvae of older females are more resistant to Larvae of older females are more resistant to starvationstarvation
•• Studies of additional species underwayStudies of additional species underway
•• Older females may be disproportionately valuable Older females may be disproportionately valuable as contributors to future generationsas contributors to future generations
2323
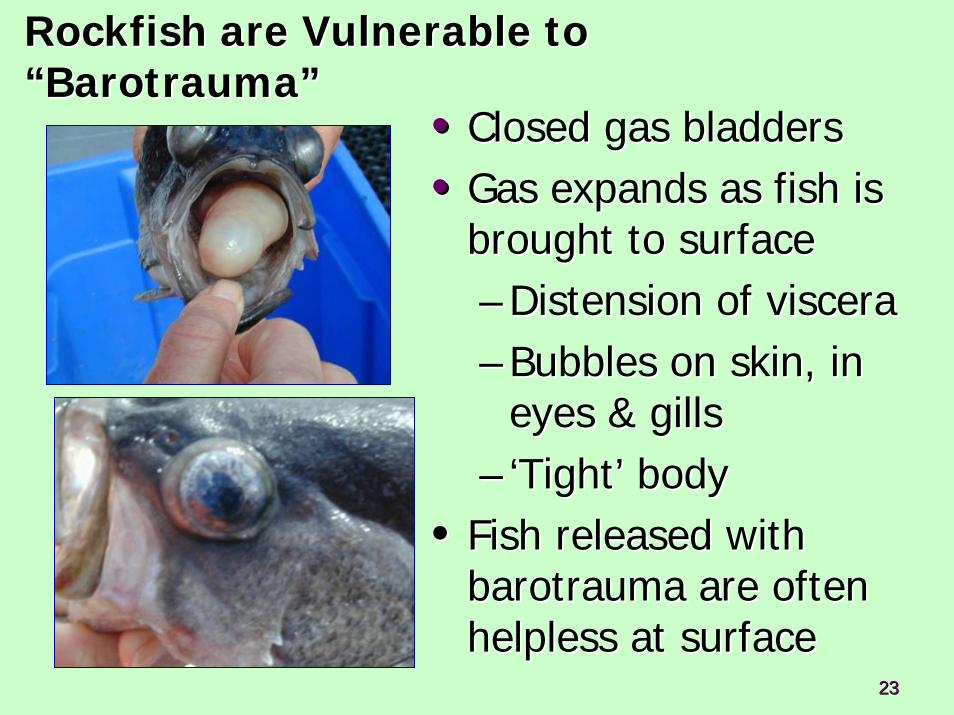
Rockfish are Vulnerable to Rockfish are Vulnerable to ““BarotraumaBarotrauma””
•• Closed gas bladdersClosed gas bladders•• Gas expands as fish is Gas expands as fish is
brought to surfacebrought to surface–– Distension of visceraDistension of viscera–– Bubbles on skin, in Bubbles on skin, in
eyes & gillseyes & gills–– ‘‘TightTight’’ bodybody
•• Fish released with Fish released with barotraumabarotrauma are often are often helpless at surfacehelpless at surface
2424
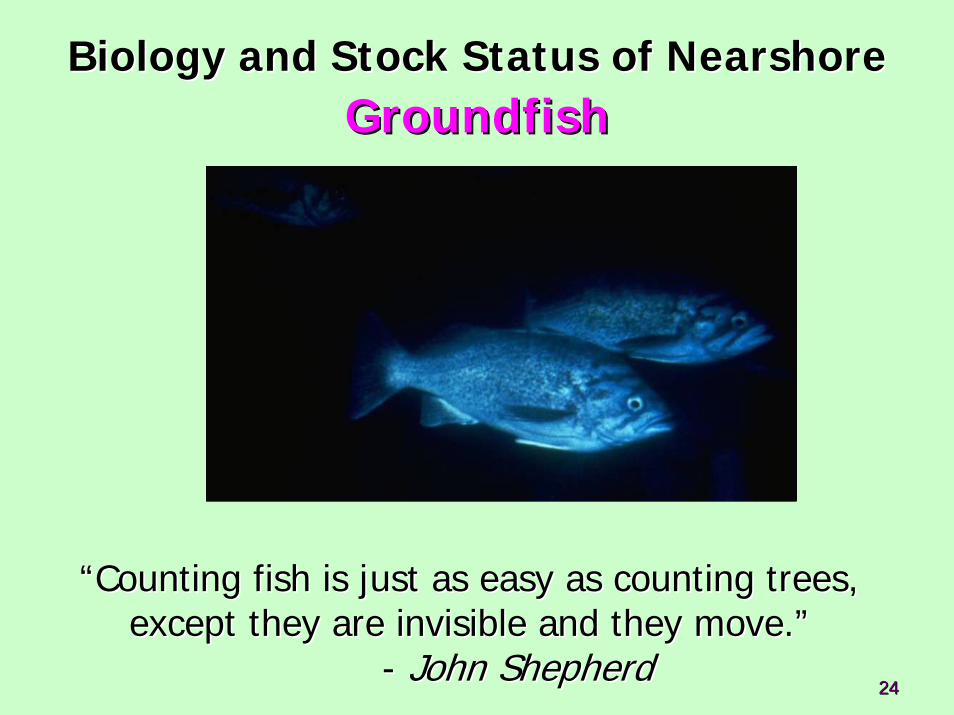
Biology and Stock Status of Biology and Stock Status of NearshoreNearshoreGroundfishGroundfish
““Counting fish is just as easy as counting trees, Counting fish is just as easy as counting trees, except they are invisible and they move.except they are invisible and they move.””
-- John ShepherdJohn Shepherd
2525
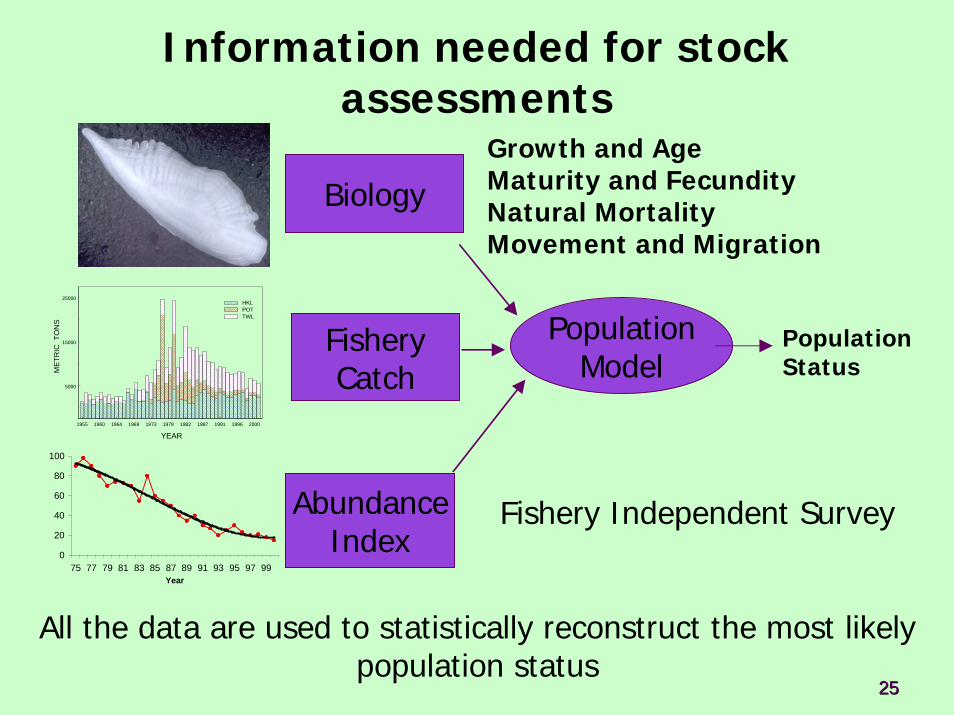
All the data are used to statistically reconstruct the most likely population status
Biology
FisheryCatch
PopulationModel
AbundanceIndex
1955 1960 1964 1969 1973 1978 1982 1987 1991 1996 2000
YEAR
5000
15000
25000
MET
RIC
TO
NS
HKLPOTTWL
Fishery Independent Survey
PopulationStatus
0
20
40
60
80
100
75 77 79 81 83 85 87 89 91 93 95 97 99Year
Growth and AgeMaturity and FecundityNatural MortalityMovement and Migration
Information needed for stock assessments
2626
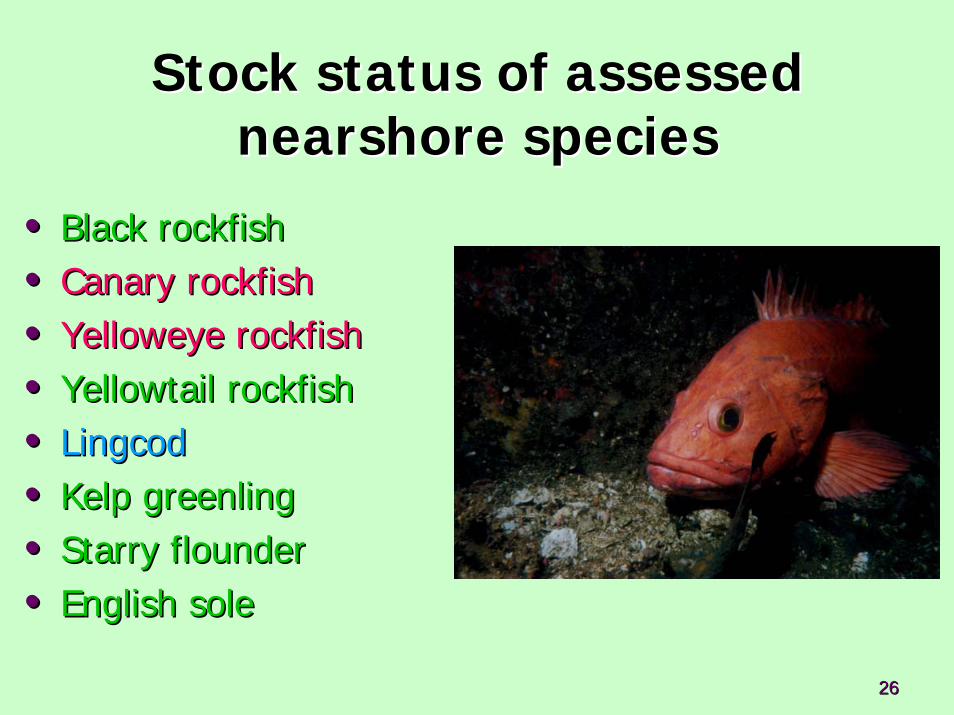
•• Black rockfishBlack rockfish•• Canary rockfishCanary rockfish•• YelloweyeYelloweye rockfishrockfish•• Yellowtail rockfishYellowtail rockfish•• LingcodLingcod•• Kelp greenlingKelp greenling•• Starry flounderStarry flounder•• English soleEnglish sole
Stock status of assessed Stock status of assessed nearshore speciesnearshore species
2727
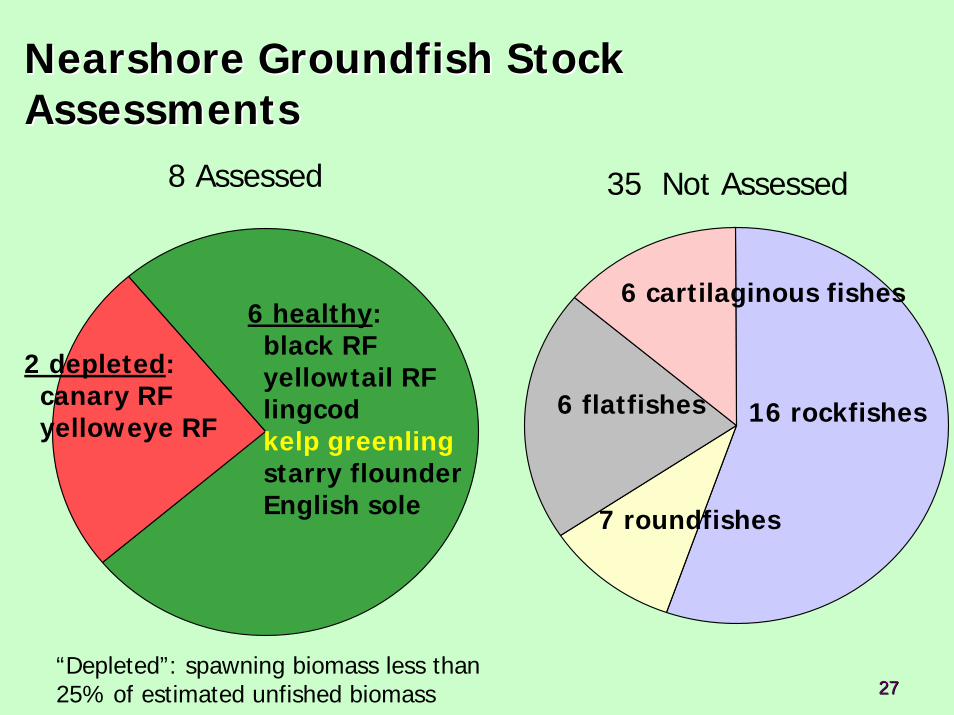
NearshoreNearshore GroundfishGroundfish Stock Stock AssessmentsAssessments
6 healthy:black RFyellowtail RFlingcodkelp greenlingstarry flounderEnglish sole
2 depleted:canary RFyelloweye RF 16 rockfishes6 flatfishes
7 roundfishes
6 cartilaginous fishes
35 Not Assessed8 Assessed
“Depleted”: spawning biomass less than 25% of estimated unfished biomass
2828
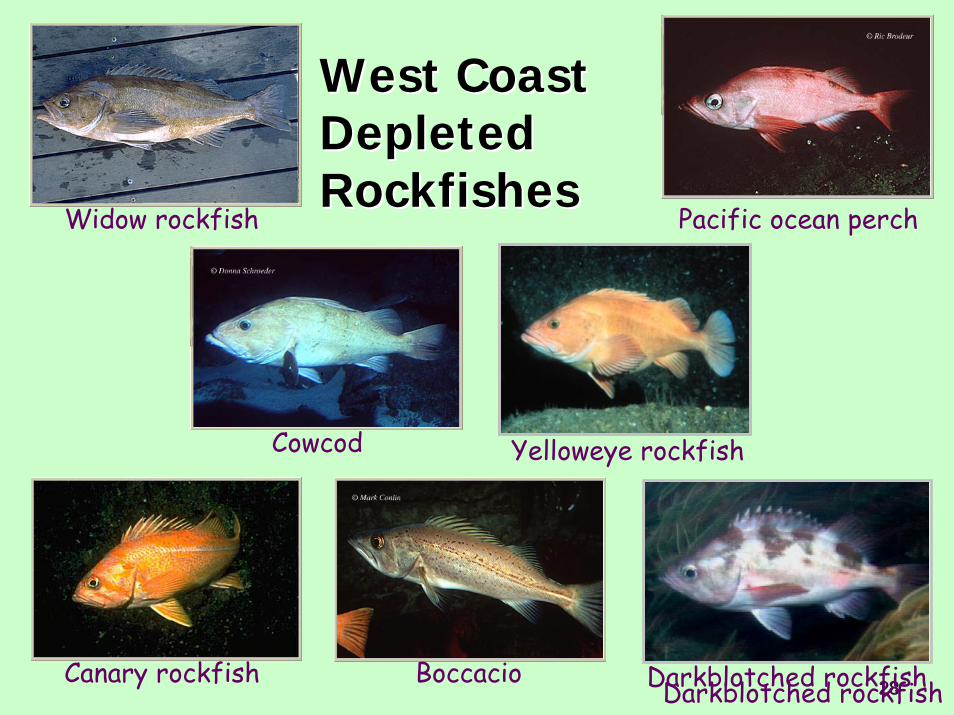
West CoastWest CoastDepleted Depleted RockfishesRockfishes
Widow rockfish
Cowcod
Canary rockfish Boccacio Darkblotched rockfish
Pacific ocean perch
Yelloweye rockfish
Darkblotched rockfish
2929
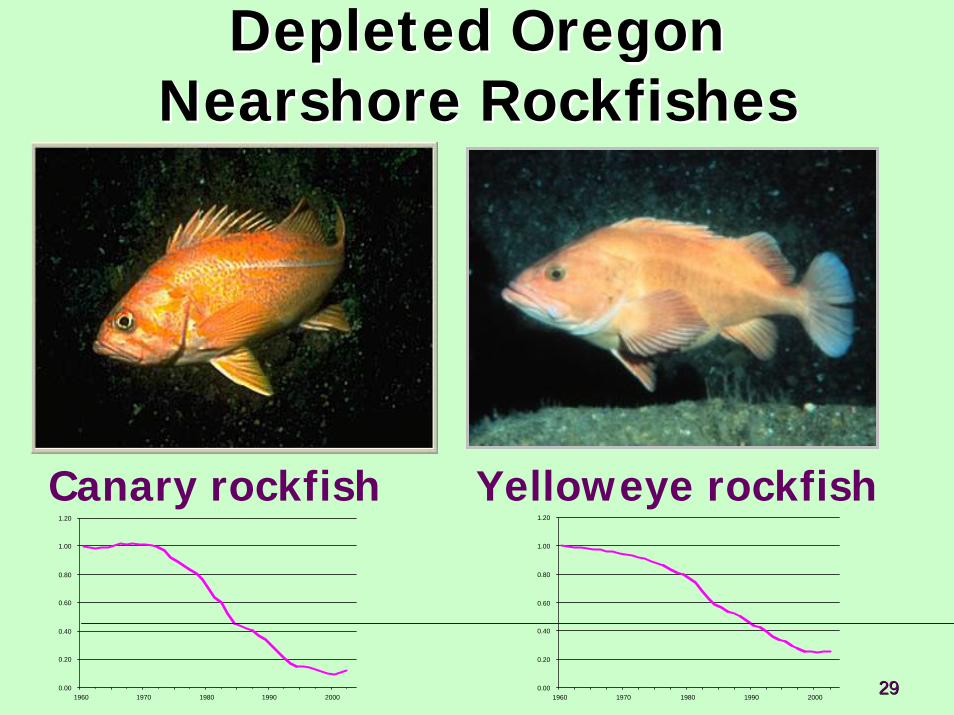
Depleted Oregon Depleted Oregon NearshoreNearshore RockfishesRockfishes
Canary rockfish Yelloweye rockfish
0.00
0.20
0.40
0.60
0.80
1.00
1.20
1960 1970 1980 1990 20000.00
0.20
0.40
0.60
0.80
1.00
1.20
1960 1970 1980 1990 2000
3030
••We know the basics for most We know the basics for most groups, but very little compared groups, but very little compared to whatto what’’s needed for a current s needed for a current approvable stock assessmentapprovable stock assessment
3131
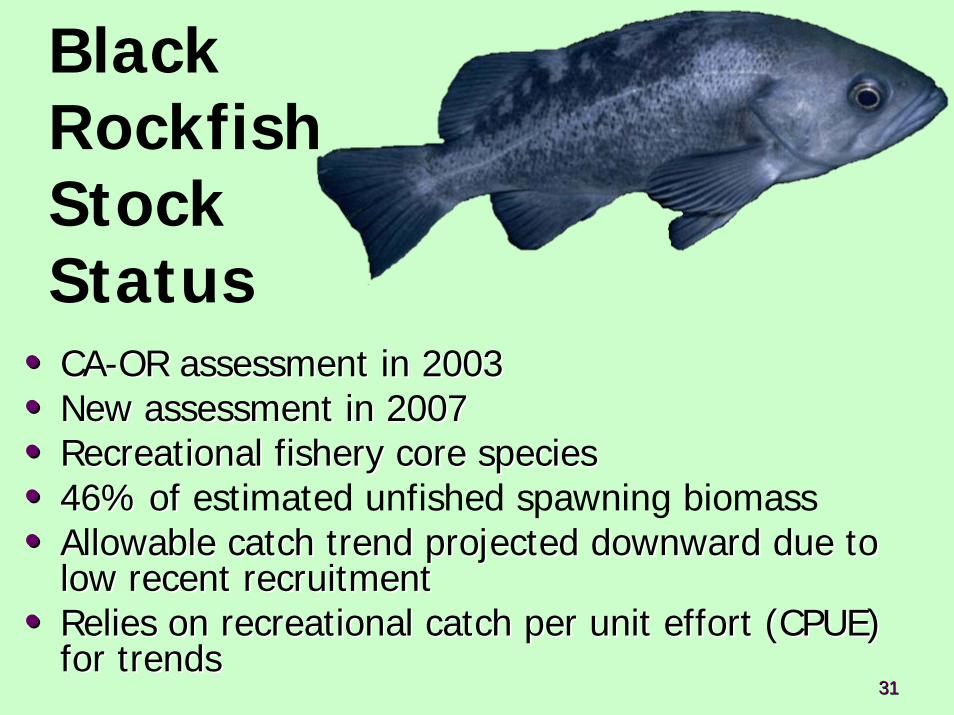
Black Rockfish Stock Status
•• CACA--OR assessment in 2003OR assessment in 2003•• New assessment in 2007New assessment in 2007•• Recreational fishery core speciesRecreational fishery core species•• 46% of 46% of estimated unfished spawning biomass•• Allowable catch trend projected downward due to Allowable catch trend projected downward due to
low recent recruitmentlow recent recruitment•• Relies on recreational catch per unit effort (CPUE) Relies on recreational catch per unit effort (CPUE)
for trendsfor trends
3232
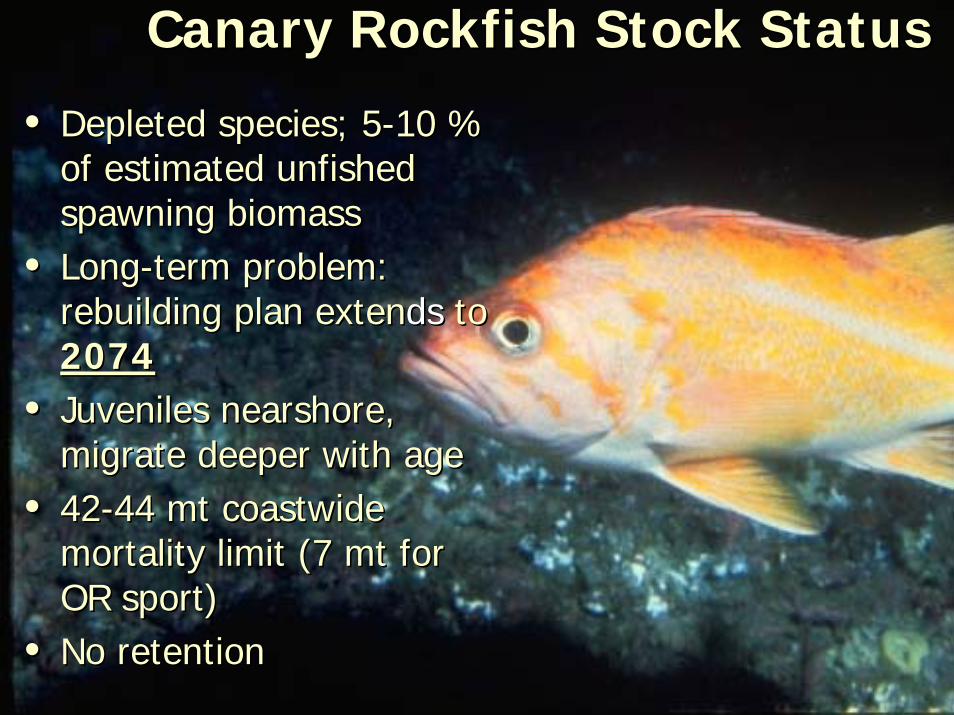
Canary Rockfish Stock StatusCanary Rockfish Stock Status
•• Depleted species; 5Depleted species; 5--10 % 10 % of estimated of estimated unfishedunfishedspawning biomass spawning biomass
•• LongLong--term problem: term problem: rebuilding plan extenrebuilding plan extends ds to to 20742074
•• Juveniles nearshore, Juveniles nearshore, migrate deeper with agemigrate deeper with age
•• 4242--44 44 mtmt coastwidecoastwidemortality limit (7 mortality limit (7 mtmt for for OR sport) OR sport)
•• No retentionNo retention
3333
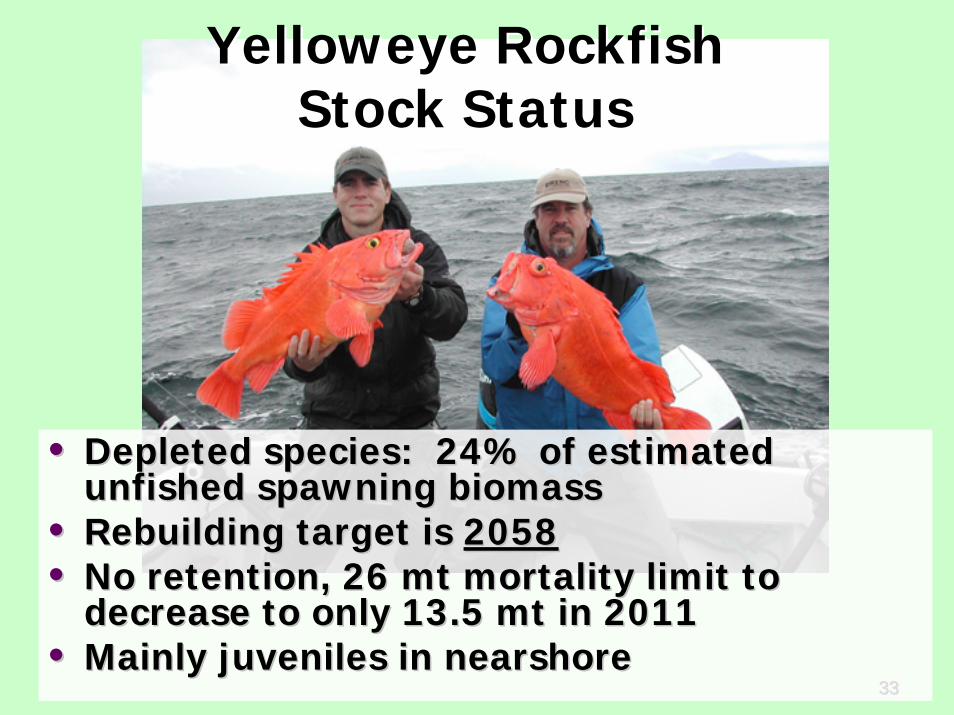
YelloweyeYelloweye Rockfish Rockfish Stock StatusStock Status
•• Depleted species: 24% of estimated Depleted species: 24% of estimated unfishedunfished spawning biomass spawning biomass
•• Rebuilding target is Rebuilding target is 20582058•• No retention, 26 No retention, 26 mtmt mortality limit to mortality limit to
decrease to only 13.5 decrease to only 13.5 mtmt in 2011in 2011•• Mainly juveniles in Mainly juveniles in nearshorenearshore
3434
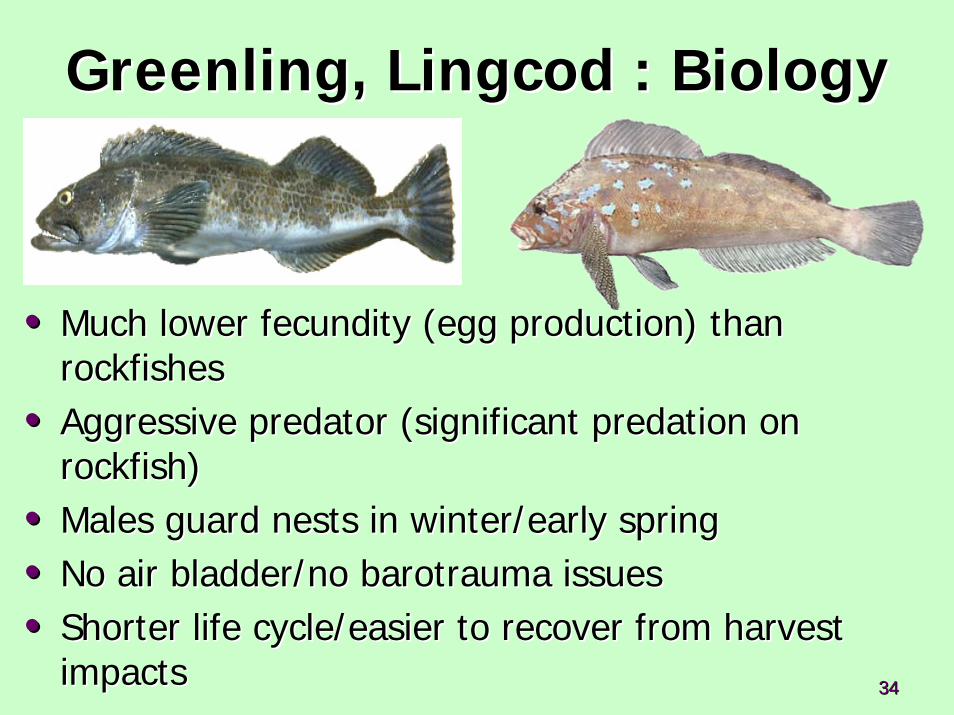
Greenling, Lingcod : BiologyGreenling, Lingcod : Biology
•• Much lower fecundity (egg production) than Much lower fecundity (egg production) than rockfishesrockfishes
•• Aggressive predator (significant predation on Aggressive predator (significant predation on rockfish)rockfish)
•• Males guard nests in winter/early springMales guard nests in winter/early spring•• No air bladder/no No air bladder/no barotraumabarotrauma issuesissues•• Shorter life cycle/easier to recover from harvest Shorter life cycle/easier to recover from harvest
impactsimpacts
3535
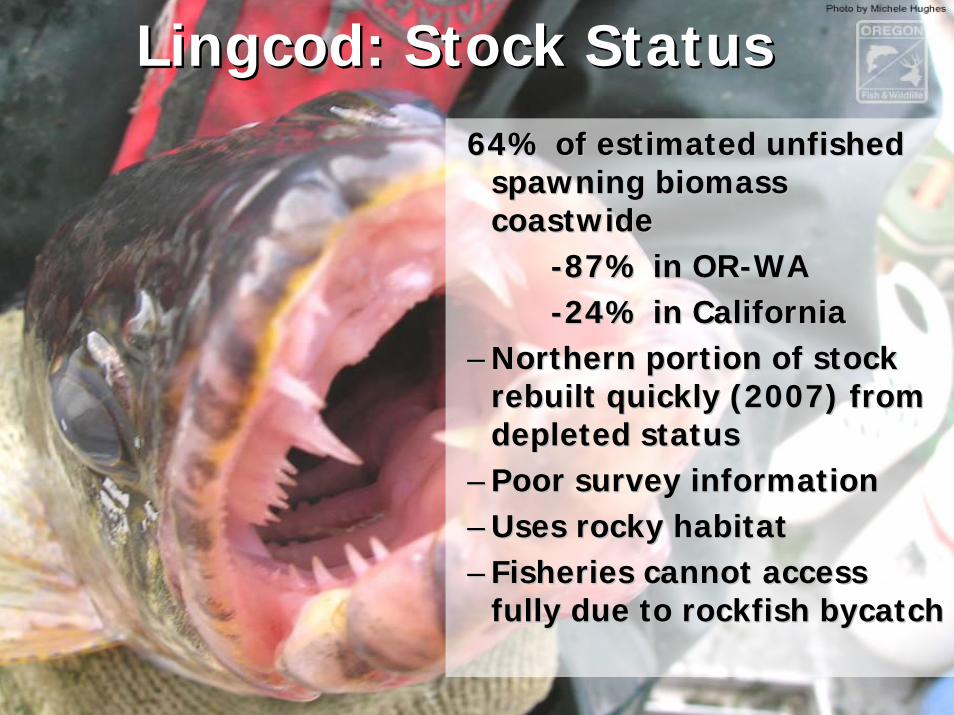
Lingcod: Stock StatusLingcod: Stock Status64% of estimated 64% of estimated unfishedunfished
spawning biomass spawning biomass coastwidecoastwide
--87% in OR87% in OR--WAWA--24% in California24% in California
–– Northern portion of stock Northern portion of stock rebuilt quickly (2007) from rebuilt quickly (2007) from depleted statusdepleted status
–– Poor survey informationPoor survey information–– Uses rocky habitatUses rocky habitat–– Fisheries cannot access Fisheries cannot access
fully due to rockfish fully due to rockfish bycatchbycatch
3636
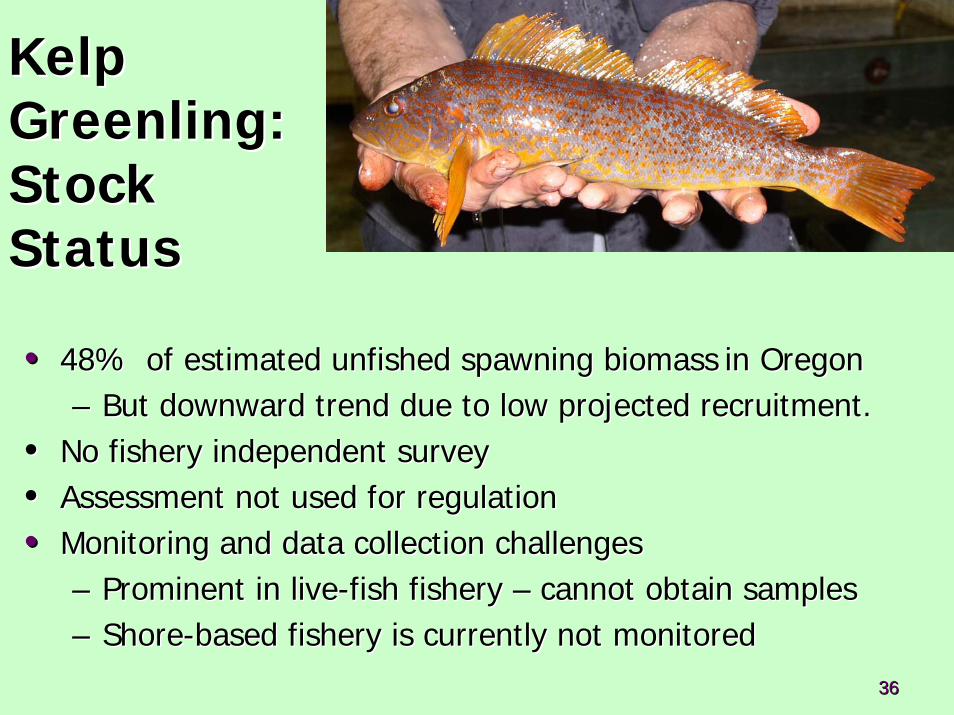
Kelp Kelp Greenling: Greenling: StockStockStatusStatus
•• 48% of estimated 48% of estimated unfishedunfished spawning biomassspawning biomass in Oregonin Oregon–– But downward trend due to low projected recruitment.But downward trend due to low projected recruitment.
•• No fishery independent surveyNo fishery independent survey•• Assessment not used for regulationAssessment not used for regulation•• Monitoring and data collection challengesMonitoring and data collection challenges
–– Prominent in liveProminent in live--fish fishery fish fishery –– cannot obtain samplescannot obtain samples–– ShoreShore--based fishery is currently not monitoredbased fishery is currently not monitored
3737
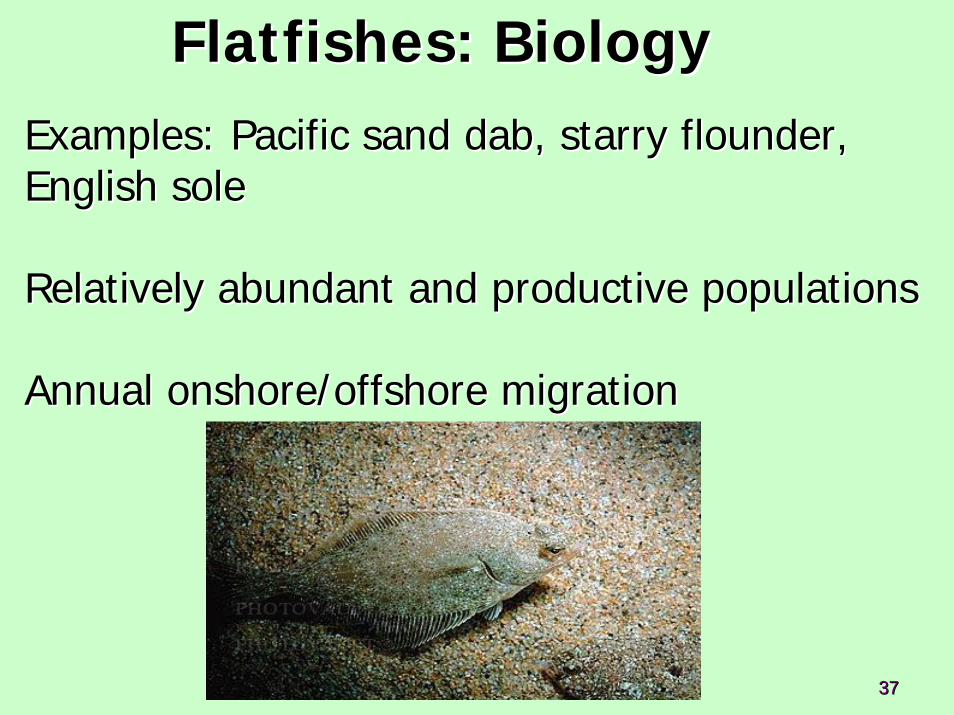
Flatfishes: BiologyFlatfishes: BiologyExamples: Pacific sand dab, starry flounder, Examples: Pacific sand dab, starry flounder, English soleEnglish sole
Relatively abundant and productive populations Relatively abundant and productive populations
Annual onshore/offshore migrationAnnual onshore/offshore migration
3838
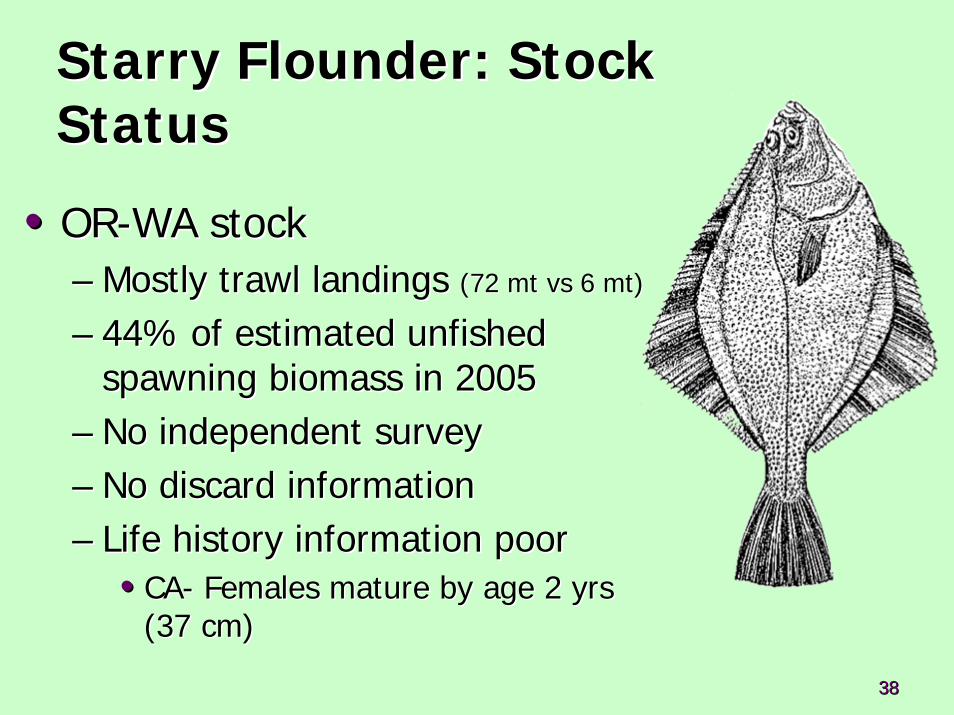
Starry Flounder: Stock Starry Flounder: Stock StatusStatus
•• OROR--WA stockWA stock–– Mostly trawl landings Mostly trawl landings (72 (72 mtmt vsvs 6 6 mtmt))
–– 44% of estimated 44% of estimated unfishedunfishedspawning biomass in 2005spawning biomass in 2005
–– No independent surveyNo independent survey–– No discard informationNo discard information–– Life history information poorLife history information poor
•• CACA-- Females mature by age 2 yrs Females mature by age 2 yrs (37 cm)(37 cm)
3939
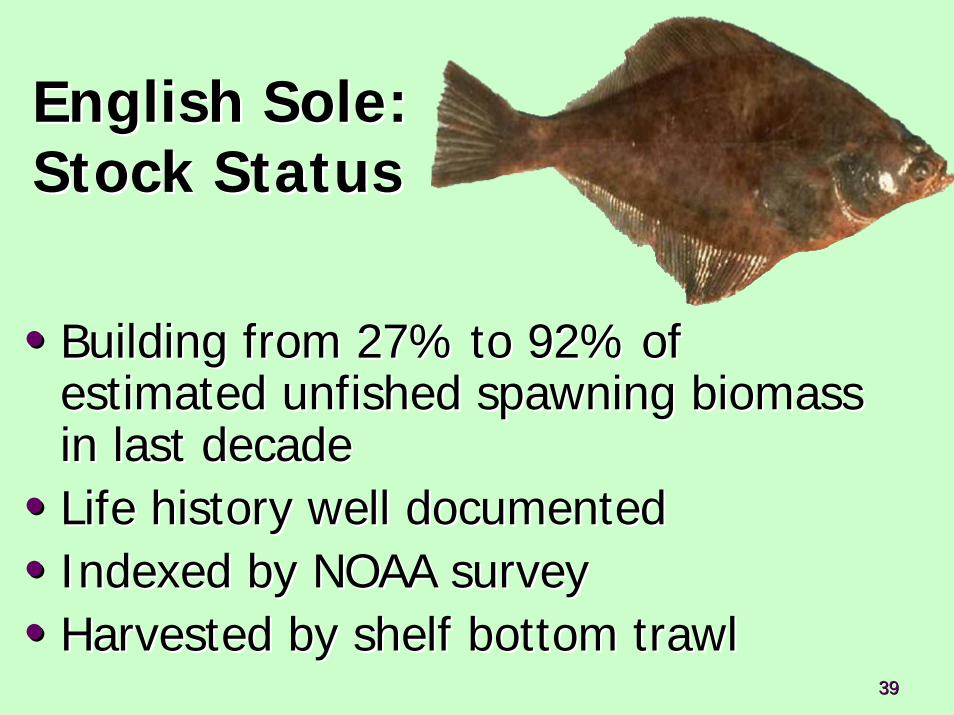
English Sole: English Sole: Stock StatusStock Status
•• Building from 27% to 92% of Building from 27% to 92% of estimated estimated unfishedunfished spawning biomass spawning biomass in last decadein last decade
•• Life history well documentedLife history well documented•• Indexed by NOAA surveyIndexed by NOAA survey•• Harvested by shelf bottom trawlHarvested by shelf bottom trawl
4040
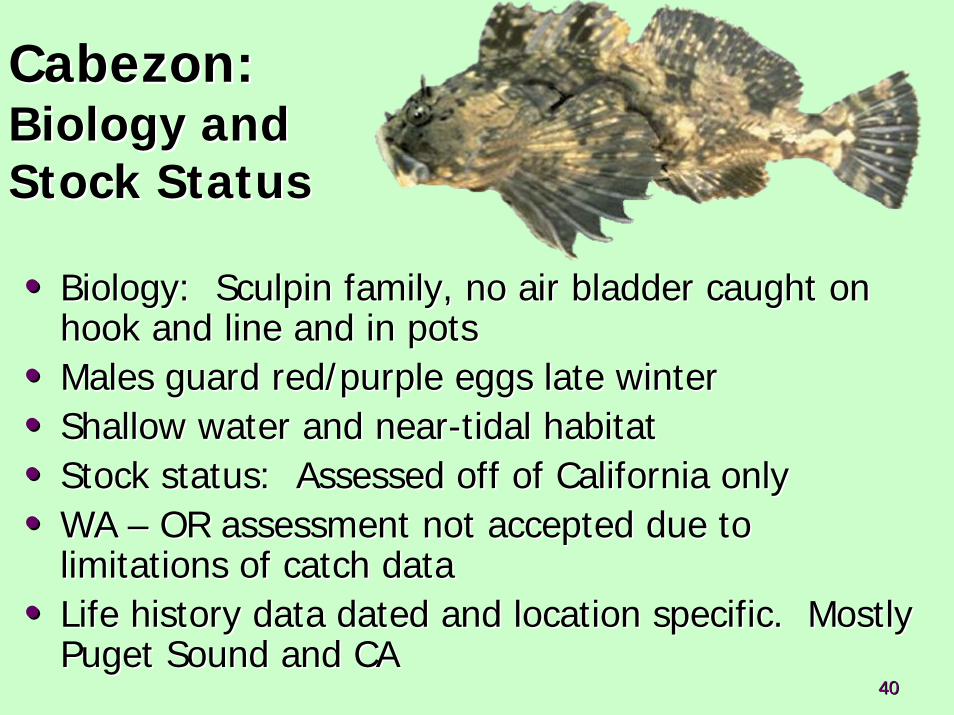
CabezonCabezon::Biology and Biology and Stock StatusStock Status
•• Biology: Biology: SculpinSculpin family, no air bladder caught on family, no air bladder caught on hook and line and in potshook and line and in pots
•• Males guard red/purple eggs late winterMales guard red/purple eggs late winter•• Shallow water and nearShallow water and near--tidal habitattidal habitat•• Stock status: Assessed off of California onlyStock status: Assessed off of California only•• WA WA –– OR assessment not accepted due to OR assessment not accepted due to
limitations of catch datalimitations of catch data•• Life history data dated and location specific. Mostly Life history data dated and location specific. Mostly
Puget Sound and CAPuget Sound and CA
4141
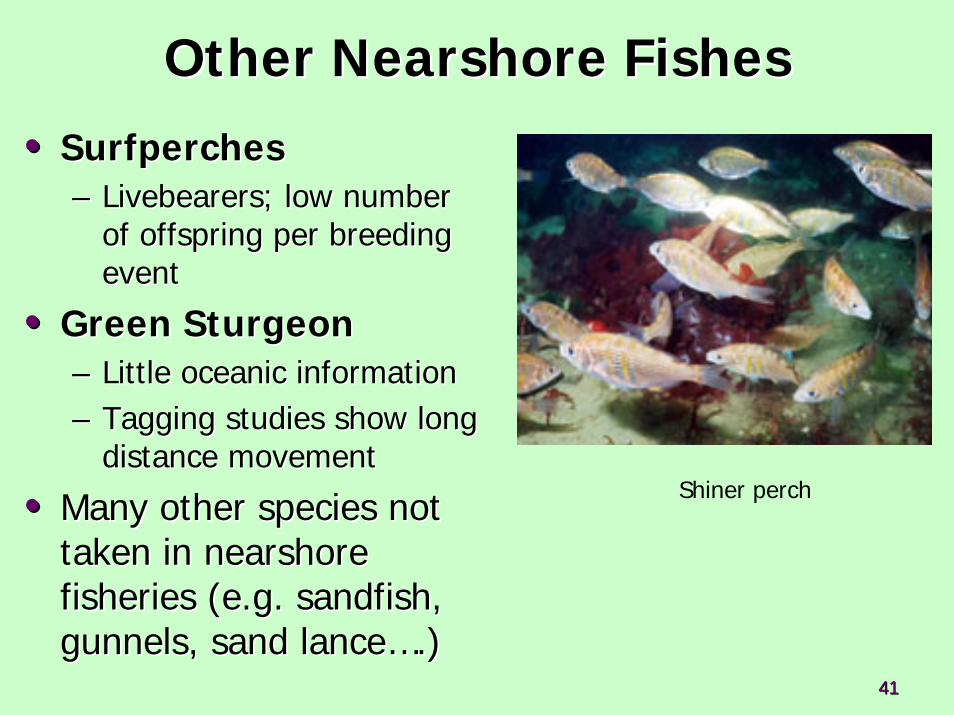
Other Other NearshoreNearshore FishesFishes
•• SurfperchesSurfperches–– Livebearers; low number Livebearers; low number
of offspring per breeding of offspring per breeding eventevent
•• Green SturgeonGreen Sturgeon–– Little oceanic informationLittle oceanic information–– Tagging studies show long Tagging studies show long
distance movementdistance movement
•• Many other species not Many other species not taken in taken in nearshorenearshorefisheries (e.g. sandfish, fisheries (e.g. sandfish, gunnels, sand lancegunnels, sand lance…….).)
Shiner perch
4242
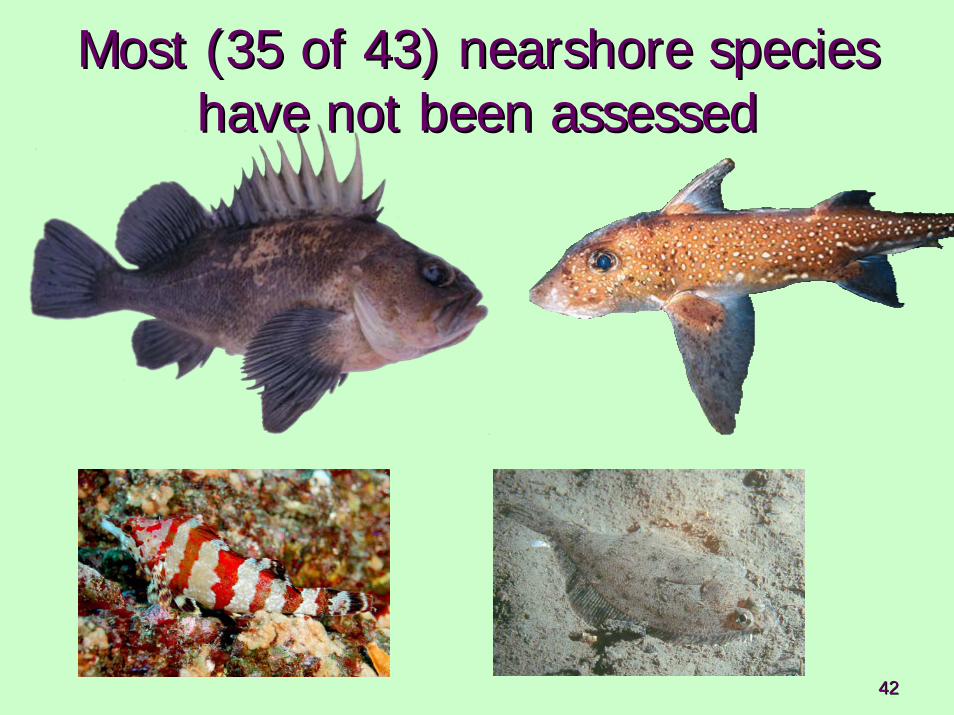
Most (35 of 43) Most (35 of 43) nearshorenearshore species species have not been assessedhave not been assessed
4343
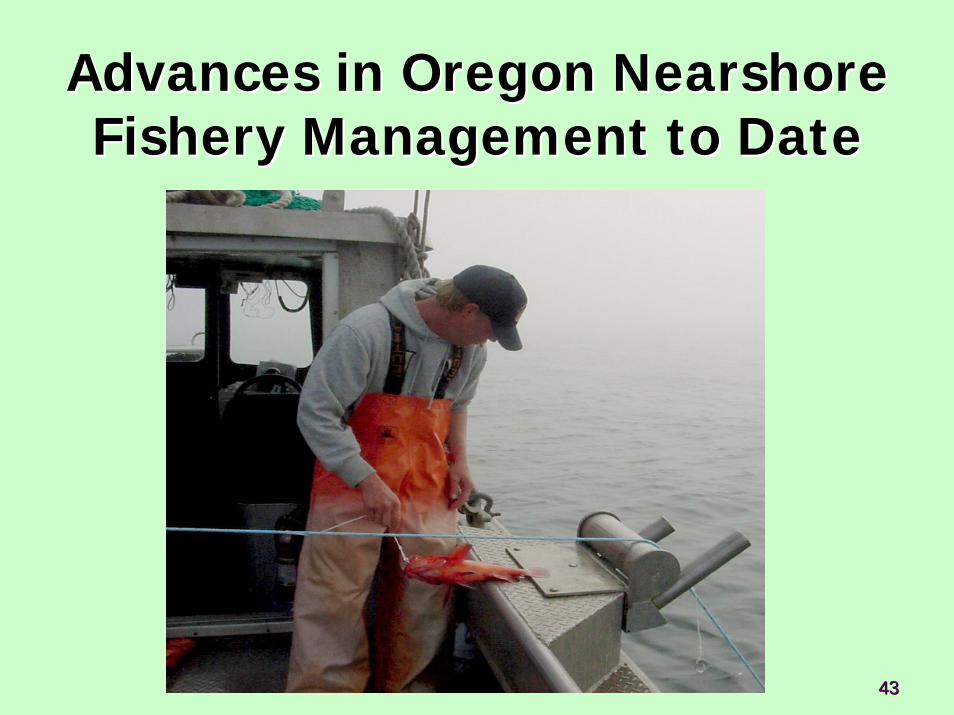
Advances in Oregon Advances in Oregon NearshoreNearshoreFishery Management to DateFishery Management to Date
4444
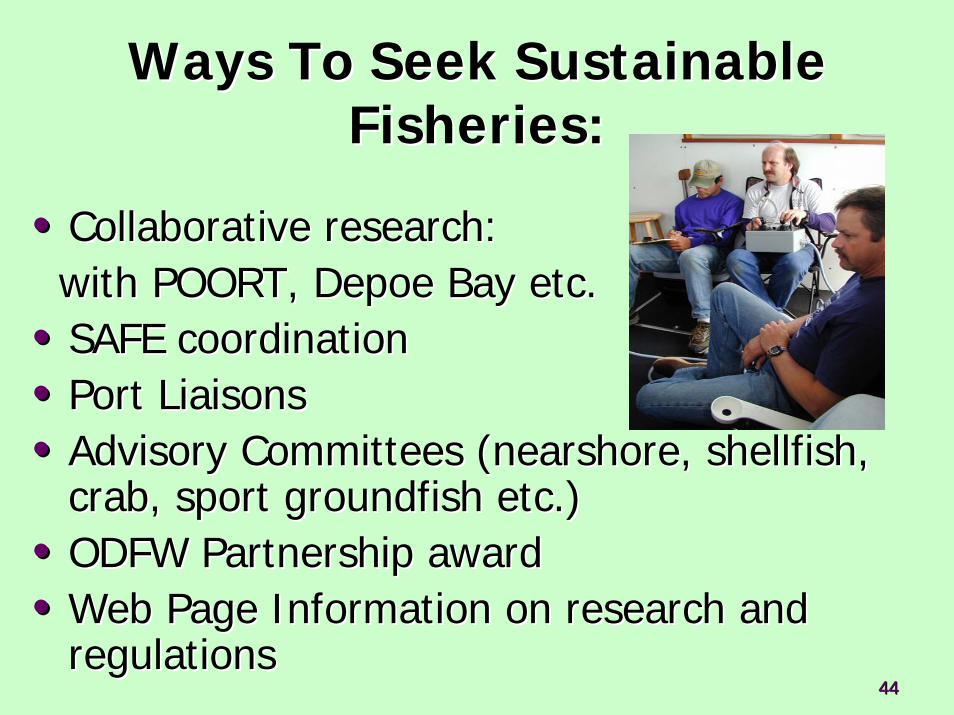
Ways To Seek Sustainable Ways To Seek Sustainable Fisheries: Fisheries:
•• Collaborative research:Collaborative research:with POORT, Depoe Bay etc.with POORT, Depoe Bay etc.
•• SAFE coordinationSAFE coordination•• Port LiaisonsPort Liaisons•• Advisory Committees (Advisory Committees (nearshorenearshore, shellfish, , shellfish,
crab, sport crab, sport groundfishgroundfish etc.)etc.)•• ODFW Partnership awardODFW Partnership award•• Web Page Information on research and Web Page Information on research and
regulationsregulations
4545
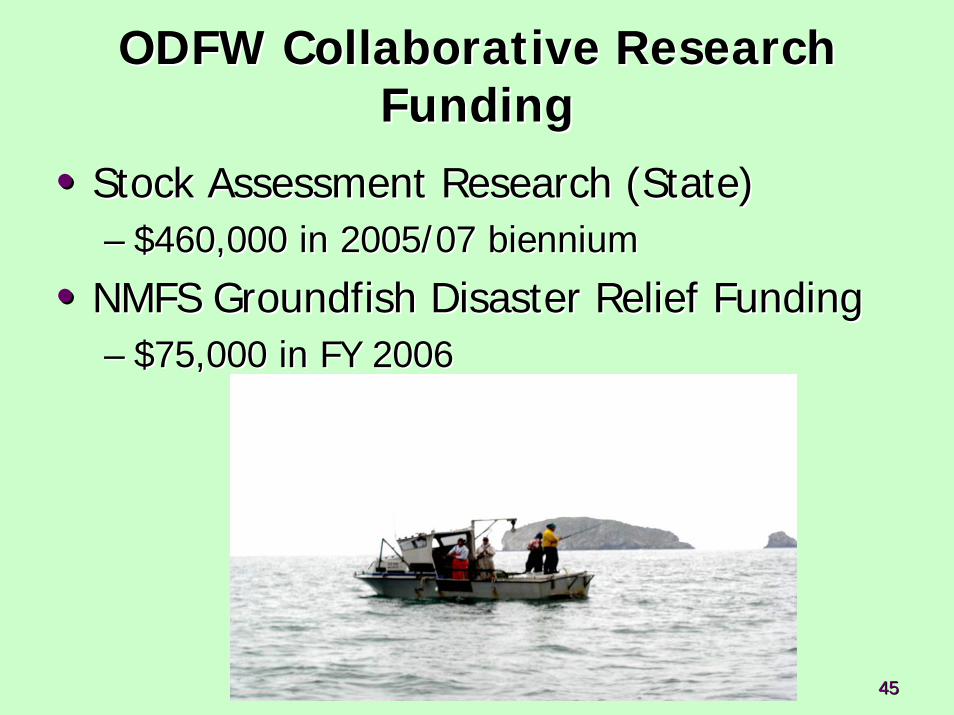
ODFW Collaborative Research ODFW Collaborative Research FundingFunding
•• Stock Assessment Research (State) Stock Assessment Research (State) –– $460,000 in 2005/07 biennium$460,000 in 2005/07 biennium
•• NMFS NMFS GroundfishGroundfish Disaster Relief Funding Disaster Relief Funding –– $75,000 in FY 2006 $75,000 in FY 2006
4646
ODFW Research in Support of ODFW Research in Support of Fisheries ManagementFisheries Management
•• Oregon is a leader in gear research and Oregon is a leader in gear research and bycatchbycatch reduction research on the West reduction research on the West Coast.Coast.
•• Innovations start with cooperative Innovations start with cooperative research partnering research partnering fishermensfishermens’’ and gearand gear--makersmakers’’ expertise with testing and expertise with testing and evaluation by ODFW scientistsevaluation by ODFW scientists
4747
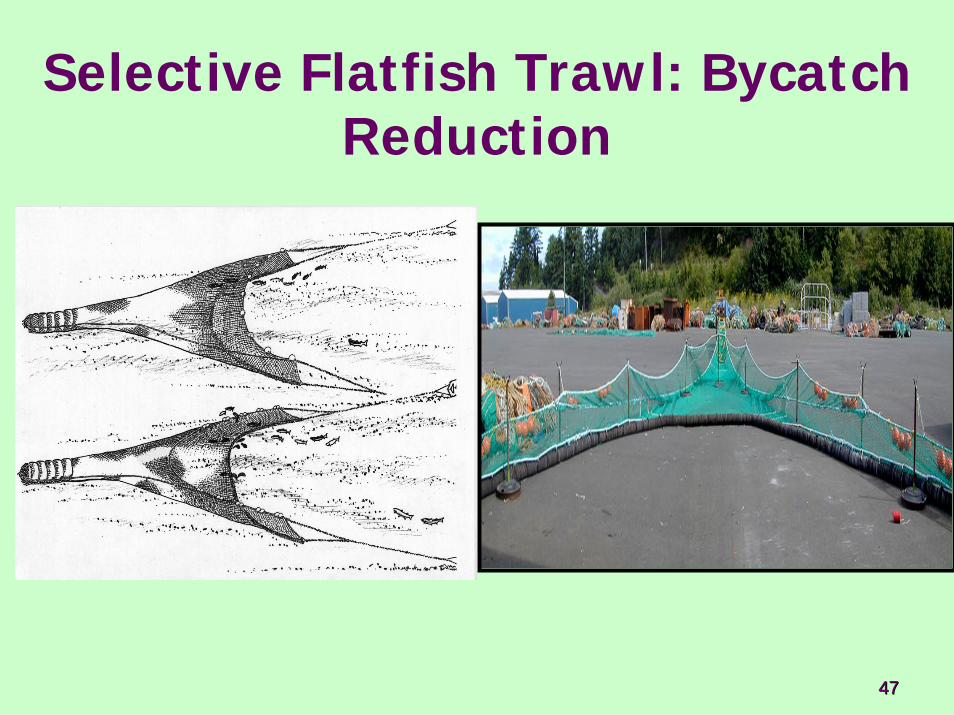
Selective Flatfish Trawl: BycatchReduction
4848
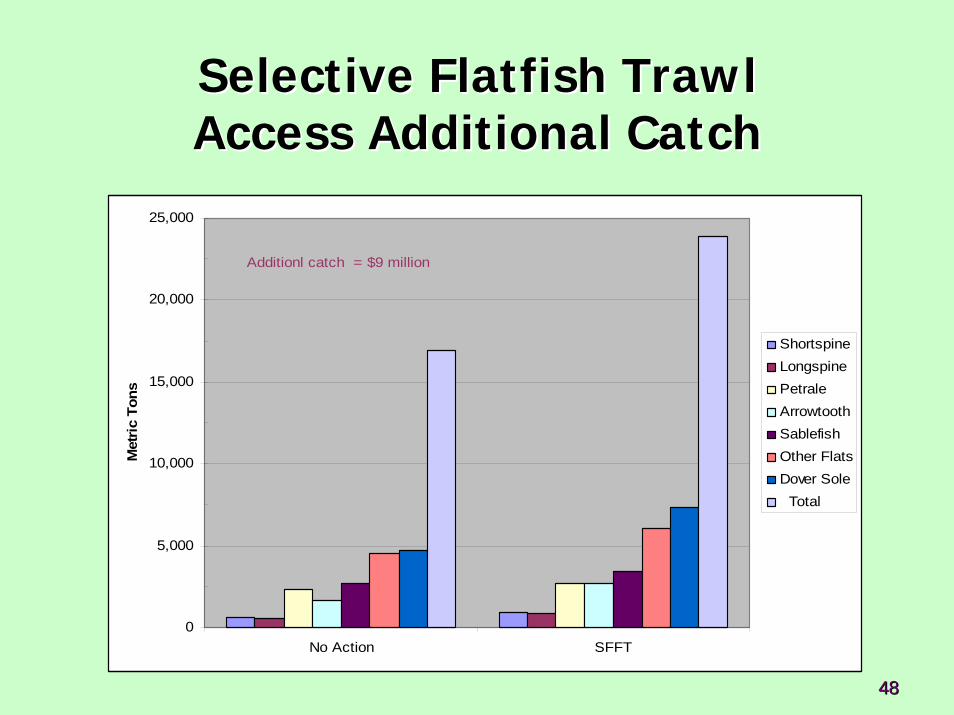
Selective Flatfish TrawlSelective Flatfish TrawlAccess Additional CatchAccess Additional Catch
0
5,000
10,000
15,000
20,000
25,000
No Action SFFT
Met
ric T
ons
ShortspineLongspinePetraleArrowtoothSablefishOther FlatsDover Sole Total
Additionl catch = $9 million
4949
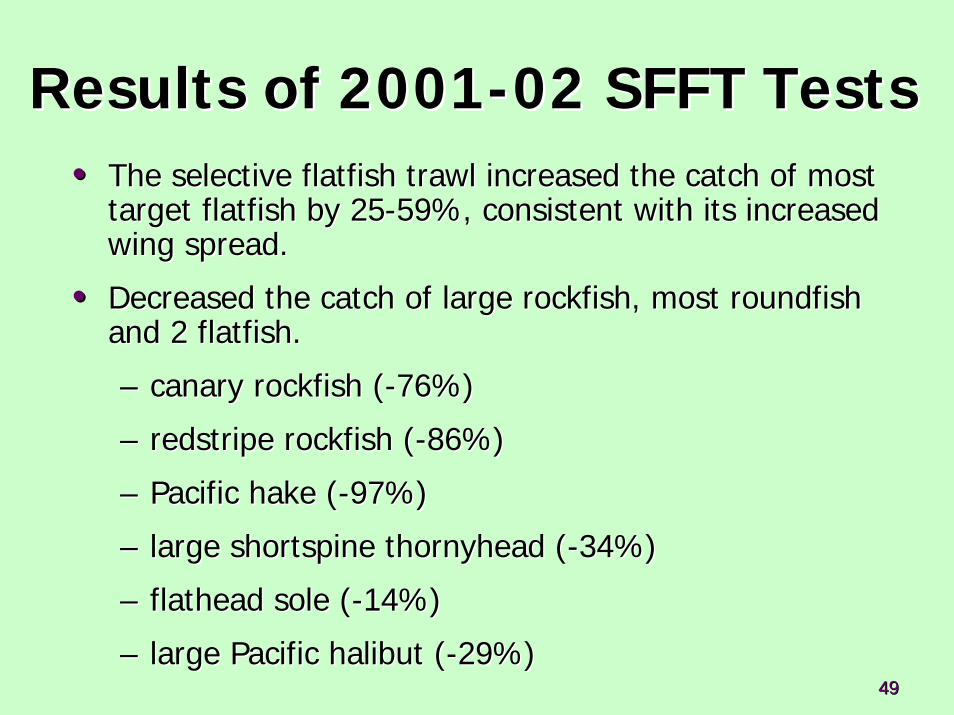
Results of 2001Results of 2001--02 SFFT Tests02 SFFT Tests•• The selective flatfish trawl increased the catch of most The selective flatfish trawl increased the catch of most
target flatfish by 25target flatfish by 25--59%, consistent with its increased 59%, consistent with its increased wing spread.wing spread.
•• Decreased the catch of large rockfish, most Decreased the catch of large rockfish, most roundfishroundfishand 2 flatfish.and 2 flatfish.
–– canary rockfish (canary rockfish (--76%) 76%)
–– redstriperedstripe rockfish (rockfish (--86%) 86%)
–– Pacific hake (Pacific hake (--97%) 97%)
–– large large shortspineshortspine thornyheadthornyhead ((--34%) 34%)
–– flathead sole (flathead sole (--14%)14%)
–– large Pacific halibut (large Pacific halibut (--29%)29%)
5050
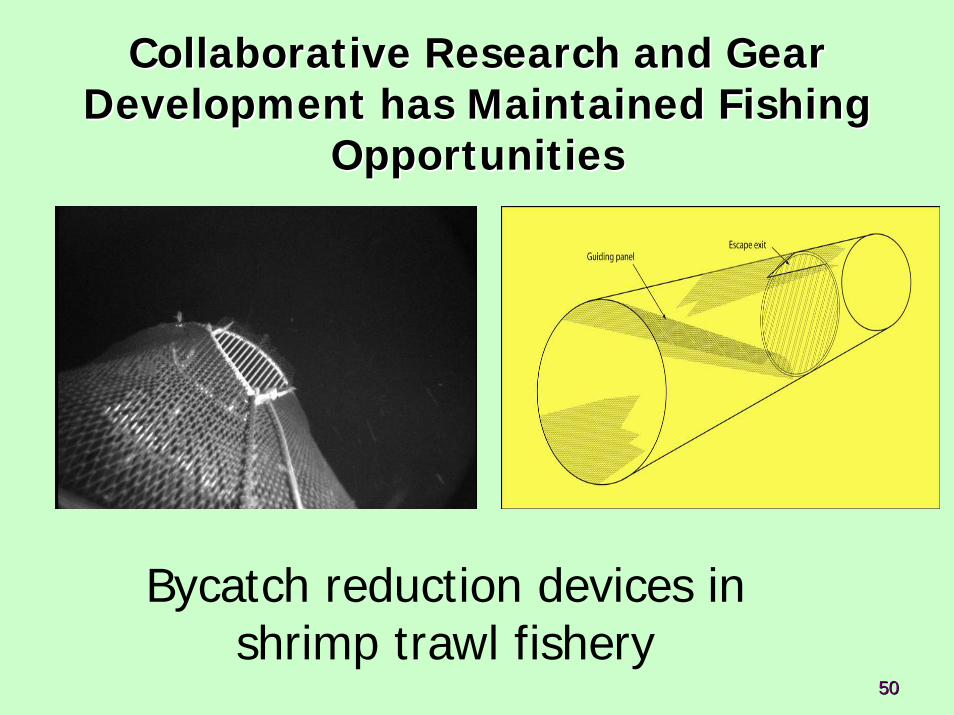
Collaborative Research and Gear Collaborative Research and Gear Development has Maintained Fishing Development has Maintained Fishing
OpportunitiesOpportunities
Bycatch reduction devices in shrimp trawl fishery
5151
5252
5353
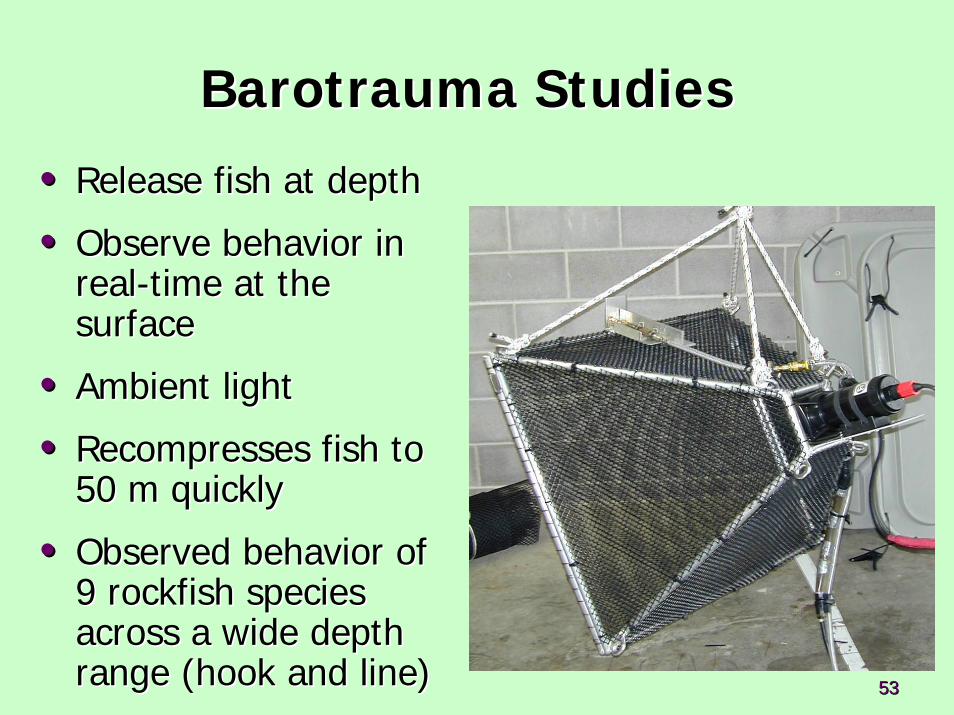
BarotraumaBarotrauma StudiesStudies
•• Release fish at depthRelease fish at depth
•• Observe behavior in Observe behavior in realreal--time at the time at the surfacesurface
•• Ambient light Ambient light
•• Recompresses fish to Recompresses fish to 50 m quickly50 m quickly
•• Observed behavior of Observed behavior of 9 rockfish species 9 rockfish species across a wide depth across a wide depth range (hook and line)range (hook and line)

5454
Movietagged.wmv
5555
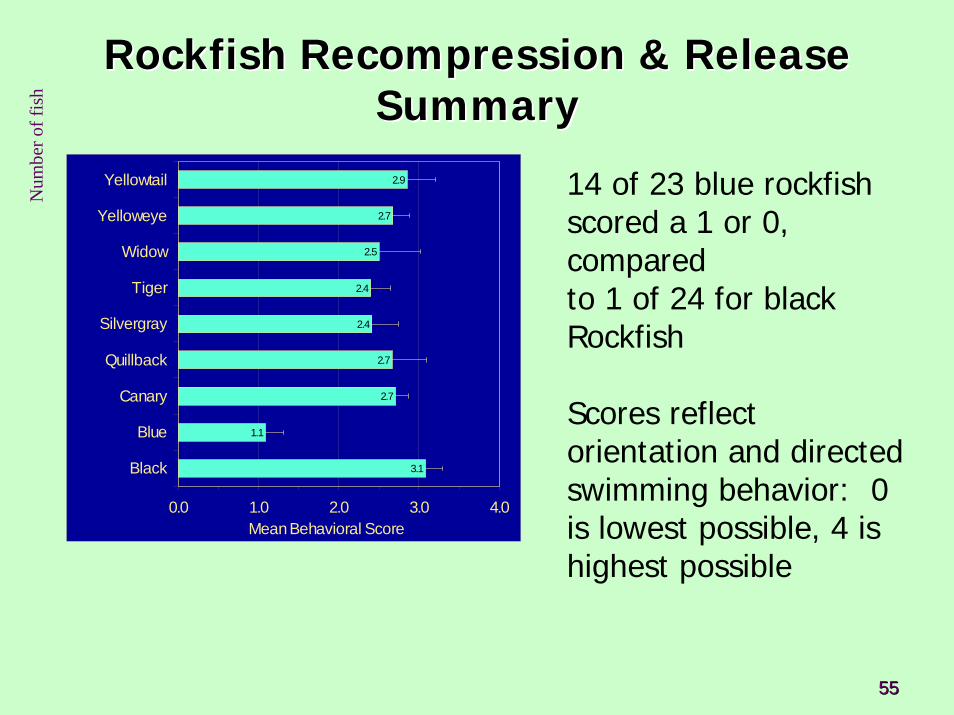
Rockfish Recompression & Release Rockfish Recompression & Release SummarySummary
3.1
1.1
2.7
2.7
2.4
2.4
2.5
2.7
2.9
0.0 1.0 2.0 3.0 4.0
Black
Blue
Canary
Quillback
Silvergray
Tiger
Widow
Yelloweye
Yellowtail
Mean Behavioral Score
14 of 23 blue rockfishscored a 1 or 0, compared to 1 of 24 for blackRockfish
Scores reflect orientation and directed swimming behavior: 0 is lowest possible, 4 is highest possible
Num
ber o
f fis
h
5656
Management Tools in UseManagement Tools in Use
•• Harvest mortality limitsHarvest mortality limits–– PFMC reductions in target fishing PFMC reductions in target fishing
mortality rates used to calculate mortality rates used to calculate acceptable biological catch (2000)acceptable biological catch (2000)
–– ODFW tracking of ODFW tracking of nearshorenearshore species species against landed catch caps (commercial against landed catch caps (commercial and recreational)and recreational)
–– Implemented through commercial Implemented through commercial landing limits and recreational bag limitslanding limits and recreational bag limits
5757
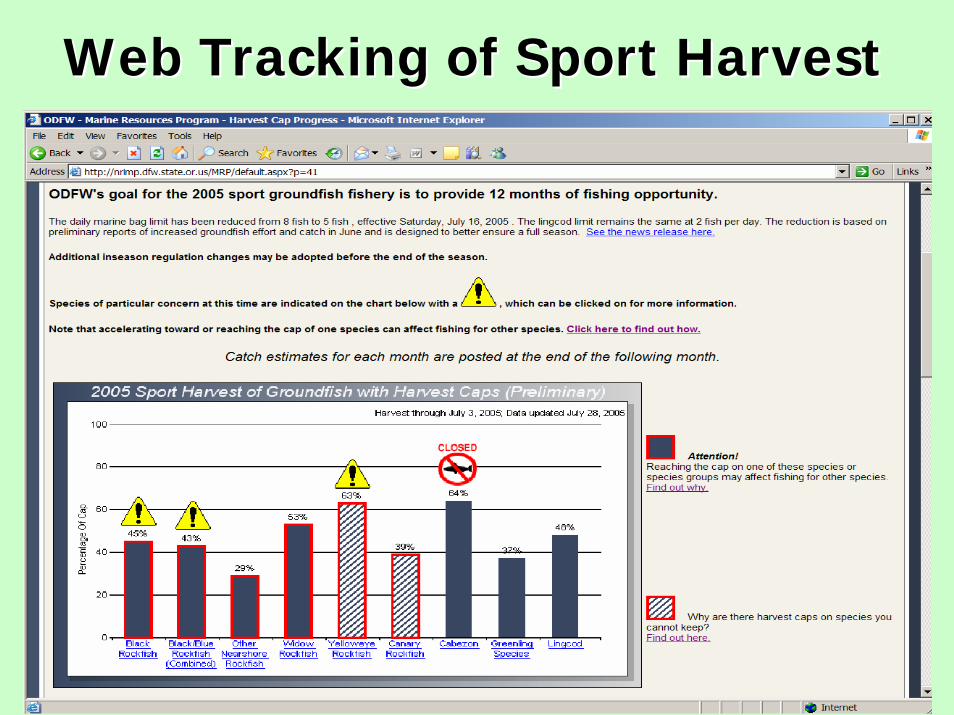
Web Tracking of Sport HarvestWeb Tracking of Sport Harvest
5858
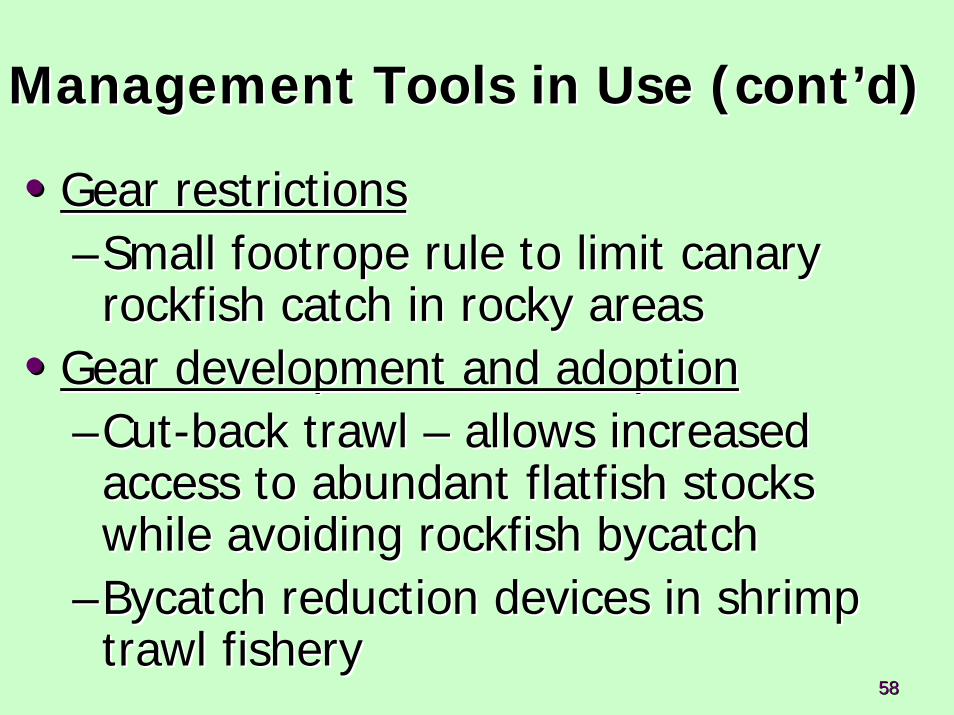
Management Tools in Use (contManagement Tools in Use (cont’’d)d)
•• Gear restrictionsGear restrictions––Small footrope rule to limit canary Small footrope rule to limit canary rockfish catch in rocky areasrockfish catch in rocky areas
•• Gear development and adoptionGear development and adoption––CutCut--back trawl back trawl –– allows increased allows increased access to abundant flatfish stocks access to abundant flatfish stocks while avoiding rockfish while avoiding rockfish bycatchbycatch
––BycatchBycatch reduction devices in shrimp reduction devices in shrimp trawl fisherytrawl fishery
5959
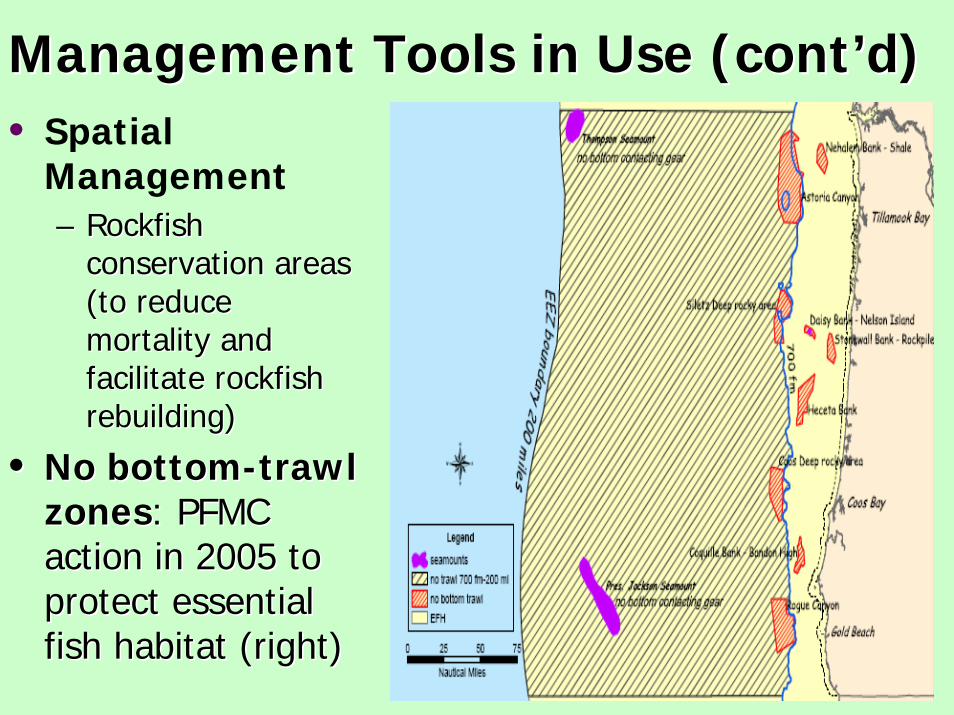
Management Tools in Use (contManagement Tools in Use (cont’’d)d)• Spatial
Management–– Rockfish Rockfish
conservation areas conservation areas (to reduce (to reduce mortality and mortality and facilitate rockfish facilitate rockfish rebuilding)rebuilding)
•• No bottomNo bottom--trawl trawl zoneszones: PFMC : PFMC action in 2005 to action in 2005 to protect essential protect essential fish habitat (right)fish habitat (right)
6060
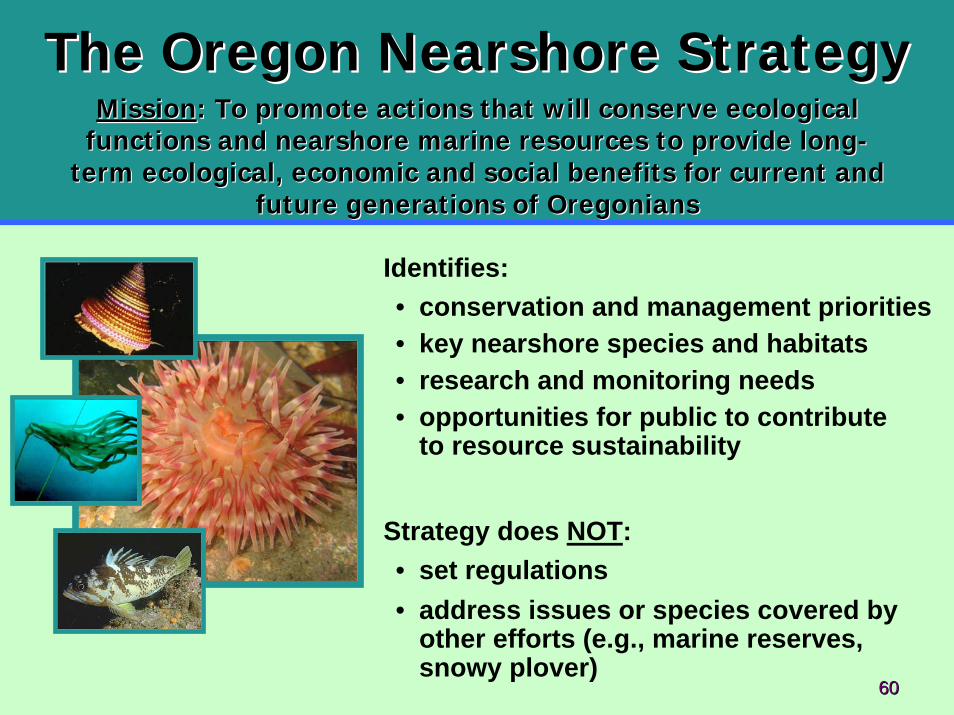
The Oregon Nearshore StrategyThe Oregon Nearshore StrategyMissionMission:: To promote actions that will conserve ecological To promote actions that will conserve ecological
functions and nearshore marine resources to provide longfunctions and nearshore marine resources to provide long--term ecological, economic and social benefits for current and term ecological, economic and social benefits for current and
future generations of Oregoniansfuture generations of Oregonians
Identifies:• conservation and management priorities• key nearshore species and habitats• research and monitoring needs• opportunities for public to contribute
to resource sustainability
Strategy does NOT:• set regulations• address issues or species covered by
other efforts (e.g., marine reserves, snowy plover)
6161
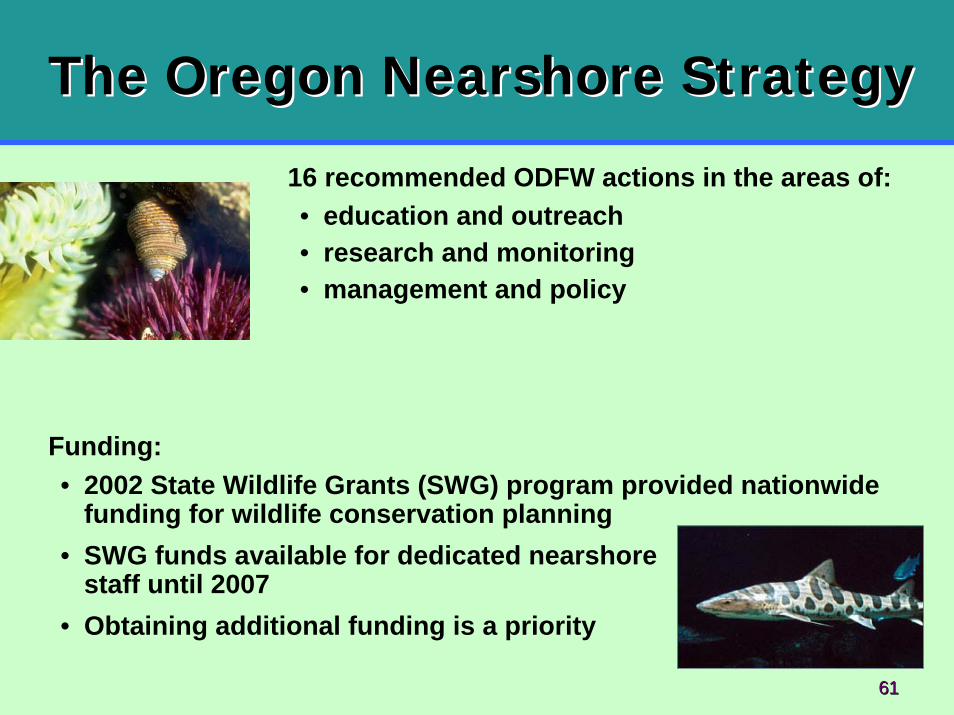
The Oregon Nearshore StrategyThe Oregon Nearshore Strategy
Funding:• 2002 State Wildlife Grants (SWG) program provided nationwide
funding for wildlife conservation planning• SWG funds available for dedicated nearshore
staff until 2007• Obtaining additional funding is a priority
16 recommended ODFW actions in the areas of:• education and outreach• research and monitoring• management and policy
6262
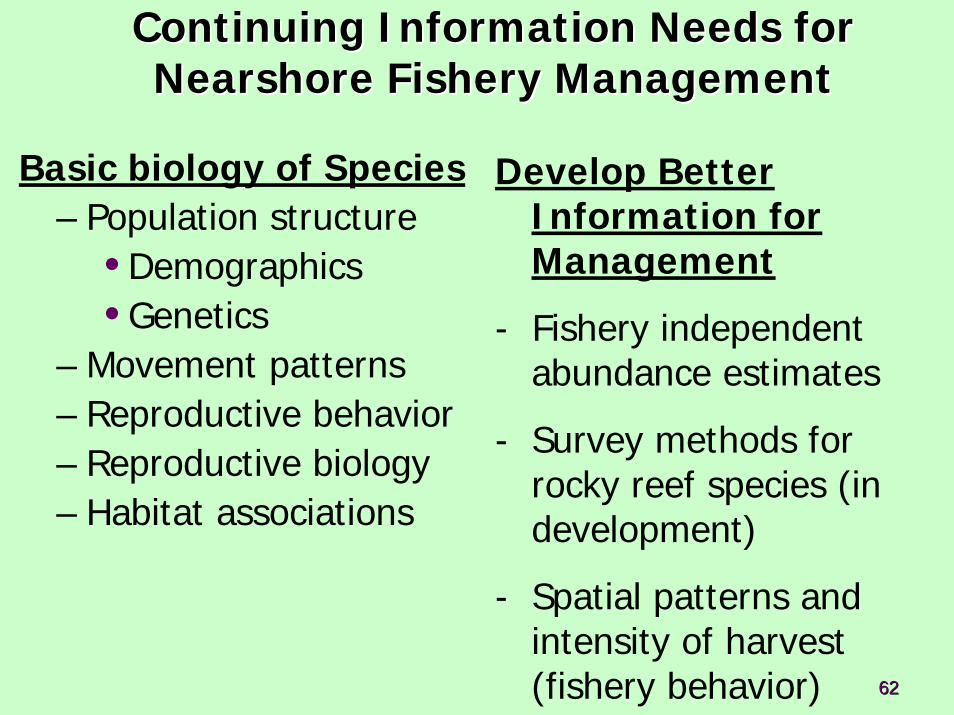
Continuing Information Needs for Continuing Information Needs for NearshoreNearshore Fishery ManagementFishery Management
Basic biology of Species– Population structure
•Demographics•Genetics
– Movement patterns– Reproductive behavior– Reproductive biology– Habitat associations
Develop Better Information for Management
- Fishery independent abundance estimates
- Survey methods for rocky reef species (in development)
- Spatial patterns and intensity of harvest (fishery behavior)
6363
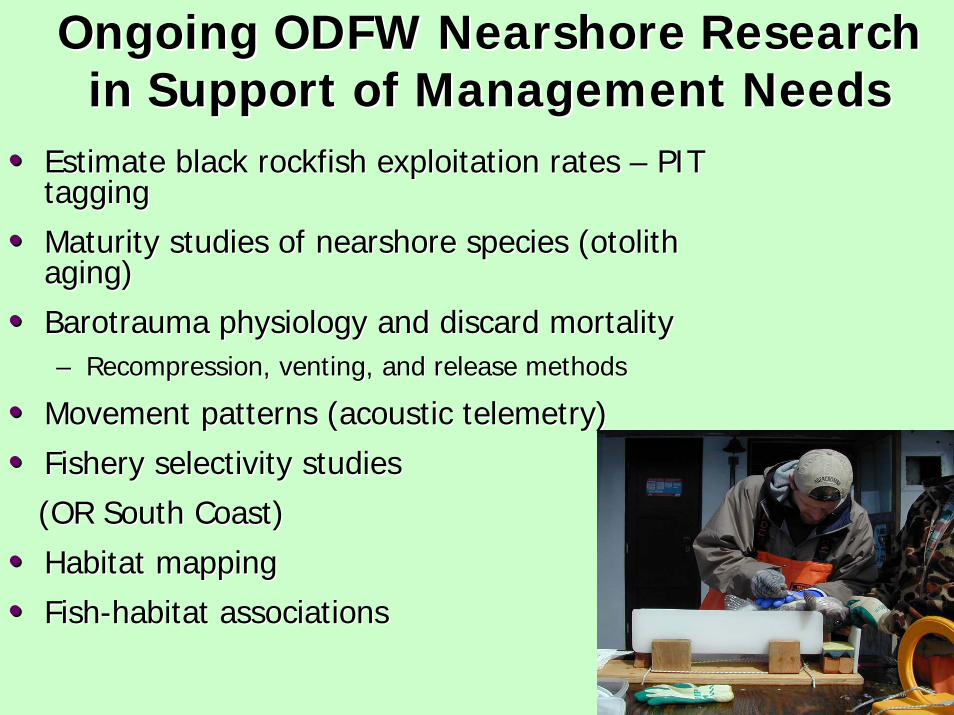
Ongoing ODFW Ongoing ODFW NearshoreNearshore Research Research in Support of Management Needsin Support of Management Needs
•• Estimate black rockfish exploitation rates Estimate black rockfish exploitation rates –– PIT PIT taggingtagging
•• Maturity studies of nearshore species (Maturity studies of nearshore species (otolithotolithaging)aging)
•• Barotrauma physiology and discard mortalityBarotrauma physiology and discard mortality–– Recompression, venting, and release methodsRecompression, venting, and release methods
•• Movement patterns (acoustic telemetry)Movement patterns (acoustic telemetry)
•• Fishery selectivity studies Fishery selectivity studies
(OR South Coast)(OR South Coast)
•• Habitat mappingHabitat mapping
•• FishFish--habitat associationshabitat associations
6464
Summary: NearshoreGroundfish Stock Status
• The vast majority of nearshore groundfishspecies are neither assessed or indexed.
• Two of eight of the assessed nearshoregroundfish species are depleted/overfished.
• Depleted stocks limit fishery access and harvest opportunity of more abundant stocks under precautionary management
6565
Summary: ProgressSummary: Progress•• Direct Measurement of Harvest RateDirect Measurement of Harvest Rate
((PIT tagging) PIT tagging) –– Helpful to establish better sock assessment baseline Helpful to establish better sock assessment baseline information (may not be applicable to less abundant species).information (may not be applicable to less abundant species).
•• Selective Capture GearsSelective Capture GearsHas promise, but much more work needed for hook and line etcHas promise, but much more work needed for hook and line etc..
•• Spatial ManagementSpatial ManagementWithin certain depth limits, acoustic tagging can provide infWithin certain depth limits, acoustic tagging can provide information on ormation on movements and survival. More data on where fish live and movememovements and survival. More data on where fish live and movement data nt data for less common species is needed.for less common species is needed.
•• NearshoreNearshore StrategyStrategyBegins putting Begins putting nearshorenearshore resources into broader ecological context; identifies resources into broader ecological context; identifies significant nonsignificant non--fishing concerns; nonfishing concerns; non--regulatoryregulatory
6666
Questions?Questions?