Embed Size (px)
Citation preview
Steadfast & Vibrant
CapitaMall TrustAnnual Report 2013

Steadfast & VibrantCapitaMall Trust (CMT) remains dedicated to delivering sustainable results across its portfolio of quality shopping malls. Since listing, CMT’s portfolio has steadily grown. This ensures that Unitholders and investors can rely on CMT for steady returns. CMT is focused on owning shopping malls that are vibrant and in close proximity to public transport. They are predominantly located in suburban areas as well as in Singapore’s bustling downtown core. CMT has been unwavering in its commitment to maintaining strong and rewarding partnerships with tenants. Together with the tenants, CMT continues to deliver results based on the creation and off ering of entertaining and relevant lifestyle shopping experiences that serve shoppers’ aspirations and needs.
Clarity Clarity enables us to enhance organisational performance through operational excellence and eff iciencies.

Contents Corporate Profile 03Financial Highlights 04Letter to Unitholders 06Year in Brief 14 Corporate Governance & Sustainability Trust Structure 18Organisation Structure 19Board of Directors 20Trust Management Team 30Property Management Team 31Corporate Governance 32Enterprise Risk Management 48Investor & Media Relations 52Unit Price Performance 54Sustainability 57People & Talent Management 62 Business ReviewGrowth Strategies 66Operations Review 68Financial Review 76Capital Management 81Independent Retail
Market Overview 85Singapore REIT Sector 91Marketing & Promotions 93Tenants Spotlight 100Meeting Our Shoppers 102
Portfolio Details Portfolio at a Glance 106Portfolio Summary 108Portfolio Details 110CapitaRetail China Trust 142 Financial Statements Report of the Trustee 146Statement by The Manager 147Independent Auditors’ Report 148Statements of Financial Position 149Statements of Total Return 150Distribution Statements 151Statements of Movements in
Unitholders’ Funds 153Portfolio Statements 154Statements of Cash Flows 159Notes to the Financial Statements 161
AppendixInterested Person Transactions 223Unitholders’ Statistics 224Mall Directory 226Corporate Information 227Glossary 228
1

Corporate Profile
To deliver stable distributions and sustainable total returns to Unitholders.
MissionCreating Value Maximising Returns Transforming Experiences
CMT’s vision embraces all our stakeholders. We rely on the continued and combined support of our Unitholders, business partners, tenants, shoppers and employees to achieve this vision and, in return, share with them the fruits of our success.
Vision
CMT is the first Real Estate Investment Trust (REIT) listed on Singapore Exchange Securities Trading Limited (SGX-ST) in July 2002. CMT is also the largest REIT by market capitalisation and asset size in Singapore, with a market capitalisation and asset size of approximately S$6.6 billion and S$10.0 billion respectively as at 31 December 2013.
CMT owns and invests in quality income-producing assets which are used, or predominantly used, for retail purposes primarily in Singapore. As at 31 December 2013, CMT’s portfolio comprised a diverse list of over 2,900 leases with local and international retailers and achieved a committed occupancy of 98.5%. CMT’s portfolio comprises 16 quality shopping malls, which are strategically located in the suburban areas and downtown core of Singapore.
CMT also owns 122.7 million units in CapitaRetail China Trust, the first China shopping mall REIT listed on SGX-ST in December 2006.
CMT has been assigned an ‘A2’ issuer rating by Moody’s Investors Service on 19 March 2013. The ‘A2’ issuer rating is the highest rating assigned to a Singapore REIT.
CMT is managed by an external manager, CapitaMall Trust Management Limited, which is a wholly-owned subsidiary of CapitaMalls Asia Limited, one of Asia’s largest listed shopping mall developers, owners and managers.
3

FinancialHighlights
Performance at a Glance
total assets (S$ million)
Distributable income (S$ million)
Gross revenue (S$ million)
2011
661.6
2009 2010 2012 2013
552.7581.1
630.6
729.2
net ProPerty income (S$ million)
2011
445.3
2009 2010 2012 2013
376.8399.1
418.2
502.7
2011
316.9
2009 2010 2012 2013
282.0294.8
301.6
356.2
2011
9,888.7
2009 2010 2012 2013
7,423.08,125.9
9,172.210,017.5
Clarity4 CapitaMall Trust Annual Report 2013

GROUP 1 2009 2010 2011 2012 2013Selected Statement of Total Return and
Distribution DataGross Rental Income (S$ million) 513.7 539.2 582.7 610.9 676.6Car Park Income (S$ million) 14.3 15.5 17.6 19.1 20.5Other Income (S$ million) 24.7 26.4 30.3 31.6 32.1Gross Revenue (S$ million) 552.7 581.1 630.6 661.6 729.2Net Property Income (S$ million) 376.8 399.1 418.2 445.3 502.7 Distributable Income (S$ million) 282.0 294.8 301.6 316.9 356.2Selected Statement of Financial Position DataTotal Assets (S$ million) 7,423.0 8,125.9 9,172.2 9,888.7 10,017.5Total Borrowings 2 (S$ million) 2,243.0 2,916.9 3,483.8 3,706.1 3,567.2Net Asset Value Per Unit 3 (S$) 1.54 1.53 1.56 1.64 1.71Unitholders’ Funds (S$ million) 4,969.6 4,939.4 5,246.04 5,702.94 6,008.7Market Capitalisation 5 (S$ million) 5,722.7 6,209.3 5,658.3 7,362.2 6,589.7Portfolio Property Valuation (S$ million) 6,920.5 7,271.5 7,849.2 8,191.8 8,799.4Key Financial IndicatorsEarnings Per Unit (cents) (2.23)6 8.49 11.98 16.05 16.61Distribution Per Unit (cents) 8.85 9.24 9.37 9.46 10.27Gearing 30.2% 35.9% 38.4% 36.7% 35.3%Interest Coverage (times) 3.6 3.6 3.3 3.2 4.2Management Expense Ratio 7 0.7% 0.7% 0.8% 0.8% 0.8%Unencumbered Assets as % of Total Assets 20.0% 36.3% 37.9% 77.5%8 83.7%8
Net Debt / EBITDA 9 (times) 6.6 6.8 7.4 6.9 6.5Average Term to Maturity 10 (years) 1.7 2.6 2.7 3.911 3.6Average Cost of Debt 3.5% 3.7% 3.5% 3.3% 3.4%
1 CMT Group includes the proportionate consolidation of the 40.00% interest in Raffles City Singapore, consolidation of 100.00% interest in CapitaRetail Singapore Limited and CMT MTN Pte. Ltd. (CMT MTN) and equity accounting of its associate, CapitaRetail China Trust. With effect from 30 May 2011, CMT Group also includes the proportionate consolidation of 30.00% interest in Infinity Mall Trust and Infinity Office Trust.
2 Based on principal sums only.3 Excludes outstanding distributable income as at end of each period.4 139,665,000 and 125,000,000 new units in CMT with gross proceeds of S$250.0 million each were issued via private placement exercises on
10 November 2011 and 30 November 2012 respectively.5 Based on the closing unit price of S$1.80 on 31 December 2009, S$1.95 on 31 December 2010, S$1.70 on 30 December 2011, S$2.13 on 31 December 2012
and S$1.905 on 31 December 2013.6 The negative Earnings Per Unit of 2.23 cents as at 31 December 2009 was mainly due to the revaluation deficit on investment properties.7 Refers to the expenses of the Trust, excluding property expenses and finance costs but including performance component of CapitaMall Trust Management
Limited’s management fees, expressed as a percentage of weighted average net assets.8 Higher in 2012 mainly due to the repayment of commercial mortgage backed securities (CMBS) borrowings under Silver Maple Investment Corporation Ltd
of S$783.0 million on 31 October 2012. Following the repayment, the properties mortgaged under the CMBS borrowings namely Tampines Mall, Junction 8, Funan DigitaLife Mall, IMM Building, Bugis Junction, Sembawang Shopping Centre and JCube were discharged and released.
Higher in 2013 mainly due to the redemption and cancellation of the remaining S$98.25 million in principal amount of S$650.0 million 1.0% convertible bonds due 2013 (Convertible Bonds due 2013) at 109.31% of the principal amount upon maturity. Following the redemption and cancellation, the legal mortgage over The Atrium@Orchard had been discharged and released.
9 Net Debt comprises gross debt less temporary cash intended for refinancing and capital expenditure and EBITDA refers to earnings before interest, tax, depreciation and amortisation.
10 From 2009 to 2010, it was assumed that bondholders of Convertible Bonds due 2013 would exercise the put option in July 2011. In 2011 and 2012, it was assumed that bondholders of the Convertible Bonds due 2013 would hold to maturity on 2 July 2013.
11 Higher in 2012 mainly due to the long tenures of between six to 12 years for four series of Euro-Medium Term Notes and one series of Medium Term Notes issued under CMT MTN in 2012.
5

Letter to Unitholders
CMT has delivered steadfast performance since its public listing in 2002. We will continue to drive sustainable growth through active lease management, asset enhancements, acquisitions and exploring greenfield developments. This strategy has helped us to survive through different economic cycles and deliver long-term sustainable performance for our Unitholders.
(Left) Tan Wee Yan, Wilson, Chief Executive Officer | (Right) Danny Teoh Leong Kay, Chairman
Clarity6 CapitaMall Trust Annual Report 2013

Dear Unitholders,
CapitaMall Trust (CMT) delivered an increase in distributions to Unitholders in 2013 despite a challenging global economy. CMT’s distribution per unit (DPU) for 2013 was 10.27 cents, 8.6% higher than the DPU of 9.46 cents for 2012. This translates to a distribution yield of 5.4% based on CMT’s closing price of S$1.905 per unit on 31 December 2013, which was approximately 280 basis points higher than the yield for the 10-year Singapore Government bond.
CMT’s gross revenue grew 10.2% year-on-year to S$729.2 million for the financial year ended 31 December 2013, while net property income increased 12.9% compared to 2012. The good performance in 2013 was due to the full year contributions from JCube, which re-opened in April 2012, and the completion of asset enhancement works at Bugis+ in end-July 2012 and The Atrium@Orchard in end-October 2012. CMT also achieved higher rentals on new and renewed leases; and higher rentals from gross turnover. Westgate commenced operations on 2 December 2013 and contributed S$1.3 million to the gross revenue.
CMT has delivered consistent and sustained performance since its public listing in 2002. We will continue to drive sustainable growth for our Unitholders through active lease management, asset enhancements, acquisitions
and exploring greenfield developments. This strategy has helped us to survive through different economic cycles and deliver long-term sustainable performance for our Unitholders. DeliverinG steaDfast oPerational PerformanceThe improved economic conditions, healthy tourist arrivals, low unemployment and growing household income have underpinned consumer spending in Singapore. Our malls continue to draw interest from both existing tenants and new-to-market brands.
A total of 629 leases were renewed with an increase of 6.3% over preceding rental rates contracted three years ago. CMT’s portfolio occupancy rate was 98.5% as at 31 December 2013 – up from 98.2% a year ago, largely due to the healthy take-up rate of the space vacated by Carrefour at Plaza Singapura and the new space at The Atrium@Orchard, Clarke Quay and IMM Building after asset enhancements. The occupancy figure would have been higher at 99.7% if we exclude Westgate which opened on 2 December 2013.
reaPinG benefits from asset enhancementsIn 2013, we reaped the fruits of asset enhancement works at JCube, Bugis+ and The Atrium@Orchard which were completed in 2012. During the year, we completed various asset enhancement works at Clarke Quay, Junction 8, IMM Building
S$729.2mThis was 10.2% higher than the gross revenue for 2012. DPU for 2013 was 10.27 cents, 8.6% higher than the DPU of 9.46 cents for 2012.
Gross Revenue
98.5%CMT’s portfolio occupancy rate was 98.5% as at 31 December 2013. A total of 629 leases were renewed with an increase of 6.3% over the preceding rental rates contracted three years ago.
Occupancy Rate
7

and Bugis Junction. We have also announced the asset enhancement works at Tampines Mall, which will be starting in the first quarter of 2014.
At Clarke Quay, asset enhancement works were fully completed in January 2013. The works involved recovering space from an anchor tenant to optimise the use of space at Block C and maximising the gross floor area at Block E. Blocks C and E are now refreshed with vibrant frontage along River Valley Road with more food and beverage (F&B) offerings. The new frontage, designed to match the heritage architecture of the location, has brought back the charm of the old warehouses at Clarke Quay.
At Junction 8, we opened a linkway from Bishan Mass Rapid Transit (MRT) Interchange Station to Basement 1, making it more accessible to shoppers and providing more F&B offerings. This has led to the higher flow of shoppers into the mall, compared to the previous year.
IMM Building embarked on asset enhancement works in May 2012 and completed the first phase of its repositioning as a value-focused mall in June 2013. Today, IMM Building is Singapore’s largest outlet mall, with over 55 outlet stores. We will explore the next phase of asset enhancements to house more outlet stores in IMM Building.
At Bugis Junction, we recovered space from an anchor tenant on
levels 2 and 3, and converted it to specialty stores. This will strengthen the mall’s positioning as a place for the young, hip and trendy. We will be embarking on the next phase of works in the first quarter of 2014, which includes further recovery of space from the anchor tenant at Level 1 to convert to new specialty stores.
We have also announced asset enhancement works at Tampines Mall. This involves converting the Level 5 roof area to new lettable area to house enrichment schools and educational tenants, reconfiguring levels 2 and 3 to enhance the fashion offerings, and rejuvenating the mall. The asset enhancement works are expected to be completed in the fourth quarter of 2015.
extractinG value from investment anD Divestment activities Westgate, an integrated retail and office development project in which CMT has a 30.00% stake, commenced mall operations on 2 December 2013. Located in Jurong Gateway and the only development directly connected to both the Jurong East MRT Interchange Station and future bus interchange, Westgate has drawn strong interest from retailers and shoppers. As at 31 December 2013, Westgate’s committed occupancy was about 90.0% and it received about 3.4 million shoppers in the first month of opening. The seven-storey shopping mall from Basement 2 to Level 5 houses more than 250 brands over a net lettable area of about 410,000
Letter to Unitholders
Westgate
Westgate has drawn strong interest from retailers and shoppers, with committed occupancy of about 90.0% as at 31 December 2013 and received 3.4 million shoppers in the first month of opening.
Commenced Operations
Clarity8 CapitaMall Trust Annual Report 2013

was swapped into S$62.0 million at a fixed rate of 3.148% per annum. In addition, S$350.0 million seven-year retail bonds were issued at 3.08%.
WinninG accolaDes We are honoured that we have been recognised during the year for our investor relations, corporate governance and green efforts.
In November 2013, CapitaMall Trust was the winner of both the Singapore Corporate Governance Award (REITs & Business Trusts category) and Most Transparent Company Award (REITs & Business Trusts category) at the Securities Investors Association (Singapore) (SIAS) Investors’ Choice Awards 2013. Capping the year, we were awarded a Certificate of Excellence at the Investor Relations (IR) Magazine South East Asia Awards 2013 in December 2013.
Taking responsibility for the environment and for our society is a core component of our strategy for sustainable development and operations. We are pleased that we continued to make improvements in this aspect. In 2013, JCube and Tampines Mall were awarded the BCA Universal Design Mark GoldPlus award and the BCA Green Mark Gold award respectively from the Building and Construction Authority (BCA). Westgate also obtained both the Universal Design Mark GoldPlus (Design) award and the BCA Green Mark Platinum award, the highest accolade for green building
square feet, similar to the retail area of Raffles City Singapore.
We are also happy to report that a consortium has exercised its options to purchase Westgate Tower for a total consideration of approximately S$579.4 million (CMT’s 30.00% share is S$173.8 million). Westgate Tower is currently under development, and the construction is expected to be completed by the end of 2014. The sale is expected to be completed following the issuance of the strata title for Westgate Tower.
enhancinG financial flexibilityWe fully repaid S$300.0 million in retail bonds in February 2013 and redeemed S$98.25 million in convertible bonds due in July 2013. Following the redemption and cancellation of the convertible bonds due in 2013, the legal mortgage over The Atrium@Orchard was released and all 14 properties held directly by CMT are now unencumbered. As such, 81.8% of CMT’s borrowings were unsecured as at 31 December 2013, compared to 80.7% as at 31 December 2012.
In 2013, we issued ¥10.0 billion seven-year fixed rate medium term notes which was swapped into S$126.0 million at a fixed rate of 3.119% per annum and S$100.0 million seven-year fixed rate medium term notes at 3.15% per annum.
In February 2014, we issued ¥5.0 billion seven-year floating rate medium term notes which
81.8%
Awards
All 14 properties held directly by CMT are now unencumbered.
Unsecured Borrowings
Winner of Singapore Corporate Governance Award (REITs & Business Trusts category) and Most Transparent Company Award (REITs & Business Trusts category) at the SIAS Investors’ Choice Awards 2013.
9
serve the large population catchment areas and cater predominantly to necessity shopping. This year, we will embark on the asset enhancement works for Tampines Mall and the second phase of such works for Bugis Junction, to further create sustainable value for our Unitholders.
acknoWleDGementsIn line with good corporate principles on board rejuvenation, Mr James Koh Cher Siang has stepped down from the Board of CapitaMall Trust Management Limited as Chairman of the Board, Non-Executive Director, Chairman of the Corporate Disclosure Committee and Chairman of the Investment Committee on 17 April 2013. We would like to thank him for his stewardship and tireless commitment to the Board over the past years.
Mr James Koh Cher Siang was succeeded by Mr Danny Teoh Leong Kay as Chairman of the Board, Chairman of the Corporate Disclosure Committee and member of the Investment Committee; and by Mr Lim Ming Yan as Chairman of the Investment Committee.
Last but not least, we would like to express our sincere gratitude to our supportive Unitholders, business partners, retailers and shoppers, and our deepest appreciation to our dedicated employees for their service and hard
certification in Singapore. We will strive to further improve our environmental performance to utilise energy and water efficiently and to minimise waste generated.
lookinG aheaDWith the global economic outlook improving modestly, supported by a slow recovery in the United States and the Eurozone, Singapore’s Ministry of Trade and Industry expects the domestic economy to grow between 2.0% and 4.0% in 2014. In Singapore, the progressive wage model led by the labour movement to boost the pay of low-wage workers will be made compulsory for the cleaning and security services sectors later this year. Coupled with the prevailing labour crunch, this could dampen some retailers’ plans to expand their retail space.
Rising wages may also lead to increases in our costs of cleaning and security services, which currently constitute less than 10.0% of our operating costs. On our part, we continually look at ways to tackle these cost increases by raising labour productivity and harnessing cost-saving technologies.
Nevertheless, growing household income and a low unemployment rate will continue to underpin retail spending. We believe that CMT will benefit from this, as our malls are strategically located to conveniently
Letter to Unitholders
work towards the mission of maximising the value of CMT.
Danny teoh leonG kay Chairman
tan Wee yan, WilsonChief Executive Officer
28 February 2014
Clarity10 CapitaMall Trust Annual Report 2013

尊敬的单位持有人,
尽 管 环 球 经 济 充 满 挑 战 , 凯 德 商 用 新 加 坡 信 托 于 2 0 1 3 向 单 位 持有 人 派 付 的 分 发 金 仍 取 得 增 长 。 2 0 1 3 年 , 凯 德 商 用 新 加 坡 信 托 每单位分发金(DPU)为10.27新分, 比 2 0 1 2 年 分 发 的 9 . 4 6 新 分 高8 . 6 % 。 按 凯 德 商 用 新 加 坡 信 托 于 2013年12月31日1.905新元的单位收市价计算,投资收益率为5.4%, 比 1 0 年 期 新 加 坡 政 府 债 券 收 益 率 高约280个基点。
于截至2013年12月31日的财政年度凯德商用新加坡信托的总收入按年增长10.2%至7.292亿新元,同时净物业收入比2012年增加12.9%。2013年良好的业绩表现受益于2012年4月重新开业的裕冰坊 (JCube)和分 别于2012年7月底及2012年10月底 完 成 资 产 改 良 工 程 的 白 沙 浮 娱 乐 广 场 ( B u g i s + ) 及 乌 节 爱 特 岭 大 厦 (The Atrium@Orchard)的全年贡献。 凯德商用新加坡信托也于新租约和 现 有 租 户 续 租 取 得 租 金 增 幅 , 以及享有较高的营业额租金。西城(Westgate) 于 2013年12 月 2 日开业,为总收入贡献130万新元。
凯 德 商 用 新 加 坡 信 托 自 2 0 0 2 年 上 市 以 来 一 直 保 持 稳 定 的 经 营业 绩 。 我 们 将 继 续 藉 由 积 极 的 租赁管理、资产改良、收购及探索 新 开 发 项 目 , 为 单 位 持 有 人 带 来 可持续的增长。此策略已成功协助 我们经历不同的经济周期,为我们 的单位持有人带来长期可持续经营业绩。
取得稳定的经营业绩经 济 状 况 改 善 、 旅 客 人 数 稳 健 增长、失业率偏低及家庭收入增加均为新加坡消费者支出带来支持。我们的购物中心继续吸引现有租户和新登陆市场的品牌进驻。
我们一共重续629 份租约,较于三年 前 签 定 的 租 金 获 6 . 3 % 的 增 长 。凯德商用新加坡信托的资产组合出租率由一年前的98 .2%提升至截至2013年12月31日的98.5%,主要是由于家乐福 (Carrefour)在狮城68 (Plaza Singapura)所腾出的空间,以 及 乌 节 爱 特 岭 大 厦 、 克 拉 码 头(Clarke Quay)及 IMM大厦经资产改良后新增的空间,均取得稳健的 出租率。若不包括于2013年12月2日开业的西城,出租率将高达99.7%。
资产改良取得成果于2013年,我们因裕冰坊、白沙浮娱乐广场及乌节爱特岭大厦的资产 改 良 工 程 于 2 0 1 2 年 完 成 而 取 得 成果。年内,我们完成克拉码头、 碧山第8站(Junction 8)、IMM大厦及 白 沙 浮 广 场 (Bugis Junction)的多 项资产改良工程。我们也宣布淡滨 尼广场(Tampines Mall)的资产改良 计 划 , 该 计 划 将 于 2 0 1 4 年 第 一 季 展开。
克 拉 码 头 于 2 0 1 3 年 1月 圆 满 完 成 其 资 产 改 良 工 程 。 有 关 工 程 涉 及 回 收 部 分 主 力 租 户 所 租 用 面 积 进行 间 隔 重 整 , 以 优 化 C 座 空 间 的 使用及将E座的总建筑面增加至最大限度。C座及E座沿River Valley Road 的店面现已焕然一新,并提供多样
凯德商用新加坡信托自2002年上市以来一直取得稳定的经营业绩。我们将继续藉由积极的租赁管理、资产改良、收购及探索新开发项目,创造可持续的增长。此策略已成功协助我们经历不同的经济周期,为我们的单位持有人带来长期可持续经营业绩。
7.292亿新元
比 2012 年总收入高
10.2%。2013 年每单
位分发金为 10.27 新分,
比 2012 年分发的 9.46 新分高 8.6%。
总收入
98.5%出租率
截至 2013 年12月31日
出租率为98.5%。我们一共重续 629 份
租约,较于三年前签定
的租金获 6.3% 的增长。
11
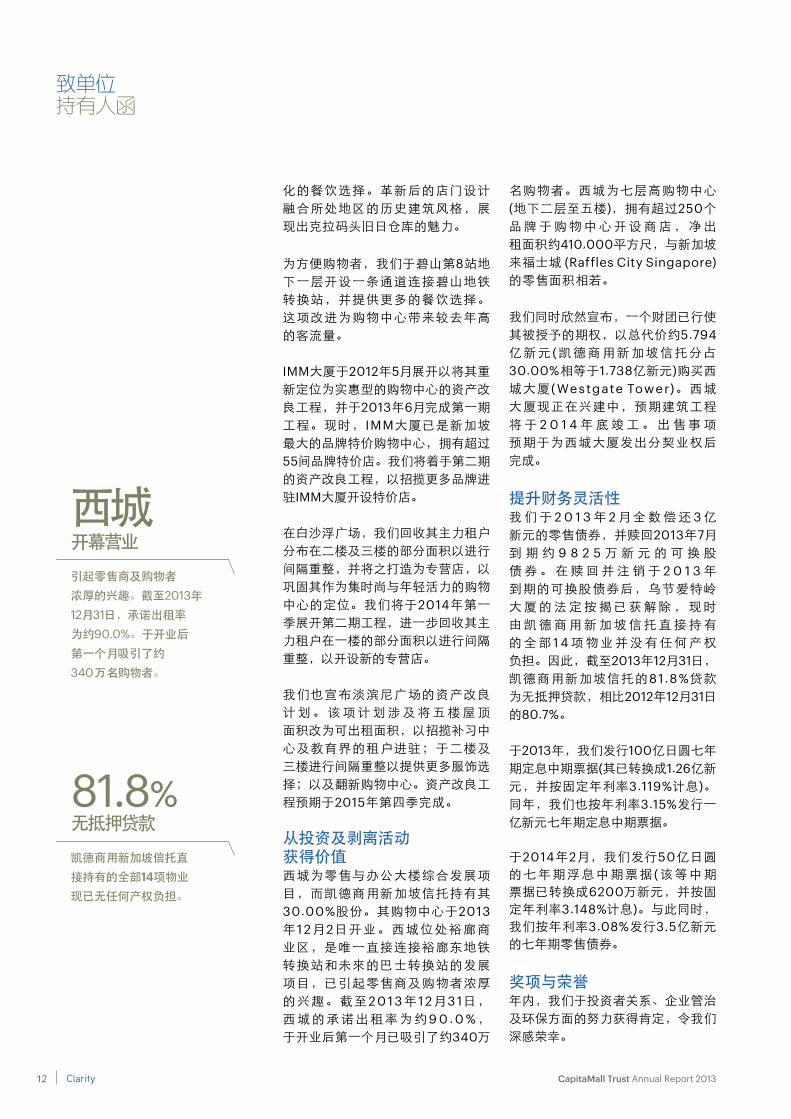
化的餐饮选择。革新后的店门设计融合所处地区的历史建筑风格,展现出克拉码头旧日仓库的魅力。
为方便购物者,我们于碧山第8站地下一层开设一条通道连接碧山地铁转换站,并提供更多的餐饮选择。这项改进为购物中心带来较去年高的客流量。
IMM大厦于2012年5月展开以将其重新定位为实惠型的购物中心的资产改良工程,并于2013年6月完成第一期工程。现时, IMM大厦已是新加坡最大的品牌特价购物中心,拥有超过 55间品牌特价店。我们将着手第二期的资产改良工程,以招揽更多品牌进驻IMM大厦开设特价店。
在白沙浮广场,我们回收其主力租户分布在二楼及三楼的部分面积以进行间隔重整,并将之打造为专营店,以巩固其作为集时尚与年轻活力的购物中心的定位。我们将于2014年第一季展开第二期工程,进一步回收其主力租户在一楼的部分面积以进行间隔重整,以开设新的专营店。
我们也宣布淡滨尼广场的资产改良计 划 。 该 项 计 划 涉 及 将 五 楼 屋 顶 面积改为可出租面积,以招揽补习中心及教育界的租户进驻;于二楼及三楼进行间隔重整以提供更多服饰选择;以及翻新购物中心。资产改良工程预期于2015年第四季完成。
从投资及剥离活动 获得价值西城为零售与办公大楼综合发展项目,而凯德商用新加坡信托持有其30.00%股份。其购物中心于2013年 1 2月 2日 开 业 。 西 城 位 处 裕 廊 商业区,是唯一直接连接裕廊东地铁转换站和未來的巴士转换站的发展项目,已引起零售商及购物者浓厚的 兴 趣 。 截 至 2 0 1 3 年 1 2月 3 1日 ,西 城 的 承 诺 出 租 率 为 约 9 0 . 0 % , 于开业后第一个月已吸引了约340万
名购物者。西城为七层高购物中心 (地下二层至五楼),拥有超过250个 品 牌 于 购 物 中 心 开 设 商 店 , 净 出 租面积约410,000平方尺,与新加坡来福士城 (Raffles City Singapore)的零售面积相若。
我们同时欣然宣布,一个财团已行使其被授予的期权,以总代价约5.794亿 新 元 ( 凯 德 商 用 新 加 坡 信 托 分 占30.00%相等于1.738亿新元)购买西城大厦 ( Westgate Tower)。西城大 厦现正在兴建中,预期建筑工程 将 于 2 0 1 4 年 底 竣 工 。 出 售 事 项 预期于为西城大厦发出分契业权后 完成。
提升财务灵活性我 们 于 2 0 1 3 年 2 月 全 数 偿 还 3 亿 新元的零售债券,并赎回2013年7月 到 期 约 9 8 2 5 万 新 元 的 可 换 股 债 券 。 在 赎 回 并 注 销 于 2 0 1 3 年 到期的可换股债券后,乌节爱特岭大 厦 的 法 定 按 揭 已 获 解 除 , 现 时 由 凯 德 商 用 新 加 坡 信 托 直 接 持 有 的 全 部 1 4 项 物 业 并 没 有 任 何 产 权 负担。因此,截至2013年12月31日,凯德商用新加坡信托的81 .8%贷款 为无抵押贷款,相比2012年12月31日的80.7%。
于2013年,我们发行100亿日圆七年期定息中期票据(其已转换成1.26亿新元,并按固定年利率3.119%计息)。 同年,我们也按年利率3.15%发行一亿新元七年期定息中期票据。
于2014年2月,我们发行50亿日圆 的 七 年 期 浮 息 中 期 票 据 ( 该 等 中 期 票据已转换成6200万新元,并按固定年利率3.148%计息)。与此同时, 我们按年利率3.08%发行3.5亿新元的七年期零售债券。
奖项与荣誉 年内,我们于投资者关系、企业管治及环保方面的努力获得肯定,令我们深感荣幸。
西城
凯德商用新加坡信托直
接持有的全部14项物业
现已无任何产权负担。
81.8%无抵押贷款
引起零售商及购物者
浓厚的兴趣。截至2013年12月31日,承诺出租率
为约90.0%。于开业后
第一个月吸引了约
340 万名购物者。
开幕营业
Clarity12 CapitaMall Trust Annual Report 2013

商用新加坡信托将受益于此。本年度,我们将于淡滨尼广场展开资产改良工程以及于白沙浮广场展开第二期有关工程,这将可为单位持有人创造可持续价值。
致谢为配合董事会更新的良好企业管治原则,许慈祥先生已于2013年4月17日卸任凯德商用新加坡信托管理有限公司董事会主席、非执行董事、公司信息披露委员会主席及投资委员会主席。我们谨藉此机会感谢他过去几年一直给予董事会的指导及贡献。
趙亮溪先生将接替许慈祥先生担任董事会主席、公司信息披露委员会主席及投资委员会成员;而林明彦先生则担任投资委员会主席。
最后,我们衷心感谢我们的单位持有人、业务伙伴、零售商及购物者一路以来给予我们的支持,并感谢我们的员工致力履行职责,为凯德商用新加坡信托创造更高价值。
趙亮溪
主席
陈伟渊
首席执行官2014年2月28日
于2013年11月,凯德商用新加坡信托于2013年新加坡证券投资会投资者选择奖中分别于「新加坡企业治理奖」(房地产投资信托及商业信托类别)及「最透明企业奖」(房地产投资信托及商业信托类别)获第一名。于 2013年12月,我们获《投资者关系》杂志颁发2013年东南亚地区投资者关系优秀表现奖。
履行对环境及对社会的企业责任是我 们 可 持 续 发 展 及 经 营 策 略 的 核心部分。我们很高兴于此方面有不断 的 进 步 。 于 2 0 1 3 年 , 裕 冰 坊 及 淡 滨 尼 广 场 分 别 获 新 加 坡 建 设 局 颁 发 通 用 设 计 标 志 超 金 奖(Universal Design Mark Gold Plus)及 绿 色 建 筑 标 志 金 奖 。 西 城 也 获颁 发 通 用 设 计 标 志 超 金 奖 ( 设 计 ) (Universal Design Mark Gold Plus(Design)) 及绿色建筑标志白金奖,为新加坡绿色建筑认证的最高荣誉。我们将继续致力于环保工作,提升能源及用 水效能及减少产生废弃物。
展望随 着 全 球 经 济 前 景 逐 步 改 善 以 及 美 国 及 欧 元 区 慢 慢 复 苏 , 新 加 坡贸 易 与 工 业 部 预 期 2 0 1 4 年 新 加 坡经济增长介乎2 .0%至4 .0%之间。为 提 升 本 地 低 工 资 员 工 的 薪 酬 水 平而推出的渐进式薪金模式,将于本年度较后时间于清洁及保安服务行业强制执行。适逢现时劳工短缺,部份零售商扩充零售空间的计划可能会受到影响。
清洁及保安服务目前虽占我们的经营成本不足10.0%,但工资上涨也令清洁及保安服务成本增加。我们将继续提高生产力,使用可节省成本的 技术,以应对成本上涨问题。
尽管如此,家庭收入持续增长以及失业率偏低将继续为零售消费带来支持。由于我们的购物中心所处位置具有策略优势,位于人口密集的地区并主要提供日常购物,故我们相信凯德
于 2013 年新加坡证券
投资会投资者选择奖中
分别于 新加坡企业治理奖」
(房地产投资信托及商业信托
类别) 及「最透明企业奖」
(房地产投资信托及商业信托
类别) 获第一名。
所获奖项
13
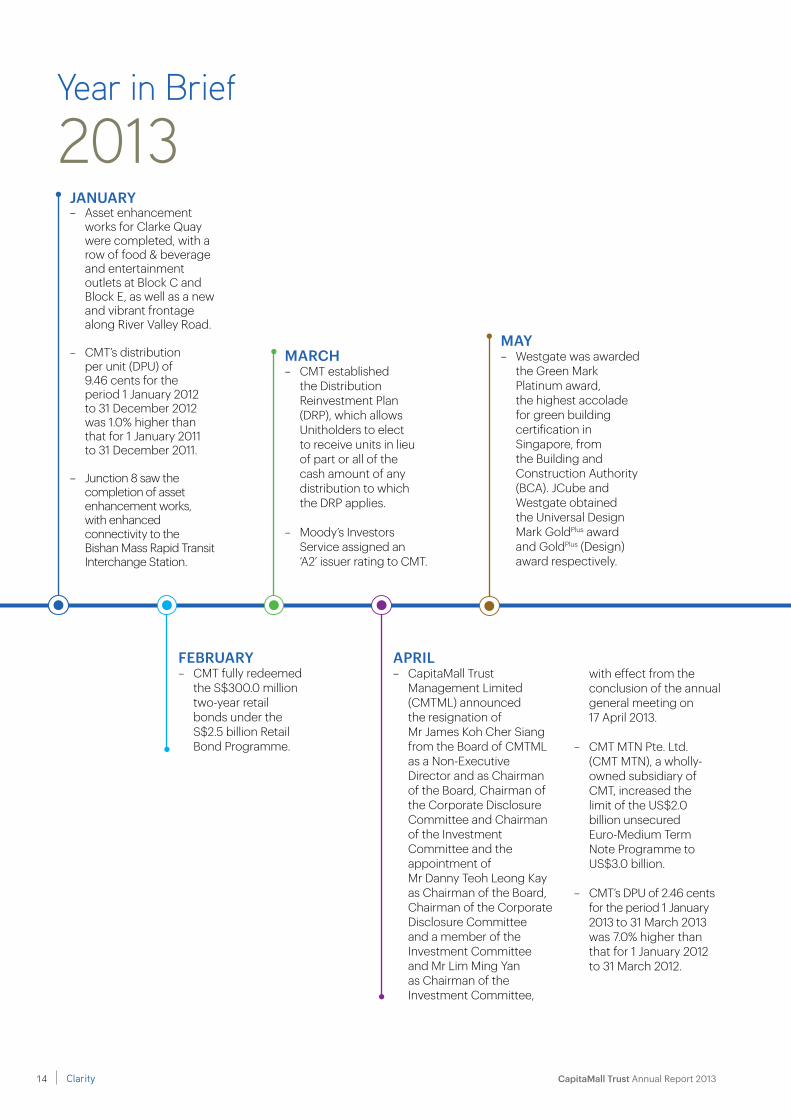
APRIL– CapitaMall Trust
Management Limited (CMTML) announced the resignation of Mr James Koh Cher Siang from the Board of CMTML as a Non-Executive Director and as Chairman of the Board, Chairman of the Corporate Disclosure Committee and Chairman of the Investment Committee and the appointment of Mr Danny Teoh Leong Kay as Chairman of the Board, Chairman of the Corporate Disclosure Committee and a member of the Investment Committee and Mr Lim Ming Yan as Chairman of the Investment Committee,
with effect from the conclusion of the annual general meeting on 17 April 2013.
– CMT MTN Pte. Ltd. (CMT MTN), a wholly-owned subsidiary of CMT, increased the limit of the US$2.0 billion unsecured Euro-Medium Term Note Programme to US$3.0 billion.
– CMT’s DPU of 2.46 cents for the period 1 January 2013 to 31 March 2013 was 7.0% higher than that for 1 January 2012 to 31 March 2012.
Year in Brief
JAnUARY– Asset enhancement
works for Clarke Quay were completed, with a row of food & beverage and entertainment outlets at Block C and Block E, as well as a new and vibrant frontage along River Valley Road.
– CMT’s distribution per unit (DPU) of 9.46 cents for the period 1 January 2012 to 31 December 2012 was 1.0% higher than that for 1 January 2011 to 31 December 2011.
– Junction 8 saw the completion of asset enhancement works, with enhanced connectivity to the Bishan Mass Rapid Transit Interchange Station.
FeBRUARY– CMT fully redeemed
the S$300.0 million two-year retail bonds under the S$2.5 billion Retail Bond Programme.
MARCH– CMT established
the Distribution Reinvestment Plan (DRP), which allows Unitholders to elect to receive units in lieu of part or all of the cash amount of any distribution to which the DRP applies.
– Moody’s Investors Service assigned an ‘A2’ issuer rating to CMT.
2013
MAY– Westgate was awarded
the Green Mark Platinum award, the highest accolade for green building certification in Singapore, from the Building and Construction Authority (BCA). JCube and Westgate obtained the Universal Design Mark GoldPlus award and GoldPlus (Design) award respectively.
Clarity14 CapitaMall Trust Annual Report 2013

JUne– Phase one of
IMM Building’s repositioning exercise as a value-focused mall was completed. IMM Building is now Singapore’s largest outlet mall with more than 55 outlet stores.
– CMT, together with CapitaMalls Asia and CapitaRetail China Trust, jointly participated in the SGX Sector Connect Seminar, as part of their commitment to engage retail investors.
OCTOBeR– CMT’s DPU of 7.55 cents
for the period 1 January 2013 to 30 September 2013 was 6.3% higher than that for 1 January 2012 to 30 September 2012.
– Phase one of the asset enhancement works for Bugis Junction was completed. Together with the completion of phase two in 2014, close to 70,000 sq ft of space will be recovered from one of the anchor tenants and converted to specialty shops.
DeCeMBeR– Westgate opened
its doors to shoppers, bringing the city lifestyle to the west of Singapore.
– CMT clinched a Certificate of Excellence at the Investor Relations (IR) Magazine South East Asia Awards 2013.
– CMT MTN issued S$100.0 million fixed rate notes with a tenure of seven years under the MTN Programme.
– Tampines Mall was awarded the Green Mark Gold award from BCA.
JULY– CMT fully redeemed
and cancelled the remaining S$98.25 million of S$650.0 million principal amount of convertible bonds due 2013 at 109.31% of the principal amount upon maturity. Following the redemption and cancellation, the legal mortgage over The Atrium@Orchard had been discharged and released.
– CMT’s DPU of 4.99 cents for the period 1 January 2013 to 30 June 2013 was 6.6% higher than that for 1 January 2012 to 30 June 2012.
nOveMBeR– CMT was the Winner
of the Singapore Corporate Governance Award (REITs and Business Trusts category) and Most Transparent Company Award (REITs and Business Trusts category) at the Securities Investors Association (Singapore) Investors’ Choice Awards 2013.
– CMT MTN issued ¥10.0 billion fixed rate notes with a tenure of seven years under the S$2.5 billion unsecured Multicurrency Medium Term Note Programme (MTN Programme).
15


Reassuringly ResilientCMT’s unitholders can rely on our robust corporate governance structure and culture for continued performance. These support best practices, sustainable policies and process improvements, as well as empower our management team to uphold a resilient future for CMT.

Represents Interests of Unitholders
Trust Structure
Asset Management Services
Trustee’s Fees
Asset Management Fees
Investment in CapitaMall
Trust
Ownership of Assets
Distributions
Net Property Income
ManagerCapitaMall Trust
Management Limited
TrusteeHSBC Institutional
Trust Services (Singapore) Limited
Property Managers
CapitaLand Retail Management Pte Ltd
CapitaLand (RCS) Property Management
Pte. Ltd. 1
CMT Portfolio
Property Management Services
Property Management Fees
Tampines MallJunction 8Funan DigitaLife MallIMM BuildingPlaza SingapuraBugis JunctionSembawang Shopping CentreJCubeLot One Shoppers’ MallBukit Panjang PlazaRivervale MallThe Atrium@OrchardClarke QuayBugis+Raffles City Singapore (40.00% interest)Westgate (30.00% interest)
Unitholders
1 CapitaLand (RCS) Property Management Pte. Ltd. only manages Raffles City Singapore.
Clarity18 CapitaMall Trust Annual Report 2013

Corporate Governance & Sustainability
OrganisationStructure
CapitaMall Trust Management Limited (CMTML)
BOARD OF DIReCTORS
CHIeF exeCUTIve OFFICeR
AUDIT COMMITTee
HeADFinance
HeADInvestment & Asset
Management
ASSISTAnT vICe PReSIDenTInvestor Relations
CapitaLand Retail Management Pte Ltd (CRMPL)
GeneRAL MAnAGeR Retail Management
General Manager Tampines MallRivervale Mall
General Manager IMM Building
JCubeWestgate
General Manager Raffles City Singapore
Centre ManagerClarke Quay
General Manager Funan DigitaLife Mall
Management Committee
Raffles City Singapore
General Manager Lot One Shoppers’ Mall
Bukit Panjang Plaza
General Manager Plaza Singapura
The Atrium@Orchard
General Manager Bugis Junction
Bugis+
Centre Manager Junction 8
Sembawang Shopping Centre
GROUP SeRvICeS
Leasing
Marketing Communications
Tenancy Design Management
Operations
19
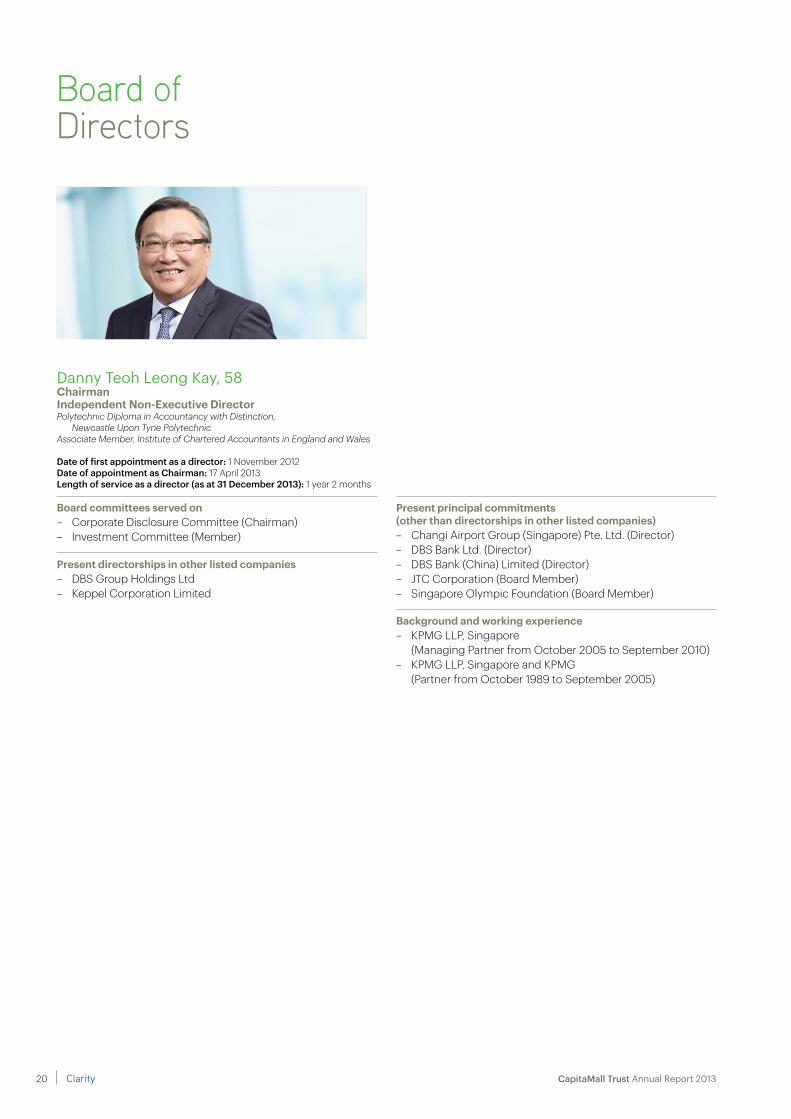
Danny Teoh Leong Kay, 58chairman independent non-executive DirectorPolytechnic Diploma in Accountancy with Distinction,
Newcastle Upon Tyne PolytechnicAssociate Member, Institute of Chartered Accountants in England and Wales
Date of first appointment as a director: 1 November 2012Date of appointment as Chairman: 17 April 2013Length of service as a director (as at 31 December 2013): 1 year 2 months
board committees served on – Corporate Disclosure Committee (Chairman)– Investment Committee (Member)
Present directorships in other listed companies– DBS Group Holdings Ltd– Keppel Corporation Limited
Present principal commitments (other than directorships in other listed companies)– Changi Airport Group (Singapore) Pte. Ltd. (Director)– DBS Bank Ltd. (Director)– DBS Bank (China) Limited (Director)– JTC Corporation (Board Member)– Singapore Olympic Foundation (Board Member)
background and working experience– KPMG LLP, Singapore
(Managing Partner from October 2005 to September 2010)– KPMG LLP, Singapore and KPMG
(Partner from October 1989 to September 2005)
Board ofDirectors
Clarity20 CapitaMall Trust Annual Report 2013

Corporate Governance & Sustainability
Lim Ming Yan, 51Deputy chairmannon-independent non-executive DirectorBachelor of Engineering (Mechanical) and Economics (First Class Honours),
University of Birmingham, UK
Date of first appointment as a director: 1 January 2013Length of service as a director (as at 31 December 2013): 1 year
board committees served on– Corporate Disclosure Committee (Member)– Executive Committee (Chairman)– Investment Committee (Chairman)
Present directorships in other listed companies– Ascott Residence Trust Management Limited
(manager of Ascott Residence Trust) (Deputy Chairman)– CapitaCommercial Trust Management Limited
(manager of CapitaCommercial Trust) (Deputy Chairman)– CapitaLand Limited– CapitaMalls Asia Limited– CapitaRetail China Trust Management Limited
(manager of CapitaRetail China Trust) (Deputy Chairman)– Central China Real Estate Limited
Present principal commitments (other than directorships in other listed companies)– Building and Construction Authority (Board Member)– Business China (Director)– CapitaLand China Holdings Pte. Ltd. (Chairman)– CapitaLand Limited (President & Group Chief Executive Officer)– CapitaLand Singapore Limited (Chairman)– CapitaLand Hope Foundation (Director)– CapitaLand Malaysia Pte. Ltd. (Chairman)– CTM Property Trust, Steering Committee (Chairman)– LFIE Holding Limited (Co-Chairman)– Shanghai YiDian Holding (Group) Company (Director)– Singapore Tourism Board (Board Member)– The Ascott Limited (Chairman)
Directorship in other listed companies held over the preceding three years– Lai Fung Holdings Limited
background and working experience– Chief Operating Officer of CapitaLand Limited
(From May 2011 to December 2012)– CEO of The Ascott Limited
(From July 2009 to February 2012) – CEO of CapitaLand China Holdings Pte Ltd
(From July 2000 to June 2009)
awards– Outstanding CEO (Overseas) in the Singapore
Business Awards 2006– Magnolia Award by the Shanghai Municipal Government
Magnolia in 2003 and 2005
21
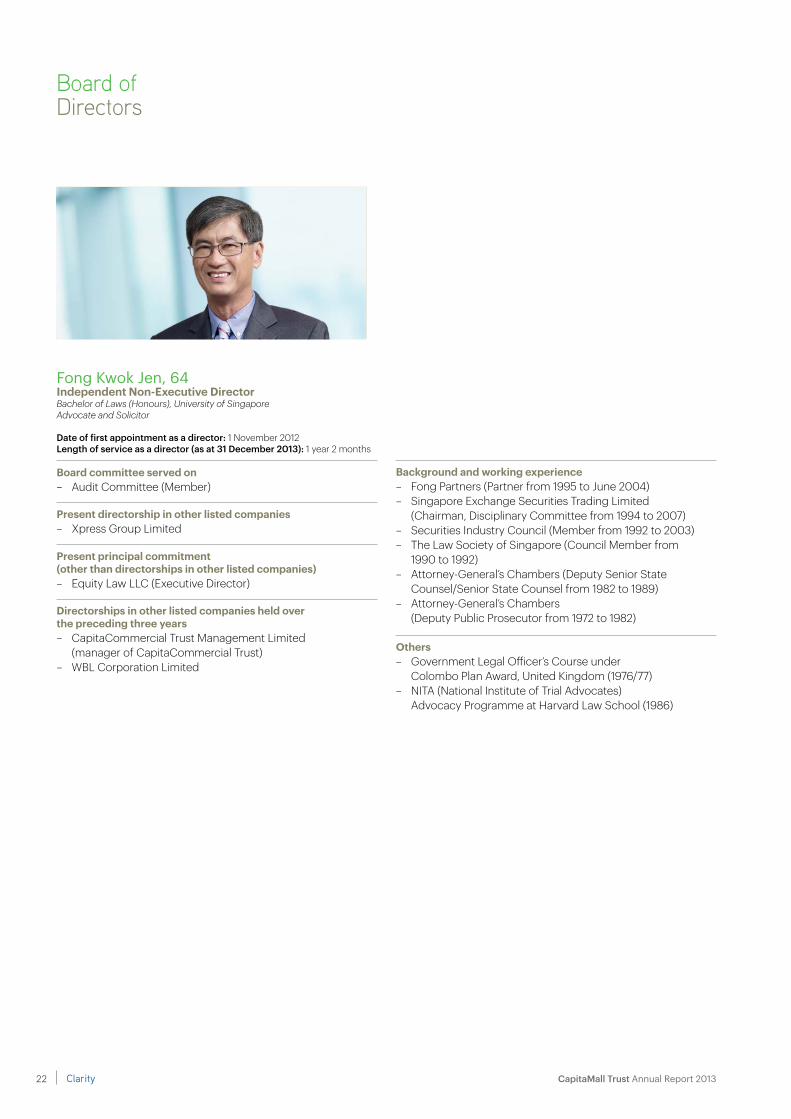
Fong Kwok Jen, 64independent non-executive DirectorBachelor of Laws (Honours), University of SingaporeAdvocate and Solicitor
Date of first appointment as a director: 1 November 2012Length of service as a director (as at 31 December 2013): 1 year 2 months
board committee served on– Audit Committee (Member)
Present directorship in other listed companies– Xpress Group Limited
Present principal commitment (other than directorships in other listed companies)– Equity Law LLC (Executive Director)
Directorships in other listed companies held over the preceding three years– CapitaCommercial Trust Management Limited
(manager of CapitaCommercial Trust)– WBL Corporation Limited
background and working experience– Fong Partners (Partner from 1995 to June 2004)– Singapore Exchange Securities Trading Limited
(Chairman, Disciplinary Committee from 1994 to 2007)– Securities Industry Council (Member from 1992 to 2003)– The Law Society of Singapore (Council Member from
1990 to 1992)– Attorney-General’s Chambers (Deputy Senior State
Counsel/Senior State Counsel from 1982 to 1989)– Attorney-General’s Chambers
(Deputy Public Prosecutor from 1972 to 1982)
others– Government Legal Officer’s Course under
Colombo Plan Award, United Kingdom (1976/77)– NITA (National Institute of Trial Advocates)
Advocacy Programme at Harvard Law School (1986)
Board ofDirectors
Clarity22 CapitaMall Trust Annual Report 2013

Corporate Governance & Sustainability
Gay Chee Cheong, 57independent non-executive DirectorBachelor of Science in Engineering (Honours),
Royal Military College of ScienceBachelor of Science (Economics), University of LondonMasters of Business Administration, National University
of Singapore
Date of first appointment as a director: 1 November 2012Length of service as a director (as at 31 December 2013): 1 year 2 months
board committee served on– Audit Committee (Member)
Present directorship in other listed companies– Hyflux Ltd
Present principal commitments (other than directorships in other listed companies)– Heliconia Capital Management Pte. Ltd. (Director)– National University of Singapore
(Member, Entrepreneurship Committee) – The UWCSEA Foundation Limited (Director)– Temasek Polytechnic (Member, Board of Governors,
Deputy Chairman, Investment Committee, Deputy Chairman, Administration Committee and Member, General Education Fund Management Committee)
background and working experience– 2G Capital Pte Ltd (Deputy Chairman and
Chief Executive Officer from 2001 to 2006)– JIT Electronics Pte Ltd (Group Executive Director
from 1997 to 2000)
23

Board ofDirectors
Ho Chee Hwee Simon, 52non-independent non-executive DirectorBachelor of Science (Estate Management) (Honours),
National University of SingaporeMaster of Science (Real Estate), National University of Singapore
Date of first appointment as a director: 25 November 2009Length of service as a director (as at 31 December 2013): 4 years 1 month
board committees served on – Corporate Disclosure Committee (Member)– Executive Committee (Member)– Investment Committee (Member)
Present directorship in other listed companies– CapitaMalls Malaysia REIT Management Sdn. Bhd.
(manager of CapitaMalls Malaysia Trust)
Present principal commitment (other than directorships in other listed companies)– CapitaMalls Asia Limited (Deputy Chief Executive Officer)
background and working experience– CapitaMall Trust Management Limited
(Chief Executive Officer and Executive Director from November 2009 to June 2012)
– CapitaMalls Asia Limited (Deputy Chief Executive Officer from January 2009 to November 2009)
– CapitaMalls Asia Limited (Chief Operating Officer from September 2004 to December 2008)
Clarity24 CapitaMall Trust Annual Report 2013

Corporate Governance & Sustainability
Lee Khai Fatt, Kyle, 62independent non-executive DirectorBachelor of Arts in Business Studies (Honours), Council for National Academic
Awards, Polytechnic of the South BankMaster of Science in International Management (Distinction),
University of London, The School of Oriental and African StudiesMaster of Business Administration and Diploma in Management,
University of London, Imperial College of Science, Technology and Medicine
Fellow of the Institute of Chartered Accountants in England and Wales and the Institute of Singapore Chartered Accountants
Date of first appointment as a director: 1 November 2012Length of service as a director (as at 31 December 2013): 1 year 2 months
board committees served on– Audit Committee (Chairman)– Investment Committee (Member)
Present directorships in other listed companies– FEO Hospitality Asset Management Pte. Ltd.
(manager of Far East Hospitality Real Estate Investment Trust)– FEO Hospitality Trust Management Pte. Ltd.
trustee-manager of Far East Hospitality Business Trust)– MFS Technology Ltd– WBL Corporation Limited
background and working experience– PricewaterhouseCoopers LLP and Price Waterhouse
(Partner from July 1990 to June 2010)
25
Richard R. Magnus, 69independent non-executive DirectorBachelor of Laws (Honours), National University of SingaporeMaster of Laws, National University of SingaporeAlumni, HBS and JF Kennedy School of Government
Date of first appointment as a director: 3 May 2010Length of service as a director (as at 31 December 2013): 3 years 8 months
board committee served on – Investment Committee (Member)
Present principal commitments (other than directorships in other listed companies)– Bioethics Advisory Committee (Chairman)– Changi Airport Group (Singapore) Pte. Ltd. (Director)– Casino Regulatory Authority (Chairman)– Justice of Peace – Mediacorp Editorial Advisory Panel (Member)– Political Films Consultative Committee (Chairman)– Public Service Commission (Member)– Public Transport Council (Member)– The Public Guardian Board (Chairman)– Temasek Cares CLG Limited (Chairman)– UNESCO’S International Bioethics Committee (Member)
background and working experience– Singapore Legal Service Commission
(Senior District Judge from 1998 to 2008)
awards– Meritorious Service Medal (2009)– Public Administration Medal (Gold) (Bar) (2003) – Public Administration Medal (Gold) (1994)– Public Administration Medal (Silver) (1983)
Board ofDirectors
Clarity26 CapitaMall Trust Annual Report 2013

Corporate Governance & Sustainability
Maj-Gen (NS) Ng Chee Khern, 48independent non-executive DirectorBachelor of Arts (Honours) in Philosophy, Politics & Economics,
University of OxfordMaster of Arts, University of OxfordMaster in Public Administration, Harvard University
Date of first appointment as a director: 8 June 2012Length of service as a director (as at 31 December 2013): 1 year 7 months
Present principal commitments (other than directorships in other listed companies)– Public Utilities Board (Board Member)– Security and Intelligence Division, Ministry of Defence,
Singapore (Director)
background and working experience– Security and Intelligence Division, Ministry of Defence,
Singapore (Senior Deputy Director from January 2010 to August 2010)
– Republic of Singapore Air Force, Ministry of Defence, Singapore (Chief of Air Force from March 2006 to December 2009)
– Republic of Singapore Air Force, Ministry of Defence, Singapore (Chief of Staff from September 2005 to March 2006)
– Republic of Singapore Air Force, Ministry of Defence, Singapore (Director of Joint Operations and Plans Directorate and Joint Staff-MINDEF from March 2004 to September 2005)
– Republic of Singapore Air Force, Ministry of Defence, Singapore (Head of Joint Operations and Joint Staff – MINDEF from June 2003 to March 2004)
– Republic of Singapore Air Force, Ministry of Defence, Singapore (Head of Air Operations from March 2001 to June 2003)
awards– Public Administration Medal (Gold) (Military) (2005)– The Legion of Merit (Degree of Commander)
by the United States– The Bintang Swa Bhuwana Paksa Utama
by Indonesia– The Knight Grand Cross (First Class)
of the Most Noble Order of the Crown of Thailand – Ordre National de la Légion d’honneur by
the French Government
27

Board ofDirectors
Tan Kian Chew, 60non-independent non-executive DirectorBachelor of Science (Mechanical Engineering) (First Class Honours),
University of AstonAdvance Management Program, Harvard University
Date of first appointment as a director: 3 May 2010Length of service as a director (as at 31 December 2013): 3 years 8 months
Present directorship in other listed companies– ARA Trust Management (Suntec) Limited
(manager of Suntec Real Estate Investment Trust)
Present principal commitment (other than directorships in other listed companies)– NTUC Fairprice Co-operative Ltd
(Group Chief Executive Officer)
background and working experience– NTUC Fairprice Co-operative Ltd
(Chief Executive Officer from October 1997 to June 2006)– Prime Minister’s Office (Principal Private Secretary to Deputy
Prime Minister Ong Teng Cheong from 1988 to 1992)– Ministry of Trade and Industry
(Deputy Director from 1983 to 1988)– Singapore Navy (Head of Operations from 1975 to 1983)
award– Public Administration Medal (Silver) (1991)
Clarity28 CapitaMall Trust Annual Report 2013
Corporate Governance & Sustainability
Tan Wee Yan, Wilson, 56non-independent executive Directorchief executive officerBachelor of Arts (Economics), National University of Singapore
Date of first appointment as a director: 1 July 2012Length of service as a director (as at 31 December 2013): 1 year 6 months
board committees served on – Executive Committee (Member)– Investment Committee (Member)
Present principal commitments (other than directorships in other listed companies)– Council for Third Age (Director)– EZ-Link Pte Ltd (Chairman)– Republic Polytechnic (Member, Board of Governors
and Member, Audit Committee) – School of Digital Media and Infocomm Technology (DMIT),
Singapore Polytechnic (Chairman, Advisory Committee)
background and working experience– CapitaMall Trust Management Limited
(Deputy Chief Executive Officer from February 2012 to June 2012)
– Singapore Post Limited (Group CEO from October 2007 to April 2010)
– NEC Asia Pte. Ltd. (Managing Director from January 2007 to September 2007)
– Mercury Interactive (President of Japan & APAC from March 2002 to March 2006)
29

Trust Management Team(CMTML)
Tan Wee Yan, Wilsonchief executive officer and executive DirectorPlease refer to description under the section on ‘Board of Directors’.
Tan Lei Kenghead, financeLei Keng is responsible for the sourcing and management of funds for CMT. She also provides support in areas of treasury, accounting and all finance-related matters in line with CMT’s investment strategy and its mall portfolio management, with a focus on driving revenue and delivering investment returns for CMT.
Prior to joining CMTML, Lei Keng had extensive regional experience in finance with locally-listed as well as American listed companies. She holds a Master of Business Administration from the University of South Florida and a Bachelor of Accountancy from the University of Singapore.
Jacqueline Leehead, investment & asset managementJacqueline oversees the investment and asset management team and is responsible for implementing CMT’s strategy of creating value for Unitholders through acquisitions, asset enhancement and active lease management. The team identifies, evaluates and executes acquisitions, divestments, asset enhancement and other strategic initiatives; prepares the annual business plan; monitors and analyses performance metrics and trends; and works with the Property Management team to execute the business plan.
Jacqueline has extensive experience in real estate including investment, corporate finance and engineering. Prior to joining CMTML, she worked in a public listed company handling mergers and acquisitions, divestments and business valuation. Jacqueline started her career as an electrical engineer, and was involved in the planning, design and construction of major building and infrastructure projects. She holds a Master of Business Administration from the University of Sydney, Australia; a Master of Arts and a Bachelor of Arts (Honours) in Engineering Science from the University of Oxford, United Kingdom.
Audrey Tanassistant vice President, investor relationsAudrey is responsible for building relations and facilitating strategic communications with CMT’s Unitholders, potential investors and analysts through various communication platforms, as well as providing feedback from the investment community.
Prior to joining CMTML, Audrey has more than 14 years’ regional experience in finance, accounting and treasury with locally-listed and multinational companies. She holds a Bachelor of Business in Accountancy and is a Certified Practising Accountant with CPA Australia.
Clarity30 CapitaMall Trust Annual Report 2013

Corporate Governance & Sustainability
Property Management Team(CRMPL)
Teresa TeowGeneral manager, singaporeTeresa has more than 20 years of experience in real estate management and currently oversees the operations of 19 retail properties in Singapore. She is responsible for the smooth execution of operational plans and the operational efficiency of the malls in order to achieve operational targets. As part of her portfolio, Teresa also oversees the Singapore Group Leasing, Group Marketing Communications and Group Operations departments, to achieve better synergies for both leasing and marketing communications activities and to leverage on the scale of the portfolio. Teresa also assists in planning for staff development so as to ensure continuity of operations in the portfolio. Teresa holds a Bachelor of Business (Business Administration) degree from the Royal Melbourne Institute of Technology, Australia.
Cindy Peh head, leasing, singaporeCindy oversees the Singapore Group Leasing function which supports CMT’s malls in all aspects of leasing activities and asset enhancement initiatives. She works closely with the malls’ leasing teams to ensure greater synergies and unlock greater value for CMT’s malls. Cindy is also involved in conceptualisation and supports CMT’s development projects in all leasing aspects. She formulates initiatives to achieve greater efficiency and improve business processes for the leasing function in the malls. Cindy has 16 years of experience in retail leasing,
which includes six years of retail consultancy for key malls. She holds a Bachelor of Science (Economics) from the National University of Singapore.
Irene Tanhead, marketing communications, singaporeIrene has 20 years of marketing experience in engaging consumers through traditional and new media. She heads the Singapore Group Marketing Communications function and formulates strategic direction and initiatives to engage shoppers, tenants and the communities of CMT’s malls. With a suite of loyalty products such as CapitaCard, CapitaVoucher and CAPITASTAR, she builds greater loyalty amongst shoppers and generates business opportunities for tenants within CMT’s malls. She works closely with the malls’ marketing communications teams to ensure greater synergies and unlock value for CMT’s malls. Irene holds a Master of Commerce in E-business Marketing from the University of New South Wales, Australia and a Bachelor of Commerce in Marketing from the Curtin University, Australia.
Angela Nghead, tenancy Design management, singaporeAngela oversees the Tenancy Design Management (TDM) team to review and approve designs for shop fit-outs in the shopping malls owned by CMT. She strategises and develops retail design guidelines, and oversees visual merchandising programmes to ensure that high standards of design and visual display are maintained in the malls. The key function of visual merchandising is to complement the TDM to
meet the objective of enhancing tenants’ returns on investment through improved visual displays. She is also involved in conceptualisation and feasibility studies for asset enhancement initiatives and development projects. Angela has over 10 years of real estate experience, with experience in retail design. She holds a Diploma in Interior Design from the National Design Academy, London.
Jason Loyhead, operations, singaporeJason Loy formulates the strategic direction of the engineering and operational aspects in CMT’s malls. He is responsible for developing operational guidelines as well as implementing facilities management policies, which include the establishment of standard operating procedures for the malls to run efficiently. He also devises new initiatives and implements innovative ways to improve business work processes for productivity. Jason is a registered Professional Engineer with 18 years of experience in planning, design, supervision of mechanical & electrical services, technical due diligence, project administration, operations, sustainability and green building technologies. He holds a Bachelor of Engineering in Mechanical and Production Engineering from the Nanyang Technological University, Singapore.
31
our roleOur primary role as the manager of CMT (Manager) is to set the strategic direction of CMT and make recommendations to HSBC Institutional Trust Services (Singapore) Limited, in its capacity as trustee of CMT (Trustee), on acquisition, divestment and enhancement of the assets of CMT in accordance with its stated investment strategy. The research, evaluation and analysis required for this purpose is coordinated and carried out by us as the Manager.
As the Manager, we have general powers of management over the assets of CMT. Our primary responsibility is to manage the assets and liabilities of CMT for the benefit of the unitholders of CMT (Unitholders). We do this with a focus on generating rental income and enhancing asset value over time so as to maximise the returns from the investments, and ultimately the distributions and total returns to Unitholders.
Our other functions and responsibilities as the Manager include:
(a) using our best endeavours to conduct CMT’s business in a proper and efficient manner and to conduct all transactions with, or on behalf of, CMT at arm’s length;
(b) preparing annual business plans for review by the directors of the Manager (Directors), including forecasts on revenue, net income and capital expenditure, explanations on major variances to previous years’ numbers, written
commentaries on key issues and underlying assumptions on rental rates, operating expenses and any other relevant assumptions;
(c) ensuring compliance with relevant laws and regulations, including the Listing Manual of Singapore Exchange Securities Trading Limited (SGX-ST) (Listing Manual), the Code on Collective Investment Schemes (CIS Code) issued by the Monetary Authority of Singapore (MAS) (including Appendix 6 of CIS Code (Property Funds Appendix)) and the tax rulings issued by the Inland Revenue Authority of Singapore on the taxation of CMT and Unitholders;
(d) attending to all regular communications with Unitholders; and
(e) supervising CapitaLand Retail Management Pte Ltd (Property Manager), the property manager which performs the day-to-day property management functions (including leasing, marketing, promotion, coordination and property management) for CMT’s malls; with regard to Raffles City Singapore (RCS), which is held by CMT and CapitaCommercial Trust (CCT) in the proportions of 40.00% and 60.00% respectively, the Property Manager holds 40.00% interest in CapitaLand (RCS) Property Management Pte. Ltd. which provides property management services to RCS with CapitaLand Commercial Management Pte. Ltd., the
property manager of the properties owned by CCT, holding the other 60.00%. As a result of its interest in CapitaLand (RCS) Property Management Pte. Ltd., the Property Manager is able to play a key role in directing the property management function for RCS.
CMT, constituted as a trust, is externally managed by the Manager and therefore has no personnel of its own. The Manager appoints experienced and well qualified management to run its day-to-day operations. All Directors and employees of the Manager are remunerated by the Manager and not CMT.
The Manager was appointed in accordance with the terms of the trust deed constituting CMT and dated 29 October 2001 (as amended, varied or supplemented from time to time) (Trust Deed). The Trust Deed also outlines certain circumstances under which the Manager can be removed, including by notice in writing given by the Trustee upon the occurrence of certain events, or by a resolution passed by a simple majority of Unitholders present and voting at a meeting of Unitholders duly convened and held in accordance with the provisions of the Trust Deed.
our corPorateGovernance cultureThe Manager observes high standards of corporate conduct which are in line with the Principles of the Code of Corporate Governance 2012 (Code). The Manager believes in developing and maintaining sound and transparent policies
CorporateGovernance
Clarity32 CapitaMall Trust Annual Report 2013

Corporate Governance & Sustainability
and practices to meet the specific business needs of CMT and to provide a firm foundation for a trusted and respected business enterprise. The Manager remains focused on complying with the substance and spirit of the Principles of the Code while achieving operational excellence and delivering CMT’s long-term strategic objectives.
Further, in conjunction with the Singapore Corporate Governance Week 2013 initiated by the Securities Investors Association (Singapore), the Manager is a signatory to the Statement of Support Towards Excellence in Corporate Governance. With this pledge, the Manager has, together with more than 100 other companies, made a public promise to uphold high standards of corporate governance.
This report on the corporate governance practices for financial year 2013 describes the Manager’s application of good governance principles in building a company committed to integrity, transparency, excellence and its people. This application is underpinned by sound and robust systems of internal controls and accountability to promote and drive long-term sustainable growth and value for Unitholders.
The following sections outline the Manager’s policies and practices on corporate governance. Where there is any material deviation from any Principle of the Code, an explanation has been provided within this report.
our achievementsOur commitment towards strong corporate governance was affirmed with CMT garnering the following awards at the Securities Investors Association (Singapore) Investors’ Choice Awards 2013:
• WinnerofSingaporeCorporate Governance Award (REITs & Business Trusts category)
• WinnerforMostTransparentCompany Award (REITs & Business Trusts category)
(a) boarD mattersthe board’s conduct of affairsPrinciple 1:every company should be headed by an effective board to lead and control the company. the board is collectively responsible for the long-term success of the company. the board works with management to achieve this objective and management remains accountable to the board.
The Manager is led by a Board of Directors (Board) comprising a majority of independent non-executive Directors. Each Director brings to the Board skills, experience, insights and sound judgement, which together with strategic networking relationships, serve to further the interests of CMT. At all times, the Directors are collectively and individually obliged to act honestly and with diligence, and consider the best interests of Unitholders.
The Board oversees the affairs of the Manager, in furtherance
of the Manager’s primary responsibility to manage the assets and liabilities of CMT for the benefit of Unitholders. The Chief Executive Officer, who is assisted by management team of the Manager (Management), is responsible for the day-to-day management and overall operation of CMT’s business.
The Board provides leadership to the Management, sets strategic directions and oversees the competent management of CMT. The Board establishes goals for Management and monitors the achievement of these goals. It ensures that proper and effective controls are in place to assess and manage business risks and compliance with requirements under the Listing Manual, the Property Funds Appendix, as well as any other applicable guidelines prescribed by the SGX-ST, the MAS or other relevant authorities, and applicable laws. It also sets the disclosure and transparency standards for CMT and ensures that obligations to Unitholders and other stakeholders are understood and met.
Various Board Committees, namely the Audit Committee, Corporate Disclosure Committee, Executive Committee and Investment Committee have been constituted with clear written Terms of Reference to assist the Board in the discharge of its functions.
Each of these Board Committees operates under delegated authority from the Board. The Board may
33

The Board has adopted a set of internal controls which establishes approval limits for, amongst others, capital expenditure, investments and divestments and bank borrowings. Apart from matters that specifically require the Board’s approval – such as the issue of new units, income distributions and other returns to Unitholders – the Board, while approving certain transactions exceeding certain threshold limits, delegates authority for transactions below those limits to Board Committees and Management. Approval sub-limits are also provided at Management level to optimise operational efficiency.
The Board meets at least once every quarter, and as required by business imperatives. Where a physical Board meeting is not possible, the Articles of Association of the Manager permit the Directors to meet via teleconferencing or video conferencing. The Board and Board Committees may also make decisions by way of resolutions in writing.
A total of four Board meetings were held in the financial year 2013. A table showing the attendance record of Directors at Board and Audit Committee meetings during the year under review is set out on page 34 of the Annual Report.
Corporate Governance
form other Board Committees as dictated by business imperatives. Membership of the various Board Committees is carefully managed to ensure an equitable distribution of responsibilities among Board members, to maximise the effectiveness of the Board and to foster active participation and contribution from Board members. Diversity of experience and appropriate skills are considered.
A table of the Board members’ participation in the various Board Committees is set out on page 34 of the Annual Report. This reflects each Board member’s additional responsibilities and special focus in the respective Board Committees.
comPosition anD attenDance recorD of meetinGs of the boarD anD boarD committees in 2013
Composition Attendance Record of Meetings
Board MembersAudit
Committee
CorporateDisclosure
Committeeexecutive
CommitteeInvestmentCommittee
Boardnumber of
MeetingsHeld: 4
AuditCommitteenumber of
MeetingsHeld: 4
James Koh Cher Siang 1 – C – C 1 N.A.Danny Teoh Leong Kay 2 – C – M 4 N.A.Lim Ming Yan 3 – M C C 4 N.A.Fong Kwok Jen M – – – 4 4Gay Chee Cheong M – – – 4 4Ho Chee Hwee Simon – M M M 4 N.A.Lee Khai Fatt, Kyle C – – M 4 4Maj-Gen (NS) Ng Chee Khern – – – – 4 N.A.Richard R. Magnus – – – M 3 N.A.Tan Kian Chew – – – – 4 N.A.Tan Wee Yan, Wilson – – M M 4 N.A.
C: Chairman M: Member N.A.: Not Applicable
1 James Koh Cher Siang resigned as a Non-Executive Director and ceased to be Chairman of the Board, Chairman of the Corporate Disclosure Committee and Chairman of the Investment Committee with effect from the conclusion of the Annual General Meeting of the Unitholders on 17 April 2013.
2 Danny Teoh Leong Kay was appointed as Chairman of the Board, Chairman of the Corporate Disclosure Committee and a member of the Investment Committee with effect from the conclusion of the Annual General Meeting of the Unitholders on 17 April 2013.
3 Lim Ming Yan was appointed as Chairman of the Investment Committee with effect from the conclusion of the Annual General Meeting of the Unitholders on 17 April 2013.
Clarity34 CapitaMall Trust Annual Report 2013

Corporate Governance & Sustainability
Board meetings for each year are scheduled in advance in the preceding year to facilitate Directors’ individual administrative arrangements in respect of competing commitments.
The Manager provides suitable training for Directors. Upon appointment, each Director is provided a formal letter of appointment setting out various information including duties and obligations as a Director. Newly appointed Directors are briefed on the business activities of CMT, its strategic directions and policies, the regulatory environment in which CMT operates and the Manager’s corporate governance practices.
Following their appointment, Directors are provided with opportunities for continuing education in areas such as Directors’ duties and responsibilities, changes to regulations and accounting standards and industry-related matters so as to be updated on matters that affect or may enhance their performance as Board or Board Committee members.
board composition and GuidancePrinciple 2:there should be a strong and independent element on the board, which is able to exercise objective judgement on corporate affairs independently, in particular, from management and 10% shareholders. no individual or small group of individuals should be allowed to dominate the board’s decision making.
The Board comprises 10 Directors, of whom six are independent non-executive Directors who have no relationship with the Manager, its related corporations, its shareholders who hold 10% or more of the voting shares in the Manager, Unitholders who hold 10% or more of the units in issue of CMT or its officers that could interfere, or be reasonably perceived to interfere, with the exercise of the Directors’ independent business judgement in the best interests of CMT.
The size and composition of the Board is reviewed regularly to ensure that the Board is of appropriate size and has an optimal mix of expertise and experience, and comprises persons who, as a group, provide the necessary core competencies, taking into consideration the nature and scope of CMT’s operations. The profiles of the Directors are set out on pages 20 to 29 of the Annual Report.
The Directors are business leaders and professionals with financial, banking, real estate, legal, investment and accounting backgrounds. The varied background of the Directors enables Management to benefit from their external, diverse and objective perspectives on issues brought before the Board. It also enables the Board to interact and work with Management through a robust exchange of ideas and views to help shape the strategic process. This, together with the separation of the roles of the Chairman and the Chief Executive Officer,
provides a healthy professional relationship between the Board and Management with clarity of roles and facilitates robust deliberation on the business activities of CMT.
The independence of each Director is reviewed by the Board upon appointment, and thereafter annually and as and when circumstances require. The Board has determined that Mr Danny Teoh Leong Kay, Mr Fong Kwok Jen, Mr Gay Chee Cheong, Mr Lee Khai Fatt, Kyle, Maj-Gen (NS) Ng Chee Khern and Mr Richard R. Magnus to be Independent Directors under the Code.
chairman and chief executive officerPrinciple 3:there should be a clear division of responsibilities between the leadership of the board and the executives responsible for managing the company’s business. no one individual should represent a considerable concentration of power.
To maintain an appropriate balance of power, increased accountability and greater capacity of the Board for independent decision making, the roles and responsibilities of Chairman and Chief Executive Officer are held by separate individuals.
The independent non-executive Chairman is responsible for leading the Board and ensuring that the Board is effective on all aspects of its role, while the Chief Executive Officer is responsible for the overall operation of the
35
CMT’s business. The Chairman and Chief Executive Officer are not immediate family members.
The Chairman ensures that the members of the Board and Management work together with integrity, competency and moral authority, and that the Board constructively engages Management on strategy, business operations, enterprise risk and other plans. The Chairman also approves the agendas for the Board meetings and ensures sufficient allocation of time for thorough discussion of each agenda item.
The Chief Executive Officer is a Board member and has full executive responsibilities over the business directions and operational decisions of CMT. He ensures the quality and timeliness of the flow of information between Management and the Board. He is also responsible for ensuring that the Manager complies with the Principles and Guidelines of the Code. board membershipPrinciple 4:there should be a formal and transparent process for the appointment and re-appointment of directors to the board.
As the Manager is not a listed entity, it does not have a nominating committee. Thus, the Board performs the functions that such a committee would otherwise perform, namely, it administers nominations to the Board, reviews the structure, size and composition of the Board, and reviews the independence of
Board members. Directors of the Manager are not subject to periodic retirement by rotation.
Under the Code, the composition of the Board, including the selection of candidates for new appointments to the Board as part of the Board’s renewal process, is determined using the following principles:
(a) the Board should comprise Directors with a broad range of commercial experience, including expertise in funds management, the property industry and in the banking and legal fields; and
(b) at least one-third of the Board should comprise Independent Directors. Where, among other things, the Chairman of the Board is not an Independent Director, at least half of the Board should comprise Independent Directors.
The selection of candidates is evaluated taking into account various factors including the current and mid-term needs and goals of CMT, as well as the relevant expertise of the candidates and their potential contributions. Candidates may be put forward or sought through contacts and recommendations.
Guideline 4.4 of the Code recommends that the Board determine the maximum number of listed companies board representations which any director may hold and disclose this in the annual report. The Board is of the view that, the limit on the number of listed company
Corporate Governance
directorships that an individual may hold should be considered on a case-by-case basis, as a person’s available time and attention may be affected by many different factors such as whether they are in full-time employment and their other responsibilities. A Director with multiple directorships is expected to ensure that sufficient attention is given to the affairs of the Manager in managing the assets and liabilities of CMT for benefit of Unitholders. The Board believes that each individual Director is best placed to determine and ensure that he is able to devote sufficient time and attention to discharge his duties and responsibilities as a Director of the Manager, bearing in mind his other commitments. In considering the nomination of Directors for appointment, the Board will take into account, amongst others, the competing time commitments faced by Directors with multiple Board memberships. All Directors had confirmed that notwithstanding the number of their individual listed company board representations and other principal commitments, which the Directors held, they were able to devote sufficient time and attention to the affairs of the Manager in managing the assets and liabilities of CMT for benefit of Unitholders. The Board is of the view that current commitments of each of its Directors are reasonable and each of the Directors is able to and has been adequately carrying out his duties.
board PerformancePrinciple 5:there should be a formal
Clarity36 CapitaMall Trust Annual Report 2013

Corporate Governance & Sustainability
annual assessment of the effectiveness of the board as a whole and its board committees and the contribution by each director to the effectiveness of the board.
The Manager believes that Board performance is ultimately reflected in the long-term performance of CMT.
Reviews of Board performance are carried out on an informal basis. The Manager believes that collective Board performance and that of individual Board members are better reflected in, and evidenced by, its and their proper guidance, diligent oversight and able leadership, and the support that it lends to Management in steering CMT in the appropriate direction, and the long-term performance of CMT whether under favourable or challenging market conditions.
Contributions by an individual Board member can also take other forms, including providing objective perspectives on issues, facilitating business opportunities and strategic relationships, and accessibility by Management outside of a formal environment of Board and/or Board Committee meetings.
Renewals or replacement of Board members do not necessarily reflect their contributions to date, but may be driven by the need to position and shape the Board in line with the needs of CMT and its business.
access to informationPrinciple 6:in order to fulfil their responsibilities, directors should be provided with complete, adequate and timely information prior to board meetings and on an on-going basis so as to enable them to make informed decisions to discharge their duties and responsibilities.
The Manager believes that the Board should be provided with timely, adequate and complete information prior to Board meetings, and as and when the need arises. As a general rule, Board papers are sent to Board members at least five working days prior to the Board meeting to allow the members to prepare for the Board meetings; this enables the discussions to focus on questions that the members may have. However, sensitive matters may be tabled at the meeting itself or discussed without any papers being distributed. At all times the Directors have access to the Manager’s records, such as Board papers and related materials, and minutes of Board meetings and Board Committee meetings.
Management provides timely, adequate and complete information to the Board on Board affairs and issues requiring the Board’s decision. It also provides ongoing reports relating to the operational and financial performance of the Manager, such as monthly management reports. Timely communication with members of the Board is effected through electronic means which include electronic
mail, teleconferencing and video conferencing. Informal meetings are also held for Management to brief Directors on prospective deals and potential developments in the early stages before formal Board approval is sought.
The Board has separate and independent access to Management including the company secretary of the Manager (Company Secretary) at all times. The Company Secretary attends to corporate secretarial administration matters and is the corporate governance advisor on corporate matters to the Board and Management. The Company Secretary attends Board meetings. The Board, whether as individual Director or as a group, is also entitled to have access to independent professional advice where required, at the Manager’s expense.
The Audit Committee also meets the external and internal auditors separately at least twice a year without the presence of the Chief Executive Officer and Management, and has unfettered access to any information that it may require.
(b) remuneration matters
Procedures for Developing remuneration PoliciesPrinciple 7:there should be a formal and transparent procedure for developing policy on executive remuneration and for fixing the remuneration packages of individual directors. no director should
37
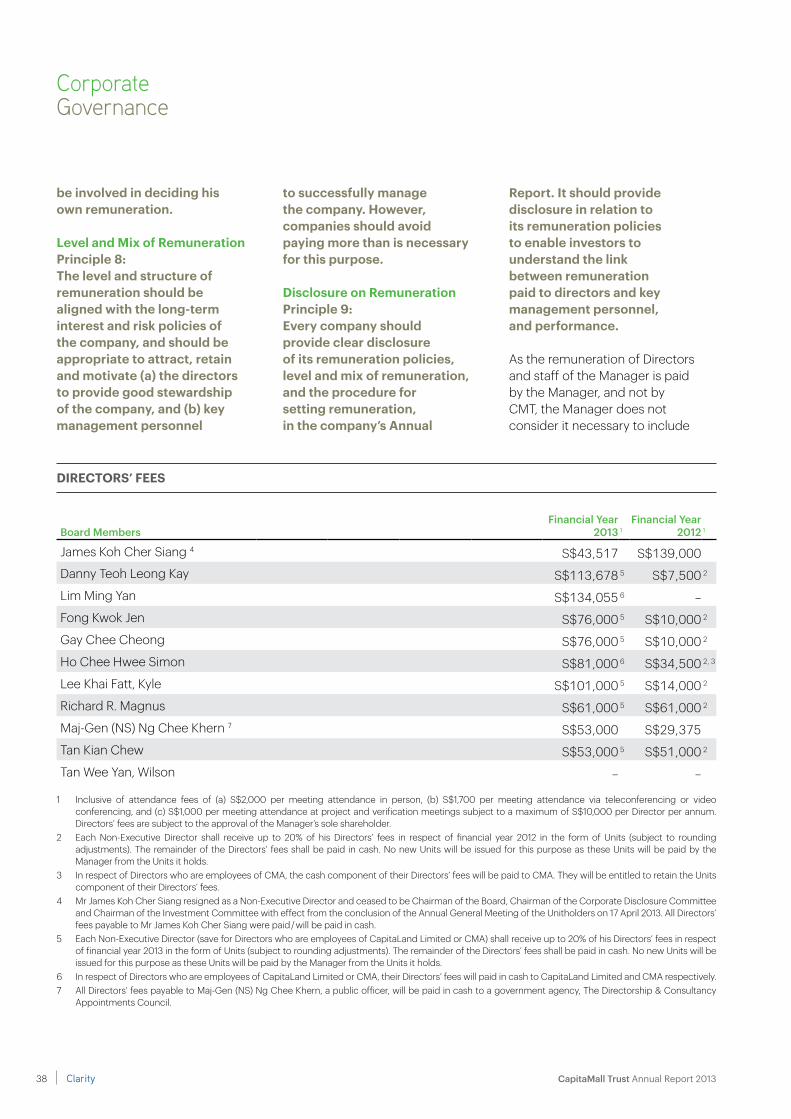
Directors’ fees
Board MembersFinancial Year
2013 1Financial Year
2012 1
James Koh Cher Siang 4 S$43,517 S$139,000Danny Teoh Leong Kay S$113,678 5 S$7,500 2
Lim Ming Yan S$134,055 6 –Fong Kwok Jen S$76,000 5 S$10,000 2
Gay Chee Cheong S$76,000 5 S$10,000 2
Ho Chee Hwee Simon S$81,000 6 S$34,500 2, 3
Lee Khai Fatt, Kyle S$101,000 5 S$14,000 2
Richard R. Magnus S$61,000 5 S$61,000 2
Maj-Gen (NS) Ng Chee Khern 7 S$53,000 S$29,375Tan Kian Chew S$53,000 5 S$51,000 2
Tan Wee Yan, Wilson – –
1 Inclusive of attendance fees of (a) S$2,000 per meeting attendance in person, (b) S$1,700 per meeting attendance via teleconferencing or video conferencing, and (c) S$1,000 per meeting attendance at project and verification meetings subject to a maximum of S$10,000 per Director per annum. Directors’ fees are subject to the approval of the Manager’s sole shareholder.
2 Each Non-Executive Director shall receive up to 20% of his Directors’ fees in respect of financial year 2012 in the form of Units (subject to rounding adjustments). The remainder of the Directors’ fees shall be paid in cash. No new Units will be issued for this purpose as these Units will be paid by the Manager from the Units it holds.
3 In respect of Directors who are employees of CMA, the cash component of their Directors’ fees will be paid to CMA. They will be entitled to retain the Units component of their Directors’ fees.
4 Mr James Koh Cher Siang resigned as a Non-Executive Director and ceased to be Chairman of the Board, Chairman of the Corporate Disclosure Committee and Chairman of the Investment Committee with effect from the conclusion of the Annual General Meeting of the Unitholders on 17 April 2013. All Directors’ fees payable to Mr James Koh Cher Siang were paid / will be paid in cash.
5 Each Non-Executive Director (save for Directors who are employees of CapitaLand Limited or CMA) shall receive up to 20% of his Directors’ fees in respect of financial year 2013 in the form of Units (subject to rounding adjustments). The remainder of the Directors’ fees shall be paid in cash. No new Units will be issued for this purpose as these Units will be paid by the Manager from the Units it holds.
6 In respect of Directors who are employees of CapitaLand Limited or CMA, their Directors’ fees will paid in cash to CapitaLand Limited and CMA respectively. 7 All Directors’ fees payable to Maj-Gen (NS) Ng Chee Khern, a public officer, will be paid in cash to a government agency, The Directorship & Consultancy
Appointments Council.
Corporate Governance
be involved in deciding his own remuneration.
level and mix of remunerationPrinciple 8:the level and structure of remuneration should be aligned with the long-term interest and risk policies of the company, and should be appropriate to attract, retain and motivate (a) the directors to provide good stewardship of the company, and (b) key management personnel
to successfully manage the company. however, companies should avoid paying more than is necessary for this purpose.
Disclosure on remunerationPrinciple 9:every company should provide clear disclosure of its remuneration policies, level and mix of remuneration, and the procedure for setting remuneration, in the company’s annual
report. it should provide disclosure in relation to its remuneration policies to enable investors to understand the link between remuneration paid to directors and key management personnel, and performance.
As the remuneration of Directors and staff of the Manager is paid by the Manager, and not by CMT, the Manager does not consider it necessary to include
Clarity38 CapitaMall Trust Annual Report 2013

Corporate Governance & Sustainability
information (other than as voluntarily provided in the table on page 38 of the Annual Report) on the remuneration of the Directors and its key executives in this report. The Manager is not listed entity and so it does not have a remuneration committee.
The Board has carefully considered the remuneration policies and practices of the Manager’s holding company, CapitaMalls Asia Limited (CMA), and believes that such policies and practices will provide the Manager with a transparent and suitable remuneration policy. CMA has a remuneration committee that determines and recommends to the CMA board of directors the framework of remuneration, terms of engagement, compensation and benefits for senior executives of CMA and its subsidiaries, which include the Chief Executive Officer and Management.
The Directors’ fees for financial year 2013 are shown in the table on page 38 of the Annual Report. The Chief Executive Officer does not receive any fees in his capacity as a Director. Directors’ fees generally comprise a basic retainer fee as a Director, an additional fee for serving on any of the Board Committees and an attendance fee for participation in meetings of the Board and any of the Board Committees, project meetings and verification meetings.
Non-Executive Directors (save for Directors who are employees of CapitaLand Limited or CMA) receive Directors’ fees which are
payable by way of cash and units in CMT (Units). The Manager believes that the payment of a portion of the Directors’ fees in Units will serve to align the interests of such Directors with that of Unitholders and CMT’s long-term growth and value.
(c) accountability anD auDit
accountabilityPrinciple 10:the board should present a balanced and understandable assessment of the company’s performance, position and prospects.
The Manager provides Unitholders with quarterly and annual financial statements as required by and within the timeframe set out in the Listing Manual.
In presenting the annual and quarterly financial statements to Unitholders, the Board aims to provide Unitholders with a balanced, clear and understandable assessment of CMT’s performance, position and prospects. In order to achieve this, Management provides the Board with management accounts on a monthly basis and such explanation and information as any Director may require, to enable the Directors to keep abreast, and make a balanced and informed assessment, of the CMT’s financial performance, position and prospects.
The Manager believes in conducting itself in ways that seek to deliver maximum sustainable value to Unitholders. Best practices are promoted
as a means to build an excellent business for Unitholders and the Manager is accountable to Unitholders for CMT’s performance. Prompt fulfilment of statutory reporting requirements is but one way to maintain Unitholders’ confidence and trust in the capability and integrity of the Manager.
risk management and internal controlsPrinciple 11:the board is responsible for the governance of risk. the board should ensure that management maintains a sound system of risk management and internal controls to safeguard shareholders’ interests and the company’s assets, and should determine the nature and extent of the significant risks which the board is willing to take in achieving its strategic objectives.
The Manager has in place an adequate and effective system of internal controls addressing material financial, operational, compliance and information technology risks to safeguard Unitholders’ interests and CMT’s assets.
The Board has overall responsibility for the governance of risk and exercises oversight of the risk management strategy and framework.
The Audit Committee reviews and recommends to the Board, the adequacy and effectiveness of the risk management and internal control systems including financial, operational, compliance and information technology within CapitaMall Trust and its subsidiaries (CMT Group).
39

Corporate Governance
The Manager adopts an Enterprise Risk Management Framework (ERM Framework) which sets out the required environmental and organisational components for managing risk in an integrated, systematic and consistent manner. The ERM Framework and related policies are reviewed at least annually.
As part of the ERM Framework, Management, amongst other things, undertakes and performs a risk and control self-assessment (RCSA) process. As a result of the RCSA process, the Manager produces and maintains a risk register which identifies the material risks it faces and the corresponding internal controls in place to manage or mitigate those risks. The material risks are reviewed annually by the Audit Committee and the Board.
Internal and external auditors conduct audits that involve testing the effectiveness of the material internal control systems in the CMT Group addressing financial, operational, compliance and information technology risks, including testing, where practical, material internal controls in areas managed by external service providers. Any material non-compliance or lapses in internal controls together with corrective measures recommended by internal and external auditors are reported to and reviewed by the Audit Committee. The adequacy and effectiveness of the measures taken by the Manager in response to the recommendations made by the internal and external
auditors are also reviewed by the Audit Committee.
The Board has received assurance from the Chief Executive Officer and Head of Finance of the Manager that:
(a) the financial records of the CMT Group have been properly maintained and the financial statements for the year ended 31 December 2013 give a true and fair view of the CMT Group’s operations and finances; and
(b) the system of risk management and internal controls in place within the CMT Group is adequate and effective in addressing the material risks faced by the CMT Group in its current business environment including material financial, operational, compliance and information technology risks. The Chief Executive Officer and Head of Finance of the Manager have obtained similar assurance from the functions heads in CMT Group.
In addition, in the year under review, the Board has also received quarterly certification by Management on the integrity of financial reporting and the Board has provided a negative assurance confirmation to Unitholders, as required by the Listing Manual.
Based on the ERM Framework established and the reviews conducted by Management and both the internal and external auditors as well as the assurance from the Chief Executive Officer and Head of
Finance of the Manager, the Board concurs with the recommendation of the Audit Committee and is of the opinion, that the CMT Group’s system of risk management and internal controls addressing material financial, operational, compliance and information technology risks is adequate and effective to meet the needs of the CMT Group in its current business environment as at 31 December 2013.
The Board notes that the system of risk management and internal controls established by the Manager provides reasonable, but not absolute, assurance that the CMT Group will not be significantly affected by any event that can be reasonably foreseen as it strives to achieve its business objectives. However, the Board also notes that no system of risk management and internal controls can provide absolute assurance in this regard, or absolute assurance against poor judgement in decision making, human error, losses, fraud or other irregularities.
audit committeePrinciple 12:the board should establish an audit committee with written terms of reference which clearly set out its authority and duties.
The Audit Committee comprises three independent non-executive Directors. The members bring with them invaluable recent and relevant managerial and professional expertise in accounting and related financial management domains.
Clarity40 CapitaMall Trust Annual Report 2013

Corporate Governance & Sustainability
The Audit Committee functions independently of the officers and other Directors of the Manager who are not Audit Committee members. Management is required to provide the fullest co-operation in providing information and resources, and in implementing or carrying out all requests made by the Audit Committee. The Audit Committee has direct access to the internal and external auditors and full discretion to invite any Director or executive officer to attend its meetings. Similarly, both the internal and external auditors are given unrestricted access to the Audit Committee.
The Audit Committee is guided by Terms of Reference which defines its scope of authority. Specifically, the Audit Committee:
(a) monitors and evaluates the effectiveness of the Manager’s system of risk management and internal controls (including financial, operational and compliance controls and risk management policies and systems) through reviewing internal and external audit reports to ensure that where deficiencies in internal controls have been identified, appropriate and prompt remedial action is taken by Management;
(b) reviews the quality and reliability of information prepared for inclusion in the financial reports and approves the financial statements and the audit report before recommending to the Board for approval;
(c) reviews the adequacy and effectiveness of the internal audit function;
(d) monitors the procedures established to regulate all transactions involving an Interested Person (as defined in Chapter 9 of the Listing Manual) and /or Interested Party (as defined in Property Funds Appendix) (each, an Interested Person) and CMT and/or its subsidiaries (Interested Person Transactions) including ensuring compliance with the provisions of the Listing Manual and Property Funds Appendix relating to Interested Person Transactions;
(e) reviews the appointment and re-appointment of external auditors (including remuneration and terms of engagement) before recommending them to the Board for recommendation to Unitholders at each annual general meeting and reviewing the adequacy of existing audits in respect of cost, scope and performance;
(f) reviews the scope and results of the external audit and also assesses the cost effectiveness, the independence and objectivity of the external auditors. Where the external auditors also supply substantial volume of non-audit services to CMT, the Audit Committee shall keep the nature and extent of such services under review, seeking to balance the maintenance of objectivity and value for money; and
(g) monitors the procedures in place to ensure compliance with applicable legislation, the Listing Manual and the Property Funds Appendix.
The Audit Committee has reviewed all non-audit services provided by the external auditors during the financial year and is satisfied that the nature and extent of such services will not prejudice the independence and objectivity of the external auditors. The aggregate amount of audit fees paid and payable to the external auditors for financial year 2013 was S$384,748, of which audit fees amounted to S$373,748 and non-audit fees amounted to S$11,000.
Management closely monitors changes to accounting standards and other similar issues which may potentially have an impact on financial statements, and provides the Audit Committee with relevant briefings and updates during quarterly Audit Committee meetings, at specially convened sessions conducted by professionals or via circulation of Audit Committee papers.
A total of four Audit Committee meetings were held in 2013. The Audit Committee also held two meetings with the external auditors and internal auditors, without Management’s presence, to discuss the reasonableness of the financial reporting process, the system of internal controls, and the significant comments and recommendations by the auditors.
41

Corporate Governance
The Manager confirms, on behalf of CMT, that CMT complies with Rule 712 and Rule 715 of the Listing Manual.
internal auditPrinciple 13:the company should establish an effective internal audit function that is adequately resourced and independent of the activities it audits.
The Manager has in place an internal audit function supported by CMA’s Internal Audit Department (CMA IA) which reports directly to the Audit Committee and administratively to the Chief Executive Officer. CMA IA plans its internal audit schedules in consultation with, but independently of, Management and its plan is submitted to the Audit Committee for approval prior to the beginning of each year. The Audit Committee also meets with CMA IA at least twice a year without the presence of Management. CMA IA has unfettered access to all the Manager’s documents, records, properties and personnel, including access to the Audit Committee.
To ensure that the internal audits are performed effectively, CMA IA recruits and employs suitably qualified professional staff with the requisite skill sets and experience.
CMA IA identifies and provides training and development opportunities for its staff to ensure their technical knowledge and skill sets remain current and relevant.
(D) unitholDer riGhts anD resPonsibilities
shareholder rightsPrinciple 14:companies should treat all shareholders fairly and equitably, and should recognise, protect and facilitate the exercise of shareholders’ rights, and continually review and update such governance arrangements.
The Manager is committed to treating all Unitholders fairly and equitably and keeping all Unitholders and other stakeholders and analysts informed of the performance and changes in CMT or its business which would be likely to materially affect the price or value of Units, on a timely and consistent basis, so as to assist Unitholders and investors in their investment decisions.
The Manager provides accurate and timely disclosure of material information on the SGXNET.
All Unitholders are entitled to attend general meetings and are accorded the opportunity to participate effectively and vote at general meetings. All Unitholders are also informed of the rules, including voting procedures, governing such meetings.
communication with shareholdersPrinciple 15:companies should actively engage their shareholders and put in place an investor relations policy to promote regular, effective and fair communication with shareholders.
The Manager has in place the Investor Relations and Corporate Communications team which facilitates effective communication with Unitholders, analysts, fund managers and the media.
The Manager actively engages with Unitholders and has put in place an Investor Relations Policy to promote regular, effective and fair communications with Unitholders. The Policy is uploaded on the CMT’s website at www.capitamall.com.
The Board has established the Corporate Disclosure Committee which reviews the promptness and comprehensiveness of corporate disclosures and announcements made to the SGX-ST. It ensures the adoption of good corporate governance and best practices in terms of transparency to Unitholders and investing community.
The Manager makes disclosures on an immediate basis as required under the Listing Manual, or as soon as possible where immediate disclosure is not practicable. Regular briefings and meetings for analysts and the media are held, generally coinciding with the release of CMT’s second quarter and full-year results. During these briefings, Management reviews CMT’s most recent performance and discusses CMT’s outlook. In the interest of transparency and broad dissemination, these briefings are webcast live and accessible to the public on the CMT’s website at www.capitamall.com, materials used in the briefings are disseminated via SGXNET
Clarity42 CapitaMall Trust Annual Report 2013

Corporate Governance & Sustainability
and recordings of the briefings are also archived on the CMT’s website.
In 2013, the Manager met with institutional investors from Singapore, Hong Kong, Japan, the United Kingdom, the United States, various European countries and Australia. These meetings and roadshows with investors enabled the Manager to update potential and current Unitholders on CMT’s significant developments and its medium- to long-term strategies. CMT also participated in various local and overseas conferences as part of its efforts to build interest in the Singapore REIT market.
In addition, the Manager pursues opportunities to keep its retail Unitholders informed through the business media, website postings and other publicity channels. Materials used in the briefings to institutional Unitholders are also disseminated via SGXNET for easy access by retail Unitholders.
Unitholders and potential investors have access to CMT’s website which is available in English including a dedicated Investor Relations link providing CMT’s latest announcements and stock details. The public is able to post questions to the Manager on CMT’s website through the ‘Ask Us’ link. Unitholders may also raise any enquiry to the Manager by post to the Investor Relations department of the Manager at 39 Robinson Road, #18-01 Robinson Point, Singapore 068911. CMT is included in the Straits Times Index (STI), the primary
Singapore equity market barometer. It is also included in other key indices which are widely tracked and referred to by international fund managers as performance benchmarks in the selection and monitoring of investments.
conduct of shareholder meetingsPrinciple 16:companies should encourage greater shareholder participation at general meetings of shareholders, and allow shareholders the opportunity to communicate their views on various matters affecting the company.
The Manager supports the principle of encouraging Unitholders’ participation and voting at general meetings. Unitholders receive a CD containing CMT Annual Report (printed copies are available upon request) and notice of the annual general meeting. As and when an extraordinary general meeting is to be held, Unitholders will receive a copy of circular which contains details of the matters to be proposed for Unitholders’ consideration and approval. Notices of the general meetings are also issued via SGXNET.
At general meetings, Unitholders are encouraged to communicate their views on and discuss with the Board and Manager matters affecting CMT. Representatives of the Trustee, Directors (including the respective Chairpersons of the Board and the Audit Committee), the Manager’s senior management and the
external auditors of CMT, would usually be present at general meetings.
To safeguard Unitholder interests and rights, a separate resolution is proposed for each substantially separate issue at general meetings. To ensure transparency in the voting process and better reflect Unitholders’ interest, the Manager conducts poll voting for Unitholders/proxies present at the meeting for all the resolutions proposed at the general meetings. The total number of votes cast for or against the resolutions and the respective percentages are announced after the general meetings via SGXNET. Minutes of general meetings are taken and are available to Unitholders for their inspection upon their request. Unitholders also have the opportunity to communicate their views and discuss with the Board and Manager matters affecting CMT after the meetings.
(e) aDDitional information
additional committeesApart from Audit Committee and Corporate Disclosure Committee, the Board has also established Executive Committee and Investment Committee.
The Executive Committee oversees the day-to-day activities and affairs of the Manager and that of CMT on behalf of the Board. The principal responsibilities of the Executive Committee under its Terms of Reference include the following:
(a) approving specific budgets for capital expenditure on
43

Corporate Governance
compliance with Chapter 9 of the Listing Manual and the Property Funds Appendix.
In particular, the following procedures are in place:
• transactions(eitherindividually or as part of a series or if aggregated with other transactions involving the same interested person during the same financial year) equal to or exceeding S$100,000 in value, but below 3.0% of CMT’s net tangible assets, will be subject to review and approval by the Audit Committee;
• transactions(eitherindividually or as part of a series or if aggregated with other transactions involving the same interested person during the same financial year) equal to or exceeding 3.0%, but below 5.0% of CMT’s net tangible assets, will be subject to the review and approval of the Audit Committee, and SGX announcement requirements under the Listing Manual and Property Funds Appendix;
• transactions(eitherindividually or as part of a series or if aggregated with other transactions involving the same interested person during the same financial year) equal to or exceeding 5.0% of CMT’s net tangible assets will be subject to review and approval by the Audit Committee which may, as it deems fit, request for advice on the transaction from independent sources
or advisors, including the obtaining of valuations from professional valuers, as well as SGX announcement requirements under the Listing Manual and Property Funds Appendix. Further, under the Listing Manual and the Property Funds Appendix, such transactions would have to be approved by Unitholders at a meeting of Unitholders; and
• theAuditCommittee’sapproval shall only be given if the transactions are on normal commercial terms and consistent with similar types of transactions undertaken by the Trustee with third parties which are unrelated to the Manager.
Further, the Trustee has the ultimate discretion under the Trust Deed to decide whether or not to enter into an Interested Person Transaction. If the Trustee is to enter into an Interested Person Transaction, the Trustee will review such transaction to ensure that it complies with applicable requirements under the Listing Manual, the Property Funds Appendix (in each case, as may be amended from time to time) as well as any other applicable guidelines which may from time to time be prescribed by the SGX-ST, the MAS or other relevant authorities.
role of the audit committee for interested Person transactionsThe Manager’s internal control procedures are intended to ensure that Interested Person
development projects, acquisitions and enhancements/upgrading of properties;
(b) reviewing management reports and operating budgets; and
(c) awarding contracts for development projects.
The members of the Executive Committee also meet informally during the course of the year.
The Investment Committee reviews and approves new investments and divestments by CMT.
Dealings with interested Personsreview Procedures for interested Person transactionsThe Manager has established internal control procedures to ensure that all Interested Person Transactions are undertaken on an arm’s length basis and on normal commercial terms, which are generally no more favourable than those extended to unrelated third parties. In respect of such transactions, the Manager would have to demonstrate to the Audit Committee that such transactions are undertaken on normal commercial terms and are not prejudicial to the interests of CMT and Unitholders which may include obtaining (where practicable) third party quotations or obtaining valuations from independent valuers (in accordance with applicable provisions of the Listing Manual and the Property Funds Appendix). The internal control procedures also ensure
Clarity44 CapitaMall Trust Annual Report 2013

Corporate Governance & Sustainability
Transactions are conducted at arm’s length and on normal commercial terms, and are not prejudicial to Unitholders’ interests. The Manager maintains a register to record all Interested Person Transactions which are entered into by CMT (and the basis on which they are entered into, including the quotations obtained to support such basis). All Interested Person Transactions are subject to regular periodic reviews by the Audit Committee, which in turn obtains advice from CMA IA, to ascertain that the guidelines and procedures established to monitor Interested Person Transactions, including the relevant provisions of the Listing Manual and the Property Funds Appendix, as well as any other guidelines which may from time to time be prescribed by the SGX-ST, the MAS or other relevant authorities, have been complied with. The review includes an examination of the nature of the transaction and its supporting documents or such other information deemed necessary by the Audit Committee. If a member of the Audit Committee has an interest in a transaction, he is to abstain from participating in the review and approval process in relation to that transaction. In addition, the Trustee also reviews such audit reports to ascertain that the Listing Manual and the Property Funds Appendix have been complied with.
Details of all Interested Person Transactions (equal to or exceeding S$100,000 each in value) entered into by CMT during the financial year are disclosed on page 223 of the Annual Report.
Dealing with conflicts of interestThe following principles and procedures have been established to deal with potential conflicts of interest which the Manager (including its Directors, executive officers and employees) may encounter in managing CMT:
(a) the Manager is a dedicated manager to CMT and will not manage any other REIT or be involved in any other real property business;
(b) all executive officers of the Manager are employed by the Manager;
(c) all resolutions at meetings of the Board in relation to matters concerning CMT must be decided by a majority vote of the Directors, including at least one independent non-executive Director;
(d) in respect of matters in which CapitaLand Limited (CapitaLand) and/or its subsidiaries (including CMA) have an interest, whether direct or indirect, any nominees appointed by CapitaLand and/or its subsidiaries (including CMA) to the Board will abstain from voting;
(e) if the Manager is required to decide whether or not to take any action against any person in relation to any breach of any agreement entered into by the Trustee for and on behalf of CMT with an affiliate of the Manager, the Manager shall be obliged to consult with a reputable
law firm (acceptable to the Trustee) which shall provide legal advice on the matter. If the said law firm is of the opinion that the Trustee, on behalf of CMT, has a prima facie case against the party allegedly in breach under such agreement, the Manager is obliged to pursue the appropriate remedies under such agreement; and
(f) at least one-third of the Board should comprise independent non-executive Directors.
Additionally, the Trustee has been granted a right of first refusal by CMA over all retail income-producing properties located in Singapore with certain specified characteristics which may in the future be identified and targeted for acquisition by CMA or any of its subsidiaries.
Under the Trust Deed, in respect of voting rights where the Manager would face a conflict between its own interests and that of Unitholders, the Manager shall cause such voting rights to be exercised according to the discretion of the Trustee.
Dealings in securitiesThe Manager has devised and adopted a securities dealing policy for the Manager’s officers and employees which applies the best practices recommendations in the Listing Manual. To this end, the Manager has issued guidelines to its Directors and employees as well as certain relevant executives of CMA, which sets out prohibitions
45

Corporate Governance
against dealings in the CMT’s securities (i) while in possession of material unpublished price sensitive information, (ii) during two weeks before the release of CMT’s results for the first three quarters, and (iii) during one month before the release of CMT’s full-year results. The Manager will also not deal in the CMT’s securities during the same period. Under these guidelines, all Directors and employees as well as certain relevant executives of CMA have been directed to refrain from dealing in the CMT’s securities on short-term considerations. They are also made aware of the applicability of the insider trading laws at all times.
(f) coDe of business conDuct
The Manager adheres to an ethics and code of business conduct policy which deals with issues such as confidentiality, conduct and work discipline, corporate gifts and concessionary offers. Clear policies and guidelines on how to handle work place harassment and grievances are also in place.
All employees of the Manager have each been given a printed employee handbook which sets out these policies clearly.
The Manager believes that the policies it has implemented help to detect and prevent occupational fraud in mainly three ways.
First, the Manager offers fair compensation packages, based on practices of pay-for-performance and
promotion based on merit. The Manager also provides various healthcare subsidies and financial assistance schemes to alleviate the common financial pressures its employees face.
Second, clearly documented policies and work procedures incorporate internal controls which ensure that adequate checks and balances are in place. Periodic audits are also conducted to evaluate the efficacy of these internal controls.
Finally, the Manager seeks to build and maintain the right organisational culture through its core values, educating its employees on good business conduct and ethical values. The Manager’s zero tolerance stance against all types of fraud is also regularly communicated at staff communication sessions.
anti-corruption and bribery PolicyThe Manager adopts a strong stance against corruption and bribery. In addition to clear guidelines and procedures for the giving and receipt of corporate gifts and concessionary offers, all employees of the Manager are required to make a declaration on an annual basis where they pledge to uphold the Manager’s core values and not to engage in any corrupt or unethical practices. The Manager believes that such an initiative serves as a reminder to all employees to maintain the highest standards of integrity in their work and business dealings. The Manager’s stance against corruption and bribery
is frequently reiterated by Management during its regular staff communication sessions as well.
The Manager’s zero tolerance policy towards corruption and bribery extends to its dealings with third party service providers and vendors. Pursuant to such policy, the Manager usually requires that all agreements with third party service providers and vendors incorporate robust anti-corruption and anti-bribery provisions.
Whistle-blowing PolicyWhistle-blowing policy and procedures are put in place to provide employees of the Manager and parties with dealings with CMT with well defined, accessible and trusted channels to report suspected fraud, corruption, dishonest practices or other impropriety in the workplace, and for the independent investigation of any reported incidents and appropriate follow up action. The objective of the whistle-blowing policy is to encourage the reporting of such matters – that employees or external parties making any reports in good faith will be able to do so with the confidence that they will be treated fairly, and to the extent possible, be protected from reprisal. On an ongoing basis, the whistle-blowing policy is covered during periodic communications to employees to promote fraud awareness.
anti-money laundering and countering the financing of terrorism measuresAs a holder of a Capital Markets Services licence issued by the
Clarity46 CapitaMall Trust Annual Report 2013

Corporate Governance & Sustainability
MAS, the Manager abides by the MAS’ guidelines on the prevention of money laundering and countering the financing of terrorism. Under these guidelines, the main obligations of the Manager are:
• customerduediligence;
• suspicioustransactionreporting;
• recordkeeping;
• employeescreening;and
• stafftraining.
The Manager has developed and implemented a policy on the prevention of money laundering and terrorist financing and is alert at all times to suspicious transactions. Where there is a suspicion of money laundering or terrorist financing, the Manager performs due diligence checks on its counterparties in order to ensure that it does not enter into business transactions with terrorist suspects or other high risk persons or entities. Suspicious transactions are also reported to the Suspicious Transaction Reporting office of the Commercial Affairs Department.
Under this policy, the Manager must retain all relevant records or documents relating to business relations with its customers or transactions entered into for a period of at least five years following the termination of such business relations or the completion of such transactions.
All prospective employees of the Manager are also screened against various lists of terrorist suspects issued by the MAS. Periodic training is provided by the Manager to its licensed representatives to ensure they are updated and aware of applicable anti-money laundering and terrorist financing regulations, the prevailing techniques and trends in money laundering and terrorist financing and the measures adopted by the Manager to combat money laundering and terrorist financing.
47

Enterprise Risk Management
enterPrise risk manaGement frameWorkRisk management is an integral part of CMT and its subsidiaries (CMT Group) business culture whether at a strategic or operational level. Through proactive risk management, which supports CMT Group’s business objectives, value is created and preserved.
The Board of Directors of the manager of CMT (Board) is responsible for the governance of risk. The Audit Committee (AC) reviews and recommends to the Board, the adequacy and effectiveness of the risk management and internal control systems including financial, operational, compliance and information technology within the CMT Group. The AC meets on a quarterly basis. The meetings are attended by the Chief Executive Officer and key management staff of the manager of CMT (Manager).
The Manager recognises that risk management is about opportunities as much as threats. To capitalise on opportunities, CMT Group has to take risks. Therefore, risk management is not about pursuing risk minimisation as a goal but rather optimising the risk-reward relationship. CMT Group will therefore take risks in a prudent manner for justifiable business reasons.
The Manager has adopted an Enterprise Risk Management (ERM) framework for the CMT Group that enables it to manage risks in an integrated, systematic and consistent manner. As a foundation to this framework, the Manager aims to create a risk-aware culture which embeds prudent risk-taking in decision-making and business processes.
A robust internal control system as well as an effective independent review and audit
process are the twin pillars that underpin the ERM framework, addressing financial, operational, compliance and information technology risks to safeguard its Unitholders’ interests and the CMT Group’s assets, and also to manage risks. The line management is responsible for the design and implementation of effective internal controls using a risk-based approach. The Manager has in place an internal audit function supported by CapitaMalls Asia Limited’s Internal Audit Department (CMA IA). CMA IA carries out independent review to test the design and implementation to provide reasonable assurance to the AC on the adequacy and effectiveness of the internal control system. The Manager also conducts assessment of its risks and control environment. Key risks and their associated controls are consolidated and reviewed at the CMT Group
risk-aware culture
erm framework
risk strategy
board oversight & senior management involvement
Risk Identification
& Assessment
Risk Monitoring & Reporting
Risk Response
•Risk&Control Self Assessment
•InvestmentRiskEvaluation
•ScenarioAnalysis•Whistle-blowing/
Business Malpractice
•KeyRiskIndicators
•PortfolioMonitoring of Financial Risks
•Accept•Avoid•Mitigate•Transfer
inde
pend
ent r
evie
w a
nd a
udit
inte
rnal
con
trol
sys
tem
Clarity48 CapitaMall Trust Annual Report 2013

Corporate Governance & Sustainability
level before they are presented to the AC.
CMT Group effectively manages its risk by maintaining a prudent risk profile through a risk analysis framework that seeks to identify, measure and mitigate any key risk where possible. CMT Group strives to achieve an optimised risk-return relationship and ensure that stakeholders’ interests and value are protected.
The Manager will continue to review the risk management systems and methodologies so as to proactively manage risks, preserve capital and enhance Unitholders’ value. The Manager’s key risk management principle remains its endeavour to optimise risk-reward relationship. The potential key risks include but are not limited to:
key risks & control measuresoperational riskTo mitigate and manage operational risk, the Manager has integrated risk management into the day-to-day activities across all functions. Measures include the establishment of planning and control systems, group-wide policies, information technology systems, and operational reporting and monitoring procedures which are overseen by the Executive Committee and the Board. The risk management system is regularly monitored and examined to ensure continuing effectiveness. The risk management framework is designed to ensure appropriate processes and procedures are in place to prevent, mitigate and manage any operational risk.
investment riskThe main sources of growth for CMT Group are asset enhancement initiatives (AEI),
acquisition of properties as well as investment in greenfield developments. The risks involved in such investment activities are managed through a rigorous set of investment criteria which includes potential for growth in yield, rental sustainability and potential for value creation. Also, key financial projection assumptions are reviewed and sensitivity analysis performed on key variables. The potential risks associated with proposed projects and the issues that may prevent their smooth implementation or attainment of projected outcomes are identified at evaluation stage. This is to enable the Manager to devise action plans to mitigate such risks as early as possible.
interest rate riskCMT Group’s exposure to fluctuations in interest rates relates primarily to interest-bearing financial liabilities. Interest rate risk is managed on an ongoing basis, and with the primary objective of minimising the impact on net interest expense that is caused by adverse movements in interest rates. Hence, the Manager proactively seeks to minimise the level of interest rate risk by locking in most of the borrowings of the CMT Group at fixed interest rates.
As at 31 December 2013, the risk is minimal as majority of CMT Group’s borrowings are either on fixed rate basis or have been swapped into Singapore Dollar fixed rates.
currency riskAs the assets of CMT Group are currently based in Singapore, there is little or no foreign exchange exposure from its operations. CMT borrows in Singapore Dollars from its wholly-owned subsidiary, CMT MTN Pte. Ltd. (CMT MTN).
CMT MTN provides treasury services to CMT, including the on-lending of proceeds from notes issued under the S$2.5 billion unsecured Multicurrency Medium Term Note Programme (MTN Programme), and the US$3.0 billion unsecured Euro-Medium Term Note Programme (EMTN Programme).
RCS Trust, in which CMT has a 40.00% interest, borrows in Singapore Dollars from a special purpose vehicle, Silver Oak Ltd (Silver Oak). Silver Oak issued foreign currency denominated notes at floating rates at attractive spreads by borrowing from the overseas markets. They were swapped into fixed rates and Singapore Dollars.
credit riskCredit risk is the potential volatility in earnings caused by tenants’ failure to fulfill their contractual lease payment obligations, as and when they fall due. There is a stringent collection policy in place to ensure that credit risk is minimised. In addition to the requirement for upfront payment of security deposit of an amount typically equivalent to three months’ rent (which may be lodged in the form of cash or bankers’ guarantee), the Manager also establishes vigilant debt monitoring and collection procedures. Debt turnover of CMT Group were 1.4 days and 1.2 days for 31 December 2013 and 31 December 2012 respectively.
liquidity riskThe Manager actively monitors the cash flow position of CMT Group to ensure that there are sufficient liquid reserves, in the form of cash and banking facilities, to finance CMT Group’s operations and AEI. The Manager also monitors covenants closely to ensure compliance.
49

EnterpriseRisk Management
financing riskGiven CMT Group’s reliance on external sources of funding for refinancing of existing borrowings, AEI, acquisition of properties as well as investment in greenfield developments, the health of the debt markets directly affects CMT Group.
Different funding strategies are used to minimise over-reliance on a single source of funds for any funding or refinancing requirements. Other than MTN Programme and EMTN Programme, CMT is also one of the first real estate investment trusts to set up a retail bond programme. CMT Group has also tapped into the convertible bonds and commercial mortgage backed securities markets for funds. In addition, CMT Group has banking facilities as a source of back-up funds.
The Manager will continue to proactively manage capital structure of CMT Group by ensuring its debt maturity profile is spread out without major concentration of debts maturing in a single year, and maintaining an optimal gearing level.
legal and compliance riskDue to the nature of CMT’s business, CMT is required to comply with the relevant legislation and regulations that include the Listing Manual of the SGX-ST (Listing Manual), the Code on Collective Investment Schemes (CIS Code) issued by the Monetary Authority of Singapore and the tax rulings issued by the Inland Revenue Authority of Singapore with regards to the taxation of CMT and its Unitholders. Thus, any changes in these legislation and regulations may affect
CMT’s business, results or operations. The Manager has established relevant policies and procedures to ensure CMT’s compliance with applicable legislation and regulations.
In addition, any legal, arbitration, administrative or other proceedings against CMT that may arise from time to time in the course of its business may result in additional costs, delays in its projects or financial losses. The Manager manages such risk through identification and active monitoring of potential issues, and the effective use of its external legal advisers where appropriate.
interested Person transactions riskThe Manager has established internal control procedures to ensure that all transactions involving HSBC Institutional Trust Services (Singapore) Limited (in its capacity as trustee of CMT) and an interested person of the Manager pursuant to the Listing Manual (Interested Person Transactions) are undertaken on an arm’s length basis and on normal commercial terms and will not be prejudicial to the interests of the Unitholders. For Interested Person Transactions, the Manager would have to demonstrate to the AC that the transactions were undertaken on normal commercial terms and were not prejudicial to the interests of CMT and its Unitholders which may include obtaining third party quotations or obtaining valuations from independent valuers (in accordance with the Property Funds Appendix of the CIS Code). Proactive measures are also adopted to avoid situations of conflict and potential conflict of interest.
human resource riskIn order to deliver quality products and services to our valued tenants and shoppers, the Manager and the property manager of CMT, CapitaLand Retail Management Pte Ltd (Property Manager), invest in quality human capital by recruiting and retaining employees with the relevant expertise, skills and professionalism. High turnover rate of valued employees can be detrimental as it causes disruptions to CMT Group’s business operations and undermines the implementation of CMT’s strategic business plans. The Manager and the Property Manager have also adopted an integrated human capital strategy to recruit, develop and motivate quality employees. In addition to seeking outstanding talents with the required expertise and experience, emphasis has also been placed on managing these talents through staff development and continuous training. Comprehensive compensation and benefits plans are also used to motivate and retain the talents. Such measures are also to ensure that the CMT Group maintains its competitive edge.
Development and construction risk Under the Property Funds Appendix of the CIS Code, the total contract value of all property development activities undertaken by CMT Group, together with its investments in uncompleted property developments, may not exceed 10.0% of CMT Group’s deposited property. CMT Group’s deposited property as at 31 December 2013 is about S$10.0 billion.
To date, the Manager has committed to invest about S$469.5 million on CMT’s
Clarity50 CapitaMall Trust Annual Report 2013

Corporate Governance & Sustainability
first greenfield development project, Westgate. Westgate has commenced its mall operations on 2 December 2013 and Westgate Tower is expected to obtain temporary occupation permit by end-2014.
The development of new projects usually takes a few years to complete, depending on the project size and its complexity. In the event that the projects cannot be completed within the anticipated time frame and budget, these may have a material adverse effect on CMT Group’s business, financial position, results of operations and prospects. In addition, significant pre-operating costs incurred may not be recovered within the expected period or at all. The Manager mitigates such risk through continual monitoring and regular reviews on the progress of these projects. The Manager has established standard operating procedures (SOPs) to guide project management personnel and ensure that all required applications are submitted for the authorities’ approvals. These SOPs are subject to a series of continuity and consistency reviews by the Manager and an independent ISO 9001 qualified auditor. In addition, the Manager has set up a framework for evaluating and pre-qualifying contractors and service providers that would be invited for project-related tenders.
information technology security riskInformation technology (IT) security risk consists of loss of data, inaccuracy of data, unavailability of systems and damage to systems. To mitigate IT security risk, the Manager has established an IT governance framework consisting of IT security/management policies,
procedures and controls. These policies, procedures and controls are periodically reviewed and benchmarked for effectiveness. One of the benchmarks is the ISO/IEC 20000, which is the first international standard for IT service management. The Manager is happy to report that its leasing system and shopper loyalty system are ISO/IEC 20000 certified. The Manager also engages the services of external experts to complement its internal IT security controls, such as periodic network penetration tests and websites vulnerability scanning.
51

Investor &Media Relations
We are committed to providing the investment and media communities with timely and transparent information on CMT’s business and performance.
The management of CMT frequently meets existing and potential investors and analysts at one-on-one or group meetings, local and overseas conferences and roadshows. In 2013, we met or held conference calls with about 250 institutional investors globally and took part in investor conferences and roadshows in Singapore, Europe, Hong Kong, the United States (US) and Japan. We constantly engage our growing base of debt investors, given CMT’s diversified sources of debt funding. In August 2013, we participated in the ‘CapitaLand Debt Investors’ Day’, which was well received and attended.
We made conscious efforts to engage more retail investors as well, through large group seminars. During the year, we participated in the UOB Kay Hian CEO Seminar and the SGX Sector Connect Seminar to educate retail investors on CMT’s investment proposition. The audiences had the opportunity to ask questions and interact with the Chief Executive Officer at the seminar. Currently, 22 local and foreign brokerage firms have research coverage on CMT.
Approximately 15,000 registered Unitholders owned CMT units as at 31 December 2013. About 56.65% of the units were held by institutional investors with CapitaMalls Asia Limited (CMA) owning another 27.62% of the units while retail investors constitute the remaining 15.73%. Excluding CMA’s stake, investors from Singapore, US and United Kingdom held the largest
portions of unitholdings in CMT at 14.42%, 13.10% and 10.33% respectively. Investors from Hong Kong, Europe (excluding the United Kingdom), Australia and other parts of Asia accounted for the rest of the unitholdings.
Joint analyst and media results briefings are held every six months to provide updates on CMT’s half-year and full-year financial and operational performance. The briefings are webcast ‘live’ and viewers of the webcasts can send in questions online to be addressed by the management team on the spot. In line with our commitment to deliver accurate and timely information to Unitholders and the general public, financial results announcements are made within 23 days from the end of each quarter.
In addition, annual general meeting (AGM) and extraordinary general meeting (EGM) provide important channels for communication between the management and Unitholders. CMT convened its fourth AGM in April 2013 with Unitholders approving all resolutions tabled at the event. Voting for all the AGM resolutions were conducted via polls.
General information on CMT including annual reports, property portfolio details and investor presentations are updated regularly on the corporate website for investors and the general public. All news releases and legal announcements are also available on the Singapore Exchange Securities Trading Limited (SGX-ST) website. Mall tours are regularly conducted for analysts, investors and journalists who are keen to visit CMT’s properties to better understand the performance of
the various malls and the asset enhancement initiatives which were completed.
As part of our proactive corporate governance efforts and in line with the Monetary Authority of Singapore’s Code of Corporate Governance 2012, we have put in place an investor relations policy to promote regular, effective and fair communication with Unitholders. The detailed policy can be located on CMT’s corporate website under the ‘Investor Relations’ section.
investor relations anD corPorate Governance aWarDs in 2013
securities investors association (singapore) investors’ choice awards 2013
Winner, most transparent company awardREITs & Business Trusts Category
Winner, singapore corporate Governance award REITs & Business Trusts Category
ir magazine south east asia awards 2013
certificate of excellence in investor relations
Clarity52 CapitaMall Trust Annual Report 2013

Corporate Governance & Sustainability
1st Quarter• Media&Analysts’Results
Briefing cum ‘live’ Webcast for Full Year 2012 Results
• Post-FullYear2012Results Investors’ Lunch hosted by UBS
• CreditSuisseNon-dealRoadshow (Europe)
• UOBKayHianCEOSeminar (Singapore)
• J.P.MorganAsiaPacificRealEstate Conference (Singapore)
2nd Quarter• AnnualGeneralMeeting• Post-1Q2013ResultsInvestors’
Lunch hosted by Morgan Stanley• CitiNon-dealRoadshow
(Hong Kong)• SGXSectorConnectSeminar
(Singapore)
3rd Quarter• Media&Analysts’Results
Briefing cum ‘live’ Webcast for Half Year 2013 Results
• Post-HalfYear2013Results Investors’ Lunch hosted by Goldman Sachs
• CapitaLandDebtInvestors’Day• MacquarieASEANConference
(Singapore)• MacquarieNon-deal
Roadshow (US)
4th Quarter• Post-3Q2013Results
Investors’ Briefing hosted by DBS Bank
• GoldmanSachsNon-dealRoadshow (Japan)
• MorganStanleyAsiaPacificSummit (Singapore)
investor & meDia relations calenDar 2013unitholDers’ enQuiriesIf you have any enquiries or would like to find out more about CMT, please contact:
the managerMs Audrey TanInvestor Relations
Mr Lim Seng JinCorporate Communications
Tel: +65 6536 1188Fax: +65 6536 3884Email: [email protected]: www.capitamall.com
unit registrar boardroom corporate and advisory services Pte. ltd.50 Raffles Place#32-01 Singapore Land TowerSingapore 048623Tel: +65 6536 5355Fax: +65 6536 1360Website: www.boardroomlimited.com
For depository-related matters such as change of details pertaining to Unitholders’ investment records, please contact:
the central Depository (Pte) limited4 Shenton Way#02-01 SGX Centre 2Singapore 068807Tel: +65 6535 7511Fax: +65 6535 0775Email: [email protected]: www.sgx.com/cdp
financial calenDar
2013 2014(Tentative)
First Quarter Results Announcement 19 Apr 2013 Apr 2014
First Quarter Distribution to Unitholders 30 May 2013 May 2014
Second Quarter Results Announcement 19 Jul 2013 Jul 2014
Second Quarter Distribution to Unitholders 29 Aug 2013 Aug 2014
Third Quarter Results Announcement 23 Oct 2013 Oct 2014
Third Quarter Distribution to Unitholders 29 Nov 2013 Nov 2014
Full Year Results Announcement 22 Jan 2014 Jan 2015
Final Distribution to Unitholders 28 Feb 2014 Feb 2015
53

Unit Price Performance
Uncertainty reigned in 2013 over the possible tapering of the quantitative easing programme by the United States (US) Federal Reserve, and whether the debt ceiling in the US will be raised in a timely manner. The Eurozone remains susceptible to a flare-up of the sovereign debt crisis, while there are risks of a sharper-than-expected slowdown in China given on-going policy adjustments to restructure the economy.
During the year, CMT’s unit price saw a steady increase but the uptrend was disrupted in May 2013 over the prospects of a start in tapering in May 2013. CMT’s unit price closed at S$1.905 on 31 December 2013, 10.6% lower compared to S$2.13 at the beginning of the year. FTSE ST Real Estate Investment Trusts (REIT) Index ended the year 8.9% lower and FTSE ST Real Estate (RE) Index dropped 9.7% at the end of 2013.
As at 31 December 2013, CMT’s market capitalisation registered S$6.6 billion. The stock’s trading volume in 2013 reached approximately 2.1 billion units, translating to an average daily trading volume of approximately 8.5 million units.
traDinG Data by year
2004 2005 2006 2007 2008 2009 2010 2011 2012 2013
Unit Price (S$)Highest 1.76 2.66 2.93 4.32 3.75 1.87 2.15 2.00 2.20 2.38
Lowest 1.36 1.73 2.01 2.76 1.38 0.98 1.67 1.64 1.71 1.82
Average Closing 1.58 2.25 2.40 3.64 2.78 1.50 1.91 1.85 1.91 2.05
Last Done at Year-end
1.76 2.24 2.91 3.46 1.59 1.80 1.95 1.70 2.13 1.905
Trading Volume (million units)
307.5 353.7 549.6 1,111.6 1,380.6 2,554.8 1,435.3 1,672.9 1,877.2 2,137.5
Average Daily Trading Volume (million units)
1.2 1.4 2.2 4.5 5.5 10.2 5.7 6.7 7.5 8.5
Net Asset Value Per Unit 1 (S$)
1.31 1.64 1.87 2.21 2.41 1.54 1.53 1.56 1.64 1.71
1 Excludes outstanding distributable income as at end of each period.
cmt’s monthly traDinG Performance
Trading Volume (million units) Highest and Lowest Unit Prices (S$)
Dec2013
Nov2013
Oct2013
Sep2013
Aug2013
Jul2013
Jun2013
May2013
Apr2013
Mar2013
Feb2013
Jan2013
400
350
300
250
200
150
100
50
0
2.5
2.0
1.5
1.0
0.5
0
Clarity54 CapitaMall Trust Annual Report 2013
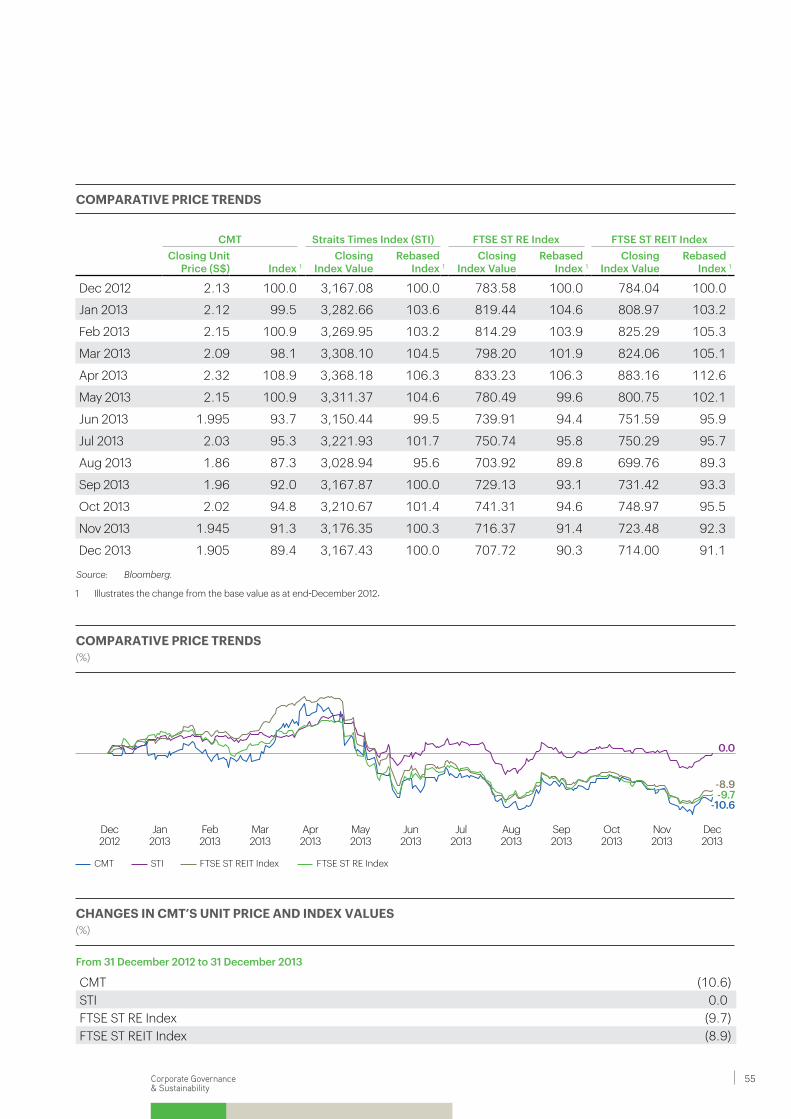
Corporate Governance & Sustainability
comParative Price trenDs
CMT Straits Times Index (STI) FTSe ST Re Index FTSe ST ReIT IndexClosing Unit
Price (S$) Index 1Closing
Index valueRebased
Index 1Closing
Index valueRebased
Index 1Closing
Index valueRebased
Index 1
Dec 2012 2.13 100.0 3,167.08 100.0 783.58 100.0 784.04 100.0
Jan 2013 2.12 99.5 3,282.66 103.6 819.44 104.6 808.97 103.2
Feb 2013 2.15 100.9 3,269.95 103.2 814.29 103.9 825.29 105.3
Mar 2013 2.09 98.1 3,308.10 104.5 798.20 101.9 824.06 105.1
Apr 2013 2.32 108.9 3,368.18 106.3 833.23 106.3 883.16 112.6
May 2013 2.15 100.9 3,311.37 104.6 780.49 99.6 800.75 102.1
Jun 2013 1.995 93.7 3,150.44 99.5 739.91 94.4 751.59 95.9
Jul 2013 2.03 95.3 3,221.93 101.7 750.74 95.8 750.29 95.7
Aug 2013 1.86 87.3 3,028.94 95.6 703.92 89.8 699.76 89.3
Sep 2013 1.96 92.0 3,167.87 100.0 729.13 93.1 731.42 93.3
Oct 2013 2.02 94.8 3,210.67 101.4 741.31 94.6 748.97 95.5
Nov 2013 1.945 91.3 3,176.35 100.3 716.37 91.4 723.48 92.3
Dec 2013 1.905 89.4 3,167.43 100.0 707.72 90.3 714.00 91.1
chanGes in cmt’s unit Price anD inDex values(%)
From 31 December 2012 to 31 December 2013
CMT (10.6)STI 0.0FTSE ST RE Index (9.7)FTSE ST REIT Index (8.9)
Jan2013
Feb2013
Mar2013
Apr2013
May2013
Jun2013
Jul2013
Aug2013
Sep2013
Oct2013
Nov2013
Dec2013
Dec2012
CMT STI FTSE ST REIT Index FTSE ST RE Index
0.0
-10.6-9.7-8.9
comParative Price trenDs (%)
1 Illustratesthechangefromthebasevalueasatend-December2012.
Source: Bloomberg.
55

FTSE4Good Global Index
FTSE/ASEAN Index
FTSE EPRA 1/NAREIT 2 Global Real Estate Index
FTSE All-World Index
FTSE Straits Times (ST) Index
FTSE ST All Share Index
FTSE ST Financials Index
FTSE ST Real Estate Investment Trusts Index
FTSE ST Real Estate Index
GPR 3 General Index
GPR 3 General ex-US Index
GPR 3 General Far East Index
GPR 3 General Far East ex-Japan Index
GPR 3 General Singapore Index
GPR 3 General Quoted Index
GPR 3 General Quoted ex-US Index
GPR 3 General Quoted Far East Index
GPR 3 General Quoted Far East ex-Japan Index
GPR 3 General Quoted Singapore Index
GPR 3 250 Index
GPR 3 250 ex-US Index
GPR 3 250 Asia Index
GPR 3 250 Asia ex-Japan Index
GPR 3 250 Asia Pacific Index
GPR 3 250 Asia Pacific ex-Japan Index
GPR 3 250 South-Eastern Asia Index
GPR 3 250 Singapore Index
1 Based on the distribution per unit (DPU) of 10.27 cents for the period 1 January 2013 to 31 December 2013 and the unit closing price of S$1.905 on 31 December 2013.
Sources: Bloomberg, Central Provident Fund (CPF) Board, Monetary Authority of Singapore.
Unit Price Performance
comParative yielDs(%)
As at 31 December 2013
2.53.3
Yield spread:280 basis points
5.4
2.6
1.10.3
3.7
CMT 2013 DPU Yield 1
10-year Govt Bond Yield
5-year Govt Bond Yield
CPF Ordinary Account Savings
12-month (S$) Fixed Deposit
STI 12-month Yield
FTSE ST RE12-month Yield
constituent of key inDices
1 EuropeanPublicRealEstateAssociation.2 NationalAssociationofRealEstateInvestmentTrusts.3 GlobalPropertyResearch.4 MorganStanleyCapitalInternational.5 Standard & Poor’s.
GPR 3 250 REIT Index
GPR 3 250 REIT ex-US Index
GPR 3 250 REIT Asia Index
GPR 3 250 REIT Asia ex-Japan Index
GPR 3 250 REIT Asia Pacific Index
GPR 3 250 REIT Asia Pacific ex-Japan Index
GPR 3 250 REIT South-Eastern Asia Index
GPR 3 250 REIT Singapore Index
MSCI 4 Singapore Standard
MSCI 4 World Standard Index
S&P 5 BMI Global Index
S&P 5 Global Property Index
S&P 5 Global REIT Index
Clarity56 CapitaMall Trust Annual Report 2013

Corporate Governance & Sustainability
Sustainability
Jointly with corporate governance, environmental and social (ESG) issues are critical to creating a sustainable future for CMT, our stakeholders and society. By integrating ESG considerations into our operations, we believe that we can manage our business better and create long-term value for all stakeholders.
Our approach to sustainability incorporates considerations relating to:
Since September 2007, CMT has been a constituent of FTSE4Good Global Index, which was designed to facilitate investment in companies that meet globally recognised corporate responsibility standards.
To shape our understanding of the ESG issues that we must address in our everyday business, we continuously engage with our stakeholders. We cultivate our stakeholder relationships through regular and systematically planned forms of dialogue such as conferences, workshops, roadshows and surveys and sometimes, through informal ways as well.
stakeholDer enGaGement
Stakeholders and Why We engage Issues/Interests How We engage (examples)Shoppers
• Tounderstandourshoppers’needs and improve the appeal of CMT’s malls
• Shoppingmallswithfamily friendly facilities
• Easyaccesstopublictransport• Greaterconveniencetoenhance
shopping experience
• Advertisementsandpromotionalevents• Focusgroupsandsurveys• Onlineandmobileplatforms• Socialmedia• Loyaltyprogrammes
Tenants
• Tounderstandourtenants’needs and concerns as well as help drive shopper traffic to their stores
• Openingofnewshops/malls• Learnfromsuccessfulcompanies• Knowledgesharing
• Informaltenantgatherings• Biz+Seriesevents• Jointpromotionsandpartnerships• Retailerforums
Investors
• Tocreateaninformedperception of CMT, manage investors’ expectations and promote a positive investment environment
• Businessperformance• Businessexpectationsandstrategy• Economic,socialandenvironmental
concerns
• Annualgeneralmeetings• SGXNetannouncements• Annualreports,resultsbriefingsto
analysts and media, webcasts• Websiteupdates• Roadshows,conferencesandmeetings• ToursofCMT’smalls
employees
• Tounleashemployees’potential, align their personal goals with company objectives
• Communicatingbusinessstrategy and developments
• Rewardandrecognition• Traininganddevelopment• Employeewellness
• Intranet,e-mails,staffcommunicationsessions, recreational and teambuilding activities
• Employeeengagementsurveys• Performanceappraisals
Community
• Tocontributetothecommunities in which we operate
• Philanthropy• Environment
• Employeevolunteerism• Donationstonon-profitorganisations• Managementofenvironmental,social
and governance issues
environmental • Effectivemanagementofprocessestomitigatekeyenvironmental risks
Social • Superiorpoliciesandpracticestorecruitand retain employees
• Improvementofworkplacehealthandsafety• Maintenanceofstrongcommunityrelations
Governance • Integrityinallaspectsandcommitmenttothe highest standards of good governance, transparency and accountability
57

project paper submitted to the Board of Directors for approval. At the procurement stage, in accordance with the GBG, all main contractors appointed in 2013 for projects that span a gross floor area (GFA) of at least 2,000 square metres, have to be ISO 14001 and OHSAS 18001 certified or they have to implement Environmental, Health and Safety (EHS) measures on site to comply fully with EHS legislations equivalent. The OHSAS 18001 is an internationally recognised standard for the occupational health and safety management of businesses.
We use an Environmental Tracking System (ETS), developed in-house by CapitaLand, to track the monthly energy and water usage, carbon dioxide emission and waste generation for CMT’s properties. This ETS is audited annually by CapitaLand’s Technical Services Unit.
Our long-term energy and water reduction targets (using 2008 as base year) are:
• Toreduceenergyandwaterusage by 15.0% by 2015
• Toreduceenergyandwaterusage by 20.0% by 2020
In 2013, our total energy consumption recorded 143,207 megawatt hours (MWh). We managed to reduce our energy usage by 13.6% from 20.56 kilowatt hours per square metre of GFA per month (kWh/m2/month) in 2008 to 17.77 kWh/m 2/month in 2013.
Our total water consumption stood at 1,688,269 cubic
metres (m3) in 2013. We reduced our water usage by 26.7% from 0.217 m3 per square metre of GFA per month (m3/m2/month) in 2008 to 0.159 m3/m2/month in 2013 after adjusting for shopper traffic count at the properties.
In terms of carbon emissions, we recorded 71,525 tonnes in 2013. Our carbon emissions decreased by 17.9% from 10.81 kilogrammes per square metre of GFA per month (kg/m2/month) in 2008 to 8.87 kg/m2/month in 2013.
Green initiativesCMT’s malls marked the ‘Earth Hour’ by switching off their facade lights and non-essential lighting for extended hours through the night, beginning at 8.30 p.m. on 23 March 2013. This was the sixth year that we participated in this annual global sustainability movement to promote awareness of energy conservation. All CMT’s operating malls participated in the ‘Earth Hour’ initiative.
In conjunction with ’Earth Hour’, we organised ‘Bring Your Plastic Bottles, Metal Cans & Papers to Recycle’ at Bukit Panjang Plaza, IMM Building, JCube, Junction 8 and Tampines Mall. The objective was to encourage shoppers to be environmentally friendly.
Green awardsAs at 31 December 2013, 12 of CMT’s malls have garnered Green Mark awards from Singapore’s Building and Construction Authority (BCA). The BCA Green Mark was introduced in January 2005. It is a scheme that assesses the environmental performance and impact of
environmentTo ensure that our actions in operating CMT’s malls are environmentally friendly and that we follow green practices in the office, we have adopted an Environmental Management System (EMS) which was certified to the ISO 14001 international standards in 2007. ISO 14001 is an internationally recognised standard for the environmental management of businesses. We review new or update existing legal requirements for the EMS every quarter and evaluate compliance annually. In 2013, we have complied fully with the environmental laws and regulations in Singapore and there was no environmental non-conformance by the company.
As part of CapitaLand’s group, we adhere to the group’s Green Buildings Guidelines (GBG) which is an in-house guide developed since 2007 and is regularly reviewed to ensure continual improvement. We strive to implement the GBG at all stages of a development project, from feasibility, design, procurement and construction to operations.
The GBG includes an Environmental Impact Assessment (EIA) which is carried out during the feasibility stage of any development project. The EIA helps to identify any environmental threats or opportunities related to the project site and its surroundings, including aspects such as air quality, noise, floods, biodiversity, connectivity, heritage and resources. All significant findings of the EIA and their cost implications have to be tabled as part of the investment
Sustainability
Clarity58 CapitaMall Trust Annual Report 2013
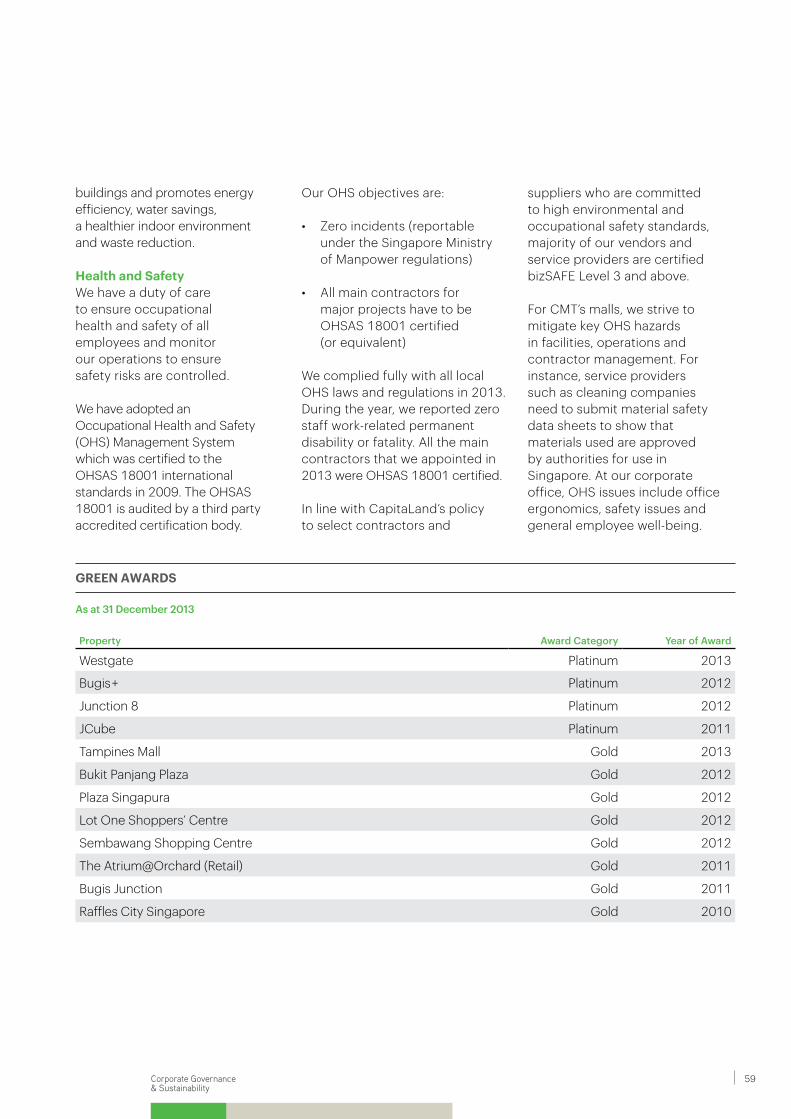
Corporate Governance & Sustainability
buildings and promotes energy efficiency, water savings, a healthier indoor environment and waste reduction.
health and safetyWe have a duty of care to ensure occupational health and safety of all employees and monitor our operations to ensure safety risks are controlled.
We have adopted an Occupational Health and Safety (OHS) Management System which was certified to the OHSAS 18001 international standards in 2009. The OHSAS 18001 is audited by a third party accredited certification body.
Our OHS objectives are:
• Zeroincidents(reportable under the Singapore Ministry of Manpower regulations)
• Allmaincontractorsfor major projects have to be OHSAS 18001 certified (or equivalent)
We complied fully with all local OHS laws and regulations in 2013. During the year, we reported zero staff work-related permanent disability or fatality. All the main contractors that we appointed in 2013 were OHSAS 18001 certified.
In line with CapitaLand’s policy to select contractors and
suppliers who are committed to high environmental and occupational safety standards, majority of our vendors and service providers are certifiedbizSAFE Level 3 and above.
For CMT’s malls, we strive to mitigate key OHS hazards in facilities, operations and contractor management. For instance, service providers such as cleaning companies need to submit material safety data sheets to show that materials used are approved by authorities for use in Singapore. At our corporate office, OHS issues include office ergonomics, safety issues and general employee well-being.
Property Award Category Year of Award
Westgate Platinum 2013
Bugis + Platinum 2012
Junction 8 Platinum 2012
JCube Platinum 2011
Tampines Mall Gold 2013
Bukit Panjang Plaza Gold 2012
Plaza Singapura Gold 2012
Lot One Shoppers’ Centre Gold 2012
Sembawang Shopping Centre Gold 2012
The Atrium@Orchard (Retail) Gold 2011
Bugis Junction Gold 2011
Raffles City Singapore Gold 2010
Green aWarDs
As at 31 December 2013
59

community involvementAs suburban satellite hubs, CMT’s malls are a channel for us to engage local communities actively in activities that educate and benefit them. We are also committed to supporting non-profit, community and charitable organisations through synergistic partnerships.
heritage and artsTo further promote the local art scene, Bugis+ together with Singapore Polytechnic Design School held a month-long art exhibition titled ‘The Singapore Blend’. Third year students showcased a visual feast of their sentiments and experiences about their homeland. Perspectives on local culture and issues took the forms of photography, illustrations, new media installations and creative advertising.
Lot One Shoppers’ Mall brought back fond memories of yesteryears with the ‘Rediscovery-Celebrating Our Heritage’ event in July 2013. The week-long event showcased the history and evolution of hawker centres and personalities associated with them through an interactive exhibition by National Heritage Board. Shoppers feasted on freshly prepared local hawker fare and traditional titbits as well as enjoyed cultural performances, exciting traditional games, cooking demonstrations and talks on natural beauty remedies. The mall partnered the National Library Board to organise challenging jigsaw puzzles and hands-on traditional arts and craft workshops to create rangoli, lanterns and ketupat. In conjunction with the Great Singapore Sale, shoppers in Lot One Shoppers’ mall were entertained by six international street artists in a street art festival
Sustainability
Westgate
shoWcase of a Green builDinG: WestGate
Westgate is located at Jurong Gateway, comprising a seven-storey shopping mall and an office tower, achieved Green Mark Platinum award from BCA in 2013. Extensive efforts went into making Westgate energy-efficient and resource-efficient so as to reduce operational costs, while offering intangible benefits such as enhanced user comfort and setting a benchmark for future projects.
examples of environmental features at Westgate:
• Estimatedenergy savings: 10,004,645 kWh/year
• Estimatedwatersavings: 56,085 m3/year
• Highperformanceglass for the skylight and high efficiency facade system to reduce indoor heat gain
• Chillerplantsystemwithestimated efficiency of 0.51 kW/tonne
• Naturallyventilatedareaswith localised mechanical ventilation
• Regenerativeliftswithestimated savings of 0.52% in total energy consumption
• Automaticwaterefficientrain water irrigation system with rain sensor serving 100.0% of the landscaped areas
• Substantialusageof green concrete
• Waterfixtureswhich are rated 2-tick or 3-tick under the Public Utilities Board’s Water Efficiency Labelling Scheme
• Paperrecyclingchute for office tower
• Incorporationofgreenleases as part of tenancy agreements, covering fit-out requirements and environmental management.
Clarity60 CapitaMall Trust Annual Report 2013

Corporate Governance & Sustainability
curated by Act 3 International. In addition to the performances, the artists ran workshops for children as an extended learning experience to complete the appreciation of the art form. The mall hosted the Japanese Koto and Taiko drum performance in partnership with the People’s Association with the support of South West Community Development Council. In view of the mall’s support of the arts, Lot One Shoppers’ Mall was conferred the Associate of the Arts Award by National Arts Council in 2013.
health and Well-beingIn June 2013, Singapore experienced one of the worst haze pollution in national history. CMT’s malls took appropriate measures to ensure a safe shopping environment. For instance, hourly Pollutant Standards Index readings were displayed at all customer service counters to provide up-to-date information to shoppers. Our customer service counters were also equipped with N95 masks and bottled water during the peak of the haze situation.
Bukit Panjang Plaza hosted a wide variety of community-based activities that benefit the community. Throughout 2013, the mall worked closely with organisations such as schools located within the vicinity, North West Community Development Council, Senja-Cashew Community Club, PAP Community Foundation and Jurong Police Division to organise these events. Activities included qigong, Dance Fit, Line Dance cum Jamming Sessions, community aerobics, dog obedience training, Cashew INC Fiesta, Theft Roadshow, Children’s Day Donation Drive 2013, Assumption Pathway School Challenge, Kampung
Play by Ground-Up Initiative and MediaCorp TV50 Roadshow. These activities not only reflect our commitment to be a strong partner in the communities that we serve, but also add vibrancy to the malls.
family-friendly PracticesIn addition to the wide array of family-themed shops, dedicated nursing rooms, washrooms equipped with baby holders and family lounge, Plaza Singapura also ran the second ‘PS BabyStar’ and ‘Best Loving Family Portrait’ contests in November 2013 where winners walked away with grand prizes such as a pre-credited Standard Chartered e$aver Kids Savings Account.
Bukit Panjang Plaza also collaborated with Ground-Up Initiative to hold ‘Kampong Play’ workshops in July 2013, where parents were encouraged to participate in traditional games with their children. The event was organised to promote interaction among the participants and bonding amongst family members.
Family workshops were also held at Junction 8, where top-spending CAPITASTAR members were invited to participate in the food and beverage workshops including pizza-making and cupcake decoration with their children.
During the festive season, CMT’s malls were also active in hosting character shows for the young and the young-at-heart, creating opportunities for families to shop, gather and bond with their loved ones.
my schoolbag ProgrammeThe annual signature corporate social responsibility programme ‘My Schoolbag’, continued to
reach out to the community in 2013. Together with the Community Development Councils, student and staff volunteers, we reached out to children from low-income families. The programme was held at Junction 8, Tampines Mall, Lot One Shoppers’ Mall and IMM Building, where each child was given a school bag and accompanied by the volunteers, to shop for stationery, school shoes and daily necessities at participating tenants. This meaningful programme has impacted the lives of more than 5,000 families since its inaugural run in 2009.
Programmes for tenantsInitiated in 2006, the CapitaMalls Asia Biz+ Series is a tenant engagement programme comprising seminars, workshops and networking sessions which are organised with the aim to add value to our tenants’ businesses and partner their growth. In 2013, we conducted three Biz+ Series seminars and our second ‘CEO Breakfast Roundtable’ for our tenants. These well received events were good platforms for networking and knowledge sharing of the most current and relevant industry trends with our tenants. The topics were centered on service excellence and improving productivity to help tenants expand knowledge and address pressing issues in the retail industry.
We greatly value our relationships with our tenants and on pages 100 to 101 of this report, we feature companies who have been our long-time supportive tenants.
61
As part of career development, employees are given opportunities to rotate to different malls, functions, cities or countries within CMA’s portfolio.
competitive compensation & benefitsWe offer all employees comprehensive and competitive remuneration packages. These include short-term cash bonus and long-term equity-based reward plans such as restricted shares and performance shares programmes. Such equity-based reward plans help to strengthen the link between reward and performance, as well as to retain talent.
All employees receive staff benefits including a flexible benefits plan and leave entitlements for maternity, paternity and volunteer reasons. We recognise that employees have diverse needs, and a flexible benefits plan enables staff to complement their personal medical and insurance needs with those provided by the company. Employees can thus customise their benefits for themselves and their families.
To ensure that we can continue to attract and retain talent, we regularly engage external human resource consultants to benchmark our compensation and benefits packages against other peers and industries in Singapore. We also constantly seek innovations in our compensation strategies for staff.
Developing our PeopleIn line with our belief that continual learning is a fundamental building block of growth, we offer comprehensive training and development programmes for employees to acquire relevant knowledge
and skills to achieve business excellence.
In 2013, about 3.0% of our annual payroll was allocated for programmes relating to employee learning and growth. We already have in place training roadmaps and a wide variety of courses, ranging from project financing and real estate to soft skill subjects such as communications and presentation skills. Staff have direct access to a year-long training calendar, which comprises a series of pre-evaluated training courses, via our in-house intranet. In addition, we have established an online learning platform which offers more than 200 programmes, to encourage staff to learn continuously and offer them more choices in terms of courses.
In 2013, employees clocked an average of 43 training hours per employee, with 97.3% of staff attending at least one training event. We encourage employees to upgrade themselves by attending courses or obtain professional qualifications relevant to their work. Employees are granted paid examination leave for their studies. For full time staff, examination leave is up to 10 days per calendar year.
Throughout the year, our employees also participated in study visits to overseas malls in Hong Kong, India, Malaysia and South Korea to network and gain insights to interesting retail concepts outside Singapore.
For members of the senior management team with proven track records and leadership potential, we partner with CapitaLand Institute of Management and Business (CLIMB) to provide leadership
As an externally managed real estate investment trust, CMT has no employees and is managed by CapitaMall Trust Management Limited (CMTML), which is a wholly-owned subsidiary of CapitaMalls Asia Limited (CMA). CapitaLand Limited holds 65.36% interest in CMA as at 31 December 2013.
We believe in managing our human capital in the most effective and efficient manner. We see infinite value in them and recognise that it is their passion, professionalism and commitment that can contribute to the success of our business.
talent management We have a workforce of 548 people, comprising 20 employees at CMTML level, those working at CMT’s malls and the property management team. We are well poised to meet the challenges to support our business expansion. In strengthening our team, we recruit talents at different transition points in their career path, from fresh graduates to young, mid-career professionals and industry veterans.
At the core of our development programme is a systematic programme for all new hires to learn more about our business operations, strategies, core values and management philosophy. All employees also undergo an annual performance review where employees can openly discuss their performance and future aspirations with their supervisors. They broach topics such as possible career moves and recommended training plans.
We believe in talent cross-fertilisation and leverage on our regional Human Resource function to build people.
People & TalentManagement
Clarity62 CapitaMall Trust Annual Report 2013
Corporate Governance & Sustainability
well-balanced and healthy lifestyle among employees. Recreational activities also included a family day and an annual dinner and dance party.
We also support annual national campaigns such as the ‘Eat with Your Family Day’ in May 2013 by giving employees time off to leave offices earlier to dine with their families.
To provide our employees with a better work-life balance, we have a flexible work arrangement policy which permits flexible working hours, working from home or part-time work arrangements.
Promoting fairness and DiversityWe define our human resource policy on equal opportunities and fair employment practices and all job applicants are treated fairly regardless of ethnicity, age or gender. As part of the CapitaLand group, we adhere to the group’s policies on non-discriminatory employment practices. CapitaLand has signed the Employers Pledge for Fair Employment Practices with The Tripartite Alliance for Fair Employment Practices 1 and also upholds the spirit of international human rights conventions, such as the Universal Declaration of Human Rights and the International Labour Organisation Conventions, against discrimination in any form and coerced labour.
In 2013, 68.0% of our workforce was between the age of 30 and 50, 19.3% less than 30 years old and 12.7% more than 50 years old. Our workforce comprises an
almost equal proportion of males and females. The company’s female employees are well represented at the middle and senior management level. For the past three years, more than half of the managerial employees were female. In 2013, over 58.8% of senior management, comprising those who were at Vice President levels and above, were female.
and management programmes to sharpen their management, leadership and business skills.
engaging our PeopleWe encourage open communication and positive employee bonding to create a happy work environment that boosts productivity.
Staff communication sessions by senior management are conducted at least twice a year. During these staff communication sessions, information on financial results and key business focus are shared with employees. These sessions include a question and answer session, where employees can ask questions and management seek to gather feedback from them.
The CapitaLand and CMA intranet systems are valuable information platforms for employees to find out the details of employment terms, benefits, human resource policies and practices including the whistle-blowing policy as well as ethics and code of business conduct policies. CapitaLand also publishes an e-newsletter ‘iConnect’ to provide quarterly updates to employees on the latest development within CapitaLand.
We regularly organise recreational, team-building events and brain-storming workshops to reinforce organisational cohesiveness as part of our concerted efforts to engage our workforce. In 2013, activities such as complimentary health screenings, free flu vaccinations, wine appreciation, movie day and health-related activities were organised to encourage a
1 The Tripartite Alliance for Fair Employment Practices was formed in May 2006 to promote non-discriminatory employment practices and to shift mindsets among employers, employees and the general public towards fair employment practices for all workers in Singapore. Members include employer representatives, union leaders and government officials.
63


Dynamic DeliveryIn a challenging business environment, CMT continues to deliver on our growth strategies in creating dynamic retail destinations. Strong partnerships with tenants and unwavering commitment to shoppers’ experiences continue to drive the performance of our business.
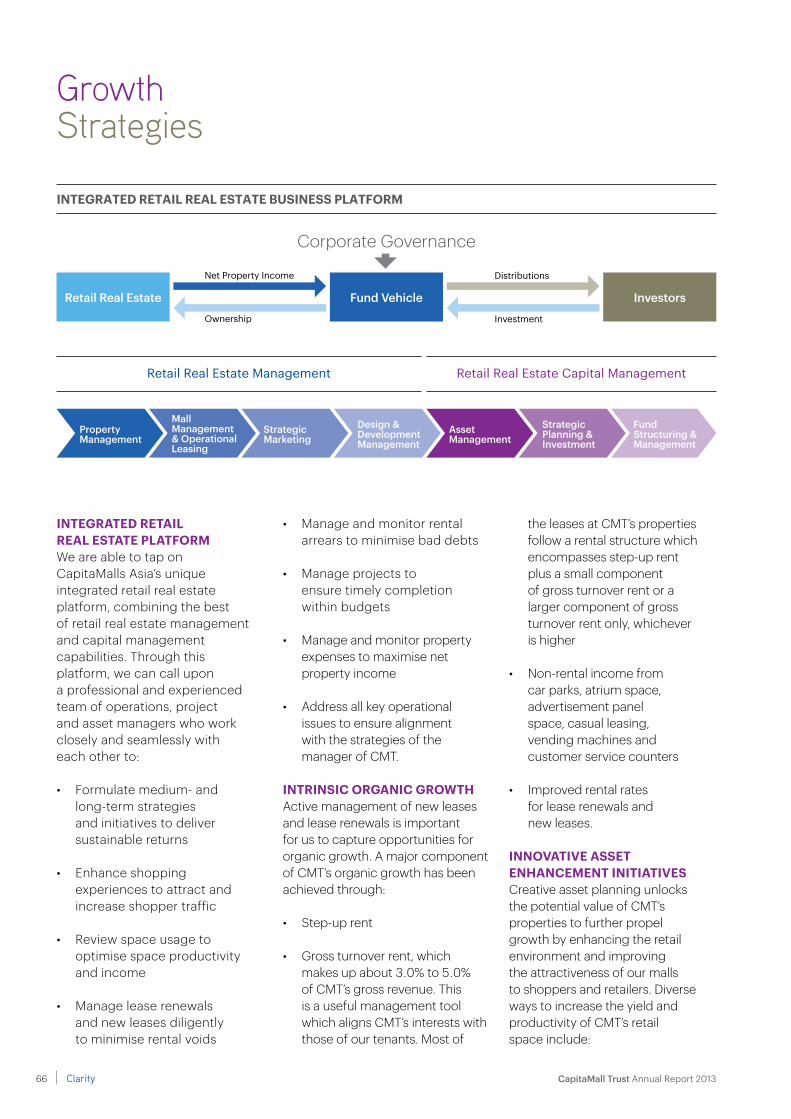
inteGrateD retail real estate business Platform
GrowthStrategies
inteGrateD retail real estate PlatformWe are able to tap on CapitaMalls Asia’s unique integrated retail real estate platform, combining the best of retail real estate management and capital management capabilities. Through this platform, we can call upon a professional and experienced team of operations, project and asset managers who work closely and seamlessly with each other to:
• Formulatemedium-and long-term strategies and initiatives to deliver sustainable returns
• Enhanceshopping experiences to attract and increase shopper traffic
• Reviewspaceusagetooptimise space productivity and income
• Manageleaserenewals and new leases diligently to minimise rental voids
Corporate Governance
Fund vehicleRetail Real estate Investors
Retail Real Estate Management Retail Real Estate Capital Management
PropertyManagement
Mall Management & OperationalLeasing
StrategicMarketing
Design &DevelopmentManagement
AssetManagement
StrategicPlanning &Investment
FundStructuring &Management
DistributionsNet Property Income
InvestmentOwnership
• Manageandmonitorrentalarrears to minimise bad debts
• Manageprojectsto ensure timely completion within budgets
• Manageandmonitorpropertyexpenses to maximise net property income
• Addressallkeyoperational issues to ensure alignment with the strategies of the manager of CMT.
intrinsic orGanic GroWthActive management of new leases and lease renewals is important for us to capture opportunities for organic growth. A major component of CMT’s organic growth has been achieved through:
• Step-uprent
• Grossturnoverrent,which makes up about 3.0% to 5.0% of CMT’s gross revenue. This is a useful management tool which aligns CMT’s interests with those of our tenants. Most of
the leases at CMT’s properties follow a rental structure which encompasses step-up rent plus a small component of gross turnover rent or a larger component of gross turnover rent only, whichever is higher
• Non-rentalincomefromcar parks, atrium space, advertisement panel space, casual leasing, vending machines and customer service counters
• Improvedrentalrates for lease renewals and new leases.
innovative assetenhancement initiativesCreative asset planning unlocks the potential value of CMT’s properties to further propel growth by enhancing the retail environment and improving the attractiveness of our malls to shoppers and retailers. Diverse ways to increase the yield and productivity of CMT’s retail space include:
Clarity66 CapitaMall Trust Annual Report 2013

Business Review
• Decantationwhereby lower-yield space is converted into higher-yield space
• Reconfigurationofretailunits to optimise space efficiency
• Maximisingtheuseof common areas, such as bridge space, and converting mechanical and electrical areas into leasable space
• Upgradingamenities, adding play and rest areas, providing design advisory on shop front design and creating better shopper circulation to enhance the attractiveness of our malls.
invitinG exPeriencesTo stay ahead of consumer trends, we constantly reinvent retail experiences with innovative shopping, dining and entertainment combinations which help to maximise the sales of the tenants and generate growth through improved rental income. The increase in shopper traffic is generated through:
• Alignmentoftenancy mix with current market trends which ensures a continual good mix of attractive and popular retail outlets in CMT’s malls
• Newretailconceptswhichgenerate fresh excitement and positive sales
• Enhancingshoppers’experiences with a more pleasant, comfortable and exciting environment by improving connectivity between floors, installing
electronic car park guidance system and media walls, upgrading restroom facilities, baby nursing rooms, family rooms, children’s playgrounds, designated water play areas with interactive features for children and alfresco dining areas
• Innovativemarketing and promotional events to draw in the crowds
• Attractiveshopfronts and visual merchandising design ideas.
instrumental investmentsThe ability to identify value-adding acquisition and investment in greenfield development, and further enhance their value is central to CMT’s long-term sustainable growth.
Our investments must satisfy the investment criteria of:
• potentialforgrowthinyield,
• rentalsustainabilityand
• potentialforvaluecreation.
CMT’s 15.28% interest in CapitaRetail China Trust provides some exposure to the growth in the China retail real estate market without significantly changing the asset profile of CMT.
In May 2011, CMT took a 30.00% stake in Westgate, marking its first foray into greenfield development and offering CMT a new avenue of growth. The mall opened on 2 December 2013. Westgate Tower is currently under development and a consortium has entered into
sales and purchase agreements to purchase Westgate Tower.
intensive caPital & risk manaGementWe seek to optimise returns to Unitholders while maintaining a strong capital base and credit rating to support CMT’s growth.
Regular assessments of capital management policies are undertaken to ensure that they are adaptable to changes in economic conditions and the risk characteristics of CMT. We also monitor our exposures to various risk elements by closely adhering to well-established management policies and procedures.
As part of our proactive capital management, we are currently diversifying our sources of funding and reducing the lumpiness of debts maturing in any one year.
67
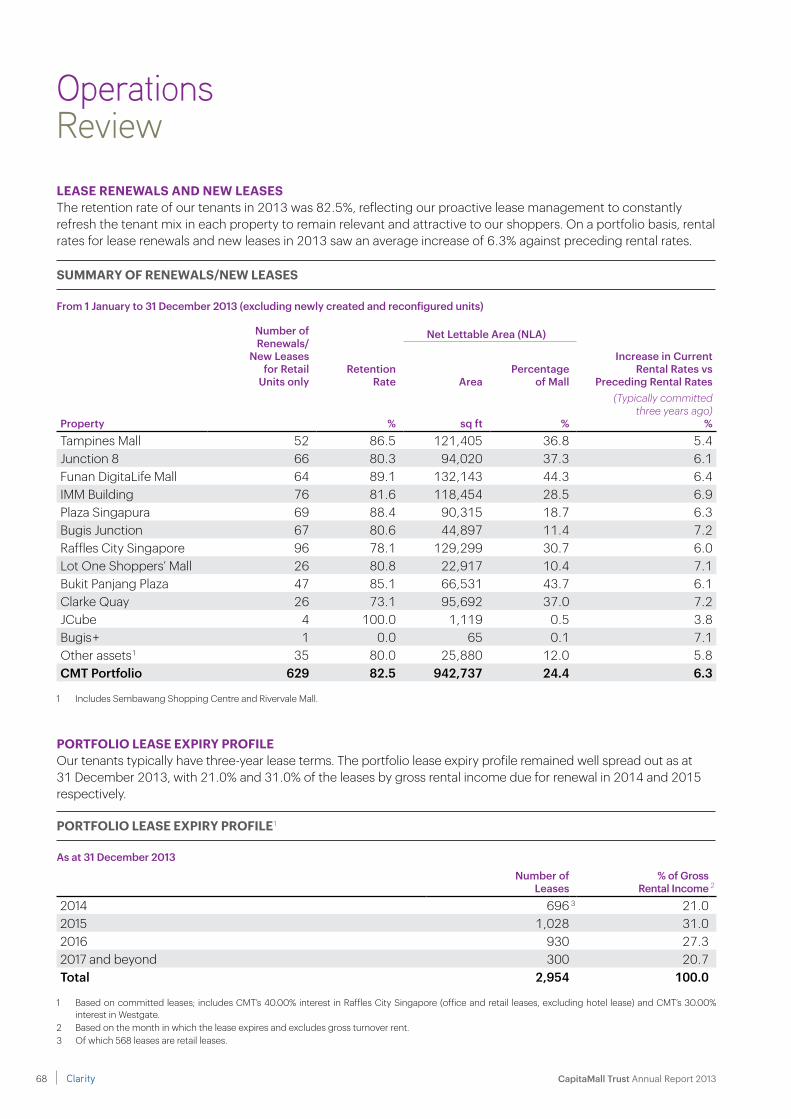
OperationsReview
lease reneWals anD neW leasesThe retention rate of our tenants in 2013 was 82.5%, reflecting our proactive lease management to constantly refresh the tenant mix in each property to remain relevant and attractive to our shoppers. On a portfolio basis, rental rates for lease renewals and new leases in 2013 saw an average increase of 6.3% against preceding rental rates.
summary of reneWals/neW leases
From 1 January to 31 December 2013 (excluding newly created and reconfigured units)
number of Renewals/
new Leases for Retail
Units only
net Lettable Area (nLA)
Increase in Current Rental Rates vs
Preceding Rental RatesRetention
Rate AreaPercentage
of Mall
Property % sq ft %
(Typically committed three years ago)
%Tampines Mall 52 86.5 121,405 36.8 5.4Junction 8 66 80.3 94,020 37.3 6.1Funan DigitaLife Mall 64 89.1 132,143 44.3 6.4IMM Building 76 81.6 118,454 28.5 6.9Plaza Singapura 69 88.4 90,315 18.7 6.3Bugis Junction 67 80.6 44,897 11.4 7.2Raffles City Singapore 96 78.1 129,299 30.7 6.0Lot One Shoppers’ Mall 26 80.8 22,917 10.4 7.1Bukit Panjang Plaza 47 85.1 66,531 43.7 6.1Clarke Quay 26 73.1 95,692 37.0 7.2JCube 4 100.0 1,119 0.5 3.8Bugis + 1 0.0 65 0.1 7.1Other assets 1 35 80.0 25,880 12.0 5.8CMT Portfolio 629 82.5 942,737 24.4 6.3
1 Includes Sembawang Shopping Centre and Rivervale Mall.
Portfolio lease exPiry ProfileOur tenants typically have three-year lease terms. The portfolio lease expiry profile remained well spread out as at 31 December 2013, with 21.0% and 31.0% of the leases by gross rental income due for renewal in 2014 and 2015 respectively.
Portfolio lease exPiry Profile 1
As at 31 December 2013
number of Leases
% of Gross Rental Income 2
2014 696 3 21.02015 1,028 31.02016 930 27.32017 and beyond 300 20.7Total 2,954 100.0
1 Based on committed leases; includes CMT’s 40.00% interest in Raffles City Singapore (office and retail leases, excluding hotel lease) and CMT’s 30.00% interest in Westgate.
2 Based on the month in which the lease expires and excludes gross turnover rent.3 Of which 568 leases are retail leases.
Clarity68 CapitaMall Trust Annual Report 2013
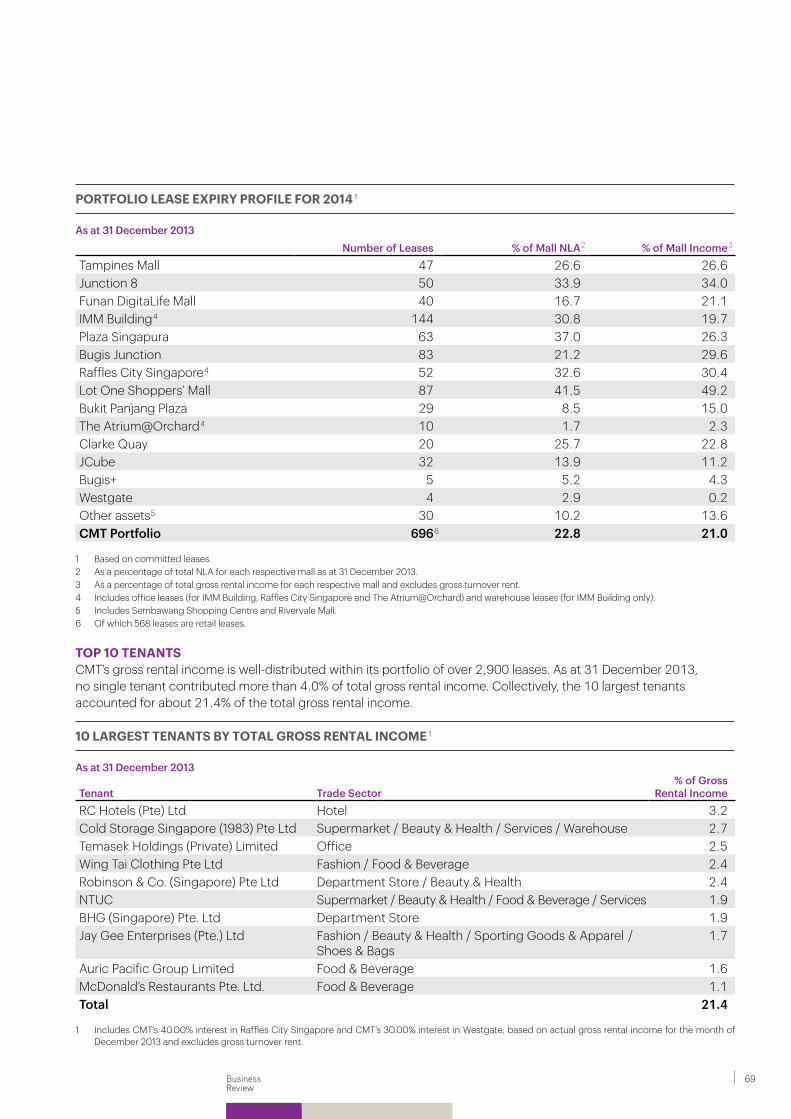
Business Review
Portfolio lease exPiry Profile for 2014 1
As at 31 December 2013number of Leases % of Mall nLA2 % of Mall Income3
Tampines Mall 47 26.6 26.6Junction 8 50 33.9 34.0Funan DigitaLife Mall 40 16.7 21.1IMM Building 4 144 30.8 19.7Plaza Singapura 63 37.0 26.3Bugis Junction 83 21.2 29.6Raffles City Singapore 4 52 32.6 30.4Lot One Shoppers’ Mall 87 41.5 49.2Bukit Panjang Plaza 29 8.5 15.0The Atrium@Orchard 4 10 1.7 2.3Clarke Quay 20 25.7 22.8JCube 32 13.9 11.2Bugis+ 5 5.2 4.3Westgate 4 2.9 0.2Other assets 5 30 10.2 13.6CMT Portfolio 6966 22.8 21.0
1 Based on committed leases.2 As a percentage of total NLA for each respective mall as at 31 December 2013.3 As a percentage of total gross rental income for each respective mall and excludes gross turnover rent.4 Includes office leases (for IMM Building, Raffles City Singapore and The Atrium@Orchard) and warehouse leases (for IMM Building only). 5 Includes Sembawang Shopping Centre and Rivervale Mall.6 Of which 568 leases are retail leases.
10 larGest tenants by total Gross rental income 1
As at 31 December 2013
Tenant Trade Sector% of Gross
Rental IncomeRC Hotels (Pte) Ltd Hotel 3.2Cold Storage Singapore (1983) Pte Ltd Supermarket / Beauty & Health / Services / Warehouse 2.7Temasek Holdings (Private) Limited Office 2.5Wing Tai Clothing Pte Ltd Fashion / Food & Beverage 2.4Robinson & Co. (Singapore) Pte Ltd Department Store / Beauty & Health 2.4NTUC Supermarket / Beauty & Health / Food & Beverage / Services 1.9BHG (Singapore) Pte. Ltd Department Store 1.9Jay Gee Enterprises (Pte.) Ltd Fashion / Beauty & Health / Sporting Goods & Apparel /
Shoes & Bags1.7
Auric Pacific Group Limited Food & Beverage 1.6McDonald’s Restaurants Pte. Ltd. Food & Beverage 1.1Total 21.4
1 Includes CMT’s 40.00% interest in Raffles City Singapore and CMT’s 30.00% interest in Westgate; based on actual gross rental income for the month of December 2013 and excludes gross turnover rent.
toP 10 tenantsCMT’s gross rental income is well-distributed within its portfolio of over 2,900 leases. As at 31 December 2013, no single tenant contributed more than 4.0% of total gross rental income. Collectively, the 10 largest tenants accounted for about 21.4% of the total gross rental income.
69

traDe sector analysisCMT’s portfolio is well-diversified and relies on many different trade sectors for rental income. As at 31 December 2013, Food & Beverage (F&B) remained the largest contributor to gross rental income at 27.7% of the total portfolio. Fashion, which occupied 9.0% of NLA, remained the second largest contributor to gross rental income at 14.8%.
More than 70.0% of CMT’s malls in the portfolio caters to the necessity shopping segment, in terms of gross revenue and asset valuation.
OperationsReview
1 Includes CMT’s 40.00% interest in Raffles City Singapore (retail and office leases, excluding hotel lease) and CMT’s 30.00% interest in Westgate.2 Based on committed gross rental income and excludes gross turnover rent.3 Includes tenants approved as thematic dining, entertainment and a performance centre in Bugis+.4 Others include Art Gallery and Luxury.
By Net Lettable Area
(As at 31 December 2013)
Food & Beverage 19.2Leisure & Entertainment / Music & Video 3
10.4
Fashion 9.0Department Store 8.9Warehouse 8.7Office 7.9Beauty & Health 6.2Supermarket 6.2Gifts / Toys & Hobbies / Books / Sporting Goods
4.8
Services 3.6Information Technology 3.2Houseware & Furnishings 3.1Electrical & Electronics 2.9Education 2.5Shoes & Bags 2.2Jewellery & Watches 0.9
Others 4 0.3
Food & Beverage 27.7Fashion 14.8Beauty & Health 9.7Services 6.5Department Store 6.1Leisure & Entertainment / Music & Video 2
5.6
Gifts / Toys & Hobbies / Books / Sporting Goods
4.9
Shoes & Bags 4.1Supermarket 3.5Office 3.5Houseware & Furnishings 2.9Jewellery & Watches 2.6Information Technology 2.6Electrical & Electronics 2.3Warehouse 1.2Education 1.2
Others 4 0.8
By Gross Rental Income 2
(For the month of December 2013)
cmt Portfolio 1
(%)
Clarity70 CapitaMall Trust Annual Report 2013

Business Review
1 Excludes CMT’s 30.00% interest in Westgate which commenced mall operations on 2 December 2013.2 Includes Tampines Mall, Junction 8, IMM Building, Plaza Singapura, Bugis Junction, Sembawang Shopping Centre, Lot One Shoppers’ Mall, Bukit Panjang
Plaza, Rivervale Mall, JCube and The [email protected] Includes Funan DigitaLife Mall, Clarke Quay, Bugis+ and CMT’s 40.00% interest in Raffles City Singapore.
By Gross Revenue
(For full year 2013)
By Asset Valuation
(As at 31 December 2013)
cmt Portfolio 1
(%)
Necessity Shopping 2 73.6Discretionary Shopping 3 26.4
Necessity Shopping 2 73.6Discretionary Shopping 3 26.4
vibrant retail and dining experiences in The Atrium@Orchard
71
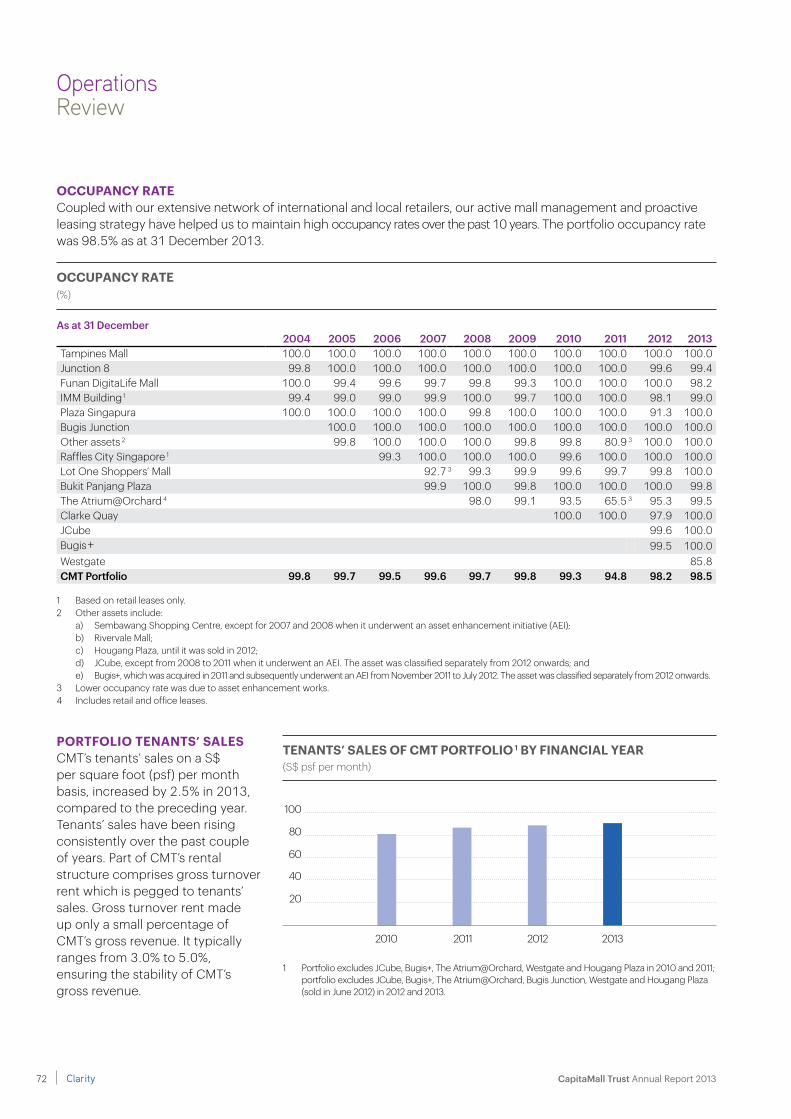
100
80
60
40
20
2004 2005 2006 2007 2008 2009 2010 2011 2012 2013 Tampines Mall 100.0 100.0 100.0 100.0 100.0 100.0 100.0 100.0 100.0 100.0Junction 8 99.8 100.0 100.0 100.0 100.0 100.0 100.0 100.0 99.6 99.4Funan DigitaLife Mall 100.0 99.4 99.6 99.7 99.8 99.3 100.0 100.0 100.0 98.2IMM Building 1 99.4 99.0 99.0 99.9 100.0 99.7 100.0 100.0 98.1 99.0Plaza Singapura 100.0 100.0 100.0 100.0 99.8 100.0 100.0 100.0 91.3 100.0Bugis Junction 100.0 100.0 100.0 100.0 100.0 100.0 100.0 100.0 100.0Other assets 2 99.8 100.0 100.0 100.0 99.8 99.8 80.9 3 100.0 100.0Raffles City Singapore 1 99.3 100.0 100.0 100.0 99.6 100.0 100.0 100.0Lot One Shoppers’ Mall 92.7 3 99.3 99.9 99.6 99.7 99.8 100.0Bukit Panjang Plaza 99.9 100.0 99.8 100.0 100.0 100.0 99.8The Atrium@Orchard 4 98.0 99.1 93.5 65.5 3 95.3 99.5Clarke Quay 100.0 100.0 97.9 100.0JCube 99.6 100.0Bugis + 99.5 100.0Westgate 85.8CMT Portfolio 99.8 99.7 99.5 99.6 99.7 99.8 99.3 94.8 98.2 98.5
1 Based on retail leases only.2 Other assets include:
a) Sembawang Shopping Centre, except for 2007 and 2008 when it underwent an asset enhancement initiative (AEI);b) Rivervale Mall;c) Hougang Plaza, until it was sold in 2012;d) JCube, except from 2008 to 2011 when it underwent an AEI. The asset was classified separately from 2012 onwards; ande) Bugis+, which was acquired in 2011 and subsequently underwent an AEI from November 2011 to July 2012. The asset was classified separately from 2012 onwards.
3 Lower occupancy rate was due to asset enhancement works.4 Includes retail and office leases.
occuPancy rateCoupled with our extensive network of international and local retailers, our active mall management and proactive leasing strategy have helped us to maintain high occupancy rates over the past 10 years. The portfolio occupancy rate was 98.5% as at 31 December 2013.
OperationsReview
occuPancy rate(%)
As at 31 December
tenants’ sales of cmt Portfolio 1 by financial year (S$ psf per month)
1 Portfolio excludes JCube, Bugis+, The Atrium@Orchard, Westgate and Hougang Plaza in 2010 and 2011; portfolio excludes JCube, Bugis+, The Atrium@Orchard, Bugis Junction, Westgate and Hougang Plaza (sold in June 2012) in 2012 and 2013.
2010 2011 2012 2013
Portfolio tenants’ salesCMT’s tenants’ sales on a S$ per square foot (psf) per month basis, increased by 2.5% in 2013, compared to the preceding year. Tenants’ sales have been rising consistently over the past couple of years. Part of CMT’s rental structure comprises gross turnover rent which is pegged to tenants’ sales. Gross turnover rent made up only a small percentage of CMT’s gross revenue. It typically ranges from 3.0% to 5.0%, ensuring the stability of CMT’s gross revenue.
Clarity72 CapitaMall Trust Annual Report 2013

Business Review
General Growth Properties
(United States)
564582
Westfield Group (United States)
Simon Property (United States)
582
Performance of tenants’ sales by traDeMost trade categories registered stronger sales performance with Jewellery & Watches and Music & Video achieving the highest growth rate of 15.4% and 13.7% respectively in terms of tenants’ sales in 2013, compared to 2012.
1 Services include convenience stores, bridal shops, optical shops, film processing shops, florists, magazine stores, pet shops, travel agencies, cobblers/locksmiths, laundromats and clinics.
Sources: Data publicly disclosed as at 30 June 2013 (Westfield Retail) and 31 December 2013 (CFS Retail Property Trust, CMT, Simon Property, Westfield Group and General Growth Properties).
full year tenants’ sales of retail reits(US$ psf per annum)
(0.3)
tenants’ sales s$ Psf Per month variance year-on-year(%)
15.413.7
11.49.4
4.7 4.6 4.2 3.9 3.71.3
(0.8)(2.0) (2.4)
(6.2) (7.3) (7.3)
(15.8)
Tele
com
mun
icat
ions
Mus
ic &
Vid
eo
Serv
ices
1
Shoe
s &
Bag
s
Food
& B
ever
age
Spor
ting
Goo
ds
Info
rmat
ion
Tech
nolo
gy
Beau
ty &
Hea
lth
Toys
& H
obbi
es
Fash
ion
Elec
tric
al &
Ele
ctro
nics
Book
s &
Sta
tione
ry
Supe
rmar
ket
Dep
artm
ent S
tore
Leis
ure
& E
nter
tain
men
t
Hom
e Fu
rnis
hing
Gift
s &
Sou
veni
rs
Jew
elle
ry &
Wat
ches
Compared with other retail real estate investment trusts (REITs) in Australia and the United States, the tenants’ sales (US$ psf per annum) of CMT’s portfolio in 2013 was among the highest.
CFS Retail Property Trust (Australia)
911
Westfield Retail (Australia)
888
CMT (Singapore)
881
73
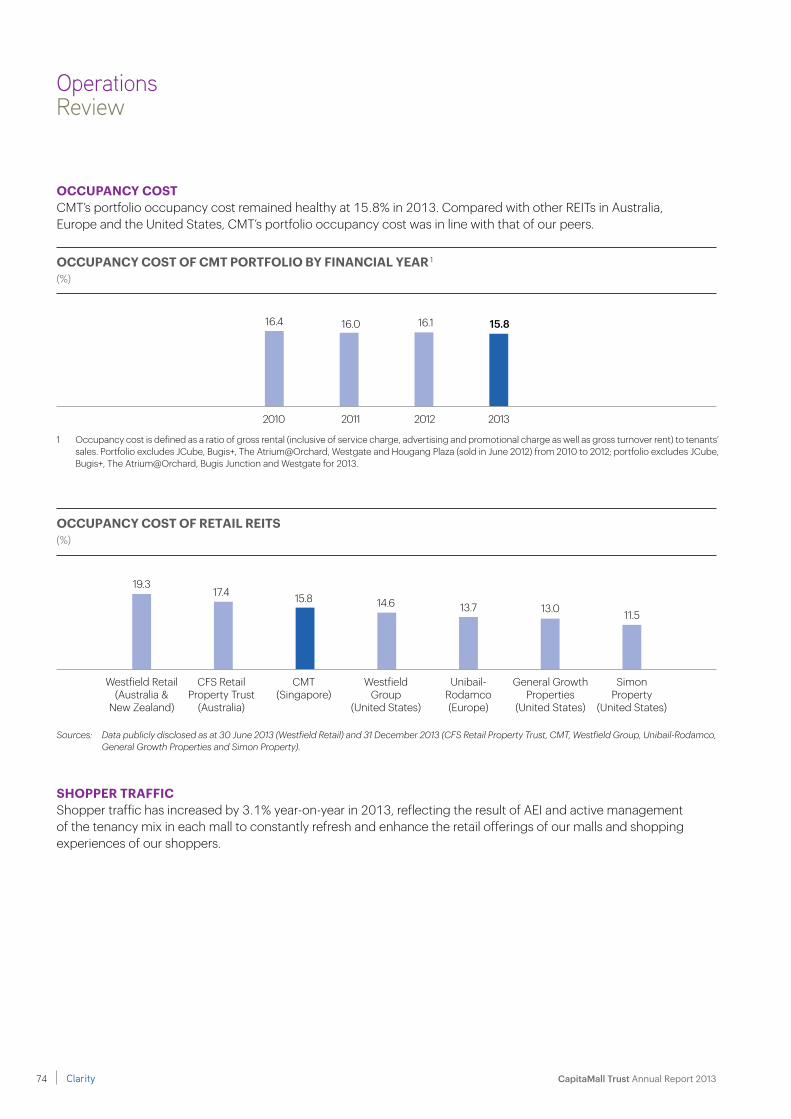
OperationsReview
occuPancy cost of cmt Portfolio by financial year 1
(%)
1 Occupancy cost is defined as a ratio of gross rental (inclusive of service charge, advertising and promotional charge as well as gross turnover rent) to tenants’ sales. Portfolio excludes JCube, Bugis+, The Atrium@Orchard, Westgate and Hougang Plaza (sold in June 2012) from 2010 to 2012; portfolio excludes JCube, Bugis+, The Atrium@Orchard, Bugis Junction and Westgate for 2013.
2010 2011 2012 2013
16.4 16.1 15.816.0
Sources: Data publicly disclosed as at 30 June 2013 (Westfield Retail) and 31 December 2013 (CFS Retail Property Trust, CMT, Westfield Group, Unibail-Rodamco, General Growth Properties and Simon Property).
occuPancy cost of retail reits (%)
17.413.7 13.0 11.5
15.819.3
occuPancy costCMT’s portfolio occupancy cost remained healthy at 15.8% in 2013. Compared with other REITs in Australia, Europe and the United States, CMT’s portfolio occupancy cost was in line with that of our peers.
shoPPer trafficShopper traffic has increased by 3.1% year-on-year in 2013, reflecting the result of AEI and active management of the tenancy mix in each mall to constantly refresh and enhance the retail offerings of our malls and shopping experiences of our shoppers.
Westfield Retail (Australia &
New Zealand)
CFS Retail Property Trust
(Australia)
CMT (Singapore)
14.6
Westfield Group
(United States)
Unibail- Rodamco (Europe)
General Growth Properties
(United States)
Simon Property
(United States)
Clarity74 CapitaMall Trust Annual Report 2013
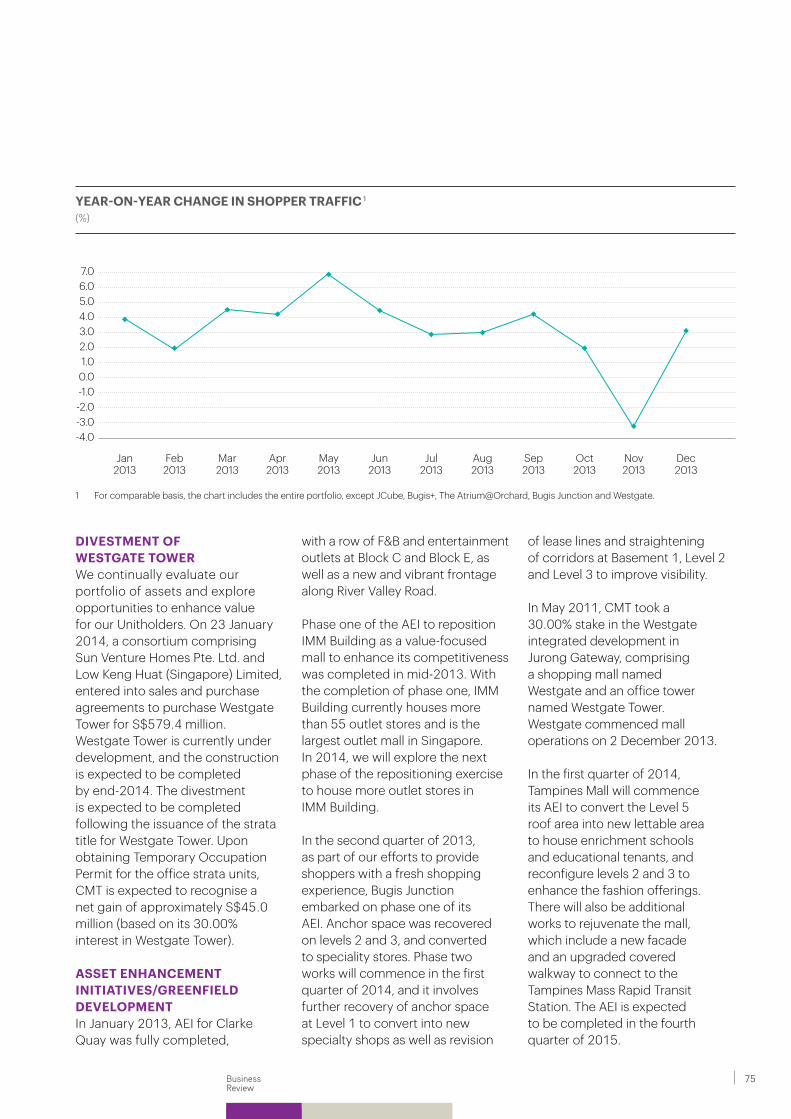
Business Review
with a row of F&B and entertainment outlets at Block C and Block E, as well as a new and vibrant frontage along River Valley Road.
Phase one of the AEI to reposition IMM Building as a value-focused mall to enhance its competitiveness was completed in mid-2013. With the completion of phase one, IMM Building currently houses more than 55 outlet stores and is the largest outlet mall in Singapore. In 2014, we will explore the next phase of the repositioning exercise to house more outlet stores in IMM Building.
In the second quarter of 2013, as part of our efforts to provide shoppers with a fresh shopping experience, Bugis Junction embarked on phase one of its AEI. Anchor space was recovered on levels 2 and 3, and converted to speciality stores. Phase two works will commence in the first quarter of 2014, and it involves further recovery of anchor space at Level 1 to convert into new specialty shops as well as revision
of lease lines and straightening of corridors at Basement 1, Level 2 and Level 3 to improve visibility.
In May 2011, CMT took a 30.00% stake in the Westgate integrated development in Jurong Gateway, comprising a shopping mall named Westgate and an office tower named Westgate Tower. Westgate commenced mall operations on 2 December 2013.
In the first quarter of 2014, Tampines Mall will commence its AEI to convert the Level 5 roof area into new lettable area to house enrichment schools and educational tenants, and reconfigure levels 2 and 3 to enhance the fashion offerings. There will also be additional works to rejuvenate the mall, which include a new facade and an upgraded covered walkway to connect to the Tampines Mass Rapid Transit Station. The AEI is expected to be completed in the fourth quarter of 2015.
Divestment of WestGate toWerWe continually evaluate our portfolio of assets and explore opportunities to enhance value for our Unitholders. On 23 January 2014, a consortium comprising Sun Venture Homes Pte. Ltd. and Low Keng Huat (Singapore) Limited, entered into sales and purchase agreements to purchase Westgate Tower for S$579.4 million. Westgate Tower is currently under development, and the construction is expected to be completed by end-2014. The divestment is expected to be completed following the issuance of the strata title for Westgate Tower. Upon obtaining Temporary Occupation Permit for the office strata units, CMT is expected to recognise a net gain of approximately S$45.0 million (based on its 30.00% interest in Westgate Tower).
asset enhancement initiatives/GreenfielD DeveloPmentIn January 2013, AEI for Clarke Quay was fully completed,
year-on-year chanGe in shoPPer traffic 1
(%)
1 For comparable basis, the chart includes the entire portfolio, except JCube, Bugis+, The Atrium@Orchard, Bugis Junction and Westgate.
Jan2013
Feb2013
Mar2013
Apr2013
May2013
Jun2013
Jul2013
Aug2013
Sep2013
Oct2013
Nov2013
Dec2013
7.06.05.04.03.02.01.0
0.0-1.0-2.0-3.0-4.0
75

FinancialReview
Gross revenueGross revenue for financial year (FY) 2013 was S$729.2 million, an increase of S$67.6 million or 10.2% over FY 2012. JCube, which reopened on 2 April 2012, accounted for S$10.1 million of the increase. Bugis+ and The Atrium@Orchard (Atrium) also accounted for S$40.2 million increase in gross revenue arising from the completion of asset enhancement initiatives (AEI) in end-July 2012 and end-October 2012 respectively. Westgate contributed S$1.3 million (CMT’s 30.00% interest) after it commenced operations on 2 December 2013. The other properties except for Bugis Junction, accounted for S$18.1 million increase in gross revenue mainly due to higher rental achieved on new and renewed leases and staggered rental, as well as higher rental on gross turnover. Bugis Junction recorded lower gross revenue as it underwent AEI from April 2013 to October 2013.
FY 2013 1 FY 2012 varianceGross Revenue by Property S$’000 S$’000 S$’000 %Tampines Mall 73,384 69,752 3,632 5.2 Junction 8 55,447 53,661 1,786 3.3 Funan DigitaLife Mall 33,306 32,139 1,167 3.6 IMM Building 75,406 73,558 1,848 2.5 Plaza Singapura 83,954 81,228 2,726 3.4 Bugis Junction 2 73,059 75,176 (2,117) (2.8)Sembawang Shopping Centre, Hougang Plaza 3 and Rivervale Mall 22,990 23,049 (59) (0.3)JCube 4 33,842 23,712 10,130 42.7 Lot One Shoppers’ Mall 41,966 40,688 1,278 3.1 Bukit Panjang Plaza 25,867 25,053 814 3.2The Atrium@Orchard 4 49,572 21,193 28,379 133.9 Clarke Quay 37,309 34,369 2,940 8.6 Bugis+ 4 31,454 19,640 11,814 60.2
637,556 573,218 64,338 11.2 Raffles City Singapore (40.00% interest) 90,315 88,370 1,945 2.2 Westgate (30.00% interest) 5 1,291 – 1,291 N.M.CMT Group 729,162 661,588 67,574 10.2
N.M.: Not Meaningful.
1 Adjusted for intercompany transactions within CMT Group.2 Bugis Junction underwent AEI from April 2013 to October 2013.3 The sale of Hougang Plaza was completed on 13 June 2012.4 JCube, Bugis+ and Atrium underwent AEI and resumed full operations in April 2012, August 2012 and October 2012 respectively.5 Westgate was under development and commenced mall operations on 2 December 2013.
FY 2013 1 FY 2012Tampines Mall 73.4 69.8Junction 8 55.4 53.7Funan DigitaLife Mall 33.3 32.1IMM Building 75.4 73.6Plaza Singapura 84.0 81.2Bugis Junction 2 73.1 75.2Sembawang Shopping Centre, Hougang Plaza 3 and Rivervale Mall
23.0 23.0
JCube 4 33.8 23.7Lot One Shoppers’ Mall 42.0 40.7Bukit Panjang Plaza 25.9 25.0The Atrium@Orchard 4 49.6 21.2Clarke Quay 37.3 34.4Bugis+ 4 31.4 19.6Raffles City Singapore (40.00% interest)
90.3 88.4
Westgate (30.00% interest) 5 1.3 –
Gross revenue by ProPerty(S$ million)
FY 2013 1 FY 2012
661.6
729.2
Clarity76 CapitaMall Trust Annual Report 2013

Business Review
net ProPerty income by ProPerty(S$ million)
net ProPerty incomeAs a result of the higher gross revenue, net property income (NPI) of S$502.7 million was S$57.4 million or 12.9% higher than the S$445.3 million for the FY ended 31 December 2012. This was mainly due to the completion of AEI at JCube, Bugis+ and Atrium in 2012 as well as strong operating performance from the other properties.
FY 2013 1 FY 2012 variancenet Property Income by Property S$’000 S$’000 S$’000 %Tampines Mall 53,789 50,328 3,461 6.9 Junction 8 39,496 37,901 1,595 4.2 Funan DigitaLife Mall 22,095 21,384 711 3.3 IMM Building 50,024 46,597 3,427 7.4 Plaza Singapura 63,141 59,404 3,737 6.3 Bugis Junction 2 47,903 51,927 (4,024) (7.7)Sembawang Shopping Centre, Hougang Plaza 3 and Rivervale Mall 13,480 13,427 53 0.4 JCube 4 22,086 14,223 7,863 55.3 Lot One Shoppers’ Mall 28,881 27,928 953 3.4 Bukit Panjang Plaza 16,690 15,925 765 4.8 The Atrium@Orchard 4 36,710 11,393 25,317 222.2 Clarke Quay 23,073 19,972 3,101 15.5 Bugis+ 4 21,313 10,319 10,994 106.5
438,681 380,728 57,953 15.2 Raffles City Singapore (40.00% interest) 66,407 64,525 1,882 2.9 Westgate (30.00% interest) 5 (2,285) – (2,285) N.M.Westgate Tower (30.00% interest) 6 (104) – (104) N.M.CMT Group 502,699 445,253 57,446 12.9
N.M.: Not Meaningful.
1 Adjusted for intercompany transactions within CMT Group.2 Bugis Junction underwent AEI from April 2013 to October 2013.3 The sale of Hougang Plaza was completed on 13 June 2012.4 JCube, Bugis+ and Atrium underwent AEI and resumed full operations in April 2012, August 2012 and October 2012 respectively.5 Westgate was under development and commenced mall operations on 2 December 2013.6 Westgate Tower is currently under development.
FY 2013 1 FY 2012Tampines Mall 53.8 50.4Junction 8 39.4 37.9Funan DigitaLife Mall 22.1 21.4IMM Building 50.0 46.6Plaza Singapura 63.2 59.4Bugis Junction 2 47.9 51.9Sembawang Shopping Centre, Hougang Plaza 3 and Rivervale Mall
13.6 13.5
JCube 4 22.0 14.2Lot One Shoppers’ Mall 28.9 27.9Bukit Panjang Plaza 16.7 15.9The Atrium@Orchard 4 36.7 11.4Clarke Quay 23.1 20.0Bugis+ 4 21.3 10.3Raffles City Singapore (40.00% interest)
66.4 64.5
Westgate (30.00% interest) 5 (2.3) –Westgate Tower (30.00% interest) 6 (0.1) –
502.7
445.3
FY 2013 1 FY 2012
77

DistributionsDistribution for FY 2013 was S$356.2 million, an increase of S$39.3 million or 12.4% as compared to FY 2012. Distribution per unit (DPU) for FY 2013 was 10.27 cents, 8.6% higher than 9.46 cents for FY 2012. The increase was mainly attributed to JCube, Bugis+ and Atrium which completed their respective AEI and commenced operations in April 2012, August 2012 and October 2012 respectively as well as strong operating performance from the other properties. In 2013, CMT retained S$7.6 million capital distribution and tax-exempt income received from CapitaRetail China Trust
as well as S$3.5 million tax-exempt special preference dividend income received from CapitaRetail Singapore Limited for general corporate and working capital purposes.
assetsAs at 31 December 2013, the total assets for CMT and its subsidiaries (CMT Group) were S$10,017.5 million, compared with S$9,888.7 million as at 31 December 2012. The increase of S$128.8 million was mainly due to the revaluation surplus on investment properties of S$204.2 million, capital expenditure of S$158.5 million (including S$69.3 million capital expenditure incurred under
FinancialReview
20131 January to
31 March1 April to30 June
1 July to30 September
1 October to 31 December
1 January to31 December
DPU (cents)
2.46 2.53 2.56 2.72 10.27
20121 January to
31 March1 April to30 June
1 July to30 September
1 October to29 november
30 november to31 December 1
1 January to31 December
DPU (cents)
2.30 2.38 2.42 1.55 0.81 9.46
DPU (cents) 2.36
1 DPU for the period from 30 November 2012 to 31 December 2012 was based on the enlarged number of 3,456,420,674 units as at 31 December 2012 after the issuance of 125,000,000 units via the private placement exercise on 30 November 2012.
breakDoWn of unitholDers’ Distribution for fy 2013 With fy 2012 comParatives
investment properties under development and development property for sale) and increase in investment in associate of S$26.2 million mainly attributed to revaluation surplus on investment properties recognised by CapitaRetail China Trust. The increase was offset by the decrease in cash and cash equivalents of S$285.6 million. The decrease in cash and cash equivalents was mainly due to the redemption in 2013 of S$300.0 million retail bonds and the redemption and cancellation of the remaining S$98.25 million in principal amount of the S$650.0 million 1.0% convertible bond due 2013 upon maturity.
Clarity78 CapitaMall Trust Annual Report 2013

Business Review
valuations anD valuation caPitalisation rates
As at 31 December
Property
valuation valuation per net
Lettable Area 2013
S$ per sq ft
valuation Capitalisation Rate 1
2013S$ million
2012S$ million
varianceS$ million
2013%
2012%
Tampines Mall 852.0 827.0 25.0 2,585 5.35 5.50Junction 8 636.0 617.0 19.0 2,520 5.35 5.50Funan DigitaLife Mall 358.0 354.0 4.0 1,199 5.50 5.65IMM Building 632.0 608.0 24.0 663 2 Retail – 6.50
Office – 6.25Warehouse – 7.50
Retail – 6.50Office – 6.75
Warehouse – 7.75Plaza Singapura 1,168.0 1,106.0 62.0 2,423 5.00 5.25Bugis Junction 901.0 879.0 22.0 2,241 5.35 5.50JCube 360.0 340.0 20.0 1,712 5.60 5.75Lot One Shoppers’ Mall 485.0 467.0 18.0 2,206 5.35 5.50Bukit Panjang Plaza 274.0 270.0 4.0 1,798 5.45 5.60The Atrium@Orchard 722.0 717.0 5.0 1,856 2 Retail – 5.25
Office – 4.00Retail – 5.50
Office – 4.15Clarke Quay 347.0 325.0 22.0 1,192 5.50 5.65Bugis+ 330.0 322.0 8.0 1,539 5.70 5.85Other assets 3 211.0 199.0 12.0 977 5.55 – 5.60 5.70 – 5.75Total CMT Portfolio excluding Raffles City Singapore (40.00% interest) and Westgate (30.00% interest)
7,276.0 7,031.0 245.0 1,650 n.A. n.A.
Raffles City Singapore (40.00% interest)
1,207.2 1,160.8 46.4 N.M. 4 Retail – 5.25Office – 4.25Hotel – 5.55
Retail – 5.40Office – 4.25Hotel – 5.75
Westgate (30.00% interest) 5 316.2 N.A. 6 316.2 2,568 5.35 N.A.Total CMT Portfolio 8,799.4 8,191.8 607.6 1,675 7 n.A. n.A.Less additions
during the year(89.2)
Less reclassification during the year
(313.5) 8
Less consolidation adjustments
(0.7) 9
net increase in valuations 204.2
N.A.: Not Applicable. N.M.: Not Meaningful.
1 Valuation capitalisation rate refers to the capitalisation rate adopted by the independent valuers to derive the market values of each property.2 Reflects valuation of the property in its entirety. 3 Includes Sembawang Shopping Centre and Rivervale Mall. 4 Not meaningful because Raffles City Singapore comprises retail units, office units, hotels and convention centre.5 For the retail component of the Westgate development only. Westgate Tower has been reclassified to development property for sale under current assets.6 Valuation as at 31 December 2012 is for land only. 7 Valuation per sq ft excludes Raffles City Singapore. 8 Westgate was reclassified as investment property upon completion of development and commenced mall operations on 2 December 2013.9 Refers to acquisition fees for Westgate and Westgate Tower capitalised at CMT level, net of interest on intercompany loans to Infinity Mall Trust (CMT’s
30.00% interest) and Infinity Office Trust (CMT’s 30.00% interest), now adjusted to revaluation surplus.
79

Financial Performance for 2009 to 2012
FinancialReview
2011
Gross revenueGross revenue for the FY ended 31 December 2011 was S$630.6 million, an increase of S$49.5 million or 8.5% over S$581.1 million for the FY ended 31 December 2010. Of the increase, S$28.9 million was due to Clarke Quay and Bugis+, which were acquired on 1 July 2010 and 1 April 2011 respectively, while the balance was attributed to higher gross revenue across the properties mainly due to the higher rental rates achieved from new and renewed leases and step-up rents. The increase was partially offset by decrease in revenue from Atrium due to the commencement of its AEI in January 2011.
net Property incomeAs a result of the higher gross revenue, NPI of S$418.2 million was S$19.1 million or 4.8% higher than the S$399.1 million for FY 2010. Similarly, this was mainly due to Clarke Quay and Bugis+ which were acquired on 1 July 2010 and 1 April 2011 respectively and higher rental income across the properties which was partially offset by decrease in revenue from Atrium and JCube due to AEI.
2010
Gross revenueGross revenue for the FY 2010 was S$581.1 million, an increase of S$28.4 million or 5.1% over S$552.7 million for FY 2009. S$15.4 million of the increase was due to Clarke Quay, which was acquired on 1 July 2010 while the balance was attributed to higher gross revenue across the properties mainly due to the higher
rental rates achieved from new and renewed leases and step-up rents.
net Property incomeAs a result of the higher gross revenue, NPI of S$399.1 million was S$22.3 million or 5.9% higher than the S$376.8 million for FY 2009. Similarly, this was mainly due to Clarke Quay which was acquired on 1 July 2010 and higher rental income across the properties.
2009
Gross revenueGross revenue for FY 2009 was S$552.7 million, an increase of S$41.8 million or 8.2% over S$510.9 million for FY 2008. S$19.4 million of the increase was due to Atrium which was acquired on 15 August 2008. The balance was attributed to higher gross revenue from Tampines Mall, IMM, Plaza Singapura, Bugis Junction, Sembawang Shopping Centre (SSC) and Lot One Shoppers’ Mall (Lot One) mainly due to the completion of AEI and partially offset by decrease in gross revenue from JCube as it has ceased operations for AEI. On a comparable mall basis (excluding SSC, JCube and Atrium), gross revenue for FY 2009 was S$18.0 million or 3.6% higher than FY 2008.
net Property incomeAs a result of the higher gross revenue, NPI of S$376.8 million was S$35.7 million or 10.4% higher than the S$341.1 million for FY 2008. Similarly, this was mainly due to Atrium which was acquired on 15 August 2008, SSC which re-opened in late December 2008 and higher NPI from Tampines Mall, IMM, Plaza Singapura, Bugis Junction and Lot One mainly due to the completion of AEI.
2012
Gross revenueGross revenue for FY 2012 was S$661.6 million, an increase of S$31.0 million or 4.9% over FY 2011. JCube, which re-opened on 2 April 2012, accounted for S$23.7 million of the increase in gross revenue. Bugis+, acquired on 1 April 2011 commenced AEI in November 2011 and completed its AEI in end-July 2012, accounted for S$8.4 million of the increase in gross revenue. The other properties, except for Atrium and IMM Building (IMM), accounted for another S$8.4 million increase in gross revenue mainly due to higher rental rates achieved from new and renewed leases and step-up rents. Atrium recorded lower gross revenue as it was undergoing AEI since January 2011. Atrium’s AEI was completed in end-October 2012 while IMM recorded lower gross revenue as a result of the ongoing AEI which started in May 2012.
net Property incomeAs a result of the higher gross revenue, NPI of S$445.3 million was S$27.1 million or 6.5% higher than the S$418.2 million for the FY ended 31 December 2011. Similarly, this was mainly due to JCube which re-opened on 2 April 2012 and Bugis+ which was acquired on 1 April 2011 and completed its AEI in end-July 2012.
Clarity80 CapitaMall Trust Annual Report 2013

Business Review
key financial inDicators
CapitalManagement
1 Total Assets exclude non-eliminated portion of CMT’s loan to Infinity Mall Trust and Infinity Office Trust (collectively, the Infinity Trusts) and CMT’s share of interest expense on the loans from joint venture partners, capitalised under investment properties under development and development property for sale in 2012 and 2013 respectively, arising from proportionate accounting.
2 Ratio of borrowings including 40.00% share of borrowings of RCS Trust and 30.00% share of borrowings of Infinity Trusts, over total deposited property for CMT Group, excludes non-eliminated portion of CMT’s loan to Infinity Trusts and CMT’s share of interest expense on the loans from joint venture partners, capitalised under investment properties under development and development property for sale in 2012 and 2013 respectively, arising from proportionate accounting.
3 Funds raised ahead of the maturity of the existing borrowings of CMT are excluded from both borrowings and total deposited property for the purpose of computing the gearing ratio as the funds are set aside solely for the purpose of repaying the existing borrowings of CMT.
4 Net Debt comprises gross debt less temporary cash intended for refinancing and capital expenditure and EBITDA refers to earnings before interest, tax, depreciation and amortisation.
5 Ratio of net investment income at CMT Group before interest and tax over interest expense from 1 January 2013 to 31 December 2013 and 1 January 2012 to 31 December 2012 respectively. In computing the ratio, cost of raising debt and CMT’s share of interest expense on the loans from joint venture partners arising from proportionate accounting, are excluded from interest expense.
6 Ratio of interest expense over weighted average borrowings.7 Moody’s Investors Service (Moody’s) has assigned an ‘A2’ issuer rating to CMT in March 2013. Prior to this, Moody’s had assigned an ‘A2’ corporate family
rating to CMT.
Unencumbered Assets as% of Total Assets 1 83.7% 77.5%Gearing 2, 3
35.3% 36.7%NetDebt/EBITDA 4
(times) 6.5 6.9Interest Coverage 5 (times) 4.2 3.2Average Term to Maturity (years) 3.6 3.9Average Cost of Debt 6
3.4% 3.3%CMT’s Rating 7
‘A2’ ‘A2’
As at 31 December 2013 As at 31 December 2012
81

caPital manaGementCMT fully redeemed the S$300.0 million two-year retail bonds under the S$2.5 billion retail bond programme (Retail Bond Programme) on 25 February 2013.
On 3 April 2013, CMT MTN Pte. Ltd. (CMT MTN) increased the limit of the unsecured Euro-Medium Term Note Programme (EMTN Programme) from US$2.0 billion to US$3.0 billion. During the year, CMT MTN issued two series of notes under the S$2.5 billion unsecured Multicurrency Medium Term Note Programme (MTN Programme) as follows:
1 ¥10.0 billion seven-year fixed rate notes on 13 November 2013 which was swapped into S$126.0 million; and
2 S$100.0 million seven-year fixed rate notes on 18 December 2013.
CapitalManagement
borroWinGs 1
1 Based on principal sums only.2 Includes ¥10.0 billion fixed rate notes (swapped into S$126.0 million) and S$100.0 million fixed rate
notes issued in 2013 under the MTN Programme. 3 CMT’s 40.00% interest in RCS Trust.4 Drawdown of S$650.0 million term loan and S$170.0 million RCF by Infinity Trusts (CMT’s 30.00% share
thereof is S$246.0 million) from the S$820.0 million secured banking facilities.
As at 31 December 2013S$ million
Loans from CMT MTN 2,568.4 2
Convertible Bonds 350.0 Total borrowings at CMT level 2,918.4 Loans at RCS Trust level from Silver Oak 402.8 3
Loans at Infinity Trusts level 246.0 4
Total borrowings at CMT and its subsidiaries (CMT Group)
3,567.2
On 2 July 2013, CMT fully redeemed and cancelled the remaining S$98.25 million in principal amount of the S$650.0 million 1.0% convertible bonds due 2013 (Convertible Bonds due 2013) at 109.31% of the principal amount upon maturity.
CMT has a 40.00% interest in RCS Trust. Under the loan agreements between Silver Oak Ltd (Silver Oak) and RCS Trust Trustee-Manager, Silver Oak has granted RCS Trust a term loan facility of S$1.0 billion and a revolving credit facility (RCF) of S$300.0 million. RCS Trust has drawn down the S$1.0 billion term loan in 2011 and S$7.0 million RCF in 2013. CMT’s 40.00% share thereof is S$402.8 million.
CMT has a 30.00% interest in Infinity Mall Trust and Infinity Office Trust (collectively, the Infinity Trusts). Out of the total facilities of S$820.0 million which comprise term loan of S$650.0 million and RCF of S$170.0 million, Infinity Trusts have drawn down the full S$650.0 million term loan and S$170.0 million RCF as at 31 December 2013. CMT’s 30.00% share of Infinity Trusts’ term loan and RCF is S$246.0 million.
CMT Group holds derivative financial instruments to hedge its currency and interest rate risk exposures. The fair value derivative for Financial Year (FY) 2013, which was included as financial derivatives was S$119.2 million, comprising financial derivatives liabilities of S$123.7 million and financial derivatives assets of S$4.5 million. This represented 2.0% of the net assets of CMT Group as at 31 December 2013.
%
Loans from CMT MTN 72.0
Convertible Bonds 9.8
Loans at RCS Trust level from Silver Oak (CMT’s 40.00% interest)
11.3
Loans at Infinity Trusts level (CMT’s 30.00% interest)
6.9
100.0
Debt mix by tyPe(%)
As at 31 December 2013
Unsecured 81.8%
Secured 18.2%
Clarity82 CapitaMall Trust Annual Report 2013

Business Review
1 CBs due 2014 at fixed rate of 2.125% p.a. with conversion price of S$2.2427 (which was adjusted to S$2.1955 on 3 February 2014).2 US$500.0 million 4.321% fixed rate notes were swapped to S$699.5 million at a fixed interest rate of 3.794% p.a. in April 2010.3 Drawdown of S$7.0 million under Silver Oak. CMT’s 40.00% share thereof is S$2.8 million, from the S$300.0 million RCF.4 S$200.0 million 5-year term loan under Silver Oak (CMT’s 40.00% share thereof is S$80.0 million).5 US$645.0 million in principal amount of Class A Secured Floating Rate Notes with expected maturity on 21 June 2016 issued pursuant to the S$10.0 billion
Multicurrency Secured Medium Term Note Programme established by Silver Oak and are secured by its rights to Raffles City Singapore. The proceeds have been swapped into S$800.0 million (CMT’s 40.00% share thereof is S$320.0 million).
6 S$820.0 million secured banking facilities by Infinity Trusts, CMT’s 30.00% share thereof is S$246.0 million.7 US$400.0 million 3.731% fixed rate notes were swapped to S$505.2 million at a fixed rate of 3.29% p.a. in March 2012.8 ¥10.0 billion 1.309% fixed rate notes were swapped to approximately S$157.6 million at a fixed rate of 2.79% p.a. in October 2012.9 ¥10.0 billion 1.039% fixed rate notes were swapped to S$126.0 million at a fixed rate of 3.119% p.a. in November 2013.10 HK$1.15 billion 3.76% fixed rate notes were swapped to S$190.1 million at a fixed rate of 3.45% p.a. in June 2012.11 HK$885.0 million 3.28% fixed rate notes were swapped to S$140.0 million at a fixed rate of 3.32% p.a. in November 2012.
Silver Oak: Silver Oak Ltd CMBS: Commercial mortgage backed securities CBs: Convertible bonds
Fixed rate notes issued under MTN Programme
CBs due 2014
Fixed rate notes issued under EMTN Programme
Secured RCF from Silver Oak – 40.00% interest in RCS Trust
Secured term loan from Silver Oak – 40.00% interest in RCS Trust
Secured CMBS from Silver Oak – 40.00% interest in RCS Trust
Secured banking facilities – 30.00% interest in Infinity Trusts
Debts with secured assets
100.0
226.0
648.8
500.0
799.5
126.0 9
157.6 8
505.2 7
250.0
320.0 5
699.5 2
100.0
246.0 6
350.0 1
150.0
80.0 4
2.8 3
2020201920182017201620152014
150.0140.0 11
190.1 10
202420232022
Debt maturity Profile(S$ million)
As at 31 December 2013
83
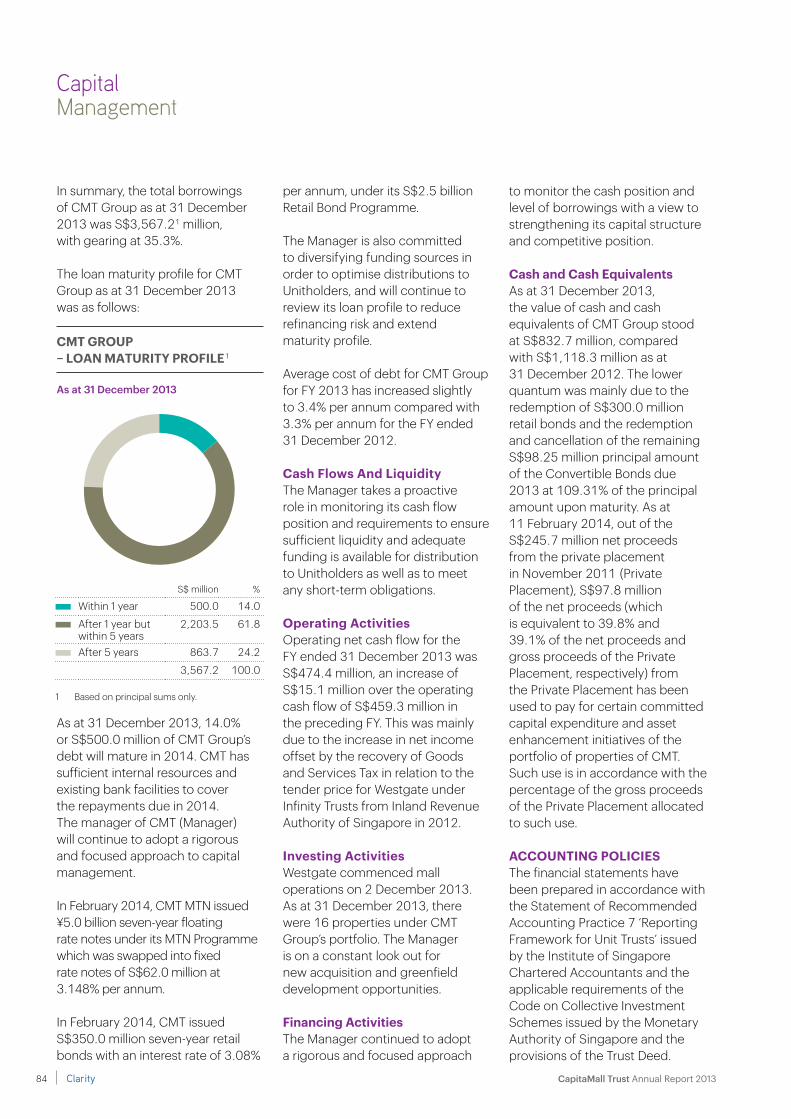
In summary, the total borrowings of CMT Group as at 31 December 2013 was S$3,567.21 million, with gearing at 35.3%.
The loan maturity profile for CMT Group as at 31 December 2013 was as follows:
As at 31 December 2013, 14.0% or S$500.0 million of CMT Group’s debt will mature in 2014. CMT has sufficient internal resources and existing bank facilities to cover the repayments due in 2014. The manager of CMT (Manager) will continue to adopt a rigorous and focused approach to capital management.
In February 2014, CMT MTN issued ¥5.0 billion seven-year floating rate notes under its MTN Programme which was swapped into fixed rate notes of S$62.0 million at 3.148% per annum.
In February 2014, CMT issued S$350.0 million seven-year retail bonds with an interest rate of 3.08%
per annum, under its S$2.5 billion Retail Bond Programme.
The Manager is also committed to diversifying funding sources in order to optimise distributions to Unitholders, and will continue to review its loan profile to reduce refinancing risk and extend maturity profile.
Average cost of debt for CMT Group for FY 2013 has increased slightly to 3.4% per annum compared with 3.3% per annum for the FY ended 31 December 2012.
cash flows and liquidityThe Manager takes a proactive role in monitoring its cash flow position and requirements to ensure sufficient liquidity and adequate funding is available for distribution to Unitholders as well as to meet any short-term obligations.
operating activitiesOperating net cash flow for the FY ended 31 December 2013 was S$474.4 million, an increase of S$15.1 million over the operating cash flow of S$459.3 million in the preceding FY. This was mainly due to the increase in net income offset by the recovery of Goods and Services Tax in relation to the tender price for Westgate under Infinity Trusts from Inland Revenue Authority of Singapore in 2012.
investing activitiesWestgate commenced mall operations on 2 December 2013. As at 31 December 2013, there were 16 properties under CMT Group’s portfolio. The Manager is on a constant look out for new acquisition and greenfield development opportunities.
financing activitiesThe Manager continued to adopt a rigorous and focused approach
to monitor the cash position and level of borrowings with a view to strengthening its capital structure and competitive position.
cash and cash equivalentsAs at 31 December 2013, the value of cash and cash equivalents of CMT Group stood at S$832.7 million, compared with S$1,118.3 million as at 31 December 2012. The lower quantum was mainly due to the redemption of S$300.0 million retail bonds and the redemption and cancellation of the remaining S$98.25 million principal amount of the Convertible Bonds due 2013 at 109.31% of the principal amount upon maturity. As at 11 February 2014, out of the S$245.7 million net proceeds from the private placement in November 2011 (Private Placement), S$97.8 million of the net proceeds (which is equivalent to 39.8% and 39.1% of the net proceeds and gross proceeds of the Private Placement, respectively) from the Private Placement has been used to pay for certain committed capital expenditure and asset enhancement initiatives of the portfolio of properties of CMT. Such use is in accordance with the percentage of the gross proceeds of the Private Placement allocated to such use.
accountinG PoliciesThe financial statements have been prepared in accordance with the Statement of Recommended Accounting Practice 7 ‘Reporting Framework for Unit Trusts’ issued by the Institute of Singapore Chartered Accountants and the applicable requirements of the Code on Collective Investment Schemes issued by the Monetary Authority of Singapore and the provisions of the Trust Deed.
CapitalManagement
S$ million %
Within 1 year 500.0 14.0
After 1 year butwithin 5 years
2,203.5 61.8
After 5 years 863.7 24.2
3,567.2 100.0
1 Based on principal sums only.
cmt GrouP – loan maturity Profile 1
As at 31 December 2013
Clarity84 CapitaMall Trust Annual Report 2013

Business Review
Independent Retail Market Overview
the Economist Intelligence Unit (EIU) expects growth to average 4.7% per annum. This is lower than the long-term trend, but a healthy rate of growth nonetheless. It reflects lower growth in the global economy, much of the growth over the past decade was fuelled by debt, a situation that is unlikely to return over the short to medium-term.
Obviously, these growth forecasts are dependent on a continued global economic recovery, with any stagnation or negative shocks to the global economy likely to be reflected in Singapore’s future real GDP growth. Conversely, better than expected global economic performance will positively impact Singapore’s real GDP growth.
inflationFrom 2001 to 2013, consumer price inflation averaged 2.3% per annum. Years in which prices recorded significantly higher growth include 2008, 2011 and 2012, with price increases mainly driven by rising housing, food and transport costs.
Consumer price inflation moderated to 2.4% in 2013 partly due to a moderation in the increase of transport cost. Despite the recent easing in transport cost, together with housing and food costs, they continue to be the main drivers of inflation. EIU expects consumer price inflation to rise marginally to 2.7% in 2014, recording an average of 2.3% per annum over the 2013-2018 forecast period.
Retail price inflation measures the price variance of retail goods and services. Retail price inflation
in Singapore typically trends slightly below CPI, averaging approximately 1.3% per annum over 2003-2013. Our initial estimate of retail price inflation for 2013 is -0.3%, reflective of the easing of prices in watches and jewellery as well as furniture and household goods. We expect retail price inflation to average approximately 1.0% per annum during 2013-2018.
PoPulationIn June 2013, Singapore Department of Statistics estimated the total population of Singapore to be approximately 5.39 million. The total population figure for 2013 consists of 3.84 million Singapore ‘residents’ (either citizens or permanent residents) and 1.55 million ‘non-residents’. ‘Non-residents’ primarily consist of expatriate workers on long-term working visas.
Singapore’s population growth is largely driven by growth in non-residents. Growth, therefore, is largely contingent on Government policy which controls the level of migration. We expect that with a slightly below trend economic growth outlook, the level of immigration will be kept in check, and non-resident population growth might be lower than in recent years. This segment is likely to grow at around 4.3% per annum over the next five years. Due to an aging population and low fertility rates, the resident population should exhibit lower and more stable growth over time. We expect it to grow at 0.6% per annum over the next five years in line with recent trends.
As a result, total population growth is forecast at 1.7% per annum, reaching 5.89 million by 2018.
economic GroWthSingapore’s economic growth has remained healthy in recent years, with gross domestic product (GDP) growing by 5.6% per annum over 2001-2013. Despite weaker economic performance due to the global financial crisis (GFC) in 2008 and 2009, the economy has managed to rebound from the downturn and maintain a solid level of growth. As a major trading nation and financial hub, Singapore’s economic performance is highly correlated to the state of the global economy. During the last global economic boom which ended in 2007, Singapore benefited greatly with its economic growth significantly above trend levels. In more recent times, the major issues confronting the global economy, including the Euro crisis, the slow rebound of the United States (US) economy and the slowing of the major emerging economies, have all acted as a drag on the Singapore economy.
However, the global economy has stabilised over the past 12 months. The rebound in theUS finally appears to be takinga firm hold, in contrast to thestuttering of the past few years.Japan, which has been a long-term underperformer, has started to see signs of improvement. Europe appears to have muddled its way through the Euro crisis, and markets are now less nervous about China than they have been.
All these developments point to an improving outlook for Singapore. After relatively weak growth of 1.3% in 2012, the Singapore economy continued its gradual improvement, growing by 4.1% in 2013. Between 2013 and 2018,
85
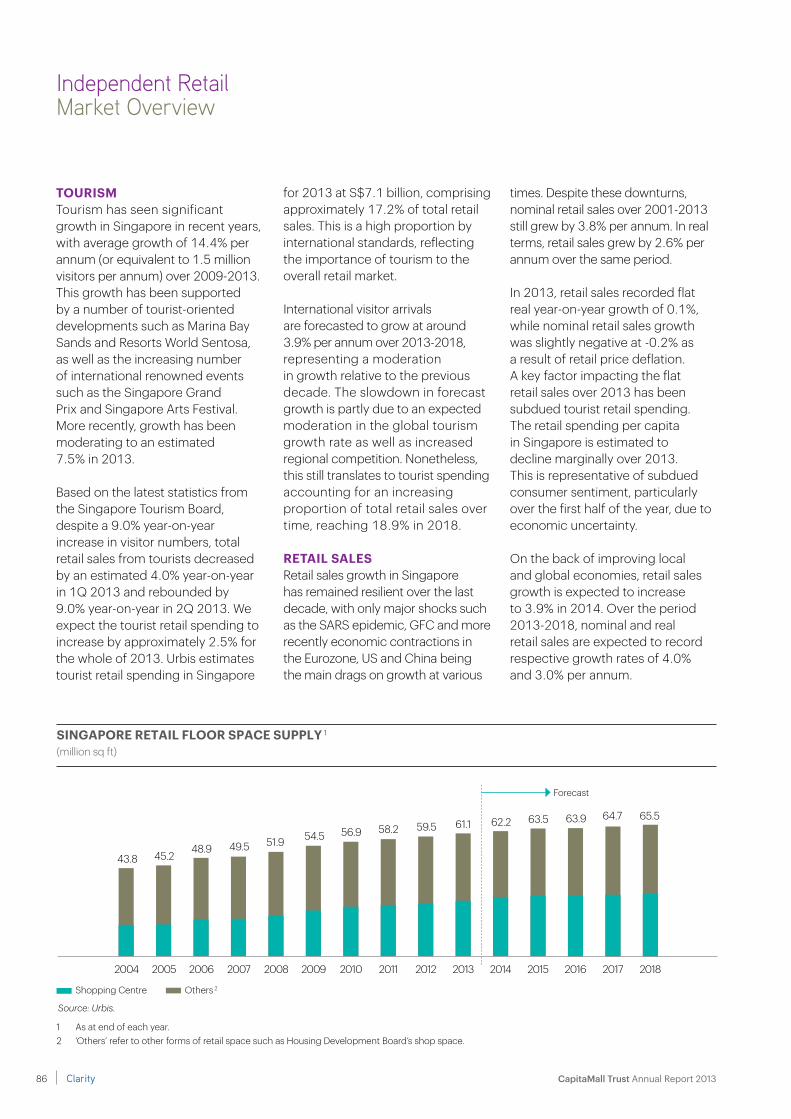
for 2013 at S$7.1 billion, comprising approximately 17.2% of total retail sales. This is a high proportion by international standards, reflecting the importance of tourism to the overall retail market.
International visitor arrivals are forecasted to grow at around 3.9% per annum over 2013-2018, representing a moderation in growth relative to the previous decade. The slowdown in forecast growth is partly due to an expected moderation in the global tourism growth rate as well as increased regional competition. Nonetheless, this still translates to tourist spending accounting for an increasing proportion of total retail sales over time, reaching 18.9% in 2018.
retail salesRetail sales growth in Singapore has remained resilient over the last decade, with only major shocks such as the SARS epidemic, GFC and more recently economic contractions in the Eurozone, US and China being the main drags on growth at various
times. Despite these downturns, nominal retail sales over 2001-2013 still grew by 3.8% per annum. In real terms, retail sales grew by 2.6% per annum over the same period.
In 2013, retail sales recorded flat real year-on-year growth of 0.1%, while nominal retail sales growth was slightly negative at -0.2% as a result of retail price deflation. A key factor impacting the flat retail sales over 2013 has been subdued tourist retail spending. The retail spending per capita in Singapore is estimated to decline marginally over 2013. This is representative of subdued consumer sentiment, particularly over the first half of the year, due to economic uncertainty.
On the back of improving local and global economies, retail sales growth is expected to increase to 3.9% in 2014. Over the period 2013-2018, nominal and real retail sales are expected to record respective growth rates of 4.0% and 3.0% per annum.
tourismTourism has seen significant growth in Singapore in recent years, with average growth of 14.4% per annum (or equivalent to 1.5 million visitors per annum) over 2009-2013. This growth has been supported by a number of tourist-oriented developments such as Marina Bay Sands and Resorts World Sentosa, as well as the increasing number of international renowned events such as the Singapore Grand Prix and Singapore Arts Festival. More recently, growth has been moderating to an estimated 7.5% in 2013.
Based on the latest statistics from the Singapore Tourism Board, despite a 9.0% year-on-year increase in visitor numbers, total retail sales from tourists decreased by an estimated 4.0% year-on-year in 1Q 2013 and rebounded by 9.0% year-on-year in 2Q 2013. We expect the tourist retail spending to increase by approximately 2.5% for the whole of 2013. Urbis estimates tourist retail spending in Singapore
Independent Retail Market Overview
sinGaPore retail floor sPace suPPly 1
(million sq ft)
Source: Urbis.
2004 2005 2006 2007 2008 2009 2010 2011 2012 2013 2014 2015 2016 2017 2018
63.9 64.7 65.559.5
49.5 51.9
63.558.2
62.256.9
48.9
61.154.5
45.243.8
Forecast
1 As at end of each year.2 ‘Others’ refer to other forms of retail space such as Housing Development Board’s shop space.
Shopping Centre Others 2
Clarity86 CapitaMall Trust Annual Report 2013

Business Review
retail suPPlyWe estimate the total retail net lettable area (NLA) in Singapore was 61.1 million sq ft as at 31 December 2013. Approximately 27.3 million sq ft (equivalent to 44.7%) is estimated to be shopping centre floor space.
Over the course of 2013, approximately 1.7 million sq ft of shopping centre floor space was added to the Singapore market with the most significant projects being JEM, Westgate and Bedok Mall. In 2014, the most significant supply coming onstream will be Singapore Sports Hub.
Over the period 2013-2018, we expect shopping centre floor space to increase by an average of 690,000 sq ft per annum, reaching a total of 30.8 million sq ft in 2018 or equivalent to 47.0% of total retail floor space. Significant retail developments coming onstream over the period 2015-2018 include Jurong Big Box
and Waterway Point in 2015 and CapitaMalls Asia Limited’s (CMA) Project Jewel in 2018.
retail floor sPace Per caPitaRetail floor space per capita in Singapore is estimated to be approximately 11.3 sq ft in 2013. On the basis of known retail developments, this figure is expected to remain relatively stable to 2016.
The provision of total retail floor space per capita in Singapore remains relatively low compared with other developed Asian economies such as China (12.9 sq ft) South Korea (14.4 sq ft) and Japan (16.6 sq ft). However, the proportion of shopping centre floor space (44.7%) in Singapore is relatively high compared to Asian economies such as China (approximately 21%) and Japan (approximately 22%).
share of major shoPPinG centre floor sPace by oWner 1, 2013(%)
Others 38.9Allgreen 2.0City Developments Ltd 2.3Singapore Press Holdings 2.3Las Vegas Sands 2.4Marina Centre Holdings 2.7CapitaMalls Asia 2 2.8Far East Organisation 3.2Suntec REIT 4.5Mapletree 4.8Frasers Centrepoint 5.7Lend Lease 5.7Pramerica 5.9CapitaMall Trust 16.6
total retail floor sPace Per caPita(sq ft)
Source: Urbis.
Conversely, the proportion of shopping centre floor space in Singapore is marginally lower than in Australia (approximately 45%) and the United States (approximately 47%).
mall oWnershiPCMT remains the largest shopping centre owner in Singapore, constituting a 16.6% share of floor space in shopping centres over 100,000 sq ft NLA. A significant gap exists between CMT and its nearest competitors in terms of market share, Pramerica (5.9%),
Source: Urbis.
1 Malls greater than 100,000 sq ft NLA as at end-2013. Share of floor space takes into account ownership stake.
2 CMA’s share only accounts for malls directly owned by CMA and does not include those owned through CMT.
11.3
11.3
11.3
12.9
14.4
16.6
23.7
50.5
Singapore (2016)
Singapore (2013)
Hong Kong (2012)
China (2012)
South Korea (2010)
Japan (2009)
Australia (2012)
USA (2010)
87

38 3632302826242220
Independent Retail Market Overview
Sources: CBRE, Urbis.
1Q 2005 1Q 2006 1Q 2007 1Q 2008 1Q 2009 1Q 2010 1Q 2011 1Q 2012 1Q 20131Q 2004
Orchard Road Suburban
sinGaPore Prime retail rents by sub-market(S$ per sq ft per month)
rental GroWth outlook(%)
Source: Urbis.
2014 2015 2016
1.8
3.03.0
Suburban
2014 2015 2016
3.0 3.03.0
Orchard Road
occuPancy rate outlook(%)
Source: Urbis.
2014 2015 2016
95.5 96.096.0
Suburban
2014 2015 2016
Orchard Road
95.5 96.596.5
Clarity88 CapitaMall Trust Annual Report 2013

Business Review
are estimated to have increased in 2013, reaching 95.5% and 95.7% respectively. The most significant increase in average occupancy rate was seen in the Orchard Road sub-market, with the average occupancy rate rising by 3.7 percentage points. The strength of interest from retailers in the Suburban sub-market is highlighted by the fact that JEM and Bedok Mall opened effectively fully leased, while Westgate opened at close to 90.0% committed occupancy.
retail rental & occuPancy outlookBroadly speaking, the economic environment looks supportive for ongoing rental growth in Singapore. We expect retail sales to continue growing at a healthy average rate of 4.0% per annum through to 2018. After a number of volatile years, the outlook for the Singapore economy appears to have improved and we expect to see this flow through to retail sales data.
New retailers continue to enter the market, with Singapore being seen as a relatively easy entry point for the Asian market. Retailer demand appears healthy, evidenced by the successful absorption of the new retail floor space of JEM, Westgate and Bedok Mall. However, retailers’ expansion plans will to some degree be constrained by the rising employment cost in view of the implementation of new foreign labour restrictions in 2013.
Healthy demand, combined with a gradual moderation in the amount of new floor space, is likely to continue to push up
occupancy rates. As noted above, the occupancy rate reached well above 95.0% in 2013, at which point the pressure on rents is likely to start increasing, particularly in strong centres in good quality locations. Over the next year, we expect to see occupancy rates remain flat on Orchard Road while in suburban areas we expect a marginal decrease in occupancy rates as a result of the lagged effect of the significant amount of retail stock delivered in 2013. In 2015 and 2016, it is expected that occupancy rates will firm in both sub-markets.
With high levels of occupancy and strong market fundamentals, rents are expected to continue to increase. Rents on Orchard Road are expected to continue to grow at around 3.0% per annum over the next few years, thanks in part to continued strong growth in tourist numbers.
The Suburban sub-market had a weaker than expected year in 2013; we expect now that the new retail floor space of JEM, Westgate and Bedok Mall have been successfully absorbed, stronger rental growth is likely to return to the market. The majority of new floor space in the near future, however, will be in the Suburban sub-market which is likely to keep rental growth slightly below that achieved in the Orchard Road sub-market.
conclusionsDespite a small downturn in the Singapore retail market in 2013, the medium-term outlook remains positive, with the market expected to rebound in 2014 on the back of resilient domestic growth and the forecast continued in global economy recovery.
Lend Lease (5.7%) and Frasers Centrepoint (5.7%) being the closest competitors. The scale at which CMT operates gives it the opportunity to achieve economies of scale in centre management and leasing, and also allows it to distribute its risk profile across different types of centres, and different sub-markets.
retail ProPerty PerformanceAccording to CBRE, prime retail rents in the Orchard Road sub-market grew by 2.8%, averaging S$32.50 per sq ft per month over 2013, while prime retail rents in the Suburban sub-market rose more modestly by 0.5% to an average of S$29.90 per sq ft per month over the year.
Rental growth over the first three quarters of 2013 was relatively flat in both the Orchard Road and Suburban sub-markets. However, in the last quarter of 2013, stronger macroeconomic performance and significant interest from a number of new-to-market international retailers in prime retail locations drove an increase in rents in both sub-markets, with quarter-on-quarter growth recorded at 3.4% and 1.7% in the Orchard Road and Suburban sub-markets respectively. Retailers continue to show great interest in Singapore with 27 new-to-market international retailers entering the market in 2013, second in Asia after Hong Kong (according to CBRE).
Based on the Urban Redevelopment Authority’s first three quarters data, average occupancy rates in both the Orchard Road and Suburban sub-markets
89
DisclaimerThis report is dated 28 February 2014 and incorporates information and events up to that date only and excludes any information arising, or event occurring, after that date which may affect the validity of Urbis Pty Ltd’s (Urbis) opinion in this report. Urbis prepared this report on the instructions, and for the benefit only, of CMT (Instructing Party) for the purpose of providing an independent overview of the Singapore retail market (Purpose) and not for any other purpose or use. Urbis expressly disclaims any liability to the Instructing Party who relies or purports to rely on this report for any purpose other than the Purpose and to any party other than the Instructing Party who relies or purports to rely on this report for any purpose whatsoever (including the Purpose).
In preparing this report, Urbis was required to make judgements which may be affected by unforeseen future events, the likelihood and effects of which are not capable of precise assessment.
All surveys, forecasts, projections and recommendations contained in or associated with this report are made in good faith and on the basis of information supplied to Urbis at the date of this report, and upon which Urbis relied. Achievement of the projections and budgets set out in this report will depend, among other things, on the actions of others over which Urbis has no control.
In preparing this report, Urbis may rely on or refer to documents in a language other than English, which Urbis may arrange to be translated. Urbis is not responsible for the accuracy or completeness of such translations and disclaims any liability for any statement or opinion made in this report being inaccurate or incomplete arising from such translations.
Whilst Urbis has made all reasonable inquiries it believes necessary in preparing this report, it is not responsible for determining the completeness or accuracy of information provided to it. Urbis (including its officers and personnel) is not liable for any errors or omissions, including in information provided by the Instructing Party or another person or upon which Urbis relies, provided that such errors or omissions are not made by Urbis recklessly or in bad faith.
This report has been prepared with due care and diligence by Urbis and the statements and opinions given by Urbis in this report are given in good faith and in the reasonable belief that they are correct and not misleading, subject to the limitations above.
average occupancy rates of between 96.0% and 96.5% are forecast through to 2016. These high occupancy rates reflect the controlled nature by which new stock is delivered to the market that ensures that supply does not get too far ahead of demand. Consequently, rental growth of around 3.0% per annum should be achievable in both the Orchard Road and Suburban sub-markets.
Singapore remains sensitive to the wider global economy, and as such fluctuations in global economic growth will be tangibly felt in the market.
However, with global economic conditions improving and domestic growth forecast to steadily increase, retail assets that are well managed, marketed and leased can be expected to perform well over the medium-term.
jack backenDirector
Urbiswww.urbis.com.au
28 February 2014
Over the course of 2013, retail development in Singapore was particularly active. A significant proportion of shopping centre additions were in the Suburban sub-market, and these centres experienced strong take-up from retailers reflecting retailer interest in being located in Singapore’s suburban growth areas.
Occupancy rates remained healthy across Singapore, with Orchard Road seeing a rise in occupancy rate in 2013 largely due to demand from new-to-market retailers. High
Independent Retail Market Overview
Clarity90 CapitaMall Trust Annual Report 2013
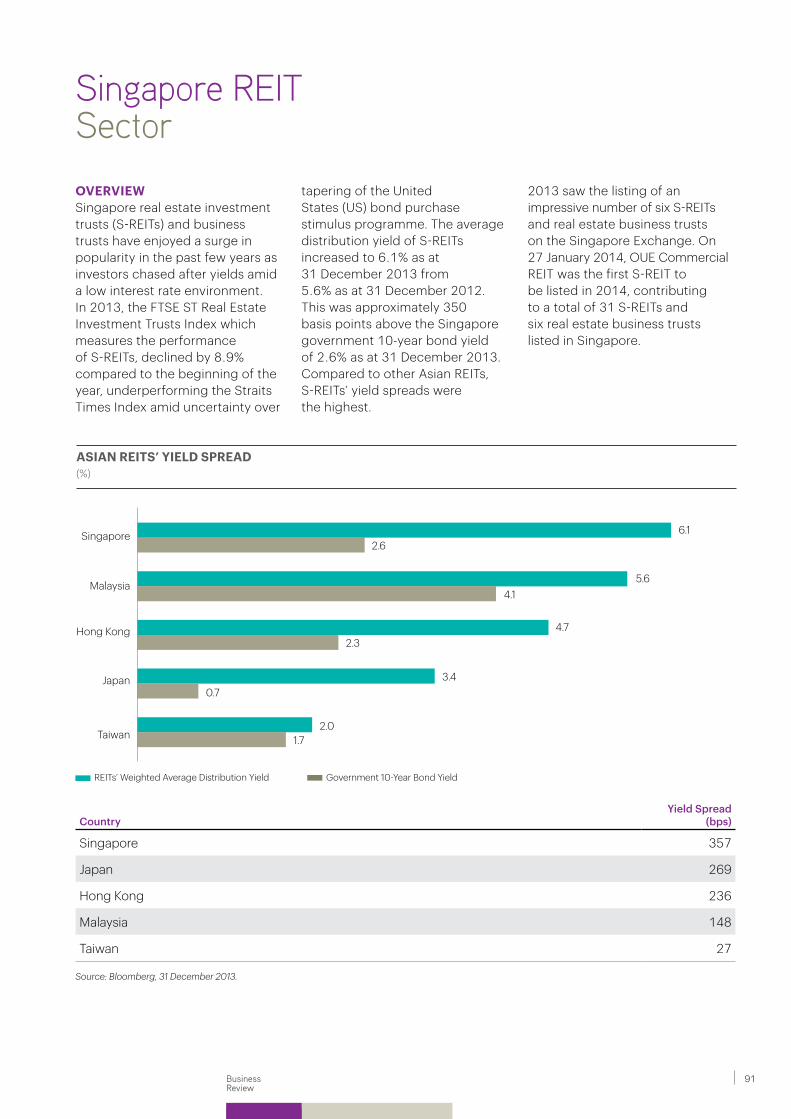
Business Review
Singapore REIT Sector
tapering of the United States (US) bond purchase stimulus programme. The average distribution yield of S-REITs increased to 6.1% as at 31 December 2013 from 5.6% as at 31 December 2012. This was approximately 350 basis points above the Singapore government 10-year bond yield of 2.6% as at 31 December 2013. Compared to other Asian REITs, S-REITs’ yield spreads were the highest.
overvieW Singapore real estate investment trusts (S-REITs) and business trusts have enjoyed a surge in popularity in the past few years as investors chased after yields amid a low interest rate environment. In 2013, the FTSE ST Real Estate Investment Trusts Index which measures the performance of S-REITs, declined by 8.9% compared to the beginning of the year, underperforming the Straits Times Index amid uncertainty over
CountryYield Spread
(bps)
Singapore 357
Japan 269
Hong Kong 236
Malaysia 148
Taiwan 27
Source: Bloomberg, 31 December 2013.
asian reits’ yielD sPreaD(%)
2.01.7Taiwan
5.64.1
Malaysia
4.72.3
Hong Kong
3.40.7
Japan
6.12.6
Singapore
REITs’ Weighted Average Distribution Yield Government 10-Year Bond Yield
2013 saw the listing of an impressive number of six S-REITs and real estate business trusts on the Singapore Exchange. On 27 January 2014, OUE Commercial REIT was the first S-REIT to be listed in 2014, contributing to a total of 31 S-REITs and six real estate business trusts listed in Singapore.
91

Singapore has established itself as a major Asian hub for real estate investment. However, it faces competition from other regional markets, as they are establishing their own real estate investment trust and business trust frameworks and will compete increasingly for listings.
The current concern for S-REITs is the sunset clause attached to the tax incentives. A number of tax incentives which were critical to encouraging the propagation of S-REITs, including the stamp duty remission in respect of the transfer of local properties and a lower withholding tax of 10.0% on qualifying S-REITs distributions, are due to expire in March 2015.
On 30 January 2014, the US Federal Reserve decided that it will continue to reduce the scale of its bond purchase stimulus programme, with the programme expected to be tapered steadily through 2014. The S-REITs may face the challenges of rising interest rates and correspondingly higher borrowing costs when financing new acquisitions and refinancing existing debts. To compensate for the higher borrowing costs and achieve better yields, S-REITs will now have to look at how best to achieve organic growth, for example, by undertaking asset enhancements, active lease management and proactive asset management to achieve positive rental reversions. In addition, S-REITs need to re-examine and be more proactive in their capital management. This would include scrutinising the hedging policies and debt strategies. According to a media report in 2013, S-REITs have become less reliant on traditional senior loans secured against specific assets, and are
taking to using medium-term note (MTN) issuances as an alternative source for the financing of their real estate portfolios. The higher portions of unsecured MTN of total debts, coupled with a prudent leverage ratio have helped to support a higher unencumbered asset ratio for their portfolios, which enhanced the financial flexibility of S-REITs.
lookinG forWarDThe framework for S-REITs has been continually refined since CMT’s listing as the first S-REIT in 2002. We believe that we will continue to see efforts in enhancing and refining the existing S-REITs regime as Singapore seeks to stay abreast of the competition.
We continue to see interest in the listing activity in the S-REITs and business trusts in 2014. The success of these new listings will depend on, among others, the performance of comparables in the market and the extent of yield compression flowing from the tapering of the US stimulus programme.
Singapore REIT Sector
Clarity92 CapitaMall Trust Annual Report 2013

Business Review
Marketing &Promotions
wider awareness and more shoppers are signing up to enjoy its rewards and benefits. CAPITASTAR’s mobile application has also been enhanced to house mobile games and participating merchants’ offers to bring more joy and benefits to its fast-growing membership base.
CapitaVoucher had a great year in 2013 that saw sales grow by approximately 52.5% year-on-year to S$51.1 million of committed spending at CMT’s malls with over 2,000 participating outlets where CapitaVoucher is widely accepted. In addition to existing key partnerships, CapitaVoucher also collaborated with the Ministry of Defence and the Ministry of Home Affairs to commemorate the 45th Anniversary celebrations of National Service in which National Servicemen could exchange their HomeTeamNS or SAFRA vouchers for CapitaVouchers. In addition to the array of loyalty programmes, relevant
and interesting portfolio-wide activities were also implemented during major festivities, which we collaborated with strategic partners to bring more exciting promotions and giveaways for our shoppers during these campaigns. At the same time, the e-Queue Management System and free WiFi were new shopper-centric initiatives rolled out as a first step to further enhance the shopping experience and provide greater convenience.
mall-centreD activities
buGis junction
spring/summer fashion showcaseBugis Junction featured fashion tenants’ wardrobes on a four-day fashion rampage with themes such as ‘I Love My Job’, ‘On The Fast Track’ and ’The Edge of Glory’. Shoppers were able to gain ideas on revamping their wardrobes as models showcased tenants’ latest collections of
Portfolio-WiDe activitiesIn 2013, our strategic group-level marketing activities were focused on improving shoppers’ satisfaction through constant innovation of shopper-centric initiatives to build the loyalty of shoppers and bring greater delight to their shopping experiences at CMT’s malls.
Our three loyalty initiatives, CapitaCard, CapitaVoucher and CAPITASTAR, present today’s savvy shoppers with a multi-store, multi-mall integrated rewards platform to meet their fast-changing needs. CapitaCard’s membership base saw a significant growth to over 267,000 card members as at 31 December 2013. Card spending for the programme achieved 20.0% year-on-year growth to approximately S$294.0 million in 2013. This co-brand card programme continues to delight shopper and attract repeat shopper spending at CMT’s malls. It does not only provide card members with Capita$ instant cash rebates, but also offers a host of exclusive treats, privileges and benefits in our malls such as complimentary parking and privileged parking.
CAPITASTAR’s membership base grew significantly to over 476,000 as at 31 December 2013, up 160.1% from 2012. The card-less rewards programme enables shoppers to enjoy benefits on top of their existing rebates from CapitaCard, whereby they can earn STAR$ from their purchases across CMT’s malls, which can be accumulated and redeemed for CapitaVoucher. Since its inception in December 2011, the programme has gained e-Queue Management System at Westgate
93

young talents showcased their performing arts, from singing to jamming at the mall’s outdoor civic plaza at Level 1.
cosfest x’masIn partnership with Cosfest Asia, Bugis+ held the first ever Cosfest X’mas in Singapore and shoppers were wowed by the colourful cosplayers appearing in the mall. One of the highlights was the appearance of Yuegene Fay, a famous cosplayer from Thailand, who mingled with the crowd.
bukit PanjanG Plaza
halloween madnessBukit Panjang Plaza hosted its annual iconic Halloween Madness event in October 2013. In the mall’s Instant Win Lucky Dip redemption programme, shoppers won attractive gifts and dining vouchers. They were also challenged to a Psychic Guessing Game by guessing the number of props - pumpkins, spiders and eyeballs – in the display cubes. Three lucky winners with the closest guesses
were entered into a lucky draw to win iPad minis.
In the name of good fun, brave souls flocked to the mall for a hair-raising time. They came face to face with ‘eerie’ characters and the little ones were ‘spooked’ in the Haunted House Hunt.
christmasThe mall ushered in the festive season with an exclusive ‘Mr Men & Little Miss Dillydale Christmas Rock Concert’ cum meet-and-greet session. A special one-hour Royal Tea Party was also arranged for 50 junior fans of Little Miss Princess where they were treated like royalty. Each guest was given an individual photo-taking opportunity with Little Miss Princess and a goodie bag. In conjunction with the show, limited edition Mr Men & Little Miss umbrellas were given away as part of the mall’s redemption programme.
clarke Quay
music matters live at clarke QuayThe annual Music Matters Live was back for the third year at Clarke Quay. The three jam-packed nights featured Australia’s Cub Scouts, French award-winning power pop outfit Pony Pony Run Run and Singapore’s rock trio Electrico. The main stage at the Central Fountain Square hosted the main acts, with ‘live’ broadcast on YouTube. Other musical gigs also took place at various outlets such as China One, Crazy Elephant, Fern & Kiwi, The Forbidden City by Indochine and Paulaner Wirtshaus.
fashion forward trends available in Bugis Junction.
star struckBugis Junction continued to host meet-and-greet sessions with celebrities such as Karen Mok, Aska Yang, Wei Li An, Zhang Zhengyue and numerous Korean boy bands.
x’mas GaloreDuring the festive season, Bugis Junction offered a variety of gifts for sale at its atrium for three weeks. Shoppers were pampered with offerings from Action City, SK Jewellery, Gift a Name and many others. Individual booths were dressed up to complement the mall’s Christmas decorations to bring greater Christmas cheer to shoppers.
buGis+
singapore street festivalFor the second consecutive year, Bugis+ worked with Singapore Street Festival to host the grand finals of belly dancing and yo-yo competitions. In addition, local
Marketing &Promotions
Music Matters Live at Clarke Quay
Clarity94 CapitaMall Trust Annual Report 2013

Business Review
clarke Quay radio city new year’s eve countdownHosted by local TV personality Chua En Lai and MediaCorp Class 95FM DJ Jean Danker, Clarke Quay celebrated the New Year with a spectacular countdown along with stellar performances. Highlights included band performances by Goodfellas, colourful street decor, street parade and roving music icons. Visitors played trivia games with MediaCorp radio DJs as they broadcasted ‘live’ from Clarke Quay.
funan DiGitalife mall
funan anime matsuri 2013Funan Anime Matsuri was the inaugural cosplay event in Funan DigitaLife Mall where shoppers experienced Japanese pop culture. During the one-week event, cosplay fans met their favourite cosplayers such as Kaname (Japan), Natumi (Taiwan), Ying Tze (Malaysia) and Angie (Malaysia). There were also fun-filled activities
such as Japanese anime screenings, Maid & Butler Café, Illustrator Workshop, Vanguard Card Tournament and Turntable showcase by DJ Tomu.
clubsnap crossing bridges 2013ClubSnap Singapore, being the largest dedicated photography discussion and community website in Singapore with more than 188,000 members, hosted the 10th Annual Crossing Bridges Photography Gathering in Singapore and Funan DigitaLife Mall was the venue partner. During the event, photography enthusiasts and Crossing Bridges participants attended photography and imaging related workshops by the professionals such as Mark Thompson (Formula One Chief Photographer from Getty Images) and Tim Chong (Senior Sub-editor/Photographer from Global Pictures Desk Reuters). ClubSnap collaborated with Canon and ran exclusive promotions with photography shops in Funan DigitaLife Mall.
imm builDinG
singapore best Dance crew competition IMM Building played host to the Singapore’s Best Dance Crew Competition 2013 where the grand champion was crowned. The competition was spread over three weekends with teams of dancers competing for the chance to represent Singapore at the eighth UDO Street Dance Championship in August 2013 held at Scotland. Other award categories included ‘Best Solo Dance (Popping)’ and ‘7 to Smoke’.
clarke Quay oktoberfest 2013Due to popular demand, Clarke Quay hosted its fourth annual Oktoberfest celebration. Patrons enjoyed authentic German culinary delights at the various German-themed food and Erdinger beer kiosks, along with a rip-roaring array of activities and performances by Raw Energy, Summer Oompah! and Swiss Alpine Lions.
clarke Quay Presents twilight zoneVisitors wore their best costumes and came down to Clarke Quay for a smashing Halloween celebration. A variety of exhilarating games hosted by 98.7FM DJs Rosalyn Lee and Vernon A was lined up for patrons to win attractive prizes. Visitors also enjoyed band performances, face painting, scary roving characters and much more. In addition, lucky radio listeners had a chance to pub crawl with some of Singapore’s hottest DJs.
Funan Anime Matsuri 2013 at Funan DigitaLife Mall
95

Greater savings at singapore’s largest outlet mallIMM Building launched a campaign in July to brand IMM Building as Singapore’s largest outlet mall. Among the exciting activities was ’Be Our Guest’, where five lucky winners who took part in the Class 95FM radio contest experienced VIP treatments with chauffeured trips to and fro IMM Building, and received S$200 worth of shopping and dining vouchers each.
celebrity appearancesKorean artiste Kim Jong Kook, known as ‘Sparta’ by his ‘Running Man’ fan base, held his first appearance in Singapore at IMM Building. The mall also hosted fan meet event by Taiwanese veteran artiste, Yang Fan, where he conducted an autograph session for his loyal fans.
jcube
j.addict redemptionDuring the course of three months, JCube rewarded shoppers with SHAW JCube IMAX vouchers, CapitaVoucher, STAR$ and shopping vouchers. In addition to the attractive rewards offered, shoppers could also purchase S$10 tenants’ vouchers from more than 30 selected shops at a special price of S$1.
events @ jstageA series of K-POP fan meets was held in JCube. K-POP fans got a chance to be up close and personal with their favourite Korean stars. In addition, there were fan meets with international artistes such as Screw (Japan), AOA (Korea), Bosco Wong (Hong Kong) and
and S$150 respectively at any participating outlets. The Fashion Week ended with the Fashion Runway Show that was held on Saturday and Sunday featuring ready-to-buy outfits from Junction 8’s tenants.
sale-abrate @ j8 – Where you shop till you Drop!To celebrate the Great Singapore Sale in 2013, Junction 8 chose eight lucky winners to go on a shopping spree with S$1,800 worth of vouchers each. With a minimum spending of S$50, shoppers stood a chance to be chosen as one of the lucky ones.
Junction 8 also hosted its first Kids Hip Hop Dance Competition and seven groups were selected to participate in the finals. The top three winners walked away with S$1,000, S$800 and S$500 worth of vouchers respectively. satiate your inner Gourmet Junction 8 hosted a one-week culinary adventure in July 2013 to excite shoppers’ taste buds with tantalising feasts
Korean boy bands including LC09, A-Prince and Lunafly. Teenage Magazine also held their annual dance battle for the third consecutive year.
christmas & new year countdown on ice – with snow @ the rinkFor the first time in Singapore, skaters experienced snowfall while ice-skating at JCube during the Christmas and New Year parties. Skaters were treated to an exhilarating skate party, on-ice games, snowfall, free party kits, delicious tapas and mocktails. Skaters received a complimentary skating session for their next return and stood a chance to win air tickets.
junction 8
makeover magic 2013 Junction 8 held its Fashion Week in April 2013, offering shoppers irresistible deals up to 50% discount and 1-for-1 buys. Shoppers were rewarded with STAR$ and free makeover sessions when they spent S$60
Marketing &Promotions
Christmas & new Year Countdown on Ice at JCube
Clarity96 CapitaMall Trust Annual Report 2013

Business Review
Plaza sinGaPura
celebrity appearancesPlaza Singapura hosted autograph sessions for popular Mandopop singers such as Aaron Yan, Liang Wen Yin and Anthony Neely. International superstars Andy Lau and Sammi Cheng from the movie ‘Blind Detective’ also made special appearances at Plaza Singapura in June 2013 which created much excitement among shoppers and movie fans. Calvin Chen from the Taiwanese boyband, Fahrenheit joined his co-stars, K-Pop artistes Alexander Lee Eusebio and Jae Liew to promote their movie ’3 Peas in a Pod‘ at Plaza Singapura in November 2013.
cbeebies live! you’re a star this christmas Plaza Singapura, in partnership with BBC Worldwide brought CBeebies Live! to the mall, which marked its first appearance in Asia with a three-week long music-themed extravaganza during the December school holidays. This was specially created for the pre-schoolers. The eight CBeebies characters, Zingzillas and Teletubbies inhabited a colourful and fun environment which got the young and young at heart dancing and singing. Kids also participated in hands-on workshops to decorate their favourite stars.
raffles city sinGaPore
thru the city in styleRaffles City Singapore’s Spring/Summer 2013 campaign kick-started with its first ever fashion bus, with models and talents
Celebrity appearances at Plaza Singapura
CBeebies Live! You’re A Star This Christmas at Plaza Singapura
ranging from local flavours to international delights. Shoppers were also rewarded with STAR$ with a minimum spend of S$30 at any of the food and beverage outlets.
lot one shoPPers’ mall
mother’s DayLot One Shoppers’ Mall gave away 50 complimentary makeover sessions worth S$50
with minimum S$120 spent. The mall also partnered with anchor tenant, BHG to host the ‘Most Beautiful Mum’ contest. 12 contestants were shortlisted for the grand finals from the makeover event. The winner was crowned based on public votes. The event was also complemented by BHG promotions that offered a wide range of gift ideas for mothers as well as MediaCorp celebrities and DJs appearances.
97

March Sizzles! at Sembawang Shopping Centre
showcasing the hottest trends from our fashion tenants, touring Orchard Road, Marina Bay area and Raffles City vicinity. Media and fashion bloggers were invited on board and hosted by DJ Soo Wei.
Shoppers who boarded the fashion bus were treated to ice-cream and S$20 CapitaVoucher while they listened to the styling tips given by the host. Raffles City Singapore also presented seven uniquely choreographed runway looks from tenants such as Shanghai Tang, Robinsons, Swarovski, FURLA, Stradivarius, Montblanc and Nine West.
a Whirl of christmas DazzleRaffles City Singapore was proud to present Barbie™ as Mariposa, the Butterfly Fairy’s musical. Shoppers were treated to a repertoire of Christmas carols with jazzy tunes and instrumental showmanship by popular artistes as they indulged in wonderful prizes and promotions for their year-end shopping spree during the festive season.
sembaWanG shoPPinG centre
march sizzles!Sembawang Shopping Centre held its signature enrichment fair showcasing programmes by the tenants during the March school holiday.
During the fair, kids were treated to a range of exciting activities including colouring contests and stage performances. Shoppers who signed up for enrichment programmes were rewarded with S$85 worth of shopping vouchers.
Gss – sale-abrateShoppers at Sembawang Shopping Centre enjoyed fun and friendship with the adorable Forever Friends bears. Shoppers and their families were treated to the Forever Friends meet-and-greet sessions, game stations as well as arts and craft workshops.
filling your christmas with Double the joy Sembawang Shopping Centre hosted Care Bear character shows during the Christmas season. Shoppers relived their childhood memories together with their children through meet-and-greet sessions and workshops. On top of festive redemptions of gift wrappers, gift tags and shopping rebates, shoppers born in the month of December were also treated to an exclusive birthday treat.
tamPines mall
hokkaido fairTampines Mall’s iconic event celebrated its eighth anniversary.
Marketing &Promotions
Jointly organised with Isetan, it offered shoppers an exciting array of Hokkaido delicacies such as Koyu Seikatsu (Okhotsk chamomile tea), Niki Farm – stick cake, Yotsuba Nyugyo (Hokkaido Tokusen 3.6 milk) and Hokkaido Smart Ramen.
kyushu fairKyushu Fair returned to the mall for the fourth consecutive year. Jointly organised with Isetan, this iconic event offered Kyushu’s major agricultural products such as Marumitsu Sanyo (Japanese fruit jelly), Misoya Dou (Japanese ramen), HAPPY CREPE (cup crepe), Kikuya (fresh roll cake and pudding roll) and Aji No Kuraya – ‘FUKA FUKA’ (steamed brown sugar cake).
baby fairTampines Mall introduced its inaugural Baby Fair in collaboration with Watsons. The fair, held at the main atrium, featured a colourful and animal-themed setup, exciting weekend stage events and merchandises.
Clarity98 CapitaMall Trust Annual Report 2013

Business Review
Kyushu Fair at Tampines Mall
Bjorn the Polar Bear at Westgate
WestGate
bjorn the Polar bearFor the first time, Bjorn the Polar Bear appeared in Singapore at Westgate for an unforgettable show. Over a period of eight days during the Christmas season, shoppers had the chance to interact and take photos with the life-like Bjorn and learn more about this endangered species.
live band @ courtyardTo further enhance the shopping experience, shoppers were entertained as they dined and shopped along the Courtyard
at Westgate as the live band performed Christmas songs to bring in the festive cheers.
99

Ms Clara Cheo chief executive officer
‘Retail is a competitive business and it is important to establish a close relationship with the landlord to offer the best customer experience. Retail trends are constantly evolving, hence, we must be forward thinking with new ideas to continuously keep the customers’ interest such as the popular Eat at Taipei store in JCube. CapitaMall Trust is supportive of this philosophy and allows us to grow the business together.’
Mr Anthony Wong managing Director
Mr George Quek chairman
Mr Loo Leong Thye chief executive officer
TenantsSpotlight
breaDtalk GrouP
‘From our first BreadTalk outlet at Bugis Junction, the BreadTalk Group has expanded its brand portfolio with Toast Box, Din Tai Fung, RamenPlay and Food Republic – through developing exciting concepts at CapitaMall Trust’s strategic property locations. Our strong partnership with its team of experienced leadership and professional property managers have allowed us to grow our business in an exciting, dynamic way. As the BreadTalk Group spearheads its international expansion in China in more than 60 cities, we will continue to leverage on each other’s strengths through our strong collaboration with CapitaMalls Asia.’
‘We are glad to have a strong and long-standing partnership with CapitaMall Trust. Challenger has presence in more than 10 malls of CapitaMall Trust. As a retailer, we need good location to expand. CapitaMall Trust, being the biggest landlord has allowed us to grow our business. We recently opened our first Valore store at Funan DigitaLife Mall and three stores in Westgate, namely Challenger, Musica and Valore.’
challenGer
creative eateries
‘CapitaMall Trust is a supportive landlord. We have had a close partnership for many years. Their creative marketing activities have helped draw footfall traffic to the malls. The management has been helpful and listens to our needs. As our business evolves, CapitaMall Trust and Golden Village are in constant partnership to regularly upgrade our amenities, to better meet customers’ needs and stay ahead of trends.’
GolDen villaGe
Clarity100 CapitaMall Trust Annual Report 2013

Business Review
Mr R Dhinakaran managing Director
Mr Anders Peter Juel Sauerberg chief executive officer
Mr Lim Tien Chun managing Director
Ms Phyllis Cheung managing Director
isetan
‘We have a long-established relationship with CapitaMall Trust. Our first outlet with CapitaMall Trust in Tampines Mall was successful and we hope to mirror the success in the new store in Westgate. This new store includes Isetan’s first supermarket outside town. We look forward to growing the business in Singapore with them.’
‘For more than 10 years, McDonald’s Singapore has built a strong partnership with CapitaMall Trust. The malls are strategically located at transportation hubs, which become the focal point for residents and workers in their daily activities. The partnership has proven to bring us both business success and brand reputation. They are always helpful to our restaurant managers in resolving daily operating issues with the purpose to bring more customer satisfaction. We’re loving it.’
mcDonalD’s
PanDora
‘We have enjoyed a long and excellent working relationship with CapitaMall Trust. We went through good and difficult times. As CapitaMall Trust expands, we expand with them by setting up new stores in their malls. Together with CapitaMall Trust, we look forward to grow our business with strength to strength.’
‘As an Asian retail specialist, Norbreeze is delighted to repeat our success formulas and expand the Pandora brand in Singapore with CapitaMall Trust. We have recently opened a Pandora boutique in Westgate and seen great potential. CapitaMall Trust understands the retail scene in Singapore and we have received strong support from them. Looking forward to deepening our relationship with CapitaMall Trust in the years to come.’
t.m.leWin
101

Sally and family Monica and friends
Shi Hui and family Keith and Cyndi
tamPines mall
Plaza sinGaPura
how often do you come here?Twice a week.What do you like about the mall?Convenience.What do you think about the mall?Awesome! What are your favourite stores at the mall?NTUC FairPrice.
how often do you come here?Twice a month. What do you like about the mall?Family friendly, child friendly and many shop options. What do you think about the mall?Great family hangout especially with family room. What are your favourite stores at the mall?Owndays, Tim Ho Wan, Mothercare and Daiso.
the atrium@orcharD
how often do you come here?Twice a month.What do you like about the mall?Convenient location.What do you think about the mall?Wide varieties and good location.What are your favourite stores at the mall?Watsons, Sephora, Skinny Pizza and Golden Village.
buGis+
how often do you come here?Twice a month. What do you like about the mall?Convenience and wide choices of food.What do you think about the mall?Good gathering venue with friends.What are your favourite stores at the mall?Craftholic and Sephora.
MeetingOur Shoppers
Clarity102 CapitaMall Trust Annual Report 2013

Business Review
Pattina and family Reyaz and family
Daryl and Michelle Dominique
buGis junction
WestGate
how often do you come here?Twice a week.What do you like about the mall?Open-air walking space, convenient to shop with wide varieties.What do you think about the mall?Youngsters hangout, good location for food and good meeting point.What are your favourite stores at the mall?Starbucks, Miam Miam, Miss Selfridge and Watsons.
how often do you come here?At least once a week.What do you like about the mall?The mall is very spacious and we do not need to go to Orchard Road.What do you think about the mall?The mall is nice and we enjoy shopping here.What are your favourite stores at the mall?Isetan and some of the restaurants.
jcube
how often do you come here?Once a week to skate and dine. What do you like about the mall?The rink is in an open concept style where diners and movie goers can look in. This really helps to promote ice-skating.What do you think about the mall? I think this mall is great!What are your favourite stores at the mall? Chili’s, Nando’s, Kungfu Paradise, Starbucks and Caesars.
imm builDinG
how often do you come here?Once a month. What do you like about the mall?It offers wide varieties and outlet shopping.What do you think about the mall?Convenient and spacious.What are your favourite stores at the mall?Adidas and Timberland.
103


Sustained SuccessOur portfolio of strategic shopping malls continues to grow and expand in our appeal to increasingly diverse types of shoppers and tenants. Growth across CMT’s asset portfolio remains sustained by its scale and vibrant retail experiences.
Portfolioat a Glance
CMT’s portfolio of 16 quality shopping malls is well-diversified in the suburban areas and downtown core of Singapore. The portfolio includes Tampines Mall, Junction 8, Funan DigitaLife Mall, IMM Building, Plaza Singapura, Bugis Junction, Sembawang Shopping Centre, JCube, Raffles City Singapore (40.00% interest), Lot One Shoppers’ Mall, Bukit Panjang Plaza, Rivervale Mall, The Atrium@Orchard, Clarke Quay, Bugis+ and Westgate (30.00% interest).
These shopping malls are largely well-connected to public transportation nodes such as Mass Rapid Transit (MRT)/Light Rail Transit (LRT) stations and bus interchanges and are strategically located either in areas with large population catchments or within Singapore’s popular shopping and tourist destinations.
The Manager continues to strive to ensure that each shopping mall in CMT’s portfolio optimises its
financial performance, strengthens its market position as the leading mall serving its respective target market, as well as provides the ideal shopping experience for its shoppers. This is achieved through a combination of active tenant remixing, asset enhancements, stringent mall maintenance standards as well as unique mall-centric marketing and promotional activities.
Property Valuation S$8,799.4 million 1
Net Lettable Area 5.6 million sq ft 2
Committed Occupancy Rate 98.5% 3
Number of Leases 2,955Total Annual Shopper Traffic 298.2 million 4
1 Includes CMT’s 40.00% interest in Raffles City Singapore and CMT’s 30.00% interest in Westgate.2 Includes the post-asset enhancement net lettable area of Bugis Junction.3 Excludes the office and hotel leases of Raffles City Singapore as well as the office and warehouse leases of IMM Building.4 Excludes Westgate which was under development and commenced mall operations on 2 December 2013.
ProPerty Portfolio summary
As at 31 December 2013
Clarity106 CapitaMall Trust Annual Report 2013
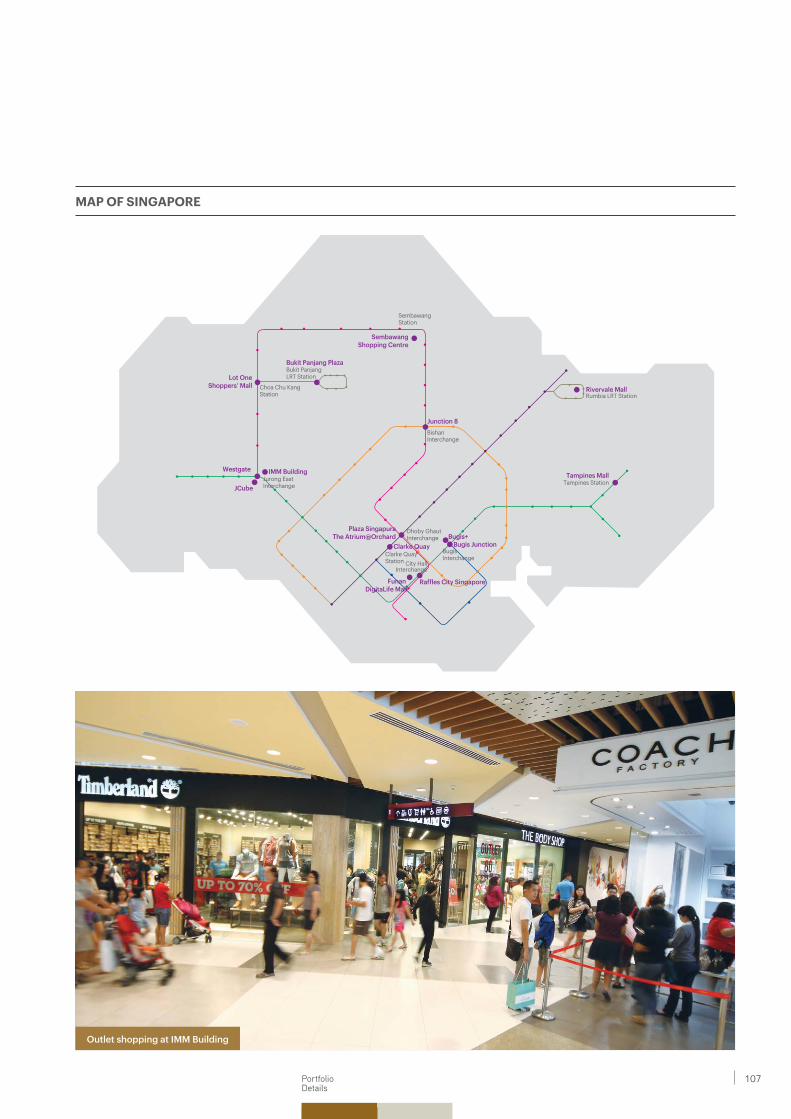
PortfolioDetails
Outlet shopping at IMM Building
maP of sinGaPore
Tampines MallTampines Station
BishanInterchange
SembawangStation
Bukit PanjangLRT Station
Choa Chu KangStation
Jurong EastInterchange
Dhoby GhautInterchange
BugisInterchange
Rivervale MallRumbia LRT Station
Bugis JunctionClarke Quay
Junction 8
SembawangShopping Centre
Bukit Panjang Plaza
Lot OneShoppers’ Mall
IMM BuildingWestgate
JCube
Bugis+Plaza Singapura
The Atrium@Orchard
Clarke QuayStation
Raf�es City Singapore
City HallInterchange
Funan DigitaLife Mall
107

Tampines Mall Junction 8 1
Funan DigitaLife Mall
IMM Building
Plaza Singapura
Bugis Junction
Sembawang Shopping Centre
Rivervale Mall JCube
Raffles City Singapore
Lot One Shoppers’ Mall
Bukit Panjang Plaza
The Atrium@Orchard Clarke Quay Bugis+ Westgate 2
Gross Floor Area(sq ft)
474,035 375,679 482,097 1,426,504 757,031 577,719 197,676 109,243 316,815 3,449,727 326,152 228,982 576,972 366,363 320,044 593,928
net Lettable Area(nLA) (sq ft)
329,581 252,383 298,598 Retail: 415,424Non-Retail: 537,225Total: 952,649
482,311 393,983 134,940 81,159 210,237 Retail: 420,995Office: 380,927Total: 801,922
219,837 152,307 Retail: 137,053Office: 252,308Total: 389,361
291,111 214,420 410,332
number of Leases 171 179 187 618 247 260 75 65 120 279 159 111 98 76 96 214
Car Park Lots 638 306 338 1,324 695 648 165 178 341 1,045 324 332 128 424 325 600
Title Leasehold tenure of 99 years with effect from 1 September 1992
Leasehold tenure of 99 years with effect from 1 September 1991
Leasehold tenure of 99 years with effect from 12 December 1979
Leasehold tenure of 30+ 30 years with effect from 23 January 1989
Freehold Leasehold tenure of 99 years with effect from 10 September 1990
Leasehold tenure of 999 years with effect from 26 March 1885
Leasehold tenure of 99 years with effect from 6 December 1997
Leasehold tenure of 99 years with effect from 1 March 1991
Leasehold tenure of 99 years with effect from 16 July 1979
Leasehold tenure of 99 years with effect from 1 December 1993
Leasehold tenure of 99 years with effect from 1 December 1994
Leasehold tenure of 99 years with effect from 15 August 2008
Leasehold tenure of 99 years with effect from 13 January 1990
Leasehold tenure of 60 years with effect from 30 September 2005
Leasehold tenure of 99 years with effect from 29 August 2011
Purchase Price(S$ million)
409.0 295.0 191.0 247.4 710.0 605.8 78.0 65.2 68.0 2,166.0 (100.00% interest)866.4(40.00% interest)
243.8 161.3 839.8 268.0 295.0 969.0(100.00% interest)290.7(30.00% interest)
Market valuation(S$ million)
852.0 636.0 358.0 632.0 1,168.0 901.0 96.0 115.0 360.0 3,018.0(100.00% interest)1,207.2(40.00% interest)
485.0 274.0 722.0 347.0 330.0 1,054.0(100.00% interest)316.2(30.00% interest)
As % of Portfolio valuation 9.7% 7.2% 4.1% 7.2% 13.3% 10.2% 1.1% 1.3% 4.1% 13.7% 5.5% 3.1% 8.2% 3.9% 3.8% 3.6%
Gross Revenue(S$ million)
73.4 55.4 33.3 75.4 84.0 73.1 23.0 33.8 90.3(40.00% interest)
42.0 25.9 49.6 37.3 31.4 1.3 3
(30.00% interest)
net Property Income(S$ million)
53.8 39.4 22.1 50.0 63.2 47.9 13.6 22.0 66.4(40.00% interest)
28.9 16.7 36.7 23.1 21.3 (2.3) 3
(30.00% interest)
Committed Occupancy 100.0% 99.4% 98.2% Retail: 99.0%Non-retail: 96.7%Total: 97.7%
100.0% 100.0% 100.0% 100.0% 100.0% Retail: 100.0%Office: 100.0%Total: 100.0%
100.0% 99.8% Retail: 98.5%Office: 100.0%Total: 99.5%
100.0% 100.0% 85.8%
Annual Shopper Traffic(million)
26.7 30.9 8.3 15.4 24.1 40.4 4.8 10.2 15.2 35.2 17.4 13.5 23.4 11.7 21.0 N.A. 3
Key Tenants (by gross rental income)
NTUC, Isetan, Golden Village, Kopitiam, McDonald’s
BHG, NTUC, Best Denki, BreadTalk, Wing Tai Clothing
Challenger, Newstead Technologies, Pertama Merchandising, Auric Pacific, Cold Storage
Cold Storage, Best Denki, Kopitiam, Daiso, Extra Space Jurong
Robinson & Co., Golden Village, Cold Storage, StarHub, Spotlight
BHG, Wing Tai Clothing, Auric Pacific, Cold Storage, TKA Amusement
Cold Storage, Daiso, Auric Pacific, Esprit, Popular
NTUC, Daiso, McDonald’s, United Overseas Bank, Watsons
Bals Singapore, Cold Storage, Paradise Group, Kopitiam, VGO Corporation
Robinson & Co., Wing Tai Clothing, Jay Gee Enterprises, TES 07 Pte. Ltd., Auric Pacific
NTUC, Auric Pacific, Courts, BHG, KFC/ Pizza Hut
NTUC, Kopitiam, KFC/Pizza Hut, McDonald’s, Cold Storage
Temasek Holdings, Wing Tai Clothing, F J Benjamin, Auric Pacific, Fullerton Fund Management
Luminox, The Quayside Group, Shanghai Dolly, Katrina Holdings, Attica
Jay Gee Enterprises, Hansfort Investment, Wing Tai Clothing, RSH Singapore Pte Ltd, Komars Management
Isetan, BreadTalk, Courts, Samsung, Fitness First
% of Anchor Tenants 4
(by nLA)32.8% 12.7% 19.1% 25.6% 33.1% 26.2% 27.9% N.A. N.A. 23.5% N.A. 18.2% 56.4% 21.9% 12.3% 14.6%
N.A.: Not Applicable.Data as at 31 December 2013.Gross Revenue, Net Property Income and Annual Shopper Traffic figures were for the year ended 31 December 2013.
PortfolioSummary
Clarity108 CapitaMall Trust Annual Report 2013
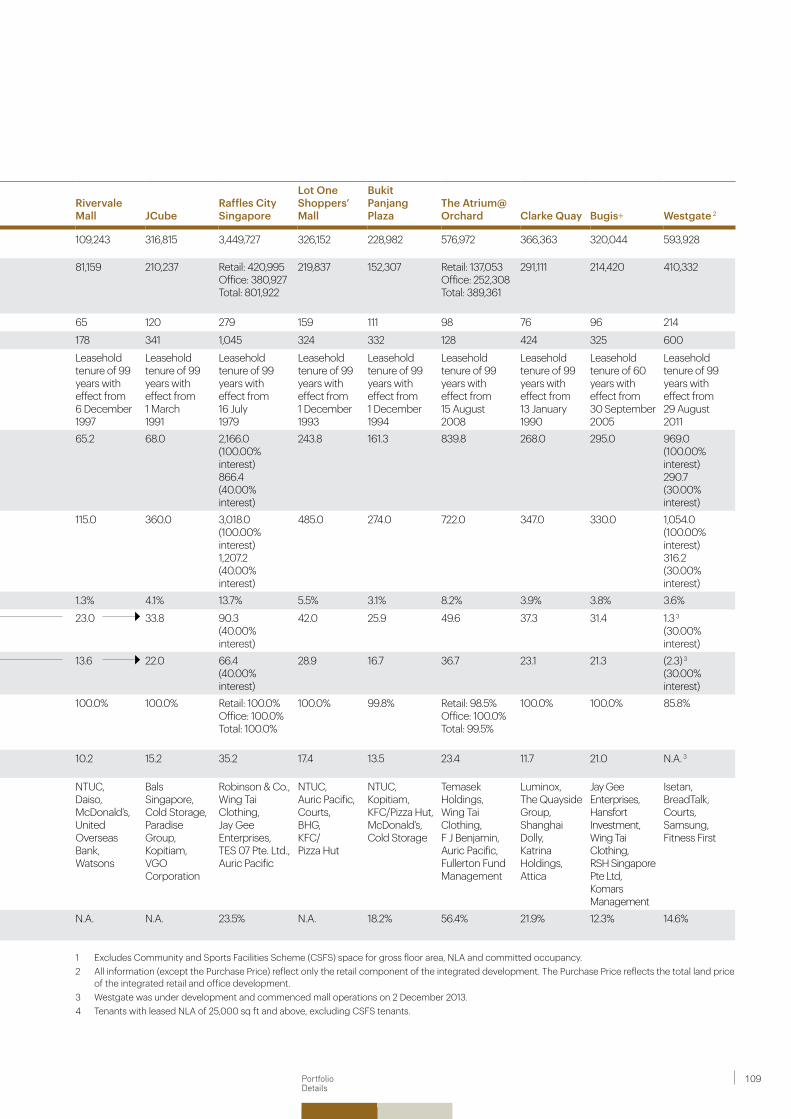
PortfolioDetails
1 Excludes Community and Sports Facilities Scheme (CSFS) space for gross floor area, NLA and committed occupancy.2 All information (except the Purchase Price) reflect only the retail component of the integrated development. The Purchase Price reflects the total land price
of the integrated retail and office development.3 Westgate was under development and commenced mall operations on 2 December 2013.4 Tenants with leased NLA of 25,000 sq ft and above, excluding CSFS tenants.
Tampines Mall Junction 8 1
Funan DigitaLife Mall
IMM Building
Plaza Singapura
Bugis Junction
Sembawang Shopping Centre
Rivervale Mall JCube
Raffles City Singapore
Lot One Shoppers’ Mall
Bukit Panjang Plaza
The Atrium@Orchard Clarke Quay Bugis+ Westgate 2
Gross Floor Area(sq ft)
474,035 375,679 482,097 1,426,504 757,031 577,719 197,676 109,243 316,815 3,449,727 326,152 228,982 576,972 366,363 320,044 593,928
net Lettable Area(nLA) (sq ft)
329,581 252,383 298,598 Retail: 415,424Non-Retail: 537,225Total: 952,649
482,311 393,983 134,940 81,159 210,237 Retail: 420,995Office: 380,927Total: 801,922
219,837 152,307 Retail: 137,053Office: 252,308Total: 389,361
291,111 214,420 410,332
number of Leases 171 179 187 618 247 260 75 65 120 279 159 111 98 76 96 214
Car Park Lots 638 306 338 1,324 695 648 165 178 341 1,045 324 332 128 424 325 600
Title Leasehold tenure of 99 years with effect from 1 September 1992
Leasehold tenure of 99 years with effect from 1 September 1991
Leasehold tenure of 99 years with effect from 12 December 1979
Leasehold tenure of 30+ 30 years with effect from 23 January 1989
Freehold Leasehold tenure of 99 years with effect from 10 September 1990
Leasehold tenure of 999 years with effect from 26 March 1885
Leasehold tenure of 99 years with effect from 6 December 1997
Leasehold tenure of 99 years with effect from 1 March 1991
Leasehold tenure of 99 years with effect from 16 July 1979
Leasehold tenure of 99 years with effect from 1 December 1993
Leasehold tenure of 99 years with effect from 1 December 1994
Leasehold tenure of 99 years with effect from 15 August 2008
Leasehold tenure of 99 years with effect from 13 January 1990
Leasehold tenure of 60 years with effect from 30 September 2005
Leasehold tenure of 99 years with effect from 29 August 2011
Purchase Price(S$ million)
409.0 295.0 191.0 247.4 710.0 605.8 78.0 65.2 68.0 2,166.0 (100.00% interest)866.4(40.00% interest)
243.8 161.3 839.8 268.0 295.0 969.0(100.00% interest)290.7(30.00% interest)
Market valuation(S$ million)
852.0 636.0 358.0 632.0 1,168.0 901.0 96.0 115.0 360.0 3,018.0(100.00% interest)1,207.2(40.00% interest)
485.0 274.0 722.0 347.0 330.0 1,054.0(100.00% interest)316.2(30.00% interest)
As % of Portfolio valuation 9.7% 7.2% 4.1% 7.2% 13.3% 10.2% 1.1% 1.3% 4.1% 13.7% 5.5% 3.1% 8.2% 3.9% 3.8% 3.6%
Gross Revenue(S$ million)
73.4 55.4 33.3 75.4 84.0 73.1 23.0 33.8 90.3(40.00% interest)
42.0 25.9 49.6 37.3 31.4 1.3 3
(30.00% interest)
net Property Income(S$ million)
53.8 39.4 22.1 50.0 63.2 47.9 13.6 22.0 66.4(40.00% interest)
28.9 16.7 36.7 23.1 21.3 (2.3) 3
(30.00% interest)
Committed Occupancy 100.0% 99.4% 98.2% Retail: 99.0%Non-retail: 96.7%Total: 97.7%
100.0% 100.0% 100.0% 100.0% 100.0% Retail: 100.0%Office: 100.0%Total: 100.0%
100.0% 99.8% Retail: 98.5%Office: 100.0%Total: 99.5%
100.0% 100.0% 85.8%
Annual Shopper Traffic(million)
26.7 30.9 8.3 15.4 24.1 40.4 4.8 10.2 15.2 35.2 17.4 13.5 23.4 11.7 21.0 N.A. 3
Key Tenants (by gross rental income)
NTUC, Isetan, Golden Village, Kopitiam, McDonald’s
BHG, NTUC, Best Denki, BreadTalk, Wing Tai Clothing
Challenger, Newstead Technologies, Pertama Merchandising, Auric Pacific, Cold Storage
Cold Storage, Best Denki, Kopitiam, Daiso, Extra Space Jurong
Robinson & Co., Golden Village, Cold Storage, StarHub, Spotlight
BHG, Wing Tai Clothing, Auric Pacific, Cold Storage, TKA Amusement
Cold Storage, Daiso, Auric Pacific, Esprit, Popular
NTUC, Daiso, McDonald’s, United Overseas Bank, Watsons
Bals Singapore, Cold Storage, Paradise Group, Kopitiam, VGO Corporation
Robinson & Co., Wing Tai Clothing, Jay Gee Enterprises, TES 07 Pte. Ltd., Auric Pacific
NTUC, Auric Pacific, Courts, BHG, KFC/ Pizza Hut
NTUC, Kopitiam, KFC/Pizza Hut, McDonald’s, Cold Storage
Temasek Holdings, Wing Tai Clothing, F J Benjamin, Auric Pacific, Fullerton Fund Management
Luminox, The Quayside Group, Shanghai Dolly, Katrina Holdings, Attica
Jay Gee Enterprises, Hansfort Investment, Wing Tai Clothing, RSH Singapore Pte Ltd, Komars Management
Isetan, BreadTalk, Courts, Samsung, Fitness First
% of Anchor Tenants 4
(by nLA)32.8% 12.7% 19.1% 25.6% 33.1% 26.2% 27.9% N.A. N.A. 23.5% N.A. 18.2% 56.4% 21.9% 12.3% 14.6%
N.A.: Not Applicable.Data as at 31 December 2013.Gross Revenue, Net Property Income and Annual Shopper Traffic figures were for the year ended 31 December 2013.
109

PortfolioDetails
tampines mall
Tampines Mall, located in the densely populated residential area of Tampines, is one of Singapore’s leading suburban malls. It is conveniently situated within the Tampines Regional Centre, the first and most developed regional centre in Singapore, and accessible via the Tampines Mass Rapid Transit (MRT) Station and bus interchange.
To meet the needs of middle-income consumers living and working around the bustling Tampines Regional Centre, Tampines Mall provides a wide variety of shopping, dining and entertainment options for families, professionals and young adults.
ProPerty information
Description Five retail levels (including a basement level) and two basement car park levels
net Lettable Area (sq ft) 329,581number of Leases 171Car Park Lots 638Title Leasehold tenure of 99 years
with effect from 1 September 1992Acquisition Year 2002Market valuation (S$ million) 852.0Gross Revenue (S$ million) 73.4net Property Income (S$ million) 53.8Committed Occupancy (%) 100.0Annual Shopper Traffic (million) 26.7Key Tenants NTUC, Isetan, Golden Village,
Kopitiam, McDonald'sData as at 31 December 2013.Gross Revenue, Net Property Income and Annual Shopper Traffic figures were for the year ended 31 December 2013.
Mustafa Abdul RahimGeneral Manager
Jessica LeeLeasing
Sarah LuaMarcom
Chloe PohOperations
centre manaGement
Clarity110 CapitaMall Trust Annual Report 2013

PortfolioDetails
2014 2015 2016
26.6 26.621.9
24.8
33.437.4
18.1
11.2
% of Total Net Lettable Area % of Total Gross Rental Income 2
Food & Beverage 31.0Beauty & Health 11.2Fashion 10.4Services 8.4Gifts / Toys & Hobbies / Books / Sporting Goods
6.9
Jewellery & Watches 6.6Supermarket 5.6Department Store 5.1Shoes & Bags 4.3Leisure & Entertainment / Music & Video
4.2
Information Technology 2.2Electrical & Electronics 1.9Education 1.8Houseware & Furnishings 0.4
Food & Beverage 26.0Leisure & Entertainment / Music & Video
11.2
Department Store 11.1Supermarket 10.2Gifts / Toys & Hobbies / Books / Sporting Goods
9.9
Beauty & Health 6.4Fashion 6.0Services 5.0Education 4.6Electrical & Electronics 3.1Jewellery & Watches 2.7Shoes & Bags 2.3Information Technology 1.2Houseware & Furnishings 0.3
By Net Lettable Area
(As at 31 December 2013)
By Gross Rental Income 2
(For the month of December 2013)
2017 & Beyond
traDe sector analysis 1(%)
lease exPiry Profile 1(%)
As at 31 December 2013
1 Based on committed leases. 2 Excludes gross turnover rent.
111

junction 8
Ivy AngCentre Manager
Patsy Pan Leasing
Zen LeeMarcom
Damien Koh Operations
Junction 8 is located in the densely populated residential area of Bishan, being well served by the Bishan MRT Interchange Station and bus interchange. It helps to extend its reach well beyond its immediate vicinity.
As the only shopping mall in Bishan, Junction 8 is positioned as a one-stop shopping, dining and entertainment destination catering to the needs of residents from the surrounding estates, office workers in the area and students from nearby schools. Junction 8 has undergone asset enhancement initiatives whereby the internal corridors, roof garden and toilet facilities were upgraded.
PortfolioDetails
centre manaGement
Description Five retail levels (including a basement level) and two basement car park levels
net Lettable Area (sq ft) 252,383 1
number of Leases 179Car Park Lots 306Title Leasehold tenure of 99 years
with effect from 1 September 1991Acquisition Year 2002Market valuation (S$ million) 636.0Gross Revenue (S$ million) 55.4net Property Income (S$ million) 39.4Committed Occupancy (%) 99.4 1
Annual Shopper Traffic (million) 30.9Key Tenants BHG, NTUC, Best Denki, BreadTalk,
Wing Tai ClothingData as at 31 December 2013.Gross Revenue, Net Property Income and Annual Shopper Traffic figures were for the year ended 31 December 2013.
1 Excludes Community and Sports Facilities Scheme (CSFS) space.
ProPerty information
Clarity112 CapitaMall Trust Annual Report 2013

PortfolioDetails
2014 2015 2016
33.9 34.031.1
22.326.3
38.2
8.75.5
Food & Beverage 31.8Fashion 14.5Beauty & Health 10.0Services 6.6Gifts / Toys & Hobbies / Books / Sporting Goods
5.8
Leisure & Entertainment / Music & Video
5.6
Department Store 5.0Supermarket 5.0Electrical & Electronics 4.6Shoes & Bags 3.2Jewellery & Watches 3.1Information Technology 2.3Office 1.6Education 0.5Houseware & Furnishings 0.4
Food & Beverage 20.6Office 17.5Department Store 10.4Leisure & Entertainment / Music & Video
10.3
Supermarket 8.1Fashion 6.9Gifts / Toys & Hobbies / Books / Sporting Goods
6.3
Electrical & Electronics 6.2Beauty & Health 5.2Services 3.5Shoes & Bags 1.6Jewellery & Watches 1.1Information Technology 1.0Education 1.0Houseware & Furnishings 0.3
By Net Lettable Area
(As at 31 December 2013)
By Gross Rental Income 2
(For the month of December 2013)
2017 & Beyond
1 Based on committed leases; includes CSFS space. 2 Excludes gross turnover rent.
% of Total Net Lettable Area % of Total Gross Rental Income 2
traDe sector analysis 1(%)
lease exPiry Profile 1(%)
As at 31 December 2013
113

funan Digitalife mall
Margaret KhooGeneral Manager
Tan Pei ChengCentre Manager
Wang YingyingLeasing
Yvel LeuMarcom
Ivan LauOperations
Funan DigitaLife Mall (Funan) enjoys an excellent location in the downtown core and tourist belt of Singapore. It is within walking distance of the City Hall MRT Interchange Station and the Clarke Quay MRT Station, which places it in close proximity to the riverside dining and entertainment precincts such as Clarke Quay.
Together with a unique mix of reputable retailers that offer genuine products and quality customer service, Funan is one of Singapore’s choice destinations for information technology (IT), gaming, digital and lifestyle products. All these make it hugely popular with professionals, managers, executives and businessmen (PMEBs) and tourists alike.
Description Seven retail levels (including a basement level) and three basement car park levels
net Lettable Area (sq ft) 298,598number of Leases 187Car Park Lots 338Title Leasehold tenure of 99 years
with effect from 12 December 1979Acquisition Year 2002Market valuation (S$ million) 358.0Gross Revenue (S$ million) 33.3net Property Income (S$ million) 22.1Committed Occupancy (%) 98.2Annual Shopper Traffic (million) 8.3Key Tenants Challenger, Newstead Technologies,
Pertama Merchandising, Auric Pacific, Cold Storage
Data as at 31 December 2013.Gross Revenue, Net Property Income and Annual Shopper Traffic figures were for the year ended 31 December 2013.
ProPerty information
PortfolioDetails
centre manaGement
Clarity114 CapitaMall Trust Annual Report 2013
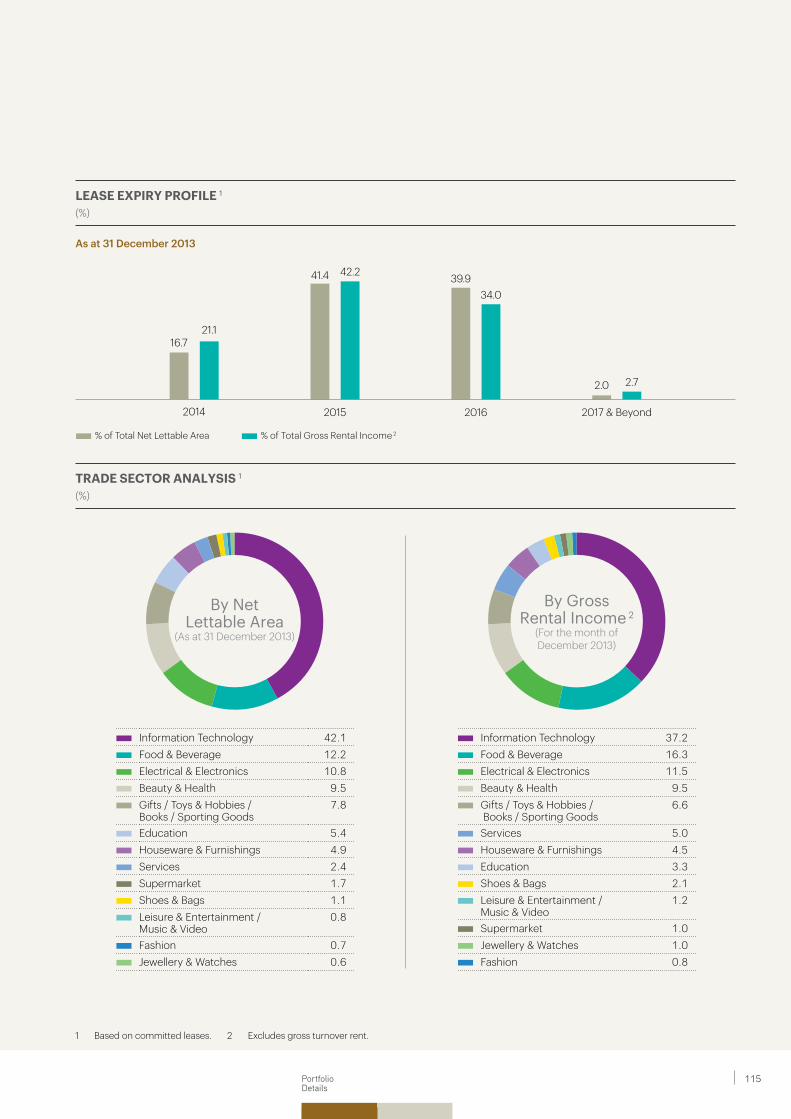
PortfolioDetails
2014 2015 2016
16.721.1
41.4 42.2 39.934.0
2.0 2.7
Information Technology 37.2Food & Beverage 16.3Electrical & Electronics 11.5Beauty & Health 9.5Gifts / Toys & Hobbies / Books / Sporting Goods
6.6
Services 5.0Houseware & Furnishings 4.5Education 3.3Shoes & Bags 2.1Leisure & Entertainment / Music & Video
1.2
Supermarket 1.0Jewellery & Watches 1.0Fashion 0.8
Information Technology 42.1Food & Beverage 12.2Electrical & Electronics 10.8Beauty & Health 9.5Gifts / Toys & Hobbies / Books / Sporting Goods
7.8
Education 5.4Houseware & Furnishings 4.9Services 2.4Supermarket 1.7Shoes & Bags 1.1Leisure & Entertainment / Music & Video
0.8
Fashion 0.7Jewellery & Watches 0.6
By Net Lettable Area
(As at 31 December 2013)
By Gross Rental Income 2
(For the month of December 2013)
2017 & Beyond
1 Based on committed leases. 2 Excludes gross turnover rent.
% of Total Net Lettable Area % of Total Gross Rental Income 2
traDe sector analysis 1(%)
lease exPiry Profile 1(%)
As at 31 December 2013
115
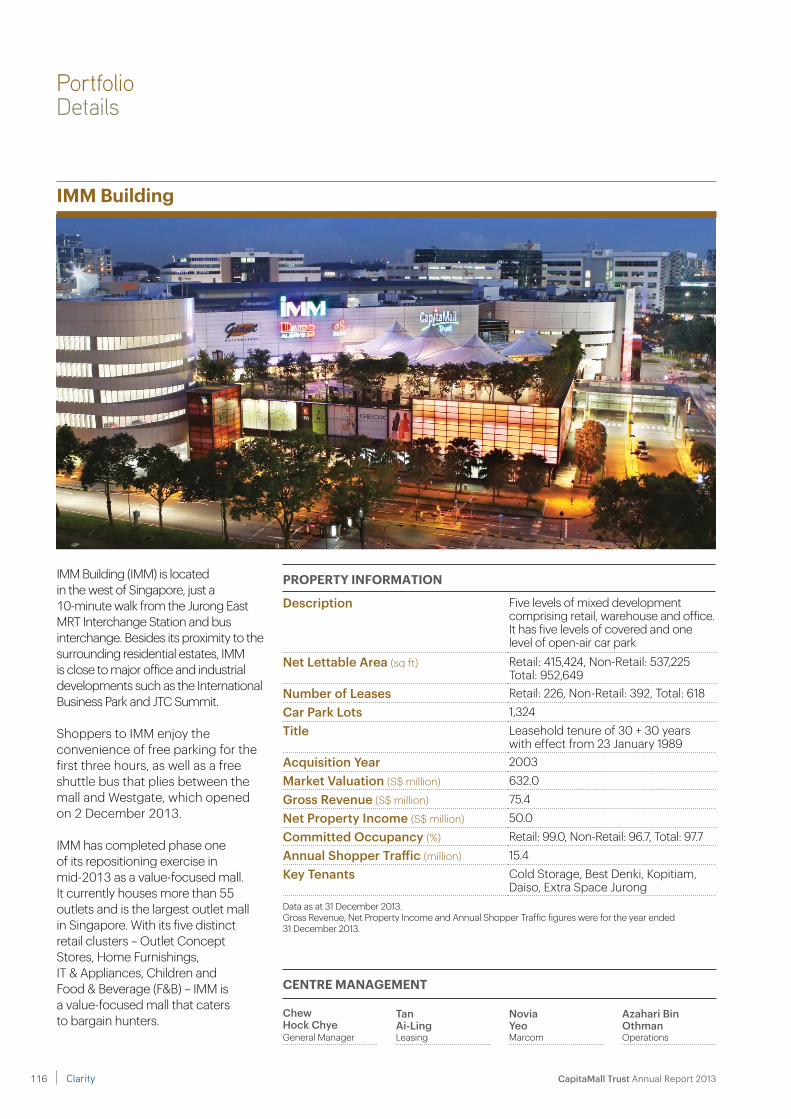
imm building
IMM Building (IMM) is located in the west of Singapore, just a 10-minute walk from the Jurong East MRT Interchange Station and bus interchange. Besides its proximity to the surrounding residential estates, IMM is close to major office and industrial developments such as the International Business Park and JTC Summit.
Shoppers to IMM enjoy the convenience of free parking for the first three hours, as well as a free shuttle bus that plies between the mall and Westgate, which opened on 2 December 2013.
IMM has completed phase one of its repositioning exercise in mid-2013 as a value-focused mall. It currently houses more than 55 outlets and is the largest outlet mall in Singapore. With its five distinct retail clusters – Outlet Concept Stores, Home Furnishings, IT & Appliances, Children and Food & Beverage (F&B) – IMM is a value-focused mall that caters to bargain hunters.
PortfolioDetails
Chew Hock ChyeGeneral Manager
Tan Ai-LingLeasing
novia YeoMarcom
Azahari Bin OthmanOperations
centre manaGement
ProPerty information
Description Five levels of mixed development comprising retail, warehouse and office. It has five levels of covered and one level of open-air car park
net Lettable Area (sq ft) Retail: 415,424, Non-Retail: 537,225 Total: 952,649
number of Leases Retail: 226, Non-Retail: 392, Total: 618Car Park Lots 1,324Title Leasehold tenure of 30 + 30 years
with effect from 23 January 1989Acquisition Year 2003Market valuation (S$ million) 632.0Gross Revenue (S$ million) 75.4net Property Income (S$ million) 50.0Committed Occupancy (%) Retail: 99.0, Non-Retail: 96.7, Total: 97.7Annual Shopper Traffic (million) 15.4Key Tenants Cold Storage, Best Denki, Kopitiam,
Daiso, Extra Space JurongData as at 31 December 2013.Gross Revenue, Net Property Income and Annual Shopper Traffic figures were for the year ended 31 December 2013.
Clarity116 CapitaMall Trust Annual Report 2013

PortfolioDetails
2014 2015 2016
30.8
19.724.3
35.931.8
34.5
13.19.9
By Net Lettable Area
(As at 31 December 2013)
Warehouse 48.5Food & Beverage 8.0Supermarket 7.9Office 7.6Houseware & Furnishings 7.4Fashion 4.1Electrical & Electronics 4.0Gifts / Toys & Hobbies / Books / Sporting Goods
3.0
Beauty & Health 2.1Department Store 2.1Services 1.8Shoes & Bags 1.8Information Technology 0.7Jewellery & Watches 0.5Leisure & Entertainment / Music & Video
0.4
Education 0.1
Food & Beverage 20.6Houseware & Furnishings 14.8Warehouse 12.5Fashion 8.6Supermarket 6.9Beauty & Health 6.2Electrical & Electronics 6.0Services 5.7Gifts / Toys & Hobbies / Books / Sporting Goods
4.9
Shoes & Bags 4.0Office 3.8Jewellery & Watches 2.8Department Store 1.5Information Technology 1.1Leisure & Entertainment / Music & Video
0.5
Education 0.1
2017 & Beyond
By Gross Rental Income 2
(For the month of December 2013)
1 Based on committed leases. 2 Excludes gross turnover rent.
% of Total Net Lettable Area % of Total Gross Rental Income 2
traDe sector analysis 1(%)
lease exPiry Profile 1(%)
As at 31 December 2013
117
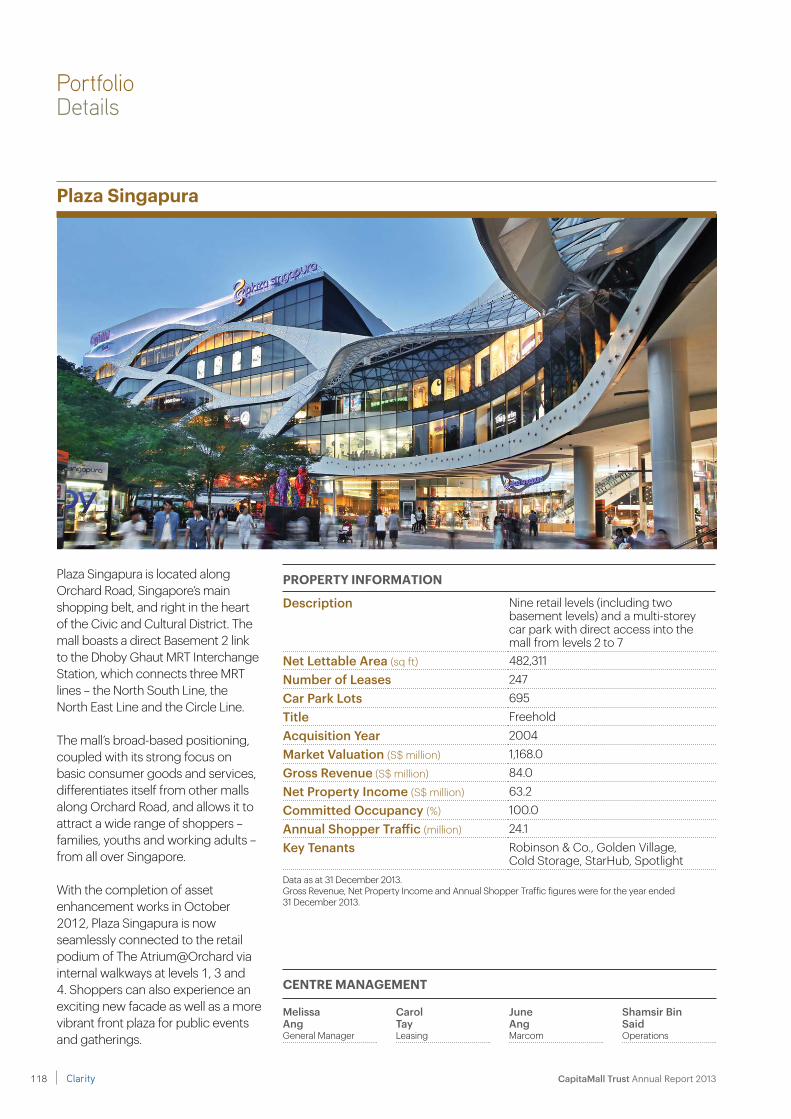
Plaza singapura
Plaza Singapura is located along Orchard Road, Singapore’s main shopping belt, and right in the heart of the Civic and Cultural District. The mall boasts a direct Basement 2 link to the Dhoby Ghaut MRT Interchange Station, which connects three MRT lines – the North South Line, the North East Line and the Circle Line.
The mall’s broad-based positioning, coupled with its strong focus on basic consumer goods and services, differentiates itself from other malls along Orchard Road, and allows it to attract a wide range of shoppers – families, youths and working adults – from all over Singapore.
With the completion of asset enhancement works in October 2012, Plaza Singapura is now seamlessly connected to the retail podium of The Atrium@Orchard via internal walkways at levels 1, 3 and 4. Shoppers can also experience an exciting new facade as well as a more vibrant front plaza for public events and gatherings.
Melissa Ang General Manager
Carol Tay Leasing
June AngMarcom
Shamsir Bin SaidOperations
PortfolioDetails
centre manaGement
Description Nine retail levels (including two basement levels) and a multi-storey car park with direct access into the mall from levels 2 to 7
net Lettable Area (sq ft) 482,311number of Leases 247Car Park Lots 695Title FreeholdAcquisition Year 2004Market valuation (S$ million) 1,168.0Gross Revenue (S$ million) 84.0net Property Income (S$ million) 63.2Committed Occupancy (%) 100.0Annual Shopper Traffic (million) 24.1Key Tenants Robinson & Co., Golden Village,
Cold Storage, StarHub, SpotlightData as at 31 December 2013.Gross Revenue, Net Property Income and Annual Shopper Traffic figures were for the year ended 31 December 2013.
ProPerty information
Clarity118 CapitaMall Trust Annual Report 2013
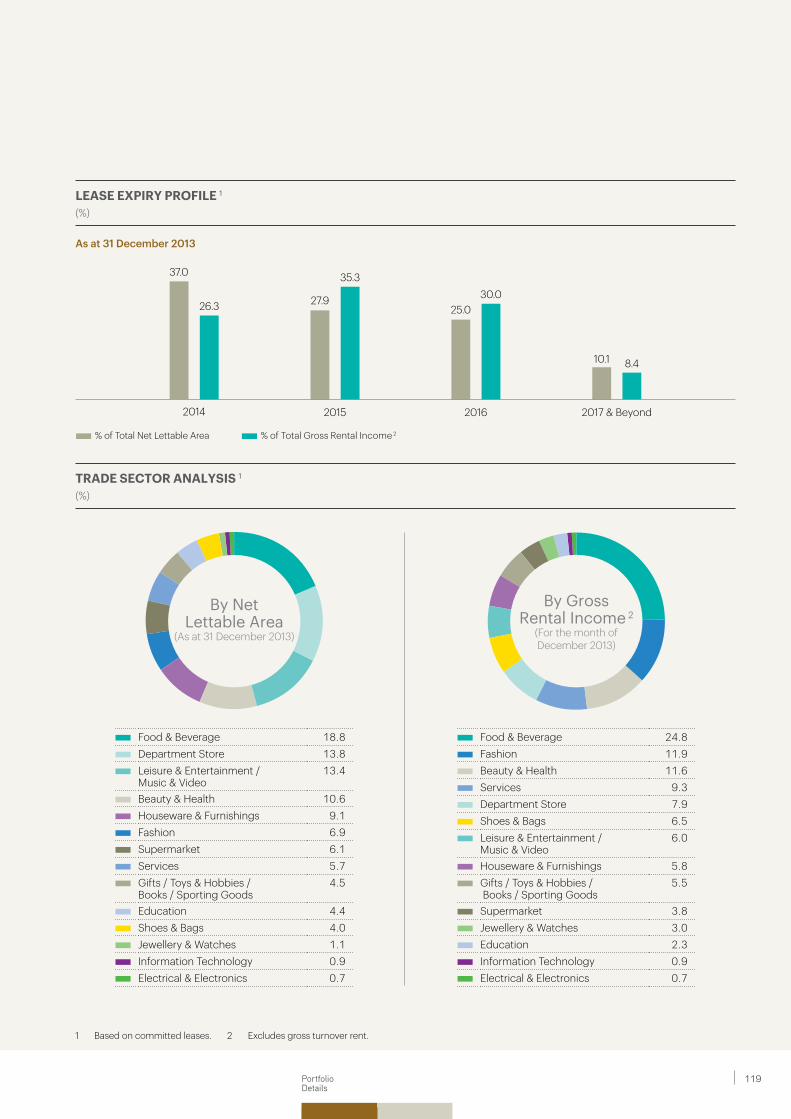
PortfolioDetails
2014 2015 2016 2017 & Beyond
37.0
26.3 27.9
35.3
25.030.0
10.1 8.4
Food & Beverage 18.8Department Store 13.8Leisure & Entertainment / Music & Video
13.4
Beauty & Health 10.6Houseware & Furnishings 9.1Fashion 6.9Supermarket 6.1Services 5.7Gifts / Toys & Hobbies / Books / Sporting Goods
4.5
Education 4.4Shoes & Bags 4.0Jewellery & Watches 1.1Information Technology 0.9Electrical & Electronics 0.7
Food & Beverage 24.8Fashion 11.9Beauty & Health 11.6Services 9.3Department Store 7.9Shoes & Bags 6.5Leisure & Entertainment / Music & Video
6.0
Houseware & Furnishings 5.8Gifts / Toys & Hobbies / Books / Sporting Goods
5.5
Supermarket 3.8Jewellery & Watches 3.0Education 2.3Information Technology 0.9Electrical & Electronics 0.7
By Net Lettable Area
(As at 31 December 2013)
By Gross Rental Income 2
(For the month of December 2013)
1 Based on committed leases. 2 Excludes gross turnover rent.
% of Total Net Lettable Area % of Total Gross Rental Income 2
traDe sector analysis 1(%)
lease exPiry Profile 1(%)
As at 31 December 2013
119

bugis junction
Located in the heart of Singapore’s Civic and Cultural District, Bugis Junction enjoys direct connectivity to the Bugis MRT Interchange Station and is well served by major public bus routes.
In line with its close proximity to the Singapore Management University, LASALLE College of the Arts and School of the Arts, Bugis Junction is positioned as a modern fashion destination mall with exciting dining choices for young adults and PMEBs.
Bugis Junction is also Singapore’s first and only air-conditioned sky-lit shopping arcade to be flanked by charming historic shophouses, representing a showcase of new- and old-world integration.
The integration of Bugis+ and Bugis Junction has created a combined shopping destination with net lettable area of more than 600,000 sq ft.
PortfolioDetails
eugenie YapGeneral Manager
Candy He Leasing
David Gage Peh Marcom
Shirley LimOperations
centre manaGement
Description Five retail levels including a basement level
net Lettable Area (sq ft) 393,983number of Leases 260Car Park Lots 648Title Leasehold tenure of 99 years
with effect from 10 September 1990Acquisition Year 2005Market valuation (S$ million) 901.0Gross Revenue (S$ million) 73.1net Property Income (S$ million) 47.9Committed Occupancy (%) 100.0Annual Shopper Traffic (million) 40.4Key Tenants BHG, Wing Tai Clothing, Auric Pacific,
Cold Storage, TKA AmusementData as at 31 December 2013.Gross Revenue, Net Property Income and Annual Shopper Traffic figures were for the year ended 31 December 2013.
ProPerty information
Clarity120 CapitaMall Trust Annual Report 2013

PortfolioDetails
2014 2015 2016
21.2
29.6
51.8
33.3
19.2
30.1
7.8 7.0
By Net Lettable Area
(As at 31 December 2013)
By Gross Rental Income 2
(For the month of December 2013)
Department Store 26.2Food & Beverage 23.4Fashion 16.9Leisure & Entertainment / Music & Video
8.3
Beauty & Health 6.6Gifts / Toys & Hobbies / Books / Sporting Goods
5.5
Supermarket 4.1Services 2.4Shoes & Bags 2.3Information Technology 2.1Jewellery & Watches 1.7Office 0.3Electrical & Electronics 0.2
Food & Beverage 29.8Fashion 21.7Department Store 14.7Beauty & Health 8.3Gifts / Toys & Hobbies / Books / Sporting Goods
5.5
Jewellery & Watches 4.5Services 3.9Shoes & Bags 3.7Leisure & Entertainment / Music & Video
3.6
Supermarket 2.1Information Technology 1.7Electrical & Electronics 0.4Office 0.1
2017 & Beyond
1 Based on committed leases. 2 Excludes gross turnover rent.
% of Total Net Lettable Area % of Total Gross Rental Income 2
traDe sector analysis 1(%)
lease exPiry Profile 1(%)
As at 31 December 2013
121

sembawang shopping centre
Sembawang Shopping Centre (SSC) was re-developed and re-opened in December 2008. It is situated in close proximity to Yishun and Sembawang MRT stations. The mall provides free shuttle bus services which ply between SSC and the neighbouring estates including Sembawang, Yishun and Woodlands. On weekdays, SSC also operates free lunch-time shuttle bus services to the nearby industrial estates.
With its positioning as a one-stop family-oriented necessity shopping destination, SSC appeals to the residents from the surrounding estates, uniformed personnel from nearby military camps as well as workers from the neighbouring industrial parks.
The mall has a strong cluster of renowned enrichment and educational tenants. This offers a wide variety of developmental classes for children and students, thus strengthening its focus as a family mall.
Ivy AngCenter Manager
Adrian LaiAssistant Centre Manager
Patsy PanLeasing
Zen LeeMarcom
Azman SulaimanOperations
PortfolioDetails
centre manaGement
Description Four retail levels (including a basement level) and three car park levels
net Lettable Area (sq ft) 134,940number of Leases 75Car Park Lots 165Title Leasehold tenure of 999 years
with effect from 26 March 1885Acquisition Year 2005Market valuation (S$ million) 96.0Committed Occupancy (%) 100.0
Annual Shopper Traffic (million) 4.8Key Tenants Cold Storage, Daiso, Auric Pacific,
Esprit, PopularData as at 31 December 2013.Annual Shopper Traffic figure was for the year ended 31 December 2013.
ProPerty information
Clarity122 CapitaMall Trust Annual Report 2013

PortfolioDetails
2014 2015 2016
8.612.6
47.7 49.6
41.735.0
2.0 2.8
By Gross Rental Income 2
(For the month of December 2013)
Food & Beverage 28.3Supermarket 17.7Beauty & Health 13.2Fashion 9.7Houseware & Furnishings 5.5Gifts / Toys & Hobbies / Books / Sporting Goods
4.7
Department Store 4.6Education 4.2Services 4.1Shoes & Bags 2.8Electrical & Electronics 1.8Jewellery & Watches 1.5Leisure & Entertainment / Music & Video
1.4
Information Technology 0.5
Supermarket 29.2Food & Beverage 24.5Department Store 9.0Beauty & Health 8.4Fashion 6.4Gifts / Toys & Hobbies / Books / Sporting Goods
5.9
Education 4.6Houseware & Furnishings 4.4Services 2.0Shoes & Bags 1.9Leisure & Entertainment / Music & Video
1.8
Electrical & Electronics 0.9Jewellery & Watches 0.6Information Technology 0.4
2017 & Beyond
By Net Lettable Area
(As at 31 December 2013)
1 Based on committed leases. 2 Excludes gross turnover rent.
% of Total Net Lettable Area % of Total Gross Rental Income 2
traDe sector analysis 1(%)
lease exPiry Profile 1(%)
As at 31 December 2013
123

rivervale mall
Mustafa Abdul RahimGeneral Manager
Jessica Lee Leasing
Sarah LuaMarcom
Chloe PohOperations
Rivervale Mall is located at the junction of Rivervale Drive and Rivervale Crescent in Sengkang New Town. The mall is strategically situated close to the Rumbia Light Rail Transit (LRT) Station, which is linked to the Sengkang MRT Station. Rivervale Mall also provides a free shuttle bus service within the Sengkang estate.
With its accessible location, the three-storey mall serves as a convenient shopping destination for families and the local community.
PortfolioDetails
centre manaGement
Description Three retail levels and car park at Level 3 (part) and levels 4 to 6
net Lettable Area (sq ft) 81,159number of Leases 65Car Park Lots 178Title Leasehold tenure of 99 years
with effect from 6 December 1997Acquisition Year 2007Market valuation (S$ million) 115.0Committed Occupancy (%) 100.0Annual Shopper Traffic (million) 10.2Key Tenants NTUC, Daiso, McDonald's,
United Overseas Bank, WatsonsData as at 31 December 2013.Annual Shopper Traffic figure was for the year ended 31 December 2013.
ProPerty information
Clarity124 CapitaMall Trust Annual Report 2013
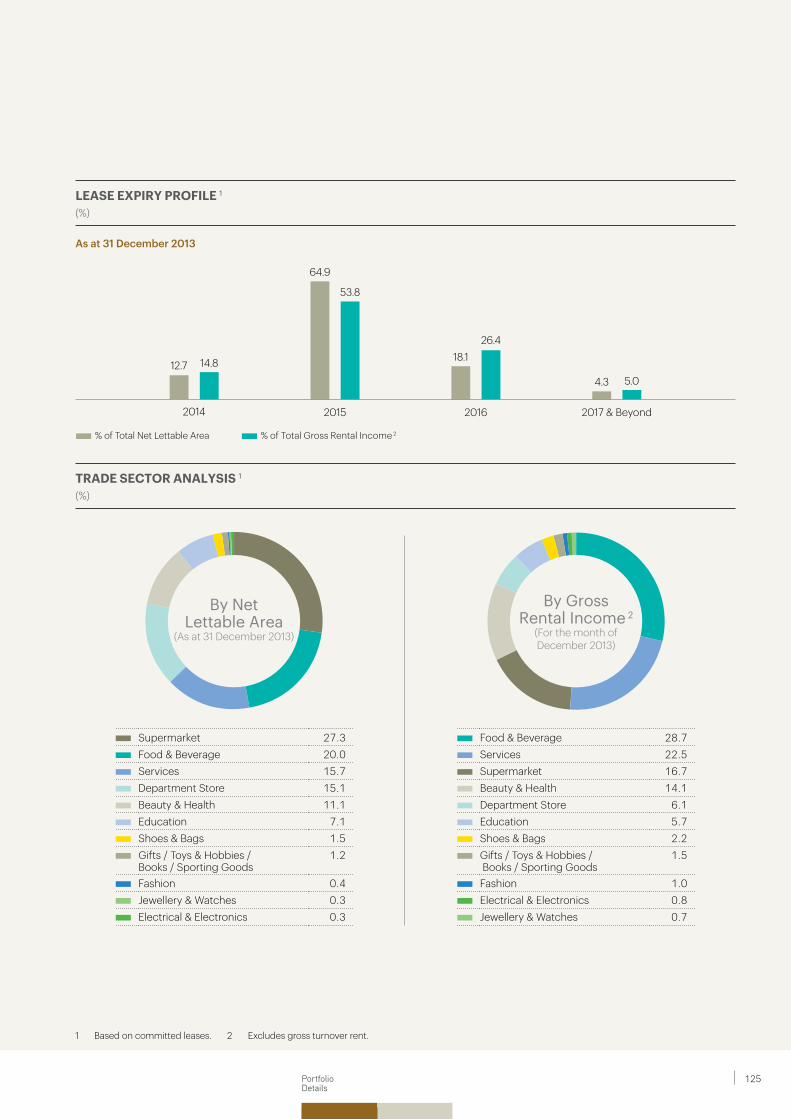
PortfolioDetails
2014 2015 2016
12.7 14.8
64.9
53.8
18.126.4
4.3 5.0
Food & Beverage 28.7Services 22.5Supermarket 16.7Beauty & Health 14.1Department Store 6.1Education 5.7Shoes & Bags 2.2Gifts / Toys & Hobbies / Books / Sporting Goods
1.5
Fashion 1.0Electrical & Electronics 0.8Jewellery & Watches 0.7
Supermarket 27.3Food & Beverage 20.0Services 15.7Department Store 15.1Beauty & Health 11.1Education 7.1Shoes & Bags 1.5Gifts / Toys & Hobbies / Books / Sporting Goods
1.2
Fashion 0.4Jewellery & Watches 0.3Electrical & Electronics 0.3
By Net Lettable Area
(As at 31 December 2013)
By Gross Rental Income 2
(For the month of December 2013)
2017 & Beyond
1 Based on committed leases. 2 Excludes gross turnover rent.
% of Total Net Lettable Area % of Total Gross Rental Income 2
traDe sector analysis 1(%)
lease exPiry Profile 1(%)
As at 31 December 2013
125

jcube
Located across the road from the Jurong East MRT Interchange Station and bus interchange, JCube is an ultra-hip mall with Singapore’s first Olympic-size ice rink and IMAX theatre in the suburbs.
The mall boasts a unique faceted facade inspired by an ice cube, reflecting natural light by day and sparkling by night. With its new-to-market brands and more dining options, JCube is the leisure and entertainment destination for youth, PMEBs and residents who live and work in the western region of Singapore.
Chew Hock ChyeGeneral Manager
Maggie ChuaCentre Manager
Joelle Lee Leasing
Sharon FoongMarcom
Derrick Chan Operations
PortfolioDetails
centre manaGement
Description Five retail levels (including a basement level) and two car park levels
net Lettable Area (sq ft) 210,237number of Leases 120Car Park Lots 341Title Leasehold tenure of 99 years
with effect from 1 March 1991Acquisition Year 2005Market valuation (S$ million) 360.0Gross Revenue (S$ million) 33.8net Property Income (S$ million) 22.0Committed Occupancy (%) 100.0Annual Shopper Traffic (million) 15.2Key Tenants Bals Singapore, Cold Storage,
Paradise Group, Kopitiam, VGO Corporation
Data as at 31 December 2013.Gross Revenue, Net Property Income and Annual Shopper Traffic figures were for the year ended 31 December 2013.
ProPerty information
Clarity126 CapitaMall Trust Annual Report 2013

PortfolioDetails
2014 2015 2016
13.9 11.2
57.0
74.7
11.1 10.918.0
3.2
Food & Beverage 36.2Beauty & Health 12.8Fashion 9.6Gifts / Toys & Hobbies / Books / Sporting Goods
8.8
Services 7.2Leisure & Entertainment / Music & Video
5.6
Houseware & Furnishings 5.5Shoes & Bags 4.5Supermarket 3.5Information Technology 3.0Jewellery & Watches 1.7Education 1.6
Leisure & Entertainment / Music & Video
28.4
Food & Beverage 26.3Gifts / Toys & Hobbies / Books / Sporting Goods
8.1
Beauty & Health 6.8Fashion 6.6Supermarket 5.7Houseware & Furnishings 5.0Services 4.1Shoes & Bags 3.9Information Technology 3.3Education 1.2Jewellery & Watches 0.6
By Net Lettable Area
(As at 31 December 2013)
By Gross Rental Income 2
(For the month of December 2013)
2017 & Beyond
1 Based on committed leases. 2 Excludes gross turnover rent.
% of Total Net Lettable Area % of Total Gross Rental Income 2
traDe sector analysis 1(%)
lease exPiry Profile 1(%)
As at 31 December 2013
127

raffles city singapore
Raffles City Singapore (RCS) is a large integrated development in Singapore. A prime landmark located in the downtown core, at the fringe of Singapore’s Central Business District, and within the Civic and Cultural District.
RCS is served by three MRT lines, directly connected to the City Hall MRT Interchange Station and the Esplanade MRT Station.
The mixed-use development comprises Raffles City Shopping Centre, Raffles City Convention Centre, 42-storey Raffles City Tower, 73-storey Swissôtel The Stamford Singapore, 28-storey twin towers that make up Fairmont Singapore, and three basement car park levels.
CapitaCommercial Trust (CCT) and CMT jointly own the integrated development through RCS Trust, the special purpose trust that holds RCS. RCS Trust was constituted on 18 July 2006 and is 60.00% owned by CCT and 40.00% owned by CMT.
Margaret KhooGeneral Manager
Rachel ChuLeasing
Jacke Chye Marcom
Ong Soon Ann Operations
PortfolioDetails
centre manaGement
ProPerty information
Description A mixed-use development comprising a shopping centre, an office tower, two hotels and a convention centre
net Lettable Area (sq ft) Retail: 420,995, Office: 380,927, Total: 801,922
number of Leases Retail: 224, Office: 54, Hotels & Convention Centre: 1, Total: 279
Car Park Lots 1,045Title Leasehold tenure of 99 years
with effect from 16 July 1979Acquisition Year 2006Market valuation (S$ million) 3,018.0 (100.00% interest)
1,207.2 (40.00% interest)Gross Revenue (S$ million) 90.3 (40.00% interest)net Property Income (S$ million) 66.4 (40.00% interest)Committed Occupancy (%) Retail: 100.0, Office: 100.0, Total: 100.0Annual Shopper Traffic (million) 35.2Key Tenants 1 Robinson & Co., Wing Tai Clothing,
Jay Gee Enterprises, TES 07 Pte. Ltd., Auric Pacific
Data as at 31 December 2013.Gross Revenue, Net Property Income and Annual Shopper Traffic figures were for the year ended 31 December 2013.
Clarity128 CapitaMall Trust Annual Report 2013

PortfolioDetails
Retail 1 48.9Hotels & Convention Centre 31.8Office 19.3
Food & Beverage 28.7Fashion 2 23.5Department Store 12.9Others 3 9.0Beauty & Health 8.0Shoes & Bags 2 7.6Sundry & Services 4.8Supermarket 2.4Gifts & Souvenirs 2 1.7Jewellery / Watches / Pen 2 1.4
By Gross Rental Income
(For the month of December 2013)
2014 2015 2016 2017
15.8
1.6
13.5
7.1
17.6
4.3 5.32.0 1.0
31.8
2018 & Beyond
Retail 1 Office Hotel
1 Based on committed gross rental income and excludes gross turnover rent. 2 As compared to 2012, the variance is mainly due to reclassification of some trades to ‘Others - Luxury’ business sector.3 Others include Luxury, Books & Stationery, Sporting Goods & Apparel, Electrical & Electronics, Houseware & Furnishings, Art Gallery, Music & Video,
Toys & Hobbies and Information Technology.
By Gross Rental Income
(For the month of December 2013)
traDe sector analysis 1 – retail only(%)
major usaGe mix(%)
lease exPiry Profile 1(%)
As at 31 December 2013
129

lot one shoppers’ mall
Lot One Shoppers’ Mall is situated in the heart of the Choa Chu Kang housing estate, in the north-western region of Singapore. The mall is well connected by major arterial roads and is next to the Choa Chu Kang MRT/LRT stations and bus interchange.
The mall enjoys a large shopper catchment, comprising residents in the Choa Chu Kang, Bukit Panjang, Bukit Batok and Upper Bukit Timah precincts, uniformed personnel from military camps in the vicinity as well as students from nearby schools.
Callie YahGeneral Manager
Andrew YongAssistant CentreManager
Chrisy GohLeasing
Saudah Mohd noor Marcom
eddie LimOperations
PortfolioDetails
centre manaGement
Description Six retail levels (including a basement level) and two basement car park levels
net Lettable Area (sq ft) 219,837number of Leases 159Car Park Lots 324Title Leasehold tenure of 99 years
with effect from 1 December 1993Acquisition Year 2007Market valuation (S$ million) 485.0Gross Revenue (S$ million) 42.0net Property Income (S$ million) 28.9Committed Occupancy (%) 100.0Annual Shopper Traffic (million) 17.4Key Tenants NTUC, Auric Pacific, Courts, BHG,
KFC/Pizza HutData as at 31 December 2013.Gross Revenue, Net Property Income and Annual Shopper Traffic figures were for the year ended 31 December 2013.
ProPerty information
Clarity130 CapitaMall Trust Annual Report 2013
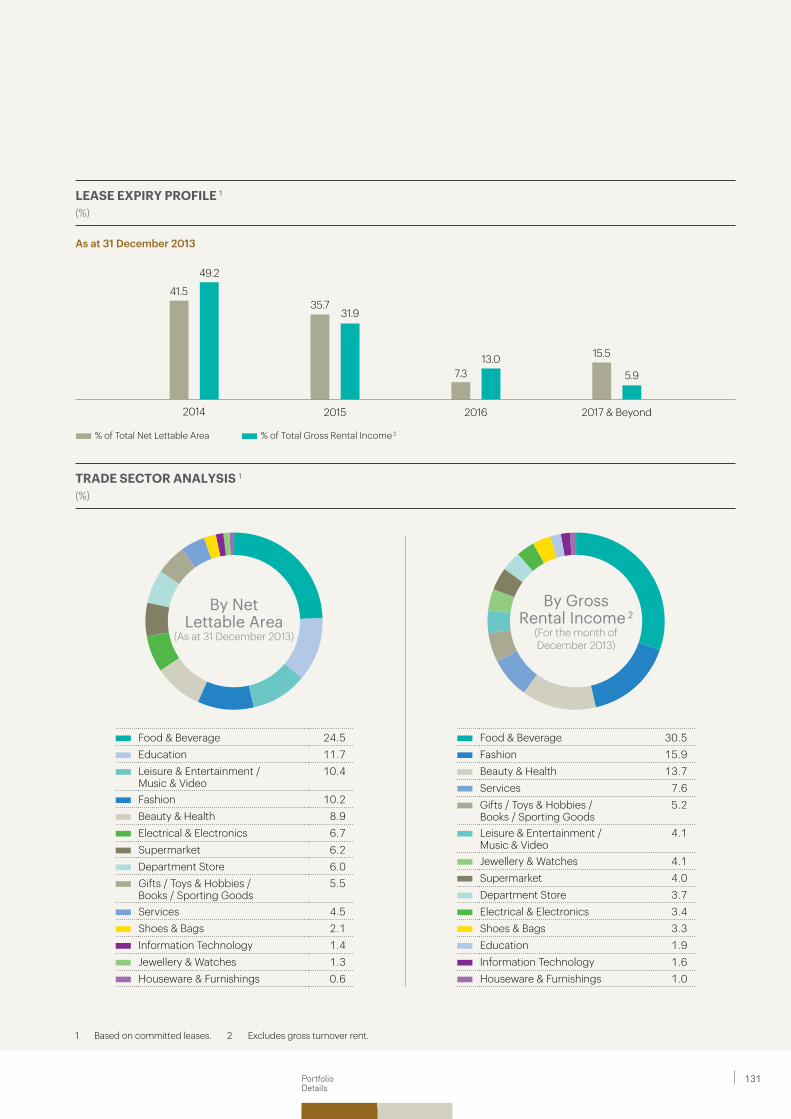
PortfolioDetails
2014 2015 2016
41.5
49.2
35.731.9
7.313.0 15.5
5.9
Food & Beverage 30.5Fashion 15.9Beauty & Health 13.7Services 7.6Gifts / Toys & Hobbies / Books / Sporting Goods
5.2
Leisure & Entertainment / Music & Video
4.1
Jewellery & Watches 4.1Supermarket 4.0Department Store 3.7Electrical & Electronics 3.4Shoes & Bags 3.3Education 1.9Information Technology 1.6Houseware & Furnishings 1.0
Food & Beverage 24.5Education 11.7Leisure & Entertainment / Music & Video
10.4
Fashion 10.2Beauty & Health 8.9Electrical & Electronics 6.7Supermarket 6.2Department Store 6.0Gifts / Toys & Hobbies / Books / Sporting Goods
5.5
Services 4.5Shoes & Bags 2.1Information Technology 1.4Jewellery & Watches 1.3Houseware & Furnishings 0.6
By Net Lettable Area
(As at 31 December 2013)
By Gross Rental Income 2
(For the month of December 2013)
2017 & Beyond
1 Based on committed leases. 2 Excludes gross turnover rent.
% of Total Net Lettable Area % of Total Gross Rental Income 2
traDe sector analysis 1(%)
lease exPiry Profile 1(%)
As at 31 December 2013
131

bukit Panjang Plaza
Bukit Panjang Plaza (BPP) is located in the high-density residential area of Bukit Panjang New Town, in the north-western region of Singapore. Besides the surrounding estates of Bukit Panjang, Cashew Park, Chestnut Drive and Hillview, BPP also caters to families and residents in Teck Whye, Choa Chu Kang and Upper Bukit Timah precincts.
The mall is conveniently located between the Bukit Panjang and Senja LRT stations, and is adjacent to the Bukit Panjang Bus Interchange. This bus interchange will be redeveloped and integrated with the new Bukit Panjang MRT Station serving the Downtown Line. The planned transportation hub is scheduled to open in 2015.
Callie YahGeneral Manager
Sabrina LaiCentre Manager
Chrisy Goh Leasing
Saudah Mohd noorMarcom
Jeffrey LowOperations
PortfolioDetails
centre manaGement
Description Four retail levels and two basement car park levels
net Lettable Area (sq ft) 152,307number of Leases 111Car Park Lots 332Title Leasehold tenure of 99 years
with effect from 1 December 1994Acquisition Year 2007Market valuation (S$ million) 274.0Gross Revenue (S$ million) 25.9net Property Income (S$ million) 16.7Committed Occupancy (%) 99.8Annual Shopper Traffic (million) 13.5Key Tenants NTUC, Kopitiam, KFC/Pizza Hut,
McDonald's, Cold StorageData as at 31 December 2013.Gross Revenue, Net Property Income and Annual Shopper Traffic figures were for the year ended 31 December 2013.
ProPerty information
Clarity132 CapitaMall Trust Annual Report 2013

PortfolioDetails
2014 2015 2016
8.515.0
30.2 28.0
54.550.5
6.8 6.5
Food & Beverage 37.7Beauty & Health 16.7Supermarket 10.9Services 10.0Fashion 5.3Gifts / Toys & Hobbies / Books / Sporting Goods
3.7
Others 3.2Jewellery & Watches 2.7Electrical & Electronics 2.6Department Store 2.1Shoes & Bags 2.0Houseware & Furnishings 1.7Leisure & Entertainment / Music & Video
0.8
Information Technology 0.6
Food & Beverage 28.8Supermarket 18.2Beauty & Health 11.5Others 9.5Department Store 6.1Electrical & Electronics 6.0Gifts / Toys & Hobbies / Books / Sporting Goods
5.8
Services 5.7Fashion 3.5Shoes & Bags 1.2Houseware & Furnishings 1.1Leisure & Entertainment / Music & Video
1.0
Jewellery & Watches 1.0Information Technology 0.6
By Net Lettable Area
(As at 31 December 2013)
By Gross Rental Income 2
(For the month of December 2013)
2017 & Beyond
1 Based on committed leases. 2 Excludes gross turnover rent.
% of Total Net Lettable Area % of Total Gross Rental Income 2
traDe sector analysis 1(%)
lease exPiry Profile 1(%)
As at 31 December 2013
133

the atrium@orchard
Following the completion of an asset enhancement initiative in October 2012, The Atrium@Orchard has been transformed from a predominantly office building into a mixed-use development.
Boasting direct links to Plaza Singapura at levels 1, 3 and 4, the retail podium now offers more than 135,000 sq ft of additional shopping space to house new retail and dining stores targeting trendy young adults and PMEBs. The development also enjoys direct connectivity to the Dhoby Ghaut MRT Interchange Station, which connects three MRT lines – the North South Line, the North East Line, and the Circle Line.
Melissa AngGeneral Manager
Lun Hwee Hsien Centre Manager
Carol TayLeasing
June AngMarcom
Chin Cheong LeongOperations
PortfolioDetails
centre manaGement
Description A mixed-use development comprising three levels of retail space, two Grade A office towers and two basement car park levels.
net Lettable Area (sq ft) Retail: 137,053, Office: 252,308, Total: 389,361
number of Leases Retail: 85, Office: 13, Total: 98Car Park Lots 128Title Leasehold tenure of 99 years
with effect from 15 August 2008Acquisition Year 2008Market valuation (S$ million) 722.0Gross Revenue (S$ million) 49.6net Property Income (S$ million) 36.7Committed Occupancy (%) Retail: 98.5, Office: 100.0, Total: 99.5Annual Shopper Traffic (million) 23.4Key Tenants Temasek Holdings, Wing Tai Clothing,
F J Benjamin, Auric Pacific, Fullerton Fund Management
Data as at 31 December 2013.Gross Revenue, Net Property Income and Annual Shopper Traffic figures were for the year ended 31 December 2013.
ProPerty information
Clarity134 CapitaMall Trust Annual Report 2013

PortfolioDetails
2014 2015 2016
1.7 2.3
17.0
29.3
11.617.5
69.7
50.9
2017 & Beyond
By Net Lettable Area
(As at 31 December 2013)
Office 64.9Fashion 10.5Food & Beverage 9.9Beauty & Health 6.2Services 3.3Shoes & Bags 2.7Gifts / Toys & Hobbies / Books / Sporting Goods
1.6
Houseware & Furnishings 0.5Electrical & Electronics 0.3Jewellery & Watches 0.1
Office 42.3Fashion 16.7Food & Beverage 15.8Beauty & Health 12.0Services 5.5Shoes & Bags 4.0Gifts / Toys & Hobbies / Books / Sporting Goods
2.2
Houseware & Furnishings 0.9Electrical & Electronics 0.4Jewellery & Watches 0.2
By Gross Rental Income 2
(For the month of December 2013)
1 Based on committed leases. 2 Excludes gross turnover rent.
% of Total Net Lettable Area % of Total Gross Rental Income 2
traDe sector analysis 1(%)
lease exPiry Profile 1(%)
As at 31 December 2013
135

clarke Quay
Clarke Quay is a unique conserved historical landmark located along the Singapore River and at the fringe of Singapore’s Central Business District. It is within walking distance of the Clarke Quay MRT Station, making it accessible by public transportation. Comprising five blocks of restored shophouses and warehouses, Clarke Quay plays host to a wide range of restaurants, wine bars, entertainment spots and retail shops.
Clarke Quay completed its asset enhancement initiative for Block C and Block E in January 2013. Retail space was recovered from an anchor tenant and together with the common area at Block E, a new row of F&B and entertainment shops was created facing River Valley Road. The new shops have added much vibrancy to the otherwise quiet road front.
PortfolioDetails
Ong Kee Leng Centre Manager
William Tan Leasing
Tanya Fum Marcom
Kwong Wing Kwee Operations
centre manaGement
Phot
o C
redi
t: Kw
ek S
wee
Sen
g, S
inga
pore
Description A premier F&B, entertainment and lifestyle riverfront destination
net Lettable Area (sq ft) 291,111number of Leases 76Car Park Lots 424Title Leasehold tenure of 99 years
with effect from 13 January 1990Acquisition Year 2010Market valuation (S$ million) 347.0Gross Revenue (S$ million) 37.3net Property Income (S$ million) 23.1Committed Occupancy (%) 100.0Annual Shopper Traffic (million) 11.7Key Tenants Luminox, The Quayside Group,
Shanghai Dolly, Katrina Holdings, Attica
Data as at 31 December 2013.Gross Revenue, Net Property Income and Annual Shopper Traffic figures were for the year ended 31 December 2013.
ProPerty information
Clarity136 CapitaMall Trust Annual Report 2013

PortfolioDetails
2014 2015 2016
25.722.8
19.924.0
21.626.4
32.8
26.8
Food & Beverage 49.8Leisure & Entertainment / Music & Video
43.3
Office 5.2Gifts / Toys & Hobbies / Books / Sporting Goods
1.3
Services 0.4
Leisure & Entertainment / Music & Video
51.0
Food & Beverage 33.7Office 11.4Gifts / Toys & Hobbies / Books / Sporting Goods
3.8
Services 0.1
By Net Lettable Area
(As at 31 December 2013)
By Gross Rental Income 2
(For the month of December 2013)
2017 & Beyond
1 Based on committed leases. 2 Excludes gross turnover rent.
% of Total Net Lettable Area % of Total Gross Rental Income 2
traDe sector analysis 1(%)
lease exPiry Profile 1(%)
As at 31 December 2013
137

bugis+
Bugis+ is strategically located in the heart of Singapore’s Civic and Cultural District directly opposite Bugis Junction. It is directly connected by an overhead link-bridge to the second storey of Bugis Junction which allows easy access to the Bugis MRT Interchange Station.
With the completion of its enhancement works to improve its efficiency and layout in 2012, Bugis+ is now a vibrant mall with endless entertainment, exciting F&B and stylish fashion trade mix, creating a dynamic magnet for fun-seeking trendy youths in the heart of Bugis.
The integration of Bugis+ and Bugis Junction created a combined shopping destination with net lettable area of more than 600,000 sq ft.
PortfolioDetails
eugenie Yap General Manager
Candy He Leasing
David Gage Peh Marcom
Shirley Lim Operations
centre manaGement
Description Seven retail–cum–entertainment levels, including a single level overhead link-bridge. Multi-storey car park with direct access into the mall at levels 3 and 4.
net Lettable Area (sq ft) 214,420number of Leases 96Car Park Lots 325Title Leasehold tenure of 60 years with
effect from 30 September 2005Acquisition Year 2011Market valuation (S$ million) 330.0Gross Revenue (S$ million) 31.4net Property Income (S$ million) 21.3Committed Occupancy (%) 100.0Annual Shopper Traffic (million) 21.0Key Tenants Jay Gee Enterprises, Hansfort
Investment, Wing Tai Clothing, RSH Singapore Pte Ltd, Komars Management
Data as at 31 December 2013.Gross Revenue, Net Property Income and Annual Shopper Traffic figures were for the year ended 31 December 2013.
ProPerty information
Clarity138 CapitaMall Trust Annual Report 2013

PortfolioDetails
2014 2015 2016
5.2 4.3
49.655.8
17.9
26.7 27.3
13.2
Leisure & Entertainment / Music & Video 3
38.4
Fashion 33.9Food & Beverage 11.8Gifts / Toys & Hobbies / Books / Sporting Goods
6.6
Beauty & Health 5.8Shoes & Bags 1.9Services 1.0Jewellery & Watches 0.6
Leisure & Entertainment / Music & Video 3
62.6
Fashion 23.1Food & Beverage 6.2Gifts / Toys & Hobbies / Books / Sporting Goods
3.7
Beauty & Health 3.1Shoes & Bags 0.7Services 0.4Jewellery & Watches 0.2
By Net Lettable Area
(As at 31 December 2013)
By Gross Rental Income 2
(For the month of December 2013)
2017 & Beyond
1 Based on committed leases. 2 Excludes gross turnover rent. 3 Include tenants approved as thematic dining, entertainment and a performance centre.
% of Total Net Lettable Area % of Total Gross Rental Income 2
traDe sector analysis 1(%)
lease exPiry Profile 1(%)
As at 31 December 2013
139

Westgate
Westgate, the premier family and lifestyle mall in the west of Singapore, opened on 2 December 2013. The mall offers the city lifestyle shopping experience with many popular brands. Strategically located in Jurong Gateway, it caters to a catchment population of over a million.
Westgate is the only mall with direct connections to Jurong East MRT Interchange Station and future bus interchange, and amenities such as the Ng Teng Fong General Hospital. The mall offers a holistic shopping experience with many unique features like the naturally ventilated Courtyard, an array of alfresco dining options and thematic children’s playgrounds.
On 23 January 2014, a consortium entered into sales and purchase agreements to purchase Westgate Tower for S$579.4 million.
PortfolioDetails
Chew Hock ChyeGeneral Manager
eddie Lim Centre Manager
Tan Kor Hoon Leasing
Steve ng Marcom
Soe PaingOperations
centre manaGement
ProPerty information
Description Seven retail levels (including two basement levels) and two basement car park levels
net Lettable Area (sq ft) 410,332number of Leases 214Car Park Lots 600Title Leasehold tenure of 99 years
with effect from 29 August 2011Acquisition Year 2011 1
Market valuation (S$ million) 1,054.0 (100.00% interest)316.2 (30.00% interest)
Gross Revenue (S$ million) 1.3 (30.00% interest) 2
net Property Income (S$ million) (2.3) (30.00% interest) 2
Committed Occupancy (%) 85.8 2
Key Tenants Isetan, BreadTalk, Courts, Samsung, Fitness First
Data as at 31 December 2013.Gross Revenue and Net Property Income figures were for the year ended 31 December 2013.
1 Refers to the year in which the development site was acquired.2 Westgate was under development and commenced mall operations on 2 December 2013.
Clarity140 CapitaMall Trust Annual Report 2013

PortfolioDetails
2014 2015 2016
2.9 0.2 0.0 0.0 3.5 5.9
93.6 93.9
Food & Beverage 32.0Fashion 17.8Beauty & Health 11.1Services 10.5Department Store 9.3Gifts / Toys & Hobbies / Books / Sporting Goods
4.1
Electrical & Electronics 3.7Shoes & Bags 2.9Education 2.9Information Technology 2.4Houseware & Furnishings 1.7Jewellery & Watches 1.6
Food & Beverage 25.5Fashion 19.9Department Store 18.0Services 7.7Beauty & Health 7.2Education 6.2Electrical & Electronics 5.0Gifts / Toys & Hobbies / Books / Sporting Goods
4.1
Houseware & Furnishings 2.2Shoes & Bags 1.8Information Technology 1.6Jewellery & Watches 0.8
By Net Lettable Area
(As at 31 December 2013)
By Gross Rental Income 2
(For the month of December 2013)
2017 & Beyond
1 Based on committed leases. 2 Excludes gross turnover rent.
% of Total Net Lettable Area % of Total Gross Rental Income 2
traDe sector analysis 1(%)
lease exPiry Profile 1(%)
As at 31 December 2013
141

CapitaRetailChina Trust
31 December 2013, the total asset size of CRCT was approximately S$2.2 billion.
All the malls in the portfolio are positioned as one-stop family-oriented shopping, dining and entertainment destinations for the sizeable population catchment areas in which they are located, and are accessible via major transportation routes or access points. A significant portion of the properties’ tenancies consists of major international and domestic retailers such as Wal-Mart, Carrefour and Beijing Hualian Group under master leases or long-term leases, which provide CRCT unitholders with stable and sustainable returns. The anchor tenants are complemented by popular specialty brands such as UNIQLO, ZARA, Vero Moda, Sephora, Watsons, KFC, Pizza Hut and BreadTalk.
CRCT has long-term growth potential from its right of first refusal arrangements to acquire assets held by CapitaMalls Asia Limited (CMA) sponsored private funds, CapitaMalls China Income Fund, CapitaMalls China Income Fund II (previously known as CapitaMalls China Incubator Fund), CapitaMalls China Income Fund III (previously known as CapitaMalls China Development Fund II), CapitaMalls China Development Fund III, as well as CMA, one of the largest listed shopping mall developers, owners and managers in Asia.
In July 2013, CMA secured CapitaMall Grand Canyon
through a public tender and CRCT exercised its right of first refusal to acquire it. CRCT completed the acquisition on 30 December 2013. With the enlarged portfolio of quality malls, CRCT is well positioned to tap on the growing consumption trend in China.
CRCT delivered a strong set of results for the financial year 2013 (FY 2013). Gross revenue and net property income were RMB795.0 million (S$160.1 million) and RMB511.7 million (S$103.0 million), up 3.5% and 2.0% respectively from that for financial year 2012. Distributable income grew 4.9% year-on-year to S$70.1 million. Distribution per unit (DPU) in FY 2013 was 9.02 Singapore cents. Shopper traffic and tenants’ sales at CRCT’s malls grew 5.4% 1 and 9.2% 1 respectively compared to the previous year. Across the portfolio, CRCT achieved strong rental reversion of 13.8% 2 and operated at a high occupancy rate of 98.2%.
CMT holds 122.7 million units in CapitaRetail China Trust (CRCT), which translates to an approximate 15.28% stake as at 31 December 2013. The fair value of CMT’s investment in CRCT represents 1.6% of CMT and its subsidiaries’ (CMT Group) total asset size as at 31 December 2013. Through its investment in CRCT, CMT’s Unitholders are provided with an opportunity to enjoy the upside from China’s growth potential without CMT’s risk profile being significantly altered.
CRCT is the first and only China shopping mall REIT listed in Singapore, with a portfolio of 10 income-producing shopping malls. Listed on the Singapore Exchange Securities Trading Limited (SGX-ST) on 8 December 2006, it is established with the objective of investing in a diversified portfolio of income-producing real estate used primarily for retail purposes and located primarily in China, Hong Kong and Macau.
CRCT’s geographically diversified portfolio of quality shopping malls is located in six cities in China. The malls are CapitaMall Xizhimen, CapitaMall Wangjing, CapitaMall Grand Canyon, CapitaMall Shuangjing and CapitaMall Anzhen in Beijing; CapitaMall Qibao in Shanghai; CapitaMall Erqi in Zhengzhou, Henan Province; CapitaMall Saihan in Huhhot, Inner Mongolia; CapitaMall Wuhu in Wuhu, Anhui Province; and CapitaMall Minzhongleyuan in Wuhan, Hubei Province. As at
1 Includes multi-tenanted malls except CapitaMall Minzhongleyuan, which is undergoing asset enhancement works and CapitaMall Grand Canyon as the acquisition was completed on 30 December 2013.
2 Excludes CapitaMall Grand Canyon as the acquisition was completed on 30 December 2013.
Clarity142 CapitaMall Trust Annual Report 2013

PortfolioDetails
CapitaMall erqi, Zhengzhou
CapitaMall Anzhen, Beijing
CapitaMall Saihan, Huhhot
CapitaMall Minzhongleyuan, Wuhan CapitaMall Grand Canyon, Beijing
CapitaMall Wangjing, Beijing
CapitaMall Qibao, Shanghai
CapitaMall xizhimen, Beijing CapitaMall Wuhu, Wuhu CapitaMall Shuangjing, Beijing
143


Report of the Trustee 146Statement by the Manager 147Independent Auditors’ Report 148Statements of Financial Position 149Statements of Total Return 150Distribution Statements 151Statements of Movements in
Unitholders’ Funds 153Portfolio Statements 154Statements of Cash Flows 159Notes to the Financial Statements 161
Financial Statements

CapitaMall Trust Annual Report 2013 146 Clarity
Report of the TrusteeYear ended 31 December 2013
HSBC Institutional Trust Services (Singapore) Limited (the “Trustee”) is under a duty to take into custody and hold the assets of CapitaMall Trust (the “Trust”) and its subsidiaries (the “Group”) in trust for the Unitholders. In accordance with the Securities and Futures Act, Chapter 289 of Singapore, its subsidiary legislation and the Code on Collective Investment Schemes, the Trustee shall monitor the activities of CapitaMall Trust Management Limited (the “Manager”) for compliance with the limitations imposed on the investment and borrowing powers as set out in the Trust Deed in each annual accounting period and report thereon to Unitholders in an annual report.
To the best knowledge of the Trustee, the Manager has, in all material respects, managed the Trust during the period covered by these financial statements, set out on pages 149 to 222 in accordance with the limitations imposed on the investment and borrowing powers set out in the Trust Deed.
For and on behalf of the Trustee,HSBC Institutional Trust Services (Singapore) Limited
Antony Wade LewisDirector
Singapore
4 February 2014

FinancialStatements
147
Statement by the ManagerYear ended 31 December 2013
In the opinion of the directors of CapitaMall Trust Management Limited, the accompanying financial statements set out on pages 149 to 222 comprising the Statements of Financial Position and Portfolio Statements of the Group and the Trust as at 31 December 2013, and the Statements of Total Return, Distribution Statements, Statements of Movements in Unitholders’ Funds and Statements of Cash Flows of the Group and of the Trust for the year then ended, and a summary of significant accounting policies and other explanatory information of the Group and of the Trust, are drawn up so as to present fairly, in all material respects, the financial position of the Group and of the Trust as at 31 December 2013, and the total return, distributable income, movements in Unitholders’ funds and cash flows of the Group and of the Trust for the year then ended in accordance with the recommendations of Statement of Recommended Accounting Practice 7 “Reporting Framework for Unit Trusts” issued by the Institute of Singapore Chartered Accountants and the provisions of the Trust Deed. At the date of this statement, there are reasonable grounds to believe that the Group and the Trust will be able to meet their financial obligations as and when they materialise.
For and on behalf of the Manager,CapitaMall Trust Management Limited
Tan Wee Yan, WilsonDirector
Singapore
4 February 2014

CapitaMall Trust Annual Report 2013 148 Clarity
Independent Auditors’ Report Unitholders of CapitaMall Trust(Established in the Republic of Singapore pursuant to a Trust Deed dated 29 October 2001 (as amended))
REPORT ON THE FINANCIAL STATEMENTSWe have audited the accompanying financial statements of CapitaMall Trust (the “Trust”) and its subsidiaries (the “Group”), which comprise the Statements of Financial Position and Portfolio Statements of the Group and the Trust as at 31 December 2013, and the Statements of Total Return, Distribution Statements, Statements of Movements in Unitholders’ Funds and Statements of Cash Flow of the Group and the Trust for the year then ended, and a summary of significant accounting policies and other explanatory information, as set out on pages 149 to 222.
Manager’s responsibility for the financial statementsThe Manager of the Trust is responsible for the preparation and fair presentation of these financial statements in accordance with the recommendations of Statement of Recommended Accounting Practice 7 “Reporting Framework for Unit Trusts” issued by the Institute of Singapore Chartered Accountants, and for such internal control as the Manager of the Trust determines is necessary to enable the preparation of financial statements that are free from material misstatements, whether due to fraud or error.
Auditors’ responsibilityOur responsibility is to express an opinion on these financial statements based on our audit. We conducted our audit in accordance with Singapore Standards on Auditing. Those standards require that we comply with ethical requirements and plan and perform the audit to obtain reasonable assurance about whether the financial statements are free from material misstatement.
An audit involves performing procedures to obtain audit evidence about the amounts and disclosures in the financial statements. The procedures selected depend on the auditor’s judgement, including the assessment of the risks of material misstatement of the financial statements, whether due to fraud or error. In making those risk assessments, the auditor considers internal control relevant to the Trust’s preparation and fair presentation of the financial statements in order to design audit procedures that are appropriate in the circumstances, but not for the purpose of expressing an opinion on the effectiveness of the Trust’s internal control. An audit also includes evaluating the appropriateness of accounting policies used and the reasonableness of accounting estimates made by the Manager of the Trust, as well as evaluating the overall presentation of the financial statements.
We believe that the audit evidence we have obtained is sufficient and appropriate to provide a basis for our audit opinion.
OpinionIn our opinion, the consolidated financial statements of the Group and the financial statements of the Trust present fairly, in all material respects, the financial position of the Group and of the Trust as at 31 December 2013 and the total return, distributable income, movements in Unitholders’ funds and cash flows of the Group and of the Trust for the year then ended in accordance with the recommendations of Statement of Recommended Accounting Practice 7 “Reporting Framework for Unit Trusts” issued by the Institute of Singapore Chartered Accountants.
KPMG LLPPublic Accountants andChartered Accountants
Singapore4 February 2014
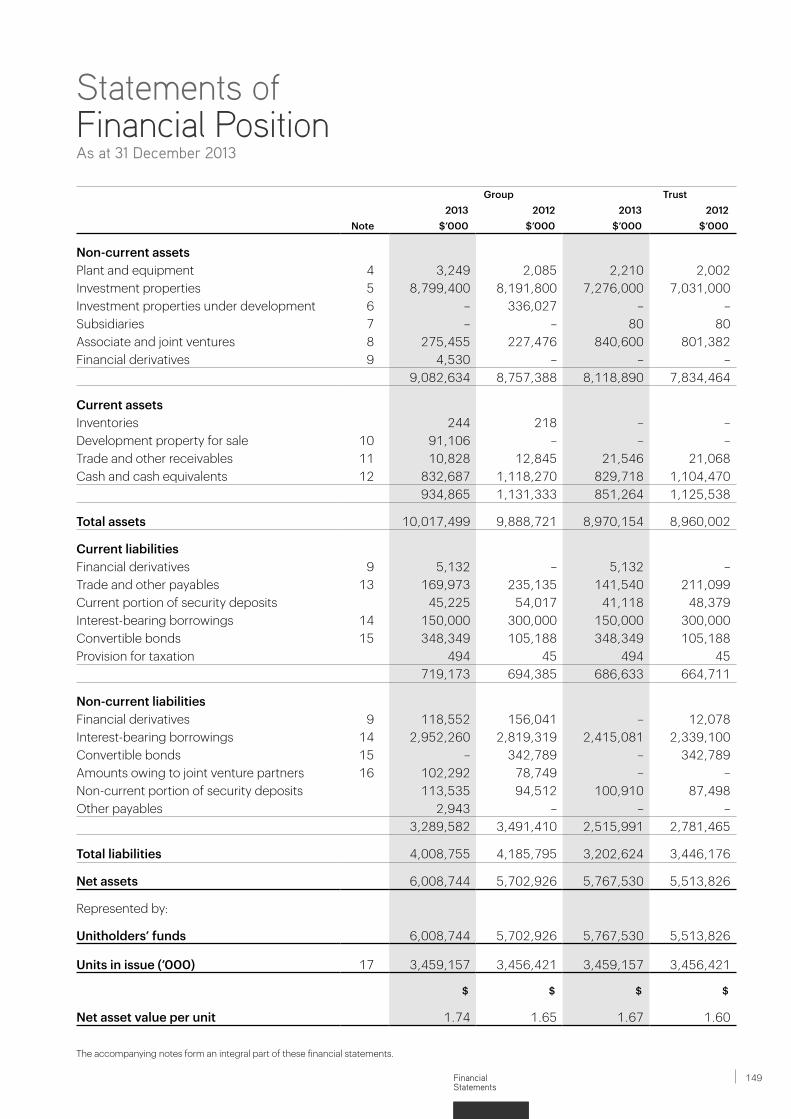
FinancialStatements
149
Statements of Financial PositionAs at 31 December 2013
The accompanying notes form an integral part of these financial statements.
Group Trust2013 2012 2013 2012
Note $’000 $’000 $’000 $’000
Non-current assetsPlant and equipment 4 3,249 2,085 2,210 2,002Investment properties 5 8,799,400 8,191,800 7,276,000 7,031,000Investment properties under development 6 – 336,027 – –Subsidiaries 7 – – 80 80Associate and joint ventures 8 275,455 227,476 840,600 801,382Financial derivatives 9 4,530 – – –
9,082,634 8,757,388 8,118,890 7,834,464
Current assetsInventories 244 218 – –Development property for sale 10 91,106 – – –Trade and other receivables 11 10,828 12,845 21,546 21,068Cash and cash equivalents 12 832,687 1,118,270 829,718 1,104,470
934,865 1,131,333 851,264 1,125,538
Total assets 10,017,499 9,888,721 8,970,154 8,960,002
Current liabilitiesFinancial derivatives 9 5,132 – 5,132 –Trade and other payables 13 169,973 235,135 141,540 211,099Current portion of security deposits 45,225 54,017 41,118 48,379Interest-bearing borrowings 14 150,000 300,000 150,000 300,000Convertible bonds 15 348,349 105,188 348,349 105,188Provision for taxation 494 45 494 45
719,173 694,385 686,633 664,711
Non-current liabilitiesFinancial derivatives 9 118,552 156,041 – 12,078Interest-bearing borrowings 14 2,952,260 2,819,319 2,415,081 2,339,100Convertible bonds 15 – 342,789 – 342,789Amounts owing to joint venture partners 16 102,292 78,749 – –Non-current portion of security deposits 113,535 94,512 100,910 87,498Other payables 2,943 – – –
3,289,582 3,491,410 2,515,991 2,781,465
Total liabilities 4,008,755 4,185,795 3,202,624 3,446,176
Net assets 6,008,744 5,702,926 5,767,530 5,513,826
Represented by:
Unitholders’ funds 6,008,744 5,702,926 5,767,530 5,513,826
Units in issue (’000) 17 3,459,157 3,456,421 3,459,157 3,456,421
$ $ $ $
Net asset value per unit 1.74 1.65 1.67 1.60
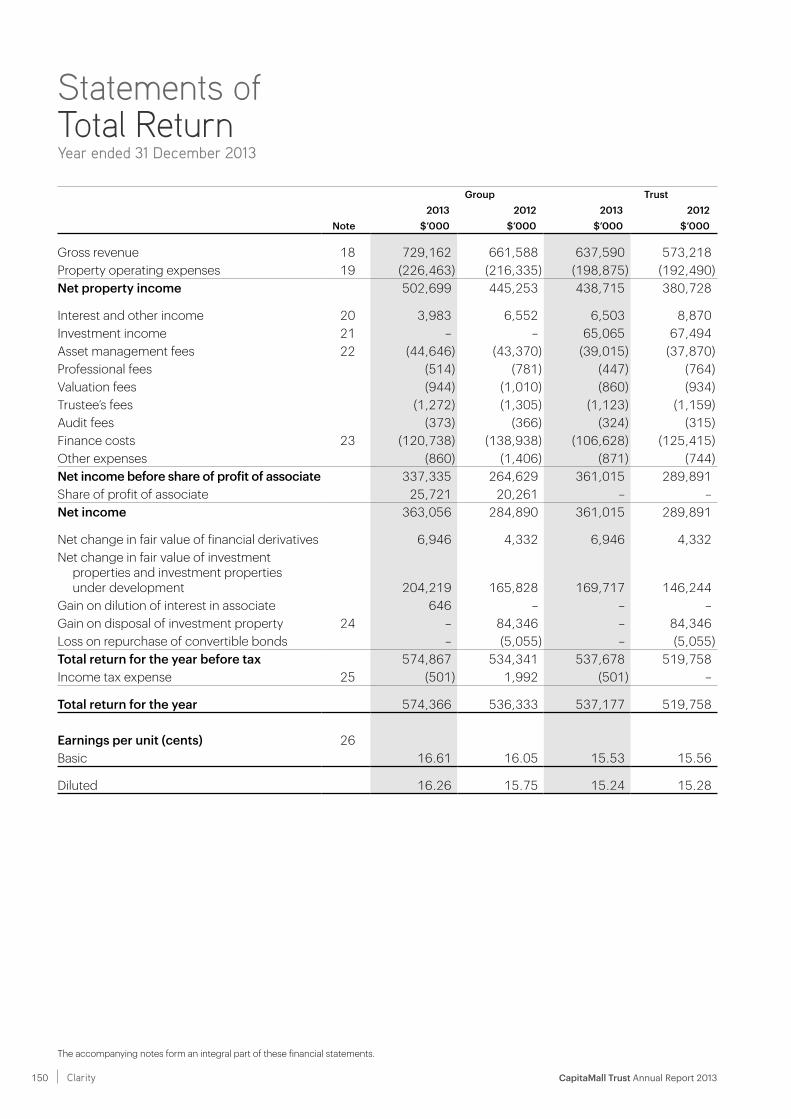
CapitaMall Trust Annual Report 2013 150 Clarity
Statements of Total ReturnYear ended 31 December 2013
The accompanying notes form an integral part of these financial statements.
Group Trust 2013 2012 2013 2012
Note $’000 $’000 $’000 $’000
Gross revenue 18 729,162 661,588 637,590 573,218Property operating expenses 19 (226,463) (216,335) (198,875) (192,490)Net property income 502,699 445,253 438,715 380,728
Interest and other income 20 3,983 6,552 6,503 8,870Investment income 21 – – 65,065 67,494Asset management fees 22 (44,646) (43,370) (39,015) (37,870)Professional fees (514) (781) (447) (764)Valuation fees (944) (1,010) (860) (934)Trustee’s fees (1,272) (1,305) (1,123) (1,159)Audit fees (373) (366) (324) (315)Finance costs 23 (120,738) (138,938) (106,628) (125,415)Other expenses (860) (1,406) (871) (744)Net income before share of profit of associate 337,335 264,629 361,015 289,891Share of profit of associate 25,721 20,261 – –Net income 363,056 284,890 361,015 289,891
Net change in fair value of financial derivatives 6,946 4,332 6,946 4,332Net change in fair value of investment
properties and investment properties under development 204,219 165,828 169,717 146,244
Gain on dilution of interest in associate 646 – – –Gain on disposal of investment property 24 – 84,346 – 84,346Loss on repurchase of convertible bonds – (5,055) – (5,055)Total return for the year before tax 574,867 534,341 537,678 519,758Income tax expense 25 (501) 1,992 (501) –
Total return for the year 574,366 536,333 537,177 519,758
Earnings per unit (cents) 26Basic 16.61 16.05 15.53 15.56
Diluted 16.26 15.75 15.24 15.28

FinancialStatements
151
Distribution StatementsYear ended 31 December 2013
The accompanying notes form an integral part of these financial statements.
Group Trust2013 2012 2013 2012
$’000 $’000 $’000 $’000
Amount available for distribution to Unitholders at beginning of year 33,016 46,752 33,016 46,752
Net income before share of profit of associate 337,335 264,629 361,015 289,891Net tax adjustments (Note A) 24,867 50,109 15,453 40,814Premium paid on the redemption
of convertible bonds (Note B) (9,147) – (9,147) –Rollover adjustment – 1,518 – 1,518Dividend income from subsidiary 3,538 – – –Distribution income from associate 7,595 15,289 – –Net loss from subsidiaries and joint ventures 3,133 678 – –
367,321 332,223 367,321 332,223Amount available for distribution to Unitholders 400,337 378,975 400,337 378,975
Distributions to Unitholders during the year:Distribution of 1.28 cents per unit for period
from 10/11/2011 to 31/12/2011 – (42,604) – (42,604)Distribution of 2.30 cents per unit for period
from 01/01/2012 to 31/03/2012 – (76,572) – (76,572)Distribution of 2.38 cents per unit for period
from 01/04/2012 to 30/06/2012 – (79,253) – (79,253)Distribution of 2.42 cents per unit for period
from 01/07/2012 to 30/09/2012 – (80,604) – (80,604)Distribution of 1.55 cents per unit for period
from 01/10/2012 to 29/11/2012 – (51,637) – (51,637)Distribution of 0.81 cents per unit for period
from 30/11/2012 to 31/12/2012 (27,997) – (27,997) –Distribution of 2.46 cents per unit for period
from 01/01/2013 to 31/03/2013 (85,044) – (85,044) –Distribution of 2.53 cents per unit for period
from 01/04/2013 to 30/06/2013 (87,481) – (87,481) –Distribution of 2.56 cents per unit for period
from 01/07/2013 to 30/09/2013 (88,536) – (88,536) –(289,058) (330,670) (289,058) (330,670)
Amounts retained for general corporate and working capital purposes (Note C) (11,133) (15,289) (11,133) (15,289)
Amount available for distribution to Unitholders at end of the year 100,146 33,016 100,146 33,016

CapitaMall Trust Annual Report 2013 152 Clarity
The accompanying notes form an integral part of these financial statements.
Distribution StatementsYear ended 31 December 2013
Note A – Net tax adjustments comprise:
Group Trust2013 2012 2013 2012
$’000 $’000 $’000 $’000
Non-tax deductible items:– asset management fees paid/payable in units 5,631 5,500 – –– trustee’s fees 1,272 1,305 1,123 1,159– non-deductible interest expenses 7,002 18,935 4,533 16,063– other items 17,611 25,628 16,443 24,851Tax deductible items:– capital allowances/balancing allowances (6,649) (1,259) (6,646) (1,259)Net tax adjustments 24,867 50,109 15,453 40,814
Note BAmount relates to 9.31% premium paid on the remaining $98.25 million in principal amount of the $650.0 million 1.0% Convertible Bonds due 2013 (“Convertible Bonds due 2013”) upon maturity on 2 July 2013. In deriving the distributable income, the premium is eligible for deduction upon payment.
Note CAmount retained for general corporate and working capital in financial year 2013 relates to the capital distribution and tax-exempt income received from CapitaRetail China Trust (“CRCT”) of $7.6 million and tax-exempt special preference dividend income from CapitaRetail Singapore Limited of $3.5 million.
For financial year 2012, this relates to the capital distribution received from CRCT of $15.3 million.

FinancialStatements
153
Statements of Movements in Unitholders’ FundsYear ended 31 December 2013
The accompanying notes form an integral part of these financial statements.
Group Trust2013 2012 2013 2012
$’000 $’000 $’000 $’000
Net assets at beginning of the year 5,702,926 5,246,022 5,513,826 5,072,720
Operations Total return for the year 574,366 536,333 537,177 519,758
Hedging reservesEffective portion of changes in fair value
of cash flow hedges 7,515 (9,080) – –
Movement in foreign currency translation reserves 6,925 7,856 – –
Movement in general reserves 485 447 – –
Unitholders’ transactionsCreation of units– Units issued in respect of RCS Trust’s
asset management fees 5,585 5,479 5,585 5,479– Units issued in respect of placement – 250,000 – 250,000Issue expenses (Note 27) – (3,461) – (3,461)Distributions to Unitholders (289,058) (330,670) (289,058) (330,670)
Net decrease in net assets resulting from Unitholders’ transactions (283,473) (78,652) (283,473) (78,652)
Net assets at end of the year 6,008,744 5,702,926 5,767,530 5,513,826

CapitaMall Trust Annual Report 2013 154 Clarity
The accompanying notes form an integral part of these financial statements.
Portfolio StatementsAs at 31 December 2013
GROUPOccupancy Ratesas at 31 December At Valuation
Percentage ofTotal Net Assets
RemainingTerm of Lease
2013 2012 2013 2012 2013 2012Description of Property Tenure of Land Term of Lease Location Existing Use % % $’000 $’000 % %
Investment properties in Singapore
Tampines Mall Leasehold 99 years 78 years 4 Tampines Central 5, Singapore Commercial 100.0 100.0 852,000 827,000 14.2 14.5
Junction 8 Leasehold 99 years 77 years 9 Bishan Place, Singapore Commercial 99.4 99.6 636,000 617,000 10.6 10.8
Funan DigitaLife Mall Leasehold 99 years 65 years 109 North Bridge Road, Singapore Commercial 98.2 100.0 358,000 354,000 6.0 6.2
IMM Building Leasehold 60 years 35 years 2 Jurong East Street 21, Singapore CommercialWarehouse
99.196.3
98.499.7
632,000 608,000 10.5 10.7
Plaza Singapura Freehold – – 68 Orchard Road, Singapore Commercial 100.0 91.3 1,168,000 1,106,000 19.4 19.4
Bugis Junction Leasehold 99 years 76 years 200 Victoria Street, Singapore Commercial 100.0 100.0 901,000 879,000 15.0 15.4
Sembawang Shopping Centre Leasehold 999 years 870 years 604 Sembawang Road, Singapore Commercial 100.0 100.0 96,000 93,000 1.6 1.6
JCube Leasehold 99 years 76 years 2 Jurong East Central 1, Singapore Commercial 100.0 99.6 360,000 340,000 6.0 6.0
Lot One Shoppers’ Mall Leasehold 99 years 79 years 21 Choa Chu Kang Avenue 4, Singapore
Commercial 100.0 99.8 485,000 467,000 8.1 8.2
Bukit Panjang Plaza Leasehold 99 years 80 years 1 Jelebu Road, Singapore Commercial 99.8 100.0 274,000 270,000 4.5 4.7
Rivervale Mall Leasehold 99 years 83 years 11 Rivervale Crescent, Singapore Commercial 100.0 100.0 115,000 106,000 1.9 1.9
The Atrium@Orchard Leasehold 99 years 94 years 60A & 60B Orchard Road, Singapore Commercial 99.5 95.3 722,000 717,000 12.0 12.6
Clarke Quay Leasehold 99 years 75 years 3A/B/C/D/E River Valley Road, Singapore
Commercial 100.0 97.9 347,000 325,000 5.8 5.7
Bugis+ Leasehold 60 years 52 years 201 Victoria Street, Singapore Commercial 100.0 99.5 330,000 322,000 5.5 5.6
40.0% interest in Raffles City Singapore
Leasehold 99 years 65 years 250 & 252 North Bridge Road, 2 Stamford Road and
80 Bras Basah Road, Singapore
RetailOffice
Hotel
100.0100.0
NA
100.0100.0
NA
1,207,200 1,160,800 20.1 20.4
30.0% interest in Westgate 2 Leasehold 99 years 97 years 3 Gateway Drive, Singapore Commercial 85.8 NA 316,200 – 5.2 –
Investment properties, at valuation 8,799,400 8,191,800 146.4 143.7Investment in associate (Note 8) 178,808 152,592 3.0 2.7
8,978,208 8,344,392 149.4 146.4Other assets and liabilities (net) (2,969,464) (2,641,466) (49.4) (46.4)Net assets 6,008,744 5,702,926 100.0 100.0

FinancialStatements
155
GROUPOccupancy Ratesas at 31 December At Valuation
Percentage ofTotal Net Assets
RemainingTerm of Lease
2013 2012 2013 2012 2013 2012Description of Property Tenure of Land Term of Lease Location Existing Use % % $’000 $’000 % %
Investment properties in Singapore
Tampines Mall Leasehold 99 years 78 years 4 Tampines Central 5, Singapore Commercial 100.0 100.0 852,000 827,000 14.2 14.5
Junction 8 Leasehold 99 years 77 years 9 Bishan Place, Singapore Commercial 99.4 99.6 636,000 617,000 10.6 10.8
Funan DigitaLife Mall Leasehold 99 years 65 years 109 North Bridge Road, Singapore Commercial 98.2 100.0 358,000 354,000 6.0 6.2
IMM Building Leasehold 60 years 35 years 2 Jurong East Street 21, Singapore CommercialWarehouse
99.196.3
98.499.7
632,000 608,000 10.5 10.7
Plaza Singapura Freehold – – 68 Orchard Road, Singapore Commercial 100.0 91.3 1,168,000 1,106,000 19.4 19.4
Bugis Junction Leasehold 99 years 76 years 200 Victoria Street, Singapore Commercial 100.0 100.0 901,000 879,000 15.0 15.4
Sembawang Shopping Centre Leasehold 999 years 870 years 604 Sembawang Road, Singapore Commercial 100.0 100.0 96,000 93,000 1.6 1.6
JCube Leasehold 99 years 76 years 2 Jurong East Central 1, Singapore Commercial 100.0 99.6 360,000 340,000 6.0 6.0
Lot One Shoppers’ Mall Leasehold 99 years 79 years 21 Choa Chu Kang Avenue 4, Singapore
Commercial 100.0 99.8 485,000 467,000 8.1 8.2
Bukit Panjang Plaza Leasehold 99 years 80 years 1 Jelebu Road, Singapore Commercial 99.8 100.0 274,000 270,000 4.5 4.7
Rivervale Mall Leasehold 99 years 83 years 11 Rivervale Crescent, Singapore Commercial 100.0 100.0 115,000 106,000 1.9 1.9
The Atrium@Orchard Leasehold 99 years 94 years 60A & 60B Orchard Road, Singapore Commercial 99.5 95.3 722,000 717,000 12.0 12.6
Clarke Quay Leasehold 99 years 75 years 3A/B/C/D/E River Valley Road, Singapore
Commercial 100.0 97.9 347,000 325,000 5.8 5.7
Bugis+ Leasehold 60 years 52 years 201 Victoria Street, Singapore Commercial 100.0 99.5 330,000 322,000 5.5 5.6
40.0% interest in Raffles City Singapore
Leasehold 99 years 65 years 250 & 252 North Bridge Road, 2 Stamford Road and
80 Bras Basah Road, Singapore
RetailOffice
Hotel
100.0100.0
NA
100.0100.0
NA
1,207,200 1,160,800 20.1 20.4
30.0% interest in Westgate 2 Leasehold 99 years 97 years 3 Gateway Drive, Singapore Commercial 85.8 NA 316,200 – 5.2 –
Investment properties, at valuation 8,799,400 8,191,800 146.4 143.7Investment in associate (Note 8) 178,808 152,592 3.0 2.7
8,978,208 8,344,392 149.4 146.4Other assets and liabilities (net) (2,969,464) (2,641,466) (49.4) (46.4)Net assets 6,008,744 5,702,926 100.0 100.0
1

CapitaMall Trust Annual Report 2013 156 Clarity
Portfolio StatementsAs at 31 December 2013
The accompanying notes form an integral part of these financial statements.
TRUST Occupancy Ratesas at 31 December At Valuation
Percentage ofTotal Net Assets
RemainingTerm of Lease
2013 2012 2013 2012 2013 2012Description of Property Tenure of Land Term of Lease Location Existing Use % % $’000 $’000 % %
Investment properties in Singapore
Tampines Mall Leasehold 99 years 78 years 4 Tampines Central 5, Singapore Commercial 100.0 100.0 852,000 827,000 14.8 15.0
Junction 8 Leasehold 99 years 77 years 9 Bishan Place, Singapore Commercial 99.4 99.6 636,000 617,000 11.0 11.2
Funan DigitaLife Mall Leasehold 99 years 65 years 109 North Bridge Road, Singapore Commercial 98.2 100.0 358,000 354,000 6.2 6.4
IMM Building Leasehold 60 years 35 years 2 Jurong East Street 21, Singapore CommercialWarehouse
99.196.3
98.499.7
632,000 608,000 11.0 11.0
Plaza Singapura Freehold – – 68 Orchard Road, Singapore Commercial 100.0 91.3 1,168,000 1,106,000 20.3 20.1
Bugis Junction Leasehold 99 years 76 years 200 Victoria Street, Singapore Commercial 100.0 100.0 901,000 879,000 15.6 15.9
Sembawang Shopping Centre Leasehold 999 years 870 years 604 Sembawang Road, Singapore Commercial 100.0 100.0 96,000 93,000 1.7 1.7
JCube Leasehold 99 years 76 years 2 Jurong East Central 1, Singapore Commercial 100.0 99.6 360,000 340,000 6.2 6.2
Lot One Shoppers’ Mall Leasehold 99 years 79 years 21 Choa Chu Kang Avenue 4, Singapore
Commercial 100.0 99.8 485,000 467,000 8.4 8.5
Bukit Panjang Plaza Leasehold 99 years 80 years 1 Jelebu Road, Singapore Commercial 99.8 100.0 274,000 270,000 4.8 4.9
Rivervale Mall Leasehold 99 years 83 years 11 Rivervale Crescent, Singapore Commercial 100.0 100.0 115,000 106,000 2.0 1.9
The Atrium@Orchard Leasehold 99 years 94 years 60A & 60B Orchard Road, Singapore Commercial 99.5 95.3 722,000 717,000 12.5 13.0
Clarke Quay Leasehold 99 years 75 years 3A/B/C/D/E River Valley Road, Singapore
Commercial 100.0 97.9 347,000 325,000 6.0 5.9
Bugis+ Leasehold 60 years 52 years 201 Victoria Street, Singapore Commercial 100.0 99.5 330,000 322,000 5.7 5.8
Investment properties, at valuation 7,276,000 7,031,000 126.2 127.5Investments in subsidiaries, associate and joint ventures (Notes 7 & 8) 840,680 801,462 14.5 14.5
8,116,680 7,832,462 140.7 142.0Other assets and liabilities (net) (2,349,150) (2,318,636) (40.7) (42.0)Net assets 5,767,530 5,513,826 100.0 100.0
NA Not Applicable1 The two hotels are on a long term master lease to RC Hotels (Pte) Ltd.2 Westgate obtained its temporary occupation permit on 25 November 2013 and was transferred from investment properties under development to
investment properties.

FinancialStatements
157
TRUST Occupancy Ratesas at 31 December At Valuation
Percentage ofTotal Net Assets
RemainingTerm of Lease
2013 2012 2013 2012 2013 2012Description of Property Tenure of Land Term of Lease Location Existing Use % % $’000 $’000 % %
Investment properties in Singapore
Tampines Mall Leasehold 99 years 78 years 4 Tampines Central 5, Singapore Commercial 100.0 100.0 852,000 827,000 14.8 15.0
Junction 8 Leasehold 99 years 77 years 9 Bishan Place, Singapore Commercial 99.4 99.6 636,000 617,000 11.0 11.2
Funan DigitaLife Mall Leasehold 99 years 65 years 109 North Bridge Road, Singapore Commercial 98.2 100.0 358,000 354,000 6.2 6.4
IMM Building Leasehold 60 years 35 years 2 Jurong East Street 21, Singapore CommercialWarehouse
99.196.3
98.499.7
632,000 608,000 11.0 11.0
Plaza Singapura Freehold – – 68 Orchard Road, Singapore Commercial 100.0 91.3 1,168,000 1,106,000 20.3 20.1
Bugis Junction Leasehold 99 years 76 years 200 Victoria Street, Singapore Commercial 100.0 100.0 901,000 879,000 15.6 15.9
Sembawang Shopping Centre Leasehold 999 years 870 years 604 Sembawang Road, Singapore Commercial 100.0 100.0 96,000 93,000 1.7 1.7
JCube Leasehold 99 years 76 years 2 Jurong East Central 1, Singapore Commercial 100.0 99.6 360,000 340,000 6.2 6.2
Lot One Shoppers’ Mall Leasehold 99 years 79 years 21 Choa Chu Kang Avenue 4, Singapore
Commercial 100.0 99.8 485,000 467,000 8.4 8.5
Bukit Panjang Plaza Leasehold 99 years 80 years 1 Jelebu Road, Singapore Commercial 99.8 100.0 274,000 270,000 4.8 4.9
Rivervale Mall Leasehold 99 years 83 years 11 Rivervale Crescent, Singapore Commercial 100.0 100.0 115,000 106,000 2.0 1.9
The Atrium@Orchard Leasehold 99 years 94 years 60A & 60B Orchard Road, Singapore Commercial 99.5 95.3 722,000 717,000 12.5 13.0
Clarke Quay Leasehold 99 years 75 years 3A/B/C/D/E River Valley Road, Singapore
Commercial 100.0 97.9 347,000 325,000 6.0 5.9
Bugis+ Leasehold 60 years 52 years 201 Victoria Street, Singapore Commercial 100.0 99.5 330,000 322,000 5.7 5.8
Investment properties, at valuation 7,276,000 7,031,000 126.2 127.5Investments in subsidiaries, associate and joint ventures (Notes 7 & 8) 840,680 801,462 14.5 14.5
8,116,680 7,832,462 140.7 142.0Other assets and liabilities (net) (2,349,150) (2,318,636) (40.7) (42.0)Net assets 5,767,530 5,513,826 100.0 100.0
NA Not Applicable1 The two hotels are on a long term master lease to RC Hotels (Pte) Ltd.2 Westgate obtained its temporary occupation permit on 25 November 2013 and was transferred from investment properties under development to
investment properties.

CapitaMall Trust Annual Report 2013 158 Clarity
Portfolio StatementsAs at 31 December 2013
The accompanying notes form an integral part of these financial statements.
On 31 December 2013, independent valuations of Tampines Mall, IMM Building, JCube, Lot One Shoppers’ Mall, Bukit Panjang Plaza, Rivervale Mall were undertaken by CBRE Pte Ltd (“CBRE”) while the independent valuations of Junction 8, Funan DigitaLife Mall, Plaza Singapura, Bugis Junction, Sembawang Shopping Centre, The Atrium@Orchard, Clarke Quay and Bugis+ were undertaken by Knight Frank Pte Ltd (“Knight Frank”). The Manager believes that the independent valuers have appropriate professional qualifications and experience in the location and category of the properties being valued.
On 31 December 2012, the carrying amount of Tampines Mall, Junction 8, Funan DigitaLife Mall, IMM Building, Bugis Junction, JCube and Bugis+ were based on independent valuations undertaken by CBRE while the carrying amount of Plaza Singapura, Sembawang Shopping Centre, The Atrium@Orchard, Bukit Panjang Plaza, Lot One Shoppers’ Mall, Rivervale Mall and Clarke Quay were based on independent valuations undertaken by Knight Frank.
The valuations were based on discounted cash flow and capitalisation approaches for CBRE and Knight Frank. The net change in fair value of the properties has been recognised in the Statement of Total Return.
On 31 December 2013 and 31 December 2012, independent valuations of Raffles City Singapore were undertaken by Knight Frank. The Manager believes that the independent valuer has appropriate professional qualifications and experience in the location and category of the property being valued. The valuations were based on investment approach and discounted cash flow analysis. The valuation adopted was $3,018,000,000 (2012: $2,902,000,000) and the Trust’s proportionate interest in the property value was $1,207,200,000 (2012: $1,160,800,000). The net change in fair value of the property has been recognised in the Statement of Total Return.
On 31 December 2013, independent valuation of Westgate was undertaken by CBRE. The Manager believes that the independent valuer has appropriate professional qualifications and experience in the location and category of the property being valued. The valuation was based on discounted cash flow and capitalisation approaches. The valuation adopted was $1,054,000,000 and the Trust’s proportionate interest in the property value is $316,200,000. The net change in fair value of the property has been recognised in the Statement of Total Return.
Investment properties comprise commercial properties that are leased to external customers. Generally, the leases contain an initial non-cancellable period of three years. Subsequent renewals are negotiated with the lessee. Contingent rents recognised in the Statement of Total Return of the Group and of the Trust amounted to $43,877,000 (2012: $36,227,000) and $34,165,000 (2012: $26,077,000) respectively.
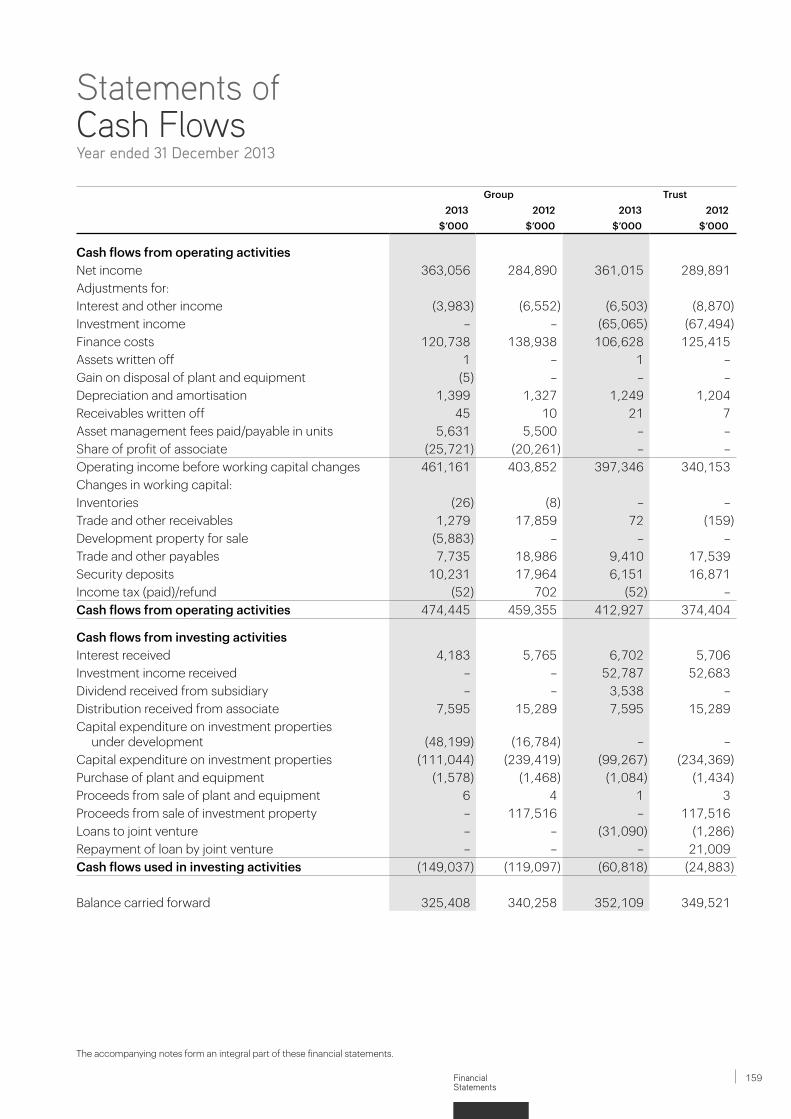
FinancialStatements
159
The accompanying notes form an integral part of these financial statements.
Statements of Cash FlowsYear ended 31 December 2013
Group Trust 2013 2012 2013 2012
$’000 $’000 $’000 $’000
Cash flows from operating activitiesNet income 363,056 284,890 361,015 289,891Adjustments for:Interest and other income (3,983) (6,552) (6,503) (8,870)Investment income – – (65,065) (67,494)Finance costs 120,738 138,938 106,628 125,415Assets written off 1 – 1 –Gain on disposal of plant and equipment (5) – – –Depreciation and amortisation 1,399 1,327 1,249 1,204Receivables written off 45 10 21 7Asset management fees paid/payable in units 5,631 5,500 – –Share of profit of associate (25,721) (20,261) – –Operating income before working capital changes 461,161 403,852 397,346 340,153Changes in working capital:Inventories (26) (8) – –Trade and other receivables 1,279 17,859 72 (159)Development property for sale (5,883) – – –Trade and other payables 7,735 18,986 9,410 17,539Security deposits 10,231 17,964 6,151 16,871Income tax (paid)/refund (52) 702 (52) –Cash flows from operating activities 474,445 459,355 412,927 374,404
Cash flows from investing activitiesInterest received 4,183 5,765 6,702 5,706Investment income received – – 52,787 52,683Dividend received from subsidiary – – 3,538 –Distribution received from associate 7,595 15,289 7,595 15,289Capital expenditure on investment properties
under development (48,199) (16,784) – –Capital expenditure on investment properties (111,044) (239,419) (99,267) (234,369)Purchase of plant and equipment (1,578) (1,468) (1,084) (1,434)Proceeds from sale of plant and equipment 6 4 1 3Proceeds from sale of investment property – 117,516 – 117,516Loans to joint venture – – (31,090) (1,286)Repayment of loan by joint venture – – – 21,009Cash flows used in investing activities (149,037) (119,097) (60,818) (24,883)
Balance carried forward 325,408 340,258 352,109 349,521

CapitaMall Trust Annual Report 2013 160 Clarity
Statements of Cash FlowsYear ended 31 December 2013
The accompanying notes form an integral part of these financial statements.
Group Trust2013 2012 2013 2012
$’000 $’000 $’000 $’000
Balance brought forward 325,408 340,258 352,109 349,521
Cash flows from financing activitiesPayment of issue and financing expenses (1,879) (7,877) (1,485) (5,668)Redemption and repurchase of Convertible Bonds
due 2013 (107,397) (172,710) (107,397) (172,710)Proceeds from interest-bearing borrowings 259,305 1,163,349 226,000 1,142,855Repayment of interest-bearing borrowings (300,000) (783,000) (300,000) (783,000)Proceeds from issue of new units – 250,000 – 250,000Distributions to Unitholders (340,695) (311,558) (340,695) (311,558)Interest paid (120,325) (117,814) (103,284) (101,332)Cash flows (used in)/from financing activities (610,991) 20,390 (626,861) 18,587
Net (decrease)/increase in cash and cash equivalents (285,583) 360,648 (274,752) 368,108
Cash and cash equivalents at beginning of the year 1,118,270 757,622 1,104,470 736,362Cash and cash equivalents at end of the year
(Note 12) 832,687 1,118,270 829,718 1,104,470
NOTE:(A) Significant Non-Cash Transaction During the financial year ended 31 December 2013, 2,736,018 (2012: 3,003,919) units were issued as payment for
the asset management fees payable in units, amounting to a value of $5,631,000 (2012: $5,500,000).

FinancialStatements
161
Notes to the Financial StatementsYear ended 31 December 2013
These notes form an integral part of the financial statements.
The financial statements were authorised for issue by the Manager and the Trustee on 4 February 2014.
1 GENERAL CapitaMall Trust (the “Trust”) is a Singapore-domiciled unit trust constituted pursuant to the trust deed dated
29 October 2001 (as amended) (the “Trust Deed”) between CapitaMall Trust Management Limited (the “Manager”) and HSBC Institutional Trust Services (Singapore) Limited (the “Trustee”). The Trust Deed is governed by the laws of the Republic of Singapore. The Trustee is under a duty to take into custody and hold the assets of the Trust in trust for the holders (“Unitholders”) of units in the Trust (the “Units”).
The Trust was formally admitted to the Official List of the Singapore Exchange Securities Trading Limited (“SGX-ST”) on 17 July 2002 (“Listing Date”) and was included under the Central Provident Fund (“CPF”) Investment Scheme on 13 September 2002.
The principal activity of the Trust is to invest in income producing real estate, which is used or substantially used for retail purposes with the primary objective of achieving an attractive level of return from rental income and for long-term capital growth. The principal activities of the subsidiaries, associate and joint ventures are set out in Notes 7 and 8.
The consolidated financial statements relate to the Trust and its subsidiaries (the “Group”) and the Group’s interest in its associate and joint ventures.
The Trust has entered into several service agreements in relation to management of the Trust and its property operations. The fee structures of these services are as follows:
1.1 Property management feesUnder the property management agreement, property management fees are charged as follows:
(a) 2.00% per annum of the gross revenue of the properties;
(b) 2.00% per annum of the net property income of the properties; and
(c) 0.50% per annum of the net property income of the properties, in lieu of leasing commissions.
The property management fees are payable monthly in arrears.

CapitaMall Trust Annual Report 2013 162 Clarity
Notes to the Financial Statements
1 GENERAL (continued)1.2 Asset management fees Pursuant to the Trust Deed, the asset management fees shall not exceed 0.70% per annum of the Deposited
Property or such higher percentage as may be fixed by an Extraordinary Resolution at a meeting of Unitholders. Deposited Property refers to all the assets of the Trust, including all its Authorised Investments (as defined in the Trust Deed) for the time being held or deemed to be held upon the trusts of the Trust Deed.
The asset management fees comprise:
(a) in respect of Authorised Investments which are in the form of real estate, a base component of 0.25% per annum of Deposited Property and a performance component of 2.85% per annum of gross revenue of the Trust for each financial year; and
(b) in respect of all other Authorised Investments which are not in the form of real estate, 0.5% per annum of the investment value of the Authorised Investment, unless such Authorised Investment is an interest in a property fund (either a real estate investment trust or private property fund) wholly managed by a wholly-owned subsidiary of CapitaLand Limited, in which case no asset management fee shall be payable in relation to such Authorised Investment.
In respect of all Authorised Investments which are in the form of real estate acquired by the Trust:
(a) the base component shall be paid to the Manager in the form of cash and/or Units (as the Manager may elect); and
(b) the performance component shall be paid to the Manager in the form of cash, in the form of Units or a combination of both (as the Manager may elect).
When paid in the form of Units, the Manager shall be entitled to receive such number of Units as may be purchased for the relevant amount of the asset management fee at the market price (as defined in the Trust Deed). The asset management fees are payable quarterly in arrears.
The Manager is also entitled to receive acquisition fee at the rate of 1.0% of the purchase price and a divestment fee of 0.5% of the sale price on all future acquisitions or disposals of properties or investments.
1.3 Trustee’s fees Pursuant to the Trust Deed, the Trustee’s fees shall not exceed 0.10% per annum of the Deposited Property
(subject to a minimum sum of $6,000 per month) payable out of the Deposited Property of the Trust. The Trustee is also entitled to reimbursement of expenses incurred in the performance of its duties under the Trust Deed.
The Trustee’s fees are payable quarterly in arrears.

FinancialStatements
163
2 BASIS OF PREPARATION2.1 Statement of compliance The financial statements have been prepared in accordance with the Statement of Recommended
Accounting Practice (“RAP”) 7 “Reporting Framework for Unit Trusts” issued by the Institute of Singapore Chartered Accountants (“ISCA”), and the applicable requirements of the Code on Collective Investment Schemes (“CIS Code”) issued by the Monetary Authority of Singapore (“MAS”) and the provisions of the Trust Deed. RAP 7 requires that accounting policies adopted should generally comply with the principles relating to recognition and measurement of the Singapore Financial Reporting Standards (“FRS”).
2.2 Basis of measurement The financial statements are prepared on the historical cost basis, except for investment properties,
derivative financial instruments and certain financial assets and financial liabilities which are measured at fair value.
2.3 Functional and presentation currency The financial statements are presented in Singapore dollars, which is the Group’s functional currency.
All financial information presented in Singapore dollars has been rounded to the nearest thousand, unless otherwise stated.
2.4 Use of estimates and judgements The preparation of financial statements in conformity with RAP 7 requires management to make judgements,
estimates and assumptions that affect the application of policies and reported amounts of assets, liabilities, income and expenses. Actual results may differ from these estimates.
Estimates and underlying assumptions are reviewed on an ongoing basis. Revisions to accounting estimates are recognised in the period in which the estimates are revised and in any future periods affected.
Information about critical judgement in applying accounting policies that have the most significant effect on the amount recognised in the financial statements is described in the following notes:
• Note5&6 – Classificationofinvestmentpropertiesandinvestmentpropertiesunderdevelopment
• Note10 – Classificationofdevelopmentpropertyforsale
Information about assumptions and estimation, uncertainty that have the most significant risk of resulting in a material adjustment within the next financial year are included in following notes:
• Note30 – Valuationoffinancialinstruments• Note31 – Valuationofinvestmentpropertiesandinvestmentpropertiesunderdevelopment

CapitaMall Trust Annual Report 2013 164 Clarity
Notes to the Financial Statements
2 BASIS OF PREPARATION (continued)2.5 Changes in accounting policies
RAP 7 (2012) From 1 January 2013, the Group and the Trust have adopted the revised RAP 7 issued by the Institute of
Singapore Chartered Accountants (ISCA) in June 2012.
The adoption of RAP 7 (2012) has resulted in additional disclosures in the financial statements of the Group and the Trust for the current and comparative years. These have been included in the Statement of Total Return and notes to the financial statements.
The adoption of RAP 7 (2012) affects only the disclosures made in the financial statements. There is no financial effect on the financial position, total return or distributable income of the Group and the Trust for the current and previous financial years. Accordingly, the adoption of RAP 7 (2012) has no impact on earnings and distributions per unit.
Fair value measurement FRS 113 Fair value measurement establishes a single framework for measuring fair value and making
disclosures about fair value measurements, when such measurements are required or permitted by other FRSs. In particular, it unifies the definition of fair value as the price at which an orderly transaction to sell an asset or to transfer a liability would take place between market participants at the measurement date. It also replaces and expands the disclosure requirements about fair value measurements in other FRSs, including FRS 107 Financial Instruments: Disclosures.
From 1 January 2013, in accordance with the transitional provisions of FRS 113, the Group has applied the new fair value measurement guidance prospectively, and has not provided any comparative information for new disclosures. Notwithstanding the above, the change had no significant impact on the measurements of the Group’s assets and liabilities. The additional disclosures necessary as a result of the introduction of this standard has been included in Note 31.
3 SIGNIFICANT ACCOUNTING POLICIES The accounting policies set out below have been applied consistently to all periods presented in these financial
statements, and have been applied consistently by the Group, except as explained in Note 2.5, which addresses changes in accounting policies.
3.1 ConsolidationSubsidiaries
Subsidiaries are entities controlled by the Group. Control exists when the Group has the power to govern the financial and operating policies of an entity so as to obtain benefits from its activities. In assessing control, potential voting rights that presently are exercisable are taken into account. The financial statements of subsidiaries are included in the consolidated financial statements from the date that control commences until the date that control ceases.
FinancialStatements
165
3 SIGNIFICANT ACCOUNTING POLICIES (continued)3.1 Consolidation (continued)
Associate and joint ventures Associate is an entity in which the Group has a significant influence, but not control, over the financial and
operating policies. In the financial statements of the Group, the interest in an associate is accounted for using the equity method. The consolidated financial statements include the Group’s share of the income and expenses of the associate, after adjustments to align the accounting policies with those of the Group, from the date that significant influence commences until the date that significant influence ceases. When the Group’s share of losses exceeds its interest in an associate, the carrying amount of that interest (including any long-term investments) is reduced to zero and the recognition of further losses is discontinued except to the extent that the Group has an obligation or has made payment on behalf of the associate.
Joint ventures are entities over whose activities the Trust has joint control, established by contractual agreement and requiring unanimous consent for strategic financial and operating decisions. In the financial statements of the Group, the interest in joint ventures is accounted for by including its proportionate share of the jointly-controlled entity’s assets, liabilities, income and expenses with the similar item, line by line, in its financial statements. The consolidated financial statements include the assets that the Group controls and the liabilities that it incurs in the course of pursuing the joint ventures, share of the income and expenses of the joint ventures, after adjustments to align the accounting policies with those of the Group, from the date that joint control commences until the date that joint control ceases.
Transactions eliminated on consolidation Intra-group balances and transactions, and any unrealised income or expenses arising from intra-group
transactions, are eliminated in preparing the consolidated financial statements. Unrealised gains arising from transactions with equity-accounted investees are eliminated against the investment to the extent of the Group’s interest in the investees. Unrealised losses are eliminated in the same way as unrealised gains, but only to the extent that there is no evidence of impairment.
Accounting for subsidiaries, associate and joint ventures by the Trust Investments in subsidiaries, associate and joint ventures are stated in the Trust’s balance sheet at cost less
accumulated impairment losses.
3.2 Plant and equipment Plant and equipment are measured at cost less accumulated depreciation and impairment losses. Cost
includes expenditure that is directly attributable to the acquisition of the asset.
When parts of an item of plant and equipment have different useful lives, they are accounted for as separate items (major components) of plant and equipment.
The cost of replacing part of an item of plant and equipment is recognised in the carrying amount of the item if it is probable that the future economic benefits embodied within the part will flow to the Group and its cost can be measured reliably. The costs of the day-to-day servicing of plant and equipment are recognised in the Statement of Total Return as incurred.

CapitaMall Trust Annual Report 2013 166 Clarity
Notes to the Financial Statements
3 SIGNIFICANT ACCOUNTING POLICIES (continued)3.2 Plant and equipment (continued) Depreciation is provided on a straight-line basis so as to write off items of plant and equipment, and major
components that are accounted for separately, over their estimated useful lives as follows:
Furniture, fittings and equipment - 2 to 5 years
Gain or loss arising from the retirement or disposal of plant and equipment is determined by comparing the proceeds from disposal with the carrying amount of plant and equipment and is recognised in the Statement of Total Return.
Depreciation methods, useful lives and residual values are reviewed, and adjusted as appropriate, at each reporting date.
3.3 Investment properties Investment properties are properties held either to earn rental income or for capital appreciation or both.
Investment properties are accounted for as non-current assets and are stated at initial cost on acquisition and at fair value thereafter. The cost of a purchased property comprises its purchase price and any directly attributable expenditure including capitalised borrowing costs. Transaction costs shall be included in the initial measurement. Fair value is determined in accordance with the Trust Deed, which requires the investment properties to be valued by independent registered valuers in the following events:
• insuchmannerandfrequencyrequiredundertheCISCodeissuedbyMAS;and
• atleastonceineachperiodof12monthsfollowingtheacquisitionofeachparcelofrealestateproperty.
Any increase or decrease on revaluation is credited or charged to the Statement of Total Return as a net change in fair value of the investment properties.
When an investment property is disposed of, the resulting gain or loss recognised in the Statement of Total Return is the difference between net disposal proceeds and the carrying amount of the property.
Investment properties are not depreciated. The properties are subject to continued maintenance and regularly revalued on the basis set out above. For income tax purposes, the Group and the Trust may claim capital allowances on assets that qualify as plant and machinery under the Income Tax Act.
3.4 Investment properties under development Investment properties under development are properties being constructed or developed for future use
as investment properties and are measured at fair value. The difference between the fair value and cost (including acquisition costs, development expenditure, capitalised borrowing costs and other directly attributable expenditure) is credited or charged to the Statement of Total Return. Upon completion, the carrying amounts are reclassified to investment properties.
FinancialStatements
167
3 SIGNIFICANT ACCOUNTING POLICIES (continued)3.5 Development property for sale Development property for sale is stated at the lower of cost and estimated net realisable value.
Net realisable value represents the estimated selling price less costs to be incurred in selling the property.
The cost of development property for sale comprises specifically identified costs, including acquisition costs, development expenditure, borrowing costs and other related expenditure. Borrowing costs payable on loans funding a development property are also capitalised, on a specific identification basis, as part of the cost of the development property until the completion of development.
3.6 Foreign currency transactions Transactions in foreign currencies are translated to the respective functional currencies of the Group at
the exchange rate at the date of the transaction. Monetary assets and liabilities denominated in foreign currencies at the end of the reporting date are retranslated to the functional currency at the exchange rate at that date. Non-monetary assets and liabilities denominated in foreign currencies that are measured at fair value are retranslated to the functional currency at the exchange rate at the date on which the fair value was determined.
Foreign currency differences arising on retranslation are recognised in Statement of Total Return, except for the following differences which are recognised in Unitholders’ funds, arising on the retranslation of:
• available-for-sale equity instruments (except on impairment in which case foreign currencydifferences that have been recognised in Unitholders’ funds are reclassified to Statement of Total Return);
• afinancialliabilitydesignatedasahedgeofthenetinvestmentinaforeignoperationtotheextentthatthe hedge is effective; or
• qualifyingcashflowhedgestotheextentthehedgeiseffective.
3.7 Financial instrumentsNon-derivative financial assets
The Group initially recognises loans and receivables on the date that they are originated. All other financial assets (including assets designated at fair value through profit or loss) are recognised initially on the trade date at which the Group becomes a party to the contractual provisions of the instrument.
The Group derecognises a financial asset when the contractual rights to the cash flows from the asset expire, or it transfers the rights to receive the contractual cash flows on the financial asset in a transaction in which substantially all the risks and rewards of ownership of the financial asset are transferred. Any interest in transferred financial assets that is created or retained by the Group is recognised as a separate asset or liability.
CapitaMall Trust Annual Report 2013 168 Clarity
Notes to the Financial Statements
3 SIGNIFICANT ACCOUNTING POLICIES (continued)3.7 Financial instruments (continued)
Non-derivative financial assets (continued) Financial assets and liabilities are offset and the net amount presented in the balance sheet when, and only
when, the Group has a legal right to offset the amounts and intends either to settle on a net basis or to realise the asset and settle the liability simultaneously.
The Group has the following non-derivative financial assets: loans and receivables.
Loans and receivables Loans and receivables are financial assets with fixed or determinable payments that are not quoted in an
active market. Such assets are recognised initially at fair value plus any directly attributable transaction costs. Subsequent to initial recognition, loans and receivables are measured at amortised cost using the effective interest method, less any impairment losses.
Loans and receivables comprise trade and other receivables, loans to joint ventures and cash and cash equivalents.
Cash and cash equivalents comprise cash balances and bank deposits.
Non-derivative financial liabilities The Group initially recognises all other financial liabilities (including liabilities designated at fair value through
profit or loss) on the trade date at which the Group becomes a party to the contractual provisions of the instrument.
The Group derecognises a financial liability when its contractual obligations are discharged, cancelled or expired.
The Group has the following non-derivative financial liabilities: loans and borrowings, amounts owing to joint venture partners, trade and other payables and security deposits.
Such financial liabilities are recognised initially at fair value plus any directly attributable transaction costs. Subsequent to initial recognition, these financial liabilities are measured at amortised cost using the effective interest method.
Derivative financial instruments and hedging activities The Group holds derivative financial instruments to hedge its foreign currency and interest rate risk
exposures. Embedded derivatives are separated from the host contract and accounted for separately if the economic characteristics and risks of the host contract and the embedded derivative are not closely related, a separate instrument with the same terms as the embedded derivative would meet the definition of a derivative, and the combined instrument is not measured at fair value through profit or loss. Multiple embedded derivatives in a single instrument are treated as a single compound embedded derivative if they share the same underlying risk exposures, are interdependent of each other and are not readily separable.
FinancialStatements
169
3 SIGNIFICANT ACCOUNTING POLICIES (continued)3.7 Financial instruments (continued)
Derivative financial instruments and hedging activities (continued) On initial designation of the hedge, the Group formally documents the relationship between the hedging
instrument(s) and hedged item(s), including the risk management objectives and strategy in undertaking the hedge transaction, together with the methods that will be used to assess the effectiveness of the hedging relationship. The Group makes an assessment, both at the inception of the hedge relationship as well as on an ongoing basis, of whether the hedging instruments are expected to be “highly effective” in offsetting the changes in the fair value or cash flows of the respective hedged items during the period for which the hedge is designated, and whether the actual results of each hedge are within a range of 80%-125%. For a cash flow hedge of a forecast transaction, the transaction should be highly probable to occur and should present an exposure to variations in cash flows that could ultimately affect reported total return.
Derivatives are recognised initially at fair value; attributable transaction costs are recognised in the Statement of Total Return when incurred. Subsequent to initial recognition, derivatives are measured at fair value, and changes therein are accounted for as described below.
Cash flow hedges When a derivative is designated as the hedging instrument in a hedge of the variability in cash flows
attributable to a particular risk associated with a recognised asset or liability or a highly probable forecast transaction that could affect Statement of Total Return, the effective portion of changes in the fair value of the derivative is recognised in Unitholders’ funds and presented in the hedging reserve in equity. Any ineffective portion of changes in the fair value of the derivative is recognised immediately in Statement of Total Return.
When the hedged item is a non-financial asset, the amount accumulated in Unitholders’ funds is included in the carrying amount of the asset when the asset is recognised. In other cases, the amount accumulated in Unitholders’ funds is reclassified to Statement of Total Return in the same period that the hedged item affects Statement of Total Return. If the hedging instrument no longer meets the criteria for hedge accounting, expires or is sold, terminated or exercised, or the designation is revoked, then hedge accounting is discontinued prospectively. If the forecast transaction is no longer expected to occur, then the balance in Unitholders’ funds is reclassified to Statement of Total Return.
Separable embedded derivatives Changes in the fair value of separable embedded derivatives are recognised immediately in the Statement
of Total Return.
Other non-trading derivatives When a derivative financial instrument is not designated in a hedge relationship that qualifies for hedge
accounting, all changes in its fair value are recognised immediately in Statement of Total Return.

CapitaMall Trust Annual Report 2013 170 Clarity
Notes to the Financial Statements
3 SIGNIFICANT ACCOUNTING POLICIES (continued)3.7 Financial instruments (continued)
Convertible bonds The Group has issued convertible bonds that comprise a liability for the principal and interest amount and a
derivative liability. The derivative liability is recognised at fair value at inception. The carrying amount of the convertible bonds at initial recognition is the difference between the gross proceeds from the convertible bonds issue and the fair value of the derivative liability. Any directly attributable transaction costs are allocated to the convertible bonds and derivative liability in proportion to their initial carrying amounts. Subsequent to initial recognition, the convertible bonds are measured at amortised cost using effective interest method. The derivative liability is measured at fair value through profit or loss.
The Group has also issued convertible bonds that can be converted into Unitholders’ funds at the option of the holder, where the number of units to be issued does not vary with changes in their fair value are accounted for as compound financial instruments. The gross proceeds are allocated to the equity and liability components, with the equity component being assigned the residual amount after deducting the fair value of the liability component from the fair value of the compound financial instrument. Subsequent to initial recognition, the liability component of convertible bonds is measured at amortised cost using the effective interest method. The equity component of convertible bonds is not re-measured subsequent to initial recognition.
3.8 Impairment Non-derivative financial assets
A financial asset not carried at fair value through profit or loss is assessed at each reporting date to determine whether there is objective evidence that it is impaired. A financial asset is impaired if objective evidence indicates that a loss event has occurred after the initial recognition of the asset, and that the loss event had a negative effect on the estimated future cash flows of that asset that can be estimated reliably.
Objective evidence that financial assets are impaired can include default or delinquency by a debtor, restructuring of an amount due to the Group on terms that the Group would not consider otherwise, indications that a debtor or issuer will enter bankruptcy. In addition, for an investment in an equity security, a significant or prolonged decline in its fair value below its cost is objective evidence of impairment.
The Group considers evidence of impairment for loans and receivables at both a specific asset and collective level. All individually significant loans and receivables are assessed for specific impairment. All individually significant loans and receivables found not to be specifically impaired are then collectively assessed for any impairment that has been incurred but not yet identified. Loans and receivables that are not individually significant are collectively assessed for impairment by grouping together loans and receivables with similar risk characteristics.
In assessing collective impairment, the Group uses historical trends of the probability of default, timing of recoveries and the amount of loss incurred, adjusted for the Manager’s judgement as to whether current economic and credit conditions are such that the actual losses are likely to be greater or less than suggested by historical trends.

FinancialStatements
171
3 SIGNIFICANT ACCOUNTING POLICIES (continued)3.8 Impairment (continued)
Non-derivative financial assets (continued) An impairment loss in respect of a financial asset measured at amortised cost is calculated as the difference
between its carrying amount and the present value of the estimated future cash flows discounted at the asset’s original effective interest rate. Losses are recognised in the Statement of Total Return and reflected in an allowance account against loans and receivables. Interest on the impaired asset continues to be recognised through the unwinding of the discount. When a subsequent event causes the amount of impairment loss to decrease, the decrease in impairment loss is reversed through the Statement of Total Return.
Non-financial assets The carrying amounts of the Group’s non-financial assets, other than investment properties and investment
properties under development, are reviewed at each reporting date to determine whether there is any indication of impairment. If any such indication exists, then the asset’s recoverable amount is estimated.
The recoverable amount of an asset or cash-generating unit (“CGU”) is the greater of its value in use and its fair value less costs to sell. In assessing value in use, the estimated future cash flows are discounted to their present value using a pre-tax discount rate that reflects current market assessments of the time value of money and the risks specific to the asset or CGU. For the purpose of impairment testing, assets that cannot be tested individually are grouped together into the smallest group of assets that generates cash inflows from continuing use that are largely independent of the cash inflows of other assets or CGU.
An impairment loss is recognised if the carrying amount of an asset or its CGU exceeds its estimated recoverable amount. Impairment losses are recognised in the Statement of Total Return.
Impairment losses recognised in prior periods are assessed at each reporting date for any indications that the loss has decreased or no longer exists. An impairment loss is reversed if there has been a change in the estimates used to determine the recoverable amount. An impairment loss is reversed only to the extent that the asset’s carrying amount does not exceed the carrying amount that would have been determined, net of depreciation or amortisation, if no impairment loss had been recognised.
3.9 Interest-bearing borrowings Interest-bearing borrowings are recognised initially at fair value less attributable transaction costs. Subsequent
to initial recognition, interest-bearing borrowings are stated at amortised cost with any difference between cost and redemption value being recognised in the Statement of Total Return over the period of the borrowings on an effective interest basis.
3.10 Unitholders’ funds Unitholders’ funds represent the Unitholders’ residual interest in the Group’s net assets upon termination
and is classified as equity.
Incremental costs directly attributable to the issue of units are recognised as a deduction from Unitholders’ funds.

CapitaMall Trust Annual Report 2013 172 Clarity
Notes to the Financial Statements
3 SIGNIFICANT ACCOUNTING POLICIES (continued)3.11 Revenue recognition
Rental income from operating leases Rental income receivable under operating leases is recognised in the Statement of Total Return on a
straight-line basis over the term of the lease, except where an alternative basis is more representative of the pattern of benefits to be derived from the leased assets. Lease incentives granted are recognised as an integral part of the total rental to be received. Contingent rentals, which include gross turnover rental, are recognised as income in the accounting period on a receipt basis. No contingent rentals are recognised if there are uncertainties due to the possible return of amounts received.
Car park income Car park income is recognised as it accrues on a time apportioned basis.
Interest income Interest income is recognised as it accrues, using the effective interest method.
Investment income Investment income is recognised when the right to receive distribution income from an associate or a joint
venture is established.
3.12 ExpensesProperty operating expenses
Property operating expenses consist of quit rents, property taxes, utilities, property management fees, property management reimbursements, marketing, maintenance and other property outgoings in relation to investment properties where such expenses are the responsibility of the Group.
Property management fees are recognised on an accrual basis based on the applicable formula, stipulated in Note 1.1.
Asset management fees Asset management fees are recognised on an accrual basis using the applicable formula, stipulated in
Note 1.2.
Trustee’s fees The Trustee’s fees are recognised on an accrual basis using the applicable formula, stipulated in Note 1.3.
3.13 Finance costs Finance costs comprise interest expense on borrowings and convertible bonds, amortisation of borrowings
and convertible bonds related transaction costs and accretion of convertible bonds interest which are recognised in the Statement of Total Return using the effective interest method over the period of borrowings and the convertible bonds. Finance costs also include gain/loss on remeasurement of financial derivatives.

FinancialStatements
173
3 SIGNIFICANT ACCOUNTING POLICIES (continued)3.14 Income tax Income tax expense comprises current and deferred tax. Current and deferred tax is recognised in the
Statement of Total Return except to the extent that it relates to items directly related to Unitholders’ funds, in which case it is recognised in Unitholders’ funds.
Current tax is the expected tax payable on the taxable income for the year, using tax rates enacted or substantively enacted at the reporting date, and any adjustment to tax payable in respect of previous years.
Deferred tax is recognised in respect of temporary differences between the carrying amounts of assets and liabilities for financial reporting purposes and the amounts used for taxation purposes. Deferred tax is not recognised for:
• temporarydifferenceson the initial recognitionof assetsor liabilities in a transaction that is not abusiness combination and that affects neither accounting nor taxable profit; and
• temporarydifferencesrelatedto investments insubsidiariesand jointventurestotheextentthat it is probable that they will not reverse in the foreseeable future.
The measurement of deferred taxes reflects the tax consequences that would follow the manner in which the Group expects, at the end of the reporting period, to recover or settle the carrying amount of its assets and liabilities. Deferred tax is measured at the tax rates that are expected to be applied to the temporary differences when they reverse, based on the laws that have been enacted or substantively enacted by the reporting date.
Deferred tax assets and liabilities are offset if there is a legally enforceable right to offset current tax liabilities and assets and they relate to taxes levied by the same tax authority on the same taxable entity, or on different tax entities, but they intend to settle current tax liabilities and assets on a net basis or their tax assets and liabilities will be realised simultaneously.
A deferred tax asset is recognised only to the extent that it is probable that future taxable profits will be available against which the temporary differences can be utilised. Deferred tax assets are reviewed at each reporting date and are reduced to the extent that it is no longer probable that the related tax benefit will be realised.
In determining the amount of current and deferred tax, the Group takes into account the impact of uncertain tax positions and whether additional taxes and interest may be due. The Group believes that its accruals for tax liabilities are adequate for all open tax years based on its assessment of many factors, including interpretations of tax law and prior experience. This assessment relies on estimates and assumptions and may involve a series of judgements about future events. New information may become available that causes the Group to change its judgement regarding the adequacy of existing tax liabilities; such changes to tax liabilities will impact tax expense in the period that such a determination is made.
CapitaMall Trust Annual Report 2013 174 Clarity
Notes to the Financial Statements
3 SIGNIFICANT ACCOUNTING POLICIES (continued)3.14 Income tax (continued) The Inland Revenue Authority of Singapore (the “IRAS”) has issued a tax ruling on the tax treatment of the
Trust. Subject to meeting the terms and conditions of the tax ruling which includes a distribution of at least 90.0% of the taxable income of the Trust, the Trustee is not subject to tax on the taxable income of the Trust to the extent of the amount distributed. Instead, the distributions made by the Trust out of such taxable income are subject to tax in the hands of Unitholders, unless they are exempt from tax on the Trust’s distributions. This treatment is known as the tax transparency treatment.
Individuals and qualifying Unitholders, i.e. companies incorporated and tax resident in Singapore, Singapore branches of foreign companies that have obtained waiver from the IRAS from tax deducted at source in respect of the distributions from the Trust, and bodies of persons registered or constituted in Singapore, are entitled to gross distributions from the Trust. For distributions made to foreign non-individual Unitholders, the Trustee is required to withhold tax at the reduced rate of 10.0%. For other types of Unitholders, the Trustee is required to withhold tax at the prevailing corporate tax rate on the distributions made by the Trust. Such other types of Unitholders are subject to tax on the regrossed amounts of the distributions received but may claim a credit for the tax deducted at source at the prevailing corporate tax rate by the Trustee.
The Trust has a distribution policy to distribute at least 90.0% of its taxable income, other than gains from the sale of real estate properties that are determined by the IRAS to be trading gains. For the taxable income that is not distributed, referred to as retained taxable income, tax will be assessed on the Trustee. Where such retained taxable income is subsequently distributed, the Trustee need not deduct tax at source.
3.15 Segment reporting An operating segment is a component of the Group that engages in business activities from which it may
earn revenues and incur expenses, including revenues and expenses that relate to transactions with any of the Group’s other components. All operating segments’ operating results are reviewed and used by the management for strategic decision making and resources allocation.
3.16 New standards, interpretations and revised recommended accounting practice not yet adopted A number of new standards, amendments to standards and interpretations are effective for annual periods
beginning after 1 January 2013, and have not been applied in preparing these financial statements. Those new standards, amendments to standards and interpretations that are expected to have a significant effect on the financial statements of the Group and the Trust in future financial periods, and which the Group does not plan to early adopt except as otherwise indicated below, are set out below.
Applicable for the Group’s 2014 financial statements• FRS 111 Joint Arrangements establishes the principles for classification and accounting of joint
arrangements. The adoption of this standard would require the Group to re-assess and classify its joint arrangements as either joint operations or joint ventures based on its rights and obligations arising from the joint arrangements. Under this standard, interests in joint ventures will be accounted for using the equity method whilst interests in joint operations will be accounted for using the applicable FRSs relating to the underlying assets, liabilities, revenue and expense items arising from the joint operations.

FinancialStatements
175
3 SIGNIFICANT ACCOUNTING POLICIES (continued)3.16 New standards, interpretations and revised recommended accounting practice not yet adopted
(continued)Applicable for the Group’s 2014 financial statements (continued) At 31 December 2013, the Group has investments under joint arrangements. Currently, RCS Trust,
Infinity Mall Trust and Infinity Office Trust are accounted for as jointly-controlled entities using the proportionate consolidation method. The Group has re-evaluated the rights and obligations of the parties to these joint arrangements and has determined that the parties in these joint arrangements have rights to the net assets of the joint arrangements. Accordingly, these joint arrangements will be classified as joint ventures under FRS 111 and will be accounted for using the equity method.
These changes will be applied retrospectively and in the Group’s 2014 financial statements, prior period comparatives will be restated. Had this change been effected as at 31 December 2013, the estimated impact on key line items in the financial statements are as follows:
Impact on Statement of Financial Position - Group
As at 31 December 2013
as reportedFRS 111
adjustments
As at 31 December 2013
to be restated$’000 $’000 $’000
Total assets 10,017,499 (797,542) 9,219,957
Total liabilities 4,008,755 (797,542) 3,211,213
Net assets 6,008,744 – 6,008,744
Impact on Statement of Total Return - Group
Year ended 31 December 2013
as reportedFRS 111
adjustments
Year ended 31 December 2013
to be restated$’000 $’000 $’000
Gross revenue 729,162 (91,572) 637,590
Net income before share of profit of associate and joint ventures 337,335 (43,976) 293,359
Share of profit of associate and joint ventures 25,721 78,479 104,200
Total return for the year 574,366 – 574,366
• FRS112Disclosure of Interests in Other Entities brings together into a single standard all the disclosure requirements about an entity’s interests in subsidiaries, joint arrangements, associates and unconsolidated structured entities. The Group is currently assessing the disclosure requirements for interests in subsidiaries, interests in joint arrangements and associates and unconsolidated structured entities in comparison with the existing disclosures. FRS 112 requires the disclosure of information about the nature, risks and financial effects of these interests.

CapitaMall Trust Annual Report 2013 176 Clarity
Notes to the Financial Statements
4 PLANT AND EQUIPMENT
Furniture, fittingsand equipment
2013 2012$’000 $’000
Group
CostAt 1 January 5,802 4,453Additions 2,078 1,468Disposals (66) (53)Assets written off (25) (66)At 31 December 7,789 5,802
Accumulated depreciationAt 1 January 3,717 2,889Charge for the year 912 943Disposals (65) (49)Assets written off (24) (66)At 31 December 4,540 3,717
Carrying amountsAt 1 January 2,085 1,564At 31 December 3,249 2,085
Trust
CostAt 1 January 5,279 3,960Additions 1,084 1,434Disposals (45) (49)Assets written off (25) (66)At 31 December 6,293 5,279
Accumulated depreciationAt 1 January 3,277 2,490Charge for the year 874 899Disposals (44) (46)Assets written off (24) (66)At 31 December 4,083 3,277
Carrying amountsAt 1 January 2,002 1,470At 31 December 2,210 2,002
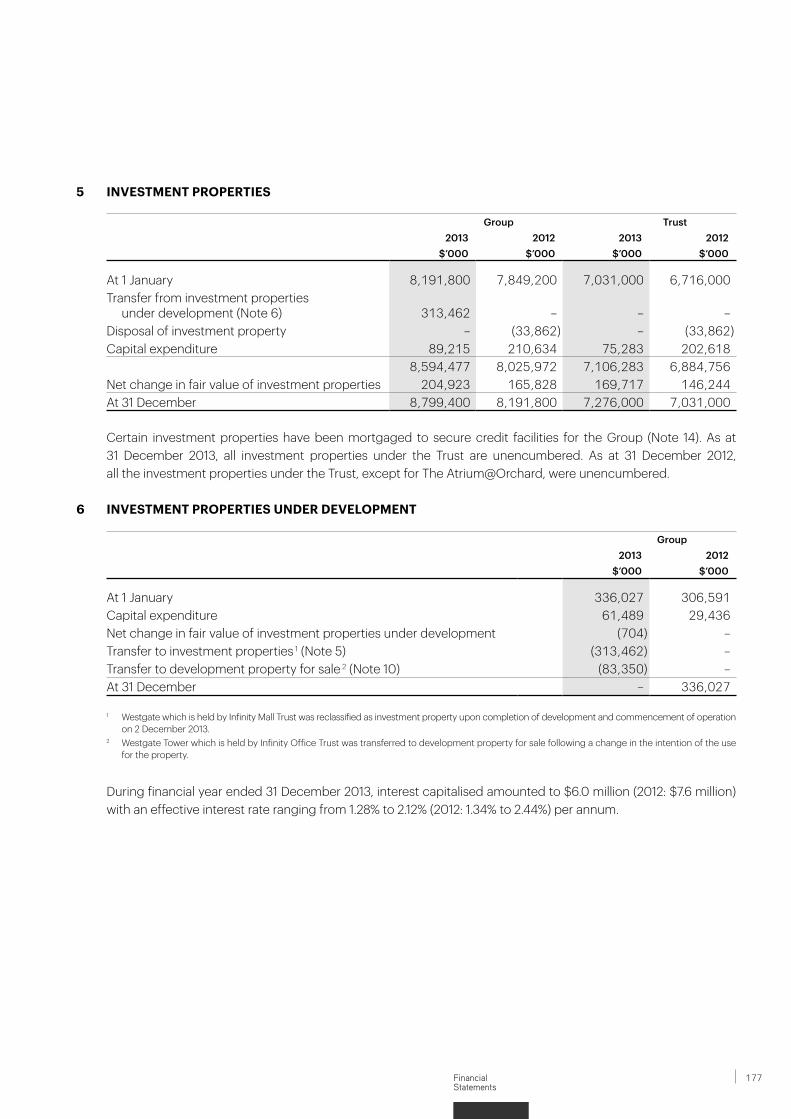
FinancialStatements
177
5 INVESTMENT PROPERTIES
Group Trust2013 2012 2013 2012
$’000 $’000 $’000 $’000
At 1 January 8,191,800 7,849,200 7,031,000 6,716,000Transfer from investment properties
under development (Note 6) 313,462 – – –Disposal of investment property – (33,862) – (33,862)Capital expenditure 89,215 210,634 75,283 202,618
8,594,477 8,025,972 7,106,283 6,884,756Net change in fair value of investment properties 204,923 165,828 169,717 146,244At 31 December 8,799,400 8,191,800 7,276,000 7,031,000
Certain investment properties have been mortgaged to secure credit facilities for the Group (Note 14). As at 31 December 2013, all investment properties under the Trust are unencumbered. As at 31 December 2012, all the investment properties under the Trust, except for The Atrium@Orchard, were unencumbered.
6 INVESTMENT PROPERTIES UNDER DEVELOPMENT
Group2013 2012
$’000 $’000
At 1 January 336,027 306,591Capital expenditure 61,489 29,436Net change in fair value of investment properties under development (704) –Transfer to investment properties 1 (Note 5) (313,462) –Transfer to development property for sale 2 (Note 10) (83,350) –At 31 December – 336,027
1 Westgate which is held by Infinity Mall Trust was reclassified as investment property upon completion of development and commencement of operation on 2 December 2013.
2 Westgate Tower which is held by Infinity Office Trust was transferred to development property for sale following a change in the intention of the use for the property.
During financial year ended 31 December 2013, interest capitalised amounted to $6.0 million (2012: $7.6 million) with an effective interest rate ranging from 1.28% to 2.12% (2012: 1.34% to 2.44%) per annum.

CapitaMall Trust Annual Report 2013 178 Clarity
Notes to the Financial Statements
7 SUBSIDIARIES
Trust2013 2012
$’000 $’000
Non-current assetsEquity investments at cost * *Loan to a subsidiary 80 80
80 80
* Less than $1,000
Details of the subsidiaries are as follows:
Effective equityinterest held by the Trust
Place of incorporation/business
2013 2012Name of subsidiaries % %
CapitaRetail Singapore Limited Singapore 100 100
CMT MTN Pte. Ltd.1 Singapore 100 100
1 Audited by KPMG LLP Singapore
CapitaRetail Singapore Limited CapitaRetail Singapore Limited (“CRSL”) has been placed under member’s voluntary liquidation since
26 November 2013 and there is no requirement for audit in year 2013. The 852 redeemable preference shares of $0.10 each in CRSL were redeemed on 25 October 2013.
CMT MTN Pte. Ltd. CMT MTN Pte. Ltd. (“CMT MTN”) was incorporated on 23 January 2007. The principal activity of this subsidiary
is the provision of treasury services, including on-lending to the Trust proceeds from issuances of notes under unsecured multicurrency medium term note programme and Euro-medium term note programme.
The Trust has provided a loan to CMT MTN amounting to $80,000 (2012: $80,000) which is non-trade in nature, unsecured and interest-free. The settlement of the amount is neither planned nor likely to occur in the foreseeable future. As this amount is, in substance, part of the Trust’s net investment in CMT MTN, it is stated at cost.

FinancialStatements
179
8 ASSOCIATE AND JOINT VENTURES
Group Trust2013 2012 2013 2012
$’000 $’000 $’000 $’000
Investment in associate 178,808 152,592 130,836 130,836Investments in joint ventures – – 563,633 558,048Loans to joint ventures 96,647 74,884 146,131 112,498
275,455 227,476 840,600 801,382
The loans to joint ventures are not expected to be repaid in the next twelve months from the reporting date. The loan bears interest rate of 2.12% (2012: 2.12% to 2.44%) per annum. Interest rate is repriced at intervals of less than twelve months.
Details of the associate and joint ventures are as follows:
Place of constitution/incorporation/
business
Effective equityinterest held by the Trust2013 2012
Name of associate and joint ventures % %
Associate 1
CapitaRetail China Trust Singapore 15.3 2 16.4 2
Joint ventures 1
Infinity Mall Trust and Infinity Office Trust Singapore 30.0 30.0
RCS Trust Singapore 40.0 40.0
1 Audited by KPMG LLP Singapore2 The dilution of interest in associate is mainly due to the equity fund raising on 2 November 2012 and the preferential offering on 20 November 2013
conducted by CapitaRetail China Trust in which the Trust did not participate.
AssociateCapitaRetail China Trust
CapitaRetail China Trust (“CRCT”) is a real estate investment trust constituted in Singapore by a trust deed dated 23 October 2006 (as amended). CRCT was formally admitted to SGX-ST on 8 December 2006. CRCT is established with the objective of investing on a long term basis in a diversified portfolio of income producing real estate and primarily for retail purposes and located primarily in the People’s Republic of China.
On a recurring basis, as the results of CRCT are not expected to be announced in sufficient time to be included in the Group’s results for the same calendar quarter, the Group will equity account the results of CRCT based on a 3-month lag time.
At the reporting date, the fair value of both the Group’s and the Trust’s investment in CRCT is $163,198,000 (2012: $201,236,000).

CapitaMall Trust Annual Report 2013 180 Clarity
Notes to the Financial Statements
8 ASSOCIATE AND JOINT VENTURES (continued)Joint VenturesInfinity Mall Trust and Infinity Office Trust (a) Infinity Mall Trust
Infinity Mall Trust is an unlisted special purpose trust established under a trust deed (“Infinity Mall Trust Trust Deed”) dated 25 May 2011 entered into between the Trustee, CMA Singapore Investments (4) Pte. Ltd., CL JM Pte. Ltd. and JG Trustee Pte. Ltd. (as trustee of Infinity Mall Trust). Infinity Mall Trust is 30.0% owned by the Trust, 50.0% by CMA Singapore Investments (4) Pte. Ltd. and 20.0% by CL JM Pte. Ltd.
Infinity Mall Trust owns Westgate, at Jurong Gateway. Westgate obtained its temporary occupation permit on 25 November 2013 and commenced operations on 2 December 2013.
Infinity Mall Trust has entered into property management agreement in relation to management of Infinity Mall Trust and its property operations. The fee structures of these services are as follows:
(i) 2.00% per annum of the gross revenue of the properties;
(ii) 2.00% per annum of the net property income of the properties; and
(iii) 0.50% per annum of the net property income of the properties, in lieu of leasing commissions.
The property management fees are payable monthly in arrears.
(b) Infinity Office Trust
Infinity Office Trust is an unlisted special purpose trust established under a trust deed (“Infinity Office Trust Trust Deed”) dated 25 May 2011 entered into between the Trustee, CMA Singapore Investments (5) Pte. Ltd., CL JO Pte. Ltd. and JG2 Trustee Pte. Ltd. (as trustee of Infinity Office Trust). Infinity Office Trust is 30.0% owned by the Trust, 50.0% by CMA Singapore Investments (5) Pte. Ltd. and 20.0% by CL JO Pte. Ltd.
Infinity Office Trust owns Westgate Tower, at Jurong Gateway which is expected to be completed by end 2014. Please also refer to Note 35 - Subsequent Event.
RCS Trust RCS Trust is an unlisted special purpose trust established under a trust deed (“RCS Trust Trust Deed”) dated
18 July 2006 entered into between HSBC Institutional Trust Services (Singapore) Limited as trustee-manager of RCS Trust (“RCS Trust Trustee-Manager”), HSBC Institutional Trust Services (Singapore) Limited as trustee of CapitaCommercial Trust (“CCT Trustee”), the Trustee, CapitaCommercial Trust Management Limited (CCTML as manager of CCT) and the Manager. RCS Trust is 40.0% owned by the Trust and 60.0% owned by CCT.
RCS Trust has entered into several service agreements in relation to management of RCS Trust and its property operations. The fee structures of these services are as follows:

FinancialStatements
181
8 ASSOCIATE AND JOINT VENTURES (continued)Joint Ventures (continued)RCS Trust (continued)(a) Property management fees
Under the property management agreement, property management fees are charged as follows:
(i) 2.00% per annum of the property income of the property; and
(ii) 2.50% per annum of the net property income of the property.
The property management fees are payable monthly in arrears.
(b) Asset management fees
Pursuant to the RCS Trust Trust Deed, the asset management fees comprise a base component of 0.25% per annum of the value of deposited property of RCS Trust and a performance component of 4.00% per annum of the net property income of RCS Trust, including all its authorised investments for the time being held or deemed to be held upon the trusts of the RCS Trust Trust Deed.
The asset management fees shall be paid entirely in the form of units or, with the unanimous approval of the Manager and CCTML, either partly in units and partly in cash or wholly in cash.
The asset management fees are payable quarterly in arrears.
(c) RCS Trust Trustee-Manager’s fees
Pursuant to the RCS Trust Trust Deed, the RCS Trust Trustee-Manager’s fees shall not exceed 0.10% per annum of the value of Deposited Property of RCS Trust, as defined in the RCS Trust Trust Deed (subject to a minimum sum of $15,000 per month), payable out of the Deposited Property of RCS Trust. The RCS Trust Trustee-Manager is also entitled to reimbursement of expenses incurred in the performance of its duties under the RCS Trust Trust Deed.
The RCS Trust Trustee-Manager’s fees are payable quarterly in arrears.
The summarised financial information relating to the associate is not adjusted for the percentage of ownership held by the Group. The summarised financial information of the joint ventures represents the Group’s share in the joint ventures.

CapitaMall Trust Annual Report 2013 182 Clarity
Notes to the Financial Statements
8 ASSOCIATE AND JOINT VENTURES (continued)Joint Ventures (continued)
The financial information of the associate and the Group’s interests in the joint ventures are as follows:
Associate 1 Joint ventures2013 2012 2013 2012
$’000 $’000 $’000 $’000
Assets and LiabilitiesNon-current assets 1,524,439 1,495,572Current assets 99,261 15,184Total assets 1,817,400 1,564,419 1,623,700 1,510,756
Non-current liabilities 808,901 733,143Current liabilities 48,227 42,730Total liabilities 677,924 662,096 857,128 775,873
ResultsRevenue 157,715 151,764 91,625 88,425Expenses (47,723) (43,816)Revaluation surplus 35,206 19,584Total return for the year 160,218 116,418 79,108 64,193
The Group’s share of joint venture capital commitment 37,011 85,791
1 As the results of CRCT for the fourth quarter ended 31 December 2013 are not announced in sufficient time to be included in the Group’s results for the same calendar quarter, the assets and liabilities recorded were based on CRCT’s unaudited financial statements and distribution announcement for the third quarter ended 30 September 2013 dated 23 October 2013. The financial results recorded were based on CRCT’s unaudited financial statements and distribution announcements for the period from 1 October 2012 to 30 September 2013.
Similarly, corresponding comparisons for previous financial year were based on CRCT’s unaudited financial statements and distribution announcement for the third quarter ended 30 September 2012 dated 23 October 2012 and on CRCT’s unaudited financial statements and distribution announcements for the period from 1 October 2011 to 30 September 2012.
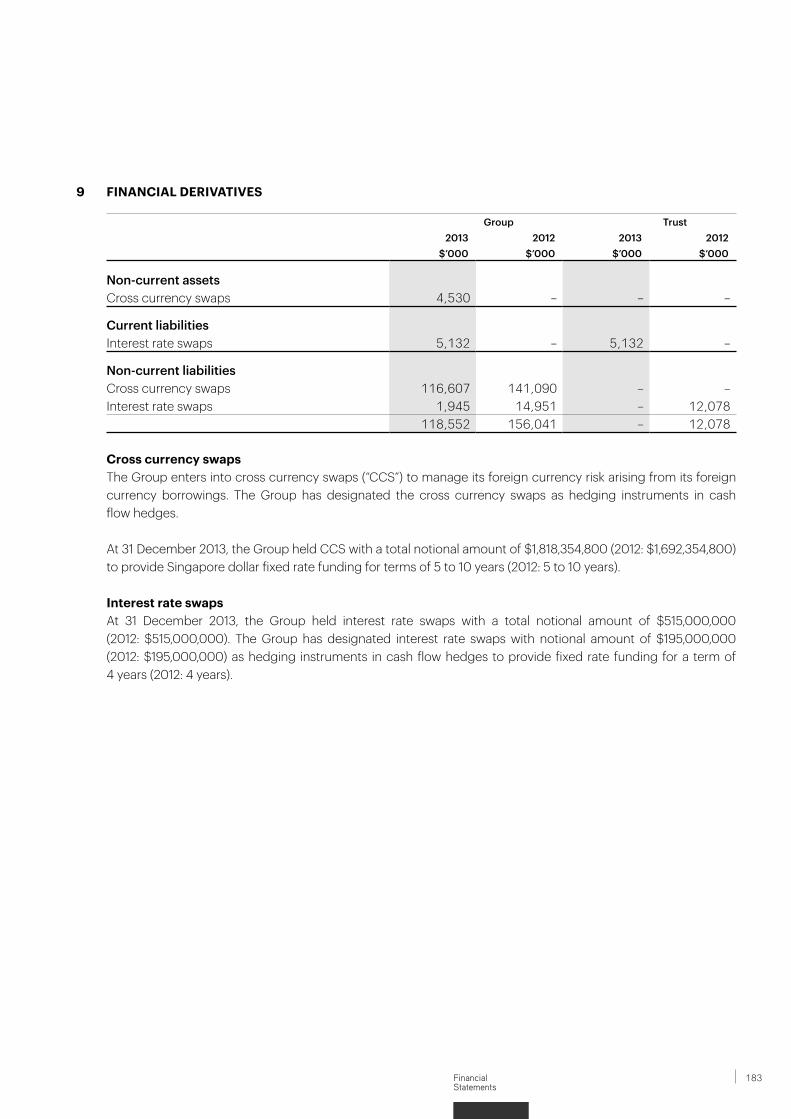
FinancialStatements
183
9 FINANCIAL DERIVATIVES
Group Trust2013 2012 2013 2012
$’000 $’000 $’000 $’000
Non-current assetsCross currency swaps 4,530 – – –
Current liabilitiesInterest rate swaps 5,132 – 5,132 –
Non-current liabilitiesCross currency swaps 116,607 141,090 – –Interest rate swaps 1,945 14,951 – 12,078
118,552 156,041 – 12,078
Cross currency swaps The Group enters into cross currency swaps (“CCS”) to manage its foreign currency risk arising from its foreign
currency borrowings. The Group has designated the cross currency swaps as hedging instruments in cash flow hedges.
At 31 December 2013, the Group held CCS with a total notional amount of $1,818,354,800 (2012: $1,692,354,800) to provide Singapore dollar fixed rate funding for terms of 5 to 10 years (2012: 5 to 10 years).
Interest rate swaps At 31 December 2013, the Group held interest rate swaps with a total notional amount of $515,000,000
(2012: $515,000,000). The Group has designated interest rate swaps with notional amount of $195,000,000 (2012: $195,000,000) as hedging instruments in cash flow hedges to provide fixed rate funding for a term of 4 years (2012: 4 years).
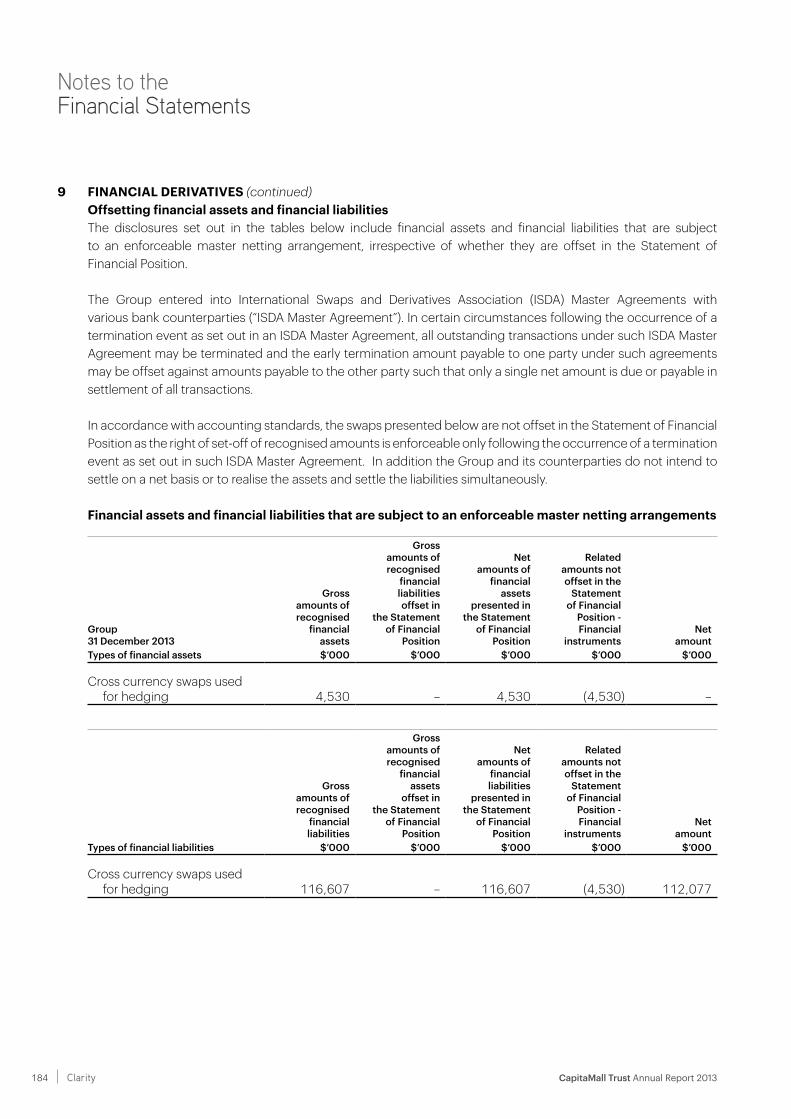
CapitaMall Trust Annual Report 2013 184 Clarity
Notes to the Financial Statements
9 FINANCIAL DERIVATIVES (continued) Offsetting financial assets and financial liabilities The disclosures set out in the tables below include financial assets and financial liabilities that are subject
to an enforceable master netting arrangement, irrespective of whether they are offset in the Statement of Financial Position.
The Group entered into International Swaps and Derivatives Association (ISDA) Master Agreements with various bank counterparties (“ISDA Master Agreement”). In certain circumstances following the occurrence of a termination event as set out in an ISDA Master Agreement, all outstanding transactions under such ISDA Master Agreement may be terminated and the early termination amount payable to one party under such agreements may be offset against amounts payable to the other party such that only a single net amount is due or payable in settlement of all transactions.
In accordance with accounting standards, the swaps presented below are not offset in the Statement of Financial Position as the right of set-off of recognised amounts is enforceable only following the occurrence of a termination event as set out in such ISDA Master Agreement. In addition the Group and its counterparties do not intend to settle on a net basis or to realise the assets and settle the liabilities simultaneously.
Financial assets and financial liabilities that are subject to an enforceable master netting arrangements
Group 31 December 2013
Grossamounts ofrecognised
financialassets
Grossamounts ofrecognised
financialliabilitiesoffset in
the Statementof Financial
Position
Netamounts of
financialassets
presented inthe Statement
of FinancialPosition
Relatedamounts notoffset in the
Statementof Financial
Position -Financial
instrumentsNet
amountTypes of financial assets $’000 $’000 $’000 $’000 $’000
Cross currency swaps used for hedging 4,530 – 4,530 (4,530) –
Grossamounts ofrecognised
financialliabilities
Grossamounts ofrecognised
financialassets
offset inthe Statement
of FinancialPosition
Netamounts of
financialliabilities
presented inthe Statement
of FinancialPosition
Relatedamounts notoffset in the
Statementof Financial
Position -Financial
instrumentsNet
amountTypes of financial liabilities $’000 $’000 $’000 $’000 $’000
Cross currency swaps used for hedging 116,607 – 116,607 (4,530) 112,077

FinancialStatements
185
9 FINANCIAL DERIVATIVES (continued) Offsetting financial assets and financial liabilities (continued)
Group 31 December 2012
Grossamounts ofrecognised
financialliabilities
Grossamounts ofrecognised
financialassets
offset inthe Statement
of FinancialPosition
Netamounts of
financialliabilities
presented inthe Statement
of FinancialPosition
Relatedamounts notoffset in the
Statementof Financial
Position -Financial
instrumentsNet
amountTypes of financial liabilities $’000 $’000 $’000 $’000 $’000
Cross currency swaps used for hedging 141,090 – 141,090 – 141,090
The tables below reconcile the ‘Net amounts of financial assets and financial liabilities presented in Statement of Financial Position’, as set out above, to the line items presented in the Statement of Financial Position.
Group 31 December 2013
Netamounts
Line item inStatement
of FinancialPosition
Carryingamount inStatement
of FinancialPosition
Financialassets not
in scope ofoffsetting
disclosuresTypes of financial assets $’000 $’000 $’000
Cross currency swaps used for hedging 4,530
Non-currentfinancial
derivatives 4,530 –
Netamounts
Line item inStatement
of FinancialPosition
Carryingamount inStatement
of FinancialPosition
Financialliabilities not
in scope ofoffsetting
disclosuresTypes of financial liabilities $’000 $’000 $’000
Cross currency swaps used for hedging 116,607
Non-currentfinancial
derivatives 118,552 1,945
Group 31 December 2012
Netamounts
Line item inStatement
of FinancialPosition
Carryingamount inStatement
of FinancialPosition
Financialliabilities not
in scope ofoffsetting
disclosuresTypes of financial liabilities $’000 $’000 $’000
Cross currency swaps used for hedging 141,090
Non-currentfinancial
derivatives 156,041 14,951
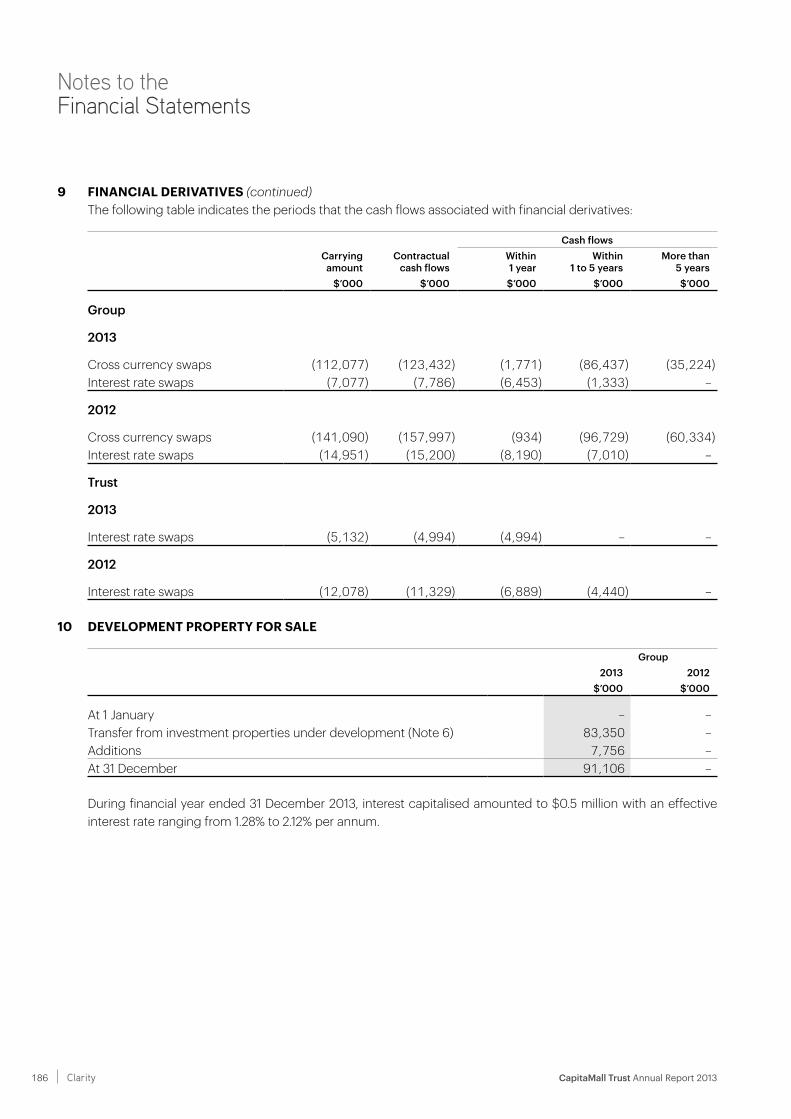
CapitaMall Trust Annual Report 2013 186 Clarity
Notes to the Financial Statements
9 FINANCIAL DERIVATIVES (continued) The following table indicates the periods that the cash flows associated with financial derivatives:
Cash flowsCarrying
amountContractual
cash flowsWithin 1 year
Within 1 to 5 years
More than5 years
$’000 $’000 $’000 $’000 $’000
Group
2013
Cross currency swaps (112,077) (123,432) (1,771) (86,437) (35,224)Interest rate swaps (7,077) (7,786) (6,453) (1,333) –
2012
Cross currency swaps (141,090) (157,997) (934) (96,729) (60,334)Interest rate swaps (14,951) (15,200) (8,190) (7,010) –
Trust
2013
Interest rate swaps (5,132) (4,994) (4,994) – –
2012
Interest rate swaps (12,078) (11,329) (6,889) (4,440) –
10 DEVELOPMENT PROPERTY FOR SALE
Group2013 2012
$’000 $’000
At 1 January – –Transfer from investment properties under development (Note 6) 83,350 –Additions 7,756 –At 31 December 91,106 –
During financial year ended 31 December 2013, interest capitalised amounted to $0.5 million with an effective interest rate ranging from 1.28% to 2.12% per annum.
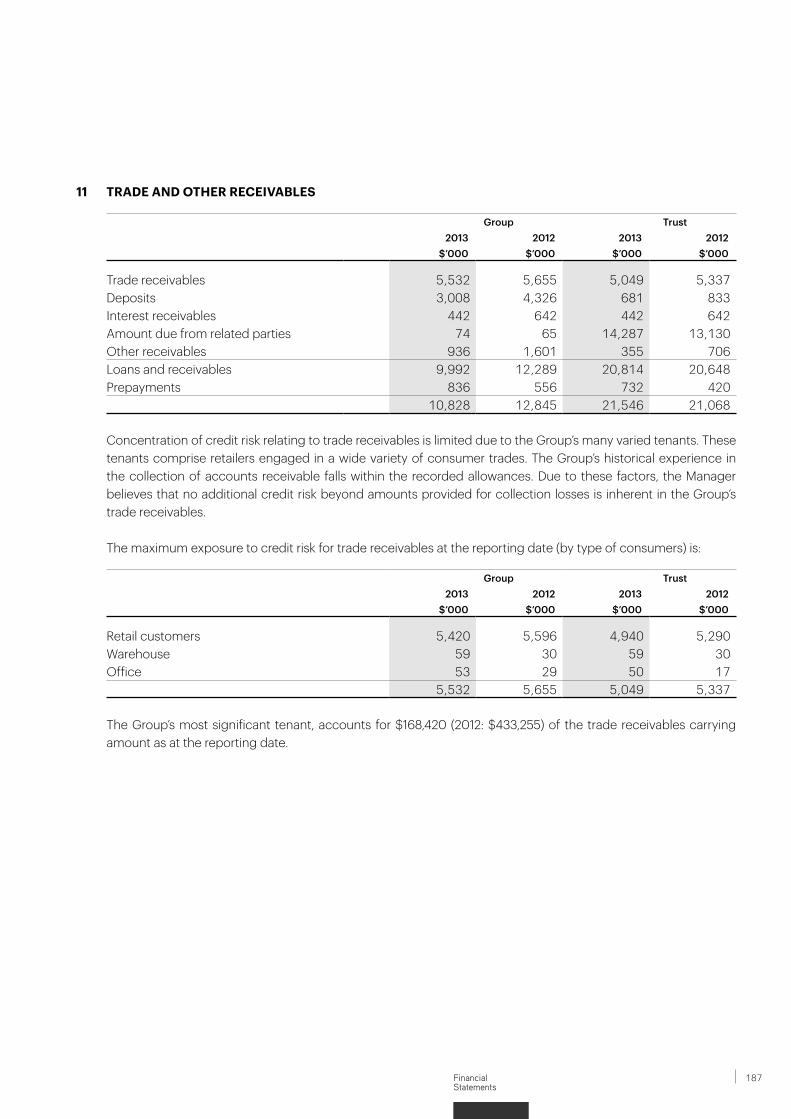
FinancialStatements
187
11 TRADE AND OTHER RECEIVABLES
Group Trust2013 2012 2013 2012
$’000 $’000 $’000 $’000
Trade receivables 5,532 5,655 5,049 5,337Deposits 3,008 4,326 681 833Interest receivables 442 642 442 642Amount due from related parties 74 65 14,287 13,130Other receivables 936 1,601 355 706Loans and receivables 9,992 12,289 20,814 20,648Prepayments 836 556 732 420
10,828 12,845 21,546 21,068
Concentration of credit risk relating to trade receivables is limited due to the Group’s many varied tenants. These tenants comprise retailers engaged in a wide variety of consumer trades. The Group’s historical experience in the collection of accounts receivable falls within the recorded allowances. Due to these factors, the Manager believes that no additional credit risk beyond amounts provided for collection losses is inherent in the Group’s trade receivables.
The maximum exposure to credit risk for trade receivables at the reporting date (by type of consumers) is:
Group Trust2013 2012 2013 2012
$’000 $’000 $’000 $’000
Retail customers 5,420 5,596 4,940 5,290Warehouse 59 30 59 30Office 53 29 50 17
5,532 5,655 5,049 5,337
The Group’s most significant tenant, accounts for $168,420 (2012: $433,255) of the trade receivables carrying amount as at the reporting date.

CapitaMall Trust Annual Report 2013 188 Clarity
Notes to the Financial Statements
11 TRADE AND OTHER RECEIVABLES (continued)Impairment losses
The ageing of receivables at the reporting date is:
Group Trust
GrossImpairment
losses GrossImpairment
losses$’000 $’000 $’000 $’000
2013
Not past due 4,828 – 4,450 –Past due 31 – 60 days 566 – 503 –Past due 61 – 90 days 104 – 75 –Over 90 days 58 (24) 21 –
5,556 (24) 5,049 –
2012
Not past due 4,807 – 4,532 –Past due 31 – 60 days 728 – 686 –Past due 61 – 90 days 85 – 85 –Over 90 days 35 – 34 –
5,655 – 5,337 –
The change in impairment loss in respect of trade receivables during the year is as follows:
Group Trust2013 2012 2013 2012
$’000 $’000 $’000 $’000
As at 1 January – – – –Allowance recognised during the year 24 3 – –Allowance reversed during the year – (3) – –As at 31 December 24 – – –
The Manager believes that no impairment allowance is necessary in respect of the remaining trade receivables as these receivables arose mainly from tenants that have good record with the Group and have sufficient security deposits as collateral.
12 CASH AND CASH EQUIVALENTS
Group Trust2013 2012 2013 2012
$’000 $’000 $’000 $’000
Cash at bank and in hand 11,733 9,873 8,764 7,638Fixed deposits with financial institutions 820,954 1,108,397 820,954 1,096,832Cash and cash equivalents in the statements of
cash flow 832,687 1,118,270 829,718 1,104,470
The weighted average effective interest rate relating to cash and cash equivalents at the reporting date for the Group and Trust is 0.56% per annum (2012: Group 0.56% and Trust 0.57%).

FinancialStatements
189
13 TRADE AND OTHER PAYABLES
Group Trust2013 2012 2013 2012
$’000 $’000 $’000 $’000
Trade payables and accrued operating expenses 116,902 126,222 94,154 107,248Amounts due to related parties (trade) 15,032 14,245 12,165 11,583Deposits and advances 14,322 14,352 12,034 12,544Interest payable 23,717 28,679 23,187 28,087Distribution payable – 51,637 – 51,637
169,973 235,135 141,540 211,099
Included in amounts due to related parties of the Group are amounts due to the Manager of $11,461,000 (2012: $11,054,000), the Property Manager (CapitaLand Retail Management Pte Ltd) of $2,717,000 (2012: $2,145,000) and the Project Manager (CapitaLand Retail Project Management Pte Ltd) of $207,000 (2012: $155,000). At Trust level, the amount due to related parties is an amount due to the Manager of $10,028,000 (2012: $9,667,000), the Property Manager of $2,039,000 (2012: $1,856,000) and the Project Manager of $3,000 (2012: $33,000).
Included in trade payables and accrued operating expenses of the Group and the Trust is an amount due to the Trustee of $328,000 (2012: $325,000) and $290,000 (2012: $288,000) respectively.
14 INTEREST-BEARING BORROWINGS
Group Trust2013 2012 2013 2012
$’000 $’000 $’000 $’000
Current liabilitiesTerm loans (unsecured) 150,000 300,000 150,000 300,000
150,000 300,000 150,000 300,000
Non-current liabilitiesTerm loans (secured) 595,000 595,000 – –Unamortised transaction costs (2,958) (4,449) – –
592,042 590,551 – –
Revolving credit facilities (secured) 53,800 20,495 – –Unamortised transaction costs (586) (288) – –
53,214 20,207 – –
Term loans (unsecured) 2,310,277 2,211,816 2,418,354 2,342,355Unamortised transaction costs (3,273) (3,255) (3,273) (3,255)
2,307,004 2,208,561 2,415,081 2,339,100
2,952,260 2,819,319 2,415,081 2,339,100
Total interest-bearing borrowings 3,102,260 3,119,319 2,565,081 2,639,100

CapitaMall Trust Annual Report 2013 190 Clarity
Notes to the Financial Statements
14 INTEREST-BEARING BORROWINGS (continued)Terms and debt repayment schedule
Terms and conditions of outstanding interest-bearing borrowings are as follows:
2013 2012Nominal
interest rate Year of maturityFace
valueCarrying
amountFace
valueCarrying
amount% $’000 $’000 $’000 $’000
Group
SecuredSGD fixed rate term loans 3.025 – 3.09 2016 400,000 397,863 400,000 396,652 SGD floating rate term loan 3 months SOR
+ 1.132016 195,000 194,179 195,000 193,899
SGD floating rate revolving credit facilities
3 months SOR + 1.13 to 1.23
2016 53,800 53,214 20,495 20,207
UnsecuredRetail bonds 2.00 2013 – – 300,000 300,000USD fixed rate term loan 3.73 – 4.32 2015 to 2018 1,137,285 1,136,037 1,099,335 1,097,783JPY fixed rate term loan 1.04 – 1.31 2019 to 2020 240,947 240,433 141,825 141,438HKD fixed rate term loan 3.28 – 3.76 2022 to 2023 332,045 331,215 320,656 319,739SGD fixed rate term loan 2.85 – 3.85 2014 to 2024 750,000 749,319 650,000 649,601
3,109,077 3,102,260 3,127,311 3,119,319
Trust
UnsecuredRetail bonds 2.00 2013 – – 300,000 300,000SGD fixed rate term loan 2.79 – 3.85 2014 to 2024 2,568,354 2,565,081 2,342,355 2,339,100
2,568,354 2,565,081 2,642,355 2,639,100
SOR – Swap Offer Rate

FinancialStatements
191
14 INTEREST-BEARING BORROWINGS (continued) The following are the expected contractual undiscounted cash outflows of financial liabilities including interest
payments and excluding the impact of netting agreements:
Cash flows Carrying
amountContractual
cash flowsWithin 1 year
Within 1 to 5 years
More than 5 years
$’000 $’000 $’000 $’000 $’000
Group
2013
Non-derivative financial liabilities
SecuredSGD fixed rate term loans 397,863 430,434 12,308 418,126 –SGD floating rate term loan 194,179 202,410 2,513 199,897 –SGD floating rate revolving
credit facilities 53,214 55,798 665 55,133 –
UnsecuredUSD fixed rate term loan 1,136,037 1,251,598 46,156 1,205,442 –JPY fixed rate term loan 240,433 258,676 2,829 11,315 244,532HKD fixed rate term loan 331,215 435,360 11,792 47,167 376,401SGD fixed rate term loans 749,319 869,830 174,096 408,068 287,666Convertible bonds 348,349 352,221 352,221 – –Trade and other payables 169,973 169,973 169,973 – –Security deposits 158,760 158,760 45,225 112,083 1,452Other payables 2,943 2,943 – 2,943 –
3,782,285 4,188,003 817,778 2,460,174 910,051

CapitaMall Trust Annual Report 2013 192 Clarity
Notes to the Financial Statements
14 INTEREST-BEARING BORROWINGS (continued)
Cash flows Carrying
amountContractual
cash flowsWithin 1 year
Within 1 to 5 years
More than 5 years
$’000 $’000 $’000 $’000 $’000
Group
2012
Non-derivative financial liabilities
SecuredSGD fixed rate term loans 396,652 442,742 12,308 430,434 –SGD floating rate term loan 193,899 205,629 2,648 202,981 –SGD floating rate revolving
credit facility 20,207 21,559 262 21,297 –Convertible bonds 105,188 108,380 108,380 – –
UnsecuredRetail bonds 300,000 300,921 300,921 – –USD fixed rate term loan 1,097,783 1,254,340 44,620 717,165 492,555JPY fixed rate term loan 141,438 154,429 1,856 7,426 145,147HKD fixed rate term loan 319,739 431,815 11,387 45,549 374,879SGD fixed rate term loans 649,601 770,230 22,363 560,788 187,079Convertible bonds 342,789 359,659 7,438 352,221 –Trade and other payables 235,135 235,135 235,135 – –Security deposits 148,529 148,529 54,017 94,512 –
3,950,960 4,433,368 801,335 2,432,373 1,199,660

FinancialStatements
193
14 INTEREST-BEARING BORROWINGS (continued)
Cash flows Carrying
amountContractual
cash flowsWithin 1 year
Within 1 to 5 years
More than 5 years
$’000 $’000 $’000 $’000 $’000
Trust
2013
Non-derivative financial liabilities
UnsecuredSGD fixed rate term loans 2,565,081 2,942,757 236,788 1,751,574 954,395Convertible bonds 348,349 352,221 352,221 – –Trade and other payables 141,540 141,540 141,540 – –Security deposits 142,028 142,028 41,118 99,823 1,087
3,196,998 3,578,546 771,667 1,851,397 955,482
2012
Non-derivative financial liabilities
SecuredConvertible bonds 105,188 108,380 108,380 – –
UnsecuredRetail bonds 300,000 300,921 300,921 – –SGD fixed rate term loans 2,339,100 2,748,871 81,125 1,422,846 1,244,900Convertible bonds 342,789 359,659 7,438 352,221 –Trade and other payables 211,099 211,099 211,099 – –Security deposits 135,877 135,877 48,379 87,498 –
3,434,053 3,864,807 757,342 1,862,565 1,244,900
CapitaMall Trust Annual Report 2013 194 Clarity
Notes to the Financial Statements
14 INTEREST-BEARING BORROWINGS (continued) The interest-bearing borrowings comprise the following:
(1) Unsecured term loans of CMT MTN The Group has a $2.5 billion Multicurrency Medium Term Note Programme (“MTN Programme”) and
a Euro-Medium Term Note Programme (“EMTN Programme”) which was increased from US$2.0 billion to US$3.0 billion with effect from 3 April 2013.
Under the MTN Programme, CMT MTN may, subject to compliance with all relevant laws, regulations and directives, from time to time issue notes in series or tranches in Singapore dollars, United States dollars or any other currency (“MTN Notes”).
Under the EMTN Programme, CMT MTN may, subject to compliance with all relevant laws, regulations and directives, from time to time issue notes in series or tranches in Euro, Sterling, United States dollars, Singapore dollars and any other currency (“EMTN Notes”).
Each series or tranche of notes may be issued in various amounts and tenors, and may bear fixed, floating or variable rates of interest. Hybrid notes or zero coupon notes may also be issued under the MTN Programme and EMTN Programme.
The MTN Notes and EMTN Notes shall constitute direct, unconditional, unsecured and unsubordinated obligations of CMT MTN ranking pari passu, without any preference or priority among themselves and pari passu with all other present and future unsecured obligations at CMT MTN. All sums payable in respect of the notes will be unconditionally and irrevocably guaranteed by the Trustee.
At 31 December 2013, notes issued by CMT MTN are as follows:
– under the MTN Programme:
(i) $750.0 million (2012: $650.0 million) of fixed rate notes maturing between 2014 to 2024; and
(ii) JPY10.0 billion (2012: Nil) of fixed rate notes maturing in 2020.
– under the EMTN Programme:
(i) US$900.0 million (2012: US$900.0 million) of fixed rate notes maturing between 2015 to 2018;
(ii) JPY10.0 billion (2012: JPY10.0 billion) of fixed rate notes maturing in 2019; and
(iii) HK$2.035 billion (2012: HK$2.035 billion) of fixed rate notes maturing between 2022 to 2023.
CMT MTN has entered into cross currency swaps to swap the abovementioned foreign currency notes into Singapore dollars.
CMT MTN has on-lent the Singapore dollars proceeds arising from each issue of MTN Notes and EMTN Notes under the MTN programme and EMTN programme to the Trust. The Trust will use the proceeds of such loans to refinance existing borrowings of the Group, to finance/refinance the investments held by the Trust, to on-lend to any trust, fund or entity in which the Trust has an interest, to finance any capital expenditure and asset enhancement works initiated in respect of the Trust or such trust, fund, or entity and to finance the general corporate and working capital purposes in respect of the Group.

FinancialStatements
195
14 INTEREST-BEARING BORROWINGS (continued)(2) Unsecured retail bonds of the Trust On 25 February 2013, the $300.0 million bonds issued under the $2.5 billion Retail Bond Programme was
repaid. The bonds were issued on 25 February 2011 and carried an interest of 2.0% per annum.
(3) Secured term loans of RCS Trust The secured term loan and revolving credit facility by the RCS Trust were granted by a special purpose
company, Silver Oak Ltd (“Silver Oak”).
Silver Oak has on 21 June 2011 granted RCS Trust a term loan facility of $1,000.0 million and a revolving credit facility (“RCF”) of $300.0 million under the loan agreements between Silver Oak and RCS Trust Trustee-Manager.
As at 31 December 2013, the total loans drawn down by RCS Trust from Silver Oak are $1,007.0 million (2012: $1,000.0 million), consisting of:
(i) term loan of $800.0 million (2012: $800.0 million) at a fixed rate of 3.09% per annum, fully repayable on 21 June 2018. In the event the loan is not prepaid in full on 21 June 2016, interest will accrue on the loan at the rate of 4.565% above the Singapore dollar Swap Offer Rate (“SOR”) repriced every three months, for the period from 21 June 2016 to 21 June 2018;
(ii) term loan of $200.0 million (2012: $200.0 million) at a fixed rate of 3.025% per annum, fully repayable on 21 June 2018. In the event the loan is not prepaid in full on 21 June 2016, interest will accrue on the loan at the rate of 2.23% above the Singapore dollar SOR repriced every three months, for the period from 21 June 2016 to 21 June 2018; and
(iii) RCF of $300.0 million of which $7.0 million (2012: Nil) was drawn down at a floating rate of 1.23% per annum above the Singapore dollar SOR, fully repayable on 21 June 2018. In the event the facility is not prepaid in full on 21 June 2016, interest will accrue on the facility at the rate of 2.23% above the Singapore dollar SOR repriced every three months, for the period from 21 June 2016 to 21 June 2018.
As security for the facilities granted by Silver Oak to the RCS Trust Trustee-Manager, the RCS Trust Trustee-Manager has granted in favour of Silver Oak the following:
(i) a mortgage over Raffles City Singapore;
(ii) an assignment of the insurance policy relating to Raffles City Singapore;
(iii) an assignment of the agreements relating to the management of Raffles City Singapore;
(iv) an assignment and charge of the rental proceeds and tenancy agreements of units in Raffles City Singapore; and
(v) a fixed and floating charge over certain assets of RCS Trust relating to Raffles City Singapore.
As at 31 December 2013, the Group’s 40.0% share of RCS Trust’s term loans and the amount drawn down under RCF are $400.0 million (2012: $400.0 million) and $2.8 million (2012: Nil) respectively.

CapitaMall Trust Annual Report 2013 196 Clarity
Notes to the Financial Statements
14 INTEREST-BEARING BORROWINGS (continued)(3) Secured term loans of RCS Trust (continued) To fund the loans to RCS Trust of $1,007.0 million (2012: $1,000.0 million), Silver Oak has:
(i) issued US$645.0 million (2012: US$645.0 million) in principal amount of Class A Secured Floating Rate Notes under the $10,000,000,000 Multicurrency Secured Medium Term Note Programme at floating interest rate of 1.45% per annum above the US dollar LIBOR repriced every three months, with expected maturity on 21 June 2016 (the “Series 002 Notes”). In the event that the Series 002 Notes are not redeemed by Silver Oak on 21 June 2016, interest will accrue at the rate of 2.45% per annum above the US dollar LIBOR repriced every three months, for the period from 21 June 2016 to date of redemption on 21 June 2018. Silver Oak has entered into a cross currency swap agreement to swap the proceeds from the Series 002 Notes into $800.0 million;
(ii) drawn down term loan of $200.0 million granted by banks at floating interest rate of 1.23% per annum above the Singapore dollar SOR repriced every three months, with expected maturity on 21 June 2016. In the event that the term loans are not repaid by Silver Oak on 21 June 2016, interest will accrue at the rate of 2.23% per annum above the Singapore dollar SOR repriced every three months, for the period from 21 June 2016 to date of final maturity on 21 June 2018. Silver Oak has entered into an interest rate swap agreement to hedge the floating interest rates of the term loan to a fixed rate term loan; and
(iii) in place $300.0 million RCF from banks to fund loan requests under the RCF provided to RCS Trust. Silver Oak has drawn down RCF of $7.0 million (2012: Nil) granted by banks at floating interest rate of 1.23% per annum above the Singapore dollar SOR repriced every three months, with expected maturity on 21 June 2016. In the event that the facility is not repaid by Silver Oak on 21 June 2016, interest will accrue at the rate of 2.23% per annum above the Singapore dollar SOR repriced every three months, for the period from 21 June 2016 to date of final maturity on 21 June 2018.
As security for the Notes, Silver Oak has created a fixed and floating charge over the assets of RCS Trust in favour of the Silver Oak Notes Trustee under the Notes Debenture.
(4) Secured term loans of Infinity Mall Trust and Infinity Office Trust Under the secured facility agreement dated 28 October 2011 between JG Trustee Pte. Ltd., JG2 Trustee
Pte. Ltd. and various banks and financial institutions, the banks and financial institutions have granted Infinity Mall Trust and Infinity Office Trust total facility of $820.0 million comprising the term loan facility of $650.0 million and RCF of $170.0 million.
The term loan facility drawn down by Infinity Mall Trust and Infinity Office Trust as at 31 December 2013 is $650.0 million (2012: $650.0 million) at a floating interest rate of 1.13% above the Singapore dollar SOR repriced every quarter, for the period from 30 November 2011 to the earlier of (i) the date after 12 months after the Final Temporary Occupation Permit date for the mixed development which comprises Westgate and Westgate Tower (“Infinity Project”) or (ii) 60 months after date of facility agreement.
As at 31 December 2013, Infinity Mall Trust and Infinity Office Trust have entered into interest rate swaps that pay fixed interest rate and receive variable rates on the notional contractual amount of $650.0 million (2012: $650.0 million).

FinancialStatements
197
14 INTEREST-BEARING BORROWINGS (continued)(4) Secured term loans of Infinity Mall Trust and Infinity Office Trust (continued) The Group’s 30.0% share of the $650.0 million term loan drawn by Infinity Mall Trust and Infinity Office Trust
amounts to $195.0 million.
The revolving credit facility drawn down by Infinity Mall Trust and Infinity Office Trust as at 31 December 2013 is $170.0 million (2012: $68.3 million) at a floating interest rate of 1.13% above the Singapore dollar SOR repriced every month, for the period from 30 November 2011 to the earlier of (i) the date after 12 months after the Final Temporary Occupation Permit date for the Infinity Project or (ii) 60 months after date of facility agreement.
The Group’s 30.0% share of the $170.0 million revolving credit facility drawn by Infinity Mall Trust and Infinity Office Trust amounts to $51.0 million.
As security for the loans, Infinity Mall Trust and Infinity Office Trust have granted in favour of the lenders the following:
(i) a mortgage over the properties;(ii) an assignment and charge of the rental proceeds, tenancy agreements, sale proceeds and sale
agreements;(iii) an assignment of the insurance policies relating to each of the properties;(iv) an assignment of the building agreement relating to each of the properties;(v) an assignment of the project documents relating to each of the properties; and(vi) a fixed and floating charge over certain assets of the Infinity Mall Trust and Infinity Office Trust relating
to the properties.
15 CONVERTIBLE BONDS
Group and Trust2013 2012
$’000 $’000
Debt component at 1 January 447,977 600,080Amortisation of transaction costs 2,865 4,402Interest accretion 4,904 13,837Redemption of Convertible Bonds due 2013 (107,397) –Repurchase of Convertible Bonds due 2013 – (170,342)Debt component at 31 December 348,349 447,977
Current liabilities 348,349 105,188Non-current liabilities – 342,789
348,349 447,977
Convertible Bonds due 2013 On 2 July 2013, the remaining $98.25 million of $650.0 million principal amount of convertible bonds due 2013
(“Convertible Bonds due 2013”) issued on 2 July 2008 and carrying coupon interest at 1.0% per annum were fully redeemed at 109.31% of the principal amount upon maturity. Following the redemption, the legal mortgage over The Atrium@Orchard had been discharged and released.

CapitaMall Trust Annual Report 2013 198 Clarity
Notes to the Financial Statements
15 CONVERTIBLE BONDS (continued)Convertible Bonds due 2014
On 19 April 2011, the Trust issued $350.0 million principal amount of convertible bonds due 2014 (“Convertible Bonds due 2014”) at 2.125% per annum. As at 31 December 2013, the Convertible Bonds due 2014 are convertible by bondholders into Units at a conversion price of $2.2427 (which is adjusted to $2.1955 on 3 February 2014) up to 3.00 p.m. on 9 April 2014 (at the place where the certificate evidencing such Convertible Bonds due 2014 is deposited for conversion), subject to customary closed periods and the terms and conditions of the Convertible Bonds due 2014. The final redemption date of the Convertible Bonds due 2014 is 19 April 2014.
16 AMOUNTS OWING TO JOINT VENTURE PARTNERS The amounts relate to the Trust’s share of joint ventures’ loans from the other joint venture partners and are not
expected to be repayable in the next twelve months from the reporting date.
17 UNITS IN ISSUE
Group and Trust2013 2012’000 ’000
Units in issue:At 1 January 3,456,421 3,328,417Units created:– as payment of asset management fees in relation to the Trust’s 40.0% interest in RCS Trust 2,736 3,004– equity fund raising – 125,000Total issued units at 31 December 3,459,157 3,456,421
On 30 November 2012, the Trust issued 125,000,000 new units at $2.00 per unit for cash for the purposes of capital expenditure and asset enhancement initiatives of the Trust properties, refinancing of existing debts of the Group and/or general corporate and working capital.
Each unit in the Trust represents an undivided interest in the Trust. The rights and interests of Unitholders are contained in the Trust Deed and include the right to:
• Receiveincomeandotherdistributionsattributabletotheunitsheld;
• Participate in the termination of the Trust by receiving a share of all net cash proceeds derived from the realisation of the assets of the Trust less any liabilities, in accordance with their proportionate interests in the Trust. However, a Unitholder has no equitable or proprietary interest in the underlying assets of the Trust and is not entitled to the transfer to it of any assets (or part thereof) or of any estate or interest in any asset (or part thereof) of the Trust;
• AttendallUnitholdersmeetings.TheTrusteeortheManagermay(andtheManagershallat therequest in writing of not less than 50 Unitholders or one-tenth in number of the Unitholders, whichever is lesser) at any time convene a meeting of Unitholders in accordance with the provisions of the Trust Deed; and
• Onevoteperunit.

FinancialStatements
199
17 UNITS IN ISSUE (continued) The restrictions of a Unitholder include the following:
• AUnitholder’srightislimitedtotherighttorequiredueadministrationoftheTrustinaccordancewiththeprovisions of the Trust Deed; and
• AUnitholderhasnorighttorequesttheManagertoredeemhisunitswhiletheunitsarelistedonSGX-ST.
A Unitholder’s liability is limited to the amount paid or payable for any units in the Trust. The provisions of the Trust Deed provide that no Unitholders will be personally liable for indemnifying the Trustee or any creditor of the Trustee in the event that liabilities of the Trust exceed its assets.
18 GROSS REVENUE
Group Trust 2013 2012 2013 2012
$’000 $’000 $’000 $’000
Gross rental income 676,586 610,908 589,319 526,502Car park income 20,532 19,128 18,174 16,985Others 32,044 31,552 30,097 29,731
729,162 661,588 637,590 573,218
19 PROPERTY OPERATING EXPENSES
Group Trust 2013 2012 2013 2012
$’000 $’000 $’000 $’000
Land rental 1,269 1,153 1,269 1,153Property tax 63,260 57,378 55,590 50,022Utilities 37,650 40,373 32,337 34,472Property management fees 27,648 24,689 24,066 21,222Property management reimbursements 34,351 30,901 30,696 28,163Marketing 17,017 17,756 13,427 16,608Maintenance 40,189 40,146 37,013 37,117Others 5,079 3,939 4,477 3,733
226,463 216,335 198,875 192,490
20 INTEREST AND OTHER INCOME
Group Trust 2013 2012 2013 2012
$’000 $’000 $’000 $’000
Interest income: – financial institutions 3,983 6,057 3,960 5,998– joint ventures – – 2,543 2,872Other income – 495 – –
3,983 6,552 6,503 8,870

CapitaMall Trust Annual Report 2013 200 Clarity
Notes to the Financial Statements
21 INVESTMENT INCOME
Trust 2013 2012
$’000 $’000
Distribution income from:– joint venture 53,932 52,205– associate 7,595 15,289
Special preference dividend income from:– subsidiary 3,538 –
65,065 67,494
22 ASSET MANAGEMENT FEES
Group Trust 2013 2012 2013 2012
$’000 $’000 $’000 $’000
Base fees 23,782 24,452 20,807 21,533Performance fees 20,864 18,918 18,208 16,337
44,646 43,370 39,015 37,870
Included in the asset management fees are fees for RCS Trust comprising base fees of $2,975,000 (2012: $2,919,000) and performance fees of $2,656,000 (2012: $2,581,000) which are paid/payable in units.
23 FINANCE COSTS
Group Trust 2013 2012 2013 2012
$’000 $’000 $’000 $’000
Interest paid/payable:– subsidiary – – 81,774 63,507– other joint venture partners 174 – – –– term loans 95,298 104,458 888 28,609– convertible bonds 8,026 10,130 8,026 10,130– revolving credit facilities 48 – – –– realised loss on financial derivatives 7,696 7,383 7,696 7,383Accreted interest on convertible bonds 4,904 11,520 4,904 11,520Amortisation of transaction costs 4,523 4,691 3,298 3,877Others 69 756 42 389
120,738 138,938 106,628 125,415
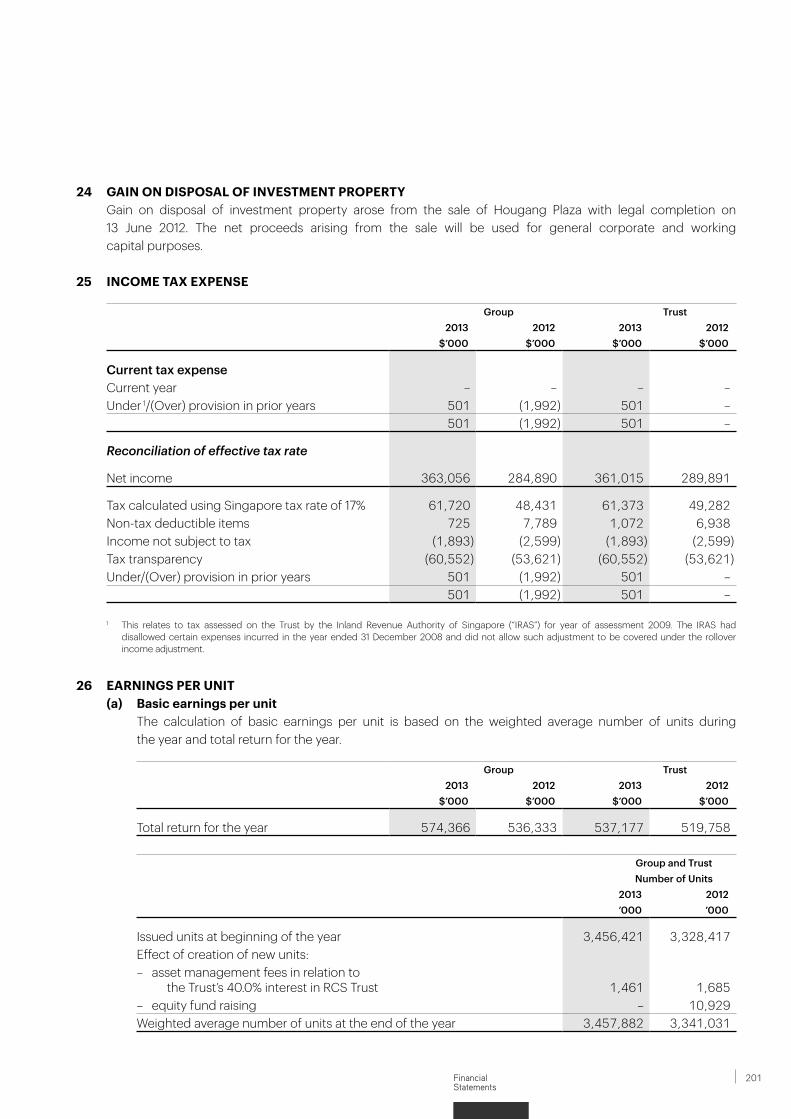
FinancialStatements
201
24 GAIN ON DISPOSAL OF INVESTMENT PROPERTY Gain on disposal of investment property arose from the sale of Hougang Plaza with legal completion on
13 June 2012. The net proceeds arising from the sale will be used for general corporate and working capital purposes.
25 INCOME TAX EXPENSE
Group Trust 2013 2012 2013 2012
$’000 $’000 $’000 $’000
Current tax expenseCurrent year – – – –Under 1/(Over) provision in prior years 501 (1,992) 501 –
501 (1,992) 501 –
Reconciliation of effective tax rate
Net income 363,056 284,890 361,015 289,891
Tax calculated using Singapore tax rate of 17% 61,720 48,431 61,373 49,282Non-tax deductible items 725 7,789 1,072 6,938Income not subject to tax (1,893) (2,599) (1,893) (2,599)Tax transparency (60,552) (53,621) (60,552) (53,621)Under/(Over) provision in prior years 501 (1,992) 501 –
501 (1,992) 501 –
1 This relates to tax assessed on the Trust by the Inland Revenue Authority of Singapore (“IRAS”) for year of assessment 2009. The IRAS had disallowed certain expenses incurred in the year ended 31 December 2008 and did not allow such adjustment to be covered under the rollover income adjustment.
26 EARNINGS PER UNIT(a) Basic earnings per unit The calculation of basic earnings per unit is based on the weighted average number of units during
the year and total return for the year.
Group Trust2013 2012 2013 2012
$’000 $’000 $’000 $’000
Total return for the year 574,366 536,333 537,177 519,758
Group and TrustNumber of Units
2013 2012’000 ’000
Issued units at beginning of the year 3,456,421 3,328,417Effect of creation of new units:– asset management fees in relation to the Trust’s 40.0% interest in RCS Trust 1,461 1,685– equity fund raising – 10,929Weighted average number of units at the end of the year 3,457,882 3,341,031

CapitaMall Trust Annual Report 2013 202 Clarity
Notes to the Financial Statements
26 EARNINGS PER UNIT (continued)(b) Diluted earnings per unit In calculating diluted earnings per unit, the total return for the year and weighted average number of units
during the year are adjusted for the effects of all dilutive potential units:
Group Trust2013 2012 2013 2012
$’000 $’000 $’000 $’000
Total return for the year 574,366 536,333 537,177 519,758Impact of conversion of the dilutive potential units 15,661 24,751 15,661 24,751Adjusted total return for the year 590,027 561,084 552,838 544,509
Group and TrustNumber of Units
2013 2012’000 ’000
Weighted average number of units used in calculation of basic earnings per unit 3,457,882 3,341,031Weighted average number of unissued units from convertible bonds 169,798 221,795Weighted average number of units in issue (diluted) 3,627,680 3,562,826
27 ISSUE EXPENSES
Group and Trust2013 2012
$’000 $’000
Underwriting and selling commissions – 3,461
28 RELATED PARTIES For the purposes of these financial statements, parties are considered to be related to the Group if
the Group has the ability, directly or indirectly, to control the parties or exercise significant influence over the parties in making financial and operating decisions, or vice versa, or where the Group and the parties are subject to common significant influence. Related parties may be individuals or other entities. The Manager, Project Manager (CapitaLand Retail Project Management Pte Ltd) and Property Manager (CapitaLand Retail Management Pte Ltd) are subsidiaries of a substantial Unitholder of the Trust.
In the normal course of the operations of the Trust, asset management fees and trustee’s fees have been paid or are payable to the Manager and Trustee respectively. The property management fees and property management reimbursements are payable to the Property Manager.

FinancialStatements
203
28 RELATED PARTIES (continued) During the financial year, other than those disclosed elsewhere in the financial statements, the following were
significant related party transactions, carried out in the normal course of business on arm’s length commercial terms:
Group Trust2013 2012 2013 2012
$’000 $’000 $’000 $’000
Asset enhancement works and consultancy fees paid/payable to related companies of the Manager 3,366 6,094 2,463 4,116
Rental and other income received/ receivable from related companies of the Manager 1,278 1,746 3,790 4,578
Divestment fees paid to the Manager – 596 – 596Other expenses paid/payable to related
companies of the Manager 3,973 1,122 3,459 1,134
29 FINANCIAL RISK MANAGEMENTCapital management
The Board of the Manager proactively reviews the Group’s and the Trust’s capital and debt management and financing policy regularly so as to optimise the Group’s and the Trust’s funding structure. Capital consists of Unitholders’ funds of the Group. The Board also monitors the Group’s and the Trust’s exposure to various risk elements and externally imposed requirements by closely adhering to clearly established management policies and procedures.
The Trust and its subsidiaries are subject to the aggregate leverage limit as defined in the Property Fund Appendix of the CIS code. The CIS code stipulates that the total borrowings and deferred payments (together the “Aggregate Leverage”) of a property fund should not exceed 35.0% of the fund’s deposited property. The Aggregate Leverage of a property fund may exceed 35.0% of the fund’s deposited property (up to a maximum of 60.0%) only if a credit rating of the property fund from Fitch Inc., Moody’s or Standard and Poor’s is obtained and disclosed to the public. The property fund should continue to maintain and disclose a credit rating so long as its Aggregate Leverage exceeds 35.0% of the fund’s deposited property.
The Trust has been assigned an ‘A2’ issuer rating in March 2013. The Group and the Trust have complied with the Aggregate Leverage limit of 60.0% during the financial year. There were no changes in the Group’s approach to capital management during the financial year.
Overview of risk management Risk management is integral to the whole business of the Group. The Group has a system of controls in place
to create an acceptable balance between the cost of risks occurring and the cost of managing the risks. The Manager continually monitors the Group’s risk management process to ensure that an appropriate balance between risk and control is achieved. Risk management policies and systems are reviewed regularly to reflect changes in market conditions and the Group’s activities.
The Audit Committee oversees how the Manager monitors compliance with the Group’s risk management policies and procedures and reviews the adequacy of the risk management framework in relation to the risks faced by the Group. The Audit Committee is assisted in its oversight role by Internal Audit. Internal Audit undertakes both regular and ad hoc reviews of risk management controls and procedures, the results of which are reported to the Audit Committee.
CapitaMall Trust Annual Report 2013 204 Clarity
Notes to the Financial Statements
29 FINANCIAL RISK MANAGEMENT (continued)Credit risk
Credit risk is the potential financial loss resulting from the failure of a customer or a counterparty to settle its financial and contractual obligations to the Group, as and when they fall due.
The Manager has established credit limits for customers and monitors their balances on an ongoing basis. Credit evaluations are performed by the Manager before lease agreements are entered into with tenants.
The Manager establishes an allowance for impairment that represents its estimate of incurred losses in respect of trade and other receivables. The main component of this allowance is a specific loss component that relates to the individually significant exposure.
The allowance account in respect of trade and other receivables is used to record impairment losses unless the Group is satisfied that no recovery of the amount owing is possible. At that point, the financial asset is considered irrecoverable and the amount charged to the allowance account is written off against the carrying amount of the impaired financial asset.
Cash and fixed deposits are placed with financial institutions which are regulated. The Group limits its credit risk exposure in respect of investments by only investing in liquid securities and only with counterparties that have sound credit ratings. Given these high credit ratings, management does not expect any counterparty to fail to meet its obligations.
At 31 December 2013 and 31 December 2012, there were no significant concentrations of credit risk. The maximum exposure to credit risk is represented by the carrying value of each financial asset on the balance sheet.
Liquidity risk The Manager monitors and maintains a level of cash and cash equivalents deemed adequate by management
to finance the Group’s operations and to mitigate the effects of fluctuations in cash flows. Typically, the Group ensures that it has sufficient cash on demand to meet expected operational expenses for a period of 60 days, including the servicing of financial obligations.
Market risk Market risk is the risk that changes in market prices, such as interest rates, foreign exchange rates and equity
prices will affect the Group’s income or the value of its holdings of financial instruments. The objective of market risk management is to manage and control market risk exposures within acceptable parameters, while optimising the return on risk.
Foreign currency risk The Group is exposed to foreign currency risk on interest-bearing borrowings that were denominated in a currency
other than the functional currency of the Group. The currencies giving rise to this risk are US Dollars, HK Dollars and JPY. The Group hedges this risk by entering into cross currency swaps with notional contract amounts of US$500.0 million, US$400.0 million, HK$1.15 billion, JPY10.0 billion, HK$885.0 million and JPY10.0 billion.

FinancialStatements
205
29 FINANCIAL RISK MANAGEMENT (continued)Foreign currency risk (continued)Sensitivity analysis
A 10.0% strengthening of Singapore dollar against the following foreign currency at the reporting date would decrease the Statement of Total Return and Unitholders’ funds as at 31 December 2013 by the amounts shown below. This analysis assumes that all other variables, in particular, interest rates, remain constant.
Statement ofTotal Return
Unitholders’ Funds
$’000 $’000
Group
2013
US dollar – (9,119)Hong Kong dollar – (2,492)Japanese Yen – (2,021)
– (13,632)
2012
US dollar – (13,554)Hong Kong dollar – (5,960)Japanese Yen – (1,557)
– (21,071)
A 10.0% weakening of Singapore dollar against the above currency would have had an equal but opposite effect on the above currency to the amounts shown above, on the basis that all other variables remain constant.
Interest rate risk The Group’s exposure to changes in interest rates relates primarily to interest-bearing financial liabilities.
Interest rate risk is managed on an ongoing basis with the primary objective of limiting the extent to which net interest expense could be affected by adverse movements in interest rates.
At 31 December 2013, the Group has interest rate swaps with total notional contract amount of $515,000,000 (2012: $515,000,000) whereby the Group has agreed with counterparties to exchange, at specified intervals, the difference between floating rate and fixed rate interest amounts calculated by reference to the agreed notional principal amounts of the secured and unsecured term loans.
The net fair value of the above swaps at 31 December 2013 is $7,077,000 (2012: $14,951,000) comprising current liabilities and non-current liabilities of $7,077,000 (2012: $14,951,000).
Sensitivity analysis An increase or decrease of 100 basis points in interest rate at the reporting date would increase or decrease
the Group’s and Trust’s Statement of Total Return and Unitholders’ funds by $534,000 (2012: $6,260,000) and $2,093,000 (2012: $5,269,000). This analysis assumes that all other variables, in particular foreign currency rates, remain constant.
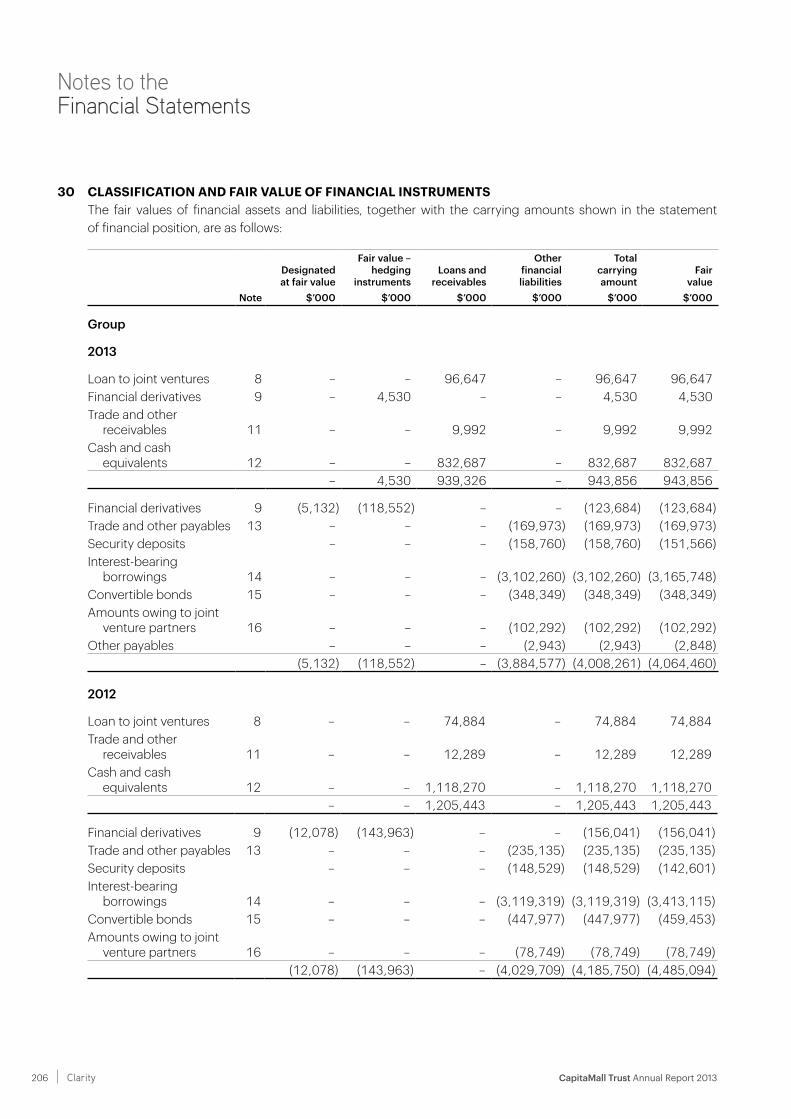
CapitaMall Trust Annual Report 2013 206 Clarity
Notes to the Financial Statements
30 CLASSIFICATION AND FAIR VALUE OF FINANCIAL INSTRUMENTS The fair values of financial assets and liabilities, together with the carrying amounts shown in the statement
of financial position, are as follows:
Designatedat fair value
Fair value –hedging
instrumentsLoans and
receivables
Other financial liabilities
Total carrying amount
Fairvalue
Note $’000 $’000 $’000 $’000 $’000 $’000
Group
2013
Loan to joint ventures 8 – – 96,647 – 96,647 96,647Financial derivatives 9 – 4,530 – – 4,530 4,530Trade and other
receivables 11 – – 9,992 – 9,992 9,992Cash and cash
equivalents 12 – – 832,687 – 832,687 832,687– 4,530 939,326 – 943,856 943,856
Financial derivatives 9 (5,132) (118,552) – – (123,684) (123,684)Trade and other payables 13 – – – (169,973) (169,973) (169,973)Security deposits – – – (158,760) (158,760) (151,566)Interest-bearing
borrowings 14 – – – (3,102,260) (3,102,260) (3,165,748)Convertible bonds 15 – – – (348,349) (348,349) (348,349)Amounts owing to joint
venture partners 16 – – – (102,292) (102,292) (102,292)Other payables – – – (2,943) (2,943) (2,848)
(5,132) (118,552) – (3,884,577) (4,008,261) (4,064,460)
2012
Loan to joint ventures 8 – – 74,884 – 74,884 74,884Trade and other
receivables 11 – – 12,289 – 12,289 12,289Cash and cash
equivalents 12 – – 1,118,270 – 1,118,270 1,118,270– – 1,205,443 – 1,205,443 1,205,443
Financial derivatives 9 (12,078) (143,963) – – (156,041) (156,041)Trade and other payables 13 – – – (235,135) (235,135) (235,135)Security deposits – – – (148,529) (148,529) (142,601)Interest-bearing
borrowings 14 – – – (3,119,319) (3,119,319) (3,413,115)Convertible bonds 15 – – – (447,977) (447,977) (459,453)Amounts owing to joint
venture partners 16 – – – (78,749) (78,749) (78,749)(12,078) (143,963) – (4,029,709) (4,185,750) (4,485,094)

FinancialStatements
207
30 CLASSIFICATION AND FAIR VALUE OF FINANCIAL INSTRUMENTS (continued)
Designatedat fair value
Fair value –hedging
instrumentsLoans and
receivables
Other financial liabilities
Total carrying amount
Fairvalue
Note $’000 $’000 $’000 $’000 $’000 $’000
Trust
2013
Loan to joint ventures 8 – – 146,131 – 146,131 146,131Trade and other
receivables 11 – – 20,814 – 20,814 20,814Cash and cash
equivalents 12 – – 829,718 – 829,718 829,718– – 996,663 – 996,663 996,663
Financial derivatives 9 (5,132) – – – (5,132) (5,132)Trade and other payables 13 – – – (141,540) (141,540) (141,540)Security deposits – – – (142,028) (142,028) (135,438)Interest-bearing
borrowings 14 – – – (2,565,081) (2,565,081) (2,627,065)Convertible bonds 15 – – – (348,349) (348,349) (348,349)
(5,132) – – (3,196,998) (3,202,130) (3,257,524 )
2012
Loan to joint ventures 8 – – 112,498 – 112,498 112,498Trade and other
receivables 11 – – 20,648 – 20,648 20,648Cash and cash
equivalents 12 – – 1,104,470 – 1,104,470 1,104,470– – 1,237,616 – 1,237,616 1,237,616
Financial derivatives 9 (12,078) – – – (12,078) (12,078)Trade and other payables 13 – – – (211,099) (211,099) (211,099)Security deposits – – – (135,877) (135,877) (130,383)Interest-bearing
borrowings 14 – – – (2,639,100) (2,639,100) (2,807,001)Convertible bonds 15 – – – (447,977) (447,977) (459,453)
(12,078) – – (3,434,053) (3,446,131) (3,620,014)

CapitaMall Trust Annual Report 2013 208 Clarity
Notes to the Financial Statements
30 CLASSIFICATION AND FAIR VALUE OF FINANCIAL INSTRUMENTS (continued)Interest rates used in determining fair values
The interest rates used to discount estimated cash flows, where applicable, are based on the forward yield curve at 31 December plus an adequate constant credit spread, and are as follows:
2013 2012% %
Security deposits 3.33 – 3.43 3.29 – 3.30Interest-bearing borrowings 0.91 – 4.30 1.32 – 3.22Convertible bonds – 1.30
Fair value hierarchy The table below analyses financial instruments carried at fair value, by valuation model. The different levels have
been defined as follows:
• Level1: Quoted prices (unadjusted) in active markets for identical assets or liabilities;
• Level2: Inputs other than quoted prices included in Level 1 that are observable for the asset or liability, either directly (i.e., as prices) or indirectly (i.e., derived from prices); and
• Level3: Inputs for the asset or liability that are not based on observable market data (unobservable data).
Level 1 Level 2 Level 3 Total$’000 $’000 $’000 $’000
Group
2013
Cross currency swaps – (112,077) – (112,077)Interest rate swaps – (7,077) – (7,077)
– (119,154) – (119,154)
2012
Cross currency swaps – (141,090) – (141,090)Interest rate swaps – (14,951) – (14,951)
– (156,041) – (156,041)
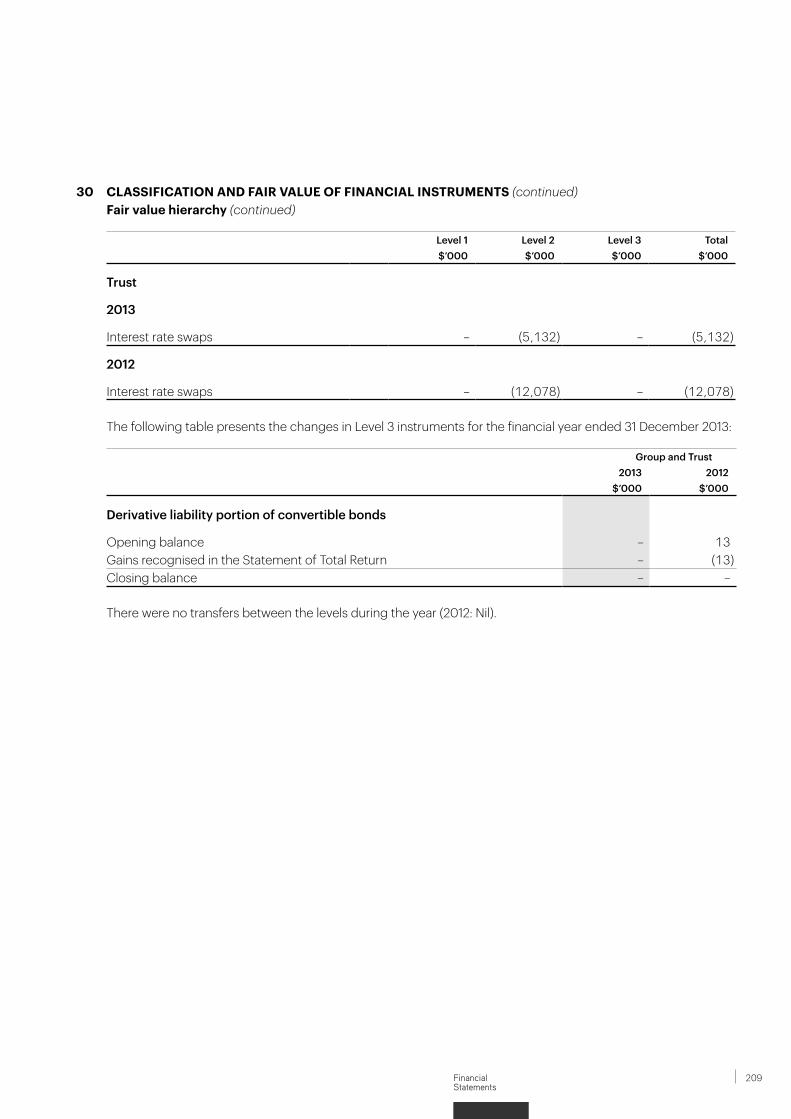
FinancialStatements
209
30 CLASSIFICATION AND FAIR VALUE OF FINANCIAL INSTRUMENTS (continued)Fair value hierarchy (continued)
Level 1 Level 2 Level 3 Total$’000 $’000 $’000 $’000
Trust
2013
Interest rate swaps – (5,132) – (5,132)
2012
Interest rate swaps – (12,078) – (12,078)
The following table presents the changes in Level 3 instruments for the financial year ended 31 December 2013:
Group and Trust2013 2012
$’000 $’000
Derivative liability portion of convertible bonds
Opening balance – 13Gains recognised in the Statement of Total Return – (13)Closing balance – –
There were no transfers between the levels during the year (2012: Nil).
CapitaMall Trust Annual Report 2013 210 Clarity
Notes to the Financial Statements
31 DETERMINATION OF FAIR VALUES A number of the Group’s accounting policies and disclosures require the determination of fair value, for both
financial and non-financial assets and liabilities. Fair values have been determined for measurement and/or disclosure purposes based on the following methods. When applicable, further information about the assumptions made in determining fair values is disclosed in the notes specific to that asset or liability.
(i) Investment property Investment properties are stated at fair value based on valuations performed by independent professional
valuers. In determining the fair value, the valuations are prepared by considering the estimated rental value of the property (i.e. the capitalisation method and discounted cashflow).
The capitalisation approach is an investment approach whereby the estimated gross passing income (on both a passing and market rent basis) has been adjusted to reflect anticipated operating costs to produce a net income on a fully leased basis. The adopted fully leased net income is capitalised over the remaining term of the lease from the valuation date at an appropriate investment yield. The discounted cash flow method involves the estimation and projection of a net income stream over a period and discounting the net income stream with an internal rate of return to arrive at the market value. The discounted cash flow method requires the valuer to assume a rental growth rate indicative of market and the selection of a target internal rate of return consistent with current market requirements.
In determining the fair value of investment property, the valuers have used valuation methods which involve certain estimates. The Manager is of the view that the estimates are reflective of the current market condition. The key assumptions used to determine the fair value of investment properties include market-corroborated capitalisation yield, terminal yield and discount rate.
In determining the fair value of investment property under development, the valuers have adopted the residual land method whereby the total gross development costs and developer’s profit are deducted from the gross development value to arrive at the residual value of land. The gross development value is the estimated value of the property assuming satisfactory completion of the development as at the date of valuation.

FinancialStatements
211
31 DETERMINATION OF FAIR VALUES (continued)(ii) Trade and other receivables The fair values of trade and other receivables are estimated at the present value of future cash flows,
discounted at the market rate of interest at the measurement date. Short-term receivables with no stated interest rate are measured at the original invoice amount if the effect of discounting is immaterial. Fair value is determined at initial recognition and for disclosure purposes, at each annual reporting date.
(iii) Derivatives The fair values of interest rate swaps and cross currency swaps (Level 2 fair values) are based on
banks’ quotes. These quotes are tested for reasonableness by discounting estimated future cash flows based on the terms and maturity of each contract and using market interest rates for a similar instrument at the measurement date. Fair values reflect the credit risk of the instrument and include adjustments to take into account the credit risk of the Group entity and counterparty when appropriate.
(iv) Other non-derivative financial liabilities Other non-derivative financial liabilities are measured at fair value at initial recognition and for disclosure
purposes, at each annual reporting date. Fair value is calculated based on the present value of future principal and interest cash flows, discounted at the market rate of interest at the measurement date.
Fair value and fair value hierarchy information on financial instruments are disclosed in Note 30.
Fair value hierarchy The table below analyses recurring non-financial assets carried at fair value. The different levels are defined
as follows:
• Level 1: quoted prices (unadjusted) in active markets for identical assets or liabilities that the Group can access at the measurement date.
• Level 2: inputs other than quoted prices included within Level 1 that are observable for the asset or liability, either directly or indirectly.
• Level 3: unobservable inputs for the asset or liability.
Level 1 Level 2 Level 3 Total$’000 $’000 $’000 $’000
2013
Group
Commercial properties for leasing – – 8,799,400 8,799,400Total investment properties – – 8,799,400 8,799,400
Trust
Commercial properties for leasing – – 7,276,000 7,276,000Total investment properties – – 7,276,000 7,276,000
The entity’s policy is to recognise transfers out of Level 3 as of the end of the reporting period during which the transfer has occurred.

CapitaMall Trust Annual Report 2013 212 Clarity
Notes to the Financial Statements
31 DETERMINATION OF FAIR VALUES (continued)Level 3 fair values
The following table shows a reconciliation from the beginning balances to the ending balances for Level 3 fair value measurements.
Investment propertiesGroup Trust$’000 $’000
Balance at 1 January 2013 8,191,800 7,031,000Transfer from investment properties under development 313,462 –Capital expenditure 89,215 75,283Balance at 31 December 2013 8,594,477 7,106,283
Gains and losses for the yearChanges in fair value – Statement of Total Return 204,923 169,717Balance at 31 December 2013 8,799,400 7,276,000
Investmentproperties under
developmentGroup$’000
Balance at 1 January 2013 336,027Capital expenditure 61,489Transfer to investment properties (313,462)Transfer to development property for sale (83,350)Balance at 31 December 2013 704
Gains and losses for the yearChanges in fair value – Statement of Total Return (704)Balance at 31 December 2013 –
The following table shows the key unobservable inputs used in the valuation models:
Type Key unobservable inputs
Inter-relationship between key unobservable inputs and fair value measurement
Investment propertyCommercial properties
for leasing Group• Capitalisationrates(from4.0%to7.5%)• Discountrate(from7.35%to8.25%)
Trust• Capitalisationrates(from4.0%to7.5%)• Discountrate(from7.5%to8.25%)
The estimated fair value increases the lower the capitalisation rates and discount rates.

FinancialStatements
213
31 DETERMINATION OF FAIR VALUES (continued)Valuation processes applied by the Group and the Trust
The fair value of investment properties is determined by external, independent property valuers, having appropriate recognised professional qualifications and recent experience in the location and category of property being valued.
Key unobservable inputs Key unobservable inputs correspond to:
• Discountrate,basedontherisk-freeratefor10yearbondsissuedbythegovernmentintherelevantmarket,adjusted for a risk premium to reflect the increased risk of investing in the asset class.
• Capitalisationratecorrespondtoarateofreturnoninvestmentpropertiesbasedontheexpectedincomethat the property will generate.
32 OPERATING SEGMENTS For the purpose of making resource allocation decisions and the assessment of segment performance,
the Group’s Chief Operating Decision Makers (“CODMs”) reviews internal / management reports of its investment properties. This forms the basis of identifying the operating segments of the Group under FRS 108 Operating Segments.
Segment revenue comprises mainly income generated from its tenants. Segment net property income represents the income earned by each segment after allocating property operating expenses. This is the measure reported to the CODMs for the purpose of assessment of segment performance. In addition, the CODMs monitor the non-financial assets as well as financial assets attributable to each segment when assessing segment performance.
Segment results, assets and liabilities include items directly attributable to a segment as well as those that can be allocated on a reasonable basis. Unallocated items comprise mainly income-earning assets and revenue, interest-bearing borrowings and expenses, related assets and expenses. Segment capital expenditure is the total cost incurred during the year to acquire segment assets that are expected to be used for more than one year.
Geographical segments Segment information in respect of the Group’s geographical segments is not presented, as the Group’s activities
for the year ended 31 December 2013 and 31 December 2012 related to properties located in Singapore.
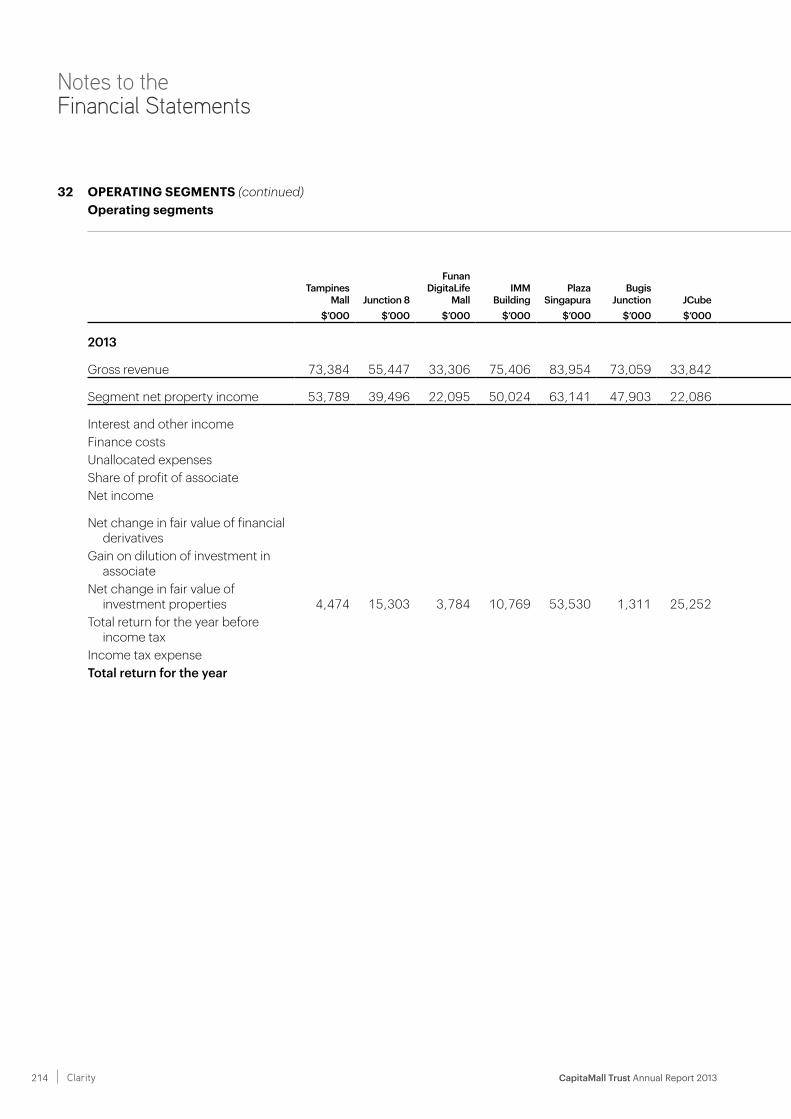
CapitaMall Trust Annual Report 2013 214 Clarity
Notes to the Financial Statements
32 OPERATING SEGMENTS (continued)Operating segments
TampinesMall Junction 8
Funan DigitaLife
MallIMM
BuildingPlaza
SingapuraBugis
Junction JCube
Lot One Shoppers’
Mall
BukitPanjang
Plaza
TheAtrium@ Orchard
ClarkeQuay Bugis+
Other Investment Properties 1
40.0%interest
in RCS Trust –Raffles City Singapore
30.0%interest
in Infinity Mall Trust –
Westgate
30.0% interest
in Infinity Office Trust –
Westgate Tower Group
$’000 $’000 $’000 $’000 $’000 $’000 $’000 $’000 $’000 $’000 $’000 $’000 $’000 $’000 $’000 $’000 $’000
2013
Gross revenue 73,384 55,447 33,306 75,406 83,954 73,059 33,842 41,966 25,867 49,572 37,309 31,454 22,990 90,315 1,291 – 729,162
Segment net property income 53,789 39,496 22,095 50,024 63,141 47,903 22,086 28,881 16,690 36,710 23,073 21,313 13,480 66,407 (2,285) (104) 502,699
Interest and other income 3,983Finance costs (120,738)Unallocated expenses (48,609)Share of profit of associate 25,721Net income 363,056
Net change in fair value of financial derivatives 6,946
Gain on dilution of investment in associate 646
Net change in fair value of investment properties 4,474 15,303 3,784 10,769 53,530 1,311 25,252 17,049 2,755 714 17,575 7,707 9,494 35,180 (492) (186) 204,219
Total return for the year before income tax 574,867
Income tax expense (501)Total return for the year 574,366

FinancialStatements
215
32 OPERATING SEGMENTS (continued)Operating segments
TampinesMall Junction 8
Funan DigitaLife
MallIMM
BuildingPlaza
SingapuraBugis
Junction JCube
Lot One Shoppers’
Mall
BukitPanjang
Plaza
TheAtrium@ Orchard
ClarkeQuay Bugis+
Other Investment Properties 1
40.0%interest
in RCS Trust –Raffles City Singapore
30.0%interest
in Infinity Mall Trust –
Westgate
30.0% interest
in Infinity Office Trust –
Westgate Tower Group
$’000 $’000 $’000 $’000 $’000 $’000 $’000 $’000 $’000 $’000 $’000 $’000 $’000 $’000 $’000 $’000 $’000
2013
Gross revenue 73,384 55,447 33,306 75,406 83,954 73,059 33,842 41,966 25,867 49,572 37,309 31,454 22,990 90,315 1,291 – 729,162
Segment net property income 53,789 39,496 22,095 50,024 63,141 47,903 22,086 28,881 16,690 36,710 23,073 21,313 13,480 66,407 (2,285) (104) 502,699
Interest and other income 3,983Finance costs (120,738)Unallocated expenses (48,609)Share of profit of associate 25,721Net income 363,056
Net change in fair value of financial derivatives 6,946
Gain on dilution of investment in associate 646
Net change in fair value of investment properties 4,474 15,303 3,784 10,769 53,530 1,311 25,252 17,049 2,755 714 17,575 7,707 9,494 35,180 (492) (186) 204,219
Total return for the year before income tax 574,867
Income tax expense (501)Total return for the year 574,366

CapitaMall Trust Annual Report 2013 216 Clarity
Notes to the Financial Statements
32 OPERATING SEGMENTS (continued)Operating segments (continued)
TampinesMall Junction 8
Funan DigitaLife
MallIMM
BuildingPlaza
SingapuraBugis
Junction JCube
Lot One Shoppers’
Mall
BukitPanjang
Plaza
TheAtrium@ Orchard
ClarkeQuay Bugis+
Other Investment Properties 1
40.0%interest
in RCS Trust –Raffles City Singapore
30.0%interest
in Infinity Mall Trust –
Westgate
30.0% interest
in Infinity Office Trust –
Westgate Tower Group
$’000 $’000 $’000 $’000 $’000 $’000 $’000 $’000 $’000 $’000 $’000 $’000 $’000 $’000 $’000 $’000 $’000
2013
Assets and liabilities
Segment assets 852,796 636,393 358,464 632,529 1,168,803 901,557 361,072 485,430 274,418 723,236 347,946 331,128 211,214 1,213,306 317,523 91,289 8,907,104Investment in associate and
joint ventures 275,455Unallocated assets 834,940Total assets 10,017,499
Segment liabilities 21,975 19,236 11,644 31,978 28,360 28,505 20,895 14,142 8,026 25,084 18,304 10,159 10,409 426,611 286,976 83,973 1,046,277
Unallocated liabilities:– interest-bearing borrowings 2,457,004– financial derivatives 121,739– convertible bonds 348,349– others 35,386
2,962,478Total liabilities 4,008,755
Other segmental information
Depreciation and amortisation 52 80 17 136 122 21 344 81 47 35 112 122 80 147 3 – 1,399
Plant and equipment:– capital expenditure 29 145 28 81 43 28 111 37 20 162 208 125 67 270 724 – 2,078
Investment properties:– capital expenditure 20,526 3,697 216 13,231 8,470 20,689 (5,252) 951 1,245 4,286 4,425 293 2,506 11,220 55,030 9,171 150,704
Receivables written off – – – – – – – – – – 21 – – 24 – – 45

FinancialStatements
217
32 OPERATING SEGMENTS (continued)Operating segments (continued)
TampinesMall Junction 8
Funan DigitaLife
MallIMM
BuildingPlaza
SingapuraBugis
Junction JCube
Lot One Shoppers’
Mall
BukitPanjang
Plaza
TheAtrium@ Orchard
ClarkeQuay Bugis+
Other Investment Properties 1
40.0%interest
in RCS Trust –Raffles City Singapore
30.0%interest
in Infinity Mall Trust –
Westgate
30.0% interest
in Infinity Office Trust –
Westgate Tower Group
$’000 $’000 $’000 $’000 $’000 $’000 $’000 $’000 $’000 $’000 $’000 $’000 $’000 $’000 $’000 $’000 $’000
2013
Assets and liabilities
Segment assets 852,796 636,393 358,464 632,529 1,168,803 901,557 361,072 485,430 274,418 723,236 347,946 331,128 211,214 1,213,306 317,523 91,289 8,907,104Investment in associate and
joint ventures 275,455Unallocated assets 834,940Total assets 10,017,499
Segment liabilities 21,975 19,236 11,644 31,978 28,360 28,505 20,895 14,142 8,026 25,084 18,304 10,159 10,409 426,611 286,976 83,973 1,046,277
Unallocated liabilities:– interest-bearing borrowings 2,457,004– financial derivatives 121,739– convertible bonds 348,349– others 35,386
2,962,478Total liabilities 4,008,755
Other segmental information
Depreciation and amortisation 52 80 17 136 122 21 344 81 47 35 112 122 80 147 3 – 1,399
Plant and equipment:– capital expenditure 29 145 28 81 43 28 111 37 20 162 208 125 67 270 724 – 2,078
Investment properties:– capital expenditure 20,526 3,697 216 13,231 8,470 20,689 (5,252) 951 1,245 4,286 4,425 293 2,506 11,220 55,030 9,171 150,704
Receivables written off – – – – – – – – – – 21 – – 24 – – 45

CapitaMall Trust Annual Report 2013 218 Clarity
Notes to the Financial Statements
32 OPERATING SEGMENTS (continued)Operating segments (continued)
Tampines Mall Junction 8
Funan DigitaLife
MallIMM
BuildingPlaza
SingapuraBugis
Junction JCube
Lot One Shoppers’
Mall
BukitPanjang
Plaza
TheAtrium@ Orchard
ClarkeQuay Bugis+
Other Investment Properties1
40.0%interest in
RCS Trust –Raffles City Singapore
InfinityTrusts Group
$’000 $’000 $’000 $’000 $’000 $’000 $’000 $’000 $’000 $’000 $’000 $’000 $’000 $’000 $’000 $’000
2012
Gross revenue 69,752 53,661 32,139 73,558 81,228 75,176 23,712 40,688 25,053 21,193 34,369 19,640 23,049 88,370 – 661,588
Segment net property income 50,328 37,901 21,384 46,597 59,404 51,927 14,223 27,928 15,925 11,393 19,972 10,319 13,427 64,525 – 445,253
Interest and other income 6,552Finance costs (138,938)Unallocated expenses (48,238)Share of profit of associate 20,261Net income 284,890
Net change in fair value of financial derivatives 4,332
Net change in fair value of investment properties 20,982 6,547 6,937 (10,805) 22,676 14,682 32,870 9,700 9,833 2,194 22,193 4,071 4,364 19,584 – 165,828
Gain on disposal of investment property 84,346
Loss on repurchase of convertible bonds (5,055)
Total return for the year before income tax 534,341
Income tax expense 1,992Total return for the year 536,333

FinancialStatements
219
32 OPERATING SEGMENTS (continued)Operating segments (continued)
Tampines Mall Junction 8
Funan DigitaLife
MallIMM
BuildingPlaza
SingapuraBugis
Junction JCube
Lot One Shoppers’
Mall
BukitPanjang
Plaza
TheAtrium@ Orchard
ClarkeQuay Bugis+
Other Investment Properties1
40.0%interest in
RCS Trust –Raffles City Singapore
InfinityTrusts Group
$’000 $’000 $’000 $’000 $’000 $’000 $’000 $’000 $’000 $’000 $’000 $’000 $’000 $’000 $’000 $’000
2012
Gross revenue 69,752 53,661 32,139 73,558 81,228 75,176 23,712 40,688 25,053 21,193 34,369 19,640 23,049 88,370 – 661,588
Segment net property income 50,328 37,901 21,384 46,597 59,404 51,927 14,223 27,928 15,925 11,393 19,972 10,319 13,427 64,525 – 445,253
Interest and other income 6,552Finance costs (138,938)Unallocated expenses (48,238)Share of profit of associate 20,261Net income 284,890
Net change in fair value of financial derivatives 4,332
Net change in fair value of investment properties 20,982 6,547 6,937 (10,805) 22,676 14,682 32,870 9,700 9,833 2,194 22,193 4,071 4,364 19,584 – 165,828
Gain on disposal of investment property 84,346
Loss on repurchase of convertible bonds (5,055)
Total return for the year before income tax 534,341
Income tax expense 1,992Total return for the year 536,333

CapitaMall Trust Annual Report 2013 220 Clarity
Notes to the Financial Statements
32 OPERATING SEGMENTS (continued)Operating segments (continued)
Tampines Mall Junction 8
Funan DigitaLife
MallIMM
BuildingPlaza
SingapuraBugis
Junction JCube
Lot One Shoppers’
Mall
BukitPanjang
Plaza
TheAtrium@ Orchard
ClarkeQuay Bugis+
Other Investment Properties 1
40.0%interest in
RCS Trust –Raffles City Singapore
InfinityTrusts Group
$’000 $’000 $’000 $’000 $’000 $’000 $’000 $’000 $’000 $’000 $’000 $’000 $’000 $’000 $’000 $’000
2012
Assets and liabilities
Segment assets 827,630 617,510 354,491 608,561 1,106,869 879,266 341,359 467,424 270,532 718,092 326,162 323,008 199,282 1,175,424 336,671 8,552,281Investment in associate and joint
ventures 227,476Unallocated assets 1,108,964Total assets 9,888,721
Segment liabilities 23,057 21,340 11,390 36,244 28,309 23,083 29,775 14,069 7,634 18,254 18,494 12,949 10,911 423,694 305,356 984,559
Unallocated liabilities:– interest-bearing borrowings 2,508,561– financial derivatives 153,168– convertible bonds 447,977– others 91,530
3,201,236Total liabilities 4,185,795
Other segmental information
Depreciation and amortisation 72 116 27 177 89 59 261 78 64 22 76 86 77 123 – 1,327
Plant and equipment:– capital expenditure 16 21 6 35 6 17 212 33 7 715 27 320 19 34 – 1,468
Investment properties:– capital expenditure 6,018 13,453 63 12,805 3,324 318 34,130 3,300 1,167 91,806 9,807 22,929 3,498 8,016 – 210,634
Receivables written off – – – – – – – – – – – 3 4 3 – 10
1 Other investment properties comprise Sembawang Shopping Centre and Rivervale Mall in 2013 and included Hougang Plaza in 2012.
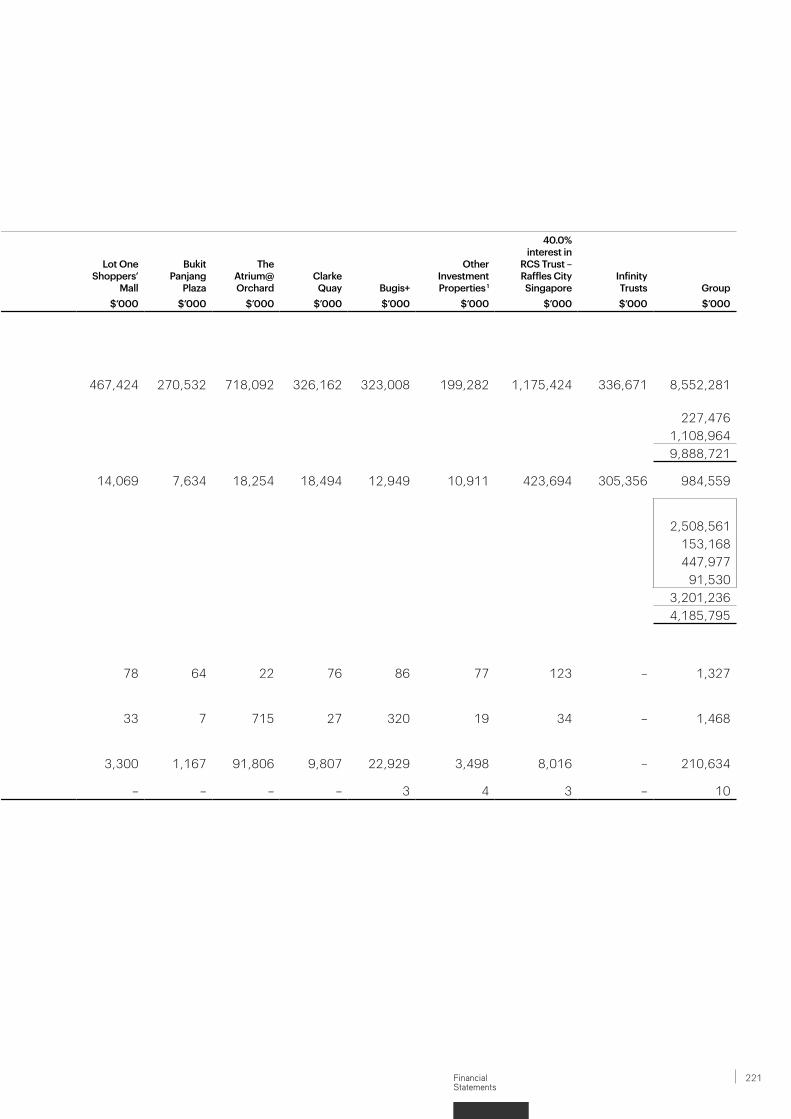
FinancialStatements
221
32 OPERATING SEGMENTS (continued)Operating segments (continued)
Tampines Mall Junction 8
Funan DigitaLife
MallIMM
BuildingPlaza
SingapuraBugis
Junction JCube
Lot One Shoppers’
Mall
BukitPanjang
Plaza
TheAtrium@ Orchard
ClarkeQuay Bugis+
Other Investment Properties 1
40.0%interest in
RCS Trust –Raffles City Singapore
InfinityTrusts Group
$’000 $’000 $’000 $’000 $’000 $’000 $’000 $’000 $’000 $’000 $’000 $’000 $’000 $’000 $’000 $’000
2012
Assets and liabilities
Segment assets 827,630 617,510 354,491 608,561 1,106,869 879,266 341,359 467,424 270,532 718,092 326,162 323,008 199,282 1,175,424 336,671 8,552,281Investment in associate and joint
ventures 227,476Unallocated assets 1,108,964Total assets 9,888,721
Segment liabilities 23,057 21,340 11,390 36,244 28,309 23,083 29,775 14,069 7,634 18,254 18,494 12,949 10,911 423,694 305,356 984,559
Unallocated liabilities:– interest-bearing borrowings 2,508,561– financial derivatives 153,168– convertible bonds 447,977– others 91,530
3,201,236Total liabilities 4,185,795
Other segmental information
Depreciation and amortisation 72 116 27 177 89 59 261 78 64 22 76 86 77 123 – 1,327
Plant and equipment:– capital expenditure 16 21 6 35 6 17 212 33 7 715 27 320 19 34 – 1,468
Investment properties:– capital expenditure 6,018 13,453 63 12,805 3,324 318 34,130 3,300 1,167 91,806 9,807 22,929 3,498 8,016 – 210,634
Receivables written off – – – – – – – – – – – 3 4 3 – 10
1 Other investment properties comprise Sembawang Shopping Centre and Rivervale Mall in 2013 and included Hougang Plaza in 2012.

CapitaMall Trust Annual Report 2013 222 Clarity
Notes to the Financial Statements
33 COMMITMENTS
Group Trust2013 2012 2013 2012
$’000 $’000 $’000 $’000
Capital commitments:– contracted but not provided for 54,255 152,040 17,244 66,249
Operating lease rental receivable The Group leases out its investment properties. Non-cancellable operating lease rentals are receivable
as follows:
Group Trust2013 2012 2013 2012
$’000 $’000 $’000 $’000
Within 1 year 612,954 562,480 520,275 490,889After 1 year but within 5 years 839,006 838,673 614,905 651,575More than 5 years 561,653 622,146 83,452 83,441
2,013,613 2,023,299 1,218,632 1,225,905
34 FINANCIAL RATIOS
2013 2012% %
Expenses to weighted average net assets 1
– including performance component of Manager’s management fees 0.76 0.80– excluding performance component of Manager’s management fees 0.43 0.49
Portfolio turnover rate 2 – –
1 The annualised ratios are computed in accordance with the guidelines of Investment Management Association of Singapore. The expenses used in the computation relate to expenses of the Trust, excluding property expenses and finance costs.
2 The annualised ratio is computed based on the lesser of purchases or sales of underlying investment properties of the Group expressed as a percentage of daily average net asset value.
35 SUBSEQUENT EVENT On 3 January 2014, JG2 Trustee Pte. Ltd., in its capacity as trustee of Infinity Office Trust granted options to
purchase office strata units of Westgate Tower to Westgate Commercial Pte. Ltd. (“WCPL”) and Westgate Tower Pte. Ltd. (“WTPL”) for $579.4 million. WCPL and WTPL exercised the options on 24 January 2014.
On 3 February 2014, CMT MTN issued floating rate notes of JPY5.0 billion due 2021 through its MTN Programme at 3 months JPY LIBOR plus 0.48% per annum. Concurrently, CMT MTN entered into swap transactions to swap the JPY proceeds into Singapore dollar proceeds of $62.0 million at 3.148% per annum. CMT MTN has on-lent the Singapore dollars proceeds arising from the issue to the Trust.
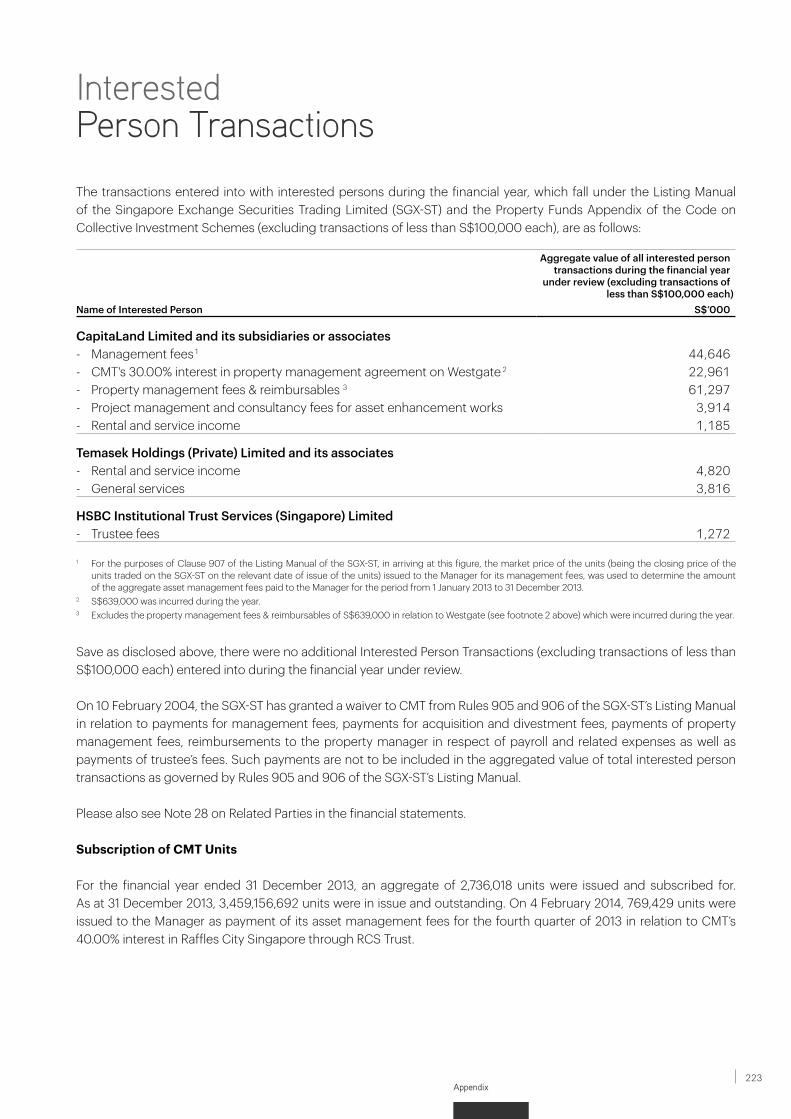
Appendix223
Interested Person Transactions
The transactions entered into with interested persons during the financial year, which fall under the Listing Manual of the Singapore Exchange Securities Trading Limited (SGX-ST) and the Property Funds Appendix of the Code on Collective Investment Schemes (excluding transactions of less than S$100,000 each), are as follows:
Aggregate value of all interested person transactions during the financial year
under review (excluding transactions of less than S$100,000 each)
Name of Interested Person S$’000
CapitaLand Limited and its subsidiaries or associates- Management fees 1 44,646 - CMT's 30.00% interest in property management agreement on Westgate 2 22,961 - Property management fees & reimbursables 3 61,297 - Project management and consultancy fees for asset enhancement works 3,914 - Rental and service income 1,185
Temasek Holdings (Private) Limited and its associates- Rental and service income 4,820 - General services 3,816
HSBC Institutional Trust Services (Singapore) Limited- Trustee fees 1,272
1 For the purposes of Clause 907 of the Listing Manual of the SGX-ST, in arriving at this figure, the market price of the units (being the closing price of the units traded on the SGX-ST on the relevant date of issue of the units) issued to the Manager for its management fees, was used to determine the amount of the aggregate asset management fees paid to the Manager for the period from 1 January 2013 to 31 December 2013.
2 S$639,000 was incurred during the year.3 Excludes the property management fees & reimbursables of S$639,000 in relation to Westgate (see footnote 2 above) which were incurred during the year.
Save as disclosed above, there were no additional Interested Person Transactions (excluding transactions of less than S$100,000 each) entered into during the financial year under review.
On 10 February 2004, the SGX-ST has granted a waiver to CMT from Rules 905 and 906 of the SGX-ST’s Listing Manual in relation to payments for management fees, payments for acquisition and divestment fees, payments of property management fees, reimbursements to the property manager in respect of payroll and related expenses as well as payments of trustee’s fees. Such payments are not to be included in the aggregated value of total interested person transactions as governed by Rules 905 and 906 of the SGX-ST’s Listing Manual.
Please also see Note 28 on Related Parties in the financial statements.
Subscription of CMT Units
For the financial year ended 31 December 2013, an aggregate of 2,736,018 units were issued and subscribed for. As at 31 December 2013, 3,459,156,692 units were in issue and outstanding. On 4 February 2014, 769,429 units were issued to the Manager as payment of its asset management fees for the fourth quarter of 2013 in relation to CMT’s 40.00% interest in Raffles City Singapore through RCS Trust.

CapitaMall Trust Annual Report 2013 224 Clarity
Unitholders’ StatisticsAs at 21 February 2014
ISSUED AND FULLY PAID UNITS 3,459,926,121 units (voting rights: 1 vote per unit)Market Capitalisation S$6,487,361,477 (based on closing unit price of S$1.875 on 21 February 2014)
DISTRIBUTION OF UNITHOLDINGS
Size of Holdings No. of Unitholders % No. of Units %
1 - 999 268 1.66 54,972 0.001,000 - 10,000 11,582 71.55 53,967,818 1.5610,001 - 1,000,000 4,298 26.55 196,227,075 5.671,000,001 and above 39 0.24 3,209,676,256 92.77
16,187 100.00 3,459,926,121 100.00
LOCATION OF UNITHOLDERS
Country No. of Unitholders % No. of Units %
Singapore 15,670 96.81 3,450,380,878 99.73Malaysia 293 1.81 4,969,311 0.14Others 224 1.38 4,575,932 0.13
16,187 100.00 3,459,926,121 100.00
TWENTY LARGEST UNITHOLDERS
No. Name No. of Units %
1 Citibank Nominees Singapore Pte Ltd 675,965,959 19.542 Pyramex Investments Pte Ltd 571,784,814 16.533 DBS Nominees Pte Ltd 424,993,215 12.284 HSBC (Singapore) Nominees Pte Ltd 357,933,653 10.355 DBSN Services Pte Ltd 312,657,275 9.046 Albert Complex Pte Ltd 279,300,000 8.077 NTUC Fairprice Co-operative Ltd 123,879,000 3.588 United Overseas Bank Nominees (Pte) Ltd 93,382,892 2.709 Raffles Nominees (Pte) Ltd 74,120,575 2.1410 Premier Healthcare Services International Pte Ltd 64,182,204 1.8611 Alphaplus Investments Pte Ltd 48,127,000 1.3912 BNP Paribas Securities Services Pte Ltd 42,013,032 1.2113 CapitaMall Trust Management Limited 41,049,037 1.1914 Bank of Singapore Nominees Pte Ltd 20,333,896 0.5915 DB Nominees (Singapore) Pte Ltd 18,879,050 0.5516 Merrill Lynch (Singapore) Pte Ltd 5,498,549 0.1617 Morgan Stanley Asia (Singapore) Securities Pte Ltd 5,352,215 0.1518 OCBC Securities Pte Ltd 5,049,543 0.1519 BNP Paribas Nominees Singapore Pte Ltd 4,854,073 0.1420 UOB Kay Hian Private Limited 4,789,899 0.14
3,174,145,881 91.76

Appendix225
DIRECTORS’ INTEREST IN UNITS AND CONVERTIBLE SECURITIES AS AT 21 JANUARY 2014Based on the Register of Directors’ Unitholdings, save for those disclosed below, none of the Directors holds any interest in Units and Convertible Securities by CMT.
No. of UnitsName Direct Interest Deemed Interest
Danny Teoh Leong Kay 649 -Lim Ming Yan 868,000 -Fong Kwok Jen 865 -Gay Chee Cheong 865 -Ho Chee Hwee Simon 122,687 119,000Lee Khai Fatt, Kyle 1,212 -Richard R. Magnus 49,764 -Tan Kian Chew 55,349 64,000Tan Wee Yan, Wilson 20,456 -
SUBSTANTIAL UNITHOLDERS’ UNITHOLDINGS AS AT 21 FEBRUARY 2014Based on the information available to the Manager as at 21 February 2014, the unitholdings of substantial unitholders of CMT are as follows:
Direct Interest Deemed InterestName of Substantial Unitholders No. of units % No. of units %
Temasek Holdings (Private) Limited (‘THPL’) - - 968,767,132 1 28.00CapitaLand Limited (‘CL’) - - 956,316,055 2 27.64CapitaMalls Asia Limited (‘CMA’) - - 956,316,055 3 27.64Pyramex Investments Pte Ltd (‘PIPL’) 571,784,814 16.53 - -Albert Complex Pte Ltd (‘ACPL’) 279,300,000 8.07 - -NTUC Enterprise Co-operative Limited - - 196,966,108 4 5.69National Trades Union Congress - - 197,730,108 5 5.71Singapore Labour Foundation - - 196,966,108 6 5.69 BlackRock, Inc. - - 172,864,580 7 5.00The PNC Financial Services Group, Inc. - - 172,864,580 8 5.001 THPL is deemed to have an interest in the unitholdings in which its associated companies have or are deemed to have an interest pursuant to Section 4 of the Securities and Futures Act, Chapter 289 of Singapore. THPL is wholly-owned by the Minister for Finance.2 CL is deemed to have an interest in the unitholdings of its indirect subsidiaries namely PIPL, ACPL, Premier Healthcare Services International Pte Ltd (“PHSIPL”) and the Manager.3 CMA is deemed to have an interest in the unitholdings of its direct wholly-owned subsidiaries, namely PIPL, ACPL and PHSIPL and its indirect wholly-owned subsidiary, namely the Manager.4 NTUC Enterprise Co-operative Limited is entitled to control the exercise of more than 50% of the votes in each of NTUC Income Insurance Co-operative Limited (which directly holds 25,098,108 Units) and NTUC FairPrice Co-operative Limited (which directly holds 171,868,000 Units), and is therefore deemed to have an interest in their unitholdings. 5 National Trades Union Congress has an approximately 39% interest in NTUC Enterprise Co-operative Limited and is therefore deemed to have an interest in the unitholdings of NTUC Enterprise Co-operative Limited, NTUC Income Insurance Co-operative Limited and NTUC FairPrice Co-operative Limited. National Trades Union Congress is also deemed to have an interest in an additional 764,000 Units through a fund manager.6 Singapore Labour Foundation has an approximately 31% interest in NTUC Enterprise Co-operative Limited and is therefore deemed to have an interest in the unitholdings of NTUC Enterprise Co-operative Limited, NTUC Income Insurance Co-operative Limited and NTUC FairPrice Co-operative Limited.7 BlackRock, Inc. is deemed to have an interest in the unitholdings of its subsidiaries.8 The PNC Financial Services Group, Inc. is deemed to have an interest in the unitholdings of BlackRock, Inc. and its subsidiaries.
FREE FLOATBased on information made available to the Manager as at 21 February 2014, approximately 61.25% of the units in CMT were held in the hands of the public. Rule 723 of the Listing Manual of the SGX-ST has accordingly been compiled with.

CapitaMall Trust Annual Report 2013 226 Clarity
Mall Directory
MALL ADDRESS AND WEBSITE TEL (GENERAL) FAX (GENERAL)
Bugis+ 201 Victoria Street, Singapore 188067 www.bugis-plus.com.sg
+65 6634 6810 +65 6835 7840
Bugis Junction 200 Victoria Street, Singapore 188021 www.bugisjunction-mall.com.sg
+65 6557 6557 +65 6338 1783
Bukit Panjang Plaza 1 Jelebu Road, Singapore 677743 www.bukitpanjangplaza.com.sg
+65 6314 6388 +65 6763 4829
Clarke Quay 3 River Valley Road, Singapore 179024 www.clarkequay.com.sg
+65 6337 3292 +65 6334 8423
Funan DigitaLife Mall 109 North Bridge Road, Singapore 179097 www.funan.com.sg
+65 6336 8327 +65 6333 4275
IMM Building 2 Jurong East Street 21, Singapore 609601www.imm.sg
+65 6665 8268 +65 6562 3933
JCube 2 Jurong East Central 1, Singapore 609731 www.j-cube.com.sg
+65 6684 2153 +65 6684 2151
Junction 8 9 Bishan Place, Singapore 579837 www.junction8.com.sg
+65 6354 2955 +65 6354 2977
Lot One Shoppers’ Mall 21 Choa Chu Kang Avenue 4, Singapore 689812 www.lot1.com.sg
+65 6314 6200 +65 6763 2405
Plaza Singapura 68 Orchard Road, Singapore 238839 www.plazasingapura.com.sg
+65 6332 9298 +65 6339 5006
Raffles City Singapore Retail 252 North Bridge Road, Singapore 179103Office 250 North Bridge Road, Singapore 179101Hotel Swissôtel The Stamford Singapore2 Stamford Road, Singapore 178882
Fairmont Singapore80 Bras Basah Road, Singapore 189560www.rafflescity.com.sg
+65 6338 7766 +65 6337 3618
Rivervale Mall 11 Rivervale Crescent, Singapore 545082www.rivervalemall.com.sg
+65 6788 8370 +65 6787 0995
Sembawang Shopping Centre
604 Sembawang Road, Singapore 758459www.sembawangsc.com.sg
+65 6757 8000 +65 6257 1463
Tampines Mall 4 Tampines Central 5, Singapore 529510www.tampinesmall.com.sg
+65 6788 8370 +65 6787 0995
The Atrium@Orchard 68 Orchard Road, Singapore 238839 www.capitamallsasia.com
+65 6332 9770 +65 6339 5006
Westgate 3 Gateway Drive, Singapore 608532 westgate.com.sg
+65 6908 3737 +65 6465 9631

Appendix227
Corporate Information
REGISTERED ADDRESS CapitaMall Trust Management Limited39 Robinson Road #18-01 Robinson Point Singapore 068911 Phone: +65 6536 1188 Fax: +65 6536 3884
DIRECTORS OF THE MANAGER Mr Danny Teoh Leong Kay Chairman & IndependentNon-Executive Director
Mr Lim Ming YanDeputy Chairman & Non-IndependentNon-Executive Director
Mr Fong Kwok JenIndependent Non-Executive Director
Mr Gay Chee Cheong Independent Non-Executive Director
Mr Ho Chee Hwee SimonNon-Independent Non-Executive Director
Mr Lee Khai Fatt, KyleIndependent Non-Executive Director
Mr Richard R. MagnusIndependent Non-Executive Director
Maj-Gen (NS) Ng Chee KhernIndependent Non-Executive Director
Mr Tan Kian ChewNon-Independent Non-Executive Director
Mr Tan Wee Yan, WilsonNon-Independent Executive Director & Chief Executive Officer
AUDIT COMMITTEE Mr Lee Khai Fatt, Kyle Chairman
Mr Fong Kwok JenMr Gay Chee Cheong
CORPORATE DISCLOSURE COMMITTEEMr Danny Teoh Leong Kay Chairman
Mr Lim Ming Yan Mr Ho Chee Hwee Simon
EXECUTIVE COMMITTEEMr Lim Ming Yan Chairman
Mr Ho Chee Hwee SimonMr Tan Wee Yan, Wilson
INVESTMENT COMMITTEEMr Lim Ming Yan Chairman
Mr Danny Teoh Leong KayMr Ho Chee Hwee SimonMr Lee Khai Fatt, Kyle Mr Richard R. MagnusMr Tan Wee Yan, Wilson
COMPANY SECRETARIESMr Choo Wei-PinMs Goh Mei Lan
CAPITAMALL TRUST
REGISTERED ADDRESS HSBC Institutional Trust Services (Singapore) Limited 21 Collyer Quay #10-02 HSBC Building Singapore 049320
WEBSITE & EMAIL [email protected]
TRUSTEEHSBC Institutional Trust Services (Singapore) Limited 21 Collyer Quay #03-01 HSBC Building Singapore 049320 Phone: +65 6658 6906 Fax: +65 6534 5526
AUDITOR KPMG LLP Public Accountants and Chartered Accountants 16 Raffles Quay #22-00 Hong Leong Building Singapore 048581 Phone: +65 6213 3388 Fax: +65 6225 0984 Partner-In-Charge:Mr Leong Kok Keong(With effect from financial year ended 31 December 2012)
UNIT REGISTRAR Boardroom Corporate & Advisory Services Pte. Ltd. 50 Raffles Place #32-01 Singapore Land Tower Singapore 048623 Phone: +65 6536 5355 Fax: +65 6536 1360
THE MANAGER

CapitaMall Trust Annual Report 2013 228 Clarity
Glossary
The following table identifies some of the common terms referred to in this Annual Report.
Decantation Optimisation of the usage of retail space by creating more valuable lettable retail space in exchange for lower-yield space in order to increase the yield of a property.
Deposited Property All the assets of CMT, including all its authorised investments for the time being held or deemed to be held upon the trusts of the Trust Deed.
Greenfield Development A land site that has not been previously developed or polluted.
Gross Turnover Rent Rental income which is pegged to tenants’ sales.
Lettable Space Any part of a property that can be leased to a tenant.
Manager CapitaMall Trust Management Limited, in its capacity as manager of CMT.
Occupancy Cost Ratio of a tenant’s gross rental (inclusive of service charge, advertising and promotional charge as well as gross turnover rent) to tenants’ sales.
Rental Reversion Increase or decrease in rental as compared to the preceding rental being fetched for a retail unit.
Return On Investment Incremental net property income divided by the capital expenditure for an asset enhancement project.
Rights Issue Underwritten renounceable 9-for-10 rights issue.
Service Charge The expenses that retail tenants pay to their landlords for maintenance of the common areas, utilities, taxes and other costs.
Sq Ft Square feet.
Step-up Rent Rental rate that increases by predetermined amounts at various points in the future under a lease agreement.

This Annual Report to Unitholders may contain forward-looking statements. Forward-looking statement is subject to inherent uncertainties and is based on numerous assumptions. Actual performance, outcomes and results may differ materially from those expressed in forward-looking statements. Representative examples of factors which may cause the actual performance, outcomes and results to differ materially from those in the forward-looking statements include (without limitation) changes in general industry and economic conditions, interest rate trends, cost of capital and capital availability, availability of real estate investment opportunities, competition from other companies, shifts in customers’ demands, changes in operating conditions, including employee wages, benefits and training, governmental and public policy changes and the continued availability of financing in the amounts and the terms necessary to support future business. You are cautioned not to place undue reliance on these forward-looking statements, which are based on the current views of management on future events. All rights are reserved.

CapitaMall Trust Management LimitedAs Manager of CapitaMall TrustCompany Reg. No.: 200106159R
39 Robinson Road#18-01 Robinson PointSingapore 068911Tel: +65 6536 1188Fax: +65 6536 3884Email: [email protected]