Embed Size (px)
Citation preview
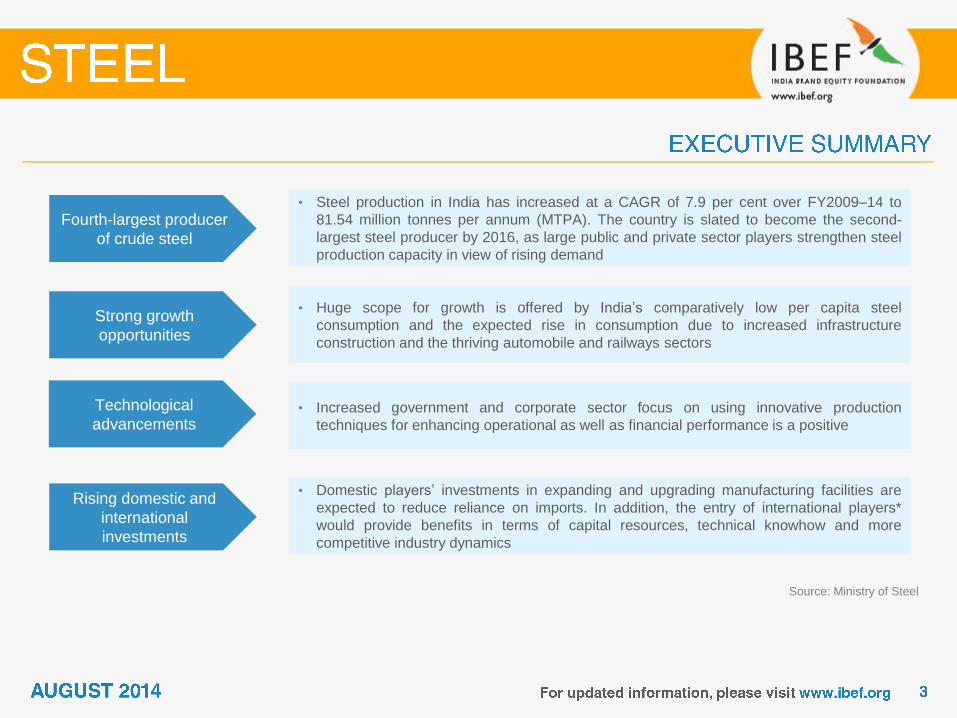
Fourth-largest producer
of crude steel
• Steel production in India has increased at a CAGR of 7.9 per cent over FY2009–14 to
81.54 million tonnes per annum (MTPA). The country is slated to become the second-
largest steel producer by 2016, as large public and private sector players strengthen steel
production capacity in view of rising demand
Strong growth
opportunities
• Huge scope for growth is offered by India’s comparatively low per capita steel
consumption and the expected rise in consumption due to increased infrastructure
construction and the thriving automobile and railways sectors
Technological
advancements • Increased government and corporate sector focus on using innovative production
techniques for enhancing operational as well as financial performance is a positive
Rising domestic and
international
investments
• Domestic players’ investments in expanding and upgrading manufacturing facilities are
expected to reduce reliance on imports. In addition, the entry of international players*
would provide benefits in terms of capital resources, technical knowhow and more
competitive industry dynamics
Source: Ministry of Steel
Growing demand
Notes: FDI - Foreign Direct Investment, MT - Million Tonnes,
MoUs - Memorandum of Understanding, 2016E - Estimated figure for the year 2016; These estimates are from Data monitor
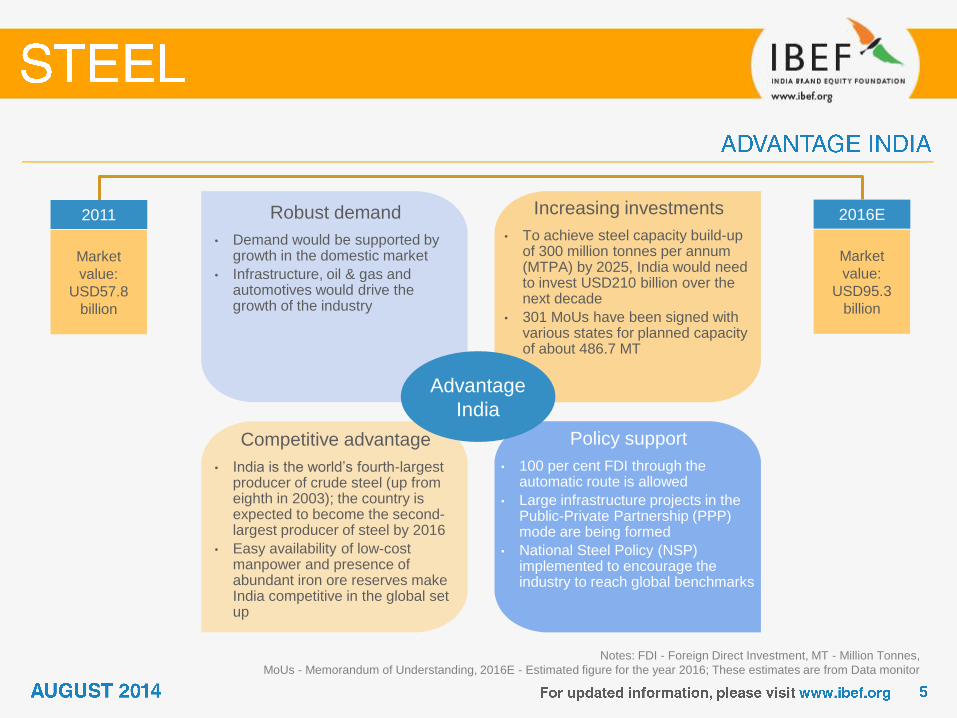
Robust demand
• Demand would be supported by growth in the domestic market
• Infrastructure, oil & gas and automotives would drive the growth of the industry
Increasing investments
• To achieve steel capacity build-up of 300 million tonnes per annum (MTPA) by 2025, India would need to invest USD210 billion over the next decade
• 301 MoUs have been signed with various states for planned capacity of about 486.7 MT
Policy support
• 100 per cent FDI through the automatic route is allowed
• Large infrastructure projects in the Public-Private Partnership (PPP) mode are being formed
• National Steel Policy (NSP) implemented to encourage the industry to reach global benchmarks
Competitive advantage
• India is the world’s fourth-largest producer of crude steel (up from eighth in 2003); the country is expected to become the second-largest producer of steel by 2016
• Easy availability of low-cost manpower and presence of abundant iron ore reserves make India competitive in the global set up
2011
Market
value:
USD57.8
billion
2016E
Market
value:
USD95.3
billion
Advantage
India
Notes: TISCO - Tata Iron and Steel Company; IISC - Indian Iron & Steel Company; SAIL - Steel Authority of India Ltd
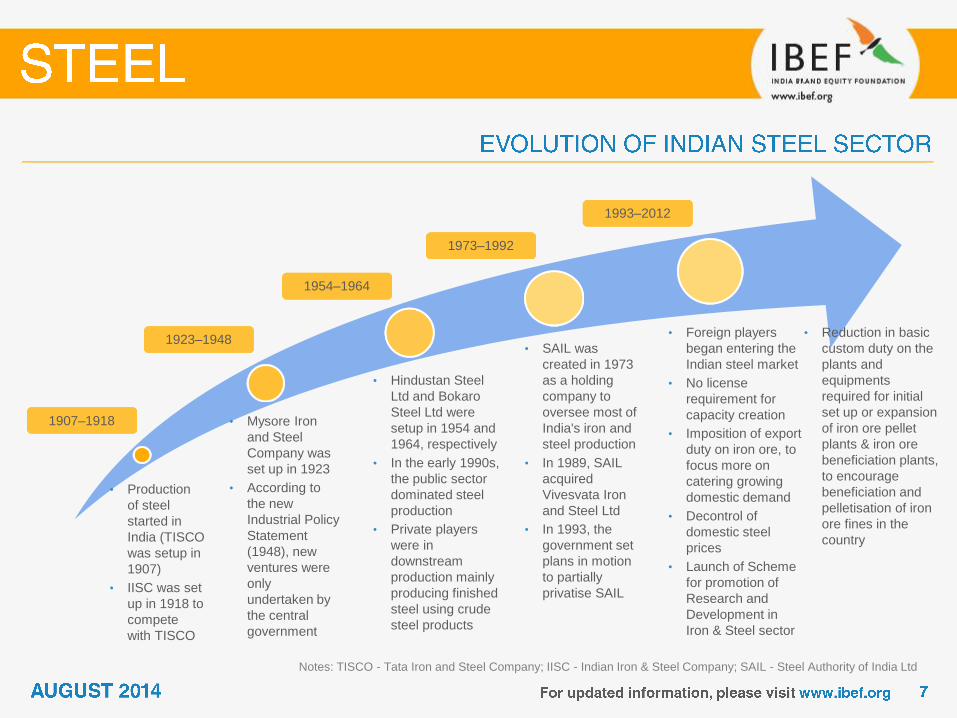
• Production
of steel
started in
India (TISCO
was setup in
1907)
• IISC was set
up in 1918 to
compete
with TISCO
• Mysore Iron
and Steel
Company was
set up in 1923
• According to
the new
Industrial Policy
Statement
(1948), new
ventures were
only
undertaken by
the central
government
• Hindustan Steel
Ltd and Bokaro
Steel Ltd were
setup in 1954 and
1964, respectively
• In the early 1990s,
the public sector
dominated steel
production
• Private players
were in
downstream
production mainly
producing finished
steel using crude
steel products
• SAIL was
created in 1973
as a holding
company to
oversee most of
India's iron and
steel production
• In 1989, SAIL
acquired
Vivesvata Iron
and Steel Ltd
• In 1993, the
government set
plans in motion
to partially
privatise SAIL
1907–1918
1923–1948
1954–1964
1973–1992
1993–2012
• Foreign players
began entering the
Indian steel market
• No license
requirement for
capacity creation
• Imposition of export
duty on iron ore, to
focus more on
catering growing
domestic demand
• Decontrol of
domestic steel
prices
• Launch of Scheme
for promotion of
Research and
Development in
Iron & Steel sector
• Reduction in basic
custom duty on the
plants and
equipments
required for initial
set up or expansion
of iron ore pellet
plants & iron ore
beneficiation plants,
to encourage
beneficiation and
pelletisation of iron
ore fines in the
country
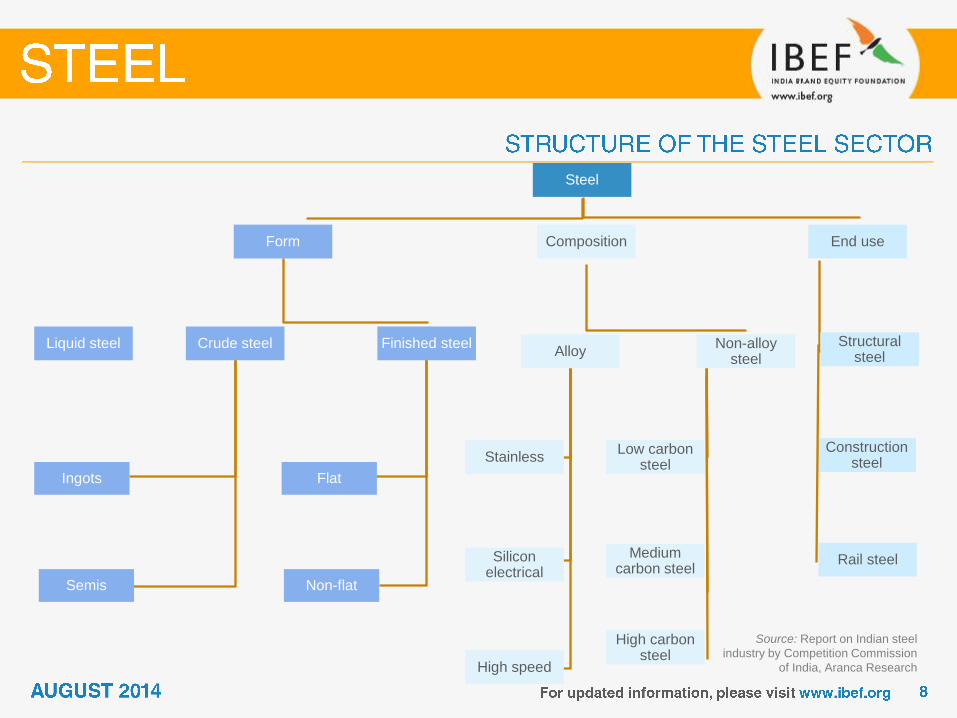
Steel
End use
Structural steel
Construction steel
Rail steel
Form
Liquid steel Crude steel
Ingots
Semis
Finished steel
Flat
Non-flat
Composition
Non-alloy steel
Low carbon steel
Medium carbon steel
High carbon steel
Alloy
Stainless
Silicon electrical
High speed
Source: Report on Indian steel
industry by Competition Commission
of India, Aranca Research
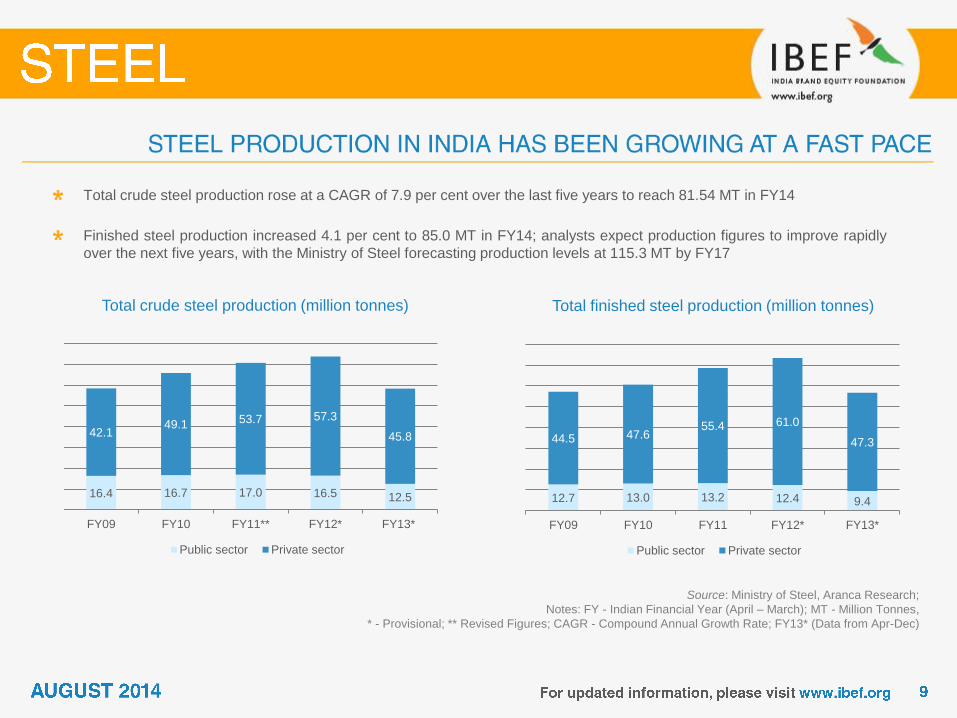
Total crude steel production (million tonnes)
Total crude steel production rose at a CAGR of 7.9 per cent over the last five years to reach 81.54 MT in FY14
Finished steel production increased 4.1 per cent to 85.0 MT in FY14; analysts expect production figures to improve rapidly
over the next five years, with the Ministry of Steel forecasting production levels at 115.3 MT by FY17
Total finished steel production (million tonnes)
Source: Ministry of Steel, Aranca Research;
Notes: FY - Indian Financial Year (April – March); MT - Million Tonnes,
* - Provisional; ** Revised Figures; CAGR - Compound Annual Growth Rate; FY13* (Data from Apr-Dec)
16.4 16.7 17.0 16.5 12.5
42.1 49.1 53.7 57.3
45.8
FY09 FY10 FY11** FY12* FY13*
Public sector Private sector
12.7 13.0 13.2 12.4 9.4
44.5 47.6 55.4 61.0
47.3
FY09 FY10 FY11 FY12* FY13*
Public sector Private sector
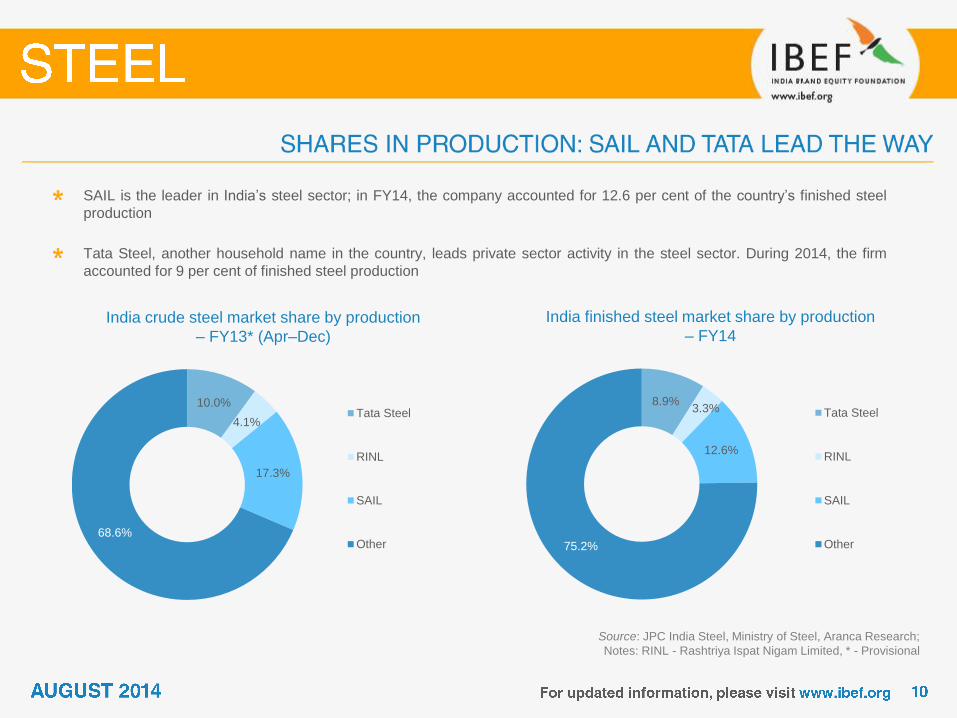
India crude steel market share by production
– FY13* (Apr–Dec)
SAIL is the leader in India’s steel sector; in FY14, the company accounted for 12.6 per cent of the country’s finished steel
production
Tata Steel, another household name in the country, leads private sector activity in the steel sector. During 2014, the firm
accounted for 9 per cent of finished steel production
India finished steel market share by production
– FY14
Source: JPC India Steel, Ministry of Steel, Aranca Research;
Notes: RINL - Rashtriya Ispat Nigam Limited, * - Provisional
10.0%
4.1%
17.3%
68.6%
Tata Steel
RINL
SAIL
Other
8.9% 3.3%
12.6%
75.2%
Tata Steel
RINL
SAIL
Other
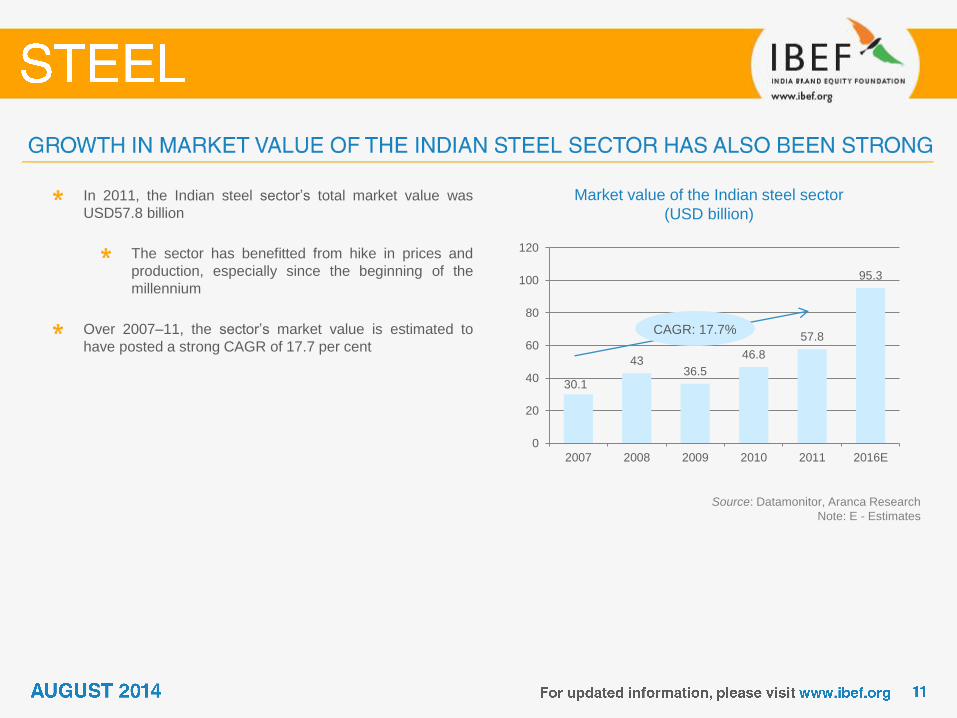
30.1
43 36.5
46.8
57.8
95.3
0
20
40
60
80
100
120
2007 2008 2009 2010 2011 2016E
Market value of the Indian steel sector
(USD billion)
In 2011, the Indian steel sector’s total market value was
USD57.8 billion
The sector has benefitted from hike in prices and
production, especially since the beginning of the
millennium
Over 2007–11, the sector’s market value is estimated to
have posted a strong CAGR of 17.7 per cent
CAGR: 17.7%
Source: Datamonitor, Aranca Research
Note: E - Estimates
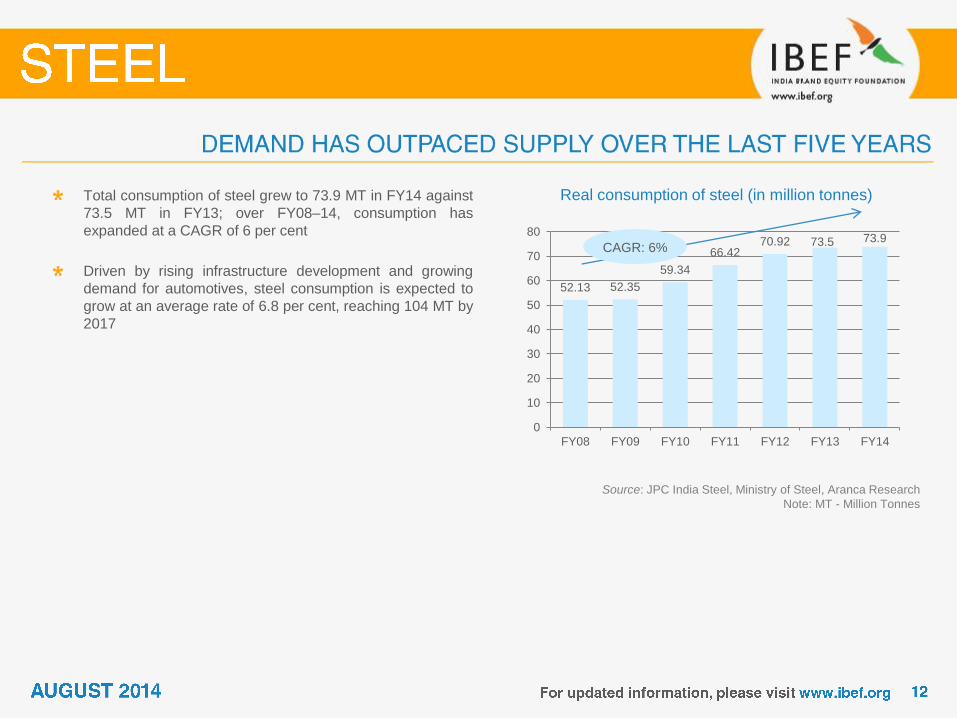
52.13 52.35
59.34
66.42 70.92 73.5 73.9
0
10
20
30
40
50
60
70
80
FY08 FY09 FY10 FY11 FY12 FY13 FY14
Real consumption of steel (in million tonnes) Total consumption of steel grew to 73.9 MT in FY14 against
73.5 MT in FY13; over FY08–14, consumption has
expanded at a CAGR of 6 per cent
Driven by rising infrastructure development and growing
demand for automotives, steel consumption is expected to
grow at an average rate of 6.8 per cent, reaching 104 MT by
2017
Source: JPC India Steel, Ministry of Steel, Aranca Research
Note: MT - Million Tonnes
CAGR: 6%
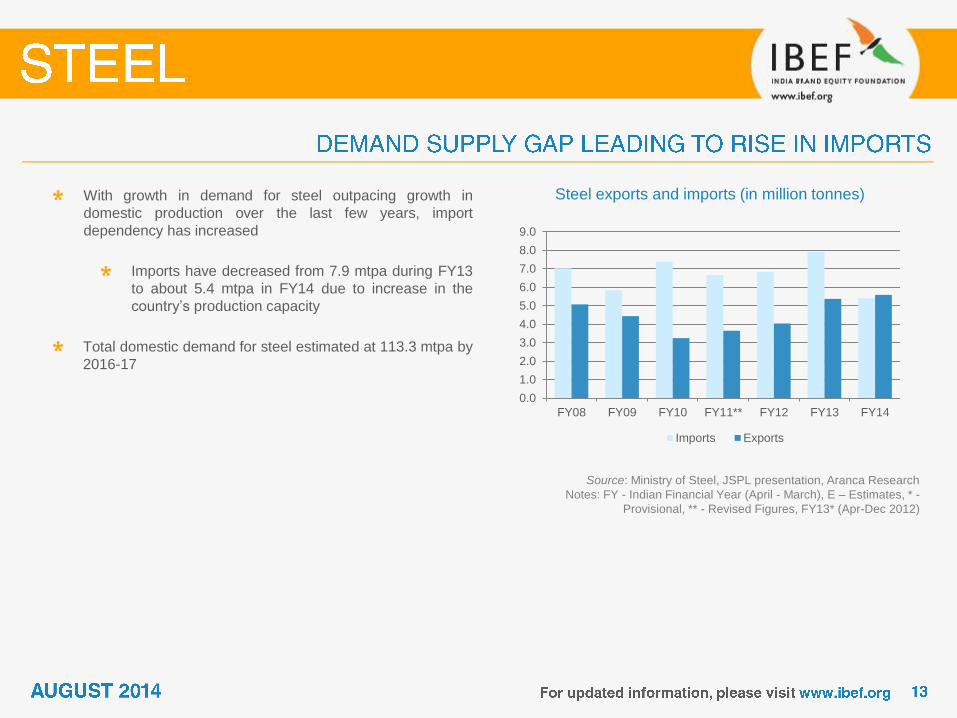
With growth in demand for steel outpacing growth in
domestic production over the last few years, import
dependency has increased
Imports have decreased from 7.9 mtpa during FY13
to about 5.4 mtpa in FY14 due to increase in the
country’s production capacity
Total domestic demand for steel estimated at 113.3 mtpa by
2016-17
Steel exports and imports (in million tonnes)
Source: Ministry of Steel, JSPL presentation, Aranca Research
Notes: FY - Indian Financial Year (April - March), E – Estimates, * -
Provisional, ** - Revised Figures, FY13* (Apr-Dec 2012)
0.0
1.0
2.0
3.0
4.0
5.0
6.0
7.0
8.0
9.0
FY08 FY09 FY10 FY11** FY12 FY13 FY14
Imports Exports
Source: JSPL May 2013 presentation, Aranca Research
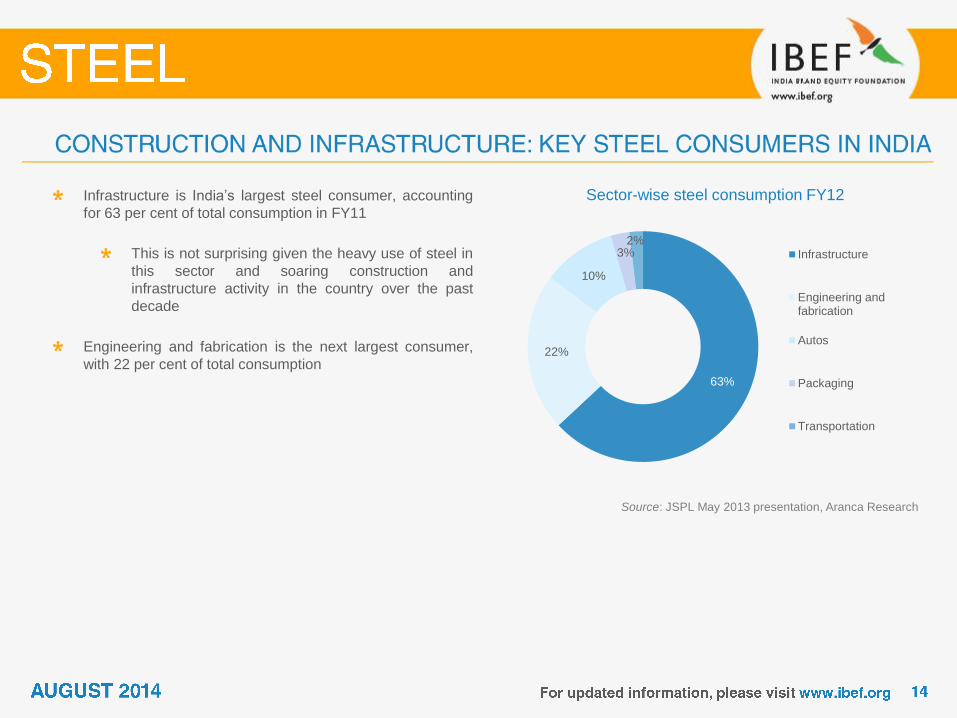
Sector-wise steel consumption FY12 Infrastructure is India’s largest steel consumer, accounting
for 63 per cent of total consumption in FY11
This is not surprising given the heavy use of steel in
this sector and soaring construction and
infrastructure activity in the country over the past
decade
Engineering and fabrication is the next largest consumer,
with 22 per cent of total consumption 63%
22%
10%
3% 2%
Infrastructure
Engineering andfabrication
Autos
Packaging
Transportation
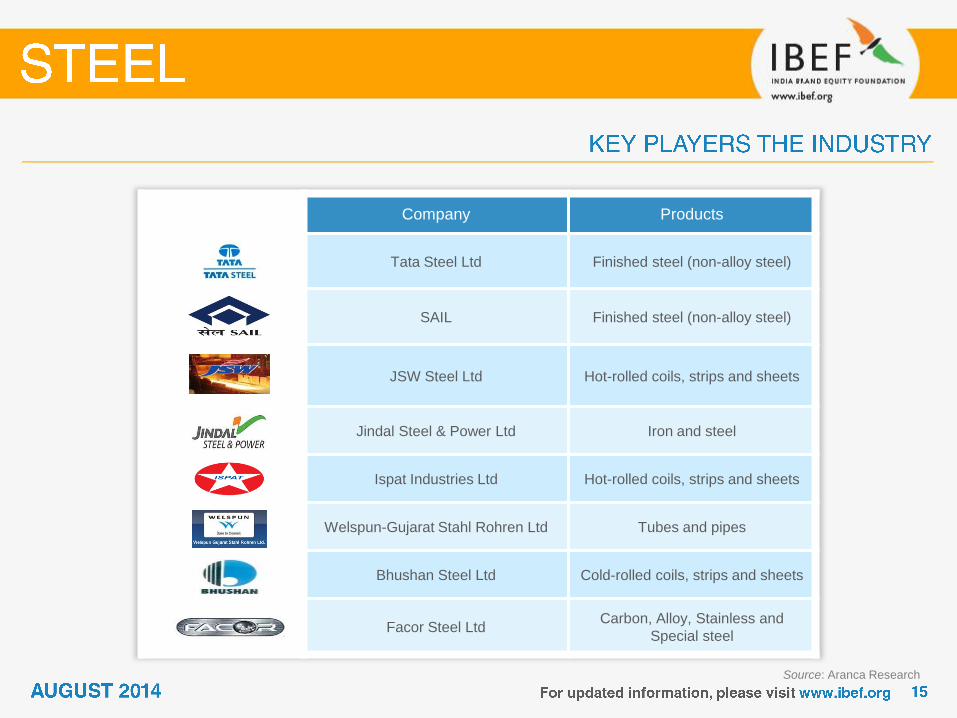
Company Products
Tata Steel Ltd Finished steel (non-alloy steel)
SAIL Finished steel (non-alloy steel)
JSW Steel Ltd Hot-rolled coils, strips and sheets
Jindal Steel & Power Ltd Iron and steel
Ispat Industries Ltd Hot-rolled coils, strips and sheets
Welspun-Gujarat Stahl Rohren Ltd Tubes and pipes
Bhushan Steel Ltd Cold-rolled coils, strips and sheets
Facor Steel Ltd Carbon, Alloy, Stainless and
Special steel
Source: Aranca Research
Source: Ministry of Railways, Aranca Research
Notes: MOUs - Memorandum of Understanding, MT - Million Tonnes
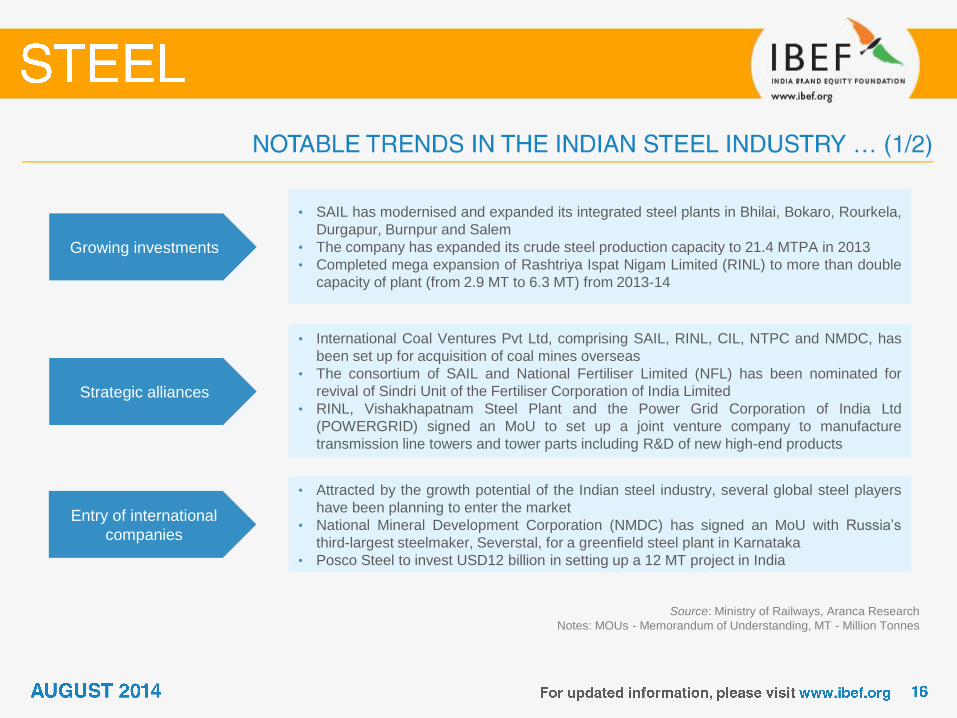
Growing investments
• SAIL has modernised and expanded its integrated steel plants in Bhilai, Bokaro, Rourkela,
Durgapur, Burnpur and Salem
• The company has expanded its crude steel production capacity to 21.4 MTPA in 2013
• Completed mega expansion of Rashtriya Ispat Nigam Limited (RINL) to more than double
capacity of plant (from 2.9 MT to 6.3 MT) from 2013-14
Strategic alliances
• International Coal Ventures Pvt Ltd, comprising SAIL, RINL, CIL, NTPC and NMDC, has
been set up for acquisition of coal mines overseas
• The consortium of SAIL and National Fertiliser Limited (NFL) has been nominated for
revival of Sindri Unit of the Fertiliser Corporation of India Limited
• RINL, Vishakhapatnam Steel Plant and the Power Grid Corporation of India Ltd
(POWERGRID) signed an MoU to set up a joint venture company to manufacture
transmission line towers and tower parts including R&D of new high-end products
Entry of international
companies
• Attracted by the growth potential of the Indian steel industry, several global steel players
have been planning to enter the market
• National Mineral Development Corporation (NMDC) has signed an MoU with Russia’s
third-largest steelmaker, Severstal, for a greenfield steel plant in Karnataka
• Posco Steel to invest USD12 billion in setting up a 12 MT project in India
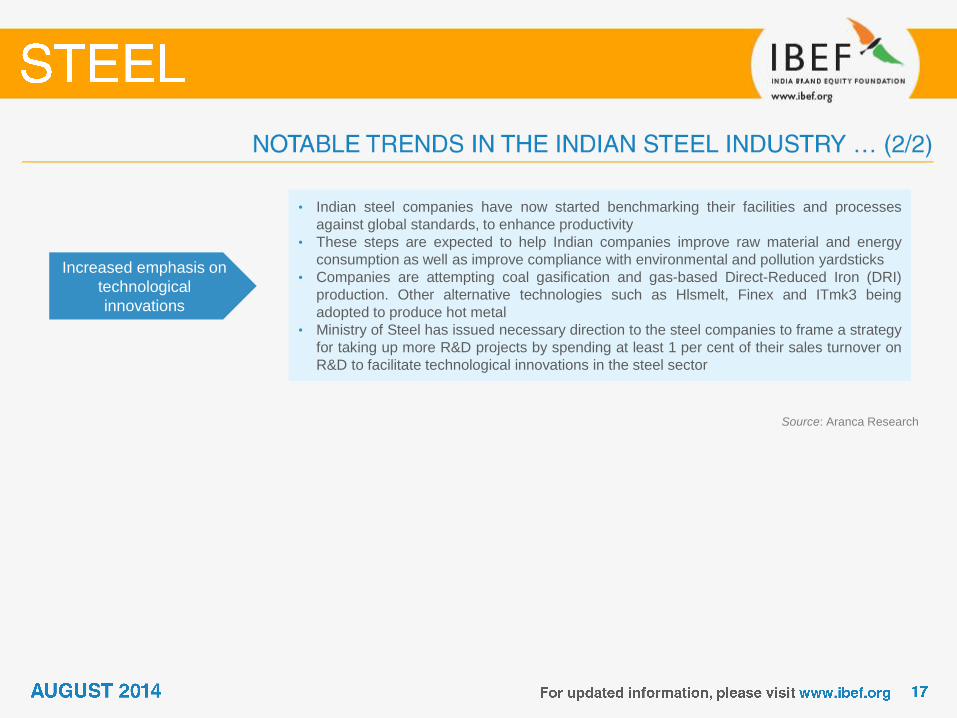
Increased emphasis on
technological
innovations
• Indian steel companies have now started benchmarking their facilities and processes
against global standards, to enhance productivity
• These steps are expected to help Indian companies improve raw material and energy
consumption as well as improve compliance with environmental and pollution yardsticks
• Companies are attempting coal gasification and gas-based Direct-Reduced Iron (DRI)
production. Other alternative technologies such as Hlsmelt, Finex and ITmk3 being
adopted to produce hot metal
• Ministry of Steel has issued necessary direction to the steel companies to frame a strategy
for taking up more R&D projects by spending at least 1 per cent of their sales turnover on
R&D to facilitate technological innovations in the steel sector
Source: Aranca Research
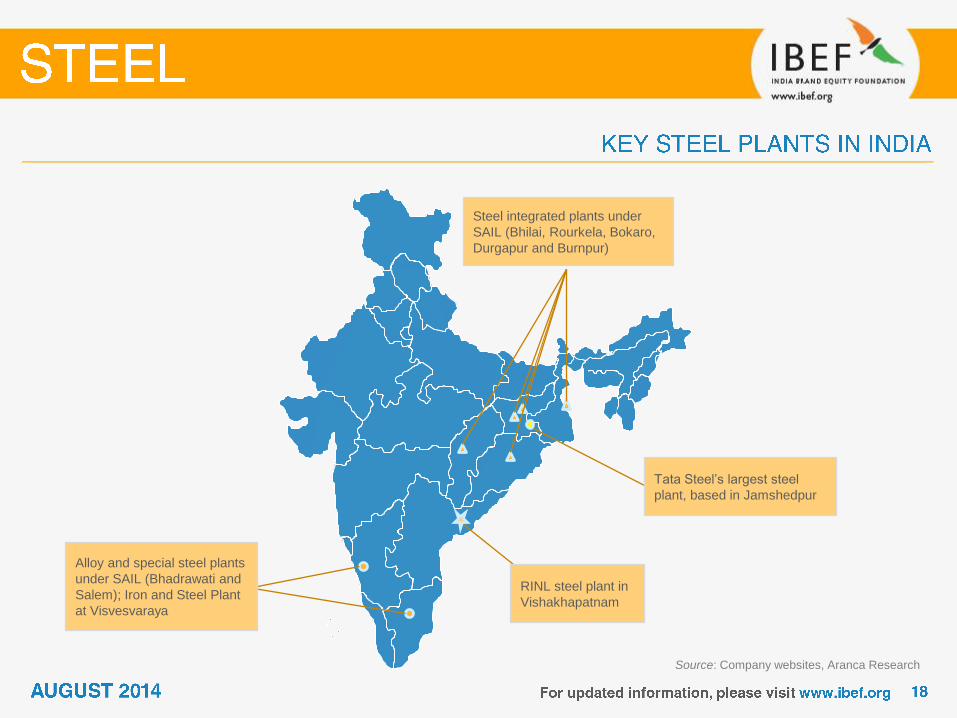
Steel integrated plants under
SAIL (Bhilai, Rourkela, Bokaro,
Durgapur and Burnpur)
Tata Steel’s largest steel
plant, based in Jamshedpur
RINL steel plant in
Vishakhapatnam
Alloy and special steel plants
under SAIL (Bhadrawati and
Salem); Iron and Steel Plant
at Visvesvaraya
Source: Company websites, Aranca Research

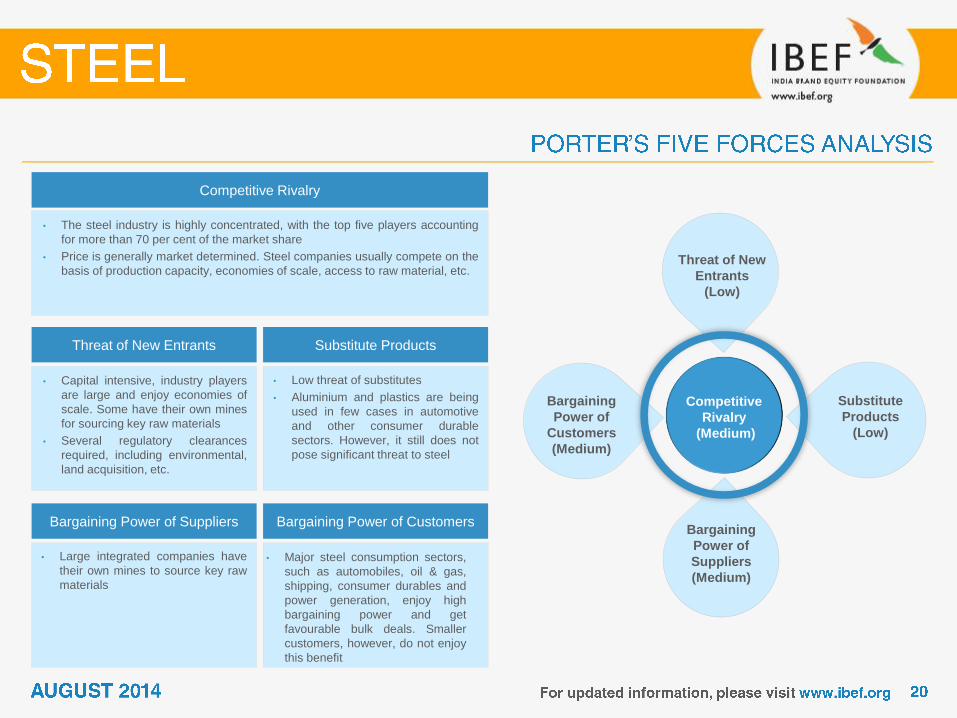
• Major steel consumption sectors,
such as automobiles, oil & gas,
shipping, consumer durables and
power generation, enjoy high
bargaining power and get
favourable bulk deals. Smaller
customers, however, do not enjoy
this benefit
Competitive Rivalry
• The steel industry is highly concentrated, with the top five players accounting
for more than 70 per cent of the market share
• Price is generally market determined. Steel companies usually compete on the
basis of production capacity, economies of scale, access to raw material, etc.
Threat of New Entrants Substitute Products
Bargaining Power of Suppliers Bargaining Power of Customers
• Capital intensive, industry players
are large and enjoy economies of
scale. Some have their own mines
for sourcing key raw materials
• Several regulatory clearances
required, including environmental,
land acquisition, etc.
• Large integrated companies have
their own mines to source key raw
materials
• Low threat of substitutes
• Aluminium and plastics are being
used in few cases in automotive
and other consumer durable
sectors. However, it still does not
pose significant threat to steel
Competitive
Rivalry
(Medium)
Threat of New
Entrants
(Low)
Substitute
Products
(Low)
Bargaining
Power of
Customers
(Medium)
Bargaining
Power of
Suppliers
(Medium)
Source: CCI, Ministry of External Affairs
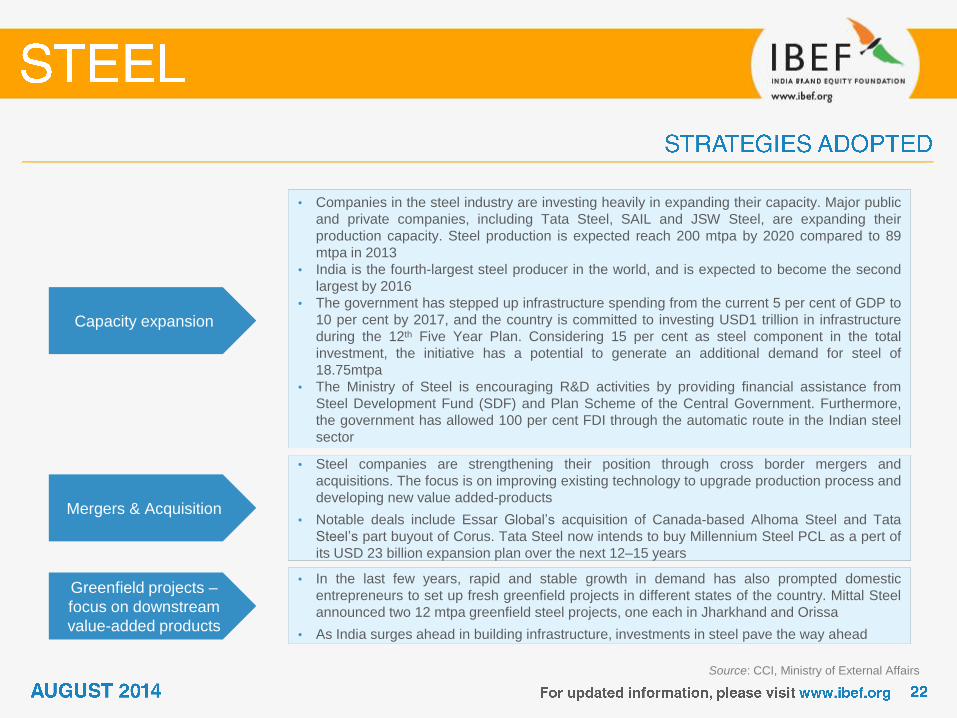
• Companies in the steel industry are investing heavily in expanding their capacity. Major public
and private companies, including Tata Steel, SAIL and JSW Steel, are expanding their
production capacity. Steel production is expected reach 200 mtpa by 2020 compared to 89
mtpa in 2013
• India is the fourth-largest steel producer in the world, and is expected to become the second
largest by 2016
• The government has stepped up infrastructure spending from the current 5 per cent of GDP to
10 per cent by 2017, and the country is committed to investing USD1 trillion in infrastructure
during the 12th Five Year Plan. Considering 15 per cent as steel component in the total
investment, the initiative has a potential to generate an additional demand for steel of
18.75mtpa
• The Ministry of Steel is encouraging R&D activities by providing financial assistance from
Steel Development Fund (SDF) and Plan Scheme of the Central Government. Furthermore,
the government has allowed 100 per cent FDI through the automatic route in the Indian steel
sector
• Steel companies are strengthening their position through cross border mergers and
acquisitions. The focus is on improving existing technology to upgrade production process and
developing new value added-products
• Notable deals include Essar Global’s acquisition of Canada-based Alhoma Steel and Tata
Steel’s part buyout of Corus. Tata Steel now intends to buy Millennium Steel PCL as a pert of
its USD 23 billion expansion plan over the next 12–15 years
• In the last few years, rapid and stable growth in demand has also prompted domestic
entrepreneurs to set up fresh greenfield projects in different states of the country. Mittal Steel
announced two 12 mtpa greenfield steel projects, one each in Jharkhand and Orissa
• As India surges ahead in building infrastructure, investments in steel pave the way ahead
Capacity expansion
Mergers & Acquisition
Greenfield projects –
focus on downstream
value-added products
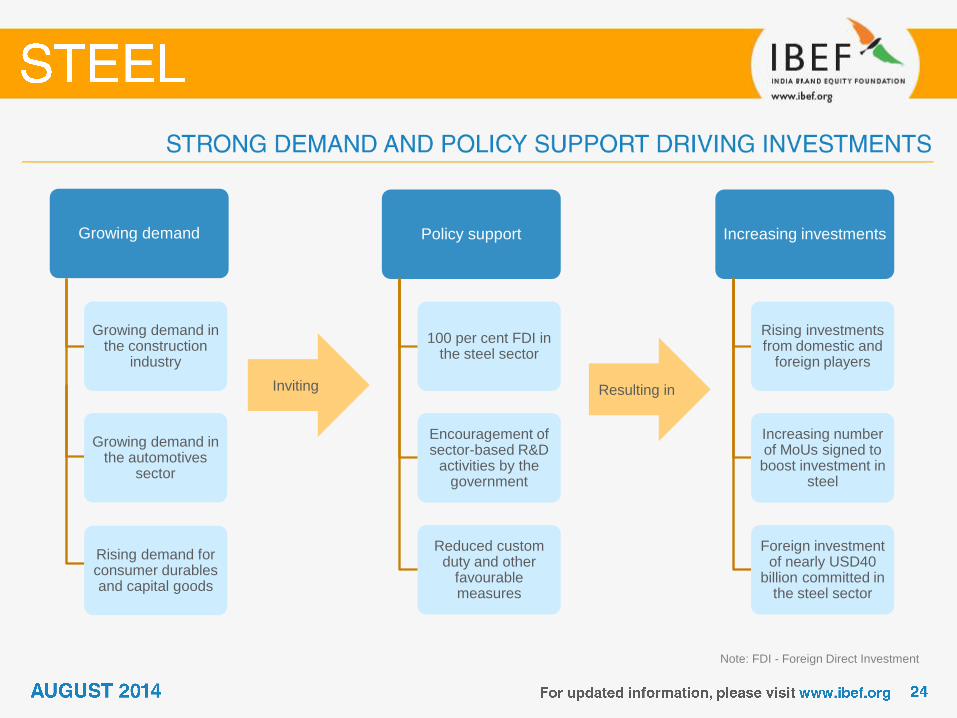
Policy support
100 per cent FDI in the steel sector
Encouragement of sector-based R&D
activities by the government
Reduced custom duty and other
favourable measures
Growing demand in the construction
industry
Increasing investments
Rising investments from domestic and
foreign players
Increasing number of MoUs signed to boost investment in
steel
Foreign investment of nearly USD40
billion committed in the steel sector
Inviting Resulting in
Growing demand in the automotives
sector
Rising demand for consumer durables and capital goods
Growing demand
Note: FDI - Foreign Direct Investment
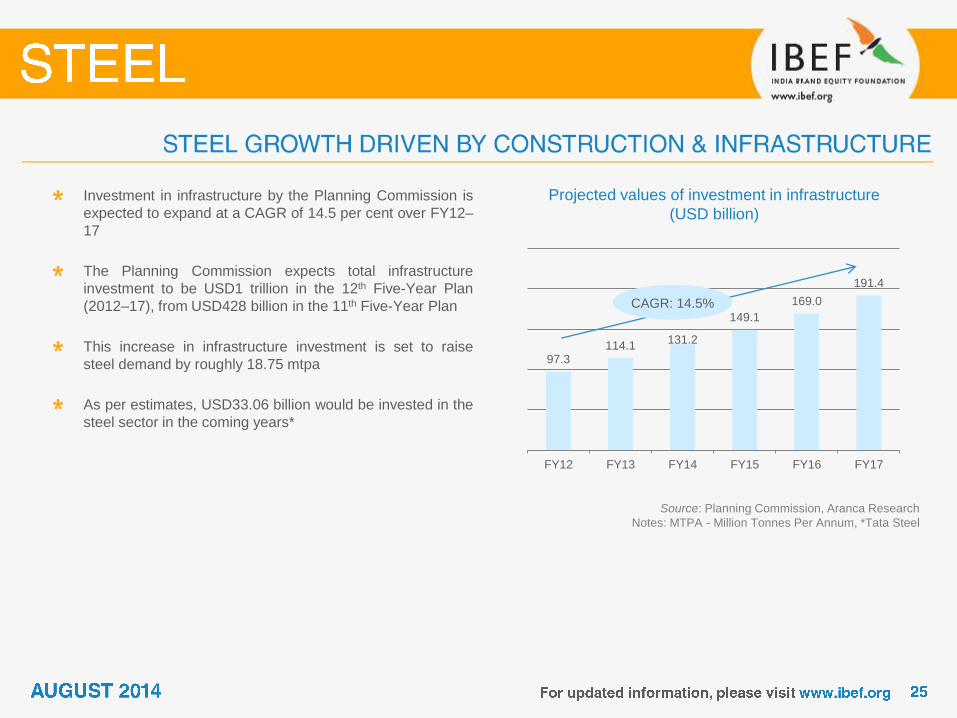
Projected values of investment in infrastructure
(USD billion)
Investment in infrastructure by the Planning Commission is
expected to expand at a CAGR of 14.5 per cent over FY12–
17
The Planning Commission expects total infrastructure
investment to be USD1 trillion in the 12th Five-Year Plan
(2012–17), from USD428 billion in the 11th Five-Year Plan
This increase in infrastructure investment is set to raise
steel demand by roughly 18.75 mtpa
As per estimates, USD33.06 billion would be invested in the
steel sector in the coming years*
Source: Planning Commission, Aranca Research
Notes: MTPA - Million Tonnes Per Annum, *Tata Steel
97.3 114.1
131.2
149.1
169.0
191.4
FY12 FY13 FY14 FY15 FY16 FY17
CAGR: 14.5%
2.9 3.2 3.5 3.8 4.2 4.7
5.2 6.3
7.3 7.3
12.5
FY03 FY04 FY05 FY06 FY07 FY08 FY09 FY10 FY11 FY12 FY15E
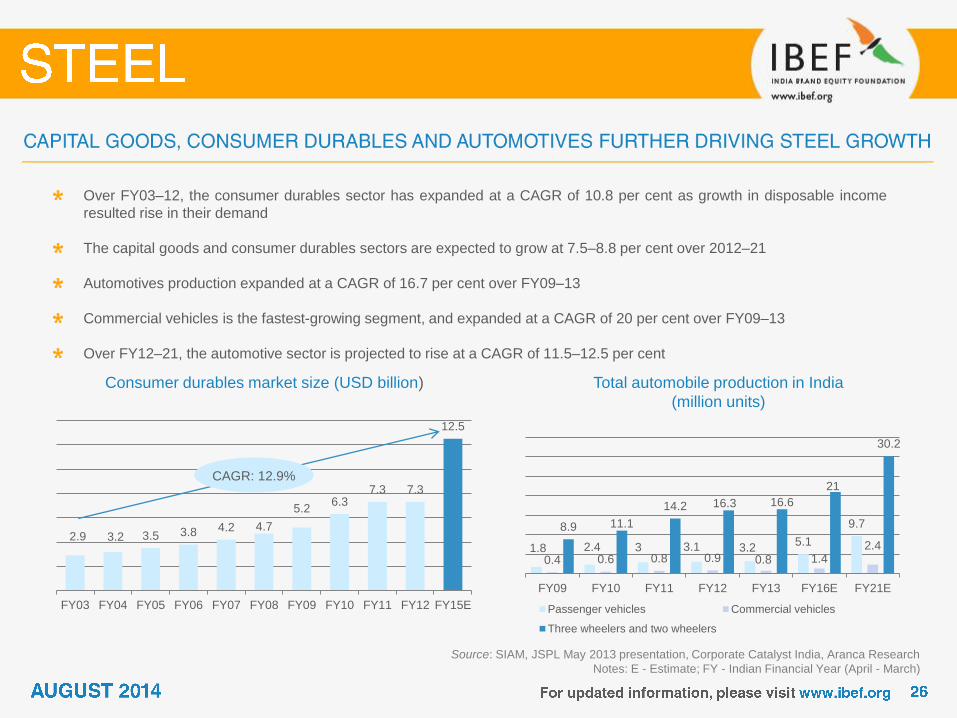
Consumer durables market size (USD billion)
Over FY03–12, the consumer durables sector has expanded at a CAGR of 10.8 per cent as growth in disposable income
resulted rise in their demand
The capital goods and consumer durables sectors are expected to grow at 7.5–8.8 per cent over 2012–21
Automotives production expanded at a CAGR of 16.7 per cent over FY09–13
Commercial vehicles is the fastest-growing segment, and expanded at a CAGR of 20 per cent over FY09–13
Over FY12–21, the automotive sector is projected to rise at a CAGR of 11.5–12.5 per cent
Total automobile production in India
(million units)
Source: SIAM, JSPL May 2013 presentation, Corporate Catalyst India, Aranca Research
Notes: E - Estimate; FY - Indian Financial Year (April - March)
CAGR: 12.9%
1.8 2.4 3 3.1 3.2 5.1
9.7
0.4 0.6 0.8 0.9 0.8 1.4 2.4
8.9 11.1
14.2 16.3 16.6
21
30.2
FY09 FY10 FY11 FY12 FY13 FY16E FY21E
Passenger vehicles Commercial vehicles
Three wheelers and two wheelers
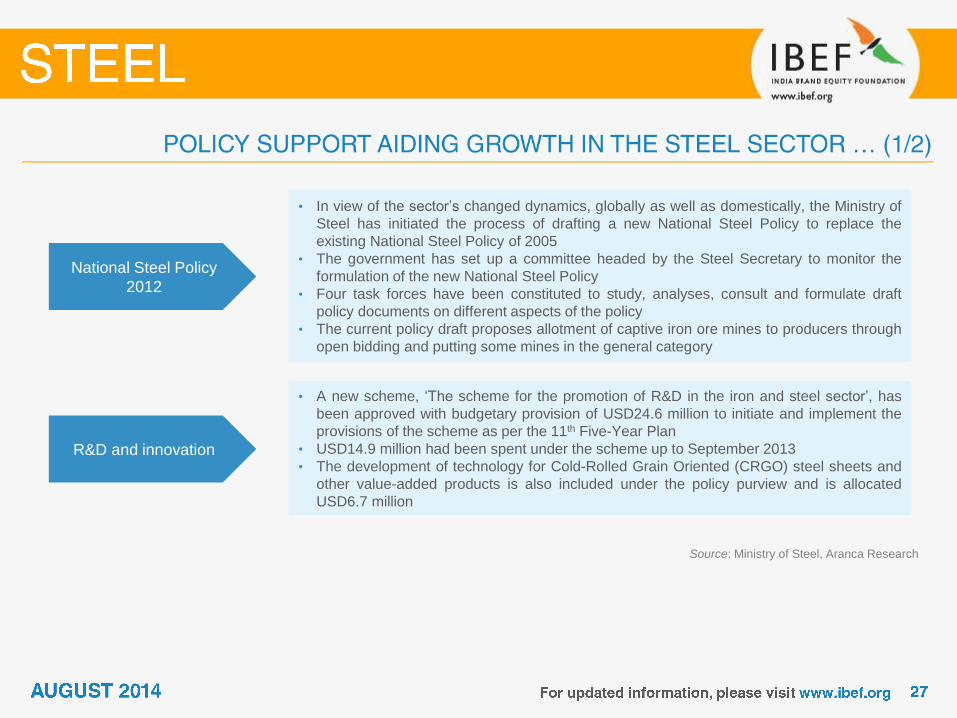
National Steel Policy
2012
• In view of the sector’s changed dynamics, globally as well as domestically, the Ministry of
Steel has initiated the process of drafting a new National Steel Policy to replace the
existing National Steel Policy of 2005
• The government has set up a committee headed by the Steel Secretary to monitor the
formulation of the new National Steel Policy
• Four task forces have been constituted to study, analyses, consult and formulate draft
policy documents on different aspects of the policy
• The current policy draft proposes allotment of captive iron ore mines to producers through
open bidding and putting some mines in the general category
R&D and innovation
• A new scheme, ‘The scheme for the promotion of R&D in the iron and steel sector’, has
been approved with budgetary provision of USD24.6 million to initiate and implement the
provisions of the scheme as per the 11th Five-Year Plan
• USD14.9 million had been spent under the scheme up to September 2013
• The development of technology for Cold-Rolled Grain Oriented (CRGO) steel sheets and
other value-added products is also included under the policy purview and is allocated
USD6.7 million
Source: Ministry of Steel, Aranca Research
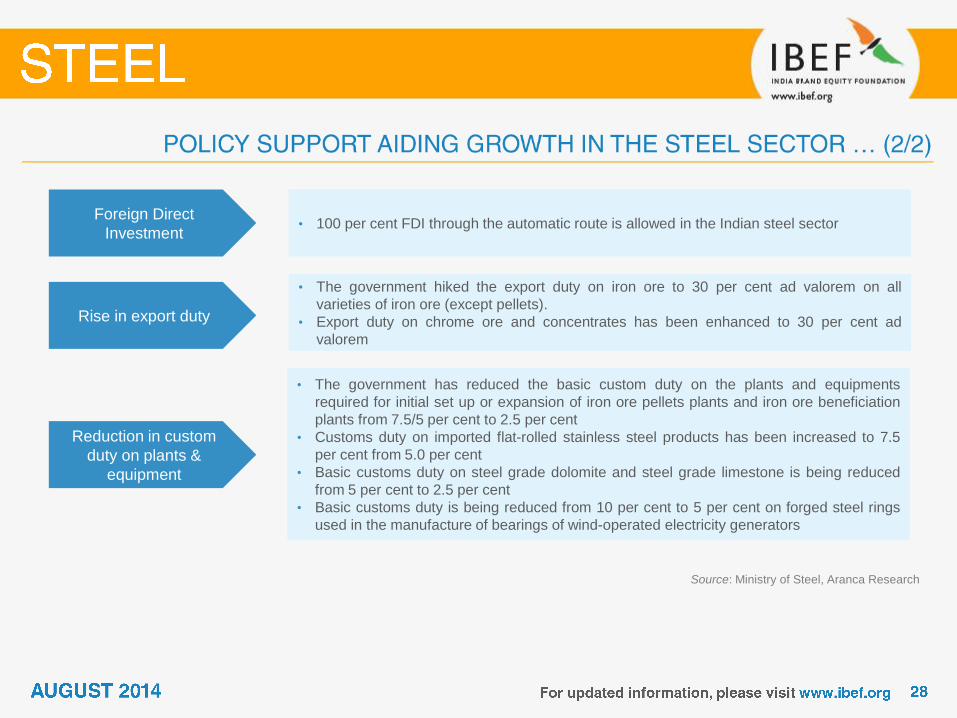
Foreign Direct
Investment • 100 per cent FDI through the automatic route is allowed in the Indian steel sector
Rise in export duty
Source: Ministry of Steel, Aranca Research
Reduction in custom
duty on plants &
equipment
• The government has reduced the basic custom duty on the plants and equipments
required for initial set up or expansion of iron ore pellets plants and iron ore beneficiation
plants from 7.5/5 per cent to 2.5 per cent
• Customs duty on imported flat-rolled stainless steel products has been increased to 7.5
per cent from 5.0 per cent
• Basic customs duty on steel grade dolomite and steel grade limestone is being reduced
from 5 per cent to 2.5 per cent
• Basic customs duty is being reduced from 10 per cent to 5 per cent on forged steel rings
used in the manufacture of bearings of wind-operated electricity generators
• The government hiked the export duty on iron ore to 30 per cent ad valorem on all
varieties of iron ore (except pellets).
• Export duty on chrome ore and concentrates has been enhanced to 30 per cent ad
valorem
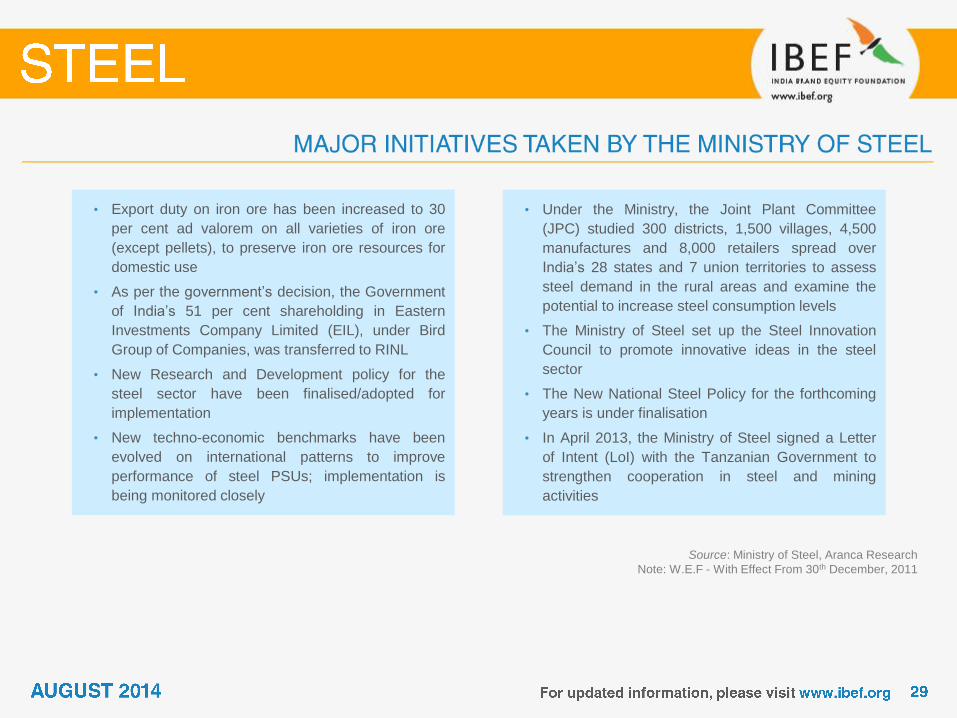
• Export duty on iron ore has been increased to 30
per cent ad valorem on all varieties of iron ore
(except pellets), to preserve iron ore resources for
domestic use
• As per the government’s decision, the Government
of India’s 51 per cent shareholding in Eastern
Investments Company Limited (EIL), under Bird
Group of Companies, was transferred to RINL
• New Research and Development policy for the
steel sector have been finalised/adopted for
implementation
• New techno-economic benchmarks have been
evolved on international patterns to improve
performance of steel PSUs; implementation is
being monitored closely
• Under the Ministry, the Joint Plant Committee
(JPC) studied 300 districts, 1,500 villages, 4,500
manufactures and 8,000 retailers spread over
India’s 28 states and 7 union territories to assess
steel demand in the rural areas and examine the
potential to increase steel consumption levels
• The Ministry of Steel set up the Steel Innovation
Council to promote innovative ideas in the steel
sector
• The New National Steel Policy for the forthcoming
years is under finalisation
• In April 2013, the Ministry of Steel signed a Letter
of Intent (LoI) with the Tanzanian Government to
strengthen cooperation in steel and mining
activities
Source: Ministry of Steel, Aranca Research
Note: W.E.F - With Effect From 30th December, 2011
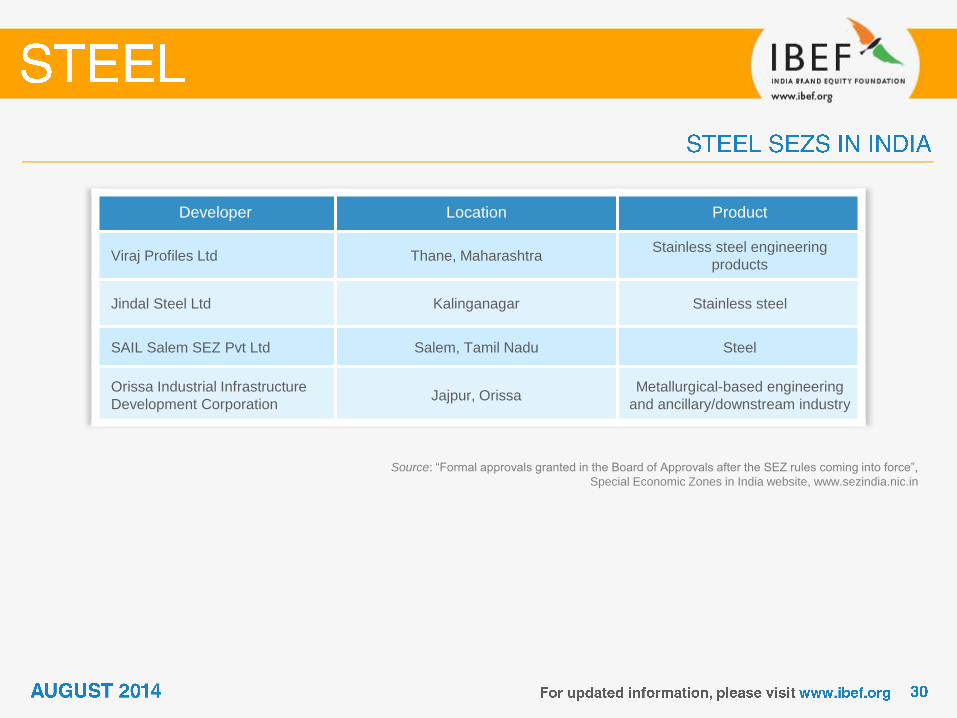
Developer Location Product
Viraj Profiles Ltd Thane, Maharashtra Stainless steel engineering
products
Jindal Steel Ltd Kalinganagar Stainless steel
SAIL Salem SEZ Pvt Ltd Salem, Tamil Nadu Steel
Orissa Industrial Infrastructure
Development Corporation Jajpur, Orissa
Metallurgical-based engineering
and ancillary/downstream industry
Source: “Formal approvals granted in the Board of Approvals after the SEZ rules coming into force”,
Special Economic Zones in India website, www.sezindia.nic.in
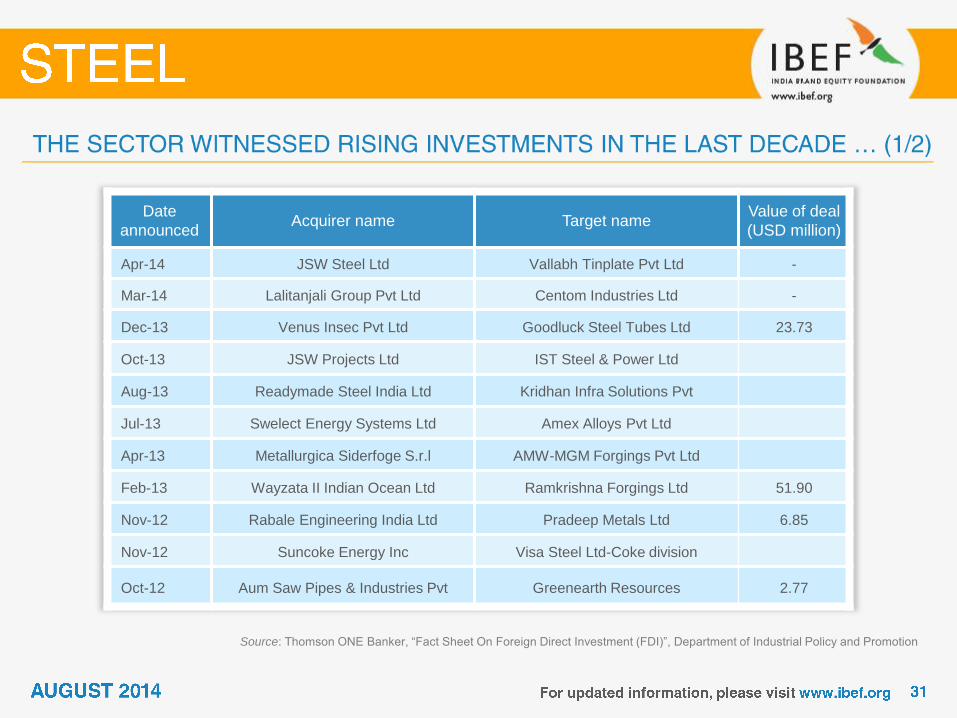
Source: Thomson ONE Banker, “Fact Sheet On Foreign Direct Investment (FDI)”, Department of Industrial Policy and Promotion
Date
announced Acquirer name Target name
Value of deal
(USD million)
Apr-14 JSW Steel Ltd Vallabh Tinplate Pvt Ltd -
Mar-14 Lalitanjali Group Pvt Ltd Centom Industries Ltd -
Dec-13 Venus Insec Pvt Ltd Goodluck Steel Tubes Ltd 23.73
Oct-13 JSW Projects Ltd IST Steel & Power Ltd
Aug-13 Readymade Steel India Ltd Kridhan Infra Solutions Pvt
Jul-13 Swelect Energy Systems Ltd Amex Alloys Pvt Ltd
Apr-13 Metallurgica Siderfoge S.r.l AMW-MGM Forgings Pvt Ltd
Feb-13 Wayzata II Indian Ocean Ltd Ramkrishna Forgings Ltd 51.90
Nov-12 Rabale Engineering India Ltd Pradeep Metals Ltd 6.85
Nov-12 Suncoke Energy Inc Visa Steel Ltd-Coke division
Oct-12 Aum Saw Pipes & Industries Pvt Greenearth Resources 2.77
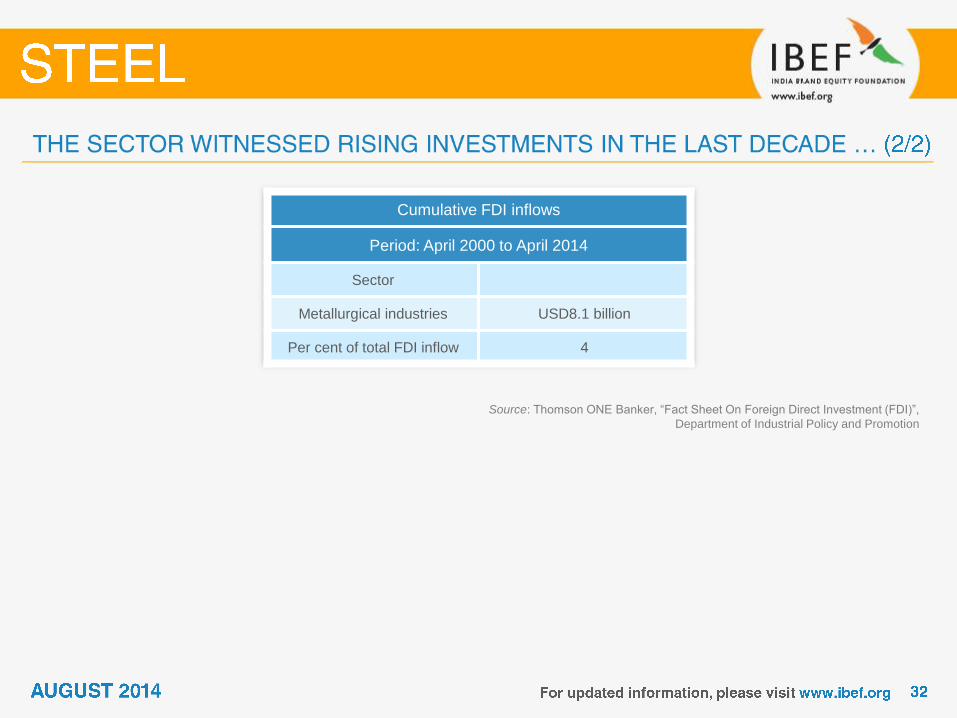
Source: Thomson ONE Banker, “Fact Sheet On Foreign Direct Investment (FDI)”,
Department of Industrial Policy and Promotion
Cumulative FDI inflows
Period: April 2000 to April 2014
Sector
Metallurgical industries USD8.1 billion
Per cent of total FDI inflow 4
For updated information, please visit www.ibef.org
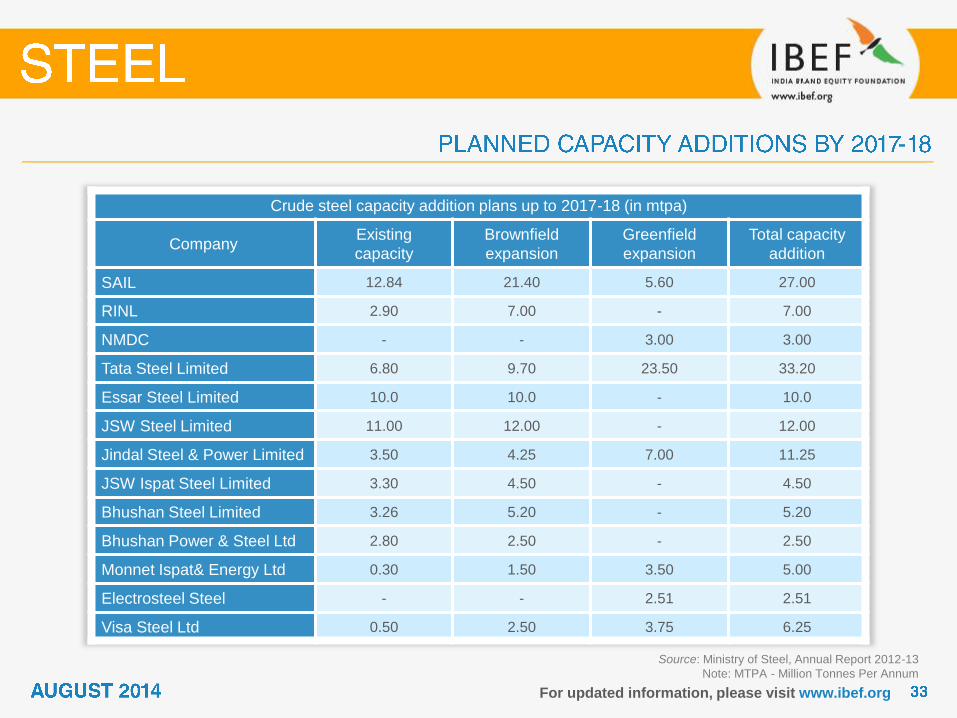
Crude steel capacity addition plans up to 2017-18 (in mtpa)
Company Existing
capacity
Brownfield
expansion
Greenfield
expansion
Total capacity
addition
SAIL 12.84 21.40 5.60 27.00
RINL 2.90 7.00 - 7.00
NMDC - - 3.00 3.00
Tata Steel Limited 6.80 9.70 23.50 33.20
Essar Steel Limited 10.0 10.0 - 10.0
JSW Steel Limited 11.00 12.00 - 12.00
Jindal Steel & Power Limited 3.50 4.25 7.00 11.25
JSW Ispat Steel Limited 3.30 4.50 - 4.50
Bhushan Steel Limited 3.26 5.20 - 5.20
Bhushan Power & Steel Ltd 2.80 2.50 - 2.50
Monnet Ispat& Energy Ltd 0.30 1.50 3.50 5.00
Electrosteel Steel - - 2.51 2.51
Visa Steel Ltd 0.50 2.50 3.75 6.25
Source: Ministry of Steel, Annual Report 2012-13
Note: MTPA - Million Tonnes Per Annum
Notes: Capex – Capital Expenditure,
P - Provisional
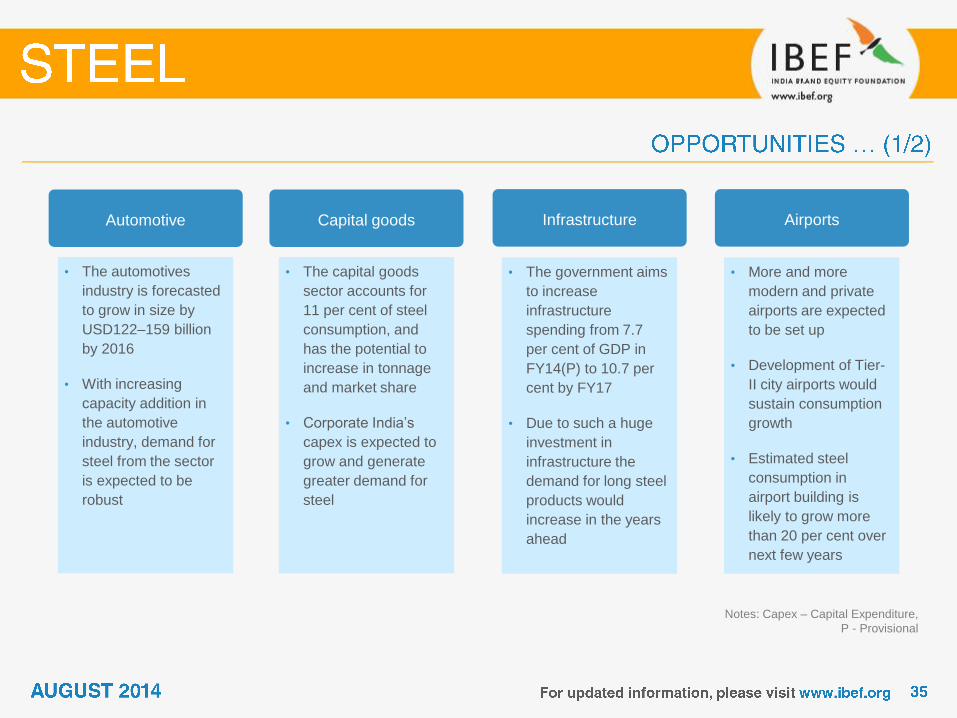
Automotive
• The automotives
industry is forecasted
to grow in size by
USD122–159 billion
by 2016
• With increasing
capacity addition in
the automotive
industry, demand for
steel from the sector
is expected to be
robust
Capital goods
• The capital goods
sector accounts for
11 per cent of steel
consumption, and
has the potential to
increase in tonnage
and market share
• Corporate India’s
capex is expected to
grow and generate
greater demand for
steel
Infrastructure
• The government aims
to increase
infrastructure
spending from 7.7
per cent of GDP in
FY14(P) to 10.7 per
cent by FY17
• Due to such a huge
investment in
infrastructure the
demand for long steel
products would
increase in the years
ahead
Airports
• More and more
modern and private
airports are expected
to be set up
• Development of Tier-
II city airports would
sustain consumption
growth
• Estimated steel
consumption in
airport building is
likely to grow more
than 20 per cent over
next few years
Source: Planning Commission, Aranca Research
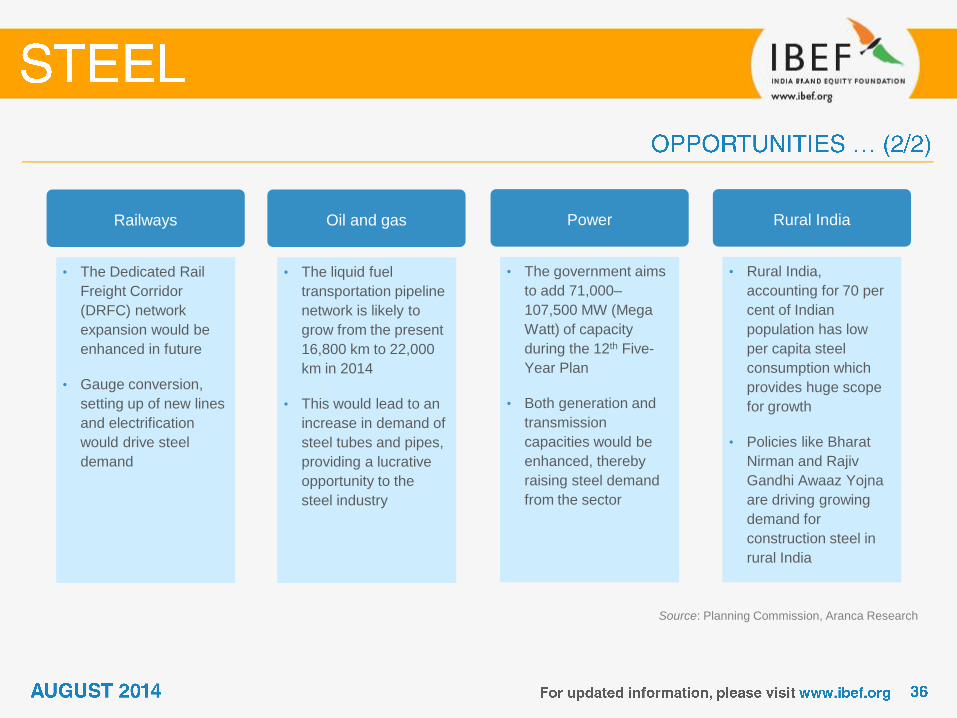
Railways
• The Dedicated Rail
Freight Corridor
(DRFC) network
expansion would be
enhanced in future
• Gauge conversion,
setting up of new lines
and electrification
would drive steel
demand
Oil and gas
• The liquid fuel
transportation pipeline
network is likely to
grow from the present
16,800 km to 22,000
km in 2014
• This would lead to an
increase in demand of
steel tubes and pipes,
providing a lucrative
opportunity to the
steel industry
Power
• The government aims
to add 71,000–
107,500 MW (Mega
Watt) of capacity
during the 12th Five-
Year Plan
• Both generation and
transmission
capacities would be
enhanced, thereby
raising steel demand
from the sector
Rural India
• Rural India,
accounting for 70 per
cent of Indian
population has low
per capita steel
consumption which
provides huge scope
for growth
• Policies like Bharat
Nirman and Rajiv
Gandhi Awaaz Yojna
are driving growing
demand for
construction steel in
rural India

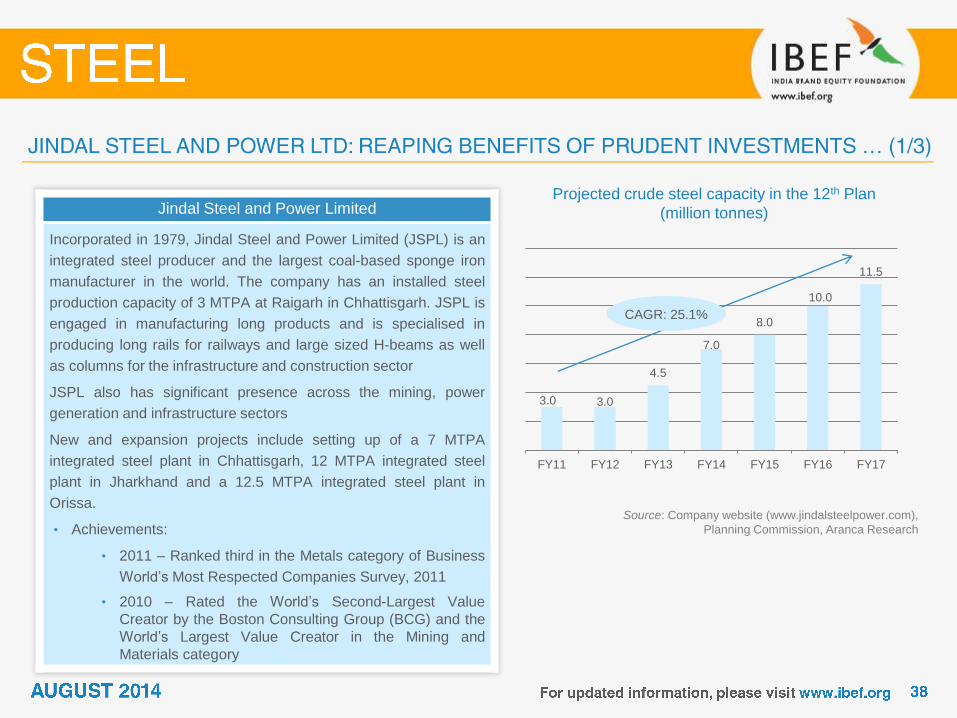
Jindal Steel and Power Limited
Incorporated in 1979, Jindal Steel and Power Limited (JSPL) is an
integrated steel producer and the largest coal-based sponge iron
manufacturer in the world. The company has an installed steel
production capacity of 3 MTPA at Raigarh in Chhattisgarh. JSPL is
engaged in manufacturing long products and is specialised in
producing long rails for railways and large sized H-beams as well
as columns for the infrastructure and construction sector
JSPL also has significant presence across the mining, power
generation and infrastructure sectors
New and expansion projects include setting up of a 7 MTPA
integrated steel plant in Chhattisgarh, 12 MTPA integrated steel
plant in Jharkhand and a 12.5 MTPA integrated steel plant in
Orissa.
• Achievements:
• 2011 – Ranked third in the Metals category of Business
World’s Most Respected Companies Survey, 2011
• 2010 – Rated the World’s Second-Largest Value
Creator by the Boston Consulting Group (BCG) and the
World’s Largest Value Creator in the Mining and
Materials category
Projected crude steel capacity in the 12th Plan
(million tonnes)
Source: Company website (www.jindalsteelpower.com),
Planning Commission, Aranca Research
3.0 3.0
4.5
7.0
8.0
10.0
11.5
FY11 FY12 FY13 FY14 FY15 FY16 FY17
CAGR: 25.1%
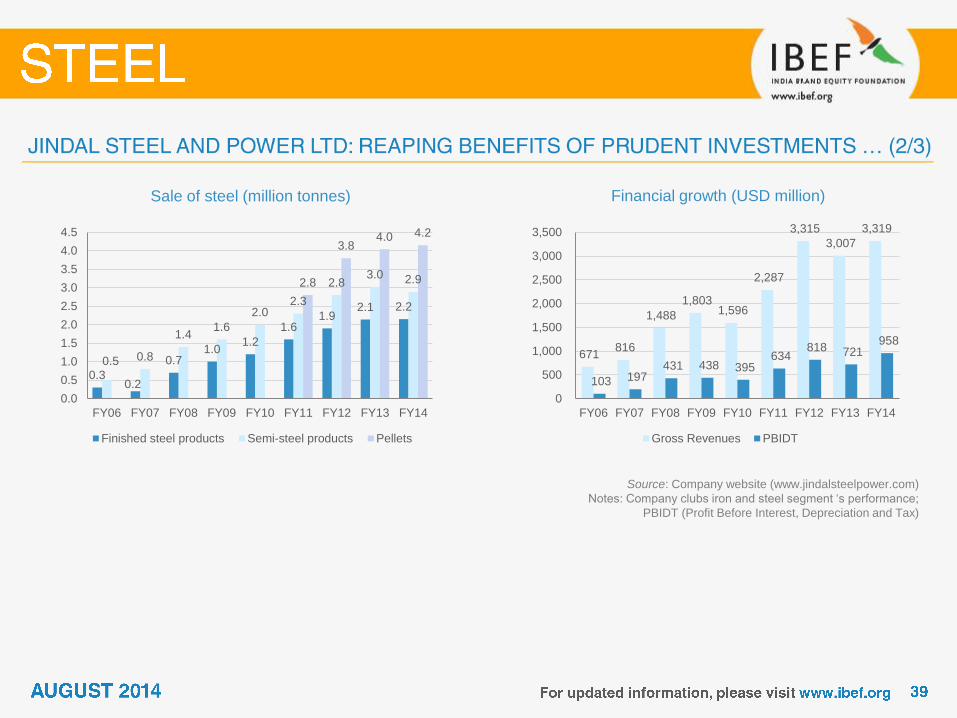
Financial growth (USD million) Sale of steel (million tonnes)
Source: Company website (www.jindalsteelpower.com)
Notes: Company clubs iron and steel segment ‘s performance;
PBIDT (Profit Before Interest, Depreciation and Tax)
0.3 0.2
0.7 1.0
1.2
1.6 1.9
2.1 2.2
0.5 0.8
1.4 1.6
2.0 2.3
2.8 3.0 2.9 2.8
3.8 4.0 4.2
0.0
0.5
1.0
1.5
2.0
2.5
3.0
3.5
4.0
4.5
FY06 FY07 FY08 FY09 FY10 FY11 FY12 FY13 FY14
Finished steel products Semi-steel products Pellets
671 816
1,488
1,803 1,596
2,287
3,315
3,007
3,319
103 197 431 438 395
634 818 721
958
0
500
1,000
1,500
2,000
2,500
3,000
3,500
FY06 FY07 FY08 FY09 FY10 FY11 FY12 FY13 FY14
Gross Revenues PBIDT
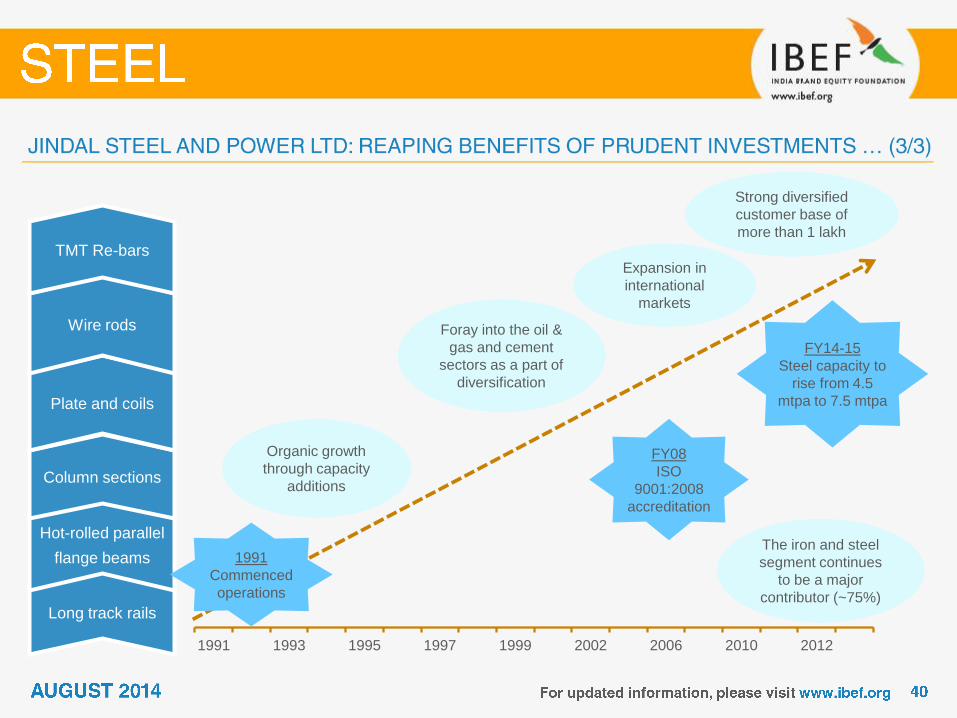
1991 1993 1995 1997 1999 2002 2006 2010 2012
Long track rails
Hot-rolled parallel
flange beams
Column sections
Plate and coils
Wire rods
Organic growth
through capacity
additions
Foray into the oil &
gas and cement
sectors as a part of
diversification
1991
Commenced
operations
FY08
ISO
9001:2008
accreditation
FY14-15
Steel capacity to
rise from 4.5
mtpa to 7.5 mtpa
The iron and steel
segment continues
to be a major
contributor (~75%)
Expansion in
international
markets
TMT Re-bars
Strong diversified
customer base of
more than 1 lakh
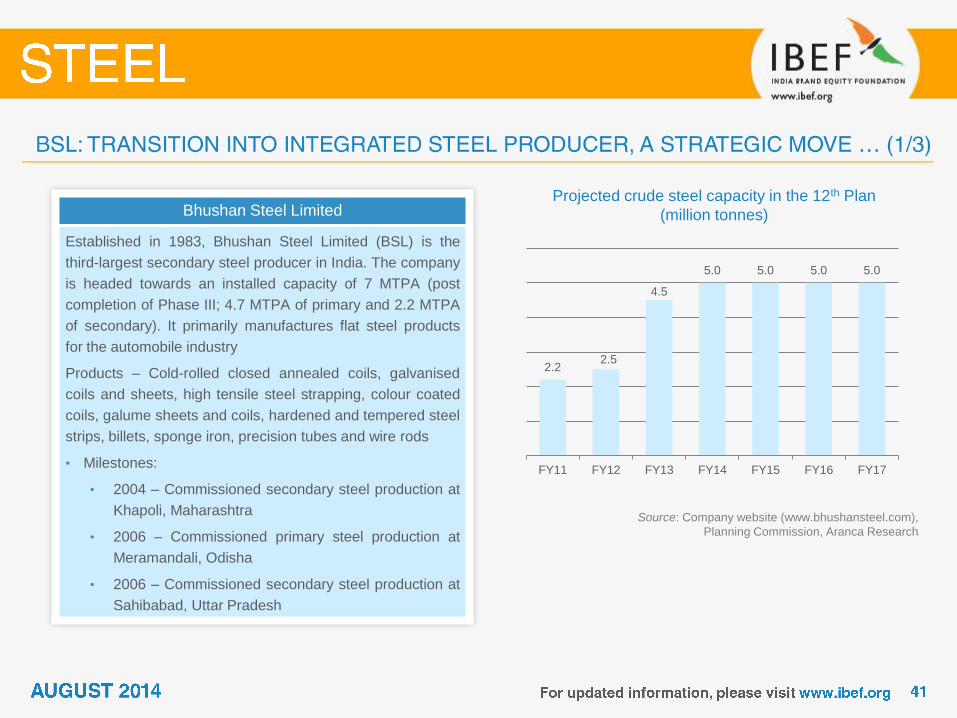
Bhushan Steel Limited
Established in 1983, Bhushan Steel Limited (BSL) is the
third-largest secondary steel producer in India. The company
is headed towards an installed capacity of 7 MTPA (post
completion of Phase III; 4.7 MTPA of primary and 2.2 MTPA
of secondary). It primarily manufactures flat steel products
for the automobile industry
Products – Cold-rolled closed annealed coils, galvanised
coils and sheets, high tensile steel strapping, colour coated
coils, galume sheets and coils, hardened and tempered steel
strips, billets, sponge iron, precision tubes and wire rods
• Milestones:
• 2004 – Commissioned secondary steel production at
Khapoli, Maharashtra
• 2006 – Commissioned primary steel production at
Meramandali, Odisha
• 2006 – Commissioned secondary steel production at
Sahibabad, Uttar Pradesh
Projected crude steel capacity in the 12th Plan
(million tonnes)
2.2 2.5
4.5
5.0 5.0 5.0 5.0
FY11 FY12 FY13 FY14 FY15 FY16 FY17
Source: Company website (www.bhushansteel.com),
Planning Commission, Aranca Research
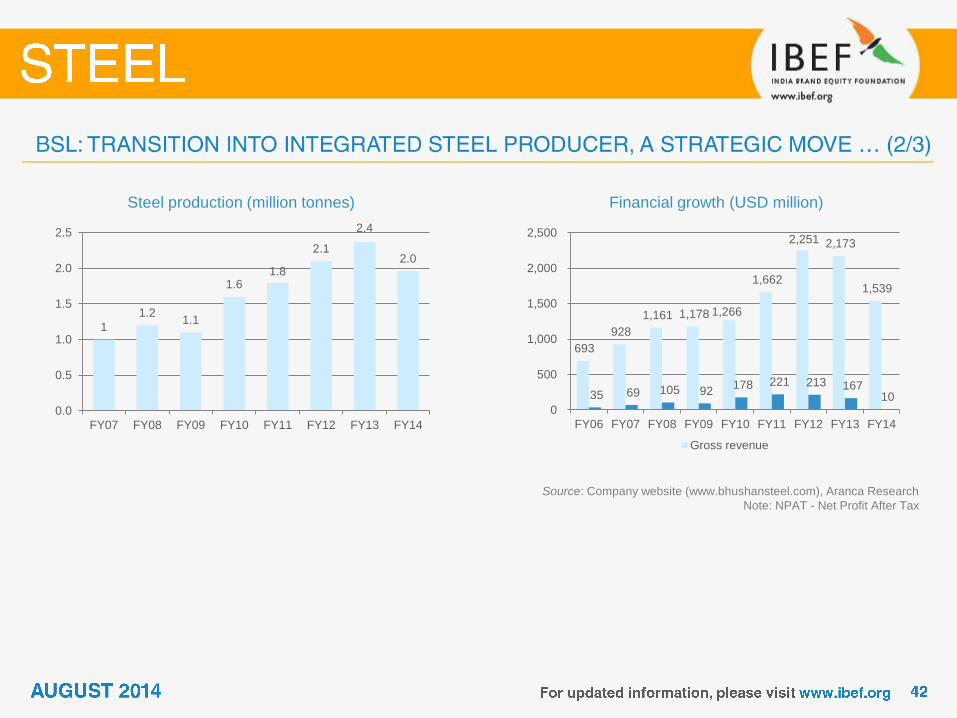
Financial growth (USD million) Steel production (million tonnes)
Source: Company website (www.bhushansteel.com), Aranca Research
Note: NPAT - Net Profit After Tax
1
1.2 1.1
1.6 1.8
2.1
2.4
2.0
0.0
0.5
1.0
1.5
2.0
2.5
FY07 FY08 FY09 FY10 FY11 FY12 FY13 FY14
693
928
1,161 1,178 1,266
1,662
2,251 2,173
1,539
35 69 105 92 178 221 213 167
10 0
500
1,000
1,500
2,000
2,500
FY06 FY07 FY08 FY09 FY10 FY11 FY12 FY13 FY14
Gross revenue
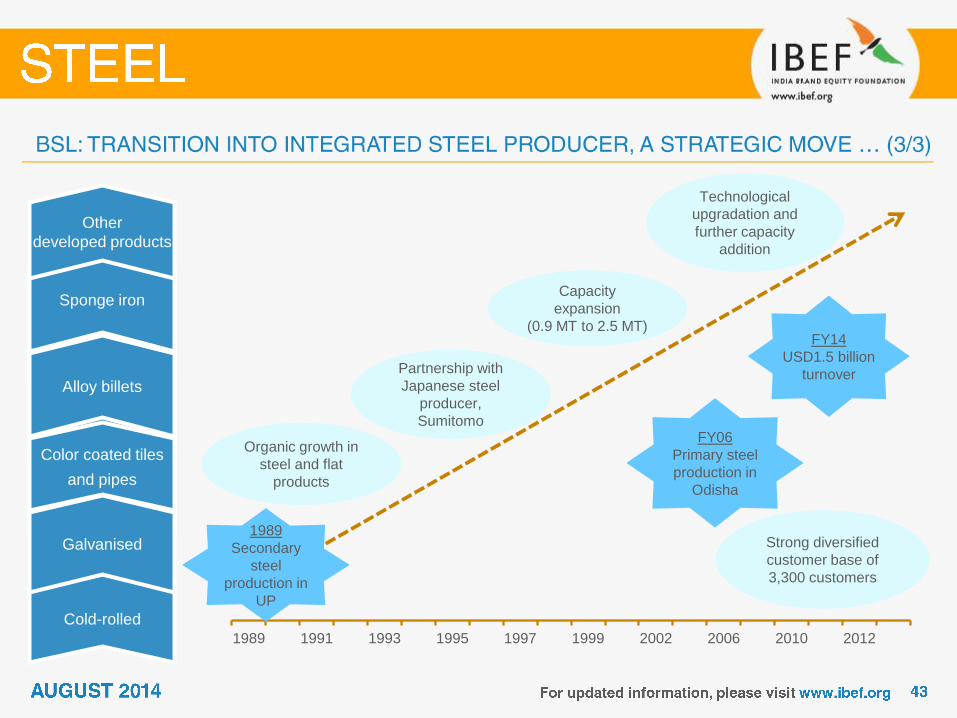
1989 1991 1993 1995 1997 1999 2002 2006 2010 2012
Cold-rolled
Wheel, tyre and
axle plant (railways)
Alloy steel
Iron making and
castings
Organic growth in
steel and flat
products
Capacity
expansion
(0.9 MT to 2.5 MT)
1989
Secondary
steel
production in
UP
Partnership with
Japanese steel
producer,
Sumitomo FY06
Primary steel
production in
Odisha
FY14
USD1.5 billion
turnover
Galvanised
Color coated tiles
and pipes
Alloy billets
Sponge iron
Other
developed products
Technological
upgradation and
further capacity
addition
Strong diversified
customer base of
3,300 customers
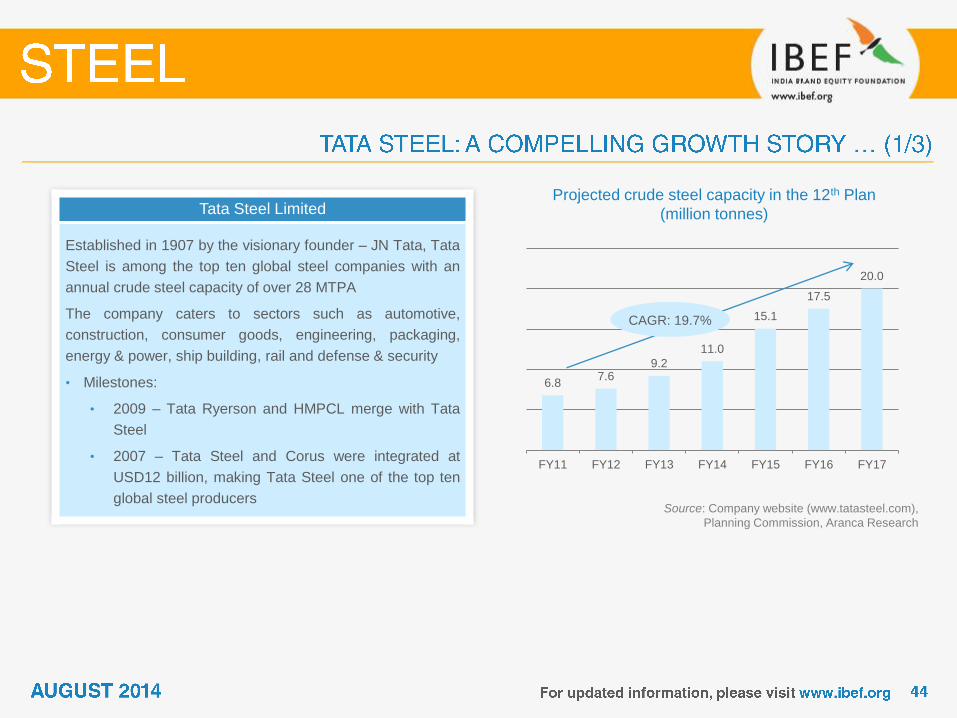
Tata Steel Limited
Established in 1907 by the visionary founder – JN Tata, Tata
Steel is among the top ten global steel companies with an
annual crude steel capacity of over 28 MTPA
The company caters to sectors such as automotive,
construction, consumer goods, engineering, packaging,
energy & power, ship building, rail and defense & security
• Milestones:
• 2009 – Tata Ryerson and HMPCL merge with Tata
Steel
• 2007 – Tata Steel and Corus were integrated at
USD12 billion, making Tata Steel one of the top ten
global steel producers
Projected crude steel capacity in the 12th Plan
(million tonnes)
Source: Company website (www.tatasteel.com),
Planning Commission, Aranca Research
6.8 7.6
9.2
11.0
15.1
17.5
20.0
FY11 FY12 FY13 FY14 FY15 FY16 FY17
CAGR: 19.7%
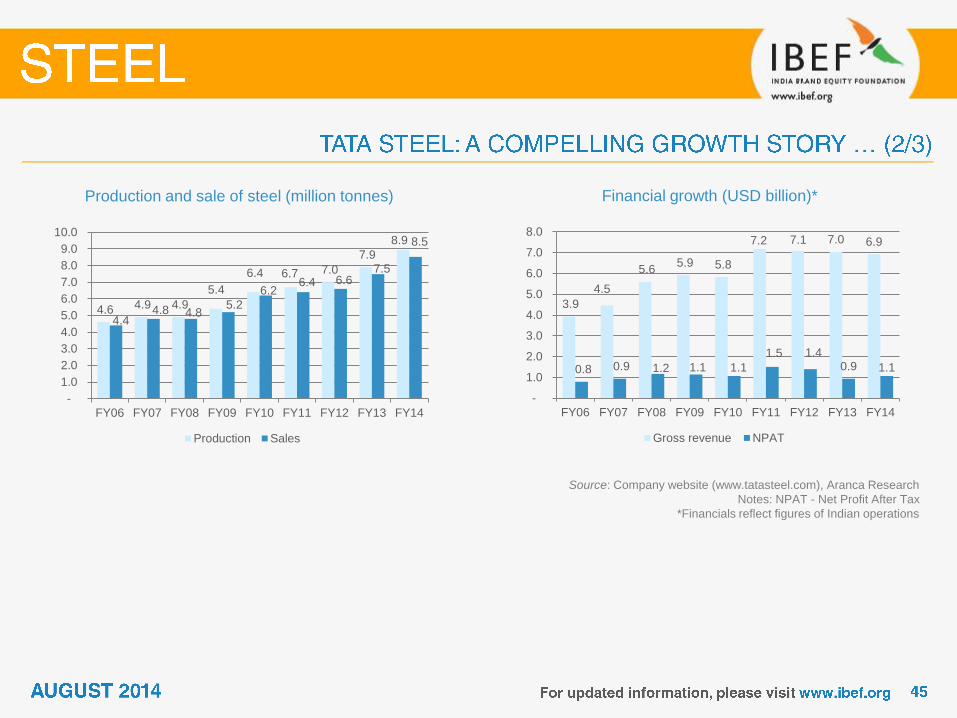
Financial growth (USD billion)* Production and sale of steel (million tonnes)
Source: Company website (www.tatasteel.com), Aranca Research
Notes: NPAT - Net Profit After Tax
*Financials reflect figures of Indian operations
4.6 4.9 4.9
5.4
6.4 6.7 7.0
7.9
8.9
4.4 4.8 4.8
5.2
6.2 6.4 6.6
7.5
8.5
-
1.0
2.0
3.0
4.0
5.0
6.0
7.0
8.0
9.0
10.0
FY06 FY07 FY08 FY09 FY10 FY11 FY12 FY13 FY14
Production Sales
3.9
4.5
5.6 5.9 5.8
7.2 7.1 7.0 6.9
0.8 0.9 1.2 1.1 1.1
1.5 1.4 0.9 1.1
-
1.0
2.0
3.0
4.0
5.0
6.0
7.0
8.0
FY06 FY07 FY08 FY09 FY10 FY11 FY12 FY13 FY14
Gross revenue NPAT
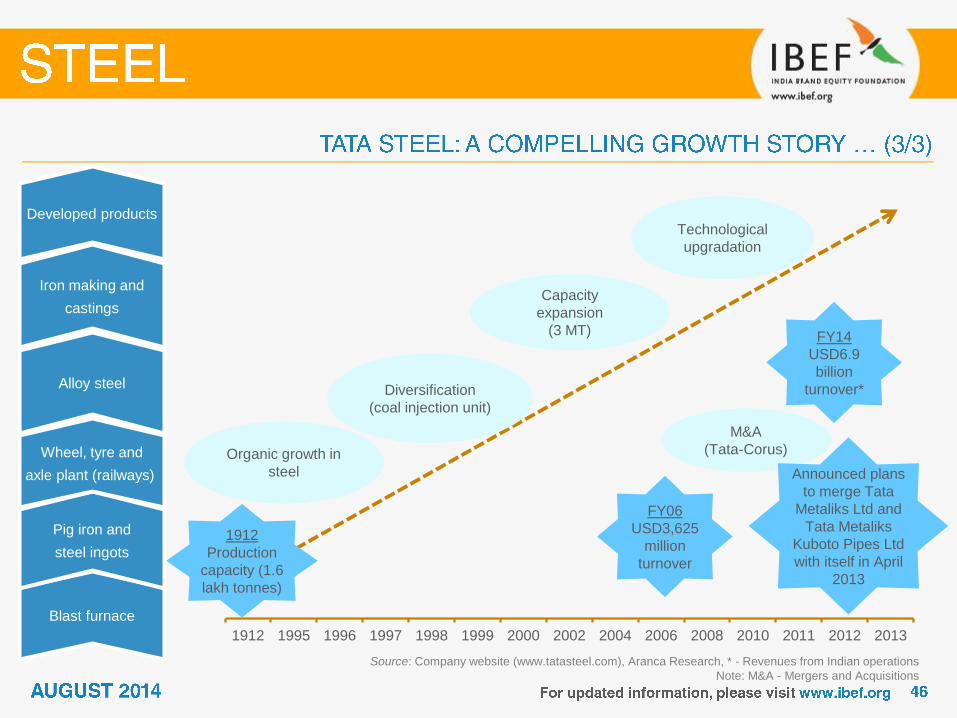
Source: Company website (www.tatasteel.com), Aranca Research, * - Revenues from Indian operations
Note: M&A - Mergers and Acquisitions
1912 1995 1996 1997 1998 1999 2000 2002 2004 2006 2008 2010 2011 2012 2013
Blast furnace
Organic growth in
steel
Capacity
expansion
(3 MT)
M&A
(Tata-Corus)
Technological
upgradation
1912
Production
capacity (1.6
lakh tonnes)
Diversification
(coal injection unit)
FY06
USD3,625
million
turnover
FY14
USD6.9
billion
turnover*
Pig iron and
steel ingots
Wheel, tyre and
axle plant (railways)
Alloy steel
Iron making and
castings
Developed products
Announced plans
to merge Tata
Metaliks Ltd and
Tata Metaliks
Kuboto Pipes Ltd
with itself in April
2013
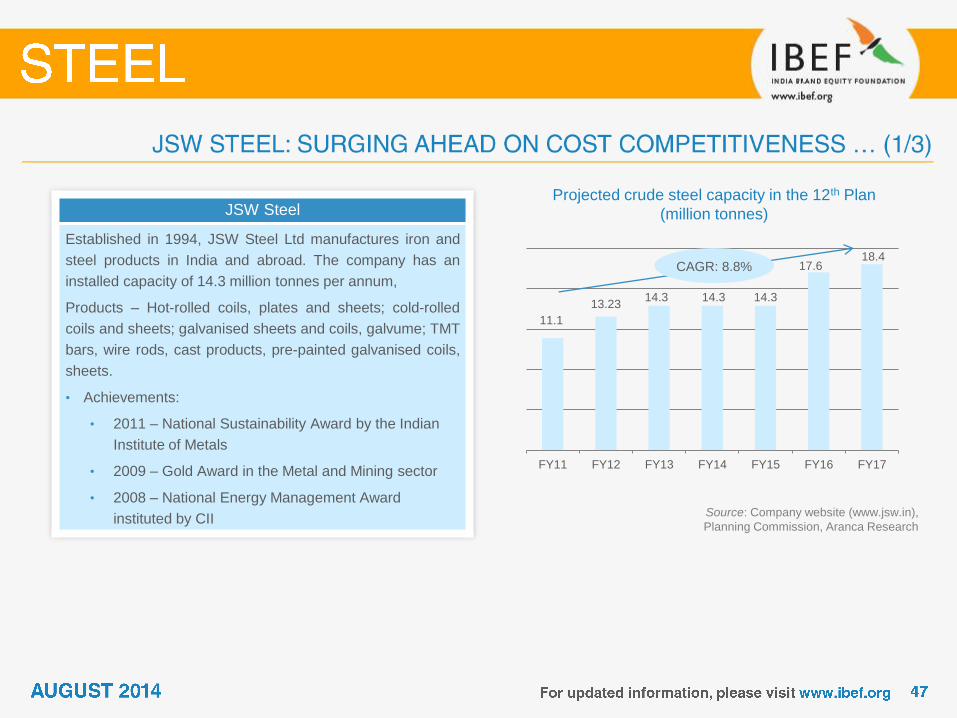
JSW Steel
Established in 1994, JSW Steel Ltd manufactures iron and
steel products in India and abroad. The company has an
installed capacity of 14.3 million tonnes per annum,
Products – Hot-rolled coils, plates and sheets; cold-rolled
coils and sheets; galvanised sheets and coils, galvume; TMT
bars, wire rods, cast products, pre-painted galvanised coils,
sheets.
• Achievements:
• 2011 – National Sustainability Award by the Indian
Institute of Metals
• 2009 – Gold Award in the Metal and Mining sector
• 2008 – National Energy Management Award
instituted by CII
Projected crude steel capacity in the 12th Plan
(million tonnes)
Source: Company website (www.jsw.in),
Planning Commission, Aranca Research
11.1
13.23 14.3 14.3 14.3
17.6 18.4
FY11 FY12 FY13 FY14 FY15 FY16 FY17
CAGR: 8.8%
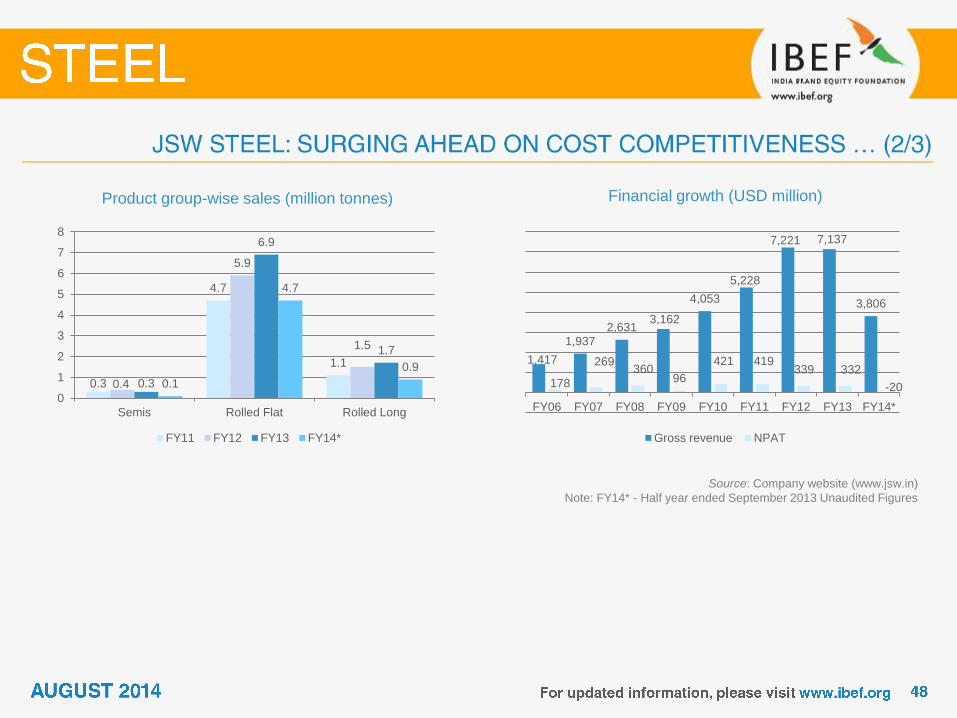
Financial growth (USD million) Product group-wise sales (million tonnes)
Source: Company website (www.jsw.in)
Note: FY14* - Half year ended September 2013 Unaudited Figures
0.3
4.7
1.1
0.4
5.9
1.5
0.3
6.9
1.7
0.1
4.7
0.9
0
1
2
3
4
5
6
7
8
Semis Rolled Flat Rolled Long
FY11 FY12 FY13 FY14*
1,417
1,937 2,631
3,162
4,053
5,228
7,221 7,137
3,806
178
269 360
96
421 419 339 332
-20
FY06 FY07 FY08 FY09 FY10 FY11 FY12 FY13 FY14*
Gross revenue NPAT
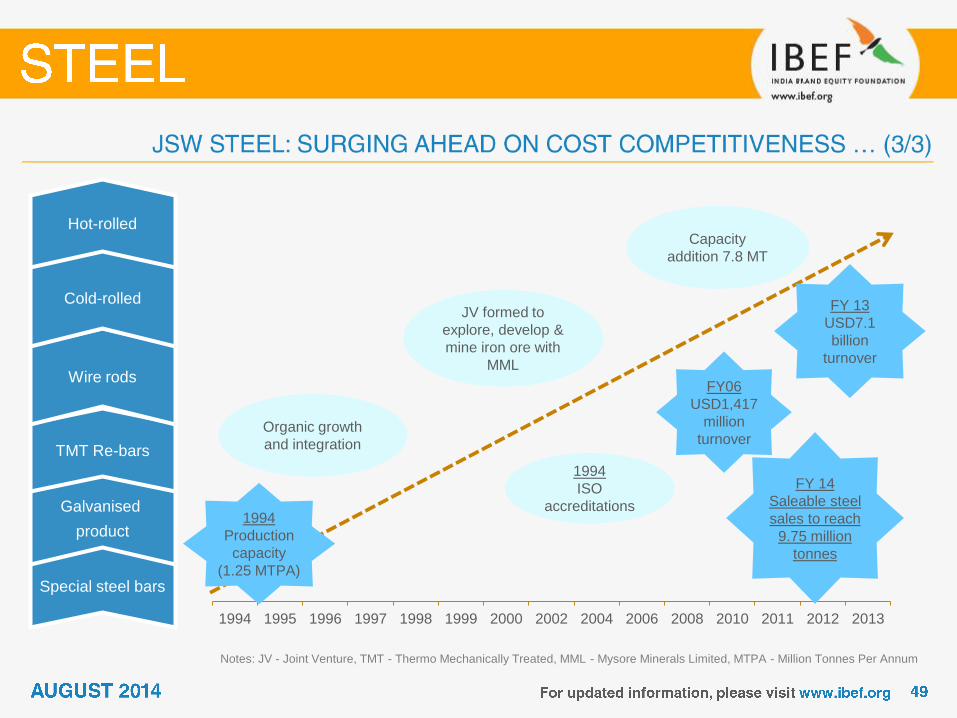
Notes: JV - Joint Venture, TMT - Thermo Mechanically Treated, MML - Mysore Minerals Limited, MTPA - Million Tonnes Per Annum
1994 1995 1996 1997 1998 1999 2000 2002 2004 2006 2008 2010 2011 2012 2013
FY 14
Saleable steel
sales to reach
9.75 million
tonnes
Special steel bars
Galvanised
product
TMT Re-bars
Wire rods
Cold-rolled
Hot-rolled
Organic growth
and integration
JV formed to
explore, develop &
mine iron ore with
MML
1994
ISO
accreditations
Capacity
addition 7.8 MT
1994
Production
capacity
(1.25 MTPA)
FY06
USD1,417
million
turnover
FY 13
USD7.1
billion
turnover

Indian Stainless Steel Development Association L-22/4, DLF Phase-II
Gurgaon, Haryana –122 002
Phone: 91-124-4375501
Fax: 91-124-4375509
E-mail: [email protected]
CAGR: Compound Annual Growth Rate
FDI: Foreign Direct Investment
FY: Indian Financial Year (April to March)
So FY10 implies April 2009 to March 2010
JV: Joint Venture
MoU: Memorandum of Understanding
MT: Million Tonnes
MTPA: Million Tonnes Per Annum
NPAT: Net Profit After Tax
SEZ: Special Economic Zone
TMT: Thermo Mechanically Treated
USD: US Dollar
Wherever applicable, numbers have been rounded off to the nearest whole number
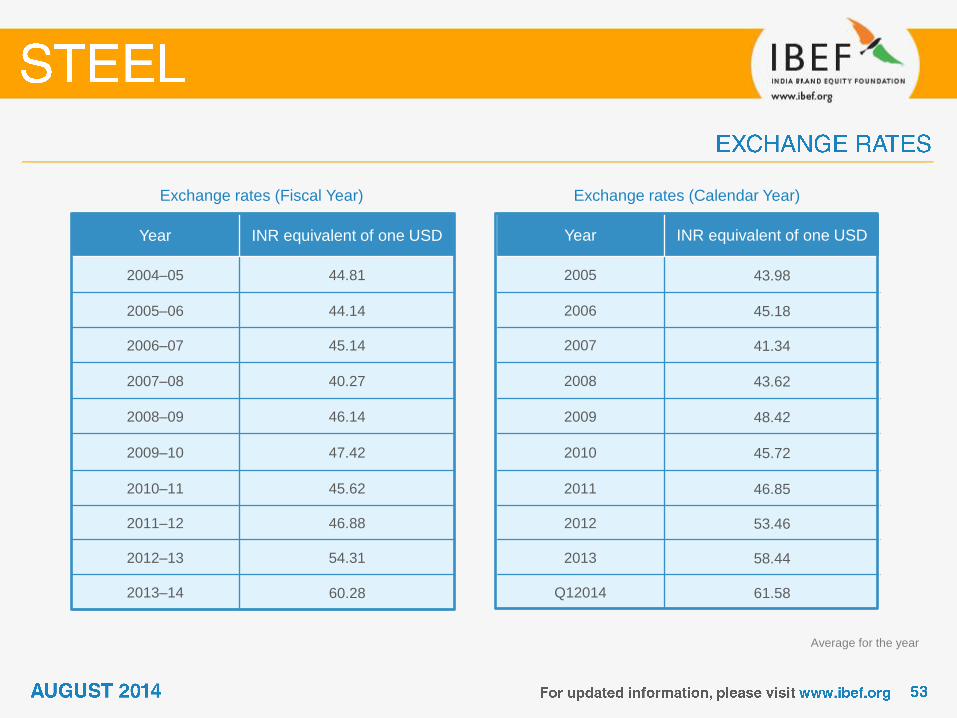
Year INR equivalent of one USD
2004–05 44.81
2005–06 44.14
2006–07 45.14
2007–08 40.27
2008–09 46.14
2009–10 47.42
2010–11 45.62
2011–12 46.88
2012–13 54.31
2013–14 60.28
Exchange rates (Fiscal Year)
Year INR equivalent of one USD
2005 43.98
2006 45.18
2007 41.34
2008 43.62
2009 48.42
2010 45.72
2011 46.85
2012 53.46
2013 58.44
Q12014 61.58
Exchange rates (Calendar Year)
Average for the year
India Brand Equity Foundation (“IBEF”) engaged Aranca to prepare this presentation and the same has been prepared
by Aranca in consultation with IBEF.
All rights reserved. All copyright in this presentation and related works is solely and exclusively owned by IBEF. The
same may not be reproduced, wholly or in part in any material form (including photocopying or storing it in any medium
by electronic means and whether or not transiently or incidentally to some other use of this presentation), modified or in
any manner communicated to any third party except with the written approval of IBEF.
This presentation is for information purposes only. While due care has been taken during the compilation of this
presentation to ensure that the information is accurate to the best of Aranca and IBEF’s knowledge and belief, the
content is not to be construed in any manner whatsoever as a substitute for professional advice.
Aranca and IBEF neither recommend nor endorse any specific products or services that may have been mentioned in
this presentation and nor do they assume any liability or responsibility for the outcome of decisions taken as a result of
any reliance placed on this presentation.
Neither Aranca nor IBEF shall be liable for any direct or indirect damages that may arise due to any act or omission on
the part of the user due to any reliance placed or guidance taken from any portion of this presentation.