Embed Size (px)
Citation preview

Stefan Arnborg, KTH, SICS
Ingrid Agartz, Håkan Hall, Erik Jönsson, Anna Sillén, Göran Sedvall, Karolinska Institutet
http://www.nada.kth.se/~stefan
Data Mining in Schizophrenia Research -preliminary
Data mining in science?
• Hasty decision making or eternal truth?
• Underpinning of findings?
• ...


Human Brain Informatics - HUBINHuman Brain Informatics - HUBIN
A project to accelerate research and development A project to accelerate research and development
to find new treatments for human brain diseaseto find new treatments for human brain disease

Human Brain Informatics - HUBIN
Intentions:
To develop a uniform database for brain
information from defined human subject groups
To implement data from many research
areas - “datadomains” - into the database
To perform statistical and datamining analyses using data from all the data domains
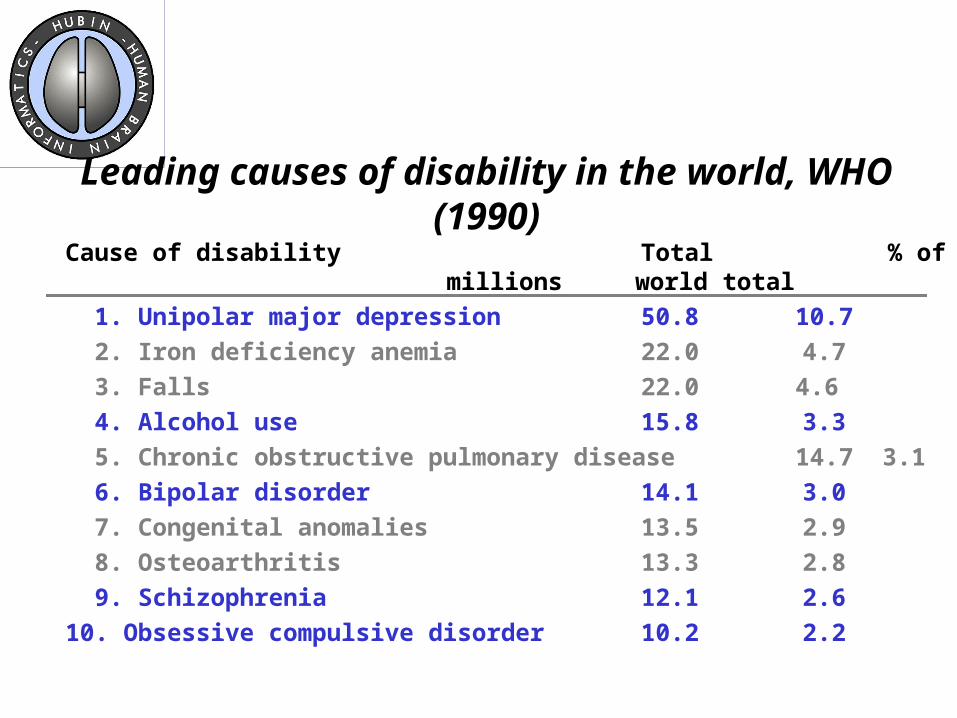
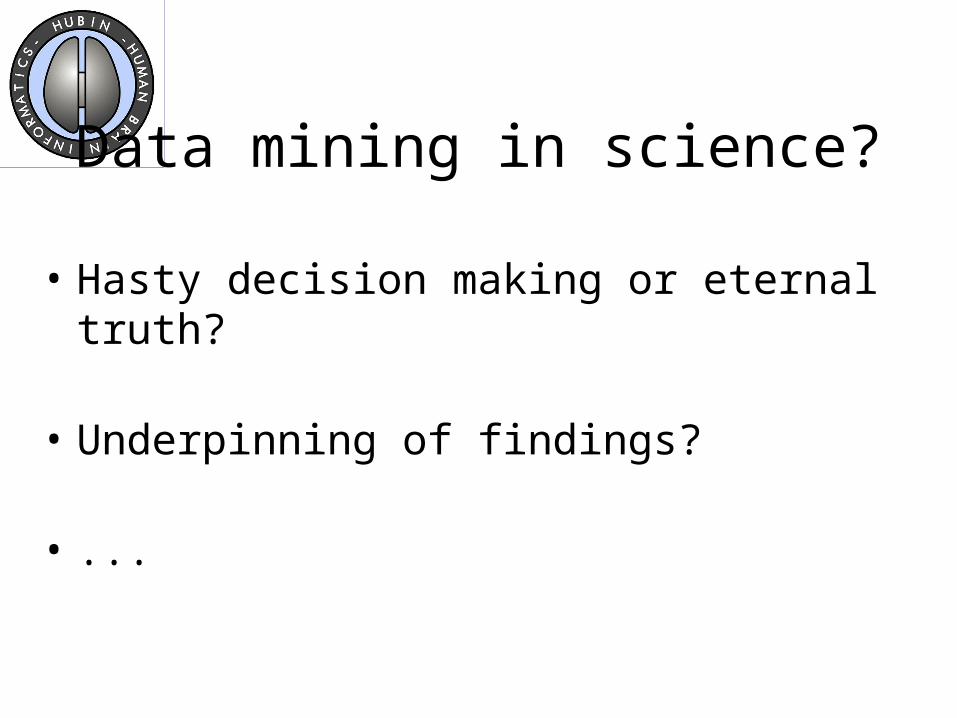
Leading causes of disability in the world, WHO (1990)
Cause of disability Total % of millions world total
1. Unipolar major depression 50.8 10.7
2. Iron deficiency anemia 22.0 4.7
3. Falls 22.0 4.6
4. Alcohol use 15.8 3.3
5. Chronic obstructive pulmonary disease 14.7 3.1
6. Bipolar disorder 14.1 3.0
7. Congenital anomalies 13.5 2.9
8. Osteoarthritis 13.3 2.8
9. Schizophrenia 12.1 2.6
10. Obsessive compulsive disorder 10.2 2.2

Schizophrenia -Questions and Clues
• Cause(s) of schizophrenia not known.• Does not appear in animals-no experimental clues.• Explanation models vary over time.• Disturbed neuronal circuitry in schizophrenia?
(currently hottest hypothesis)• Influenced by genotype or/and environment?
(clustering in families - but epidemiologic studies andstudies on adopted twins suggest both causes)
Schizophrenia -Questions and Clues
• Which processes result in disease?• Traces of disturbed development visible in MRI
(anatomy) and blood tests?• Genetic risk factors?• Causal pathways?

Hubin organizationHubin organization
Ethical groupEthical groupGöran Sedvall, ChairmanGöran Sedvall, Chairman
Ethical groupEthical groupGöran Sedvall, ChairmanGöran Sedvall, Chairman
Hubin ABHubin ABStig Larsson, ChairmanStig Larsson, ChairmanHåkan Hall, CEOHåkan Hall, CEO
Hubin ABHubin ABStig Larsson, ChairmanStig Larsson, ChairmanHåkan Hall, CEOHåkan Hall, CEO
Project staff Data domain responsibles
Management groupManagement groupHåkan Hall, Assoc. Prof. Håkan Hall, Assoc. Prof.
(project manager)(project manager)Stig Larsson, T.D. hcStig Larsson, T.D. hcGöran Sedvall, Prof.Göran Sedvall, Prof.Stefan Arnborg, Prof.Stefan Arnborg, Prof.Tom McNeil, Prof.Tom McNeil, Prof.Lars Therenius Prof.Lars Therenius Prof.
Scientific advisory boardScientific advisory boardGöran Sedvall, ChairmanGöran Sedvall, ChairmanNancy Andreasen, Univ of IowaNancy Andreasen, Univ of IowaPaul Greengard, Rockefeller UnivPaul Greengard, Rockefeller UnivTomas Hökfelt, Karolinska Inst.Tomas Hökfelt, Karolinska Inst.
Scientific advisory boardScientific advisory boardGöran Sedvall, ChairmanGöran Sedvall, ChairmanNancy Andreasen, Univ of IowaNancy Andreasen, Univ of IowaPaul Greengard, Rockefeller UnivPaul Greengard, Rockefeller UnivTomas Hökfelt, Karolinska Inst.Tomas Hökfelt, Karolinska Inst.
Preliminary analysis
Test case:144 subjects: 61 affected, 83 controlsVariables:•Diagnosis•Demography•Blood tests•Genetics•Anatomy (MRI)

In vivo imaging
Magnetic resonance images (MRI)
Functional magnetic resonance images (fMRI)
Positron emission tomography (PET)
Single photon emission tomography (SPECT)
MRI
PET
In vitro imaging (whole hemispheres)
Autoradiography
In situ hybridization
ISHH
LAR
Types of images used in HUBIN

T1 T2
T1
T2
CSFwhite
gray

Brain boxes
Picture fromBRAINS II manual,Magnotta et al,University of Iowa

Manually drawn vermis regions
ROIs drawn by GakuOkugawa

Single Nucleotide Polymorphism
A U G U U C C A U U A U U G U
A U G U U U C A U U A U U A U
RNA:
Protein A Phe
Phe
His
His
Tyr
Tyr
Cys
Phe
non-coding SNP
coding SNP
TyrProtein A’
Protein A can be slightly different from A´
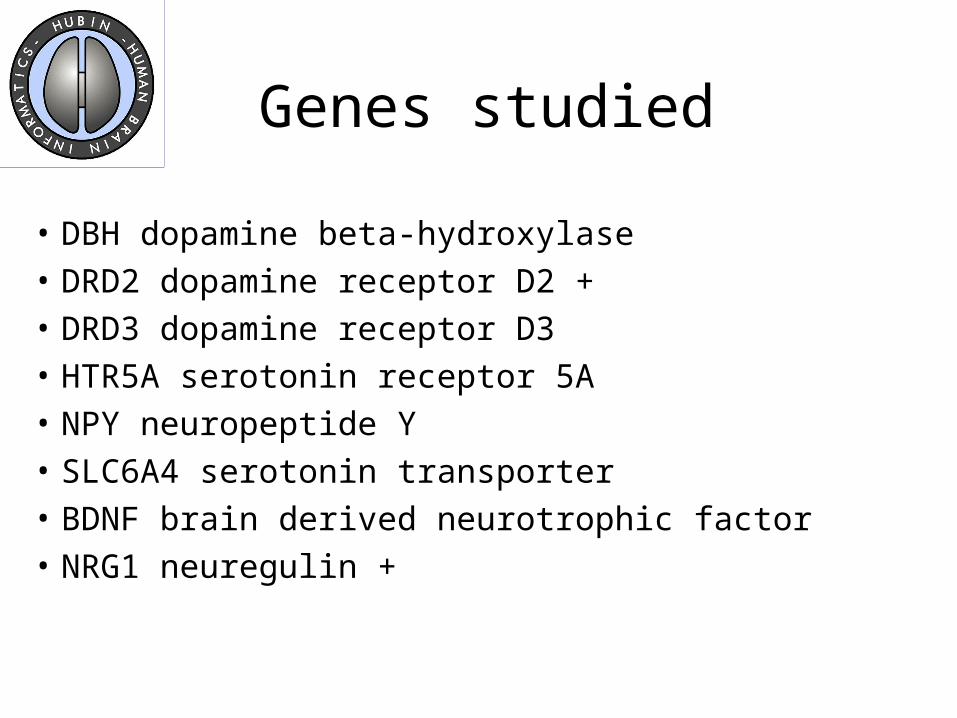
Genes studied
• DBH dopamine beta-hydroxylase• DRD2 dopamine receptor D2 +• DRD3 dopamine receptor D3• HTR5A serotonin receptor 5A• NPY neuropeptide Y• SLC6A4 serotonin transporter• BDNF brain derived neurotrophic factor• NRG1 neuregulin +

Intracranial volume (ml)
Cumulative distribution
+ = schizo = controls
Elementary Visualizations MRI Intracranial volume

Elementary VisualizationsMRI data
Total CSF volumes (ml)
Cumulative distribution
+ = schizo = controls
p < 0.0002

0 1 2 3 4 5 6 7 8 9 100
0.1
0.2
0.3
0.4
0.5
0.6
0.7
0.8
0.9
1
Gamma GTGamma GT
Cumulative distribution
+ = schizo = controls
p < 0.01
Blood dataGamma GT- alcohol marker
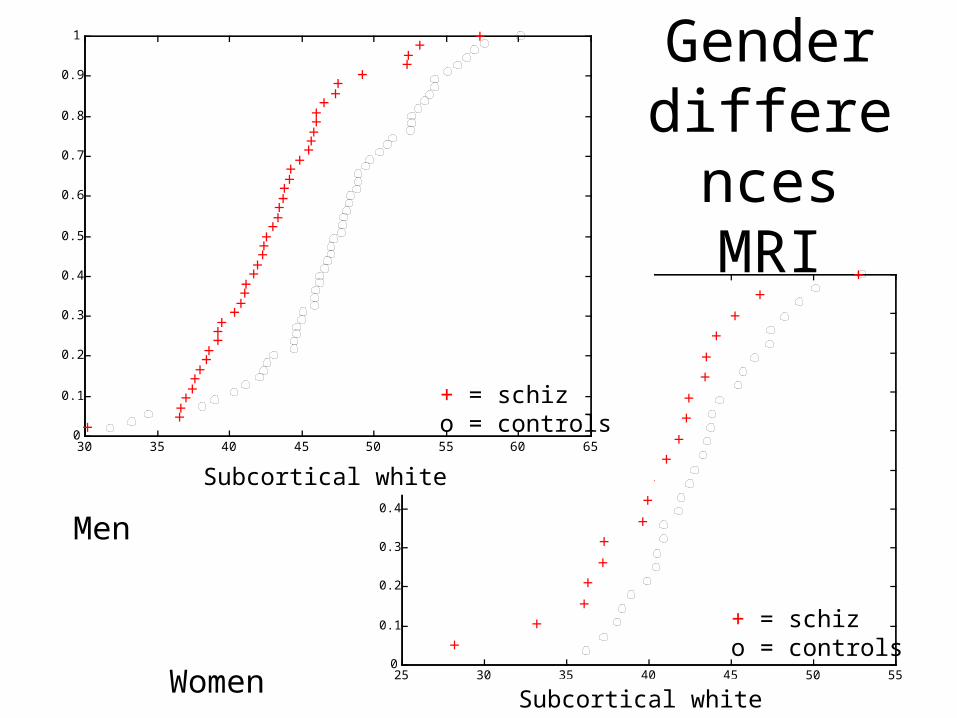
Men
Women25 30 35 40 45 50 55
0
0.1
0.2
0.3
0.4
0.5
0.6
0.7
0.8
0.9
1
Sub White-women
30 35 40 45 50 55 60 650
0.1
0.2
0.3
0.4
0.5
0.6
0.7
0.8
0.9
1
Sub White-men
Subcortical white
+ = schizo = controls
Subcortical white
+ = schizo = controls
Gender differences
MRI
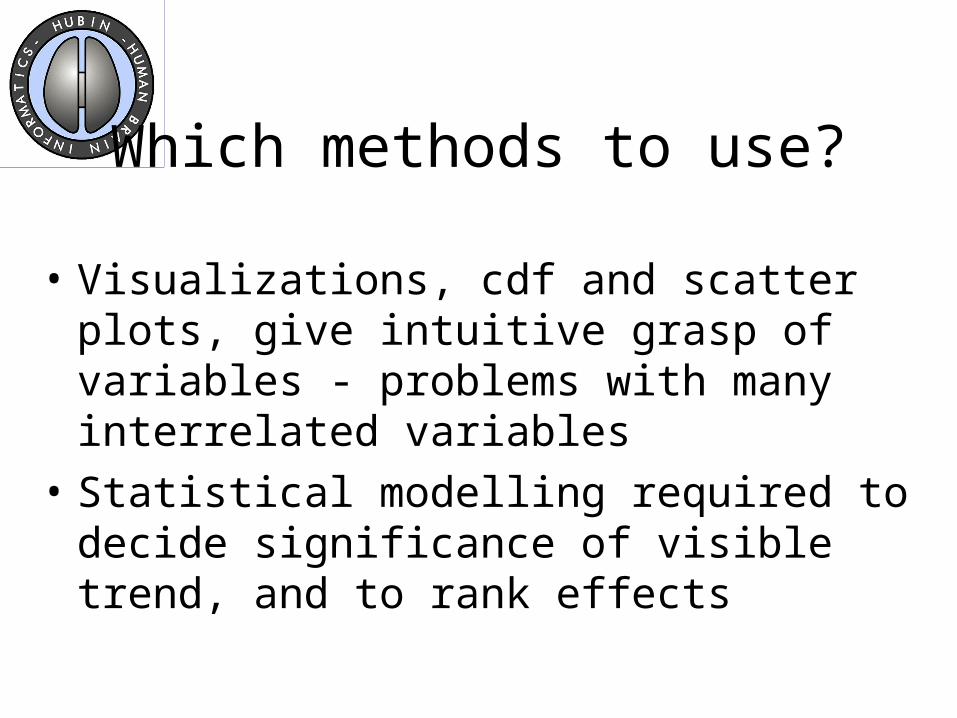
Which methods to use?
• Visualizations, cdf and scatter plots, give intuitive grasp of variables - problems with many interrelated variables
• Statistical modelling required to decide significance of visible trend, and to rank effects
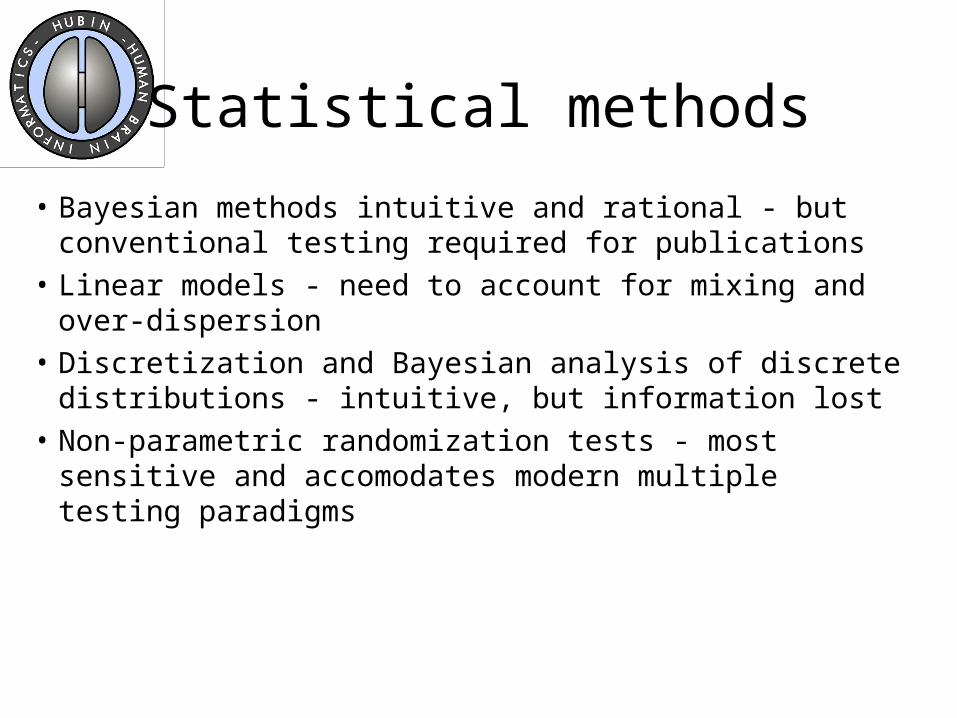
Statistical methods
• Bayesian methods intuitive and rational - but conventional testing required for publications
• Linear models - need to account for mixing and over-dispersion
• Discretization and Bayesian analysis of discrete distributions - intuitive, but information lost
• Non-parametric randomization tests - most sensitive and accomodates modern multiple testing paradigms

Bayes’ factor
• Choice between two hypotheses, H1 and H2,given experimental/observational data D
P(H1|D) P(D|H1) P(H1)P(H2|D) P(D|H2) P(H2)
Posterior odds Bayes factor prior odds
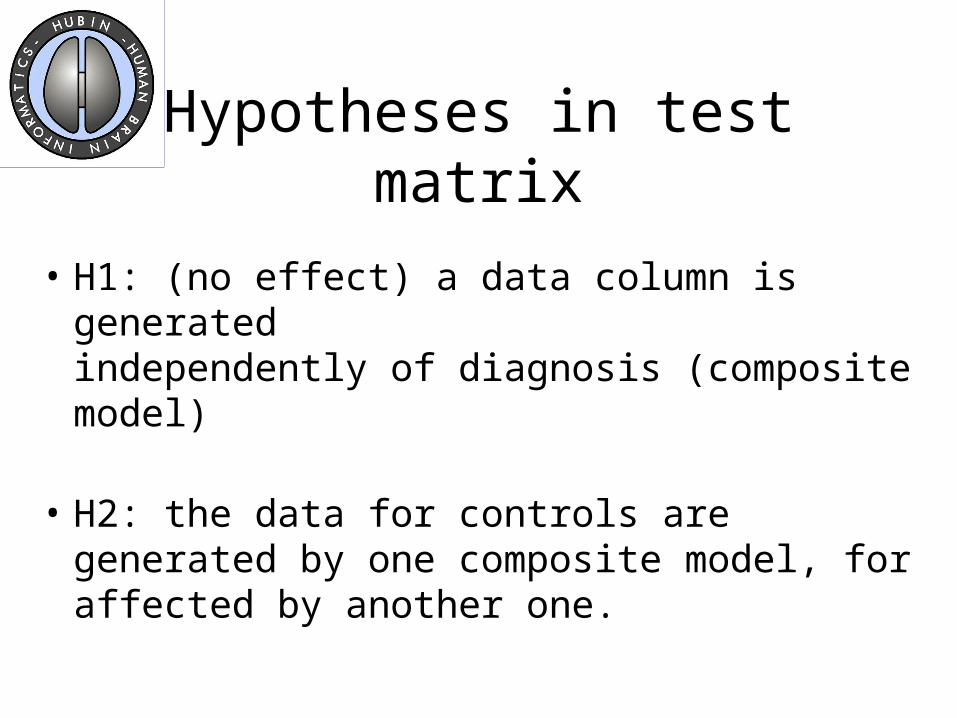
Hypotheses in test matrix
• H1: (no effect) a data column is generatedindependently of diagnosis (composite model)
• H2: the data for controls are generated by one composite model, for affected by another one.

-2.5 -2 -1.5 -1 -0.5 0 0.5 1 1.5 2-2
-1.5
-1
-0.5
0
0.5
1
1.5
2
2.5
3
x
Non-parametric Bayesian methods-Do the three point sets have the sameunderlying distribution, or not?Which is the alternative hypothesis?

Graphical models
Y
Z
X
Y
Z
X
Y
Z
Xf(x,y,z)=f(x)f(y)f(z)
f(x,y,z)=f(x,z)f(x,y)/f(x)
f(x,y,z)

V-structures,causality
X
Y
A
B
C
A
B
C
X
YA CA C | B
A CA C | B
V-structures detectablefrom observational data
Indistinguishable
A
B
C
f(x,y)=f(y|x)f(x) =f(x|y)f(y)

Pairs associated to Diagnosis
Y
Z
D
Y
Z
D
Y
Z
D
Y
Z
D
Y and Z co-vary differentlyfor Affected and Controls

Age-dependency of Posterior Superior Vermis
Age at MRI
Post sup vermis
+ = schizo = controls
70 80 90 100 110 120 1300.08
0.1
0.12
0.14
0.16
0.18
0.2
0.22
0.24
ParWhite
0
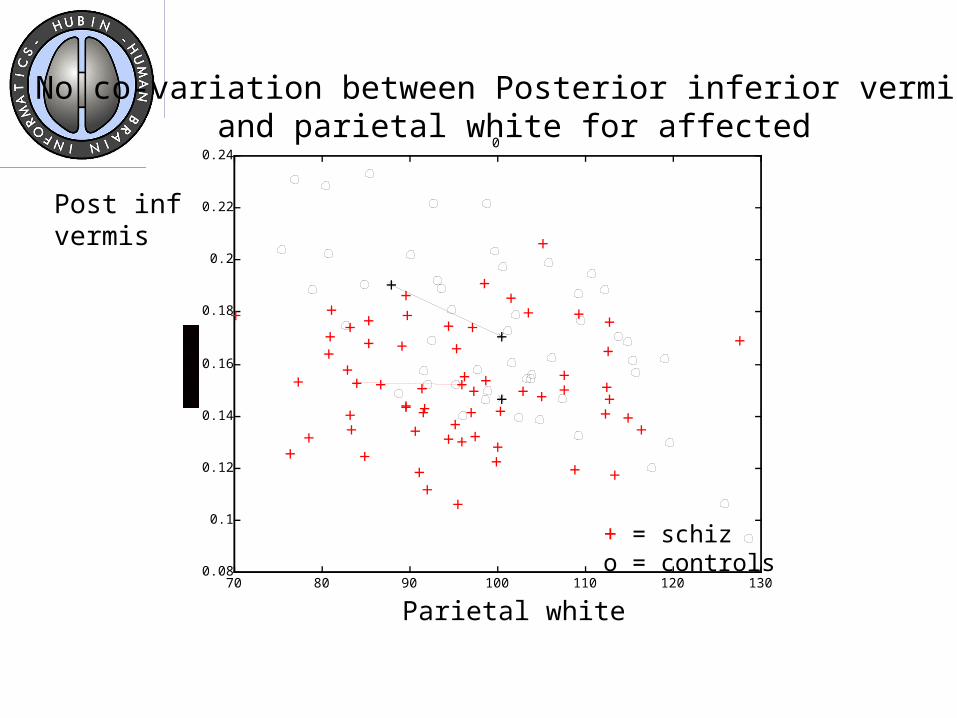
No co-variation between Posterior inferior vermis and parietal white for affected
Parietal white
Post inf vermis
+ = schizo = controls

MRI volumes, blood, demography
Dia
BrsCSF TemCSF
SubCSF TotCSF
Multivariate characterization by graphical models

Adding Vermis variables
Dia
BrsCSF TemCSF
PSV

PSV has best explanatory power
affected - healthy
0.05 0.1 0.15 0.2 0.25 0.30
0.1
0.2
0.3
0.4
0.5
0.6
0.7
0.8
0.9
1
PS VermisPosterior superior vermis
+ = schizo = controls

Decision tree for DiagnosisMRI Data
A = schizC = controls() = misscls
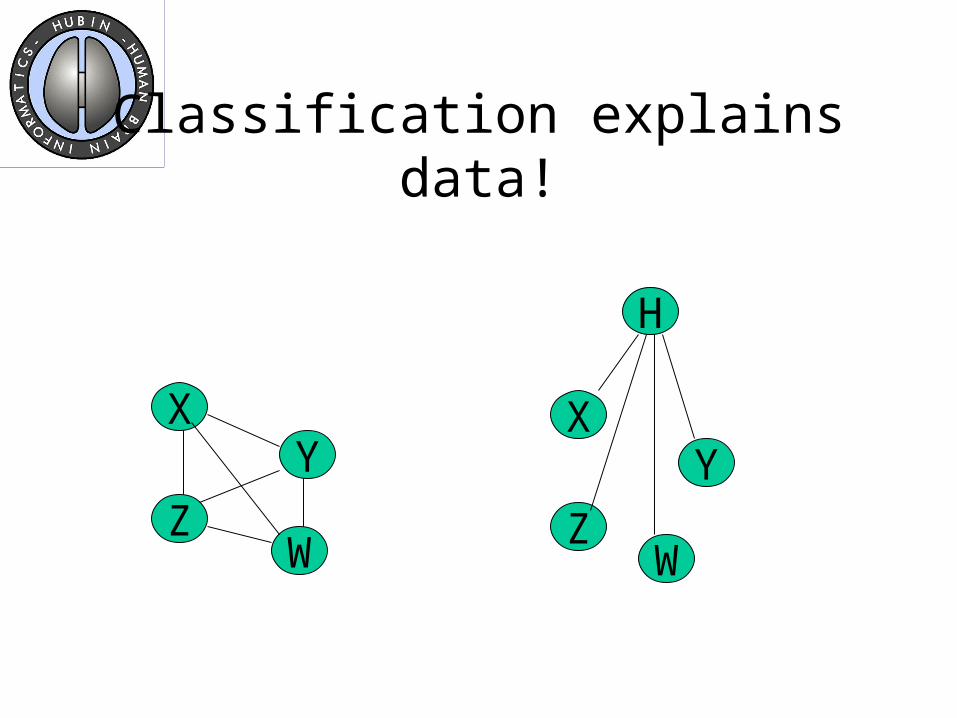
Classification explains data!
XY
Z
XY
Z
H
W W

Autoclass1
Total gray
A= schizC= controls
Weak signals in genetics data
• Numerous investigations have indicated ‘almost significant’ signals of SNP:s to diagnosis
• Typically, these findings cannot be confirmed in other studies - populations genetically heterogeneous and measurements nonstandardized.
• We try to connect SNP:s both to diagnosis and to other phenotypical variables
• Multiple testing and weak signal problems.
40 60 80 100 120 140 1600
0.1
0.2
0.3
0.4
0.5
0.6
0.7
0.8
0.9
1
FrCSF
0.0035:5 37 80
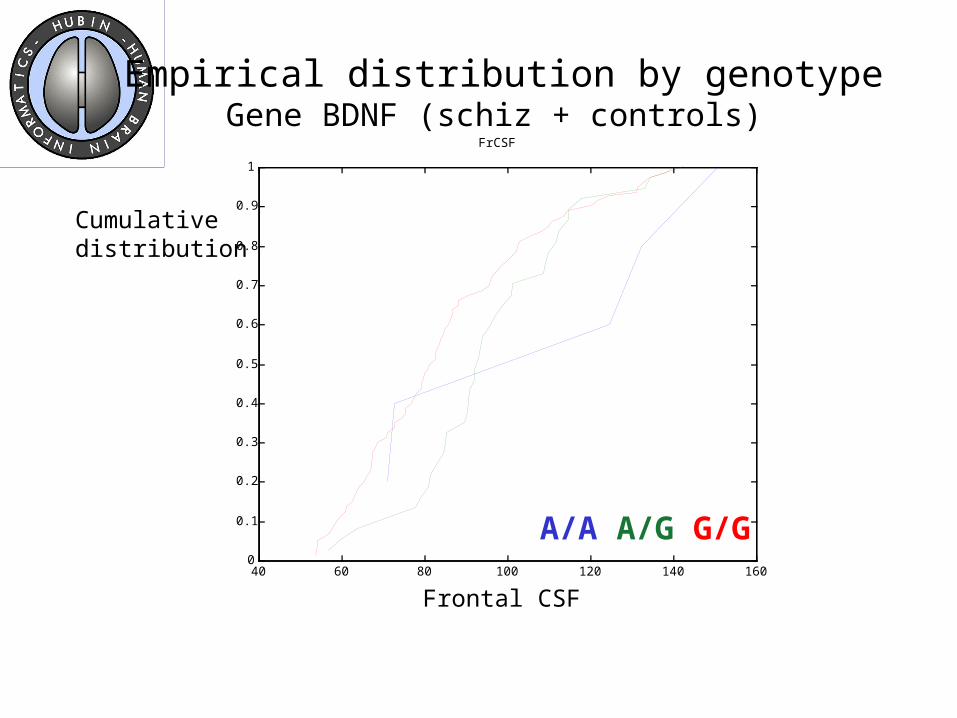
Empirical distribution by genotypeGene BDNF (schiz + controls)
Frontal CSF
A/A A/G G/G
Cumulativedistribution

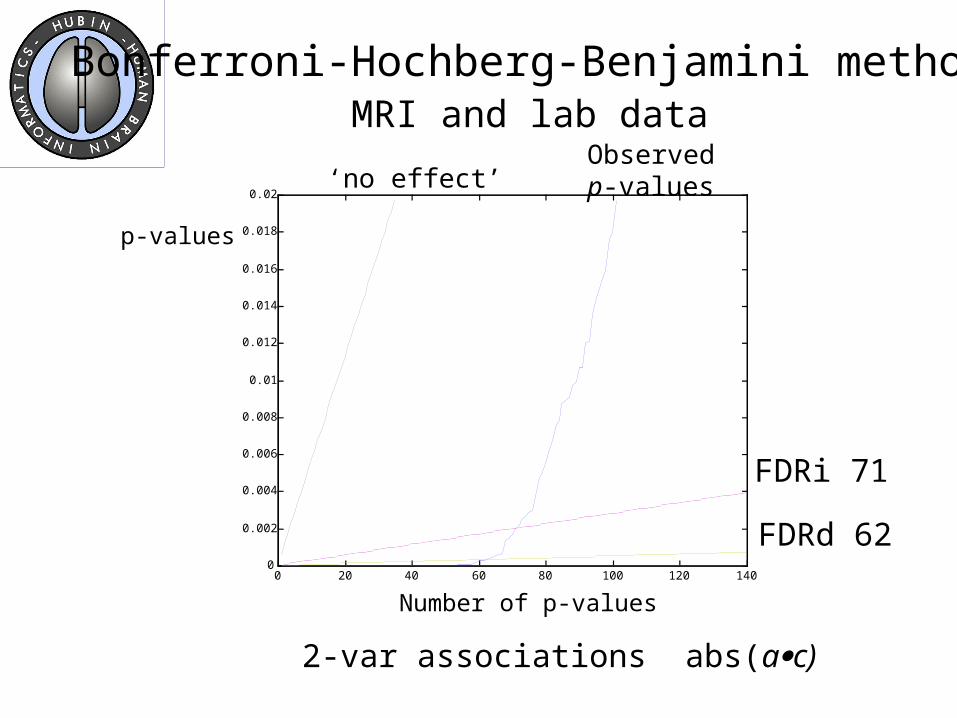
Compensating multiple comparisons
• Bonferroni 1937: For level and n tests, use level /n
• Hochberg 1988: step-up procedure• Benjamini,Hochberg 1996: False Discovery
Rate• J. Storey, 2002: pFDRi, pFDRd• Bayesian interpretations being developed
(Wasserman & Genovese, 2002)
0 20 40 60 80 100 120 1400
0.002
0.004
0.006
0.008
0.01
0.012
0.014
0.016
0.018
0.02
2-var associations abs(ac)
‘no effect’Observedp-values
FDRi 71
FDRd 62
Bonferroni-Hochberg-Benjamini methodsMRI and lab data
Number of p-values
p-values

0 0.001 0.002 0.003 0.004 0.005 0.006 0.007 0.008 0.009 0.010
0.005
0.01
0.015
0.02
0.025

0 0.5 10
0.2
0.4
0.6
0.8
1
0 0.5 10
0.2
0.4
0.6
0.8
1
0 0.5 10
0.2
0.4
0.6
0.8
1NRG1:CV2870393

Significance model-dependent!
Linear additive effect on variable - heterozygote midway between homozygotes
Frontal CSF BDNF 0.001Serum T4 BDNF 0.001Subcortical Gray BDNF 0.001Frontal Gray BDNF 0.002LPK 01 NPY 0.002Corpuscular volume BDNF 0.003….

SNP genotypes not all equal
Subcortical white HTR5A 0.008Temporal white HTR5A 0.01 Diagnosis DRD2 0.01
NRG1 0.005

That’s all, folks!
• High-quality databases for medical research of the HUBIN type open up for intelligent data analysis methods used in engineering and business
• Already with the limited data presently available, interesting clues emerge
• Long term effort - stable economy and engagement is vital.