Embed Size (px)
Citation preview
ANNUAL REPORT 2011
foto: Kjetil Alsvik/ConocoPhillips
ANNUAL REPORT 2011
foto: Kjetil Alsvik/ConocoPhillips

1
ANNUAL REPORT 2011
MASTER MARINE GROUP
CONTENTS:
Report of the Board of Directors 2
Consolidated Financial Statements of Master Marine Group 2011 7
Financial statements of Master Marine AS 2011 35
Auditors report 60

2
REPORT OF THE BOARD OF DIRECTORS
MASTER MARINE AS
Master Marine Group
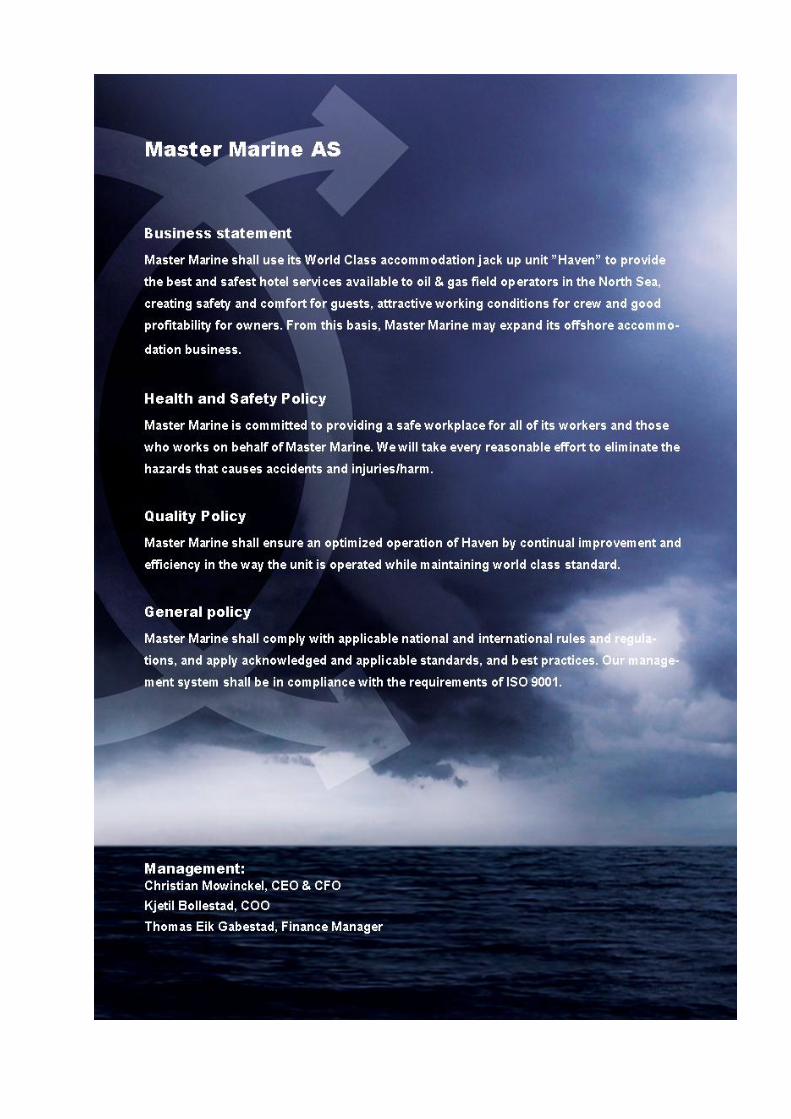
Master Marine AS, established in 1997 and parent company in Master Marine Group, has its main
office at Drammensveien 288 in Oslo, Norway. The parent has two 100% owned subsidiaries;
Jacktel AS, owner of the “Haven” jack up accommodation unit and Service Jack AS (currently
inactive).
The Group is now focusing entirely on the offshore accommodation market for the oil and gas
industry and has discontinued its marine transport and offshore installations and decommissioning
business.
Operations
“Haven” 2011 was a year of transition for Master Marine. The Group owns one state of the art jack-up
accommodation unit with 445 cabins operating at the Ekofisk field in the North Sea under a 3 year
(plus 2x1 year options) charter hire for ConocoPhillips. The first option must be exercised in
January 2013. The total contract value is in excess of 220 MEUR (375 MEUR including options).
The unit, named “Haven”, was mostly built at the Graha Yard in Batam, Indonesia and was
transferred to the Nymo Yard in Eydehavn, Norway during the summer of 2010 for completion.
Final outfitting and commissioning progress was severely hampered by an extensive volume of
rework, resulting in substantial delay and cost increase. The original scope of work in Eydehavn
was scheduled to finish by December 2010. However, throughout the first half of 2011, the Group
invested substantial resources on completing the “Haven” in strict compliance with all class and
safety requirements for operation on the Norwegian continental shelf and securing the required
funding to finance this activity.
“Haven” commenced operation at Ekofisk in late July 2011, about one year later than originally
scheduled. The Group contracted OSM Offshore AS to perform the technical management of
“Haven” under the ConocoPhillips contract.
Following the tow out and installation of “Haven” on the Ekofisk field in July, activities both
onshore and offshore were focused on bringing the unit up to full capacity as quickly as prudently
possible. Accommodation services were available to ConocoPhillips and Ekofisk partners from mid
August and were stepped up to full capacity a few weeks later. “Haven” is in compliance with all
operational and safety conditions required by the Norwegian Petroleum Safety Authority
(Petroleumstilsynet) as well as the Norsok N-001 structural design requirements, including the
10.000 year weather conditions. Some carry over work, which has been transferred to OSM
Offshore, is ongoing.
3
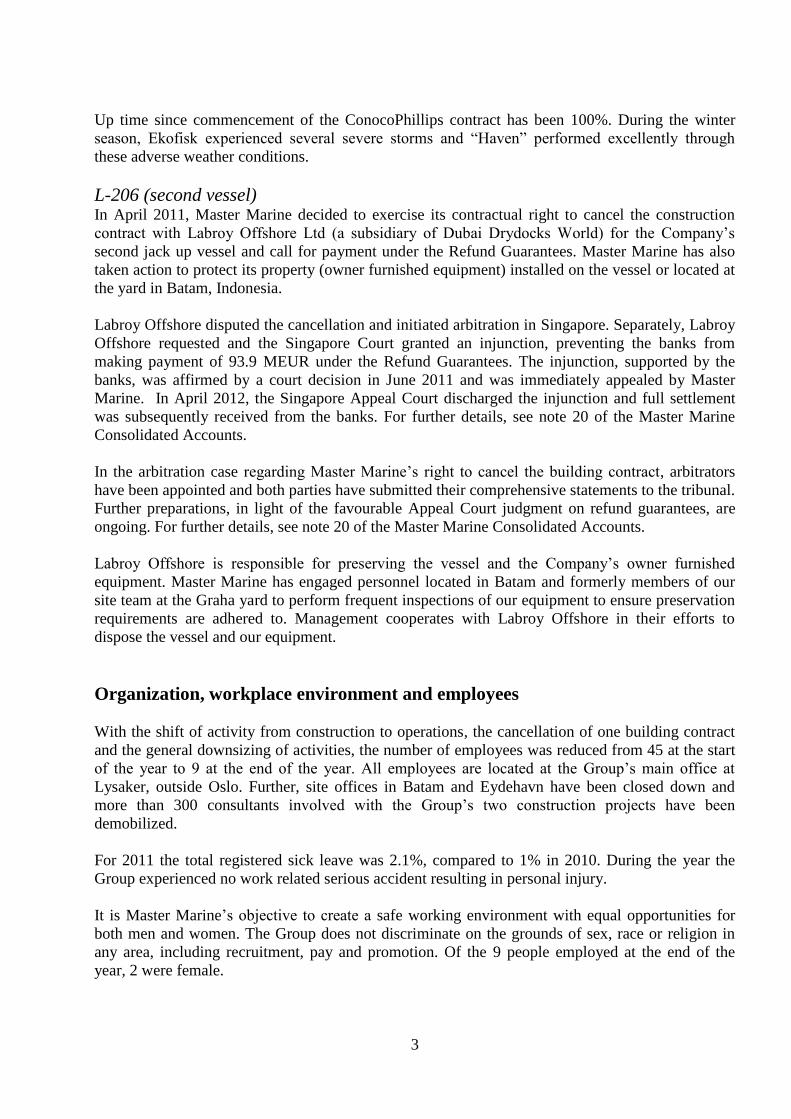
Up time since commencement of the ConocoPhillips contract has been 100%. During the winter
season, Ekofisk experienced several severe storms and “Haven” performed excellently through
these adverse weather conditions.
L-206 (second vessel) In April 2011, Master Marine decided to exercise its contractual right to cancel the construction
contract with Labroy Offshore Ltd (a subsidiary of Dubai Drydocks World) for the Company’s
second jack up vessel and call for payment under the Refund Guarantees. Master Marine has also
taken action to protect its property (owner furnished equipment) installed on the vessel or located at
the yard in Batam, Indonesia.
Labroy Offshore disputed the cancellation and initiated arbitration in Singapore. Separately, Labroy
Offshore requested and the Singapore Court granted an injunction, preventing the banks from
making payment of 93.9 MEUR under the Refund Guarantees. The injunction, supported by the
banks, was affirmed by a court decision in June 2011 and was immediately appealed by Master
Marine. In April 2012, the Singapore Appeal Court discharged the injunction and full settlement
was subsequently received from the banks. For further details, see note 20 of the Master Marine
Consolidated Accounts.
In the arbitration case regarding Master Marine’s right to cancel the building contract, arbitrators
have been appointed and both parties have submitted their comprehensive statements to the tribunal.
Further preparations, in light of the favourable Appeal Court judgment on refund guarantees, are
ongoing. For further details, see note 20 of the Master Marine Consolidated Accounts.
Labroy Offshore is responsible for preserving the vessel and the Company’s owner furnished
equipment. Master Marine has engaged personnel located in Batam and formerly members of our
site team at the Graha yard to perform frequent inspections of our equipment to ensure preservation
requirements are adhered to. Management cooperates with Labroy Offshore in their efforts to
dispose the vessel and our equipment.
Organization, workplace environment and employees
With the shift of activity from construction to operations, the cancellation of one building contract
and the general downsizing of activities, the number of employees was reduced from 45 at the start
of the year to 9 at the end of the year. All employees are located at the Group’s main office at
Lysaker, outside Oslo. Further, site offices in Batam and Eydehavn have been closed down and
more than 300 consultants involved with the Group’s two construction projects have been
demobilized.
For 2011 the total registered sick leave was 2.1%, compared to 1% in 2010. During the year the
Group experienced no work related serious accident resulting in personal injury.
It is Master Marine’s objective to create a safe working environment with equal opportunities for
both men and women. The Group does not discriminate on the grounds of sex, race or religion in
any area, including recruitment, pay and promotion. Of the 9 people employed at the end of the
year, 2 were female.

4
As a consequence of the organizational changes implemented in 2011, Master Marine is in the
process of changing its Integrated Management System (IMS) to reflect the new business model and
the new organizational structure. The revised management system will be compliant with and
operated according to ISO 9001-2008.
Environmental Reporting
The Group is working to ensure that all sides of its operation are conducted in an environmentally
friendly way. During the construction of the vessels the Group was actively monitoring the
construction to ensure that all aspects of health, safety and environment industry standards were
followed.
With “Haven” on charter hire, the Group’s focus is now on the operation of the unit which has to
comply with the highest safety and environmental standards required by the Norwegian Petroleum
Safety Authority. A high safety and environmental standard is ensured through close cooperation
with and monitoring of the technical management company, OSM Offshore.
Financial development and results
Finance During the first half of 2011, Master Marine raised an additional 111 MEUR in subordinated loans
from the main shareholder, enabling the Company to complete the construction of “Haven”. In
addition, the main shareholder refinanced the convertible bond loan of 67.3 MEUR in June 2011.
Interest on shareholder loans are capitalized quarterly and is payable at maturity.
The Company also borrowed the remaining 5 MEUR available under the 155 MEUR Bank loan
during the year. However, as a result of the substantial delay and the higher cost to complete
“Haven”, the Company’s cash flow during the second half of 2011 was insufficient to meet debt
repayment obligations originally agreed with the banks. Accordingly, the Company requested and
lenders granted temporary waivers to certain loan conditions and management invited lenders to
discuss permanent changes thereto in order to match the loan repayment profile to the Company’s
operating cash flow. Temporary waivers were still effective at year end resulting in a
reclassification of the long term bank loan to a short term liability.
Subsequent to year end, management and lenders have agreed new terms of the bank loan,
including changes to the repayment profile, to ensure a satisfactory cash flow position for the Group
in the foreseeable future. For further details, see note 20 of the Master Marine Consolidated
Accounts.
Financial results The financial statements are prepared in accordance with International Financial Reporting
Standards (IFRS) and interpretations adopted by the International Accounting Standards Board
(IASB) and IFRIC as approved by the European Union, and the additional relevant requirements
under the Norwegian Accounting Act.

5
On a consolidated basis, the operating income for 2011 was 42.8 MEUR (8.7 MEUR in 2010). All
operating income was generated from the ConocoPhillips charter hire contract. The operating
expenses were 84.5 MEUR (90.4 MEUR including 65 MEUR impairments in 2010), resulting in an
operating loss of 41.7 MEUR (81.7 MEUR in 2010). The high level of operating expenses in 2011
includes several large non recurring items. These items include construction cost incurred in 2011
on the second jack up vessel, all mobilization cost including cost incurred from offshore carry over
work on “Haven” and accruals related to several ongoing disputes were expensed. In addition, full
depreciation of the “Haven” book value started in August. Management has performed impairment
tests on both assets and the Board of Directors concluded, in light of the strong market outlook and
impairments charged to the accounts in 2010, that no further impairments are required. For further
details, see note 12 of the Master Marine Consolidated Accounts.
Net financial items for 2011 were a loss of 36.1 MEUR versus a loss of 10.5 MEUR in 2010. The
main reason for this net financial result is the substantial increase in accrued (non cash) interest cost
resulting from increased shareholder loans.
This resulted in a net loss for 2011 of 77.7 MEUR compared to a net loss for 2010 of 92.3 MEUR.
The Board of Directors proposes to charge the net loss to the share premium reserve.
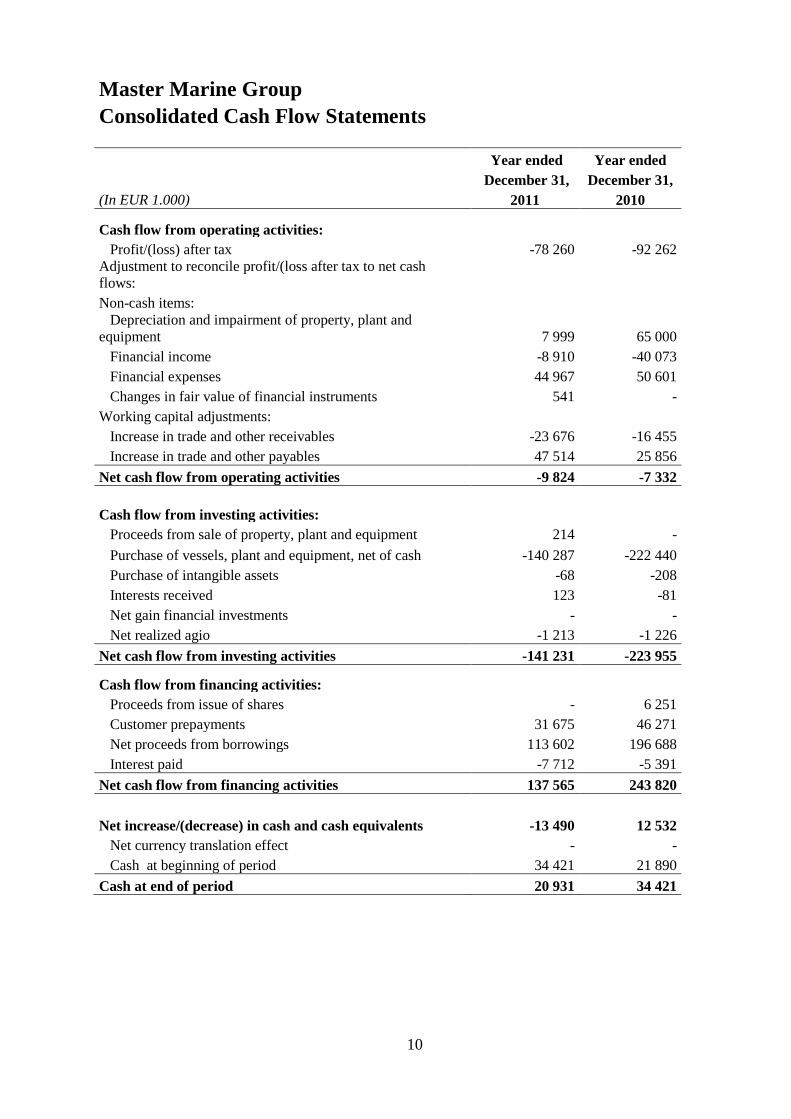
Cash flow and liquidity Operational cash flow in 2011 was -9.6 MEUR (-7.3 MEUR in 2010). Cash flow from investments
was -141.4 MEUR (-224.0 MEUR in 2010) and cash flow from financing was 137.6 MEUR (243.8
MEUR in 2010). This resulted in a net decrease in cash and cash equivalents in 2011 of -13.5
MEUR versus a net increase of 12.5 MEUR in 2010. As of the year end 2011 the Group had cash
reserves of 20.9 MEUR compared to 34.4 MEUR at the end of 2010.
The negative cash flow from operations in 2011 resulted from full operational cost for the whole
year while revenue was only generated from August. Further, cash flow from operations was
negatively affected by two months charter hire in arrears and only partial payment of mobilization
fee from ConocoPhillips as well as significant start up cost including mobilization expenses and
costs related to offshore carry over work.
Operational cash flow (excluding the non recurrent items) is satisfactory and in line with
projections.
Based on the settlement related to refund guarantees and the restructuring of loan repayments under
the bank loan as well as the long term nature of operational cash flow from the current charter hire
contract, the Board of Directors considers the Group’s liquidity position to be adequate and
confirms that the assumption of continued operations forms the basis for the annual accounts in
accordance with the requirements of the Accounting Act.
Financial Exposure The Group is exposed to financial market risks including the possibility that fluctuations in currency
exchange rates and interest rates may affect the value of the Group’s assets, liabilities and future
cash flows. The Group frequently reviews and assesses its primary financial market risks to reduce
and control these risks. See more information in note 10 of the Master Marine Group Consolidated
Accounts.
The Group has some disputes and potential disputes with third parties that are reflected in the
Group’s accounts based on management’s best estimates. The financial outcome of these disputes

6
or potential disputes is uncertain. These items are further described in note 19 of the Master Marine
Group Consolidated Accounts.
Master Marine AS results The parent company Master Marine AS had 2.8 MEUR in revenue in 2011, operating cost of 20.3
MEUR and net financial cost of -77.8 MEUR, due to impairment of shares in subsidiary Jacktel AS.
As a result the parent company had net loss of -95.3 MEUR for the year 2011. The free equity at 31
December 2011 was 0 MEUR. Further details are shown in the Master Marine AS Accounts and
associated Notes included in this Annual Report.
Future Prospects
Future prospects for the Group depend on developments in the offshore accommodation market in
the oil and gas industry. This market has shown strong improvement over the last year with day
rates on recent contracts well above day rates generated from the Company’s current charter hire
contract. The Group sees a strong accommodation market for the foreseeable future with few new
units designed for harsh environment under construction.
Oslo, 23rd
May 2012

7
CONSOLIDATED FINANCIAL STATEMENTS 2011
Master Marine Group Consolidated Profit and Loss statement
1 January - 31 December
(In EUR 1.000) 2 011 2 010
Revenue 3 42 835 8 705
TOTAL OPERATING REVENUE
42 835 8 705
OPERATING EXPENSES
Salary and personnel costs 5 -5 217 -5 123
Vessel operation cost 4 -18 814 -9 722
Other operating expenses 4 -52 467 -10 479
Impairments 12 0 -65 000
Depreciation 12 -7 999 -115
TOTAL OPERATING EXPENSES -84 496 -90 438
OPERATING PROFIT / (LOSS) -41 661 -81 733
FINANCIAL INCOME AND EXPENSES
Financial income 7 8 910 40 073
Financial expenses 7 -44 967 -50 601
NET FINANCIAL ITEMS -36 058 -10 528
PROFIT/(LOSS) BEFORE TAX -77 719 -92 262
Income tax expense (benefit) 11 0 0
NET PROFIT (LOSS) -77 719 -92 262
Consolidated Statement of Comprehensive Income
(In EUR 1.000)
Net profit this period
-77 719 -92 262
Fair value adjustment hedging reserve
-541
COMPREHENSIVE INCOME -78 260 -92 262
Allocation of comprehensive income
Share premium reserve -78 260 -92 262
Retained earnings
Earnings per share:
- Basic 16 -0,04 -0,04
- Diluted 16 -0,04 -0,04

8
Master Marine Group
Consolidated Statement of Financial Position
(In EUR 1.000) 31.12.2011 31.12.2010
ASSETS
Non-current assets:
Vessels, plant and equipment 12 605 328 473 149
Intangible assets 12 392 428
Total non-current assets 605 720 473 577
Current assets:
Other current assets 14 43 233 19 557
Cash 15 20 931 34 421
Total current assets 64 164 53 978
TOTAL ASSETS 669 884 527 556
EQUITY AND LIABILITIES
Paid in capital:
Issued capital 17 25 754 25 754
Share premium 17 78 164 156 424
Other paid in capital 17 2 866 2 866
Total paid in capital 106 784 185 044
Total equity 106 784 185 044
Non-current liabilities:
Deferred tax 0 0
Other long term liabilities 9 312 706 161 688
Total long-term liabilities 312 706 161 688
Current liabilities:
Accounts payable 18 7 159 24 869
Prepayments customer 18 52 874 46 271
Short term interest bearing debt 9 152 830 35 000
Other current liabilities 18 37 531 74 683
Total current liabilities 250 394 180 824
Total liabilities 563 100 342 511
TOTAL EQUITY AND LIABILITIES 669 884 527 556

9
Master Marine Group Consolidated Statement of Changes in Equity
(In EUR 1.000)
Share
Capital
Share
premium
Other
paid in
capital
Retained
earnings
Total
equity
Equity as at January 1, 2010 25 754 245 320 59 - 271 135
Issue of convertible loan 3 365 2 807
6 172
Net income (loss) -92 262
-92 262
Equity as at December 2010 25 754 156 424 2 866 - 185 044
Net income (loss)
-77 719
-77 719
Fair value adjustment hedging
reserve
-541
-541
Equity as at December 2011 25 754 78 164 2 866
106 784
10
Master Marine Group
Consolidated Cash Flow Statements
Year ended Year ended
December 31, December 31,
(In EUR 1.000) 2011 2010
Cash flow from operating activities:
Profit/(loss) after tax -78 260 -92 262
Adjustment to reconcile profit/(loss after tax to net cash
flows:
Non-cash items:
Depreciation and impairment of property, plant and
equipment 7 999 65 000
Financial income -8 910 -40 073
Financial expenses 44 967 50 601
Changes in fair value of financial instruments 541 -
Working capital adjustments:
Increase in trade and other receivables -23 676 -16 455
Increase in trade and other payables 47 514 25 856
Net cash flow from operating activities -9 824 -7 332
Cash flow from investing activities:
Proceeds from sale of property, plant and equipment 214 -
Purchase of vessels, plant and equipment, net of cash -140 287 -222 440
Purchase of intangible assets -68 -208
Interests received 123 -81
Net gain financial investments - -
Net realized agio -1 213 -1 226
Net cash flow from investing activities -141 231 -223 955
Cash flow from financing activities:
Proceeds from issue of shares - 6 251
Customer prepayments 31 675 46 271
Net proceeds from borrowings 113 602 196 688
Interest paid -7 712 -5 391
Net cash flow from financing activities 137 565 243 820
Net increase/(decrease) in cash and cash equivalents -13 490 12 532
Net currency translation effect - -
Cash at beginning of period 34 421 21 890
Cash at end of period 20 931 34 421
11
Notes
1. General information
Master Marine AS, the parent company of the Master Marine Group (“Master Marine” or “the
Group”) is a private limited company, incorporated in Norway. The company’s headquarter is
located at Drammensveien 288, 0283 Oslo, Norway. Master Marine is an offshore service company,
specialising in offshore accommodation.
The consolidated financial statements of Master Marine incorporate the financial statements of
Master Marine AS and its subsidiaries.
2. Summary of significant accounting policies
2.1 Statement of compliance
The financial statements of Master Marine have been prepared in accordance with International
Financial Reporting Standards (IFRS) and interpretations adopted by the International Accounting
Standards Board (IASB) and IFRIC as approved by the European Union (“EU”), as well as the
additional relevant requirements under the Norwegian Accounting Act.
2.2 Basis of preparation
The financial statements have been prepared under the historical cost convention, modified by
financial assets and financial liabilities (including derivative instruments) at fair value through
profit or loss.
The statement of comprehensive income is presented by nature of costs (IAS 1). The principal
accounting policies are set out below.
2.3 Functional currency and presentation currency
Master Marine applies Euro as reporting currency for its financial statements, which is also the
functional currency of the Group.
2.4 Adoption of new and revised standards and interpretations
The following standards, amendments and interpretations effective January 1 2011 are relevant to
the Group, but have no material impact on the financial information:
IAS 24, (Revised), IAS 32 (Amendment), IFRIC 14 (amendment), IFRIC 19, IFRS 3
(Amendment), IFRS 3 (Amendment), IFRS 7 (amendment), IAS 1 (Amendment), IAS 27
(revised), IFRIC 13 (amendment), ‘Customer Loyalty Programs’ (effective from January 1, 2011).
(a) Early adoption of standards and interpretations
No standards or interpretations have been early adopted in 2011.
(b) Standards and interpretations in issue not yet adopted
At the date of authorisation of these financial statements the following Interpretations were in issue
but not yet effective:
IFRS 7 (amendment), IFRS 9, IFRS 10, IFRS 11, IFRS 12, IFRS 13, IAS 1 (amendment), IAS 12
(amendment), IAS 19 (amendment), IAS 27 (amendment), IAS 28 (amendment)

12
Management anticipate that the standards and interpretations in issue, but not yet effective, will be
adopted in the financial statements when they become effective, and foresee currently no material
near-term impact by the adoptions on the financial statements of the Group in the period of initial
application. However this will be further assessed upon implementation. The new standards on
leasing and revenue (IAS 17 and IAS 18, not yet approved) could have an impact, but are not
expected to be effective before 2013.
2.5 Significant accounting judgments, estimates and assumptions
The preparation of the financial statements requires management to make judgments, estimates and
assumptions that affect the reported amounts of revenues, expenses, assets and liabilities, and the
disclosure of contingent liabilities, at the reporting date. Management bases its judgments and
estimates on historical experience and on various other factors that are believed to be reasonable
under the circumstances, the results of which form the basis for making judgments about the
carrying values of assets and liabilities that are not readily apparent from other sources. Uncertainty
about these assumptions and estimates could result in outcomes that could require a material
adjustment to the carrying amount of the asset or liability affected in the future. The key sources of
judgement and estimation of uncertainty at the balance sheet date, that have a significant risk for
causing a material adjustment to the carrying amounts of assets and liabilities within the next
financial year are discussed below.
Management assess whether there are any indications of impairment for all non-financial assets at
the reporting date. The vessels are tested for impairment when there are indications that the carrying
values may not be recoverable. When value in use calculations are performed, management
estimates the expected future cash flows from the assets or cash-generating unit and chooses a
suitable discount rate in order to calculate the present value of those cash flows. These are based on
management’s evaluations, including estimates of future performance, revenue generating capacity
of the assets, and assumptions of the future market conditions. Changes in circumstances and in
management’s evaluations and assumptions may give rise to impairment losses.
2.6 Revenue recognition
Revenue is recognised at the time of the transaction when it is probable that the transaction will
generate future economic benefits that will flow to the Group and the amount can be reliably
estimated. Revenues are presented net of value added tax and discounts.
Lease income from operating leases is recognised in income on a straight-line basis over the lease
term, including mobilisation fee received and other receivable for preparation to meet a specific
lease contract, unless another systematic basis is more representative of the time pattern in which
use benefit derived from the leased asset is diminished.
Revenues from the sale of services are recognised in the income statement according to the
project’s level of completion provided the outcome of the transaction can be estimated reliably.
Interest income is recognised in the income statement based on the effective interest rate method as
the income is accrued.
2.7 Foreign currency
The functional currency of the Group is EURO. Transactions in foreign currency are translated at
the exchange rate applicable on the transaction date. Monetary items in other currencies are
translated into EUR using the exchange rate applicable on the balance sheet date. Non-monetary
items that are measured at their historical price expressed in a foreign currency are translated into
EUR using the exchange rate applicable on the transaction date. Non-monetary items that are
13
measured at their fair value expressed in a foreign currency are translated at the exchange rate
applicable on the balance sheet date. Changes to exchange rates are recognised in the income
statement as they occur during the accounting period.
2.8 Segments
Operating segments are reported in a manner consistent with the internal reporting provided to the
chief operating decision maker who is responsible for allocating resources and assessing the
performance of the operating segments. The chief operating decision maker has been identified as
the Board of Directors and the Executive Management. The Group has one operational segment,
which is operation of an accommodation unit. See note 3 for more details.
2.9 Borrowing costs
Borrowing costs are recognised in profit or loss in the period in which they are incurred. Borrowing
costs directly attributable to acquisition, construction or production of qualifying assets, which are
assets that necessarily take a substantial period of time to get ready for their intended use or sale,
are added to the cost of those assets, until such time as the assets are substantially ready for their
intended use or sale. All consecutive interest expense on the financing is added to the carrying value
of the units.
2.10 Income tax
Tax cost consists of tax payable and changes to deferred tax. Deferred tax liability/tax assets are
calculated on differences between the book value and tax value of assets and liabilities.
Deferred tax assets are recognised when there is other convincing evidence proving that the Group
will have a sufficient profit for tax purposes in subsequent periods to utilise the tax asset. The
Group recognises previously unrecognised deferred tax assets to the extent it has become probable
that the Group can utilise the deferred tax asset. Deferred tax and deferred tax assets are measured
on the basis of the expected future tax rates applicable, recognised at their nominal value and
classified as non-current asset investments (long-term liabilities) in the balance sheet. Taxes
payable and deferred taxes are recognised directly in equity to the extent that they relate to equity
transactions.
2.11 Tangible assets (non-financial) and assets under construction
Tangible assets are recognised at cost less accumulated depreciation and impairment losses. When
assets are sold or disposed of, the carrying amount is derecognised and any gain or loss is
recognised in the income statement. The cost of tangible non-current assets is the purchase price,
including taxes/duties and costs directly linked to preparing the asset ready for its intended use.
Tangible assets are reviewed for impairment whenever events or changes in circumstances indicate
that the carrying value may not be recoverable. An impairment loss is recognised by the excess
value of the carrying value of the asset and the recoverable amount, and recognised in the income
statement. The recoverable amount is the higher of the asset’s net selling price and its value in use.
The value in use is determined by reference to the discounted future net cash flows expected to be
generated by the asset. A previously recognised impairment loss is reversed only if there has been a
change in the estimates used to determine the recoverable amount, however limited by the carrying
value if no impairment loss had been recognised in prior years.
Depreciation is calculated using the straight-line method over the following useful life, taking
residual values into consideration. Components with different economic useful life are depreciated
on a straight-line basis, over the components useful life. The depreciation period and method are
assessed each year. A residual value is estimated at each year-end, and changes to the estimated
residual value are recognised as a change in an estimate.

14
Ordinary repairs and maintenance expenses are recognised in the income statement in the financial
period in which they are incurred. Costs related to major inspections/classification will be
recognised in the carrying value of the units if certain recognition criteria are satisfied. The
recognition will be made when the docking has been performed and is depreciated based on
estimated time to the next inspection. Any remaining carrying value of the cost of the previous
inspection will be de-recognised. The remaining costs that do not meet the recognition criteria are
recognised as repairs and maintenance expenses.
The unit under construction are classified as non-current assets and recognised at cost until the
production or development process is completed. The unit under construction are not depreciated
until the asset has been completed and is available for use.
2.12 Leased Operating Equipment/Units
Costs, including depreciation, incurred in earning the lease income are recognised as an expense.
Lease income (excluding receipts for services provided such as insurance and maintenance) is
recognised on a straight-line basis over the lease term even if the receipts are not on such a basis,
unless another systematic basis is more representative of the time pattern in which use benefit
derived from the leased asset is diminished.
Initial direct costs incurred by lessors in negotiating and arranging an operating lease shall be added
to the carrying amount of the leased asset and recognised as an expense over the lease term on the
same basis as the lease income.
Leases are classified as finance leases whenever the terms of the lease transfer substantially all the
risks and rewards of ownership to the lessee. All other leases are classified as operating leases. The
evaluation is based on the substance of the transaction rather than the form of the contract, and the
determination is made when the leasing agreement is entered into. Financial leases are accounted
for as debt financed purchases of assets, and the annual lease payments are allocated as finance
costs and amortization of the lease liability. Capitalised lease assets are depreciated over the shorter
of the estimated useful life of the asset and the lease term if there is no reasonable certainty that the
Group will obtain ownership by the end of the lease term. For operating leases, the lease payments
(i.e. a time charter hire or bareboat hire) are recorded as ordinary operating expenses or income, and
charged to profit and loss on a straight-line basis over the term of the relevant lease. Contingent
rents are recognized as revenue in the period in which they are earned or as expense in the period in
which they are incurred.
2.13 Investments and Other Financial Assets
The Group classifies its financial assets in the following categories: financial assets at fair value
through profit or loss, loans and receivables and available-for-sale financial assets. The
classification depends on the purpose of which the investments were acquired. Management
determines the classification of its financial assets at initial recognition and re-evaluates this
designation at every reporting date. When financial assets are recognised initially, they are
measured at fair value, plus, in the case of investments not at fair value through profit or loss,
directly attributable transaction costs. The purchases and sales of financial assets are recognised on
the trade date.
(a) Financial assets at fair value through profit or loss
This category has two sub-categories: financial assets held for trading, and those designated at fair
value through profit or loss at inception. A financial asset is classified in this category if acquired
principally for the purposes of sale in the short term or if so designated by management. Derivatives

15
are also categorized as held for trading unless they are designated as hedges. Gains or losses on
investments held for trading are recognised in the profit and loss account.
(b) Loans and receivables
Loans and receivables are non-derivative financial assets with fixed or determinable payments that
are not quoted in an active market. Loans and receivables are carried at amortized cost using the
effective interest method, less any allowance for impairment. Gains and losses are recognised in
income when the loans and receivables are de-recognised or impaired, as well as through the
amortization process.
(c) Available-for-sale financial assets
Available-for-sale financial assets are non-derivative financial assets that are either designated in
this category or not classified in any of the other categories. After initial recognition, available-for-
sale financial assets are measured at fair value with gains or losses being recognised as a separate
component of equity until the investment are derecognised, at which time the cumulative gain or
loss previously reported in equity is included in the income statement. The fair value of investments
that are actively traded in organized financial markets is determined by reference to quoted market
bid prices at the close of business on the balance sheet date. For investments where there is no
active market, fair value is determined applying commonly used valuation techniques.
2.14 Hedging
Before a hedging transaction is carried out, the Group’s finance department assesses whether a
derivative is to be used to hedge:
the fair value of a recognized asset or liability or a firm commitment,
a future cash flow from a recognized asset, obligation, identified very probable future
transaction or, in the case of a currency risk, a firm commitment or
a net investment in a foreign operation.
The Group holds interest rate swaps classified as Cash Flow Hedges. The effective part of changes
in the fair value of a hedging instrument is recognized directly in equity. The ineffective part of the
hedging instrument is recognized directly in the statement of comprehensive income. Associated
accumulated gains and losses are reclassified from equity to the statement of comprehensive income
during the same period(s) as the hedged expected transaction affects the profit or loss.
2.15 Impairment of financial assets
At each balance sheet date management assesses whether there are indications that a financial asset
or a group of financial assets where changes in value are not recognized through the income
statement are impaired. Impairment only occur if there are objective indicators of impairment as a
result of one or more events after initial carrying value and the events affect the future cash flows
and this can be estimated reliably. If such impairment is indicated for loan and receivables carried at
amortized cost, the amount of impairment loss is measured as the difference between the asset’s
carrying amount and the present value of estimated future cash flows (excluding future credit losses
that have not been incurred) discounted at the financial asset’s original effective interest rate. The
impairment loss is recognised in profit and loss. If, in a subsequent period, the amount of the
impairment loss decreases and the decrease can be related objectively to an event occurring after the
impairment was recognised, the previously recognised impairment loss is reversed. Any subsequent
reversal of an impairment loss is recognised in the income statement, to the extent that the carrying
value of the asset does not exceed its amortized cost at the reversal date.

16
2.16 Financial liabilities - borrowings
Borrowings are initially recognised at the fair value of the consideration received less directly
attributable transaction costs. After initial recognition, borrowings and the related transaction costs
are subsequently measured at amortized cost using the effective interest method. Gains and losses
are recognised in net profit or loss when the liabilities are de-recognised as well as through the
amortization process. Borrowings containing prepayment options are evaluated to determine if these
options are closely related to the cost instrument or are embedded derivatives. In assessing whether
the option is closely related, the Group consider whether the exercise price is approximately equal
to the amortized cost at each exercise date. Borrowings are considered “current” if they fall due
within 12 months after the balance sheet date. Borrowings falling due later than 12 months after
balance sheet date are considered “long term”.
2.17 De-recognition of financial assets and liabilities
A financial asset is derecognised when:
the rights to receive cash flows from the asset have expired,
the Group retains the right to receive cash flows from the asset, but has assumed an
obligation to pay them in full without material delay to a third party under a ‘pass-through’
arrangement, or
the Group has transferred its rights to receive cash flows from the asset and either (a) has
transferred substantially all the risks and rewards of the asset, or (b) has neither transferred
nor retained substantially all the risks and rewards of the asset, but has transferred control of
the asset.
A financial liability is derecognised when the obligation under the liability is discharged, or
cancelled or expires. Where an existing financial liability is replaced by another from the same
lender on substantially different terms, or the terms of an existing liability are substantially
modified, such an exchange or modification is treated as a de-recognition of the original liability
and the recognition of a new liability, and the difference in the respective carrying amounts is
recognised in profit or loss.
When a convertible bond loan is converted to shares, the difference between the subscription price
for the shares and the market value is recognized in the statement of comprehensive income.
Further, any difference between the book value of the loan derecognized at the date of conversion
and the new equity from the debt conversion is also recognized in the statement of comprehensive
income.
2.18 Cash
Cash includes cash in hand and cash deposited on bank accounts.
2.19 Equity
(a) Equity and liabilities
Financial instruments are classified as liabilities or equity in accordance with the underlying
economic realities. Interest, dividend, gains and losses relating to a financial instrument classified as
a liability are recognised in the income statement. Amounts distributed to holders of financial
instruments that are classified as equity will be recognised directly in equity. Convertible bonds and
similar instruments including a liability and/or an equity element are divided into two components
when issued, and these are recognised separately as a liability or equity.

17
(b) Costs of equity transactions
Transaction costs directly related to an equity transaction are recognized directly in equity after
deducting tax expenses.
2.20 Employee benefits
The Group has defined contribution retirement benefit plans. A defined contribution plan is a
pension plan under which the Group pays fixed contributions into a separate entity, and has no
further obligations. Contributions to defined contribution retirement benefit plans are recognised as
an expense when employees have rendered service entitling them to the contributions.
2.21 Provisions
A provision is recognised when the Group has an obligation (legal or self-imposed) as a result of a
previous event, it is probable (more likely than not) that a financial settlement will take place as a
result of this obligation and the size of the amount can be measured reliably. If the effect is
considerable, the provision is calculated by discounting estimated future cash flows using a discount
rate before tax that reflects the market’s pricing of the time value of money and, if relevant, risks
specifically linked to the obligation. A provision for a guarantee is recognised when the underlying
products or services are sold. The provision is based on historical information on guarantees and a
weighting of possible outcomes according to the likelihood of their occurrence. Restructuring
provisions are recognised when the Group has approved a detailed, formal restructuring plan and
the restructuring has either started or been publicly announced. Provisions for loss-making contracts
are recognised when the Group’s estimated revenues from a contract are lower than unavoidable
costs which were incurred to meet the obligations pursuant to the contract.
2.22 Earnings per share
Basic earnings per share are calculated by dividing net profit / (loss) for the year by the weighted
average number of shares outstanding in the relevant period. Diluted earnings per share are
calculated based on the if-converted method; the profit/(loss) for the Group divided by the average
number of outstanding shares weighted over the relevant period and the potential number of shares
converted, if the criteria for conversion is fulfilled.
2.23 Consolidation
The consolidated financial statements include Master Marine AS and its subsidiaries as of
December 31 for each year. The financial statements of the subsidiaries are prepared for the same
reporting year as the parent company using consistent accounting policies. All intercompany
transactions and balances are eliminated in the consolidation. Subsidiaries are fully consolidated
from the date of acquisition, being the date on which the Group obtains control, and continues to be
consolidated until the date that such control ceases.
Master Marine AS has two fully owned subsidiaries, Jacktel AS (organization number 994 152 300)
and Service Jack AS (organization number 994 151 932). Master Marine has 100% of the voting
rights in the subsidiaries. The companies were funded in 2009 and they were part of the
consolidations for the first time in 2009.
3. Income and Segment Information
Management has defined operating segments as follows:
chartering of the accommodation unit Haven

18
managing close out of the construction contract for the second vessel including owner
furnished equipment
2011 is the first year with operation for the Group and there is no segment reporting for 2010.
Operation of
Haven Other /
Eliminations Consolidated
Charter hire 25 584 0 25 584
Reimbursables and other income 17 251 0 17 251
Total revenue 42 835 0 42 835
Operating expenses -28 227 -2 348 -30 576
Depreciation and impairment -7 780 -218 -7 999
Non recurring items -34 633 -11 289 -45 922
Operating Profit -27 805 -13 856 -41 661
Assets - vessels 478 164 127 555 605 720
Total liabilitites 367 240 98 295 465 536
All Charter hire income is related to the charter hire contract for ConocoPhillips, operating at the
Ekofisk field in the North Sea. Reimbursable and other income is mainly related to mobilization fee
and payment for equipment and grouting operation related to the ConocoPhillips contract. The
mobilization fee and payment from equipment during construction is recognized over the three year
contract period.
Operating expenses for “Haven” consist of vessel operating cost and a portion of overhead cost.
Operating expenses in Other/Elimination consist of overhead cost. Non-recurring items related to
“Haven” consist mainly of mobilization cost and various offsets related to disputes. Non Recurring
items in Other/Eliminations consist mainly of construction expenses related to the second vessel,
recognized through profit and loss as a consequence of the cancellation of the building contract.
Total liabilities consist of shareholder loans and bank loan to Jacktel AS.
4. Vessel Operation cost and Other Operating Expenses
(1.000 EUR) 2011 2010
Insurance 1 016
36
Crew 9 660
6 305
Maintenace and spares 1 398
1 401
Other 6 740
1 980
Vessel operation 18 814 9 722
Marketing 148
241
Rental and leasing costs 615
565
Travel costs 912
1 046
Consultancy fees and external personnel 1 687
5 851
Office and administrative costs 216
365
Other operating costs* 48 890
2 410
Total other operating expenses 52 467 10 479
19
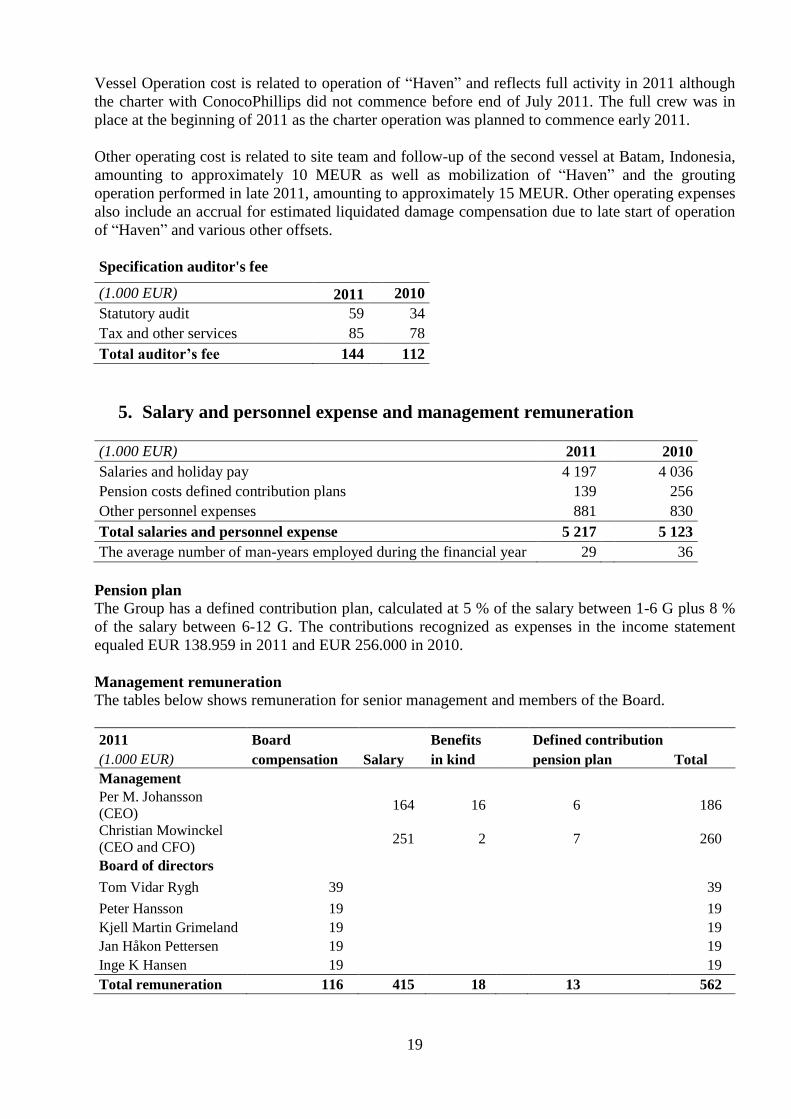
Vessel Operation cost is related to operation of “Haven” and reflects full activity in 2011 although
the charter with ConocoPhillips did not commence before end of July 2011. The full crew was in
place at the beginning of 2011 as the charter operation was planned to commence early 2011.
Other operating cost is related to site team and follow-up of the second vessel at Batam, Indonesia,
amounting to approximately 10 MEUR as well as mobilization of “Haven” and the grouting
operation performed in late 2011, amounting to approximately 15 MEUR. Other operating expenses
also include an accrual for estimated liquidated damage compensation due to late start of operation
of “Haven” and various other offsets.
Specification auditor's fee
(1.000 EUR) 2011 2010
Statutory audit 59 34
Tax and other services 85 78
Total auditor’s fee 144 112
5. Salary and personnel expense and management remuneration
(1.000 EUR) 2011 2010
Salaries and holiday pay 4 197 4 036
Pension costs defined contribution plans 139
256
Other personnel expenses 881 830
Total salaries and personnel expense 5 217 5 123
The average number of man-years employed during the financial year 29 36
Pension plan
The Group has a defined contribution plan, calculated at 5 % of the salary between 1-6 G plus 8 %
of the salary between 6-12 G. The contributions recognized as expenses in the income statement
equaled EUR 138.959 in 2011 and EUR 256.000 in 2010.
Management remuneration The tables below shows remuneration for senior management and members of the Board.
2011 Board
Benefits
Defined contribution
(1.000 EUR) compensation Salary in kind
pension plan Total
Management
Per M. Johansson
(CEO) 164 16
6 186
Christian Mowinckel
(CEO and CFO) 251 2
7 260
Board of directors
Tom Vidar Rygh 39
39
Peter Hansson 19
19
Kjell Martin Grimeland 19
19
Jan Håkon Pettersen 19
19
Inge K Hansen 19
19
Total remuneration 116 415 18 13 562

20
Per Johansson retired as CEO on 15th
August. In addition to ordinary salary he received a severance
package amounting to 148.5 KEUR in 2011, and he will receive 74.3 KEUR in 2012. Christian
Mowinckel was appointed as acting CEO from the same date and was appointed CEO by the Board
on 30th
September 2011. Christian Mowinckel holds a severance package with guaranteed base
salary until February 2014, however always equal to minimum one year full salary which is payable
in the event of a sale of “Haven” or shares in or change of control of Group companies.
2010 Board Benefits Defined contribution
(1.000 EUR) compensation Salary in kind pension plan Total
Management
Per M. Johansson
(CEO) 235 29
7
271
Christian Mowinckel
(01.05.10-31.12.10) 118 2
5
125
Anders Bruun-Olsen
(01.01.10-28.02.10) 187 0
2
189
Board of directors*
Tom Vidar Rygh 6
6
Peter Hansson 3
3
Kjell Martin
Grimeland 3
3
Geir Sandvik 3
3
Jan Håkon Pettersen 3
3
Inge K Hansen 3
3
Total remuneration 21 353 31 14 606
*for the period 04.11.2009 to 31.12.2009
There are no share options or warrants programs for management or members of the Board of
Directors. No members of the senior management or the Board hold shares in the company.
6. Transactions with related parties
The Group defines related parties as anyone with control or joint control of the shares in Master
Marine AS and subcontractors with direct influence in any of the Group companies.
The owners (Nordic Capital) behind the principal shareholder (Crystal Violet BV) of Master Marine
AS have made available several loans and guarantee facilities amounting to 321 MEUR. As of
yearend 2011, a total of 266 MEUR was drawn under the facilities and 41 MEUR of guarantees
were outstanding. See note 9 for details.
The Group has a framework agreement with structural engineers and maritime consultants Semar
AS (“Semar”). Former member of the Board of Directors Jetmund Hanssen (retired 4th
November
2009) is employed with Semar and was hired by Master Marine as a project coordinator under the
framework agreement until 5th
February 2011. Jetmund Hanssen owns 19 % of the shares in the
company Luen AS, which owns 0.13 % of the shares in Master Marine and 9% of the shares in
Semar. Based on the framework agreement, the Group purchased services from Semar valued at 2.7
MEUR during 2011 (6.2 MEUR in 2010).
All the transactions with related parties are carried out on market terms at arm’s length basis.

21
7. Financial income and expenses
(1.000 EUR) 2011 2010
Financial income
Interest income 123
81
Foreign exchange gains 8 786
39 992
Total financial income 8 910 40 073
Financial expenses
Interest expense -30 330
-2
Foreign exchange losses -9 397
-40 278
Other financial expenses -5 241
-10 321
Total financial expenses -44 967 -50 601
Interest expense is divided between shareholder loans (26.7 MEUR) provided to Master Marine AS
and bank loan (3.6 MEUR) provided to Jacktel AS. Interest expenses in 2011 are recognized
through profit and loss from July 2011 for “Haven” and for the full year for the second vessel (due
to cancellation of the building contract).
Other financial expenses in 2011 are mainly related to amortization of accrued fees on loans. Other
financial expenses in 2010 were mainly related to the effect of the 140 MEUR term loan
facilityfrom Nordic Capital being replaced by a new 140 MEUR loan and guarantee facility. The
balance of the accrued arrangement fee was then recognized in the profit and loss account. In
addition, other financial expenses in 2010 and 2011also include the proportionate amortization of
the equity component of the convertible bond (repaid in June 2011).
8. Investments and other financial instruments
Classification of financial assets and liabilities as of 31 December 2011:
(1.000 EUR)
Loans and
receivables
Financial
liabilities at fair
value through
profit and loss
Other financial
liabilities
Financial assets
Other current assets
43 233
Cash and cash equivalents
20 931
Total financial assets 64 164 0 0
Financial liabilities
Other long term liabilities
312 706
Accounts payable
7 159
Prepayments customer
52 874
Short term interest bearing debt
152 830
Other current liabilities
37 531
Total financial liabilities 503 067 0 60 033

22
Classification of financial assets and liabilities as of 31 December 2010:
(1.000 EUR)
Loans and
receivables
Financial liabilities at
fair value through
profit and loss
Other
financial
liabilities
Financial assets
Other current assets
19 557
Cash and cash equivalents
34 421
Total financial assets 53 978 0 0
Financial liabilities
Other long term liabilities
161 688
Accounts payable
24 869
Prepayments customer
46 271
Short term interest bearing debt
35 000
Other current liabilities
74 683
Total financial liabilities 271 371 0 71 140
9. Loans and Other long term liabilities
1.000 EUR) Description Lender
Drawn amount
Outstanding loan incl accr.
Interest Book value
140 MEUR Loan and guarantee facility Nordic Capital 85 000 97 849 97 849
10 MEUR Term loan facility Nordic Capital 10 000 10 926 10 926
15 MEUR Term Loan Facility Nordic Capital 15 000 16 391 16 391
86 MEUR Term loan facility Nordic Capital 86 010 90 876 88 272
69,9 MEUR Term loan facility Nordic Capital 69 934 75 278 73 656
Subtotal shareholder loans 265 944 291 320 287 094
Fair value interest rate swaps
541
Prepayments from customer
25 070
SUM Other long-term liabilities 291 320 312 706
155 MEUR Bank loan NIBC Bank (Agent) 155 000 155 000 152 830
SUM Short term interest bearing debt 155 000 155 000 152 830
SUM Other long term liabilities and bank loan 465 535
140 MEUR Loan and Guarantee Facility
The facility covers loan facility up to 85.4 MEUR and a guarantee facility up to 54.6 MEUR. The
loan is fully drawn and guarantees of 26 MEUR in favor of ConocoPhillips and 15 MEUR in favor
of bank loan lenders are outstanding. The loan carries a fixed interest at 12% p.a. accruing to
principal on a quarterly basis and payable at maturity. The loan and guarantee facility is secured by
a 2nd
lien mortgage on “Haven” and matures on 31st December 2015.
10 MEUR Term Loan facility and 15 MEUR Term Loan facility
In March 2011 Master Marine AS entered into a loan agreement with the majority shareholder in
the amount of 25 MEUR to finance additional cost to complete the construction of “Haven”. The
23
loan carries a fixed interest at 12% p.a. accruing to principal on a quarterly basis and payable at
maturity, is unsecured and matures on 31st December 2015.
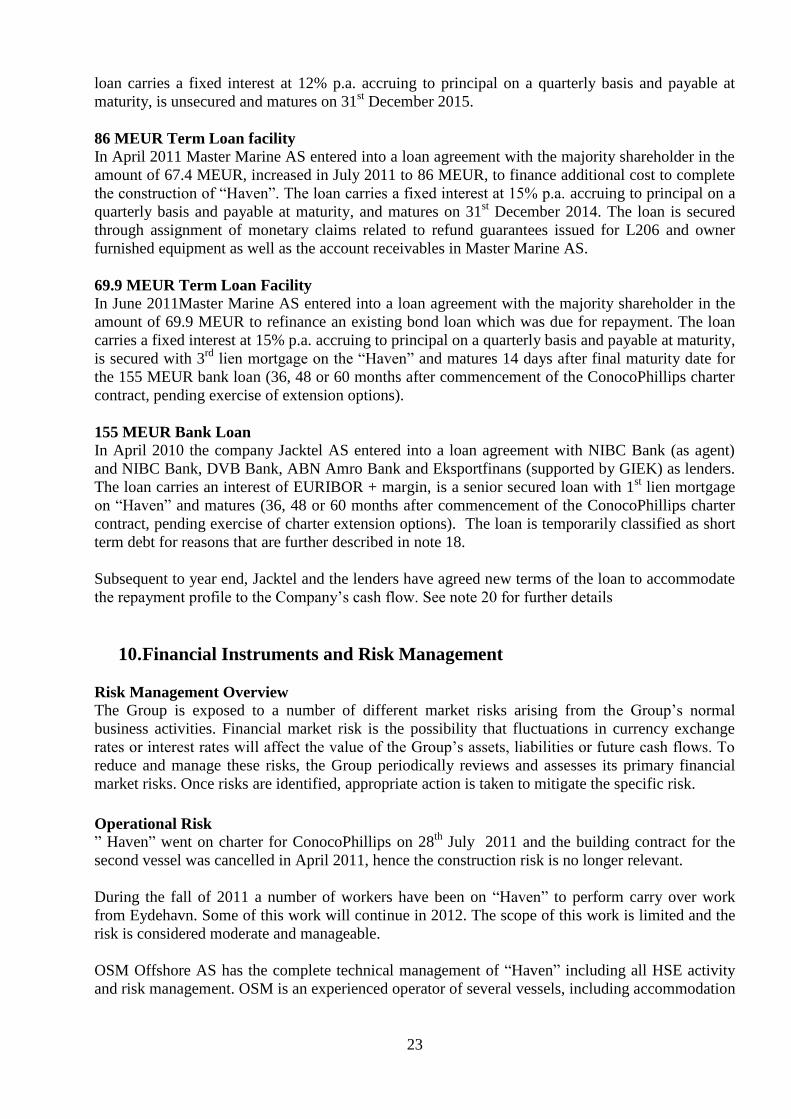
86 MEUR Term Loan facility
In April 2011 Master Marine AS entered into a loan agreement with the majority shareholder in the
amount of 67.4 MEUR, increased in July 2011 to 86 MEUR, to finance additional cost to complete
the construction of “Haven”. The loan carries a fixed interest at 15% p.a. accruing to principal on a
quarterly basis and payable at maturity, and matures on 31st December 2014. The loan is secured
through assignment of monetary claims related to refund guarantees issued for L206 and owner
furnished equipment as well as the account receivables in Master Marine AS.
69.9 MEUR Term Loan Facility
In June 2011Master Marine AS entered into a loan agreement with the majority shareholder in the
amount of 69.9 MEUR to refinance an existing bond loan which was due for repayment. The loan
carries a fixed interest at 15% p.a. accruing to principal on a quarterly basis and payable at maturity,
is secured with 3rd
lien mortgage on the “Haven” and matures 14 days after final maturity date for
the 155 MEUR bank loan (36, 48 or 60 months after commencement of the ConocoPhillips charter
contract, pending exercise of extension options).
155 MEUR Bank Loan
In April 2010 the company Jacktel AS entered into a loan agreement with NIBC Bank (as agent)
and NIBC Bank, DVB Bank, ABN Amro Bank and Eksportfinans (supported by GIEK) as lenders.
The loan carries an interest of EURIBOR + margin, is a senior secured loan with 1st lien mortgage
on “Haven” and matures (36, 48 or 60 months after commencement of the ConocoPhillips charter
contract, pending exercise of charter extension options). The loan is temporarily classified as short
term debt for reasons that are further described in note 18.
Subsequent to year end, Jacktel and the lenders have agreed new terms of the loan to accommodate
the repayment profile to the Company’s cash flow. See note 20 for further details
10. Financial Instruments and Risk Management
Risk Management Overview
The Group is exposed to a number of different market risks arising from the Group’s normal
business activities. Financial market risk is the possibility that fluctuations in currency exchange
rates or interest rates will affect the value of the Group’s assets, liabilities or future cash flows. To
reduce and manage these risks, the Group periodically reviews and assesses its primary financial
market risks. Once risks are identified, appropriate action is taken to mitigate the specific risk.
Operational Risk
” Haven” went on charter for ConocoPhillips on 28th
July 2011 and the building contract for the
second vessel was cancelled in April 2011, hence the construction risk is no longer relevant.
During the fall of 2011 a number of workers have been on “Haven” to perform carry over work
from Eydehavn. Some of this work will continue in 2012. The scope of this work is limited and the
risk is considered moderate and manageable.
OSM Offshore AS has the complete technical management of “Haven” including all HSE activity
and risk management. OSM is an experienced operator of several vessels, including accommodation
24
units, in the North Sea under the strictest safety regulations set by the Norwegian Petroleum Safety
Authority. Master Marine acts as the owner and has competent staff which continuously monitors
the Technical Manager’s performance in order to mitigate any operational risk.
The Group is exposed to market risk following the expiry of the ConocoPhillips contract in July
2014, 2015 or 2016, pending exercise of extension options. The deadline for exercising the first
extension option is in January 2013, providing management with a minimum of 18 months to
market the unit for alternative employment elsewhere. Management follows the development in the
offshore accommodation market closely. The North Sea offshore accommodation market has
strengthened considerably recently and management expect market conditions to strengthen further.
The Company’s building contract for the second vessel was cancelled in April 2011, and since the
cancellation is disputed by the yard the risk related to this project is depending on the outcome of
the ongoing arbitration case. The arbitration is anticipated to be settled some time during the second
half year of 2012 or beginning of 2013. The outcome of a hearing cannot be predicted, however
management expect to win the case affirming a rightful cancellation of the building contract.
The Group is exposed to risk associated with potentially deteriorating quality of its owner furnished
equipment installed on the second vessel or located at the Graha Yard in Batam, Indonesia.
Resulting from the contract cancellation, the yard must either acquire the equipment at full value or
return it to Master Marine in same condition as delivered to the yard. Due to ongoing disputes,
neither condition has been fulfilled. In order to protect values, Master Marine has initiated regular
inspections of equipment to ensure preservation requirements are adhered to by the yard.
Currency Risk
The functional currency of Master Marine is EURO. The Group aim to minimize the currency risk
by balancing, to the extent possible, the currencies of different types of assets and liabilities as well
as balancing revenues against expenses.
The Group’s accounts reflect the value of one unit in operation and one unit under construction. The
cost related to completion of “Haven” during the stay in Eydehavn was mainly charged in NOK
while the funding was in EURO, increasing the company’s exposure to currency risk during 2011.
With construction of “Haven” completed, this risk has again been reduced.
The Group’s future revenue from existing contracts will be in Euro while expenses will be primarily
in NOK and EURO. The Group may reduce the currency exposure generated from operational cash
flow by using derivatives. The Group may also do business in areas where revenues might be
denominated in USD which may expose the Group to different foreign exchange risk.
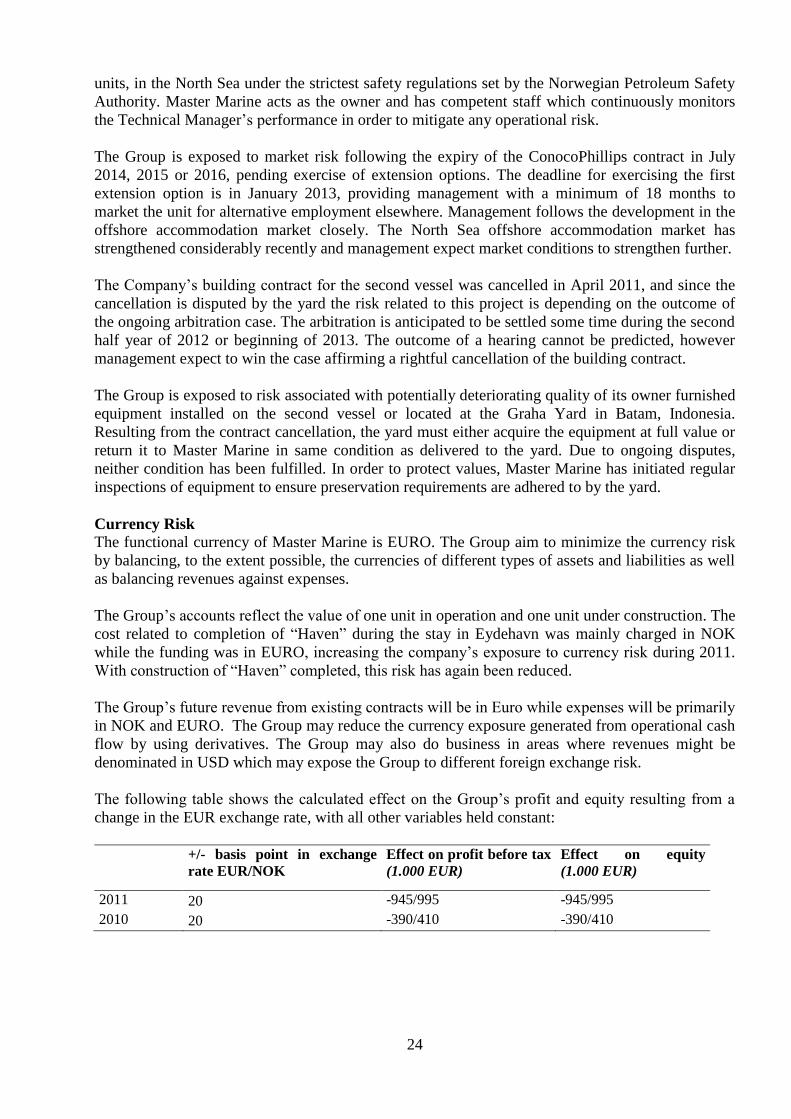
The following table shows the calculated effect on the Group’s profit and equity resulting from a
change in the EUR exchange rate, with all other variables held constant:
+/- basis point in exchange
rate EUR/NOK
Effect on profit before tax
(1.000 EUR)
Effect on equity
(1.000 EUR)
2011 20 -945/995 -945/995
2010 20 -390/410 -390/410
25
Interest Rate Risk
The Group has substantial interest bearing debt, but exposure to interest rate risk is limited. All
loans from Nordic Capital are with fixed interest. The floating rate exposure from the 155 MEUR
bank loan is hedged through swap contracts at the level of approximately 75% of the loan amount.
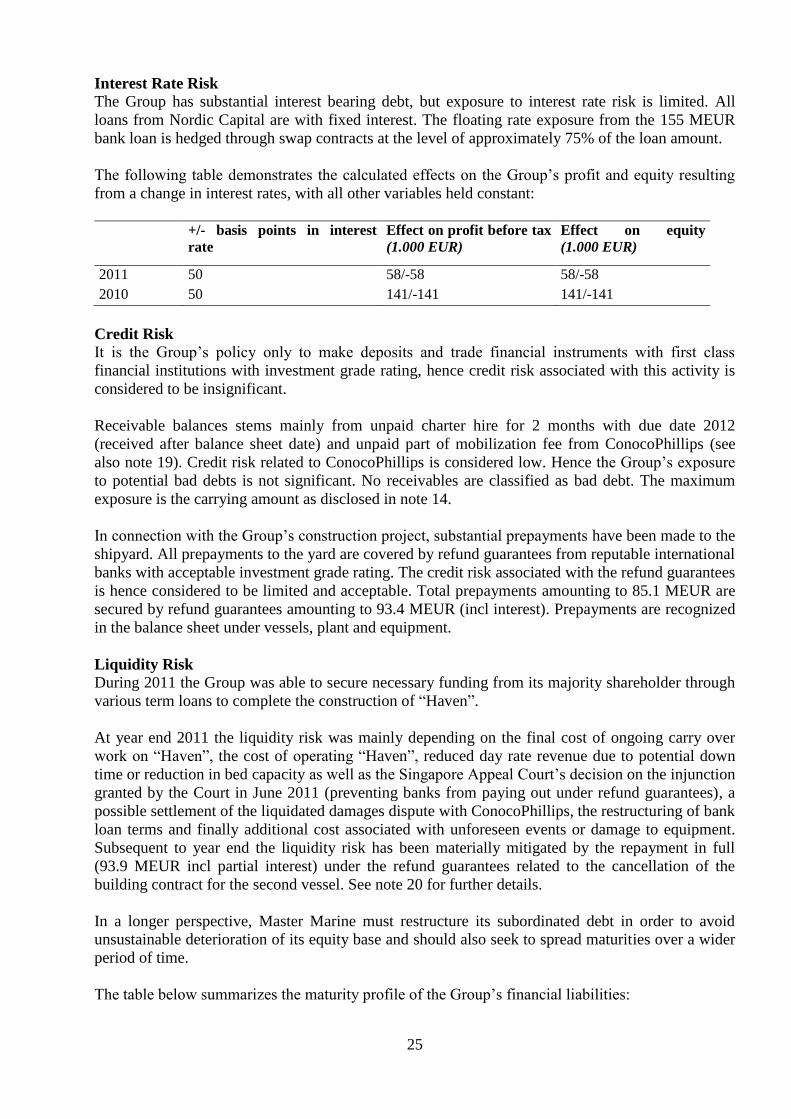
The following table demonstrates the calculated effects on the Group’s profit and equity resulting
from a change in interest rates, with all other variables held constant:
+/- basis points in interest
rate
Effect on profit before tax
(1.000 EUR)
Effect on equity
(1.000 EUR)
2011 50 58/-58 58/-58
2010 50 141/-141 141/-141
Credit Risk
It is the Group’s policy only to make deposits and trade financial instruments with first class
financial institutions with investment grade rating, hence credit risk associated with this activity is
considered to be insignificant.
Receivable balances stems mainly from unpaid charter hire for 2 months with due date 2012
(received after balance sheet date) and unpaid part of mobilization fee from ConocoPhillips (see
also note 19). Credit risk related to ConocoPhillips is considered low. Hence the Group’s exposure
to potential bad debts is not significant. No receivables are classified as bad debt. The maximum
exposure is the carrying amount as disclosed in note 14.
In connection with the Group’s construction project, substantial prepayments have been made to the
shipyard. All prepayments to the yard are covered by refund guarantees from reputable international
banks with acceptable investment grade rating. The credit risk associated with the refund guarantees
is hence considered to be limited and acceptable. Total prepayments amounting to 85.1 MEUR are
secured by refund guarantees amounting to 93.4 MEUR (incl interest). Prepayments are recognized
in the balance sheet under vessels, plant and equipment.
Liquidity Risk
During 2011 the Group was able to secure necessary funding from its majority shareholder through
various term loans to complete the construction of “Haven”.
At year end 2011 the liquidity risk was mainly depending on the final cost of ongoing carry over
work on “Haven”, the cost of operating “Haven”, reduced day rate revenue due to potential down
time or reduction in bed capacity as well as the Singapore Appeal Court’s decision on the injunction
granted by the Court in June 2011 (preventing banks from paying out under refund guarantees), a
possible settlement of the liquidated damages dispute with ConocoPhillips, the restructuring of bank
loan terms and finally additional cost associated with unforeseen events or damage to equipment.
Subsequent to year end the liquidity risk has been materially mitigated by the repayment in full
(93.9 MEUR incl partial interest) under the refund guarantees related to the cancellation of the
building contract for the second vessel. See note 20 for further details.
In a longer perspective, Master Marine must restructure its subordinated debt in order to avoid
unsustainable deterioration of its equity base and should also seek to spread maturities over a wider
period of time.
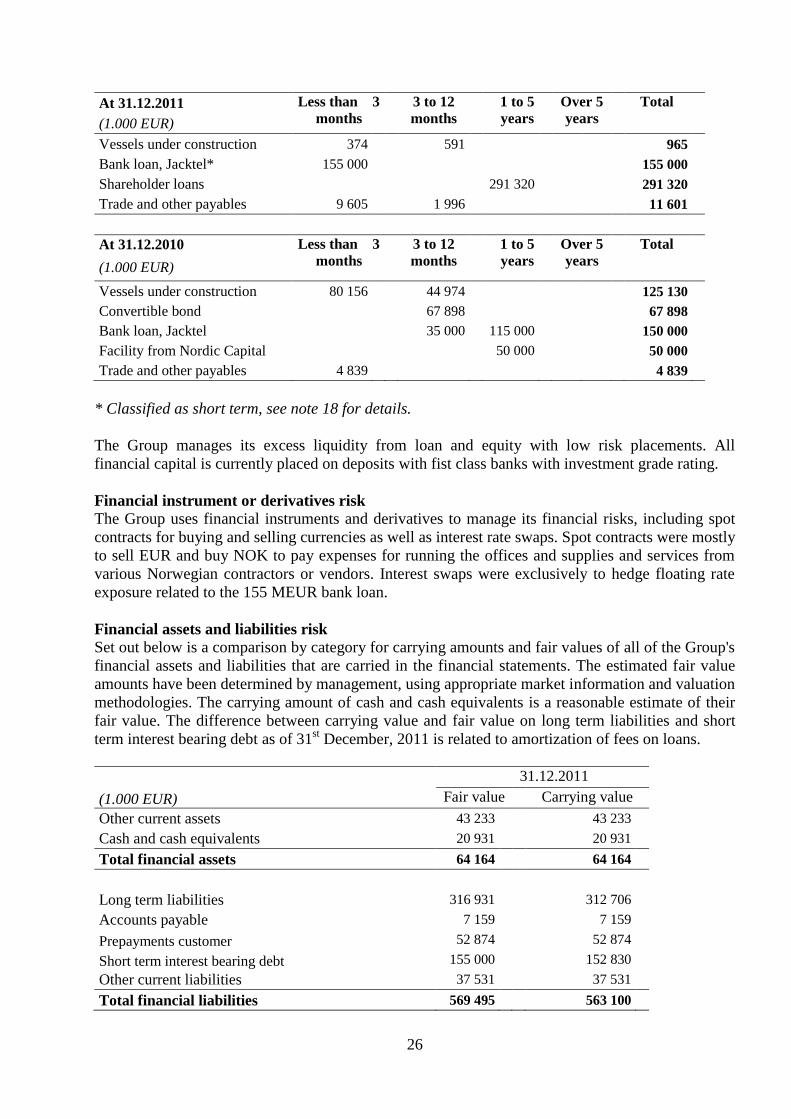
The table below summarizes the maturity profile of the Group’s financial liabilities:
26
At 31.12.2011 Less than 3
months
3 to 12
months
1 to 5
years
Over 5
years Total
(1.000 EUR)
Vessels under construction 374
591
965
Bank loan, Jacktel* 155 000
155 000
Shareholder loans
291 320
291 320
Trade and other payables 9 605 1 996 11 601
At 31.12.2010 Less than 3
months
3 to 12
months
1 to 5
years
Over 5
years
Total
(1.000 EUR)
Vessels under construction 80 156
44 974
125 130
Convertible bond
67 898
67 898
Bank loan, Jacktel
35 000
115 000
150 000
Facility from Nordic Capital
50 000
50 000
Trade and other payables 4 839 4 839
* Classified as short term, see note 18 for details.
The Group manages its excess liquidity from loan and equity with low risk placements. All
financial capital is currently placed on deposits with fist class banks with investment grade rating.
Financial instrument or derivatives risk
The Group uses financial instruments and derivatives to manage its financial risks, including spot
contracts for buying and selling currencies as well as interest rate swaps. Spot contracts were mostly
to sell EUR and buy NOK to pay expenses for running the offices and supplies and services from
various Norwegian contractors or vendors. Interest swaps were exclusively to hedge floating rate
exposure related to the 155 MEUR bank loan.
Financial assets and liabilities risk
Set out below is a comparison by category for carrying amounts and fair values of all of the Group's
financial assets and liabilities that are carried in the financial statements. The estimated fair value
amounts have been determined by management, using appropriate market information and valuation
methodologies. The carrying amount of cash and cash equivalents is a reasonable estimate of their
fair value. The difference between carrying value and fair value on long term liabilities and short
term interest bearing debt as of 31st December, 2011 is related to amortization of fees on loans.
31.12.2011
(1.000 EUR) Fair value Carrying value
Other current assets 43 233
43 233
Cash and cash equivalents 20 931
20 931
Total financial assets 64 164 64 164
Long term liabilities 316 931
312 706
Accounts payable 7 159
7 159
Prepayments customer 52 874
52 874
Short term interest bearing debt 155 000
152 830
Other current liabilities 37 531
37 531
Total financial liabilities 569 495 563 100
27
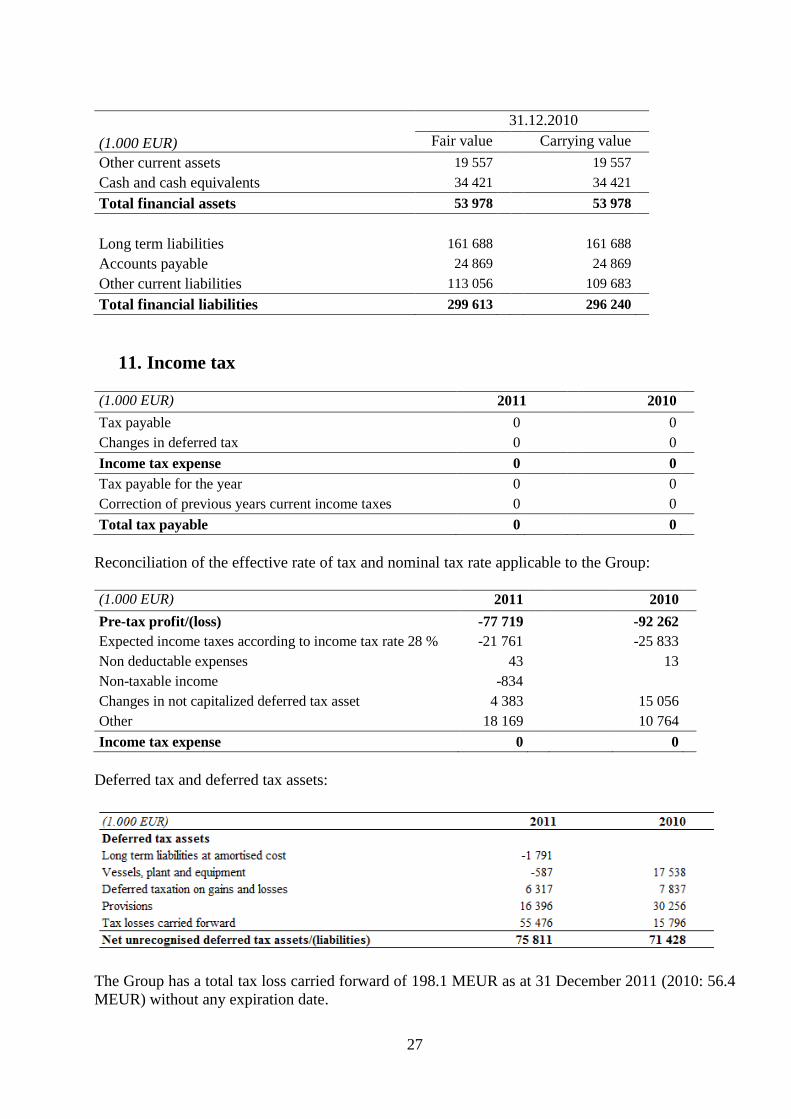
31.12.2010
(1.000 EUR) Fair value Carrying value
Other current assets 19 557
19 557
Cash and cash equivalents 34 421
34 421
Total financial assets 53 978 53 978
Long term liabilities 161 688
161 688
Accounts payable 24 869
24 869
Other current liabilities 113 056
109 683
Total financial liabilities 299 613 296 240
11. Income tax (1.000 EUR) 2011 2010
Tax payable 0
0
Changes in deferred tax 0
0
Income tax expense 0 0
Tax payable for the year 0
0
Correction of previous years current income taxes 0
0
Total tax payable 0 0
Reconciliation of the effective rate of tax and nominal tax rate applicable to the Group:
(1.000 EUR) 2011 2010
Pre-tax profit/(loss) -77 719 -92 262
Expected income taxes according to income tax rate 28 % -21 761
-25 833
Non deductable expenses 43
13
Non-taxable income -834
Changes in not capitalized deferred tax asset 4 383
15 056
Other 18 169
10 764
Income tax expense 0 0
Deferred tax and deferred tax assets:
The Group has a total tax loss carried forward of 198.1 MEUR as at 31 December 2011 (2010: 56.4
MEUR) without any expiration date.
28
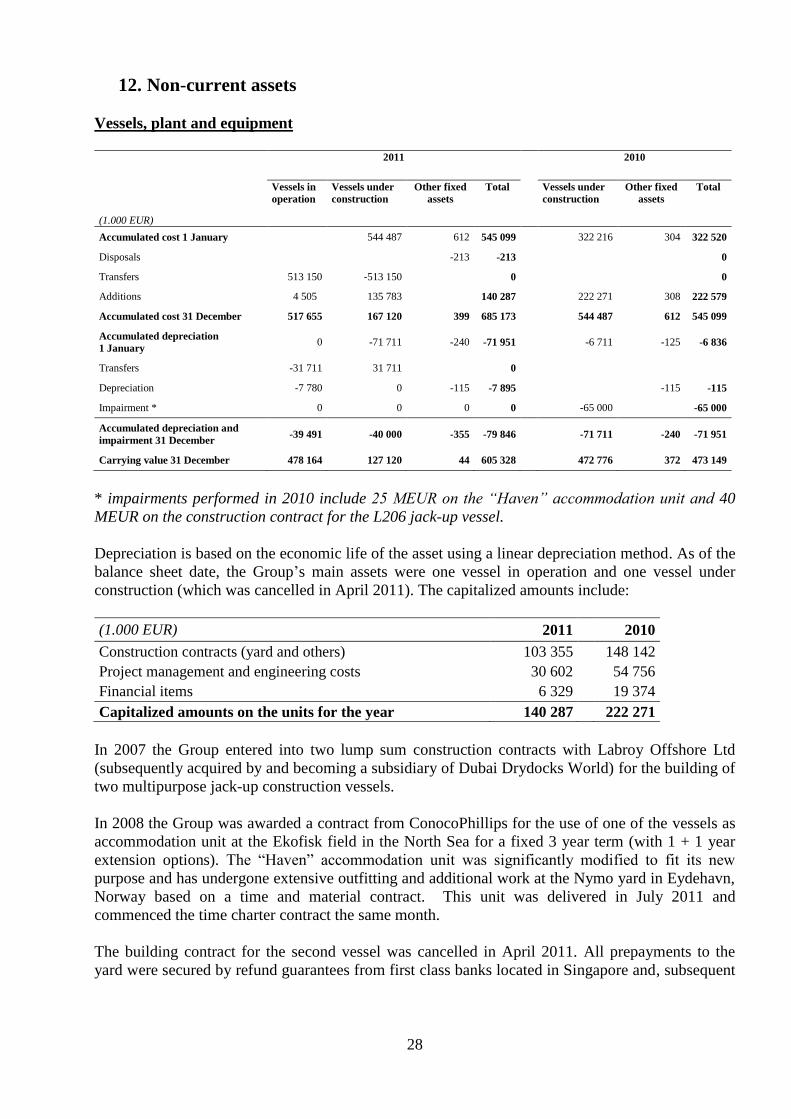
12. Non-current assets
Vessels, plant and equipment
2011 2010
(1.000 EUR)
Vessels in
operation
Vessels under
construction
Other fixed
assets
Total Vessels under
construction
Other fixed
assets
Total
Accumulated cost 1 January 544 487 612 545 099 322 216 304 322 520
Disposals
-213 -213
0
Transfers 513 150 -513 150
0
0
Additions 4 505 135 783
140 287
222 271 308 222 579
Accumulated cost 31 December 517 655 167 120 399 685 173
544 487 612 545 099
Accumulated depreciation
1 January 0 -71 711 -240 -71 951
-6 711 -125 -6 836
Transfers -31 711 31 711
0
Depreciation -7 780 0 -115 -7 895
-115 -115
Impairment * 0 0 0 0
-65 000
-65 000
Accumulated depreciation and
impairment 31 December -39 491 -40 000 -355 -79 846 -71 711 -240 -71 951
Carrying value 31 December 478 164 127 120 44 605 328 472 776 372 473 149
* impairments performed in 2010 include 25 MEUR on the “Haven” accommodation unit and 40
MEUR on the construction contract for the L206 jack-up vessel.
Depreciation is based on the economic life of the asset using a linear depreciation method. As of the
balance sheet date, the Group’s main assets were one vessel in operation and one vessel under
construction (which was cancelled in April 2011). The capitalized amounts include:
(1.000 EUR) 2011 2010
Construction contracts (yard and others) 103 355 148 142
Project management and engineering costs 30 602
54 756
Financial items 6 329
19 374
Capitalized amounts on the units for the year 140 287 222 271
In 2007 the Group entered into two lump sum construction contracts with Labroy Offshore Ltd
(subsequently acquired by and becoming a subsidiary of Dubai Drydocks World) for the building of
two multipurpose jack-up construction vessels.
In 2008 the Group was awarded a contract from ConocoPhillips for the use of one of the vessels as
accommodation unit at the Ekofisk field in the North Sea for a fixed 3 year term (with 1 + 1 year
extension options). The “Haven” accommodation unit was significantly modified to fit its new
purpose and has undergone extensive outfitting and additional work at the Nymo yard in Eydehavn,
Norway based on a time and material contract. This unit was delivered in July 2011 and
commenced the time charter contract the same month.
The building contract for the second vessel was cancelled in April 2011. All prepayments to the
yard were secured by refund guarantees from first class banks located in Singapore and, subsequent

29
to year end, have been repaid to Master Marine. See note 20 for further details. All Owner
Furnished Equipment ("OFE") for the second vessel remain the property of Master Marine AS.
Impairment
At each reporting date, an assessment is made according to IAS 36.9, on whether internal or
external information indicates a potential fall in the value of non-current assets. The Group has
carried out impairment tests for each of the two vessels based on assumptions and projections at the
time of approving the financial accounts of 2011.
a) Value of “Haven” accommodation unit
The unit was in full operation as of 31st December, 2011. Management has made an assessment of
the asset value using the value in use principle (IAS 36.66) and a set of assumptions. In a situation
where the value of the vessel is recovered through a disposal, the value might be lower.
The capitalized book value of “Haven” increased more than anticipated during 2011 and was higher
than at year end 2010 when an impairment of 25 MEUR was made. However, the accommodation
market strengthened significantly during 2011 and the project specific risk was reduced as a result
of commencing operation. On this basis, no further impairment was made in 2011. The remaining
book value as of 31st December 2011 is 478 MEUR.
The following assumptions have been used in the impairment test:
WACC: 8,7%
Day rates at the end of the contract period (incl. options): 230.000 EUR
Utilization at the end of contract period (incl. options): 95 %
Given changes in the above stated assumptions, the impact on the financial statement would be:
WACC: +1 % Impairment: 31 MEUR
Dayrates at end of contract period: -10 % Impairment: 42 MEUR
Utilization: -1 % Impairment: 0 MEUR
b) Value of cancelled contract for the L206 vessel
The building contract was cancelled on 12 April 2011. There are ongoing legal proceedings in order
to determine whether the cancellation was rightful or wrongful. The book value reflects expected
recoverable amount, given that the cancellation was rightful. The valuation is based on the value of
refund guarantees and estimated recoverable amount on owner furnished equipment. The remaining
book value as of 31 December 2011 is 127 MEUR.
Intangible assets
The intangible assets are computer software related to the operation of the Group in general.

30
1.000 EUR
2011
Intangible assets
2010
Intangible assets
Accumulated cost 1 January 428
220
Realisation 0
0
Additions 68
208
Accumulated cost 31 December 496 428
Accumulated depreciation 1 January 0
0
Depreciation -103
0
Accumulated depreciation 31 December -103 0
Carrying value 31 December 392 428
13. Contractual obligations
The table discloses contractual obligations for the Group the next five years at balance sheet date.
Obligations disclosed in 2012 and 2013 are related to OFE equipment for L206 and office rental.
(1.000 EUR) 2011 2010
2011 n/a
73 665
2012 1 355
380
2013 390
390
2014 0
0
2015 0
0
2016 0
0
Total 1 745 74 435
14. Other current assets
(1.000 EUR) 2011 2010
Trade debtors 40 112 5 540
Pre-paid expenses 68
3 880
Spare parts 0
369
Other current assets 1 876
3 138
VAT refund 1 176
6 629
Total other current assets 43 233 19 557
Trade debtors consist mainly of unpaid charter hire for November and December (paid in 2012) as
well as unpaid part of mobilization fee from ConocoPhillips. Other current asset consist amongst
other of an outstanding insurance claim under the yard’s Construction All Risk insurance policy in
relation to the riot which caused damage to some of the Company’s equipment stored at the Batam
yard.
15. Cash
The cash balance at year end 2011 was 20.9 MEUR (2010: 34.4 MEUR). Restricted cash in 2011
was 5.1 MEUR (2010: 5.7 MEUR) where 4.8 MEUR was cash deposit on escrow account related to

31
the building contract for “Haven” with Labroy Offshore. The purpose of the escrow account is to
secure potential claims the Company may have against Labroy Offshore in relation to rework or
repair work required to correct faulty work carried out by the Graha yard prior to delivery of
“Haven”.
16. Earnings per share
The basic earnings per share are calculated as the ratio of the profit/ (loss) for the year attributable
to shareholders divided by the weighted average number of ordinary shares outstanding during the
financial year.
Warrants issued (see note 17 for details) are out of-the-money as of 31 December 2011 as well as
the reporting date, and therefore does not affect the calculations of dilutive earnings per share.
2011 2010
Average number of shares outstanding 2 150 754 967
2 150 754 967
Effect of dilutive potential ordinary shares:
Convertible bonds
465 054 631
Diluted average number of shares
outstanding 2 150 754 967 2 615 809 598
Profit /(loss) -77 718 913 -92 261 696
Earnings per share: 2011
2010
- Basic -0,04
-0,04
- Diluted -0,04 -0,04
17. Share capital and shareholder information
Number of shares:
2011 2010
Ordinary shares
At 1 January 2 150 754 967 2 150 754 967
Share issues 0 0
At 31 December 2 150 754 967 2 150 754 967
All issued shares have equal voting rights and the right to receive dividend. Nominal value per
share is NOK 0.10 for calculation of earnings per share and diluted earnings per share see note 16.

32
The 20 largest shareholders as of 31 December 2011 are: Name Account
type Contry of
origin Number of
shares Owner interest
CRYSTAL VIOLET BV
NLD 1 736 518 874 80,74 %
RECTOR MARINUS INVEST AS
NOR 139 757 374 6,50 %
GOLDMAN SACHS INT. - EQUITY - NOM GBR 70 000 000 3,25 %
BANK OF NEW YORK MELLON SA/NV NOM BLG 40 311 335 1,87 %
DEUTSCHE BANK AG LONDON NOM GBR 33 860 632 1,57 %
CLEARSTREAM BANKING S.A. NOM LUX 13 938 627 0,65 %
UBS AG, LONDON BRANCH NOM GBR 12 501 133 0,58 %
CANICA AS
NOR 10 105 833 0,47 %
OPPENHEIMER QUEST INTL VALUE
USA 9 994 100 0,46 %
LABROY MARINE LTD.
SGP 8 726 400 0,41 %
PARETO GROWTH AS
NOR 8 165 403 0,38 %
SIRIUS SECURITIES AS
NOR 5 093 333 0,24 %
PARETO ENERGY SOLUTIONS AS
NOR 3 878 000 0,18 %
FREYER HOLDING AS
NOR 3 612 000 0,17 %
TANJA A/S
NOR 3 583 333 0,17 %
PATRONIA AS
NOR 3 509 000 0,16 %
WIECO INVEST AS
NOR 3 509 000 0,16 %
WIESE
NOR 3 240 500 0,15 %
OSLO PENSJONSFORSIKRING AS PM
NOR 3 168 000 0,15 %
TOLLEFSEN
NOR 2 916 667 0,14 %
Total 20 largest shareholders 2 116 389 544 98,40 %
Other
34 365 423 1,60 %
Total shares 2 150 754 967 100,00 %
*Crystal Violet BV is a company controlled by Nordic Capital Fund IIV.
In 2007 the Group issued warrants to all shareholders on a pro rata basis, 5 925 000 in total, vesting
in 2010, 2011 and 2012 respectively (1/3 each year). The subscription price is NOK 12.50. The
actual number of shares that may be subscribed varies, depending on the share price during the
relevant subscription period. If the volume weighted average share price during the relevant
subscription period is lower than NOK 14.00 (equal to 11.99% above the subscription price), no
warrants can be exercised.
18. Accounts payable and other current liabilities
(1.000 EUR) 2011 2010
Trade accounts payables 7 159 24 869
Government taxes, tax deductions etc. 34 0
Pre-payments from customers 52 874 46 271
Short term interest bearing debt 152 830 35 000
Other short term liabilities 37 497 74 683
Total 250 394 180 824

33
Pre-payments to customer consist of the short term portion of compensation received in advance
from ConocoPhillips. These pre-payments are recognized in the income statement on a straight line
basis over the period of the ConocoPhillips contract.
Short term interest bearing debt consists of the 155 MEUR bank loan to Jacktel. At the balance
sheet date, discussions about a loan restructuring were still ongoing based on a temporary waiver of
certain terms in the bank loan agreement, including repayment obligations. As a consequence, IFRS
require the loan to be classified as a short term obligation. For loan details, see note 9. For details
on loan restructuring terms, see note 20.
Other short term liabilities consist of accrued unpaid interest on loans and various offset for cost
incurred, but not paid. Other short term liabilities for 2010 consist amongst other of the convertible
bond loan (67.9 MEUR) which matured (and was repaid) in June 2011.
19. Legal disputes
The Group has identified the following significant matters or disputes with third parties:
Labroy Offshore Ltd (a subsidiary of Drydocks World, Dubai) disputed the cancellation of the
construction contract between Master Marine and Labroy Offshore for the second jack up vessel
currently under construction at Batam, Indonesia and initiated arbitration proceedings in Singapore.
Master Marine believes that Labroy Offshore will have no case to dispute the cancellation.
Subsequent to year end, the Tribunal has agreed to bifurcate the proceedings. For further details, see
note 20.
In April 2011, Master Marine made payment demands under the refund guarantees issued by three
prime Singapore banks to recover prepayments made to Labroy Offshore under the above
construction contract. In June 2011 the Singapore Court approved an injunction filed by Labroy
Offshore to prevent payment by the banks under the refund guarantees. Master Marine immediately
appealed the decision and the case was heard by the Appeal Court in February 2012 with a
favourable outcome for Master Marine. For further details, see note 20.
Flexmodul AS has claimed approximately 56 MNOK in compensation from Jacktel AS for non
payment of several variation orders. Master Marine has claimed liquidated damages of
approximately 36 MNOK in compensation for late delivery of equipment and services and approx 5
MNOK in other counter claims. Master Marine has disputed several claims from Flexmodul and is
of the opinion that Flexmodul has no legitimate claim for any compensation in excess of Master
Marine’s counter claim. Flexmodul initiated court proceedings against Master Marine AS and
Jacktel AS in Norway and arbitration proceedings against Jacktel AS in Singapore. The main
hearing at Oslo Tingrett was held in May 2012 and the parties are awaiting the Court’s judgement.
ConocoPhillips Scandinavia AS has claimed approximately 26 MEUR in liquidated damages from
Jacktel AS resulting from late delivery of the vessel “Haven”. Master Marine has disputed all such
claims on grounds of interpretation of the contract language. The parties have resolved several
matters related to a number of variation orders from the construction phase and are seeking to settle
the liquidated damages dispute.

34
20. Events after the balance sheet date
Master Marine’s appeal of the Singapore Court’s decision in June 2011 to grant an injunction
preventing banks from paying out under the refund guarantees was subject to a final Appeal Court
hearing in Feb 2012. In April 2012, the Appeal Court decided in Master Marine’s favor and
discharged the injunction. The full amount of 93.9 MEUR was subsequently received in Master
Marine’s bank account.
Following the favorable decision on refund guarantees by the Singapore Appeal Court and at
Master Marine’s request, Labroy Offshore and the Singapore Tribunal agreed to bifurcate or split
the ongoing arbitration proceedings related to whether or not the construction contract was
rightfully cancelled. In essence, this decision allows for the Tribunal to hear the case on the basis of
whether or not the contract was rightfully cancelled due to inadequate refund guarantees and will
leave out the issue of whether the contract was rightfully cancelled due to construction delay. This
approach will narrow down the issue at hand. The Tribunal has adopted a shorter timeline, requiring
both parties to submit their statements and responses by late July 2012. Management expects the
hearing to be scheduled for some time during the 3rd
quarter 2012.
In May 2012, Master Marine agreed terms with the lenders for a restructuring of the bank loan
repayment profile. New terms include a permanent waiver of all repayments which were due in
2011 amounting to 27.5 MEUR with a corresponding increase in the balloon amount after 3 years
(September 2014) from 45 MEUR to 72.5 MEUR and certain adjustments to quarterly repayments
to accommodate operating cash flow in Jacktel AS. Terms also include a margin increase from 375
basis points to 466 basis points above Euribor. Based on current cash flow projections, the new
repayment profile will provide a comfortable buffer to the debt service covenant. There is no
change to the asset value to loan outstanding covenant. The loan restructuring, yet to be executed, is
subject to loan documentation, expected to be completed shortly.

35
FINANCIAL STATEMENTS 2011
Master Marine AS Profit and Loss statement
1 January - 31 December
Notes
(In EUR 1.000) 2011 2010
Revenue 3 2 753 54 086
TOTAL OPERATING REVENUE
2 753 54 086
OPERATING EXPENSES
Salary and personnel costs 5 -5 217 -4 554
Other operating expenses 4 -14 850 -12 206
Impairments 12 - -40 000
Depreciation 12 -218 -115
TOTAL OPERATING EXPENSES -20 286 -56 874
OPERATING PROFIT / (LOSS) -17 533 -2 788
FINANCIAL INCOME AND EXPENSES
Financial income 7 21 504 38 951
Financial expenses 7 -99 283 -73 206
NET FINANCIAL ITEMS -77 779 -34 255
PROFIT/(LOSS) BEFORE TAX -95 312 -37 043
Income tax expense (benefit) 11 - -
NET PROFIT (LOSS) -95 312 -37 043
Consolidated Statement of Comprehensive Income (In EUR 1.000)
Net profit this period
-95 312 -37 043
Other comprehensive income
COMPREHENSIVE INCOME -95 312 -37 043
Allocation of comprehensive income
Share premium reserve
-95 312 -37 043
Retained earnings
Earnings per share:
- Basic
16 -0,04 -0,02
- Diluted 16 -0,04 -0,02

36
Master Marine AS
Statement of Financial Position
Notes
(In EUR 1.000) 31.12.2011 31.12.2010
ASSETS
Non-current assets:
Vessels, plant and equipment 12 127 164 125 313
Shares in subsidiaries 12 115 727 180 739
Other long term receivables 12 188 799 25 000
Intangible assets 12 392 428
Total non-current assets 432 081 331 480
Current assets:
Other current assets 14 6 948 19 164
Cash 15 4 525 22 459
Total current assets 11 473 41 623
TOTAL ASSETS 443 555 373 103
EQUITY AND LIABILITIES
Paid in capital:
Issued capital 17 25 754 25 754
Share premium 17 116 374 211 642
Other paid in capital 17 2 866 2 866
Total paid in capital 144 995 240 263
Total equity 144 995 240 263
Non-current liabilities:
Other long-term liabilities 9 287 095 49 991
Total long-term liabilities 287 095 49 991
Current liabilities:
Accounts payable 18 884 4 128
Other current liabilities 18 10 581 78 722
Total current liabilities 11 465 82 850
Total liabilities 298 560 132 841
TOTAL EQUITY AND LIABILITIES 443 555 373 103

37
Master Marine AS
Statement of Changes in Equity
(In EUR 1.000)
Share
Capital
Share
premium
Other
paid in
capital
Retained
earnings
Total equity
Equity as at January 1, 2010 25 754 245 320 59 0 271 135
Issue of convertible loan 3 365 2 807
6 172
Net income (loss) -37 043
-37 043
Equity as at December 2010 25 754 211 642 2 866 0 240 263
Effect from merger of subsidiary
44 44
Net incom (loss)
-95 268
-44 -95 312
Equity as at December 2011 25 754 116 374 2 866 0 144 995
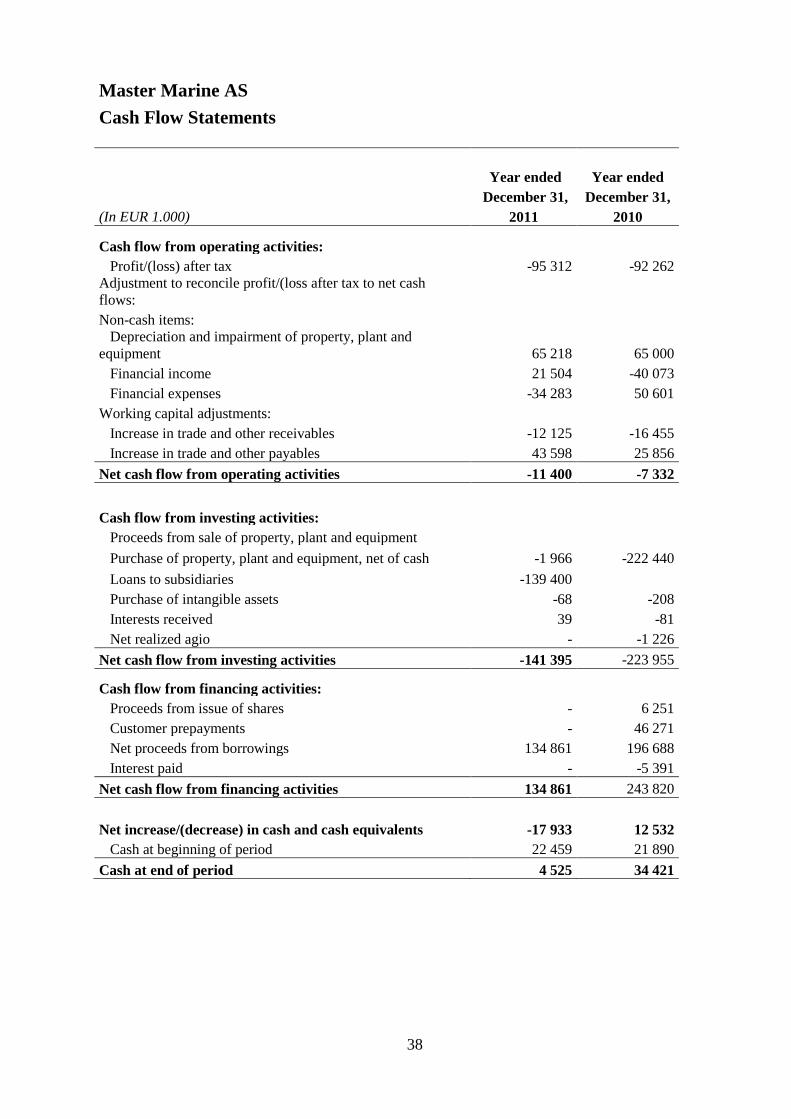
38
Master Marine AS
Cash Flow Statements
Year ended Year ended
December 31, December 31,
(In EUR 1.000) 2011 2010
Cash flow from operating activities:
Profit/(loss) after tax -95 312 -92 262
Adjustment to reconcile profit/(loss after tax to net cash
flows:
Non-cash items:
Depreciation and impairment of property, plant and
equipment 65 218 65 000
Financial income 21 504 -40 073
Financial expenses -34 283 50 601
Working capital adjustments:
Increase in trade and other receivables -12 125 -16 455
Increase in trade and other payables 43 598 25 856
Net cash flow from operating activities -11 400 -7 332
Cash flow from investing activities:
Proceeds from sale of property, plant and equipment
Purchase of property, plant and equipment, net of cash -1 966 -222 440
Loans to subsidiaries -139 400
Purchase of intangible assets -68 -208
Interests received 39 -81
Net realized agio - -1 226
Net cash flow from investing activities -141 395 -223 955
Cash flow from financing activities:
Proceeds from issue of shares - 6 251
Customer prepayments - 46 271
Net proceeds from borrowings 134 861 196 688
Interest paid - -5 391
Net cash flow from financing activities 134 861 243 820
Net increase/(decrease) in cash and cash equivalents -17 933 12 532
Cash at beginning of period 22 459 21 890
Cash at end of period 4 525 34 421

39
Notes
1. General information
Master Marine AS (“Master Marine” or “the Company”) is a private limited company, incorporated
in Norway. The company’s headquarter is located at Drammensveien 288, 0283 Oslo, Norway.
Master Marine is an offshore service company, specialising in offshore accommodation.
2. Summary of significant accounting policies
2.1 Statement of compliance
The financial statements of Master Marine have been prepared in accordance with International
Financial Reporting Standards (IFRS) and interpretations adopted by the International Accounting
Standards Board (IASB) and IFRIC as approved by the European Union (“EU”), as well as the
additional relevant requirements under the Norwegian Accounting Act.
2.2 Basis of preparation
The financial statements have been prepared under the historical cost convention, modified by
financial assets and financial liabilities (including derivative instruments) at fair value through
profit or loss.
The statement of comprehensive income is presented by nature of costs (IAS 1). The principal
accounting policies are set out below.
2.3 Functional currency and presentation currency
Master Marine AS applies Euro as reporting currency for its financial statements.
2.4 Adoption of new and revised standards and interpretations
The following standards, amendments and interpretations effective January 1, 2011, are relevant to
the Company but have no material impact on the financial information of the Company:
IAS 24, (Revised), IAS 32 (Amendment), IFRIC 14 (amendment), IFRIC 19, IFRS 3
(Amendment), IFRS 3 (Amendment), IFRS 7 (amendment), IAS 1 (Amendment), IAS 27
(revised), IFRIC 13 (amendment)
(c) Early adoption of standards and interpretations
No standards or interpretations have been early adopted in 2011.
(d) Standards and interpretations in issue not yet adopted
At the date of authorisation of these financial statements the following Interpretations were in issue
but not yet effective:
IFRS 7 (amendment), IFRS 9, IFRS 10, IFRS 11, IFRS 12, IFRS 13, IAS 1 (amendment), IAS 12
(amendment), IAS 19 (amendment), IAS 27 (amendment), IAS 28 (amendment)
Management anticipate that the standards and interpretations in issue but not yet effective will be
adopted in the financial statements when they become effective, and foresee currently no material
near-term impact by the adoptions on the financial statements of the Company in the period of
initial application, however this will be further assessed upon implementation. The new standards
40
on leasing and revenue (IAS 17 and IAS 18, not yet approved) could have an impact, but are not
expected to be effective before 2013.
2.5 Significant accounting judgments, estimates and assumptions
The preparation of the financial statements requires management to make judgments, estimates and
assumptions that affect the reported amounts of revenues, expenses, assets and liabilities, and the
disclosure of contingent liabilities, at the reporting date. Management bases its judgments and
estimates on historical experience and on various other factors that are believed to be reasonable
under the circumstances, the results of which form the basis for making judgments about the
carrying values of assets and liabilities that are not readily apparent from other sources. Uncertainty
about these assumptions and estimates could result in outcomes that could require a material
adjustment to the carrying amount of the asset or liability affected in the future. The key sources of
judgement and estimation of uncertainty at the balance sheet date, that have a significant risk for
causing a material adjustment to the carrying amounts of assets and liabilities within the next
financial year are discussed below.
Management assess whether there are any indications of impairment for all non-financial assets at
the reporting date. The unit under production are tested for impairment when there are indications
that the carrying values may not be recoverable. When value in use calculations are performed,
management estimates the expected future cash flows from the assets or cash-generating unit and
chooses a suitable discount rate in order to calculate the present value of those cash flows. These are
based on management’s evaluations, including estimates of future performance, revenue generating
capacity of the assets, and assumptions of the future market conditions. Changes in circumstances
and in management’s evaluations and assumptions may give rise to impairment losses.
2.6 Revenue recognition
Revenue is recognised at the time of the transaction when it is probable that the transaction will
generate future economic benefits that will flow to the Company and the amount can be reliably
estimated. Revenues are presented net of value added tax and discounts.
Lease income from operating leases is recognised in income on a straight-line basis over the lease
term, including mobilisation fee received and other receivable for preparation to meet a specific
lease contract, unless another systematic basis is more representative of the time pattern in which
use benefit derived from the leased asset is diminished.
Revenues from the sale of services are recognised in the income statement according to the
project’s level of completion provided the outcome of the transaction can be estimated reliably.
Interest income is recognised in the income statement based on the effective interest rate method as
the income is accrued.
2.7 Foreign currency
The functional currency of the Company is EURO. Transactions in foreign currency are translated
at the exchange rate applicable on the transaction date. Monetary items in other currencies are
translated into EUR using the exchange rate applicable on the balance sheet date. Non-monetary
items that are measured at their historical price expressed in a foreign currency are translated into
EUR using the exchange rate applicable on the transaction date. Non-monetary items that are
measured at their fair value expressed in a foreign currency are translated at the exchange rate
applicable on the balance sheet date. Changes to exchange rates are recognised in the income
statement as they occur during the accounting period.
41
2.8 Segments
Operating segments are reported in a manner consistent with the internal reporting provided to the
chief operating decision maker who is responsible for allocating resources and assessing the
performance of the operating segments. The chief operating decision maker has been identified as
the Board of Directors and the Executive Management. The Company has one operational segment,
which is operation of an accommodation unit. See note 3 for more details.
2.9 Borrowing costs
Borrowing costs are recognised in profit or loss in the period in which they are incurred. Borrowing
costs directly attributable to acquisition, construction or production of qualifying assets, which are
assets that necessarily take a substantial period of time to get ready for their intended use or sale,
are added to the cost of those assets, until such time as the assets are substantially ready for their
intended use or sale. All consecutive interest expense on the financing is added to the carrying value
of the units.
2.10 Income tax
Tax cost consists of tax payable and changes to deferred tax. Deferred tax liability/tax assets are
calculated on differences between the book value and tax value of assets and liabilities.
Deferred tax assets are recognised when there is other convincing evidence proving that the
Company will have a sufficient profit for tax purposes in subsequent periods to utilise the tax asset.
The Company recognises previously unrecognised deferred tax assets to the extent it has become
probable that the Company can utilise the deferred tax asset. Deferred tax and deferred tax assets
are measured on the basis of the expected future tax rates applicable, recognised at their nominal
value and classified as non-current asset investments (long-term liabilities) in the balance sheet.
Taxes payable and deferred taxes are recognised directly in equity to the extent that they relate to
equity transactions.
2.11 Tangible assets (non-financial) and assets under construction
Tangible assets are recognised at cost less accumulated depreciation and impairment losses. When
assets are sold or disposed of, the carrying amount is derecognised and any gain or loss is
recognised in the income statement. The cost of tangible non-current assets is the purchase price,
including taxes/duties and costs directly linked to preparing the asset ready for its intended use.
Units under construction and other non-financial tangible assets are reviewed for impairment
whenever events or changes in circumstances indicate that the carrying value may not be
recoverable. An impairment loss is recognised by the excess value of the carrying value of the asset
and the recoverable amount, and recognised in the income statement. The recoverable amount is the
higher of the asset’s net selling price and its value in use. The value in use is determined by
reference to the discounted future net cash flows expected to be generated by the asset. A
previously recognised impairment loss is reversed only if there has been a change in the estimates
used to determine the recoverable amount, however limited by the carrying value if no impairment
loss had been recognised in prior years.
Depreciation is calculated using the straight-line method over the following useful life, taking
residual values into consideration. Components with different economic useful life are depreciated
on a straight-line basis, over the components useful life. The depreciation period and method are
assessed each year. A residual value is estimated at each year-end, and changes to the estimated
residual value are recognised as a change in an estimate.
Ordinary repairs and maintenance expenses are recognised in the income statement in the financial
period in which they are incurred. Costs related to major inspections/classification will be
recognised in the carrying value of the units if certain recognition criteria are satisfied. The

42
recognition will be made when the docking has been performed and is depreciated based on
estimated time to the next inspection. Any remaining carrying value of the cost of the previous
inspection will be de-recognised. The remaining costs that do not meet the recognition criteria are
recognised as repairs and maintenance expenses.
The unit under construction are classified as non-current assets and recognised at cost until the
production or development process is completed. The units under construction are not depreciated
until the asset has been completed and is available for use.
2.12 Leased Operating Equipment/Units
Costs, including depreciation, incurred in earning the lease income are recognised as an expense.
Lease income (excluding receipts for services provided such as insurance and maintenance) is
recognised on a straight-line basis over the lease term even if the receipts are not on such a basis,
unless another systematic basis is more representative of the time pattern in which use benefit
derived from the leased asset is diminished.
Initial direct costs incurred by lessors in negotiating and arranging an operating lease shall be added
to the carrying amount of the leased asset and recognised as an expense over the lease term on the
same basis as the lease income.
Leases are classified as finance leases whenever the terms of the lease transfer substantially all the
risks and rewards of ownership to the lessee. All other leases are classified as operating leases. The
evaluation is based on the substance of the transaction rather than the form of the contract, and the
determination is made when the leasing agreement is entered into. Financial leases are accounted
for as debt financed purchases of assets, and the annual lease payments are allocated as finance
costs and amortization of the lease liability. Capitalised lease assets are depreciated over the shorter
of the estimated useful life of the asset and the lease term if there is no reasonable certainty that the
Company will obtain ownership by the end of the lease term. For operating leases, the lease
payments (i.e. a time charter hire or bareboat hire) are recorded as ordinary operating expenses or
income, and charged to profit and loss on a straight-line basis over the term of the relevant lease.
Contingent rents are recognized as revenue in the period in which they are earned or as expense in
the period in which they are incurred.
2.13 Investments and Other Financial Assets
The Company classifies its financial assets in the following categories: financial assets at fair value
through profit or loss, loans and receivables and available-for-sale financial assets. The
classification depends on the purpose of which the investments were acquired. Management
determines the classification of its financial assets at initial recognition and re-evaluates this
designation at every reporting date. When financial assets are recognised initially, they are
measured at fair value, plus, in the case of investments not at fair value through profit or loss,
directly attributable transaction costs. The purchases and sales of financial assets are recognised on
the trade date.
(d) Financial assets at fair value through profit or loss
This category has two sub-categories: financial assets held for trading, and those designated at fair
value through profit or loss at inception. A financial asset is classified in this category if acquired
principally for the purposes of sale in the short term or if so designated by management. Derivatives
are also categorized as held for trading unless they are designated as hedges. Gains or losses on
investments held for trading are recognised in the profit and loss account.

43
(e) Loans and receivables
Loans and receivables are non-derivative financial assets with fixed or determinable payments that
are not quoted in an active market. Loans and receivables are carried at amortized cost using the
effective interest method, less any allowance for impairment. Gains and losses are recognised in
income when the loans and receivables are de-recognised or impaired, as well as through the
amortization process.
(f) Available-for-sale financial assets
Available-for-sale financial assets are non-derivative financial assets that are either designated in
this category or not classified in any of the other categories. After initial recognition, available-for-
sale financial assets are measured at fair value with gains or losses being recognised as a separate
component of equity until the investment are derecognised, at which time the cumulative gain or
loss previously reported in equity is included in the income statement. The fair value of investments
that are actively traded in organized financial markets is determined by reference to quoted market
bid prices at the close of business on the balance sheet date. For investments where there is no
active market, fair value is determined applying commonly used valuation techniques.
2.14 Impairment of financial assets
At each balance sheet date management assesses whether there are indications that a financial asset
or a group of financial assets where changes in value are not recognized through the income
statement are impaired. Impairment only occur if there are objective indicators of impairment as a
result of one or more events after initial carrying value and the events affect the future cash flows
and this can be estimated reliably. If such impairment is indicated for loan and receivables carried at
amortized cost, the amount of impairment loss is measured as the difference between the asset’s
carrying amount and the present value of estimated future cash flows (excluding future credit losses
that have not been incurred) discounted at the financial asset’s original effective interest rate. The
impairment loss is recognised in profit and loss. If, in a subsequent period, the amount of the
impairment loss decreases and the decrease can be related objectively to an event occurring after the
impairment was recognised, the previously recognised impairment loss is reversed. Any subsequent
reversal of an impairment loss is recognised in the income statement, to the extent that the carrying
value of the asset does not exceed its amortized cost at the reversal date.
2.15 Financial liabilities - borrowings
Borrowings are initially recognised at the fair value of the consideration received less directly
attributable transaction costs. After initial recognition, borrowings and the related transaction costs
are subsequently measured at amortized cost using the effective interest method. Gains and losses
are recognised in net profit or loss when the liabilities are de-recognised as well as through the
amortization process. Borrowings containing prepayment options are evaluated to determine if these
options are closely related to the cost instrument or are embedded derivatives. In assessing whether
the option is closely related, the Company consider whether the exercise price is approximately
equal to the amortized cost at each exercise date. Borrowings are considered “current” if they fall
due within 12 months after the balance sheet date. Borrowings falling due later than 12 months after
balance sheet date are considered “long term”.
2.16 De-recognition of financial assets and liabilities
A financial asset is derecognised when:
- the rights to receive cash flows from the asset have expired;
- the Company retains the right to receive cash flows from the asset, but has assumed an
obligation to pay them in full without material delay to a third party under a ‘pass-through’
arrangement; or

44
- the Company has transferred its rights to receive cash flows from the asset and either (a) has
transferred substantially all the risks and rewards of the asset, or (b) has neither transferred
nor retained substantially all the risks and rewards of the asset, but has transferred control of
the asset.
A financial liability is derecognised when the obligation under the liability is discharged, or
cancelled or expires. Where an existing financial liability is replaced by another from the same
lender on substantially different terms, or the terms of an existing liability are substantially
modified, such an exchange or modification is treated as a de-recognition of the original liability
and the recognition of a new liability, and the difference in the respective carrying amounts is
recognised in profit or loss.
When a convertible bond loan is converted to shares, the difference between the subscription price
for the shares and the market value is recognized in the statement of comprehensive income.
Further, any difference between the book value of the loan derecognized at the date of conversion
and the new equity from the debt conversion is also recognized in the statement of comprehensive
income.
2.17 Cash
Cash includes cash in hand and cash deposited on bank accounts.
2.18 Equity
(c) Equity and liabilities
Financial instruments are classified as liabilities or equity in accordance with the underlying
economic realities. Interest, dividend, gains and losses relating to a financial instrument classified as
a liability are recognised in the income statement. Amounts distributed to holders of financial
instruments that are classified as equity will be recognised directly in equity. Convertible bonds and
similar instruments including a liability and/or an equity element are divided into two components
when issued, and these are recognised separately as a liability or equity.
(d) Costs of equity transactions
Transaction costs directly related to an equity transaction are recognized directly in equity after
deducting tax expenses.
2.19 Employee benefits
The Company has defined contribution retirement benefit plans. A defined contribution plan is a
pension plan under which the Company pays fixed contributions into a separate entity, and has no
further obligations. Contributions to defined contribution retirement benefit plans are recognised as
an expense when employees have rendered service entitling them to the contributions.
2.20 Provisions
A provision is recognised when the Company has an obligation (legal or self-imposed) as a result of
a previous event, it is probable (more likely than not) that a financial settlement will take place as a
result of this obligation and the size of the amount can be measured reliably. If the effect is
considerable, the provision is calculated by discounting estimated future cash flows using a discount
rate before tax that reflects the market’s pricing of the time value of money and, if relevant, risks
specifically linked to the obligation. A provision for a guarantee is recognised when the underlying
products or services are sold. The provision is based on historical information on guarantees and a
weighting of possible outcomes according to the likelihood of their occurrence. Restructuring
provisions are recognised when the Company has approved a detailed, formal restructuring plan and
the restructuring has either started or been publicly announced. Provisions for loss-making contracts
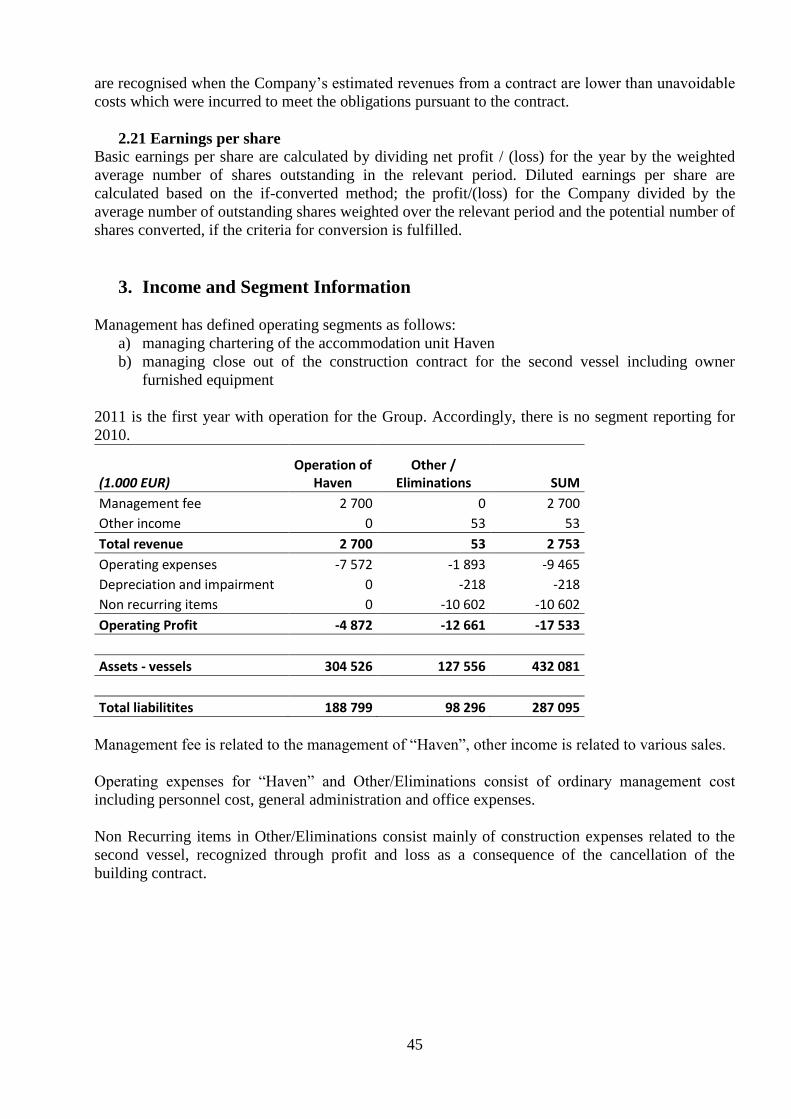
45
are recognised when the Company’s estimated revenues from a contract are lower than unavoidable
costs which were incurred to meet the obligations pursuant to the contract.
2.21 Earnings per share
Basic earnings per share are calculated by dividing net profit / (loss) for the year by the weighted
average number of shares outstanding in the relevant period. Diluted earnings per share are
calculated based on the if-converted method; the profit/(loss) for the Company divided by the
average number of outstanding shares weighted over the relevant period and the potential number of
shares converted, if the criteria for conversion is fulfilled.
3. Income and Segment Information
Management has defined operating segments as follows:
a) managing chartering of the accommodation unit Haven
b) managing close out of the construction contract for the second vessel including owner
furnished equipment
2011 is the first year with operation for the Group. Accordingly, there is no segment reporting for
2010.
(1.000 EUR) Operation of
Haven Other /
Eliminations SUM
Management fee 2 700 0 2 700
Other income 0 53 53
Total revenue 2 700 53 2 753
Operating expenses -7 572 -1 893 -9 465
Depreciation and impairment 0 -218 -218
Non recurring items 0 -10 602 -10 602
Operating Profit -4 872 -12 661 -17 533
Assets - vessels 304 526 127 556 432 081
Total liabilitites 188 799 98 296 287 095
Management fee is related to the management of “Haven”, other income is related to various sales.
Operating expenses for “Haven” and Other/Eliminations consist of ordinary management cost
including personnel cost, general administration and office expenses.
Non Recurring items in Other/Eliminations consist mainly of construction expenses related to the
second vessel, recognized through profit and loss as a consequence of the cancellation of the
building contract.

46
4. Other operating expenses
(1.000 EUR) 2011 2010
Marketing 148 240
Rental and leasing costs 548
564
Travel costs 743
975
Consultancy fees and external personnel 1 219
6 626
Office and administrative costs 194
365
Prepare for operation of Haven 0
1 064
Other operating costs 11 999
2 372
Total other operating expenses 14 850 12 206
Due to the cancellation of the building contract for the company’s second vessel (L206) in April
2011, the activity level was generally lower in 2011 than in 2010. However, the cancellation of
L206 resulted in all cost associated with ongoing construction and follow up of the vessel
amounting to approximately 10 MEUR was recognized in the income statement in 2011 under
other operating cost.
Specification auditor's fee
(1.000 EUR) 2011 2010
Statutory audit 40 34
Tax and other services 56 78
Total auditor’s fee 96 112
5. Salary and personnel expense and management remuneration
(1.000 EUR) 2011 2010
Salaries and holiday pay 4 197 3 507
Pension costs defined contribution plans 139
253
Other personnel expenses 881 793
Total salaries and personnel expense 5 217 4 554
The average number of man-years employed during the financial year 23,7 28,5
Pension plan The Company has a defined contribution plan, calculated at 5 % of the salary between 1-6 G plus 8
% of the salary between 6-12 G. The contributions recognized as expenses in the income statement
equaled EUR 138.959 in 2011 and EUR 253.000 in 2010.
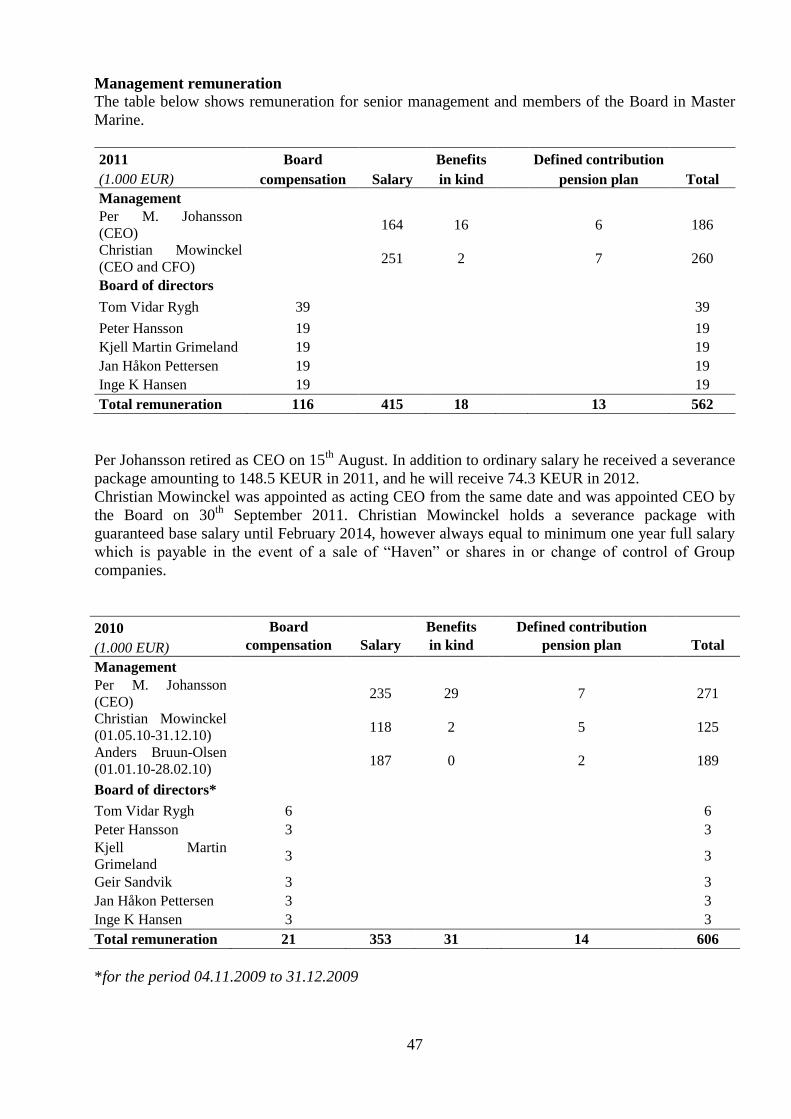
47
Management remuneration
The table below shows remuneration for senior management and members of the Board in Master
Marine.
2011 Board
Benefits
Defined contribution
(1.000 EUR) compensation Salary in kind
pension plan Total
Management
Per M. Johansson
(CEO) 164 16
6 186
Christian Mowinckel
(CEO and CFO) 251 2
7 260
Board of directors
Tom Vidar Rygh 39
39
Peter Hansson 19
19
Kjell Martin Grimeland 19
19
Jan Håkon Pettersen 19
19
Inge K Hansen 19
19
Total remuneration 116 415 18
13 562
Per Johansson retired as CEO on 15th
August. In addition to ordinary salary he received a severance
package amounting to 148.5 KEUR in 2011, and he will receive 74.3 KEUR in 2012.
Christian Mowinckel was appointed as acting CEO from the same date and was appointed CEO by
the Board on 30th
September 2011. Christian Mowinckel holds a severance package with
guaranteed base salary until February 2014, however always equal to minimum one year full salary
which is payable in the event of a sale of “Haven” or shares in or change of control of Group
companies.
2010 Board
Benefits
Defined contribution
(1.000 EUR) compensation Salary in kind pension plan Total
Management
Per M. Johansson
(CEO) 235 29
7
271
Christian Mowinckel
(01.05.10-31.12.10) 118 2
5
125
Anders Bruun-Olsen
(01.01.10-28.02.10) 187 0
2
189
Board of directors*
Tom Vidar Rygh 6
6
Peter Hansson 3
3
Kjell Martin
Grimeland 3
3
Geir Sandvik 3
3
Jan Håkon Pettersen 3
3
Inge K Hansen 3
3
Total remuneration 21 353 31
14
606
*for the period 04.11.2009 to 31.12.2009
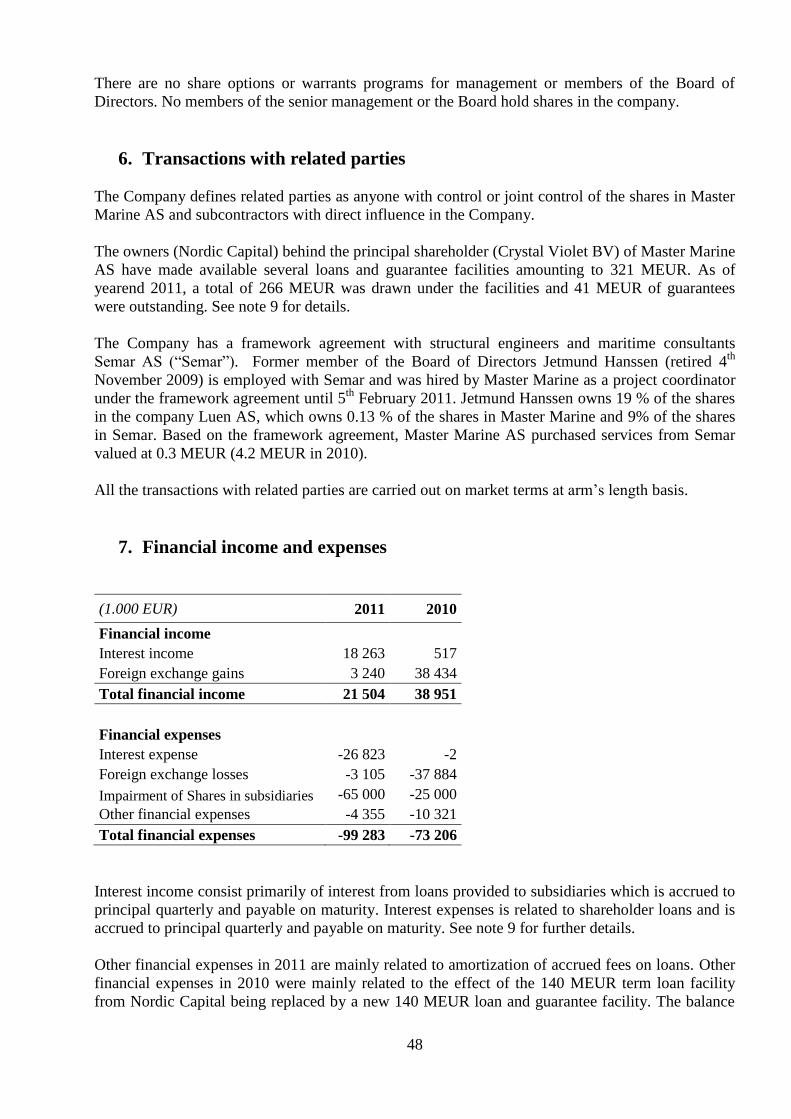
48
There are no share options or warrants programs for management or members of the Board of
Directors. No members of the senior management or the Board hold shares in the company.
6. Transactions with related parties
The Company defines related parties as anyone with control or joint control of the shares in Master
Marine AS and subcontractors with direct influence in the Company.
The owners (Nordic Capital) behind the principal shareholder (Crystal Violet BV) of Master Marine
AS have made available several loans and guarantee facilities amounting to 321 MEUR. As of
yearend 2011, a total of 266 MEUR was drawn under the facilities and 41 MEUR of guarantees
were outstanding. See note 9 for details.
The Company has a framework agreement with structural engineers and maritime consultants
Semar AS (“Semar”). Former member of the Board of Directors Jetmund Hanssen (retired 4th
November 2009) is employed with Semar and was hired by Master Marine as a project coordinator
under the framework agreement until 5th
February 2011. Jetmund Hanssen owns 19 % of the shares
in the company Luen AS, which owns 0.13 % of the shares in Master Marine and 9% of the shares
in Semar. Based on the framework agreement, Master Marine AS purchased services from Semar
valued at 0.3 MEUR (4.2 MEUR in 2010).
All the transactions with related parties are carried out on market terms at arm’s length basis.
7. Financial income and expenses
(1.000 EUR) 2011 2010
Financial income
Interest income 18 263 517
Foreign exchange gains 3 240 38 434
Total financial income 21 504 38 951
Financial expenses
Interest expense -26 823 -2
Foreign exchange losses -3 105 -37 884
Impairment of Shares in subsidiaries -65 000 -25 000
Other financial expenses -4 355 -10 321
Total financial expenses -99 283 -73 206
Interest income consist primarily of interest from loans provided to subsidiaries which is accrued to
principal quarterly and payable on maturity. Interest expenses is related to shareholder loans and is
accrued to principal quarterly and payable on maturity. See note 9 for further details.
Other financial expenses in 2011 are mainly related to amortization of accrued fees on loans. Other
financial expenses in 2010 were mainly related to the effect of the 140 MEUR term loan facility
from Nordic Capital being replaced by a new 140 MEUR loan and guarantee facility. The balance
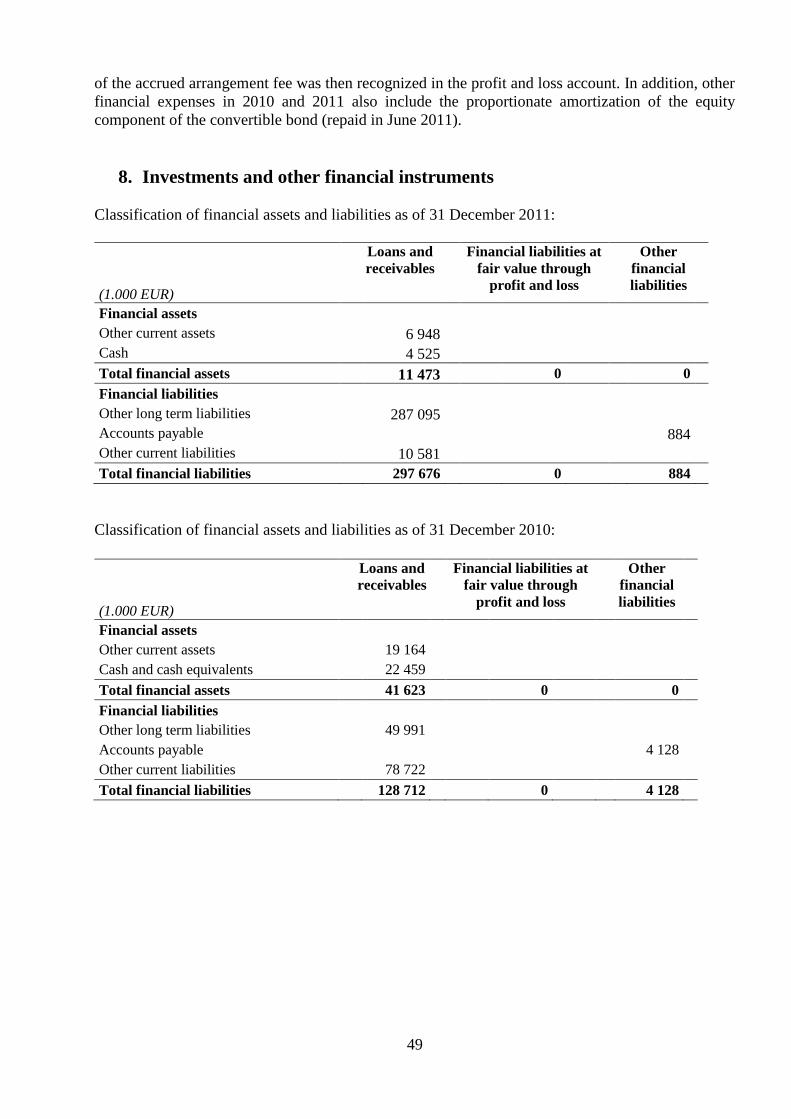
49
of the accrued arrangement fee was then recognized in the profit and loss account. In addition, other
financial expenses in 2010 and 2011 also include the proportionate amortization of the equity
component of the convertible bond (repaid in June 2011).
8. Investments and other financial instruments
Classification of financial assets and liabilities as of 31 December 2011:
(1.000 EUR)
Loans and
receivables
Financial liabilities at
fair value through
profit and loss
Other
financial
liabilities
Financial assets
Other current assets
6 948
Cash
4 525
Total financial assets 11 473 0 0
Financial liabilities
Other long term liabilities
287 095
Accounts payable
884
Other current liabilities
10 581
Total financial liabilities 297 676 0 884
Classification of financial assets and liabilities as of 31 December 2010:
(1.000 EUR)
Loans and
receivables
Financial liabilities at
fair value through
profit and loss
Other
financial
liabilities
Financial assets
Other current assets
19 164
Cash and cash equivalents
22 459
Total financial assets 41 623 0 0
Financial liabilities
Other long term liabilities
49 991
Accounts payable
4 128
Other current liabilities
78 722
Total financial liabilities 128 712 0 4 128

50
9. Loans and Other long-term liabilities
(1.000 EUR) Description Lender
Drawn amount
Principal incl accrued interest
31.12.2011 Book value
140 MEUR Loan and guarantee facility Nordic Capital 85 000 97 849 97 849
10 MEUR Term loan facility Nordic Capital 10 000 10 926 10 926
15 MEUR Term Loan Facility Nordic Capital 15 000 16 391 16 391
86 MEUR Term loan facility Nordic Capital 86 010 90 876 88 272
69,9 MEUR Term loan facility Nordic Capital 69 934 75 278 73 656
Total long-term liabilities 265 944 291 320 287 095
140 MEUR Loan and Guarantee Facility
The facility covers loan facility up to 85.4 MEUR and a guarantee facility up to 54.6 MEUR. The
loan is fully drawn and guarantees of 26 MEUR in favor of ConocoPhillips and 15 MEUR in favor
of bank loan lenders are outstanding. The loan carries a fixed interest at 12% p.a. accruing to
principal on a quarterly basis and payable at maturity. The loan and guarantee facility is secured by
a 2nd
lien mortgage on “Haven” and matures on 31st December 2015.
10 MEUR Term Loan facility and 15 MEUR Term Loan facility
In March 2011 Master Marine AS entered into a loan agreements with the majority shareholder in
the amount of total 25 MEUR to finance additional cost to complete the construction of “Haven”.
The loan carries a fixed interest at 12% p.a. accruing to principal on a quarterly basis and payable at
maturity, is unsecured and matures on 31st December 2015.
86 MEUR Term Loan facility
In April 2011 Master Marine AS entered into a loan agreement with the majority shareholder in the
amount of 67.4 MEUR, increased in July 2011 to 86 MEUR, to finance additional cost to complete
the construction of “Haven”. The loan carries a fixed interest at 15% p.a. accruing to principal on a
quarterly basis and payable at maturity, and matures on 31st December 2014. The loan is secured
through assignment of monetary claims related to refund guarantees issued for L206 and owner
furnished equipment as well as the account receivables in Master Marine AS.
69.9 MEUR Term Loan facility
In June 2011Master Marine AS entered into a loan agreement with the majority shareholder in the
amount of 69.9 MEUR to refinance an existing bond loan which was due for repayment. The loan
carries a fixed interest at 15% p.a. accruing to principal on a quarterly basis and payable at maturity,
is secured with 3rd
lien mortgage on the “Haven” and matures 14 days after final maturity date for
the 155 MEUR bank loan (36, 48 or 60 months after commencement of the ConocoPhillips charter
contract, pending exercise of extension options).
10. Financial Instruments and Risk Management
Risk Management Overview
The Company is exposed to a number of different financial market risks arising from the
Company’s normal business activities. Financial market risk is the possibility that fluctuations in
currency exchange rates or interest rates will affect the value of the Company’s assets, liabilities or
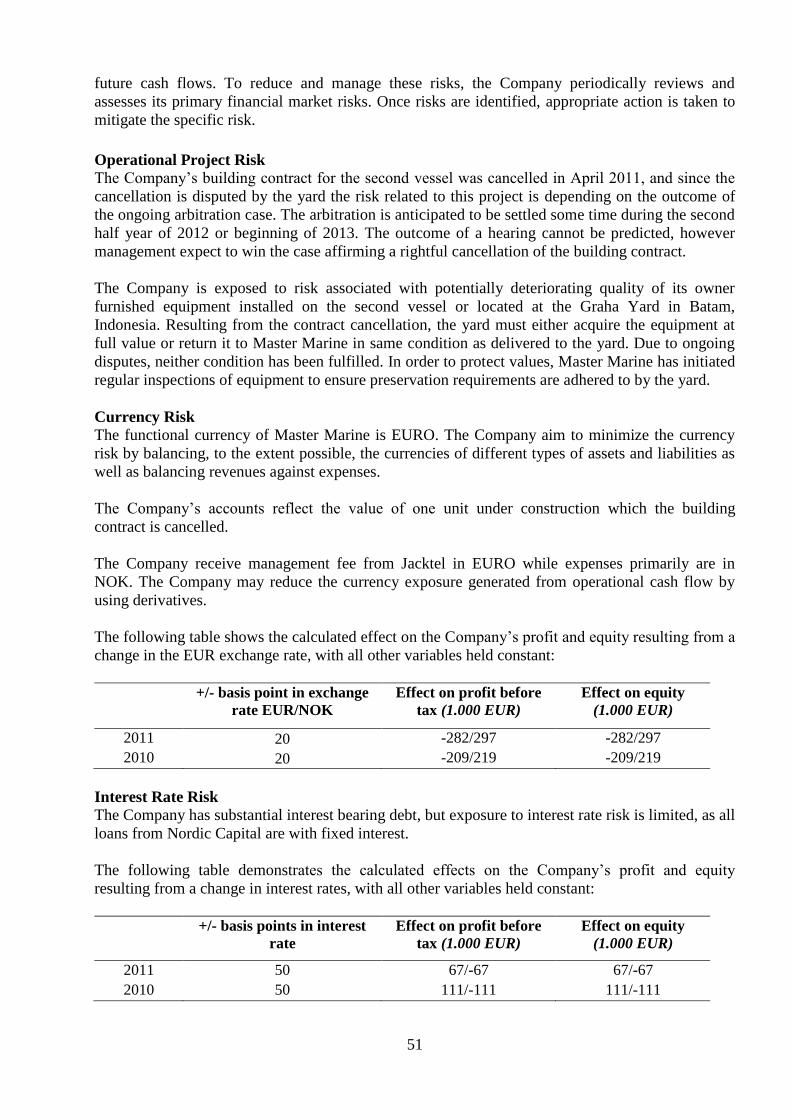
51
future cash flows. To reduce and manage these risks, the Company periodically reviews and
assesses its primary financial market risks. Once risks are identified, appropriate action is taken to
mitigate the specific risk.
Operational Project Risk
The Company’s building contract for the second vessel was cancelled in April 2011, and since the
cancellation is disputed by the yard the risk related to this project is depending on the outcome of
the ongoing arbitration case. The arbitration is anticipated to be settled some time during the second
half year of 2012 or beginning of 2013. The outcome of a hearing cannot be predicted, however
management expect to win the case affirming a rightful cancellation of the building contract.
The Company is exposed to risk associated with potentially deteriorating quality of its owner
furnished equipment installed on the second vessel or located at the Graha Yard in Batam,
Indonesia. Resulting from the contract cancellation, the yard must either acquire the equipment at
full value or return it to Master Marine in same condition as delivered to the yard. Due to ongoing
disputes, neither condition has been fulfilled. In order to protect values, Master Marine has initiated
regular inspections of equipment to ensure preservation requirements are adhered to by the yard.
Currency Risk
The functional currency of Master Marine is EURO. The Company aim to minimize the currency
risk by balancing, to the extent possible, the currencies of different types of assets and liabilities as
well as balancing revenues against expenses.
The Company’s accounts reflect the value of one unit under construction which the building
contract is cancelled.
The Company receive management fee from Jacktel in EURO while expenses primarily are in
NOK. The Company may reduce the currency exposure generated from operational cash flow by
using derivatives.
The following table shows the calculated effect on the Company’s profit and equity resulting from a
change in the EUR exchange rate, with all other variables held constant:
+/- basis point in exchange
rate EUR/NOK
Effect on profit before
tax (1.000 EUR)
Effect on equity
(1.000 EUR)
2011 20 -282/297 -282/297
2010 20 -209/219 -209/219
Interest Rate Risk
The Company has substantial interest bearing debt, but exposure to interest rate risk is limited, as all
loans from Nordic Capital are with fixed interest.
The following table demonstrates the calculated effects on the Company’s profit and equity
resulting from a change in interest rates, with all other variables held constant:
+/- basis points in interest
rate
Effect on profit before
tax (1.000 EUR)
Effect on equity
(1.000 EUR)
2011 50 67/-67 67/-67
2010 50 111/-111 111/-111

52
Credit Risk
It is the Company’s policy only to make deposits and trade financial instruments with first class
financial institutions with investment grade rating and credit risk associated with this activity is
considered to be insignificant.
Receivable are limited and monitored on an ongoing basis with the result that the Company’s
exposure to potential bad debts is not significant. No receivables are classified as bad debt. The
maximum exposure is the carrying amount as disclosed in note 14.
In connection with the Company’s construction project, substantial prepayments have been made to
the shipyard. All prepayments to the yard are covered by refund guarantees from reputable
international banks with acceptable investment grade rating. The credit risk associated with the
refund guarantees is hence considered to be limited and acceptable. Total prepayments amounting
to 85.1 MEUR are secured by refund guarantees amounting to 93.4 MEUR (incl interest).
Prepayments are recognized in the balance sheet under vessels, plant and equipment.
Liquidity Risk
As the building contract for the vessel is cancelled, the Company`s liquidity risk is mainly related to
the maturity profile of the company`s financial liabilities. In a longer perspective, Master Marine
must restructure its subordinated debt in order to avoid unsustainable deterioration of its equity base
and should also seek to spread maturities over a wider period of time.
The table below summarizes the maturity profile of the Company’s financial liabilities:
At 31.12.2011 Less than
3 months
3 to 12
months
1 to 5
years
Over 5
years Total
(1.000 EUR)
Vessels under construction 374
591
965
Shareholder loans
291 320
291 320
Trade and other payables 1 025 1 025
At 31.12.2010 Less than
3 months
3 to 12
months
1 to 5
years
Over 5
years
Total
(1.000 EUR)
Vessels under construction 39 164
38 417
77 581
Convertible bond
67 898
67 898
Facility from Nordic Capital
50 000
50 000
Trade and other payables 2 315 2 315
The Company manages its excess liquidity from loan and equity with low risk placements. All
financial capital is currently placed on deposits with fist class banks with investment grade rating.
Financial instrument or derivatives risk
The Company uses derivatives to manage its financial risks, including spot contracts for buying and
selling currencies. Spot contracts were mostly to sell EUR and buy NOK to pay expenses for
running the offices and supplies and services from various Norwegian contractors or vendors.

53
Financial assets and liabilities risk
Set out below is a comparison by category for carrying amounts and fair values of all of the
Company's financial assets and liabilities that are carried in the financial statements. The estimated
fair value amounts have been determined by management, using appropriate market information
and valuation methodologies. The carrying amount of cash and cash equivalents is a reasonable
estimate of their fair value. The difference between carrying value and fair value on long term
liabilities as of 31st December, 2011 is related to amortization of fees on loans.
31.12.2011
(1.000 EUR)
Fair value Carrying
value
Other current assets 6 948
6 948
Cash and cash equivalents 4 525
4 525
Total financial assets 11 473 11 473
Long term liabilities 291 320
287 095
Accounts payable 884
884
Other current liabilities 10 581
10 581
Total financial liabilities 302 785 298 560
31.12.2010
(1.000 EUR)
Fair value Carrying
value
Other current assets 19 164
19 164
Cash and cash equivalents 22 459
22 459
Total financial assets 41 623 41 623
Long term liabilities 49 991
49 991
Accounts payable 4 128
4 128
Other current liabilities 82 095
78 722
Total financial liabilities 136 214 132 841
11. Income tax (1.000 EUR) 2011 2010
Tax payable 0
0
Changes in deferred tax 0
0
Income tax expense 0 0
Tax payable for the year 0
0
Correction of previous years current income taxes 0
0
Total tax payable 0 0
Reconciliation of the effective rate of tax and nominal tax rate applicable to Master Marine AS:

54
(1.000 EUR) 2011 2010
Pre-tax profit/(loss) -95 312 -37 043
Expected income taxes according to income tax rate 28 % -26 687 -10 372
Non deductable expenses 18 210 7 013
Non-taxable income 0 0
Deferred tax asset from losses carried forward not recognized in balance sheet 8 846 4 374
Other -369 -1 015
Income tax expense 0 0
Deferred tax and deferred tax assets:
(1.000 EUR) 2011 2010
Deferred tax assets
Long term liabilities at amortized cost -1 183 0
Vessels, plant and equipment 9 882 9 526
Deferred taxation on profits and losses 6 317 7 837
Provisions 0 0
Tax losses carried forward 23 346 12 152
Net unrecognized deferred tax assets/(liabilities) 38 362 29 515
The Company has a total tax loss carried forward of 83 MEUR as at 31 December 2011 (2010: 49
MEUR) without any expiration date.
12. Non-current assets
Vessels, plant and equipment
2011 2010
(1.000 EUR)
Vessels under
construction
Other
fixed
assets
Total Vessels under
construction
Other
fixed
assets
Total
Accumulated cost 1 January 164 940 612 165 552 322 216 304 322 520
Realisation 0 0 0 0 0 0
Additions 2 180 0 2 180 29 758 308 30 066
Disposals 0 -546 -546 -187 034
-187 034
Accumulated cost 31 December 167 120 66 167 186 164 940 612 165 552
Accumulated depreciation
1 January -40 000 -240 -40 240 -6 711 -125 -6 836
Disposals 0 0 0 6 711 0 6 711
Depreciation 0 218 218 0 -115 -115
Impairment * 0 0 0 -40 000 0 -40 000
Accumulated depreciation and
impairment 31 December -40 000 -22 -40 022 -40 000 -240 -40 240
Carrying value 31 December 127 120 44 127 164 124 940 372 125 313

55
Depreciation of other assets is based on the economic life of the asset using a linear depreciation
method. Sale of other fixed asset like computer, company car and furniture has resulted in a
reduction in other fixed assets during 2011.
Following the transfer of the “Haven” accommodation unit to the subsidiary Jacktel AS in April
2010, the Company’s main asset is one vessel under construction although the construction contract
was cancelled in April 2011. See note 19 for details.
The capitalized amount on the unit includes:
(1.000 EUR) 2011 2010
Construction contracts (yard and others) 2 180 10 598
Project management and engineering costs 0
9 982
Financial items 0
9 178
Capitalized amounts on the units for the year 2 180 29 758
In 2007 the Company entered into two lump sum construction contracts with Labroy Offshore Ltd
(subsequently acquired by and becoming a subsidiary of Dubai Drydocks World) for the building of
two multipurpose jack-up construction vessels. In 2010 one of the two construction contracts was
transferred to subsidiary Jacktel AS.
The building contract for the second vessel was cancelled in April 2011. All prepayments to the
yard were secured by refund guarantees from first class banks located in Singapore and, subsequent
to year end, have been repaid to Master Marine. See note 20 for further details. All Owner
Furnished Equipment ("OFE") for the second vessel remain the property of Master Marine AS.
Impairment
At each reporting date, an assessment is made according to IAS 36.9, on whether internal or
external information indicates a potential fall in the value of non-current assets. The Company has
carried out an impairment test for the L206 vessel based on assumptions and projections at the time
of approving the financial accounts of 2011.
The building contract was cancelled on 12 April 2011. There are ongoing legal proceedings in order
to determine whether the cancellation was rightful or wrongful. The book value reflects expected
recoverable amount, given that the cancellation was rightful. The valuation is based on the value of
refund guarantees and estimated recoverable amount on owner furnished equipment. The remaining
book value as of December 2011 is 127 MEUR.
Shares in subsidiaries
Master Marine AS holds 100 % of the shares in Jacktel AS and Service Jack AS. The value of the
shares in Jacktel AS was written down with 65 MEUR with a corresponding reduction in equity due
to a substantial loss in Jacktel AS.
Master Marine Crewing AS was merged into Master Marine AS, effective from January 1, 2011.
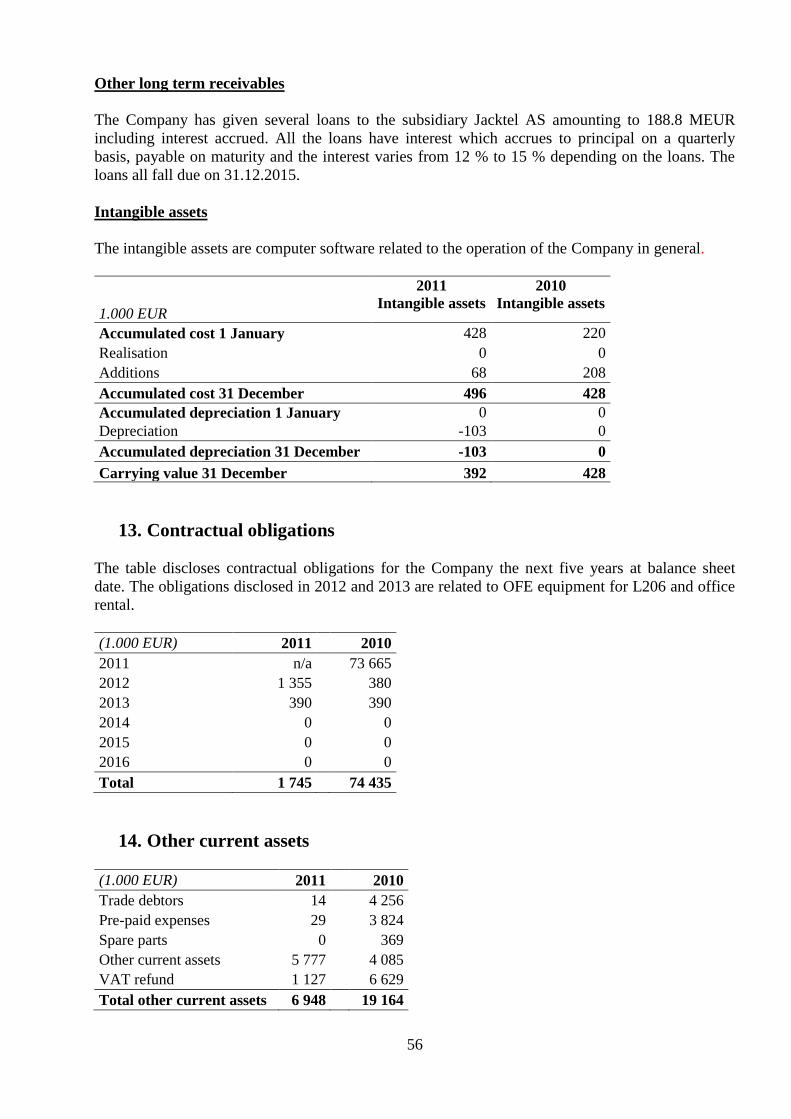
56
Other long term receivables
The Company has given several loans to the subsidiary Jacktel AS amounting to 188.8 MEUR
including interest accrued. All the loans have interest which accrues to principal on a quarterly
basis, payable on maturity and the interest varies from 12 % to 15 % depending on the loans. The
loans all fall due on 31.12.2015.
Intangible assets
The intangible assets are computer software related to the operation of the Company in general.
1.000 EUR
2011
Intangible assets
2010
Intangible assets
Accumulated cost 1 January 428 220
Realisation 0 0
Additions 68 208
Accumulated cost 31 December 496 428
Accumulated depreciation 1 January 0 0
Depreciation -103 0
Accumulated depreciation 31 December -103 0
Carrying value 31 December 392 428
13. Contractual obligations
The table discloses contractual obligations for the Company the next five years at balance sheet
date. The obligations disclosed in 2012 and 2013 are related to OFE equipment for L206 and office
rental.
(1.000 EUR) 2011 2010
2011 n/a
73 665
2012 1 355
380
2013 390
390
2014 0
0
2015 0
0
2016 0
0
Total 1 745 74 435
14. Other current assets
(1.000 EUR) 2011 2010
Trade debtors 14 4 256
Pre-paid expenses 29
3 824
Spare parts 0
369
Other current assets 5 777
4 085
VAT refund 1 127
6 629
Total other current assets 6 948 19 164

57
Other current asset consist amongst other of an outstanding insurance claim under the yard’s
Construction All Risk insurance policy in relation to the riot which caused damage to some of the
Company’s equipment stored at the Batam yard.
15. Cash
The Cash balance at year end 2011 was 4.5 MEUR (2010: 22.5 MEUR). Restricted cash amounts to
0.3 MEUR in 2011 (2010: 1.0 MEUR).
16. Earnings per share
The basic earnings per share are calculated as the ratio of the profit/ (loss) for the year attributable
to shareholders divided by the weighted average number of ordinary shares outstanding during the
financial year.
(1.000 EUR) 2011 2010
Average number of shares outstanding 2 150 754 967
2 150 754 967
Effect of dilutive potential ordinary shares:
Convertible bonds
465 054 631
Diluted average number of shares
outstanding 2 150 754 967 2 615 809 598
Profit /(loss) -95 312 102 -37 042 986
Earnings per share: 2011
2010
- Basic -0,04
-0,02
- Diluted -0,04 -0,02
Warrants issued (see note 17 for details) are out of-the-money as of 31 December 2011 as well as
the reporting date, and therefore does not affect the calculations of dilutive earnings per share.
17. Share capital and shareholder information
Number of shares:
No. of shares
2011 2010
Ordinary shares
At 1 January 2 150 754 967 2 150 754 967
Share issues 0 0
At 31 December 2 150 754 967 2 150 754 967
All issued shares have equal voting rights and the right to receive dividend. Nominal value per
share is NOK 0.10. For calculation of earnings per share and diluted earnings per share see note 16.

58
The 20 largest shareholders as of 31December2011 are:
Name Account type
Contry of origin
Number of shares
Owner interest
CRYSTAL VIOLET BV NLD 1 736 518 874 80,74 %
RECTOR MARINUS INVEST AS NOR 139 757 374 6,50 %
GOLDMAN SACHS INT. - EQUITY - NOM GBR 70 000 000 3,25 %
BANK OF NEW YORK MELLON SA/NV NOM BLG 40 311 335 1,87 %
DEUTSCHE BANK AG LONDON NOM GBR 33 860 632 1,57 %
CLEARSTREAM BANKING S.A. NOM LUX 13 938 627 0,65 %
UBS AG, LONDON BRANCH NOM GBR 12 501 133 0,58 %
CANICA AS NOR 10 105 833 0,47 %
OPPENHEIMER QUEST INTL VALUE USA 9 994 100 0,46 %
LABROY MARINE LTD. SGP 8 726 400 0,41 %
PARETO GROWTH AS NOR 8 165 403 0,38 %
SIRIUS SECURITIES AS NOR 5 093 333 0,24 %
PARETO ENERGY SOLUTIONS AS
NOR 3 878 000 0,18 %
FREYER HOLDING AS NOR 3 612 000 0,17 %
TANJA A/S NOR 3 583 333 0,17 %
PATRONIA AS NOR 3 509 000 0,16 %
WIECO INVEST AS NOR 3 509 000 0,16 %
WIESE NOR 3 240 500 0,15 %
OSLO PENSJONSFORSIKRING AS PM NOR 3 168 000 0,15 %
TOLLEFSEN NOR 2 916 667 0,14 %
Total 20 largest shareholders 2 116 389 544 98,40 %
Other
34 365 423 1,60 %
Total shares 2 150 754 967 100,00 %
*Crystal Violet BV is a company controlled by Nordic Capital Fund IIV.
In 2007 the Group issued warrants to all shareholders on a pro rata basis, 5 925 000 in total, vesting
in 2010, 2011 and 2012 respectively (1/3 each year). The subscription price is NOK 12.50. The
actual number of shares that may be subscribed varies, depending on the share price during the
relevant subscription period. If the volume weighted average share price during the relevant
subscription period is lower than NOK 14.00 (equal to 11.99% above the subscription price), no
warrants can be exercised.
18. Accounts payable and other current liabilities
(1.000 EUR) 2011 2010
Trade accounts payables 884 4 128
Government taxes, tax deductions etc. 33 0
Other short term liabilities 10 548 78 722
Total 11 465 82 850

59
Other short term liabilities consists of accrued unpaid interest on loans and various offset for cost
incurred, but not paid. Other short term liabilities for 2010 consist amongst other of the convertible
bond loan (67.9 MEUR) which matured in June 2011 (and was repaid) in June 2011.
19. Legal disputes
The Company has identified the following significant matters or disputes with third parties:
Labroy Offshore Ltd (a subsidiary of Drydocks World, Dubai) disputed the cancellation of the
construction contract between Master Marine and Labroy Offshore for the second jack up vessel
currently under construction at Batam, Indonesia and initiated arbitration proceedings in
Singapore. Master Marine believes that Labroy Offshore will have no case to dispute the
cancellation. Subsequent to year end, the Tribunal has agreed to bifurcate the proceedings. For
further details, see note 20.
In April 2011, Master Marine made payment demands under the refund guarantees issued by
three prime Singapore banks to recover prepayments made to Labroy Offshore under the above
construction contract. In June 2011 the Singapore Court approved an injunction filed by Labroy
Offshore to prevent payment by the banks under the refund guarantees. Master Marine
immediately appealed the decision and the case was heard by the Appeal Court in February 2012
with a favourable outcome for Master Marine. For further details, see note 20.
20. Events after the balance sheet date
Master Marine’s appeal of the Singapore Court’s decision in June 2011 to grant an injunction
preventing banks from paying out under the refund guarantees was subject to a final Appeal Court
hearing in Feb 2012. In April 2012, the Appeal Court decided in Master Marine’s favor and
discharged the injunction. The full amount of 93.9 MEUR was subsequently received in Master
Marine’s bank account.
Following the favourable decision on refund guarantees by the Singapore Appeal Court and at
Master Marine’s request, Labroy Offshore and the Singapore Tribunal agreed to bifurcate or split
the ongoing arbitration proceedings related to whether or not the construction contract was
rightfully cancelled. In essence, this decision allows for the Tribunal to hear the case on the basis of
whether or not the contract was rightfully cancelled due to inadequate refund guarantees and will
leave out the issue of whether the contract was rightfully cancelled due to construction delay. This
approach will narrow down the issue at hand. The Tribunal has adopted a shorter timeline, requiring
both parties to submit their statements and responses by late July 2012. Management expects the
hearing to be scheduled for some time during the 3rd
quarter 2012.
60
61
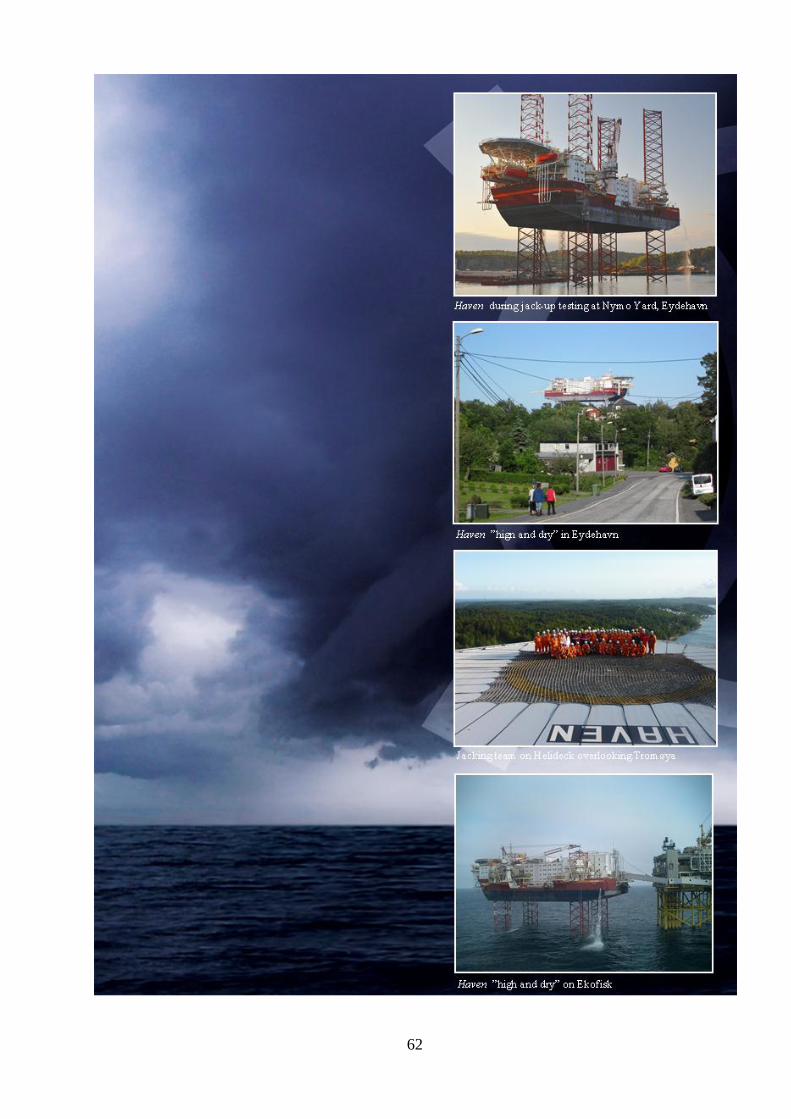
62

63