Embed Size (px)
Citation preview

1
Stock-flow adjustment (SFA) for the Member States, the euro area and the EU28 for the period 2013-2016, as reported in the
April 2017 EDP notification
The main factors contributing to changes in government debt other than government
deficit/surplus (stock-flow adjustment)
The stock-flow adjustment (SFA) explains the difference between the change in government debt and the government deficit/surplus for a given period. Although SFAs generally have legitimate explanations, they are closely monitored by Eurostat during quality checks of data for the excessive deficit procedure (EDP)
1, to ensure
adherence to statistical rules and consistency across the reported data.
Conceptually, the stock-flow adjustment can be broken down into the following categories: net acquisition of financial assets, debt adjustment effects and statistical discrepancies. The main purpose of this note is to explain the individual elements of the SFA and analyse their patterns and trends.
Countries with an exceptionally large SFA in absolute terms deserve particular attention, even though these values normally have appropriate explanations. Close consideration should also be given to large but offsetting values.
Figure 1 shows the 2016 SFA for each Member State, together with the government deficit/surplus (reversed sign) and the change in government debt, expressed as a percentage of GDP. Three countries exhibit an SFA larger than 3% of GDP in absolute terms: Bulgaria (4.7%), Latvia (4.6%) and Portugal (3.1%).
In all three cases, while other factors also contributed to it, the large positive SFAs are mainly explained by increases in Currency and deposits (F.2), due to government issuing debt securities.
1 Council Regulation 479/2009 requires the prompt and regular reporting of deficit and debt data by Member States to Eurostat. For definitions of government deficit and debt, and of consolidation, see the Methodological Annex.
Figure 1: Government deficit/surplus (reversed sign), change in government debt and stock-flow adjustment in percent of GDP: 2016 figures
-4 -2 0 2 4 6
-4 -2 0 2 4 6
UK
SE
FI
SK
SI
RO
PT
PL
AT
NL
MT
HU
LU
LT
LV
CY
IT
HR
FR
ES
EL
IE
EE
DE
DK
CZ
BG
BE
Euro area
EU 28
General government (S.13) deficit/surplus (reversed sign)
Stock-flow adjustment (SFA)
Change in general government (S.13) consolidated gross debt

2
Introduction
It is widely known that deficits contribute to an increase in debt levels, while surpluses reduce them. However, as Figure 1 shows, the change in government debt also reflects other elements. A positive SFA means that the government debt increases more than the annual deficit (or decreases less than implied by the surplus). A negative SFA means that the government debt increases less than the annual deficit (or decreases more than implied by the surplus).
SFAs have legitimate accounting explanations. The change in the stock of debt does not originate only from the deficit but could be affected, for example, by loans granted by government or by equity injections into corporations, which do not appear in the deficit figures. The importance of the SFA has been emphasized many times, since efficient statistical monitoring of fiscal performance requires a good understanding of the relationship between the two key fiscal indicators – government deficit and debt. Closely monitoring SFAs can also highlight data quality problems: governments might, for example, have an incentive to understate their deficits by reporting transactions as part of the SFA.
Figure 2: Evolution of change in debt and annual deficit in the EU28 as a percentage of GDP, 2013-2016
Figure 2 shows the evolution of the EU28 SFAs (measured as the gap between the two lines): -0.06% of GDP in 2013, 0.05% of GDP in 2014, -0.9% of GDP in 2015 and -0.1% of GDP in 2016. This trend indicates a slowdown in the EU28 government debt accumulation, which returned in 2016 back in line with the reduction in the EU28 deficit.
Table 1 shows the SFAs for the years 2013-2016, as percentage of GDP. The last column shows average SFAs over the last four years, indicating whether SFAs offset each other over time (with average SFAs at close to zero).
While the majority of the annual SFAs reported by countries for 2013 and 2015 were negative, the reverse
was true in 2014. In 2016 fourteen countries reported positive SFAs and as many negative ones. Large negative SFAs can be observed for Greece for the EDP reporting periods between 2013-2015. Substantial negative SFAs can also be seen for Denmark and Latvia in 2015 and for Ireland, Cyprus, and Poland in 2014.
On the other hand, large positive SFAs, exceeding 4% of GDP, are reported by Bulgaria and Latvia for 2016, Bulgaria, Slovenia and Sweden for 2014, Croatia and Cyprus for 2013. Luxembourg, Malta and Sweden reported positive SFAs for all four years.
More than half of the annual SFAs observed for the Member States over 2013-2015 exceed 1% of GDP, in absolute values. For a majority of Member States in 2014, for eight Member States in 2013, nine in 2015 and 2016 the SFAs exceed 2% of GDP in absolute values.
Table 1: Stock-flow adjustment, in percent of GDP, 2013-2016
2013 2014 2015 2016 average
EU 28 -0.1 0.1 -0.9 -0.1 -0.3
Euro area 0.1 0.0 -1.0 -0.3 -0.3
BE -0.7 0.4 -0.7 0.2 -0.2
BG 0.0 4.8 -1.1 4.7 2.1
CZ -0.4 -2.4 -0.3 -1.1 -1.1
DK -1.0 2.4 -4.7 -2.1 -1.3
DE -0.7 0.3 -0.3 0.2 -0.1
EE 0.8 1.6 -0.3 0.0 0.5
IE -2.8 -9.9 -2.7 -0.9 -4.1
EL -4.6 -4.1 -10.5 2.6 -4.2
ES 1.5 0.0 -2.1 -1.6 -0.5
FR 0.0 0.0 -0.8 -1.2 -0.5
HR 6.0 -1.3 -1.8 -1.0 0.5
IT 2.1 1.1 -0.5 0.3 0.7
CY 11.9 -7.1 -0.4 2.2 1.7
LV -1.6 1.7 -4.4 4.6 0.1
LT -1.8 2.8 2.8 -0.8 0.8
LU 3.8 2.0 1.6 0.7 2.0
HU -0.4 2.4 1.1 -0.4 0.7
MT 2.3 0.1 0.9 2.5 1.4
NL -0.3 -1.0 -3.5 -0.6 -1.3
AT -0.7 2.3 2.3 -0.1 1.0
PL -1.2 -6.9 0.5 2.3 -1.3
PT -0.6 -3.5 -1.3 3.1 -0.6
RO 0.9 2.0 0.2 -1.0 0.5
SI 1.9 7.2 1.9 -2.8 2.0
SK 0.9 -2.5 -2.0 -0.7 -1.1
FI 0.9 1.2 1.9 -0.7 0.8
SE 2.1 5.0 1.6 0.5 2.3
UK -1.3 0.1 -1.1 0.4 -0.5
The following sections present the individual components of the SFAs, focusing at the same time at large transactions reported by the Member States.
1.0
1.5
2.0
2.5
3.0
3.5
2013 2014 2015 2016
Net borrowing(+)/lending(-) (B.9) of general government (S.13)
Change in general government (S.13) consolidated gross debt

3
Components of the stock-flow adjustment – Factors contributing to the general government debt
The SFA is made up of 17 elements. This note presents them grouped into main categories. Table 2 presents the SFA elements, as reported to Eurostat by Member States, showing EU28 figures for 2013-2016. Table 3, at the end of this document, details the SFA of each Member State for each year over the period 2013-2016. Its columns are numbered and cross-references to the data are included throughout the text in brackets.
The starting point of the analysis is the Net lending/net borrowing, or Surplus/deficit level (with reverse sign: a deficit is displayed with a positive sign, a surplus with a negative sign) and its contribution to the change in general government debt.
The first SFA category is called Net acquisition of financial assets. These adjustments appear here because financial transactions in assets are not contributing to the deficit, but they lead to increases or decreases in the stock of debt.
A second category of SFAs, called Adjustments, includes three sub-categories. The first one includes transactions in those liabilities that are excluded from the government debt definition (Financial derivatives
(F.71), Other accounts payable (F.8) and Other liabilities (F.1, F.5, F.6 and F.72)).
The second sub-category comprises valuation effects, as shown in the next three lines (Issuances above/below nominal value, Difference between interest (D.41) accrued and paid and Redemptions of debt above/below nominal value), reflecting the fact that government debt, defined in Council Regulation 479/2009, is measured at face value.
The third sub-category includes the Appreciation/depreciation of foreign-currency debt, reflecting the impact of changes in exchange rates on those government debt components that are denominated in foreign currencies, taking into account hedging activities. Finally, other changes in volume (Changes in sector classification (K.61), and Other volume changes in financial liabilities (K.3, K.4, K.5)) mainly arise from the reclassification of units inside or outside general government or other rare cases of extinguishment of debt that are not reflected in the deficit/surplus.
The third category is the Statistical discrepancy, which reflects differences arising from the diversity of data sources and might also indicate problems with the quality of data.
Table 2: Stock-flow adjustment items for the EU28, in million euro, 2013-2016
EU-28
April 2017 EDP notification 2013 2014 2015 2016
Net borrowing(+)/lending(-)(B.9) of general government (S.13)* 447,466 418,431 349,274 251,141
Net acquisition (+) of financial assets (1, 2) -49,139 52,183 -77,751 60,986
Currency and deposits (F.2) -53,045 48,172 -6,219 31,657
Debt securities (F.3) -28,117 -19,653 -10,875 9,699
Loans (F.4) (1, 2) 17,446 -2,020 -28,043 13,853
Increase (+) 144,977 114,227 109,129 101,463
Reduction (-) -127,531 -116,247 -137,171 -87,610
Short term loans (F.41), net -2,618 1,817 -853 257
Long-term loans (F.42) 20,064 -3,837 -27,190 13,596
Increase (+) 133,733 100,718 93,425 91,884
Reduction (-) -113,669 -104,554 -120,615 -78,288
Equity and investment fund shares/units (F.5) -3,691 -11,847 -39,340 970
Portfolio investments, net -7,268 -1,968 -3,046 11,314
Equity and investment fund shares/units other than portfolio investments 3,578 -9,879 -36,293 -10,342
Increase (+) 88,361 70,327 39,146 36,605
Reduction (-) -84,783 -80,206 -75,438 -46,947
Financial derivatives (F.71) -5,335 -4,238 -14,031 -7,865
Other accounts receivable (F.8) 23,532 41,535 21,045 15,179
Other financial assets (F.1, F.6) 72 235 -288 -2,507
Adjustments (1) 40,043 -28,669 -40,775 -59,013
Net incurrence (-) of liabilities in financial derivatives (F.71) 2,533 12,057 19,120 15,022
Net incurrence (-) of other accounts payable (F.8) 14,859 -55,038 -26,806 -20,226
Net incurrence (-) of other liabilities (F.1, F.5, F.6 and F.72) -4,256 -5,053 -5,301 -5,414
Issuances above(-)/below(+) nominal value -15,658 -36,461 -79,601 -71,128
Difference between interest (D.41) accrued(-) and paid(+) 7,955 10,061 18,787 15,446
Redemptions/repurchase of debt above(+)/below(-) nominal value 1,894 3,597 5,501 3,780
Appreciation(+)/depreciation(-) of foreign-currency debt (2) (3) -3,578 22,346 18,099 6,647
Changes in sector classification (K.61) (+/-) 31,715 20,241 9,524 -1,823
Other volume changes in financial liabilities (K.3, K.4, K.5)(-) 4,579 -420 -98 -1,317
Statistical discrepancies 647 -16,201 -15,284 -19,076
Difference between capital and financial accounts (B.9-B.9f) 523 -9,325 -9,413 -8,686
Other statistical discrepancies (+/-) : : : :
Change in general government (S.13) consolidated gross debt (1, 2) ** [the last item of the core table] 439,018 425,746 215,464 234,040
Memorandum item [1=2+3]: overall aggregation effect** 99,243 139,904 -339,618
Memorandum item [2]: consolidation of intergovernmental lending (igl) effect** -9,812 9,314 641
Memorandum item [3]: forex aggregation effect** 109,054 130,590 -340,259
Memorandum item [4]: Change in the stock of aggregated (consolidated for IGL) general government debt** 524,989 355,368 -105,578
Memorandum item [5]: Stock of aggregated (consolidated for IGL) general government debt** 11,618,023 12,143,012 12,498,380 12,392,803(1) Consolidated within general government of a Member State [but not for intergovernmental lending between the EU28 Member States].
(2) Intergovernmental lending (igl) not consolidated in this line.
(3) Due to exchange-rate movements, taking into account hedging activities.
*Please note the sign convention in this table for net borrowing / net lending: a positive entry reflects a deficit, a negative entry reflects a surplus.
** Aggregated data for EU28 are calculated from the nominal figures sent by Member States to Eurostat, using an average exchange rate in the core table (for transactions and other adjustments), but using an end of
period exchange rate for the memorandum items [4] and [5], as it is appropriate for conversion of the end-year debt stock. As a consequence, the aggregation of "Change in general government (S.13) consolidated
gross debt" for 28 EU Member States [the last item of the core table] is not the same as the "change in the stock of aggregated (consolidated for IGL) general government debt" [memorandum item [4]], for the EU28
aggregate, owing to: i) the impact of intergovernmental lending [memorandum item [2]] and ii) different annual exchange rates used (for conversion of flows and for stocks), when the data are converted in euro
[memorandum item [3]].
It should be noted that the core table does not consolidate intergovernmental lending (igl), neither for the item "Loans (F.4)" [assets] nor "Change in general government (S.13) consolidated gross debt".

4
Net lending (+) / net borrowing (-) (B.9)
The basic factor contributing to the change in government consolidated gross debt is generally the deficit or surplus of the general government sector (column (1) in table 3). Figure 3 illustrates deficits/surpluses in 2013-2016, sorted in descending order of the deficit level in 2016. In 2016, twelve countries registered a government surplus, of which the largest ones are Luxembourg (1.6%) and Malta (1.0%), whilst the lowest government deficits as percentage of GDP were recorded in Ireland (-0.6%), Croatia (-0.8%) and Denmark (-0.9%). Luxembourg alone reported a surplus in each of the four years 2013-2016. Four Member States had deficits equal or higher than 3% of GDP in 2016: Spain (-4.5%), France (-3.4%), Romania (-3.0%) and the United Kingdom (-3.0%). In the euro area the government deficit to GDP ratio decreased from -3.0% in 2013 to -1.5% in 2016, and in the EU28 from -3.3% to -1.7%. The euro area deficit remained below that of the EU28 during the whole reporting period, however, their trends are slowly converging. While decreasing over the period 2013-2016, the highest deficit for 2016 was reported by Spain. Over the entire period 2013-2016, Slovenia reported the highest deficit (-15.1% of GDP in 2013, mostly due to bank recapitalisations), closely followed by Greece (2013, -13.1% of GDP).
Figure 3: Net lending (+)/net borrowing (-) in percent of GDP, 2013-2016
-15 -12 -9 -6 -3 0 3
ES
FR
RO
UK
BE
IT
PL
PT
FI
HU
SI
EU28
SK
AT
Euro area
DK
HR
IE
LV
BG
LT
EE
CY
NL
CZ
EL
DE
SE
MT
LU
2013
2014
2015
2016

5
Net acquisition of financial assets
The net acquisition of financial assets is generally the main factor in the SFA. It reflects the acquisition less disposal of financial assets held by the general government sector in the form of Currency and deposits (F.2), Debt securities (F.3), Loans granted by government to non-governmental units (F.4), Equity and investment fund shares/units (F.5), Financial derivatives (F.71), Other accounts receivable (F.8) and Other financial assets (Monetary gold and SDRs (F.1) and Insurance technical reserves (F.6)).
Transactions in financial assets are reported on a consolidated basis, i.e. excluding transactions with other government units, given that government debt is consolidated within general government. The lending from one unit of government to another is eliminated and is shown neither as acquisition of assets nor as increase in debt. Similarly, the acquisition of government bonds by government units is not shown as acquisition of assets, but as reduction in consolidated debt. The amounts of transactions between sub-sectors can be observed when information at the level of each sub-sector of general government is provided. Such information on SFAs by sub-sector is accessible on the Eurostat website.
Transactions in financial instruments, such as sales of shares, have no direct impact on government debt, because they lead to changes in holdings of other types of financial assets, normally currency and deposits. However, there will be a subsequent impact on the debt if government uses the proceeds to repay its debt.
Changes in market value (e.g. holding gains/losses due to price changes, both realized and unrealized) of financial assets owned by general government are not included here but in the revaluation accounts. These have an impact neither on government deficit nor on the change in government debt.
Figure 4 shows the evolution of the components of the net acquisition of financial assets for the EU28 over the years 2013-2016.
The net acquisition of financial assets turned negative in 2013 due to a large net decrease in Currency and deposits (F.2) and Debt securities (F.3). This downward tendency was reversed in 2014, when governments’ accumulation of currency and deposits and increase in other accounts receivable led to a growth in net financial assets. The 2014 increase was reversed in 2015 by a reduction of government holdings of all assets except for other accounts receivable. In 2016 all components, except Financial derivatives (F.71) and Other financial assets (F.1 and F.6) contributed positively to the net acquisition of financial assets.
Over the reporting period of 2013-2016, the contribution of each component varied significantly. Currency and deposits (F.2) had a negative contribution to the SFAs in 2013 and 2015, whereas less cash was spent than accumulated in 2014 and 2016. Debt securities (F.3)
contributed negatively to the net acquisition of financial assets over the first three years of the reporting period.
Lending operations increased government financial assets in 2013 and 2016. In 2014, the impact of the loans on the SFA is negligible, whilst some 2015 redemptions explain a portion of the negative SFA.
Equity and investment fund shares/units (F.5) had a negative impact in the period 2013-2015. The net contribution of this item decreased significantly in 2015, when disposals of equity account for most of the decrease in government financial assets. Net acquisition of equities was negligible in 2016.
Other accounts receivable (F.8) remained positive during the whole reporting period, whereas the effect of Other financial assets (F.1 and F.6) and Financial derivatives (F.71) was insignificant. Figure 4: Net acquisition of financial assets for EU28 (in million EUR), 2013-2016
Note: in this graph intergovernmental lending is not consolidated.
In principle, the information on net acquisition of financial assets must be coherent with financial accounts data published by Member States and reported to Eurostat under the ESA 2010 transmission programme. However, some deviations may appear, notably due to differences in "vintages" (data compiled at different points of time).
The other sections of this note are devoted to major SFA elements, examining data by country and focusing on large values. For analytical purposes, the Other accounts receivable (F.8) item is analysed together with Net incurrence of other accounts payable (F.8).
-100,000
-50,000
0
50,000
100,000
2013 2014 2015 2016
Other financial assets (F.1, F.6)
Other accounts receivable (F.8)
Financial derivatives (F.71)
Equity and investment fund shares/units (F.5)
Loans (F.4)
Debt securities (F.3)
Currency and deposits (F.2)

6
Currency and deposits (F.2)
The Currency and deposits (F.2) position (column (5) in table 3) mainly reflects movements in government deposits with banks, notably with central banks, which can fluctuate substantially from one year to another, in particular due to treasury operations (including repos). Other government units (e.g. local government, social security funds) also hold bank accounts.
The level of deposits tends to increase along with economic growth. Transactions in Currency and deposits (F.2) might also be influenced from one year to the next by very large operations that lead to large cash inflows or outflows in a given year. For example, a large bond issuance might increase the deposits of government if the receipts from the issuance are not used for another purpose like bond redemption or government spending, but are temporarily kept in the bank.
Large accumulations of Currency and deposits (F.2) might reflect governments' measures in the context of the financial crisis (e.g. reinforcement of cash reserves by issuing bonds or by taking loans). Large increases in Currency and deposits (F.2) were reported by Bulgaria, Latvia, Malta, Greece, Cyprus, Portugal and Hungary (2016), Slovenia and Finland (2015), Slovenia, Lithuania, Denmark and Cyprus (2014), Croatia and Cyprus (2013). The high positive value for Bulgaria in 2016 is mainly due to new bonds issued by government. The high positive value for Malta in 2016 is due notably to cash inflows of extra-budgetary units and higher-than-projected revenue proceeds for central government.
On the other hand, large negative values can be noted for Slovenia and Denmark (2016), Latvia, Denmark and Bulgaria (2015), Ireland, Greece, Slovakia and the Czech Republic (2014) and Spain (2013), reflecting draw-downs of cash accumulated in previous years by central government or social security funds. The high negative value for Latvia in 2015 is mainly due to the early redemption of debt.
Figure 5: Currency and deposits (F.2) in percent of GDP, 2013-2016
-6 -4 -2 0 2 4 6
EU28
Euro area
BE
BG
CZ
DK
DE
EE
IE
EL
ES
FR
HR
IT
CY
LV
LT
LU
HU
MT
NL
AT
PL
PT
RO
SI
SK
FI
SE
UK
2013
2014
2015
2016

7
Debt securities (F.3)
Debt securities (column (6) in table 3) mainly reflect net purchases by government (predominantly asset-rich social security funds) of bills, notes, bonds or preference shares issued by financial institutions, non-financial corporations or non-residents (including foreign governments). However, some large investment flows of social security funds do not appear here if they invest primarily or exclusively in government securities, because these transactions are consolidated. This item does not include transactions relating to derivatives, such as swaps, futures and options, which are reported under the separate item Financial derivatives (F.71) (column (17) in table 3).
Since 2012, this item (F.3) also includes the notes issued by the European Stability Mechanism (ESM) or the European Financial Stability Facility (EFSF). The ESM lending in the form of provision of such notes appears as acquisition of debt securities, together with an increase in debt. A disposal of debt securities is recorded later on, when the Member State decides to use these notes, for instance in a recapitalisation exercise, or to return them to the ESM (in that latter case, the Member State debt also decreases).
Figure 6 shows a marked dispersion across Member States for this item, many Member States reporting hardly any acquisition of debt securities. Malta and Romania do not hold any debt securities issued by non-government units.
The large negative value for Greece in 2015 is related to the Greek government returning bonds issued by the EFSF in 2012 and 2013 to recapitalize credit institutions, but which had not been used by the beginning of 2015. The acquisition of EFSF notes in 2013 is offset by the use of a higher amount of those notes in the same year.
For Ireland, the relatively large negative SFA in 2015 is related to the redemption and conversion of preference shares (recorded as debt securities) in Irish banks acquired during the financial crisis.
The large negative figure for Cyprus in 2014 is related to bank recapitalisation operations. The government used in 2014 its holdings in Debt securities (F.3), notably floating rate notes issued by the European Stability Mechanism in 2013, to recapitalise a failing bank. The government's increased holdings in these floating rate notes in 2013 are reflected in a large positive entry for that year.
Part of the contingent convertible instruments acquired by the Portuguese government in 2012 were repaid in 2014 (small amounts also in 2013), which explains the relatively big disposal of Debt securities (F.3) for Portugal in 2014.
Figure 6: Debt securities (F.3) in percent of GDP, 2013-2016
-9 -6 -3 0 3 6 9
EU28
Euro area
BE
BG
CZ
DK
DE
EE
IE
EL
ES
FR
HR
IT
CY
LV
LT
LU
HU
MT
NL
AT
PL
PT
RO
SI
SK
FI
SE
UK
2013
2014
2015
2016

8
Loans (F.4)
This item (column (7) in table 3) comprises loans to non-government units only, since the figures in this table are consolidated. It predominantly includes lending to public corporations, foreign governments or households (students, etc.). The value of loans grows with increased lending and decreases with loan repayments and loan cancellations. Some loans might be converted into capital (recorded as capital transfers or equity injections) which would imply a further reduction in this item.
It should be noted that loans granted by government with little expectation of repayment at inception are to be recorded in national accounts as capital transfers (thus impacting the deficit) and are therefore not reported here.
Slovenia reported large positive values in 2013 and 2014. The increase in loans in 2013 was mainly related to a transfer of claims from recapitalised banks to a bad bank classified in general government, while in 2014 it was due to loans granted to financial corporations in the context of the financial crisis. The negative value in 2015 is related to the conversion of loans into real estate and equity.
Ireland reported a significant decrease in loans for 2014, corresponding to the sale of a loan portfolio by a public defeasance structure.
Greece reported a significant reduction in loan assets in 2013, which reflects mainly the conversion into shares of bridge loans extended to Greek banks in 2012 by the Hellenic Financial Stability Fund (classified inside general government). This conversion was partly recorded as a capital transfer impacting the deficit and partly as an acquisition of equity.
The high positive value for Sweden in 2013 reflects a loan granted by central government to the National Central Bank (Riksbank).
It should be noted that EDP tables require Member States to provide information on the distribution of government's short-term loan (column (10) in table 3) and long-term loan (column (11) in table 3) assets. According to ESA 2010, the maturity of short-term loans is one year or less, while the maturity of long-term loans is more than one year. All Member States provide these items. The data are shown in table 3.
Figure 7: Loans (F.4) in percent of GDP, 2013-2016
-14 -11 -7 -4 0 4 7 11 14
EU28
Euro area
BE
BG
CZ
DK
DE
EE
IE
EL
ES
FR
HR
IT
CY
LV
LT
LU
HU
MT
NL
AT
PL
PT
RO
SI
SK
FI
SE
UK
2013
2014
2015
2016
9
Equity and investment fund shares/units (F.5)
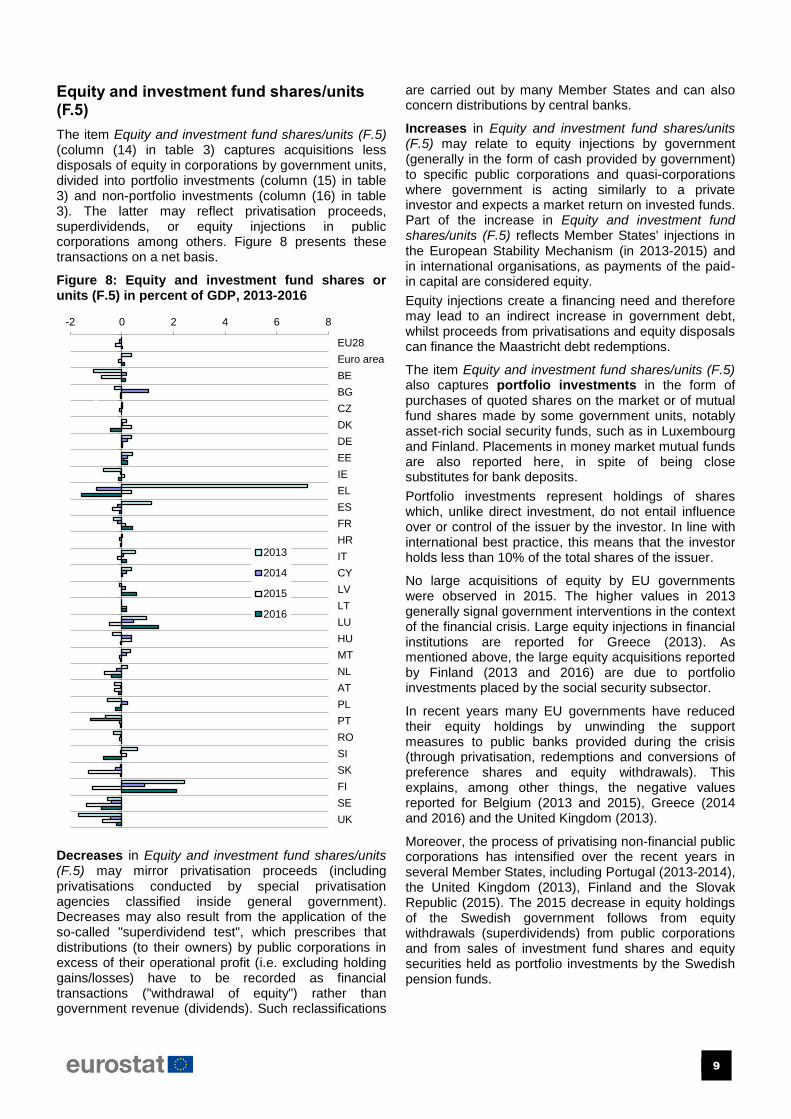
The item Equity and investment fund shares/units (F.5) (column (14) in table 3) captures acquisitions less disposals of equity in corporations by government units, divided into portfolio investments (column (15) in table 3) and non-portfolio investments (column (16) in table 3). The latter may reflect privatisation proceeds, superdividends, or equity injections in public corporations among others. Figure 8 presents these transactions on a net basis.
Figure 8: Equity and investment fund shares or units (F.5) in percent of GDP, 2013-2016
Decreases in Equity and investment fund shares/units (F.5) may mirror privatisation proceeds (including privatisations conducted by special privatisation agencies classified inside general government). Decreases may also result from the application of the so-called "superdividend test", which prescribes that distributions (to their owners) by public corporations in excess of their operational profit (i.e. excluding holding gains/losses) have to be recorded as financial transactions ("withdrawal of equity") rather than government revenue (dividends). Such reclassifications
are carried out by many Member States and can also concern distributions by central banks.
Increases in Equity and investment fund shares/units (F.5) may relate to equity injections by government (generally in the form of cash provided by government) to specific public corporations and quasi-corporations where government is acting similarly to a private investor and expects a market return on invested funds. Part of the increase in Equity and investment fund shares/units (F.5) reflects Member States' injections in the European Stability Mechanism (in 2013-2015) and in international organisations, as payments of the paid-in capital are considered equity.
Equity injections create a financing need and therefore may lead to an indirect increase in government debt, whilst proceeds from privatisations and equity disposals can finance the Maastricht debt redemptions.
The item Equity and investment fund shares/units (F.5) also captures portfolio investments in the form of purchases of quoted shares on the market or of mutual fund shares made by some government units, notably asset-rich social security funds, such as in Luxembourg and Finland. Placements in money market mutual funds are also reported here, in spite of being close substitutes for bank deposits.
Portfolio investments represent holdings of shares which, unlike direct investment, do not entail influence over or control of the issuer by the investor. In line with international best practice, this means that the investor holds less than 10% of the total shares of the issuer.
No large acquisitions of equity by EU governments were observed in 2015. The higher values in 2013 generally signal government interventions in the context of the financial crisis. Large equity injections in financial institutions are reported for Greece (2013). As mentioned above, the large equity acquisitions reported by Finland (2013 and 2016) are due to portfolio investments placed by the social security subsector.
In recent years many EU governments have reduced their equity holdings by unwinding the support measures to public banks provided during the crisis (through privatisation, redemptions and conversions of preference shares and equity withdrawals). This explains, among other things, the negative values reported for Belgium (2013 and 2015), Greece (2014 and 2016) and the United Kingdom (2013).
Moreover, the process of privatising non-financial public corporations has intensified over the recent years in several Member States, including Portugal (2013-2014), the United Kingdom (2013), Finland and the Slovak Republic (2015). The 2015 decrease in equity holdings of the Swedish government follows from equity withdrawals (superdividends) from public corporations and from sales of investment fund shares and equity securities held as portfolio investments by the Swedish pension funds.
-2 0 2 4 6 8
EU28
Euro area
BE
BG
CZ
DK
DE
EE
IE
EL
ES
FR
HR
IT
CY
LV
LT
LU
HU
MT
NL
AT
PL
PT
RO
SI
SK
FI
SE
UK
2013
2014
2015
2016

10
Adjustments
Other accounts receivable (F.8), Net incurrence of other accounts payable (F.8) and Financial derivatives (F.71)
Whereas public accounts or budget recordings are often cash based (or partly cash based) in the EU, ESA 2010 follows the accrual principle, namely: recording transactions when the obligation to pay arises, not when the payment is actually made. Consequently, the impact on the financing needs of government does not directly arise from the deficit, as government revenue can be cashed or government expenditure can be settled in different accounting periods than the economic transaction itself. Thus, two items have to be added in the transition from the deficit to the change in government debt: Other accounts receivable (F.8) and Net incurrence of other accounts payable (F.8) (columns (18) and (22) in table 3).
Other accounts receivable (F.8) mainly include receivables of taxes and social contributions, as well as amounts concerning EU transactions (amounts paid by government on behalf of the EU but not yet reimbursed by the EU), trade credits and advances (e.g. advances for future acquisition of goods, such as military equipment) and, on rare occasions, amounts for wages or benefits paid one month in advance, etc. The value of Other accounts receivable (AF.8) on the government balance sheet tends to increase over time because of nominal GDP growth.
By the same token, entries in Net incurrence of other accounts payable (F.8) include (among others) prepayments for licences (notably mobile phone spectrum licences, which are recorded as government revenue only when they are useable), trade credits granted by government suppliers, as well as the grants received from the EU but not yet paid to the final beneficiary or tax refunds not yet settled.
When verifying the EDP tables, Eurostat closely monitors flows of receivables/payables, to avoid large amounts of undocumented receivables/payables and to ensure that the accrual principle is implemented appropriately.
Figure 9 shows the net amount of other accounts receivable/payable reported by Member States for the years 2013-2016. The large negative value for Poland (2014) relates to a transfer to government of pension funds' assets, which, in line with ESA 2010 rules, is considered a financial advance for future payments of pension benefits. For Denmark, the 2015 negative value reflects a decrease in tax receivables. The negative value reported by Romania for 2016 is due mainly to EU flows and the application of new guidance on mobile phone licences.
The significant positive value for Greece in 2013 reflects a sharp decrease in payables, mostly due to settlements of hospitals' arrears. The positive value for 2015 for Lithuania results from cash/accrual
adjustments relating to the closure of the 2007-2013 EU financial framework.
Figure 9: Net amounts of Other accounts receivable(+)/payable(-) in percent of GDP, 2013-2016
Member States also provide supplementary information on Other financial assets (F.1, F.6) and Net incurrence of other liabilities (F.1, F.5, F.6 and F.72) (columns (19) and (23) in table 3). These two items are not shown in this section due to their relatively small size (below 0.3% of GDP).
Government entities, notably treasuries, may carry out operations in financial derivatives, such as swaps, futures and options, with the aim to reduce risks related to their debt instruments and for liquidity management purposes. The cash flows related to those operations are recorded in the financial accounts, without impacting the deficit. Financial derivative liabilities are excluded from government debt (except for off-market swaps, which lead to entries under loans). Individual values are shown in column (21) in table 3. Operations related to Financial derivatives (F.71) are not included in Figure 9, even though for some countries, such as Sweden, this component of the SFA might not be negligible. Moreover, in 2015, in several Member States relatively large transactions in financial derivatives were observed due to the cancellation of interest rate swaps.
-10 -8 -6 -4 -2 0 2 4
EU28
Euro area
BE
BG
CZ
DK
DE
EE
IE
EL
ES
FR
HR
IT
CY
LV
LT
LU
HU
MT
NL
AT
PL
PT
RO
SI
SK
FI
SE
UK
2013
2014
2015
2016

11
Valuation effects
These items relate to the fact that government debt is carried at face value.
Governments routinely issue bills, notes and bonds below or above their face value (face value = par value), often in the form of fungible bonds or zero coupon bonds. When the face and issuance values differ, this impacts EDP figures. Since government debt must be recorded at face value but the proceeds entering Currency and deposits (F.2) correspond to the issue value, the difference must be recorded as Issuance above(-)/below(+) par (see column (24) in table 3). Hence, the difference, which has the economic nature of "interest", is recorded as government expenditure not at time of issuance, but only gradually over time. Recently, an increasing number of Member States issued their debt above par.
Similarly, an adjustment must be made in the case of early redemption, when government buys back issued bonds, or when a government unit purchases bonds issued by another government unit. The difference between the repurchase value and the face value is presented in the column Redemptions of debt above(+)/below(-) nominal value (column (26) in table 3).
Under ESA 2010, government expenditure on interest should be spread over time, in line with the accrual principle, whereas the cash impact occurs only when interest is actually paid. In addition, interest accrued is excluded from the stock of government debt. The item Difference between interest (D.41) accrued (-) and paid (+) (column (25) in table 3) addresses these two issues. As this item also captures the spreading over time of the premium or discount at issue, positive values may reflect the accrual impact of large amounts of bonds issued in the past at a premium.
Figure 10 shows, by country, the difference between interest (D.41) accrued and paid for the whole reporting period 2013-2016 in percent of GDP. Under ESA 2010, this item no longer includes any adjustments for payments on swaps and forward rate agreements, because these are now recorded as financial transactions also for EDP purposes.
Figure 10: Difference between interest (D.41) accrued (-) and paid (+) in percent of GDP, 2013-2016
For Greece, the values reported under the item Difference between interest (D.41) accrued (-) and paid (+) were particularly high for the years 2013-2016 in the context of the extensive restructuring of debt: in 2013-2016, the negative amounts reflected mainly the deferral of interest payments by ten years on EFSF loans granted to Greece in 2012.
-1.5 -0.5 0.5 1.5
EU28
Euro area
BE
BG
CZ
DK
DE
EE
IE
EL
ES
FR
HR
IT
CY
LV
LT
LU
HU
MT
NL
AT
PL
PT
RO
SI
SK
FI
SE
UK
2013
2014
2015
2016
12
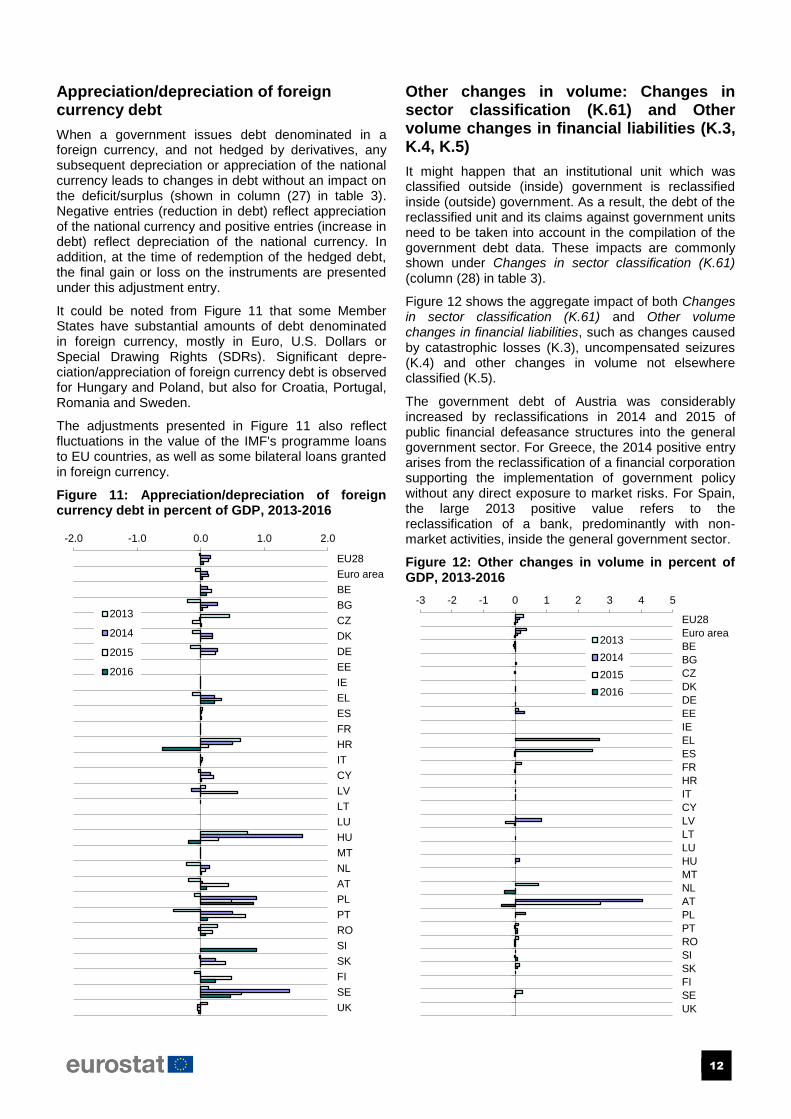
Appreciation/depreciation of foreign currency debt
When a government issues debt denominated in a foreign currency, and not hedged by derivatives, any subsequent depreciation or appreciation of the national currency leads to changes in debt without an impact on the deficit/surplus (shown in column (27) in table 3). Negative entries (reduction in debt) reflect appreciation of the national currency and positive entries (increase in debt) reflect depreciation of the national currency. In addition, at the time of redemption of the hedged debt, the final gain or loss on the instruments are presented under this adjustment entry.
It could be noted from Figure 11 that some Member States have substantial amounts of debt denominated in foreign currency, mostly in Euro, U.S. Dollars or Special Drawing Rights (SDRs). Significant depre-ciation/appreciation of foreign currency debt is observed for Hungary and Poland, but also for Croatia, Portugal, Romania and Sweden.
The adjustments presented in Figure 11 also reflect fluctuations in the value of the IMF's programme loans to EU countries, as well as some bilateral loans granted in foreign currency.
Figure 11: Appreciation/depreciation of foreign currency debt in percent of GDP, 2013-2016
Other changes in volume: Changes in sector classification (K.61) and Other volume changes in financial liabilities (K.3, K.4, K.5)
It might happen that an institutional unit which was classified outside (inside) government is reclassified inside (outside) government. As a result, the debt of the reclassified unit and its claims against government units need to be taken into account in the compilation of the government debt data. These impacts are commonly shown under Changes in sector classification (K.61) (column (28) in table 3).
Figure 12 shows the aggregate impact of both Changes in sector classification (K.61) and Other volume changes in financial liabilities, such as changes caused by catastrophic losses (K.3), uncompensated seizures (K.4) and other changes in volume not elsewhere classified (K.5).
The government debt of Austria was considerably increased by reclassifications in 2014 and 2015 of public financial defeasance structures into the general government sector. For Greece, the 2014 positive entry arises from the reclassification of a financial corporation supporting the implementation of government policy without any direct exposure to market risks. For Spain, the large 2013 positive value refers to the reclassification of a bank, predominantly with non-market activities, inside the general government sector.
Figure 12: Other changes in volume in percent of GDP, 2013-2016
-2.0 -1.0 0.0 1.0 2.0
EU28
Euro area
BE
BG
CZ
DK
DE
EE
IE
EL
ES
FR
HR
IT
CY
LV
LT
LU
HU
MT
NL
AT
PL
PT
RO
SI
SK
FI
SE
UK
2013
2014
2015
2016
-3 -2 -1 0 1 2 3 4 5
EU28
Euro area
BE
BG
CZ
DK
DE
EE
IE
EL
ES
FR
HR
IT
CY
LV
LT
LU
HU
MT
NL
AT
PL
PT
RO
SI
SK
FI
SE
UK
2013
2014
2015
2016

13
Statistical discrepancy
Finally, the Statistical discrepancy (column (30) in table 3) reflects differences arising from the diversity of data sources and might also indicate problems with the reliability of data. The government sector accounts in national accounts (ESA 2010) are often compiled from a diversity of sources, which may not be fully integrated or completely homogenous, leading to differences between the revenue and expenditure data and the financing data. Differences may also arise between the transactions in debt and other economic flows in debt (i.e. valuation effects and other changes in volume), on the one hand, and the change in debt, on the other. Deviations may also appear due to differences in "vintages" (data compiled at different points in time). Discrepancies between the non-financial and the financial accounts often relate to the time of recording of treasury or budget transactions compared to the moment these flow through the banking system. Therefore, a notable cause of discrepancies originates from the accrual recording applicable to ESA 2010 data and the difficulty to match cash and accrual data. The extent of discrepancies can thus be an indicator of the accuracy of the data supplied by Member States. Therefore, Eurostat monitors discrepancies carefully to determine if their size is excessive or they accumulate (i.e. are of the same sign) over time. In particular, a continuously positive discrepancy may put into question whether the deficit is appropriately measured. In general, the statistical discrepancies for the EU28 and the euro area are relatively small. For the year 2016, Belgium, Luxembourg and Denmark reported larger-than-usual statistical discrepancies. Large discrepancies for 2016 were also reported by Germany, Slovakia, Malta, Ireland, Italy, Finland and Portugal. Relatively high levels of statistical discrepancies for the years 2013-2015 were reported by the United Kingdom and Germany (2014 and 2015), Finland (2013 and 2015), Austria (2015) and Denmark (2014).
Figure 13: Statistical discrepancy in percent of GDP, 2013-2016
-1.0 -0.5 0.0 0.5 1.0
EU28
Euro area
BE
BG
CZ
DK
DE
EE
IE
EL
ES
FR
HR
IT
CY
LV
LT
LU
HU
MT
NL
AT
PL
PT
RO
SI
SK
FI
SE
UK
2013
2014
2015
2016
14
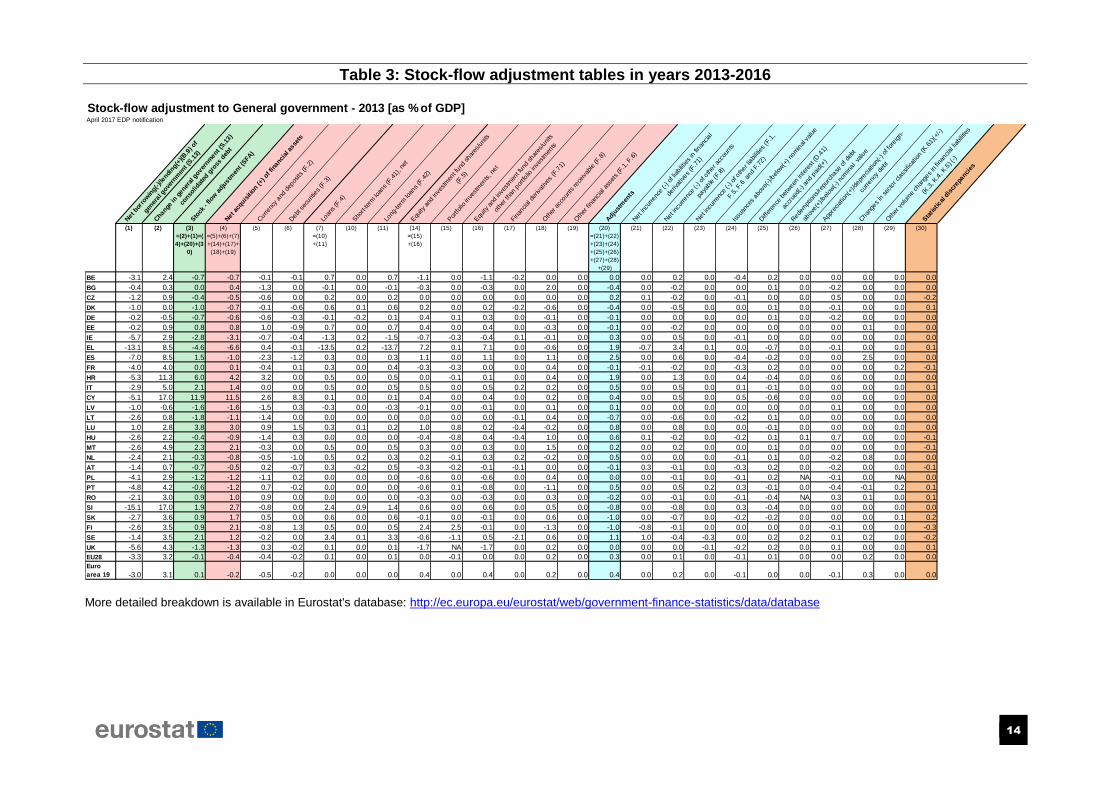
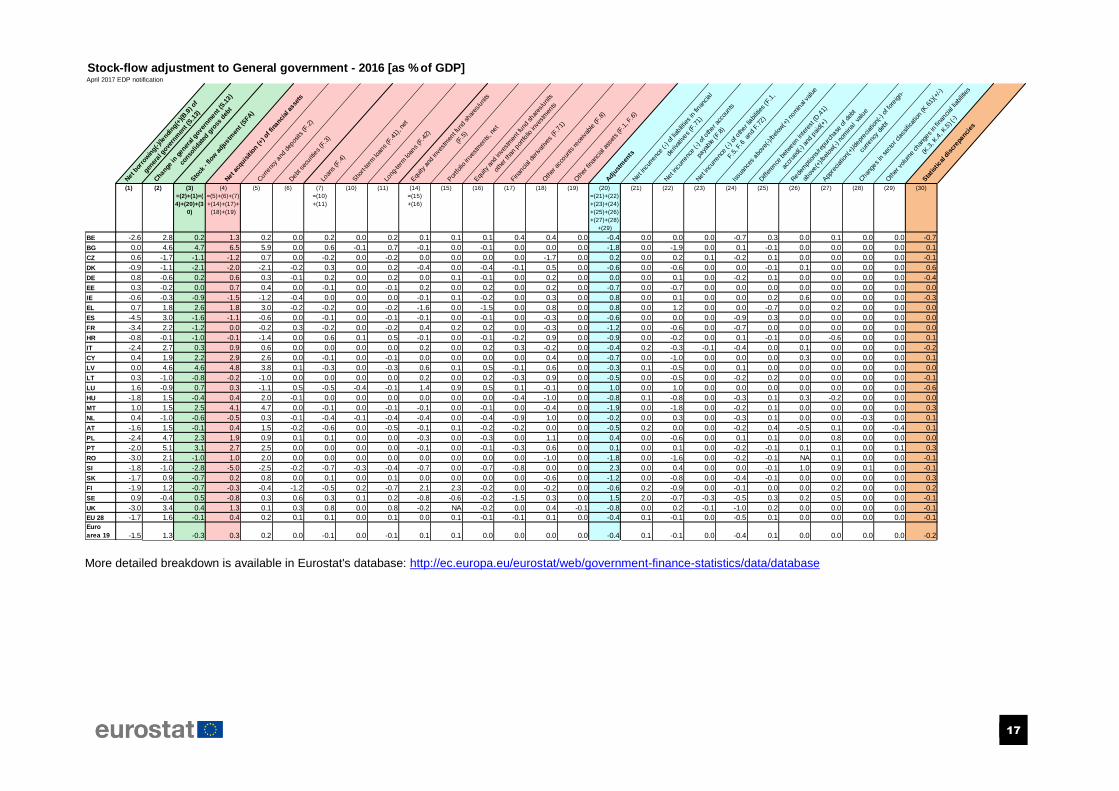
Table 3: Stock-flow adjustment tables in years 2013-2016
Stock-flow adjustment to General government - 2013 [as % of GDP]April 2017 EDP notification
Net
bor
row
ing(
-)/le
ndin
g(+)
(B.9
) of
gene
ral g
over
nmen
t (S.1
3)
Cha
nge
in g
ener
al g
over
nmen
t (S.1
3)
cons
olid
ated
gro
ss d
ebt
Sto
ck -
flow
adj
ustm
ent (
SFA
)
Net
acq
uisi
tion
(+) o
f fin
anci
al a
sset
s
Cur
renc
y an
d de
posits
(F.2
)
Deb
t sec
urities
(F.3
)Lo
ans
(F.4
)
Sho
rt-te
rm lo
ans
(F.4
1), n
et
Long
-term
loan
s (F
.42)
Equ
ity a
nd in
vest
men
t fun
d sh
ares
/uni
ts
(F.5
)
Por
tfolio
inve
stm
ents
, net
Equ
ity a
nd in
vest
men
t fun
d sh
ares
/uni
ts
othe
r tha
n po
rtfol
io in
vest
men
ts
Fina
ncia
l der
ivat
ives
(F.7
1)
Oth
er a
ccou
nts
rece
ivab
le (F
.8)
Oth
er fi
nanc
ial a
sset
s (F
.1, F
.6)
Adj
ustm
ents
Net
incu
rrenc
e (-) o
f lia
bilit
ies
in fi
nanc
ial
deriv
atives
(F.7
1)
Net
incu
rrenc
e (-) o
f oth
er a
ccou
nts
paya
ble
(F.8
)
Net
incu
rrenc
e (-) o
f oth
er liab
ilitie
s (F
.1,
F.5,
F.6
and
F.7
2)
Issu
ance
s ab
ove(
-)/b
elow
(+) n
omin
al v
alue
Diff
eren
ce b
etwee
n in
tere
st (D
.41)
accr
ued(
-) an
d pa
id(+
)
Red
empt
ions
/repu
rcha
se o
f deb
t
abov
e(+)
/bel
ow(-) n
omin
al v
alue
App
reciat
ion(
+)/d
epre
ciat
ion(
-) o
f for
eign
-
curre
ncy
debt
Cha
nges
in s
ecto
r cla
ssifi
catio
n (K
.61)
(+/-)
Oth
er v
olum
e ch
ange
s in
fina
ncia
l lia
bilitie
s
(K.3
, K.4
, K.5
) (-)
Sta
tistic
al d
iscr
epan
cies
(1) (2) (3)
=(2)+(1)=(
4)+(20)+(3
0)
(4)
=(5)+(6)+(7)
+(14)+(17)+
(18)+(19)
(5) (6) (7)
=(10)
+(11)
(10) (11) (14)
=(15)
+(16)
(15) (16) (17) (18) (19) (20)
=(21)+(22)
+(23)+(24)
+(25)+(26)
+(27)+(28)
+(29)
(21) (22) (23) (24) (25) (26) (27) (28) (29) (30)
BE -3.1 2.4 -0.7 -0.7 -0.1 -0.1 0.7 0.0 0.7 -1.1 0.0 -1.1 -0.2 0.0 0.0 0.0 0.0 0.2 0.0 -0.4 0.2 0.0 0.0 0.0 0.0 0.0
BG -0.4 0.3 0.0 0.4 -1.3 0.0 -0.1 0.0 -0.1 -0.3 0.0 -0.3 0.0 2.0 0.0 -0.4 0.0 -0.2 0.0 0.0 0.1 0.0 -0.2 0.0 0.0 0.0
CZ -1.2 0.9 -0.4 -0.5 -0.6 0.0 0.2 0.0 0.2 0.0 0.0 0.0 0.0 0.0 0.0 0.2 0.1 -0.2 0.0 -0.1 0.0 0.0 0.5 0.0 0.0 -0.2
DK -1.0 0.0 -1.0 -0.7 -0.1 -0.6 0.6 0.1 0.6 0.2 0.0 0.2 -0.2 -0.6 0.0 -0.4 0.0 -0.5 0.0 0.0 0.1 0.0 -0.1 0.0 0.0 0.1
DE -0.2 -0.5 -0.7 -0.6 -0.6 -0.3 -0.1 -0.2 0.1 0.4 0.1 0.3 0.0 -0.1 0.0 -0.1 0.0 0.0 0.0 0.0 0.1 0.0 -0.2 0.0 0.0 0.0
EE -0.2 0.9 0.8 0.8 1.0 -0.9 0.7 0.0 0.7 0.4 0.0 0.4 0.0 -0.3 0.0 -0.1 0.0 -0.2 0.0 0.0 0.0 0.0 0.0 0.1 0.0 0.0
IE -5.7 2.9 -2.8 -3.1 -0.7 -0.4 -1.3 0.2 -1.5 -0.7 -0.3 -0.4 0.1 -0.1 0.0 0.3 0.0 0.5 0.0 -0.1 0.0 0.0 0.0 0.0 0.0 0.0
EL -13.1 8.5 -4.6 -6.6 0.4 -0.1 -13.5 0.2 -13.7 7.2 0.1 7.1 0.0 -0.6 0.0 1.9 -0.7 3.4 0.1 0.0 -0.7 0.0 -0.1 0.0 0.0 0.1
ES -7.0 8.5 1.5 -1.0 -2.3 -1.2 0.3 0.0 0.3 1.1 0.0 1.1 0.0 1.1 0.0 2.5 0.0 0.6 0.0 -0.4 -0.2 0.0 0.0 2.5 0.0 0.0
FR -4.0 4.0 0.0 0.1 -0.4 0.1 0.3 0.0 0.4 -0.3 -0.3 0.0 0.0 0.4 0.0 -0.1 -0.1 -0.2 0.0 -0.3 0.2 0.0 0.0 0.0 0.2 -0.1
HR -5.3 11.3 6.0 4.2 3.2 0.0 0.5 0.0 0.5 0.0 -0.1 0.1 0.0 0.4 0.0 1.9 0.0 1.3 0.0 0.4 -0.4 0.0 0.6 0.0 0.0 0.0
IT -2.9 5.0 2.1 1.4 0.0 0.0 0.5 0.0 0.5 0.5 0.0 0.5 0.2 0.2 0.0 0.5 0.0 0.5 0.0 0.1 -0.1 0.0 0.0 0.0 0.0 0.1
CY -5.1 17.0 11.9 11.5 2.6 8.3 0.1 0.0 0.1 0.4 0.0 0.4 0.0 0.2 0.0 0.4 0.0 0.5 0.0 0.5 -0.6 0.0 0.0 0.0 0.0 0.0
LV -1.0 -0.6 -1.6 -1.6 -1.5 0.3 -0.3 0.0 -0.3 -0.1 0.0 -0.1 0.0 0.1 0.0 0.1 0.0 0.0 0.0 0.0 0.0 0.0 0.1 0.0 0.0 0.0
LT -2.6 0.8 -1.8 -1.1 -1.4 0.0 0.0 0.0 0.0 0.0 0.0 0.0 -0.1 0.4 0.0 -0.7 0.0 -0.6 0.0 -0.2 0.1 0.0 0.0 0.0 0.0 0.0
LU 1.0 2.8 3.8 3.0 0.9 1.5 0.3 0.1 0.2 1.0 0.8 0.2 -0.4 -0.2 0.0 0.8 0.0 0.8 0.0 0.0 -0.1 0.0 0.0 0.0 0.0 0.0
HU -2.6 2.2 -0.4 -0.9 -1.4 0.3 0.0 0.0 0.0 -0.4 -0.8 0.4 -0.4 1.0 0.0 0.6 0.1 -0.2 0.0 -0.2 0.1 0.1 0.7 0.0 0.0 -0.1
MT -2.6 4.9 2.3 2.1 -0.3 0.0 0.5 0.0 0.5 0.3 0.0 0.3 0.0 1.5 0.0 0.2 0.0 0.2 0.0 0.0 0.1 0.0 0.0 0.0 0.0 -0.1
NL -2.4 2.1 -0.3 -0.8 -0.5 -1.0 0.5 0.2 0.3 0.2 -0.1 0.3 0.2 -0.2 0.0 0.5 0.0 0.0 0.0 -0.1 0.1 0.0 -0.2 0.8 0.0 0.0
AT -1.4 0.7 -0.7 -0.5 0.2 -0.7 0.3 -0.2 0.5 -0.3 -0.2 -0.1 -0.1 0.0 0.0 -0.1 0.3 -0.1 0.0 -0.3 0.2 0.0 -0.2 0.0 0.0 -0.1
PL -4.1 2.9 -1.2 -1.2 -1.1 0.2 0.0 0.0 0.0 -0.6 0.0 -0.6 0.0 0.4 0.0 0.0 0.0 -0.1 0.0 -0.1 0.2 NA -0.1 0.0 NA 0.0
PT -4.8 4.2 -0.6 -1.2 0.7 -0.2 0.0 0.0 0.0 -0.6 0.1 -0.8 0.0 -1.1 0.0 0.5 0.0 0.5 0.2 0.3 -0.1 0.0 -0.4 -0.1 0.2 0.1
RO -2.1 3.0 0.9 1.0 0.9 0.0 0.0 0.0 0.0 -0.3 0.0 -0.3 0.0 0.3 0.0 -0.2 0.0 -0.1 0.0 -0.1 -0.4 NA 0.3 0.1 0.0 0.1
SI -15.1 17.0 1.9 2.7 -0.8 0.0 2.4 0.9 1.4 0.6 0.0 0.6 0.0 0.5 0.0 -0.8 0.0 -0.8 0.0 0.3 -0.4 0.0 0.0 0.0 0.0 0.0
SK -2.7 3.6 0.9 1.7 0.5 0.0 0.6 0.0 0.6 -0.1 0.0 -0.1 0.0 0.6 0.0 -1.0 0.0 -0.7 0.0 -0.2 -0.2 0.0 0.0 0.0 0.1 0.2
FI -2.6 3.5 0.9 2.1 -0.8 1.3 0.5 0.0 0.5 2.4 2.5 -0.1 0.0 -1.3 0.0 -1.0 -0.8 -0.1 0.0 0.0 0.0 0.0 -0.1 0.0 0.0 -0.3
SE -1.4 3.5 2.1 1.2 -0.2 0.0 3.4 0.1 3.3 -0.6 -1.1 0.5 -2.1 0.6 0.0 1.1 1.0 -0.4 -0.3 0.0 0.2 0.2 0.1 0.2 0.0 -0.2
UK -5.6 4.3 -1.3 -1.3 0.3 -0.2 0.1 0.0 0.1 -1.7 NA -1.7 0.0 0.2 0.0 0.0 0.0 0.0 -0.1 -0.2 0.2 0.0 0.1 0.0 0.0 0.1
EU28 -3.3 3.2 -0.1 -0.4 -0.4 -0.2 0.1 0.0 0.1 0.0 -0.1 0.0 0.0 0.2 0.0 0.3 0.0 0.1 0.0 -0.1 0.1 0.0 0.0 0.2 0.0 0.0
Euro
area 19 -3.0 3.1 0.1 -0.2 -0.5 -0.2 0.0 0.0 0.0 0.4 0.0 0.4 0.0 0.2 0.0 0.4 0.0 0.2 0.0 -0.1 0.0 0.0 -0.1 0.3 0.0 0.0 More detailed breakdown is available in Eurostat's database: http://ec.europa.eu/eurostat/web/government-finance-statistics/data/database

15
Stock-flow adjustment to General government - 2014 [as % of GDP]April 2017 EDP notification
Net
bor
row
ing(
-)/le
ndin
g(+)
(B.9
) of
gene
ral g
over
nmen
t (S.1
3)
Cha
nge
in g
ener
al g
over
nmen
t (S.1
3)
cons
olid
ated
gro
ss d
ebt
Sto
ck -
flow
adj
ustm
ent (
SFA
)
Net
acq
uisi
tion
(+) o
f fin
anci
al a
sset
s
Cur
renc
y an
d de
posits
(F.2
)
Deb
t sec
urities
(F.3
)Lo
ans
(F.4
)
Sho
rt-te
rm lo
ans
(F.4
1), n
et
Long
-term
loan
s (F
.42)
Equ
ity a
nd in
vest
men
t fun
d sh
ares
/uni
ts
(F.5
)
Por
tfolio
inve
stm
ents
, net
Equ
ity a
nd in
vest
men
t fun
d sh
ares
/uni
ts
othe
r tha
n po
rtfol
io in
vest
men
ts
Fina
ncia
l der
ivat
ives
(F.7
1)
Oth
er a
ccou
nts
rece
ivab
le (F
.8)
Oth
er fi
nanc
ial a
sset
s (F
.1, F
.6)
Adj
ustm
ents
Net
incu
rrenc
e (-) o
f lia
bilit
ies
in fi
nanc
ial
deriv
atives
(F.7
1)
Net
incu
rrenc
e (-) o
f oth
er a
ccou
nts
paya
ble
(F.8
)
Net
incu
rrenc
e (-) o
f oth
er liab
ilitie
s (F
.1,
F.5,
F.6
and
F.7
2)
Issu
ance
s ab
ove(
-)/b
elow
(+) n
omin
al v
alue
Diff
eren
ce b
etwee
n in
tere
st (D
.41)
accr
ued(
-) an
d pa
id(+
)
Red
empt
ions
/repu
rcha
se o
f deb
t
abov
e(+)
/bel
ow(-) n
omin
al v
alue
App
reciat
ion(
+)/d
epre
ciat
ion(
-) o
f for
eign
-
curre
ncy
debt
Cha
nges
in s
ecto
r cla
ssifi
catio
n (K
.61)
(+/-)
Oth
er v
olum
e ch
ange
s in
fina
ncia
l lia
bilitie
s
(K.3
, K.4
, K.5
) (-)
Sta
tistic
al d
iscr
epan
cies
(1) (2) (3)
=(2)+(1)=(
4)+(20)+(3
0)
(4)
=(5)+(6)+(7)
+(14)+(17)+
(18)+(19)
(5) (6) (7)
=(10)
+(11)
(10) (11) (14)
=(15)
+(16)
(15) (16) (17) (18) (19) (20)
=(21)+(22)
+(23)+(24)
+(25)+(26)
+(27)+(28)
+(29)
(21) (22) (23) (24) (25) (26) (27) (28) (29) (30)
BE -3.1 3.5 0.4 0.8 -0.1 -0.1 0.5 0.0 0.5 0.2 -0.1 0.2 0.0 0.2 0.0 -0.3 0.0 0.2 0.0 -0.8 0.2 0.0 0.1 0.1 -0.1 0.0
BG -5.5 10.3 4.8 4.9 1.6 0.0 1.0 0.0 1.0 1.0 0.0 1.0 0.0 1.3 0.0 -0.1 0.0 -0.3 0.0 0.0 -0.1 0.0 0.3 0.0 0.0 0.0
CZ -1.9 -0.5 -2.4 -2.4 -2.5 0.0 0.0 0.0 0.0 0.0 0.0 0.0 0.0 0.0 0.0 0.0 0.1 0.1 0.0 -0.1 0.0 0.0 0.0 0.0 0.0 -0.1
DK 1.4 1.0 2.4 2.3 2.6 -1.8 0.2 0.0 0.2 0.0 0.0 0.0 -0.2 1.4 0.0 -0.1 0.0 -0.2 0.0 -0.3 0.1 0.0 0.2 0.0 0.0 0.2
DE 0.3 0.0 0.3 0.5 0.6 -0.4 -0.3 0.0 -0.3 0.2 0.0 0.2 0.1 0.3 0.0 0.0 0.0 -0.2 0.0 -0.1 0.1 0.0 0.3 0.0 0.0 -0.2
EE 0.7 0.9 1.6 1.3 0.0 0.7 -0.1 0.0 -0.1 0.2 0.0 0.2 0.0 0.4 0.0 0.3 0.0 0.0 0.0 0.0 0.0 0.0 0.0 0.3 0.0 0.0
IE -3.7 -6.2 -9.9 -9.8 -3.3 -0.7 -6.1 -0.4 -5.7 0.0 -0.2 0.1 0.1 0.3 0.0 -0.3 0.0 -0.4 0.0 -0.2 0.0 0.3 0.0 0.0 0.0 0.2
EL -3.7 -0.4 -4.1 -7.4 -3.3 -1.1 -0.3 -0.2 -0.1 -1.0 0.0 -1.0 0.0 -1.8 0.0 3.4 0.2 1.3 0.0 0.0 -1.0 0.0 0.2 2.7 0.0 0.0
ES -6.0 6.0 0.0 0.5 1.1 -0.5 0.0 0.0 0.0 -0.2 0.0 -0.2 0.0 0.0 0.0 -0.4 0.0 0.1 0.0 -0.6 0.0 0.0 0.0 0.0 0.0 -0.1
FR -3.9 4.0 0.0 0.6 -0.1 0.3 0.0 0.0 0.0 -0.2 -0.2 0.0 0.0 0.5 0.0 -0.5 0.0 -0.3 0.0 -0.3 0.2 0.0 0.0 0.0 0.0 0.0
HR -5.4 4.1 -1.3 -0.3 -0.7 0.0 0.3 0.0 0.3 -0.1 0.1 -0.2 0.0 0.2 0.0 -1.2 0.0 -1.4 0.0 0.1 -0.4 0.0 0.5 0.0 0.0 0.1
IT -3.0 4.1 1.1 1.3 0.6 0.0 0.1 0.0 0.1 0.1 0.0 0.1 0.2 0.3 0.0 -0.1 0.1 0.1 0.0 -0.4 0.0 0.0 0.0 0.0 0.0 -0.1
CY -8.8 1.7 -7.1 -6.0 2.1 -8.5 0.2 0.0 0.2 0.2 0.0 0.2 0.0 0.0 0.0 -1.1 0.0 -0.7 -0.5 0.3 -0.4 0.0 0.2 0.0 0.0 0.1
LV -1.6 3.2 1.7 1.4 1.0 -0.2 -0.4 -0.1 -0.3 0.1 0.0 0.1 0.0 0.8 0.0 0.3 0.1 -0.5 0.0 0.1 0.0 0.0 -0.1 0.8 0.0 0.0
LT -0.7 3.5 2.8 3.4 3.3 0.1 0.0 0.0 0.0 0.0 0.0 0.0 0.0 -0.1 0.0 -0.6 0.0 -0.6 0.0 0.0 0.0 0.0 0.0 0.0 0.0 0.0
LU 1.4 0.6 2.0 3.3 1.1 0.2 0.7 0.8 -0.1 0.5 0.4 0.0 0.2 0.7 0.0 -1.2 0.0 -1.2 0.0 0.0 0.0 0.0 0.0 0.0 0.0 -0.1
HU -2.1 4.4 2.4 0.8 0.7 -0.4 0.0 0.0 -0.1 0.4 0.0 0.4 -0.3 0.4 0.0 1.6 0.2 -0.1 0.0 -1.0 0.4 0.2 1.6 0.2 0.0 -0.1
MT -2.0 2.1 0.1 1.3 0.9 0.0 0.2 0.0 0.2 0.2 0.0 0.2 0.0 0.1 0.0 -1.1 0.0 -1.0 0.0 -0.1 0.0 0.0 0.0 0.0 0.0 -0.1
NL -2.3 1.3 -1.0 -0.9 -0.1 -0.7 0.0 -0.1 0.1 -0.2 0.0 -0.2 -0.2 0.3 0.0 -0.1 0.0 -0.1 0.0 -0.3 0.1 0.0 0.1 0.0 0.0 0.0
AT -2.7 5.0 2.3 -0.5 -0.3 -0.8 0.2 0.1 0.2 0.0 0.1 -0.2 0.0 0.4 0.0 2.9 0.2 -1.4 0.0 -0.2 0.2 0.0 0.0 4.1 0.0 -0.1
PL -3.5 -3.4 -6.9 0.9 0.6 -0.2 0.2 0.0 0.2 0.2 0.0 0.2 0.0 0.1 0.0 -7.7 0.0 -9.3 0.0 0.0 0.1 0.2 0.9 0.3 0.0 0.0
PT -7.2 3.6 -3.5 -3.8 0.0 -2.7 -0.2 0.0 -0.1 -1.2 -0.3 -0.9 0.1 0.2 0.0 0.4 0.0 0.4 0.0 -0.4 -0.3 0.1 0.5 0.0 0.0 -0.1
RO -1.4 3.3 2.0 1.8 1.6 0.0 0.0 0.0 0.0 0.0 0.0 0.0 0.0 0.2 0.0 0.3 0.0 0.7 0.0 -0.2 -0.1 NA 0.0 0.0 0.0 -0.1
SI -5.4 12.6 7.2 8.0 5.8 -0.1 2.2 0.5 1.7 0.0 0.0 -0.1 0.0 0.2 0.0 -0.9 -0.1 -0.6 0.0 0.1 -0.3 0.0 0.0 0.0 0.0 0.1
SK -2.7 0.2 -2.5 -1.9 -2.9 0.0 0.1 0.0 0.1 -0.3 0.0 -0.3 0.0 1.1 0.0 -0.6 0.0 -0.3 0.0 -0.4 -0.1 0.0 0.2 0.1 0.0 -0.1
FI -3.2 4.3 1.2 0.3 -0.8 -0.6 -0.5 0.2 -0.7 0.9 1.1 -0.2 0.0 1.3 0.0 0.7 0.7 0.2 0.0 -0.1 0.0 0.0 0.0 0.0 0.0 0.1
SE -1.5 6.5 5.0 2.4 2.0 1.4 0.8 0.2 0.5 -0.4 -0.3 -0.1 -1.7 0.3 0.0 2.7 1.8 -0.1 -0.3 -0.5 0.3 0.0 1.4 0.0 0.0 -0.1
UK -5.7 5.8 0.1 0.8 0.4 0.3 0.3 0.0 0.3 -0.5 NA -0.5 0.0 0.2 0.0 -0.3 0.0 -0.1 -0.1 -0.2 0.2 0.0 -0.1 0.0 0.0 -0.3
EU 28 -3.0 3.0 0.1 0.4 0.3 -0.1 0.0 0.0 0.0 -0.1 0.0 -0.1 0.0 0.3 0.0 -0.2 0.1 -0.4 0.0 -0.3 0.1 0.0 0.2 0.1 0.0 -0.1
Euro
area 19 -2.6 2.6 0.0 0.1 0.2 -0.3 -0.1 0.0 -0.2 0.0 0.0 0.0 0.1 0.3 0.0 0.0 0.0 -0.1 0.0 -0.3 0.0 0.0 0.1 0.2 0.0 -0.1 More detailed breakdown is available in Eurostat's database: http://ec.europa.eu/eurostat/web/government-finance-statistics/data/database

16
Stock-flow adjustment to General government - 2015 [as % of GDP]April 2017 EDP notification
Net
bor
row
ing(
-)/le
ndin
g(+)
(B.9
) of
gene
ral g
over
nmen
t (S.1
3)
Cha
nge
in g
ener
al g
over
nmen
t (S.1
3)
cons
olid
ated
gro
ss d
ebt
Sto
ck -
flow
adj
ustm
ent (
SFA
)
Net
acq
uisi
tion
(+) o
f fin
anci
al a
sset
s
Cur
renc
y an
d de
posits
(F.2
)
Deb
t sec
urities
(F.3
)Lo
ans
(F.4
)
Sho
rt-te
rm lo
ans
(F.4
1), n
et
Long
-term
loan
s (F
.42)
Equ
ity a
nd in
vest
men
t fun
d sh
ares
/uni
ts
(F.5
)
Por
tfolio
inve
stm
ents
, net
Equ
ity a
nd in
vest
men
t fun
d sh
ares
/uni
ts
othe
r tha
n po
rtfol
io in
vest
men
ts
Fina
ncia
l der
ivat
ives
(F.7
1)
Oth
er a
ccou
nts
rece
ivab
le (F
.8)
Oth
er fi
nanc
ial a
sset
s (F
.1, F
.6)
Adj
ustm
ents
Net
incu
rrenc
e (-) o
f lia
bilit
ies
in fi
nanc
ial
deriv
atives
(F.7
1)
Net
incu
rrenc
e (-) o
f oth
er a
ccou
nts
paya
ble
(F.8
)
Net
incu
rrenc
e (-) o
f oth
er liab
ilitie
s (F
.1,
F.5,
F.6
and
F.7
2)
Issu
ance
s ab
ove(
-)/b
elow
(+) n
omin
al v
alue
Diff
eren
ce b
etwee
n in
tere
st (D
.41)
accr
ued(
-) an
d pa
id(+
)
Red
empt
ions
/repu
rcha
se o
f deb
t
abov
e(+)
/bel
ow(-) n
omin
al v
alue
App
reciat
ion(
+)/d
epre
ciat
ion(
-) o
f for
eign
-
curre
ncy
debt
Cha
nges
in s
ecto
r cla
ssifi
catio
n (K
.61)
(+/-)
Oth
er v
olum
e ch
ange
s in
fina
ncia
l lia
bilitie
s
(K.3
, K.4
, K.5
) (-)
Sta
tistic
al d
iscr
epan
cies
(1) (2) (3)
=(2)+(1)=(
4)+(20)+(3
0)
(4)
=(5)+(6)+(7)
+(14)+(17)+
(18)+(19)
(5) (6) (7)
=(10)
+(11)
(10) (11) (14)
=(15)
+(16)
(15) (16) (17) (18) (19) (20)
=(21)+(22)
+(23)+(24)
+(25)+(26)
+(27)+(28)
+(29)
(21) (22) (23) (24) (25) (26) (27) (28) (29) (30)
BE -2.5 1.8 -0.7 -0.1 0.1 0.0 0.1 0.0 0.1 -0.8 0.0 -0.8 0.2 0.3 0.0 -0.7 0.0 -0.1 0.0 -1.0 0.3 0.0 0.2 0.0 0.0 0.0
BG -1.6 0.5 -1.1 -2.1 -2.0 0.0 -0.5 0.1 -0.6 0.0 0.0 0.0 0.0 0.4 0.0 1.1 0.0 1.0 0.0 0.1 -0.1 0.0 0.1 0.0 0.0 -0.1
CZ -0.6 0.4 -0.3 0.3 0.1 0.0 -0.1 0.0 -0.1 -0.1 0.0 -0.1 0.0 0.4 0.0 -0.5 0.0 -0.3 -0.1 -0.1 0.1 0.0 -0.1 0.0 0.0 0.0
DK -1.3 -3.3 -4.7 -4.8 -2.6 0.0 -0.1 -0.1 0.0 0.4 0.0 0.4 -0.1 -2.4 0.0 0.2 0.0 0.0 0.0 0.1 0.0 0.0 0.2 0.0 0.0 -0.1
DE 0.7 -1.0 -0.3 -0.2 0.4 -0.1 -0.5 0.0 -0.5 0.0 0.1 0.0 0.0 0.0 0.0 0.0 0.0 -0.2 0.0 -0.1 0.1 0.0 0.2 0.0 0.0 -0.2
EE 0.1 -0.4 -0.3 -0.7 -1.5 -0.2 -0.2 0.0 -0.2 0.1 0.0 0.1 0.0 1.2 0.0 0.4 0.0 0.4 0.0 0.0 0.0 0.0 0.0 0.0 0.0 0.0
IE -2.0 -0.8 -2.7 -2.9 -0.1 -2.3 -0.4 -0.2 -0.2 0.1 0.4 -0.3 -0.1 -0.1 0.0 0.2 0.0 -0.1 0.0 -0.1 0.1 0.4 0.0 0.0 0.0 0.0
EL -5.9 -4.6 -10.5 -9.1 -1.6 -6.8 -0.3 -0.1 -0.2 0.4 0.1 0.3 0.0 -0.5 -0.2 -1.4 0.3 -1.2 0.0 0.0 -0.9 0.0 0.3 0.0 0.0 0.0
ES -5.1 3.0 -2.1 -1.3 0.1 -0.4 -0.3 0.0 -0.3 -0.4 0.0 -0.3 0.0 -0.5 0.0 -0.6 0.0 0.2 0.0 -1.1 0.3 0.0 0.0 0.0 0.0 -0.1
FR -3.6 2.7 -0.8 0.6 0.5 -0.3 -0.1 0.0 -0.1 0.1 0.0 0.1 0.0 0.3 0.0 -1.4 0.0 -0.6 0.0 -1.0 0.2 0.0 0.0 0.0 0.0 -0.1
HR -3.4 1.6 -1.8 -1.1 -1.7 -0.1 0.2 0.0 0.2 0.0 0.0 0.0 -0.2 0.6 0.0 -0.6 0.0 -0.8 0.0 0.3 -0.2 0.0 0.1 0.0 0.0 -0.1
IT -2.7 2.2 -0.5 -0.8 -0.6 0.0 -0.1 0.0 -0.1 -0.2 0.0 -0.2 0.2 -0.1 0.0 0.2 0.2 0.2 0.0 -0.3 0.1 0.1 0.0 0.0 0.0 0.1
CY -1.2 0.8 -0.4 -1.4 -1.9 0.0 0.1 0.0 0.1 0.0 0.0 0.0 0.0 0.4 0.0 1.0 0.0 0.3 0.3 0.0 -0.1 0.3 0.2 0.0 0.0 0.1
LV -1.3 -3.1 -4.4 -5.6 -4.9 0.0 -0.4 0.0 -0.4 0.0 0.0 0.0 -0.5 0.2 0.0 1.2 0.2 0.5 0.0 0.0 0.1 0.1 0.6 -0.3 0.0 0.0
LT -0.2 3.0 2.8 1.1 0.3 -0.1 0.0 0.0 0.0 0.2 0.0 0.2 -0.9 1.6 0.0 1.6 0.0 1.6 0.0 -0.1 0.1 0.0 0.0 0.0 0.0 0.1
LU 1.4 0.2 1.6 2.0 0.6 1.3 -0.1 0.1 -0.2 -0.5 -0.7 0.2 0.5 0.1 0.0 -0.3 0.0 -0.3 0.0 0.0 0.0 0.0 0.0 0.0 0.0 -0.1
HU -1.6 2.6 1.1 0.2 -0.9 0.0 0.0 0.0 0.1 0.4 -0.2 0.6 -0.8 1.5 0.0 0.8 0.1 0.6 0.0 -0.5 0.1 0.3 0.3 0.0 0.0 0.0
MT -1.3 2.2 0.9 0.9 0.5 0.0 -0.5 0.0 -0.6 -0.1 0.0 -0.1 0.0 1.0 0.0 0.0 0.0 0.1 0.0 -0.1 0.0 0.0 0.0 0.0 0.0 0.0
NL -2.1 -1.4 -3.5 -2.9 -0.2 -0.1 -0.6 0.0 -0.6 -0.7 0.0 -0.7 -0.9 -0.4 0.0 -0.6 0.0 -0.6 0.0 -0.3 0.1 0.0 0.1 0.0 0.0 0.0
AT -1.1 3.4 2.3 0.1 1.0 -0.7 -0.1 0.0 -0.1 -0.3 0.0 -0.3 0.0 0.2 0.0 2.6 0.1 -0.3 0.0 -0.5 0.1 0.0 0.4 2.7 0.0 -0.4
PL -2.6 3.1 0.5 0.1 -0.9 0.0 0.0 0.0 0.0 -0.1 0.0 -0.1 0.0 1.1 0.0 0.5 0.0 0.0 0.0 -0.1 0.1 0.0 0.5 0.0 0.0 0.0
PT -4.4 3.1 -1.3 -2.3 -1.7 -0.5 0.1 0.1 0.0 -0.1 -0.1 0.0 -0.2 0.2 0.0 1.0 0.0 1.0 0.1 -0.8 -0.3 0.2 0.7 0.2 -0.1 0.0
RO -0.8 1.0 0.2 0.4 -0.5 0.0 0.0 0.0 0.0 -0.1 0.0 -0.1 0.0 1.1 0.0 -0.2 0.0 0.1 0.0 -0.3 -0.1 NA 0.2 0.0 0.0 -0.1
SI -2.9 4.9 1.9 2.0 3.0 0.6 -1.7 -0.7 -1.0 0.2 0.0 0.2 -0.3 0.4 0.0 -0.2 0.0 0.2 -0.3 0.0 -0.1 0.0 0.0 0.0 0.0 0.1
SK -2.7 0.7 -2.0 -1.0 0.7 0.0 0.0 0.0 0.0 -1.3 0.0 -1.3 0.0 -0.3 0.0 -1.0 0.0 -0.8 0.0 -0.5 -0.1 0.0 0.4 0.0 0.0 -0.1
FI -2.7 4.6 1.9 1.3 2.6 0.0 -0.2 0.0 -0.2 -1.1 -0.6 -0.5 0.0 0.0 0.0 0.3 0.4 -0.6 0.0 0.0 0.0 0.0 0.5 0.0 0.0 0.3
SE 0.3 1.3 1.6 -0.7 -0.4 0.2 0.8 0.2 0.7 -1.4 -0.8 -0.6 -2.3 2.4 0.0 2.4 3.1 -1.0 -0.3 -0.5 0.3 0.2 0.6 0.0 0.0 -0.1
UK -4.3 3.3 -1.1 0.0 -0.2 0.9 0.0 0.0 0.0 -0.8 NA -0.8 -0.1 0.2 0.0 -0.9 0.0 -0.1 -0.1 -0.9 0.2 0.0 -0.1 0.0 0.0 -0.2
EU 28 -2.4 1.5 -0.9 -0.5 0.0 -0.1 -0.2 0.0 -0.2 -0.3 0.0 -0.2 -0.1 0.1 0.0 -0.3 0.1 -0.2 0.0 -0.5 0.1 0.0 0.1 0.1 0.0 -0.1
Euro
area 19 -2.1 1.1 -1.0 -0.6 0.2 -0.3 -0.3 0.0 -0.3 -0.1 0.0 -0.1 0.0 0.0 0.0 -0.3 0.1 -0.2 0.0 -0.5 0.1 0.0 0.1 0.1 0.0 -0.1 More detailed breakdown is available in Eurostat's database: http://ec.europa.eu/eurostat/web/government-finance-statistics/data/database
17
Stock-flow adjustment to General government - 2016 [as % of GDP]April 2017 EDP notification
Net
bor
row
ing(
-)/le
ndin
g(+)
(B.9
) of
gene
ral g
over
nmen
t (S.1
3)
Cha
nge
in g
ener
al g
over
nmen
t (S.1
3)
cons
olid
ated
gro
ss d
ebt
Sto
ck -
flow
adj
ustm
ent (
SFA
)
Net
acq
uisi
tion
(+) o
f fin
anci
al a
sset
s
Cur
renc
y an
d de
posits
(F.2
)
Deb
t sec
urities
(F.3
)Lo
ans
(F.4
)
Sho
rt-te
rm lo
ans
(F.4
1), n
et
Long
-term
loan
s (F
.42)
Equ
ity a
nd in
vest
men
t fun
d sh
ares
/uni
ts
(F.5
)
Por
tfolio
inve
stm
ents
, net
Equ
ity a
nd in
vest
men
t fun
d sh
ares
/uni
ts
othe
r tha
n po
rtfol
io in
vest
men
ts
Fina
ncia
l der
ivat
ives
(F.7
1)
Oth
er a
ccou
nts
rece
ivab
le (F
.8)
Oth
er fi
nanc
ial a
sset
s (F
.1, F
.6)
Adj
ustm
ents
Net
incu
rrenc
e (-) o
f lia
bilit
ies
in fi
nanc
ial
deriv
atives
(F.7
1)
Net
incu
rrenc
e (-) o
f oth
er a
ccou
nts
paya
ble
(F.8
)
Net
incu
rrenc
e (-) o
f oth
er liab
ilitie
s (F
.1,
F.5,
F.6
and
F.7
2)
Issu
ance
s ab
ove(
-)/b
elow
(+) n
omin
al v
alue
Diff
eren
ce b
etwee
n in
tere
st (D
.41)
accr
ued(
-) an
d pa
id(+
)
Red
empt
ions
/repu
rcha
se o
f deb
t
abov
e(+)
/bel
ow(-) n
omin
al v
alue
App
reciat
ion(
+)/d
epre
ciat
ion(
-) o
f for
eign
-
curre
ncy
debt
Cha
nges
in s
ecto
r cla
ssifi
catio
n (K
.61)
(+/-)
Oth
er v
olum
e ch
ange
s in
fina
ncia
l lia
bilitie
s
(K.3
, K.4
, K.5
) (-)
Sta
tistic
al d
iscr
epan
cies
(1) (2) (3)
=(2)+(1)=(
4)+(20)+(3
0)
(4)
=(5)+(6)+(7)
+(14)+(17)+
(18)+(19)
(5) (6) (7)
=(10)
+(11)
(10) (11) (14)
=(15)
+(16)
(15) (16) (17) (18) (19) (20)
=(21)+(22)
+(23)+(24)
+(25)+(26)
+(27)+(28)
+(29)
(21) (22) (23) (24) (25) (26) (27) (28) (29) (30)
BE -2.6 2.8 0.2 1.3 0.2 0.0 0.2 0.0 0.2 0.1 0.1 0.1 0.4 0.4 0.0 -0.4 0.0 0.0 0.0 -0.7 0.3 0.0 0.1 0.0 0.0 -0.7
BG 0.0 4.6 4.7 6.5 5.9 0.0 0.6 -0.1 0.7 -0.1 0.0 -0.1 0.0 0.0 0.0 -1.8 0.0 -1.9 0.0 0.1 -0.1 0.0 0.0 0.0 0.0 0.1
CZ 0.6 -1.7 -1.1 -1.2 0.7 0.0 -0.2 0.0 -0.2 0.0 0.0 0.0 0.0 -1.7 0.0 0.2 0.0 0.2 0.1 -0.2 0.1 0.0 0.0 0.0 0.0 -0.1
DK -0.9 -1.1 -2.1 -2.0 -2.1 -0.2 0.3 0.0 0.2 -0.4 0.0 -0.4 -0.1 0.5 0.0 -0.6 0.0 -0.6 0.0 0.0 -0.1 0.1 0.0 0.0 0.0 0.6
DE 0.8 -0.6 0.2 0.6 0.3 -0.1 0.2 0.0 0.2 0.0 0.1 -0.1 0.0 0.2 0.0 0.0 0.0 0.1 0.0 -0.2 0.1 0.0 0.0 0.0 0.0 -0.4
EE 0.3 -0.2 0.0 0.7 0.4 0.0 -0.1 0.0 -0.1 0.2 0.0 0.2 0.0 0.2 0.0 -0.7 0.0 -0.7 0.0 0.0 0.0 0.0 0.0 0.0 0.0 0.0
IE -0.6 -0.3 -0.9 -1.5 -1.2 -0.4 0.0 0.0 0.0 -0.1 0.1 -0.2 0.0 0.3 0.0 0.8 0.0 0.1 0.0 0.0 0.2 0.6 0.0 0.0 0.0 -0.3
EL 0.7 1.8 2.6 1.8 3.0 -0.2 -0.2 0.0 -0.2 -1.6 0.0 -1.5 0.0 0.8 0.0 0.8 0.0 1.2 0.0 0.0 -0.7 0.0 0.2 0.0 0.0 0.0
ES -4.5 3.0 -1.6 -1.1 -0.6 0.0 -0.1 0.0 -0.1 -0.1 0.0 -0.1 0.0 -0.3 0.0 -0.6 0.0 0.0 0.0 -0.9 0.3 0.0 0.0 0.0 0.0 0.0
FR -3.4 2.2 -1.2 0.0 -0.2 0.3 -0.2 0.0 -0.2 0.4 0.2 0.2 0.0 -0.3 0.0 -1.2 0.0 -0.6 0.0 -0.7 0.0 0.0 0.0 0.0 0.0 0.0
HR -0.8 -0.1 -1.0 -0.1 -1.4 0.0 0.6 0.1 0.5 -0.1 0.0 -0.1 -0.2 0.9 0.0 -0.9 0.0 -0.2 0.0 0.1 -0.1 0.0 -0.6 0.0 0.0 0.1
IT -2.4 2.7 0.3 0.9 0.6 0.0 0.0 0.0 0.0 0.2 0.0 0.2 0.3 -0.2 0.0 -0.4 0.2 -0.3 -0.1 -0.4 0.0 0.1 0.0 0.0 0.0 -0.2
CY 0.4 1.9 2.2 2.9 2.6 0.0 -0.1 0.0 -0.1 0.0 0.0 0.0 0.0 0.4 0.0 -0.7 0.0 -1.0 0.0 0.0 0.0 0.3 0.0 0.0 0.0 0.1
LV 0.0 4.6 4.6 4.8 3.8 0.1 -0.3 0.0 -0.3 0.6 0.1 0.5 -0.1 0.6 0.0 -0.3 0.1 -0.5 0.0 0.1 0.0 0.0 0.0 0.0 0.0 0.0
LT 0.3 -1.0 -0.8 -0.2 -1.0 0.0 0.0 0.0 0.0 0.2 0.0 0.2 -0.3 0.9 0.0 -0.5 0.0 -0.5 0.0 -0.2 0.2 0.0 0.0 0.0 0.0 -0.1
LU 1.6 -0.9 0.7 0.3 -1.1 0.5 -0.5 -0.4 -0.1 1.4 0.9 0.5 0.1 -0.1 0.0 1.0 0.0 1.0 0.0 0.0 0.0 0.0 0.0 0.0 0.0 -0.6
HU -1.8 1.5 -0.4 0.4 2.0 -0.1 0.0 0.0 0.0 0.0 0.0 0.0 -0.4 -1.0 0.0 -0.8 0.1 -0.8 0.0 -0.3 0.1 0.3 -0.2 0.0 0.0 0.0
MT 1.0 1.5 2.5 4.1 4.7 0.0 -0.1 0.0 -0.1 -0.1 0.0 -0.1 0.0 -0.4 0.0 -1.9 0.0 -1.8 0.0 -0.2 0.1 0.0 0.0 0.0 0.0 0.3
NL 0.4 -1.0 -0.6 -0.5 0.3 -0.1 -0.4 -0.1 -0.4 -0.4 0.0 -0.4 -0.9 1.0 0.0 -0.2 0.0 0.3 0.0 -0.3 0.1 0.0 0.0 -0.3 0.0 0.1
AT -1.6 1.5 -0.1 0.4 1.5 -0.2 -0.6 0.0 -0.5 -0.1 0.1 -0.2 -0.2 0.0 0.0 -0.5 0.2 0.0 0.0 -0.2 0.4 -0.5 0.1 0.0 -0.4 0.1
PL -2.4 4.7 2.3 1.9 0.9 0.1 0.1 0.0 0.0 -0.3 0.0 -0.3 0.0 1.1 0.0 0.4 0.0 -0.6 0.0 0.1 0.1 0.0 0.8 0.0 0.0 0.0
PT -2.0 5.1 3.1 2.7 2.5 0.0 0.0 0.0 0.0 -0.1 0.0 -0.1 -0.3 0.6 0.0 0.1 0.0 0.1 0.0 -0.2 -0.1 0.1 0.1 0.0 0.1 0.3
RO -3.0 2.1 -1.0 1.0 2.0 0.0 0.0 0.0 0.0 0.0 0.0 0.0 0.0 -1.0 0.0 -1.8 0.0 -1.6 0.0 -0.2 -0.1 NA 0.1 0.0 0.0 -0.1
SI -1.8 -1.0 -2.8 -5.0 -2.5 -0.2 -0.7 -0.3 -0.4 -0.7 0.0 -0.7 -0.8 0.0 0.0 2.3 0.0 0.4 0.0 0.0 -0.1 1.0 0.9 0.1 0.0 -0.1
SK -1.7 0.9 -0.7 0.2 0.8 0.0 0.1 0.0 0.1 0.0 0.0 0.0 0.0 -0.6 0.0 -1.2 0.0 -0.8 0.0 -0.4 -0.1 0.0 0.0 0.0 0.0 0.3
FI -1.9 1.2 -0.7 -0.3 -0.4 -1.2 -0.5 0.2 -0.7 2.1 2.3 -0.2 0.0 -0.2 0.0 -0.6 0.2 -0.9 0.0 -0.1 0.0 0.0 0.2 0.0 0.0 0.2
SE 0.9 -0.4 0.5 -0.8 0.3 0.6 0.3 0.1 0.2 -0.8 -0.6 -0.2 -1.5 0.3 0.0 1.5 2.0 -0.7 -0.3 -0.5 0.3 0.2 0.5 0.0 0.0 -0.1
UK -3.0 3.4 0.4 1.3 0.1 0.3 0.8 0.0 0.8 -0.2 NA -0.2 0.0 0.4 -0.1 -0.8 0.0 0.2 -0.1 -1.0 0.2 0.0 0.0 0.0 0.0 -0.1
EU 28 -1.7 1.6 -0.1 0.4 0.2 0.1 0.1 0.0 0.1 0.0 0.1 -0.1 -0.1 0.1 0.0 -0.4 0.1 -0.1 0.0 -0.5 0.1 0.0 0.0 0.0 0.0 -0.1
Euro
area 19 -1.5 1.3 -0.3 0.3 0.2 0.0 -0.1 0.0 -0.1 0.1 0.1 0.0 0.0 0.0 0.0 -0.4 0.1 -0.1 0.0 -0.4 0.1 0.0 0.0 0.0 0.0 -0.2 More detailed breakdown is available in Eurostat's database: http://ec.europa.eu/eurostat/web/government-finance-statistics/data/database

18
METHODOLOGICAL ANNEX
The Legal basis for the excessive deficit procedure (EDP) is Article 126 of the Treaty on the functioning of the European Union and Protocol 12 on the excessive deficit procedure annexed to the Treaty. Article 126 states that:
1. Member States shall avoid excessive government deficits. 2. The Commission shall monitor the development of the budgetary situation and of the stock of government debt in the Member States with a view to identifying gross errors. In particular it shall examine compliance with budgetary discipline on the basis of the following two criteria: (a) whether the ratio of the planned or actual government deficit to gross domestic product exceeds a reference value, unless: - either the ratio has declined substantially and continuously and reached a level that comes close to the reference value, - or, alternatively, the excess over the reference value is only exceptional and temporary and the ratio remains close to the reference value; (b) whether the ratio of government debt to gross domestic product exceeds a reference value, unless the ratio is sufficiently diminishing and approaching the reference value at a satisfactory pace.
The reference values are 3% for the deficit and 60% of GDP for the government debt in the annexed Protocol.
Source of fiscal data: Council Regulation 479/2009 defines the data to be reported by Member States to the European Commission in the context of EDP reporting2: the notification tables 1-4. In particular, EDP table 3A, “Provision of the data which explain the contributions of the deficit/surplus and the other relevant factors to the variation in the debt level (general government)”, is the basis for the comments and graphs presented in this document.
Detailed data, including tables as reported by Member States, can be found on the Eurostat website in the Government Finance Statistics, as well as in the dedicated EDP notifications sections.
Deficit: The Protocol on the excessive deficit procedure annexed to the Treaty requires that the government surplus/deficit is the net lending/net borrowing as defined by the European System of Accounts (ESA) of the general government sector3.
Net lending/net borrowing (B.9) is the balancing item of the capital account in ESA 2010. It is also calculated as the difference between total revenue and total expenditure of the general government sector as defined in the Regulation (EU) No 549/2013 of the European Parliament and of the Council of 21 May 2013 on
the European system of national and regional accounts in the European Union. For further details see ESA 2010 § 8.98 and 8.100 as well as chapter 20 of ESA 2010.
Government gross debt4: According to the protocol annexed to the Treaty, the government debt is the gross debt outstanding at the end of the year of the general government sector measured at nominal value and consolidated. Council Regulation 479/2009 defines further the government debt as the sum of government liabilities in Currency and deposits (AF.2), Debt securities (AF.3) and Loans (AF.4). The Regulation further specifies that nominal value for government debt excludes accrued interest (for most debt instruments) and corresponds to face value.
Consolidation: Member States debt data should be reported consolidated at the level of the general government sector. Consolidation, as defined in ESA 20105, means presenting data relating to a grouping of units as if they were one unique unit. This involves the elimination from both uses/assets and resources/liabilities of all reciprocal links: transactions as well as revaluations, other changes in volumes and stocks, that occur or exist between units which belong to the same grouping — in this case to the general government sector (or its sub-sector). Thus, government gross debt is to be consolidated: therefore holdings of government debt by government units must be excluded.
By the same token, all items reported in EDP table 3A should be also presented on a consolidated basis: not only those related to transactions (e.g. a loan given by central government to a local government unit should be removed from the calculation of the consolidated debt of general government sector as well as from the calculation of loans assets), but also valuation adjustments (such as issuance and redemptions of debt above and/or below par, as well as foreign exchange valuation) and other economic flows adjustments (other volume changes in financial liabilities).
Geographical information: Euro area (EA19): Belgium, Germany, Estonia, Ireland, Greece, Spain, France, Italy, Cyprus, Latvia, Lithuania, Luxembourg, Malta, Netherlands, Austria, Portugal, Slovenia, Slovakia and Finland. In the attached table, the euro area is defined as including Latvia and Lithuania for the full period, although Latvia joined the euro area on 1 January 2014 and Lithuania on 1 January 2015.
Up to 30 June 2013, the European Union (EU27) included 27 Member States. From 1 July 2013 the European Union (EU28) also includes Croatia. In the attached table, all periods refer to the EU28.
2 Excessive Deficit Procedure (EDP) reporting as requested in the Protocol annexed to the Treaty on functioning of the European Union (consolidated version
2012, see Official Journal C 326/47 of 26.10.2012) and related legal acts.
3 ESA 2010 §2.111-2.113 describes the general government sector as the institutional sector principally engaged in the redistribution of national income and
wealth and /or mainly producing non-market output intended for individual and collective consumption, and mainly financed by compulsory payments. For
more information on general government sector see also chapter 20 of ESA 2010 and table 24.5 in chapter 24. 4 The outstanding general government consolidated debt at the end of each year is reported by Member States in EDP table 1 of the notification tables,
according to the European legislation.
5 See ESA 2010 § 1.106-1.109.