Embed Size (px)
Citation preview

1
Stock Market Returns to Financial Innovations Before and During the
Financial Crisis in US and Europe
Lisa Schöler, Bernd Skiera, and Gerard J. Tellis
Lisa Schöler, Department of Marketing, School of Business and Economics, Goethe University
Frankfurt, Grueneburgplatz 1, 60629 Frankfurt, Germany, Phone: +49.69.798.34632, Fax:
+49.69.798.35001, email: [email protected].
Address correspondence to: Bernd Skiera is Chaired Professor of Electronic Commerce,
Department of Marketing, School of Business and Economics, Goethe University Frankfurt,
Grueneburgplatz 1, 60629 Frankfurt, Germany, Phone: +49.69.798.34649, Fax:
+49.69.798.35001, email: [email protected].
Gerard J. Tellis is Professor of Marketing and Management & Organization, Director of the
Center for Global Innovation and Neely Chair in American Enterprise at the Marshall School of
Business, University of Southern California. Address: P.O. Box 90089-1421, Los Angeles,
California, USA. Phone: +1.213.740.5031, Fax: +1.213.740.7828, email: [email protected].

2
The Value of Financial Innovations
Dr. Lisa Schöler is a consultant and was a former doctoral student in marketing at the Goethe
University, Frankfurt, Germany and also a member of the E-Finance Lab. Her research interests
include innovation management, viral marketing, and marketing-finance interface.
Dr. Bernd Skiera is a chaired professor of electronic commerce at the marketing department of
the Faculty of Business and Economics at the Goethe University, Frankfurt, Germany, where he
is also a cofounder and member of the board of the E-Finance Lab. His research interests include
electronic commerce, online marketing, pricing, prediction markets, and customer management.
His work has been published in Management Science, Marketing Science, Journal of Marketing
Research, Journal of Marketing, Journal of Product Innovation Management, Journal of
Forecasting, Journal of Interactive Marketing, Journal of Retailing and Consumer Services,
Journal of Service Research, and European Journal of Operational Research.
Gerard J. Tellis (PhD Michigan) is Professor, Neely Chair of American Enterprise, and Director
of the Center for Global Innovation, at the USC Marshall School of Business. He is an expert in
innovation, advertising, new product growth, emerging markets, and global market entry. He has
published 5 books and over 100 papers (http://www.gtellis.net) that have won over 20 awards,
including the Long Term Marketing Science, Frank M. Bass, William F. Odell, Harold D.
Maynard (twice), and Converse award for lifetime contributions to research. His new book,
Unrelenting Innovation, explains how transforming culture can enable firms to stay relentlessly
innovative. His book Will and Vision (co-authored with Peter Golder) was cited as one of the top
10 books by the Harvard Business Review and was the winner of the AMA Berry

3
The Value of Financial Innovations
Abstract
Prior studies have focused on innovations in various contexts but largely excluded
financial innovations, despite their notable importance. Not surprisingly, financial innovations
account for a substantial portion of world economies and the huge market capitalization of bank.
Therefore, the authors focus on studying the type, success, and causes of success of financial
innovations. Using an event study and financial expert ratings, this study analyzes the types of
and payoffs to 428 financial innovations by 39 major banks in North America and Western
Europe between 2001 and 2010. The results indicate that security and credit instruments
constitute the most common financial innovations, which vary substantially by economic cycles
and location. The average cumulative abnormal stock market returns to a financial innovation are
$146 million. Thus, the market considers financial innovations profitable, not harmful, despite
their apparent responsibility for the financial crisis. Surprisingly, the cumulative abnormal
returns to financial innovations are higher in recessions than in expansions. The authors find that
riskiness and radicalness of the innovation increases abnormal returns while complexity
decreases cumulative abnormal returns. Two interaction effects stand out: Riskiness of financial
innovations has higher cumulative abnormal stock market returns in the United States than in
Western Europe. Radicalness has lower cumulative abnormal stock market returns in recessions
than in expansions. The authors recommend that banks need to time their launch of radical
financial innovations to coincide with periods of expansion rather than recessions.
Keywords: financial innovations, complexity, financial risk, radicalness, stock market returns

4
Acknowledgments: The authors thank Manuel Bermes (Goethe University Frankfurt), Abhishek
Borah (University of Southern California); Ashish Sood (Emory University); Cheryl Tellis; the
participants of the marketing research seminar (Goethe University Frankfurt) for their support
and helpful guidance. This study benefited from financial support of the E-Finance Lab at
Goethe-University and a grant from Don Murray to the USC Marshall Center for Global
Innovation.

5
In 2008, the world economy plunged into a major recession, caused primarily by the crisis in
financial markets. Much of this crisis could be attributed to high-risk and complex financial
innovations introduced during 2000–2008 (e.g., Sommer 2008), including those related to
subprime mortgages and credit default swaps. In response, observers have called for more
regulation over financial innovations (e.g., Stiglitz 2009), as well as investigations into the kinds
of financial innovations that exist, their effects (Frame and White 2004), and the potential drivers
of their financial success (e.g., financial risk, complexity).
Financial innovations are one of the most important service innovations because they
have offered substantial benefits to consumers, fostered the growth of national economies, and
may have sparked the recent financial crisis (e.g., Lerner and Tufano 2011; Sommer 2008;
Skiera, Bermes and Horn 2011). For example, financial innovations are responsible for home
mortgages, student loans, and auto loans, which empower lower and middle class consumers;
credit to entrepreneurs who have built successful enterprises; and credit to emerging markets,
which has helped raise millions of people out of dire poverty. Not surprisingly, such innovations
account for a substantial portion of world economies and the huge market capitalization of banks
(Lerner and Tufano 2011).
Although the literature on innovations contains extensive investigations of the drivers and
financial success of innovations, most studies ignore service innovations (e.g., Papastathopoulou
and Hultink 2012; Storey and Easingwood 1998; Soukhoroukova, Spann and Skiera 2012). The
missing research on service innovations is especially surprising because they begin to dominate
much economic activity (e.g., Ettlie and Rosenthal 2011; Wooder and Baker 2011). And in the
existing service innovation literature financial innovations have been largely ignored (Sorescu
2011). In the finance literature, despite the widely recognized rapid growth of financial

6
innovations, research into them is relatively scarce, especially pertaining to various kinds of
innovations, their financial success, and the drivers of their success. According to Frame and
White (2004, 116), “Everybody talks about financial innovation, but (almost) nobody empirically
tests hypotheses about it.” This succinct statement is a clear indication of the need for more
research that not only tests relevant hypotheses but also provides an overview of the different
kinds of financial innovations and their distribution.
From the firm perspective, innovations (focusing specifically on service innovation, i.e.,
product innovation, not process innovation) in the financial sector differ from those in the
manufacturing sector in several ways (Lerner and Tufano 2011). First, financial innovations
likely create a complex web of positive and negative externalities, because the financial system
is highly interconnected. Thus any evaluation of the consequences of innovations is challenging.
Second, the regulation of financial innovations is complex and dynamic (i.e., regulation
stimulates innovations; innovations stimulate regulation). When a new financial reform is
passed, it exerts unknown influences on the pace and direction of financial innovations. Third,
banks have earned limited patent protection over their financial innovations. So, competitors can
quite easily copy them.
From the consumer perspective, another two aspects of financial innovations make them
unique (Lerner and Tufano 2011). First, their complexity makes consumers’ embrace of financial
innovations difficult, yet complexity may be necessary to produce consumer benefits. Second,
though all innovations involve some financial risk, the returns to financial innovations are
intimately tied to their riskiness (i.e., risk-return trade-off). Again, financial risk may be
necessary to provide benefits but difficult for consumers to embrace (e.g., if a consumer buys a
bond, the bond will have some risk otherwise it will not have a return above the risk-free rate).

7
These variations from other types of innovations in other industries create the need to study
financial innovations as phenomena in their own right (Lerner and Tufano 2011).
Because the consumer perspective is highly relevant for marketing, this article focuses on
two drivers of financial innovations, complexity and riskiness, in addition to the degree of
radicalness, a feature common to all innovations (Chandy and Tellis 1998; 2000). Given the
importance of financial innovations and service innovations (de Brentani 2001), the paucity of
research on this topic, and the critical role they played in the recent financial crisis, this study
seeks answers to the following questions:
1. How are various kinds of financial innovations distributed?
2. What are the stock market returns to these financial innovations?
3. How do the complexity, financial risk, and radicalness of financial innovations
affect their stock market returns?
4. How do economic cycles and locations affect the distribution of and stock market
returns to financial innovations?
To answer these questions, a unique data set, including ratings of three drivers of
innovations by financial experts who adopt a consumer perspective, was assembled. Based on
this data, the article investigates how financial innovations vary during recessionary versus
expansionary times in the United States versus Western Europe between 2001 and 2010. The
inclusion of different countries in the dataset follows the call in literature to analyze international
data sets (Papastathopuolou and Hultink 2012).
The remainder of the article is organized as follows: First, an overview of the theoretical
background of financial innovations is provided and then hypotheses regarding their likely

8
drivers are developed. Next, the method, sample, and findings are presented. The conclusion
features a discussion of the implications and limitations of this study.
Theoretical Background
This section provides a definition of financial innovations and a brief overview of the functions
of financial innovations. It then briefly describes stock market return and develops hypotheses
about the impact of complexity, financial risk, radicalness and the moderating effect of economic
cycles and location on stock market returns.
Financial Innovations
Following Tufano (2004), financial innovation is defined as the act of creating and then
commercializing new financial instruments. As such, these innovations are all service
innovations, even though some may be for “products” and some for “processes.” This article
focuses on financial product innovations (not process innovations) because financial product
innovations were responsible for the modern financial crisis and are the focus of calls for more
regulation.
Financial innovations fulfill various functions. First, they might overcome moral hazard
and information asymmetries (e.g., by forcing the issuer to release more information as is the
case for income bonds). Second, financial innovations might lower transaction or search costs
(e.g., buying an index certificate instead of stocks from the index to replicate it). Third, financial
innovations can be a response to taxes (e.g., zero coupon bonds allowed for the deduction of a
discount relative to their par value) and regulations (e.g., Eurodollar CDs allowed U.S. banks to
circumvent reserve requirements to stem the painful disintermediation they were experiencing).
When new regulations pass, financial innovations represent responses to them; then regulatory
bodies adjust in reaction to the latest financial innovations. Fourth, financial innovations can help

9
manage the risks and volatility created by globalization (e.g., foreign exchange futures help
overcome the risk of increasing exchange rates) (Tufano 2004).
Stock Market Return
The stock market return is the percentage change in stock price (after adjusting for stock
splits and dividends) due to the arrival of new information. Thus, when new information
becomes public, the market rapidly assimilates the new information’s financial implications into
the stock price. As such, events with a positive (negative) change in firm’s future cash flows will
have a positive (negative) impact on the stock price because investors will buy (sell) stocks.
Drivers of Returns to Financial Innovations
This article considers three such drivers: complexity, financial risk, and radicalness.
Complexity. Rogers’s (2003) classic work on the diffusion of innovations cites
complexity as an important driver of innovation’s success. This article similarly defines
complexity as the degree to which a financial innovation is difficult for the consumer to
understand (Rogers 2003). It drives financial innovations’ effect on stock market returns—
though reasons exist for a positive or negative effect.
On the one hand, financial innovations have negative impacts on stock market returns,
through low adoptions and high costs, which in turn lower cash flows and therefore stock market
returns. Complex financial innovations can have low adoptions (Rogers 2003) for several
reasons.
First, if a financial innovation is complex many consumers may not understand its
potential benefits (de Brentani 2001). These consumers may refuse to acquire the necessary
knowledge and simply reject the financial innovation (Mählmann 2012). Especially for complex
service innovations, consumers then have to rely on faith and trust (de Brentani 2001). In

10
contrast, the learning costs for simple financial innovations are low, so consumers may be more
likely to adopt them.
Second, even if consumers are willing to acquire the required knowledge, complexity
evokes negative emotional reactions, such as frustration, stress, or anxiety (Mick and Fournier
1998). Many consumers are afraid of complex innovations because they fear the unknown (de
Brentani 2001). Such negative emotions may lead consumers to avoid complex financial
innovations.
Third, complexity also makes it more difficult for consumers to compare financial
innovations to evaluate which one fits their needs best. Therefore, consumers may simply refuse
to adopt complex financial innovations (Campbell et al. 2011). Thus, complex financial
innovations have the ability to decrease cash flows and stock market returns through low
adoptions.
At the same time, complex financial innovations can increase costs, in that complex
financial innovations demand more development, marketing, and distribution costs than do
simple ones (e.g., Wuyts et al. 2004). In the financial industry, such costs take the form of costly
financial, legal, and IT talent to design, scrutinize, implement, and debug innovations. Higher
complexity leads to higher costs. Thus, complex innovations can also decrease cash flows and
stock market returns through higher costs. This line of reasoning suggests:
H1a: The more complex a financial innovation, the more negative is its impact on stock
market returns.
On the other hand, complex financial innovations could lead to higher sales or higher
prices, and thus have a positive impact on stock market returns, for the following reasons. First,
the probability of imitating a financial innovation decreases with increasing complexity and the

11
resulting lower competition yields higher sales and prices (Charupat and Prisman 2004; Skreta
and Veldkamp 2009). Second, because consumers know that complex innovations often offer
unique benefits to consumers, they are prepared to undertake the needed learning so they can
adopt the complex innovation (de Brentani 2001). In this case, complex financial innovations can
increase cash flows and stock market returns. This line of reasoning suggests:
H1b: The more complex a financial innovation, the more positive is its impact on stock
market returns.
Financial risk. Following prior research, financial risk is defined as the possible loss of cash or
non-cash benefits by a consumer (e.g., Sweeney, Soutar, and Johnson 1999) and consider it
central to consumers’ evaluation, choice, and adoption of financial innovations (Dowling 1999).
In the interest of brevity, the authors use the term “risk” to mean financial risk hereafter. Extant
research confirms that risk drives financial innovations’ effect on firm stock market returns. Here
again, there is no consensus on the direction of that effect.
On the one hand, several studies suggest that risky innovations lead to positive consumer
reactions and high sales, with a positive impact on stock market returns. First, consumers may be
risk seeking, and when firms cite the positive potential gains from financial innovations, the
positive feelings associated with the anticipation of gains (e.g., excitement) promote risk seeking
behavior (Knutson et al. 2005). Second, consumers also might invest more in high-risk financial
innovations than in low risk financial innovations because they are “myopic loss averse”—that
is, loss averse only in the short term (Benartzi and Thaler 1999). Thus, they seek more risk when
they make investment decisions that should take longer to pay off. Third, the risk-return trade-off
is fundamental in finance and states that higher risk must be rewarded with higher returns. Thus,
risky innovations might be attractive for consumers who want to pursue greater returns so that

12
more risky innovations may increase cash flows and stock market returns through higher sales.
This line of reasoning suggests:
H2a: The more risky a financial innovation, the more positive is its impact on stock
market returns.
On the other hand, consumers—and thus sales, cash flows, and stock market returns—
may respond negatively to risk. First, consumers are generally risk averse if the outcome is
uncertain. Therefore, financial innovations with higher risk are less likely to get adopted by
consumers than financial innovations with lower risk (Hwang and Satchell 2010). Additionally,
service innovations such as financial innovations are generally perceived to possess more risk
than other products, e.g. consumer durables (Storey and Easingwood 1998). Second, in contrast
with risk-return trade-off theory, some studies suggest a negative relation between risk and return
(e.g., Campbell 1987), such that consumers have no real incentive to buy riskier financial
innovations. Therefore, the likelihood of adoption should decrease with higher risk. Thus, more
risky innovations may decrease cash flows and stock market returns through low sales. This line
of reasoning suggests:
H2b: The more risky a financial innovation, the more negative is its impact on stock
market returns.
Radicalness. Radicalness accelerates consumer adoption (Holak and Lehmann 1990) and
drives new product success (Montoya-Weiss and Calantone 1994; Chandy and Tellis 2000).
Here, radicalness is defined as the degree to which innovations are perceived as totally different
and provide novel and substantial benefits (e.g., de Brentani 2001). In contrast to radical
financial innovations, incremental financial innovations only deliver marginally superior benefits
to consumers and include me-too products (e.g., de Brentani 2001).

13
Radical financial innovations should have a positive impact on stock market returns
through high prices and high sales, which increase cash flows and stock market returns through
two pathways: through high price or through high sales.
Radical financial innovations increase cash flows through high prices for the following
reasons. First, firms can charge higher prices for radical financial innovations by targeting
premium segments (e.g., innovators, early adopters) with higher willingness to pay (Tufano
2004). Second, because radical financial innovations are more difficult to imitate, the firm can
charge a premium price above that charged by competitors (de Brentani 1989; 2001).
Radical financial innovations can also increase cash flows through high sales in three
ways: increasing the market share within an existing market, increasing the market size, or
creating entirely new markets. First, the introducing bank can increase its market share because
radical innovations make existing offerings obsolete (de Brentani 1989; 2001). Second, radical
financial innovations can increase the size of the market (de Brentani 2001; Tufano 1989). Third,
radical innovations also have the ability to create entirely new markets with new choices for
investing and consuming for new customers (Lerner and Tufano 2011). Creating entirely new
markets is likely because radical innovations provide new ways to solve customer problems and
bring substantial new benefits to the customers (de Brentani 2001; Tellis 2013). Thus:
H3: The more radical a financial innovation, the more positive is its impact on stock
market returns.
Economic conditions (recession vs. expansion). Recession is defined as a decline in gross
domestic product (GDP) for two or more consecutive quarters (Srinivasan, Lilien, and Sridhar
2011). Recessions severely hinder the financial performance of financial innovations and also
might moderate the impact of radicalness on stock market returns for several reasons. First,

14
during a recession, consumers limit their spending for premium priced radical financial
innovations and wait for better times (i.e., expansions); their willingness to buy premium priced
financial innovations likely decreases precipitously (Carow 1999). Instead, they prefer
incremental financial innovations that are competitively priced, especially in response to their
substantial uncertainty about future economic conditions (Gale 1996).
Second, even if the radical innovation is not premium priced, a recession causes a decline
in consumers’ disposable incomes, likely prompting consumers to stop adopting radical financial
innovations, especially because radical financial innovations are less well known to consumers
than incremental innovations or older products. Even if consumers still buy radical financial
innovations, they may decrease the quantity bought because of their lower disposable incomes,
relative to that in an expansion phase. That is, they still depend on financial innovations (e.g., a
mortgage to buy a house), but their anticipation of future income increases is more conservative
(Katona 1975). Thus, it is anticipated that the positive impact of radical financial innovations on
stock market returns gets mitigated during a recession. This line of reasoning suggests:
H4: The more radical a financial innovation in a recession, the more negative is its
impact on stock market returns.
Recessions also might moderate the impact of risk on stock market returns for several
reasons. First, consumers often become more risk averse, pessimistic, and conservative in a
recession (Rigby 2001), because they are uncertain about future economic conditions and future
incomes. Thus, they buy financial innovations with less risk (Lamey et al. 2007). Second,
financial literature shows that the positive relation between risk and return is less pronounced
during recessions (Mayfield 2004). Therefore, consumers are less willing to adopt riskier

15
financial innovations in a recession. Thus, the negative effect of risk on stock market returns may
be accentuated. This line of reasoning suggests:
H5: The more risky a financial innovation in a recession, the more negative is its impact
on stock market returns.
Location (U.S. vs. Western Europe). This article considers location in broad terms (U.S. vs.
Western Europe) and predicts that it might moderate the impact of radicalness on stock market
returns for the following reasons. First, there is a common belief that U.S. consumers are more
innovative than those in Western Europe. So, many firms introduce innovations in the United
States first (Lee 1990). If this belief is true, location (U.S. vs. Western Europe) should affect the
likelihood of consumers adopting radical financial innovations. Second, their relatively high per
capita income and low taxes may make U.S. consumers more willing to buy premium-priced
radical financial innovations, compared with consumers in Western Europe (Bureau of Economic
Analysis 2011). Thus, the impact of radicalness on stock market returns will be accentuated in
the US relative to Western Europe. This line of reasoning suggests:
H6: The more radical a financial innovation in the United States, the more positive is its
impact on stock market returns.
Finally, prior studies suggest that location also might moderate the impact of risk, though
without any consensus about the direction of the moderating effect. On the one hand, because
U.S. consumers appear more risk seeking than Western European consumers (e.g., Hofstede
2003), adopters in Western Europe may be more averse to riskier financial innovations. In
addition, consumers save less in the United States than in Western Europe (Bureau of Economic
Analysis 2011; Eurostat 2011), which is an indication of risky behavior. Such behavior suggests
that the adoption of risky innovations may be more likely in the United States than in Western

16
Europe. Thus, the impact of risk on stock market returns will be accentuated in the US relative to
Western Europe. This line of reasoning suggests:
H7a: The more risky a financial innovation in the United States, the more positive is its
impact on stock market returns.
On the other hand, risk might not be valued differently; several studies indicate explicitly
that average risk aversion for financial innovations does not differ significantly between the
United States and Western Europe (Szpiro and Outreville 1988). Therefore, there may be no
difference in the adoption of risky financial innovations by countries. Second, the average risk
premium for financial innovations is not different between the US and Western Europe which is
an indication that risk is “valued” equally in both locations (Pastor, Sinha, and Swaminathan
2008). Thus, the impact of risk on stock market returns does not depend on location. This line of
reasoning suggests:
H7b: Stock market returns for risky financial innovations in the United States are similar
to those for risky financial innovations in Western Europe.
Method
To test the hypotheses, the authors adopt an event study, which allows one to estimate the
change in stock price in response to the arrival of new information. It rests upon the assumption
that stock prices are efficient such that the market immediately assimilates into the stock price
the financial value of new information. In this case, the new information involves
announcements of various financial innovations by innovating institutions. Their financial value
depends on the market's expectation of consumers' reactions to the financial innovation. So the
change in the innovator’s stock price serves as the measure of the value of these reactions.

17
In contrast with prior research, this article utilizes a cross-national study to estimate the
impact of major geographic regions. The authors turn to the market model (Fama and French
1993) to estimate abnormal returns (e.g., Sood and Tellis 2009):
(1) 1mjtijt ft ij ij ft ijtR R α β ( R )R
,
where t is the index for time, i is the index for the announcement, and j is the firm index; Rijt
represents the return of the respective stock of firm j for announcement i; mjtR denotes the return
on the portfolio representing a market m (i.e., index for U.S. banks, index for Western Europe
banks) for firm j on day t; Rft indicates the return on an investment with zero risk on day t.
Equation 1 is estimated for each announcement with an estimation period from 250 to 6
days prior to each announcement. The abnormal returns (ARijt) to the announcement are
computed as the difference between the normal return that would have occurred if the
announcement had not taken place and the actual return that occurred because of the
announcement:
(2)
1ˆˆ[( ( )]
ijt ijt ijt
mjtijt ft ij ij ft
AR R E R
R R RR
,
where Rijt is the actual return, and E(Rijt) is the expected return without the announcement. Next,
the cumulative abnormal returns (CARij) is computed for several event windows
(3)
2
1
t t
ij ijt
t t
CAR AR
,
where t1 is the beginning of the event window, and t2 is its end. Thus, the cumulative average
abnormal return for all N announcements is:
(4) 1 1
1 jn m
ij
i j
CAAR CARN
.

18
The authors estimate the following model to determine the effects on cumulative abnormal
returns:
(5)
1 2 3 4
5 6 7 8
9 10
11 12
ij ij ij ij ij
ij ij ij ij
ij ij
ij ij ij
CAR Complexity Risk Radicalness Recession
Country Security Fund Credit
AccountManagement Assets
Radicalness Recession Risk Recessio
13 14
ij
ij ij ij ij ij
n
Radicalness Country Risk Country ,
where the subscripts refer to announcement i and firm j.
Sample
In line with prior studies (e.g., Furst, Lang, and Nolle 2002; Lerner 2002), the banking
industry was chosen as the focus of our study. Other than mutual funds, government bodies, and
brokerage firms, banks are the main actors in the financial sector (Ryan, Trumbull, and Tufano
2010) and introduce the most financial innovations (Tufano 2004). Because banks can introduce
any kind of (legal) financial innovations, they also represent a representative sample of financial
innovations. In addition, because they are stock listed, banks provide financial data.
Five important countries were chosen for the banking industry: the United States,
Germany, United Kingdom, Switzerland, and France. The sample contains the biggest banks in
each country, as well as a random sample of other stock listed banks.
To investigate the effects of complexity, risk, and radicalness of an innovation on stock
market returns to the announcement of an innovation, this article relies on several types of
information, including (1) information indicating the announcement date; (2) stock price
information (i.e., stock market reactions) for the announcing bank; (3) judgments from financial
experts on complexity, risk, and radicalness of each financial innovation; and (4) moderators
(economic conditions and location) and control variables (total assets derived from Compustat).

19
Our dependent variable is the cumulative abnormal return to a financial innovation,
which is captured by analyzing abnormal changes in stock prices (the source for stock prices is
Datastream) in response to announcements of innovations. These announcements may come
from the banks themselves or be reported in the press. The authors sample all product
announcements publicized as press releases on banks’ websites and announcements from the
Dow Jones Factiva and LexisNexis electronic databases. To eliminate potential omitted variable
bias and noise, any events that might have been affected by other announcements are excluded,
because they occurred in the same event window.
Our sample features both up and down markets (recession data from Census Bureaus) in
both North America and Europe, which differ in their risk tolerance and innovativeness. For
example, our study period includes the biggest boom and bust in the stock market since the great
depression. Thus, the time period and location provide particularly suitable sampling frames for
studying varying responses to the complexity, riskiness, and radicalness of financial innovations.
In total, our final sample consists of 428 product announcements from 39 banks in the United
States and Western Europe (Germany, United Kingdom, Switzerland, and France) from 2001 to
2010. Each bank made an average of 11 announcements. Banks or news sources announce their
most important innovations, so our sample of announcements also should be representative of the
most important financial innovations launched by anyone during this period.
Our data set is unique because the ratings of the complexity, risk, and radicalness were by
three experts from the financial industry, who rated innovations from the consumer’s point of
view. Former studies do not contain ratings from experts. For the ratings, scales have been
adapted from previous research. For radicalness, the authors adapted the scale from Moreau,
Lehmann, and Markman (2001): How innovative do you think this product is? (minor variation =

20
1/completely new = 7). For complexity, we adapted the scale from Labay and Kinnear (1981):
The product is (not complex = 1/very complex = 9). And for financial risk, a scale was adapted
from Shimp and Bearden (1982): The investment associated with the purchase of a ___, how
risky would you say purchasing the ___would be? (Not risky at all = 1/Very risky = 9). The
interrater reliability for radicalness, complexity and financial risk is quite high (see the
Appendix).
Results
Descriptive Statistics
Financial innovations consist of five product groups: securities, funds, credit, account
management, and insurances. For example, a security innovation would be the commercial
mortgage-backed securitization launched by Deutsche Bank. The loans get secured on a wide
range of commercial properties, including offices, retail, industrial, residential, hotels, and pubs.
Goldman Sachs launched a U.S. equity fund for investors that seek equity growth opportunities
and cash flow. To help low- and moderate-income families buy homes, Citigroup introduced a
lower-income program. Bank of America introduced the “Keep the Change” program for
customers with an account: The bank rounds up all debit card purchases to the nearest dollar
amount, then transfers the difference from the customer’s checking account to a savings account.
Finally, as an example of an insurance innovation, the launch of “Proteski Pinjaman Mitra” by
HSBC offers a new credit life protection product.
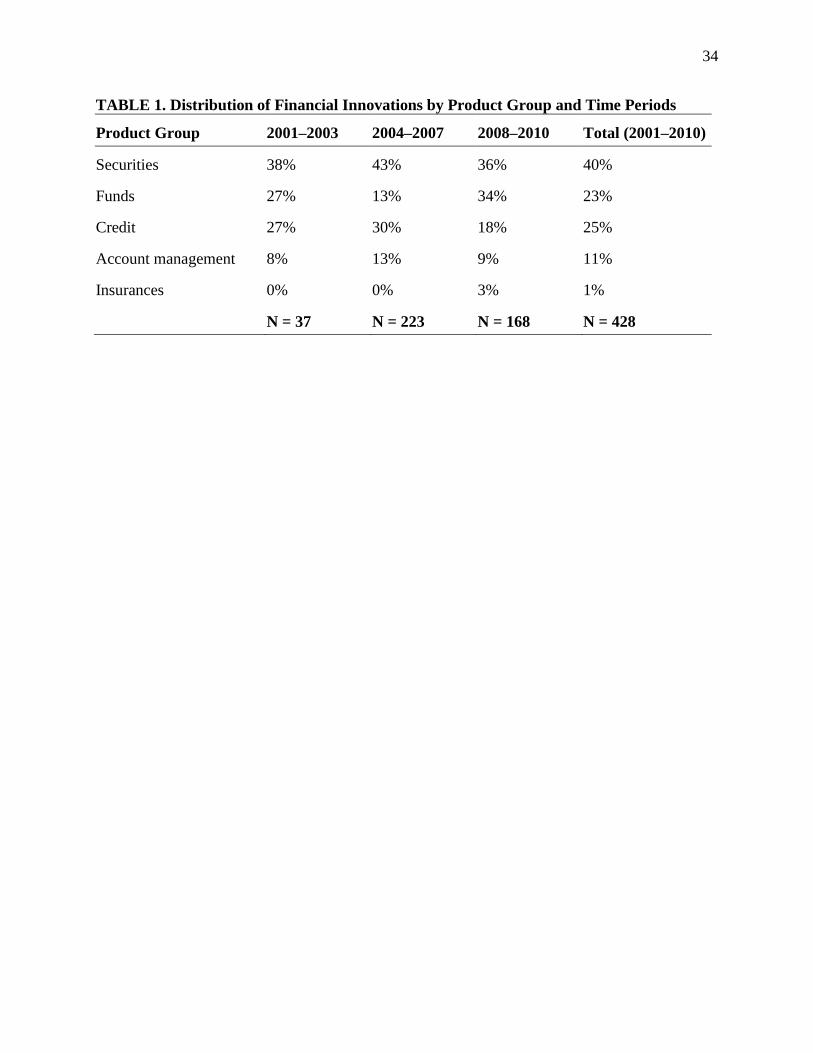
TABLE 1 depicts the distribution of financial innovations by product group and time
periods. Security and credit innovations are the most frequent innovations; insurance innovations
are the rarest. A χ2 test is used to test differences between periods for each product group. The
percentage of security and account management innovations remained stable both before and

21
during the financial crisis, whereas the percentage of credit innovations decreased during the
financial crisis (2008–2010 vs. 2004–2007; p < .01). This change might partly be due to the
popularity of subprime mortgages and credit default swaps prior to 2008 and their vast
unpopularity after the credit bubble burst. The percentages of fund and insurance innovations
increased during the financial crisis compared with 2004–2007 (p < .01); the increase in fund
innovations may reflect banks’ increased efforts to introduce ways to spread risk.
---Insert TABLE 1 about here---
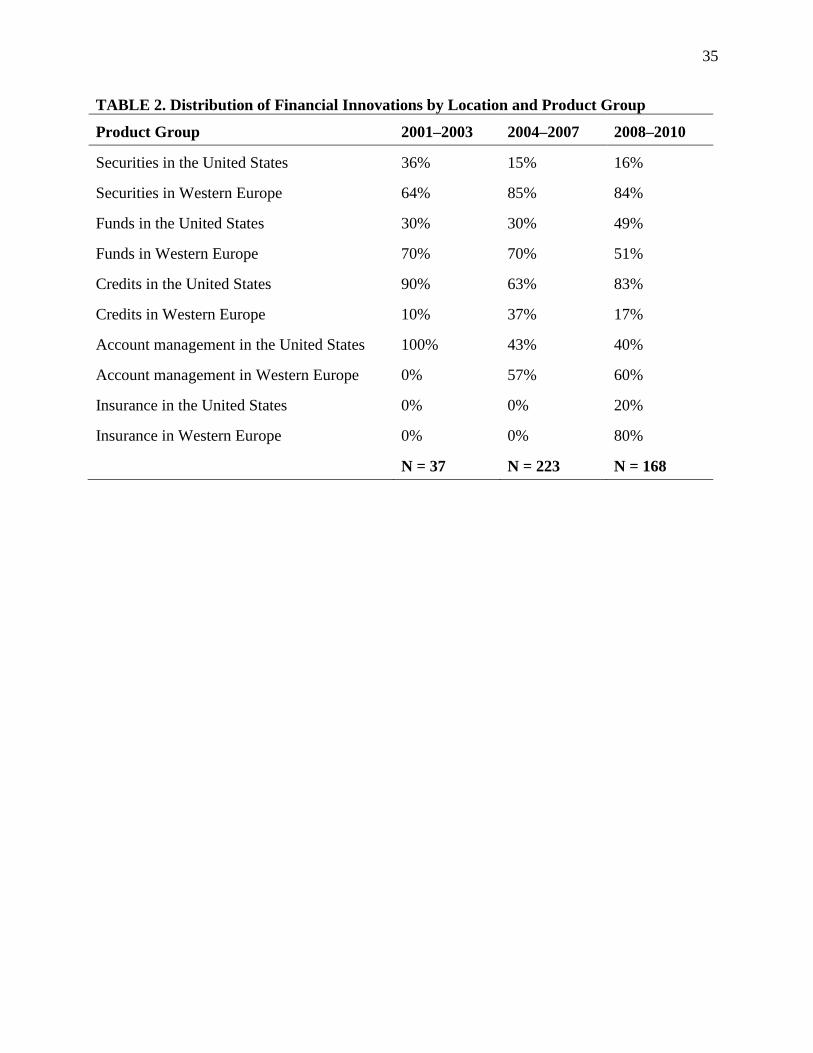
TABLE 2 reveals the distribution of financial innovations by location and product group.
A χ2 test is used to test differences between periods for each product group. Western Europe
introduced more security innovations in 2004–2007 (p < .001) and 2008–2010 (p < .001) and
more fund innovations in 2004–2007 (p < .05) than the U.S. banks. The U.S. banks introduced
more credit innovations in 2001–2003 (p < .05), 2004–2007 (p < .05), and 2008–2010 (p < .001)
and more account management innovations in 2001–2003 (p < .1) than did those in Western
Europe. There also were more U.S. credit innovations in 2004–2007, during the peak of the
housing bubble, than in other years.
---Insert TABLE 2 about here---
TABLE 3 provides the cumulative abnormal returns during different event windows. For
financial innovations, they are positive on the event day (0) and for the event window (–1, 0),
reaching $146 million on average (event window –1, 0). Although financial innovations may
have been the primary cause for the financial crisis, our findings indicate that not all financial
innovations are bad or without merit. The cumulative abnormal returns to financial innovations
are .16% in Western Europe and .30% in the United States. Our analysis uses the shortest

22
significant event window to ensure that the abnormal returns are not related to other events (i.e.,
confounding effects), which is (–1, 0).
---Insert TABLE 3 about here---
TABLE 4 provides the descriptive statistics of our sample. There was a relatively low
mean level of radicalness, which is not surprising for financial innovations because their
radicalness appears lower than that of innovations in the manufacturing sector. Many financial
innovations are not radically new and instead represent adaptations of prior products (Tufano
2004). Therefore, and because our sample includes a few very radical financial innovations, the
mean is in line with prior studies.
---Insert TABLE 4 about here---
TABLE 5 shows the correlations of the variables. A high correlation was found between
complexity and risk. To further understand this high correlation, we asked the three experts to
give us their explanation for this finding. In general, the experts do not find this finding
surprising. Their verbatim answers could attribute the correlation to three causes. First, banks
might introduce complex financial innovations to “hide” high financial risk because so doing
makes it difficult for consumers realize that the innovations are risky. Second, complex
innovations are associated with higher uncertainty. With higher uncertainty, investors’ need for a
higher return increases. According to risk-return trade-off, higher expected returns can only be
accomplished through higher financial risk. Because investors fancy higher expected returns,
banks might introduce innovations higher in complexity and risk, which in turn leads to higher
expected returns. Third, risky and especially complex financial innovations normally incorporate
higher development costs. Because investors expect that these innovations are more expensive to

23
develop, banks can even get higher spreads for risky and complex financial innovations than for
financial innovations lower in risk and complexity.
---Insert TABLE 5 about here---
Hypotheses Tests
The results of the regressions are provided in TABLE 6 (Model 5). Because
heteroscedasticity is present (White's test statistic = 91.74, 2(32), p < .001), robust standard
errors (i.e., robust variance estimator; White 1980) were used. Our results show that an increase
in complexity (b1 = –.41, p < .01) results in stronger negative cumulative abnormal returns, in
support of H1a rather than H1b. Therefore, the more complex a financial innovation, the stronger
its negative impact on cumulative abnormal returns. The probable explanation for this finding
likely involves consumers, who will not adopt complex innovations when they demand high
cognitive effort (Mählmann 2012), evoke negative emotional reactions (Mick and Fournier
1998), and make it difficult to compare various options. Thus, the negative effects outweigh the
positive effects of complex innovations.
Contrary to H2b but in line with H2a, the authors find that risk (b2 = .30, p < .05) has a
positive impact on cumulative abnormal returns: The more risky a financial innovation, the
stronger its cumulative abnormal returns, probably as a result of the positive relation between
risk and return, because consumers are only myopic loss averse (Benartzi and Thaler 1999), or
because consumers seek risk when firms frame the positive gains of an innovation (Knutson et
al. 2005). Thus, the positive effects outweigh the negative effects of risky innovations.
Consistent with H3, the authors find a positive impact of increasing radicalness (b3 = .23,
p < .01). Thus, the more radical a financial innovation, the stronger its cumulative abnormal
returns, probably as a result of higher prices for radical financial innovations by targeting

24
premium segments and because they are more difficult to imitate, and radical financial
innovations can increase the market share within an existing market, increase the market size, or
create entirely new markets.
Surprisingly, the recession (b4 = .38, p < .05) also has a positive impact on cumulative
abnormal returns. Security innovations (b6 = .31, p < .05) and account management innovations
(b9 = .25, p < .05) also have a positive impact on cumulative abnormal returns.
Recession negatively moderates the impact of radicalness (b11 = –.30, p < .05) on
cumulative abnormal returns, in support of H4, as depicted in FIGURE 1. In an expansion, higher
radicalness leads to higher cumulative abnormal returns than lower radicalness. However, in a
recession, increasing radicalness leads to lower cumulative abnormal returns. As stated in the
theory, these results could occur either because of consumers’ lower disposable income or their
lower propensity to buy expensive radical innovations.
With regard to the impact of the moderator, U.S. location, on the impact of risk (b14 =
.20, p < .05) on cumulative abnormal returns, the authors find a positive moderation, in support
of H7a instead of H7b. FIGURE 2 reveals this moderation effect. In Europe, cumulative abnormal
returns decline with the riskiness of the innovation, suggesting that Europeans are risk averse. In
contrast, cumulative abnormal returns increase with riskiness of the innovation, suggesting that
people in the US are risk seeking. This dramatic difference in propensity to risk suggests that
researchers and firms should treat investors differently in the US versus Europe.
The impact of the interaction between risk and recession on cumulative abnormal returns
is not significant though, so H5 must be rejected. The impact of the interaction effect of
radicalness and a U.S. location on cumulative abnormal returns is not significant, and so H6
cannot be confirmed, either.

25
---Insert TABLE 6 about here---
---Insert FIGURE 1 and FIGURE 2 about here---
Robustness Checks
Because of the high correlation between complexity and risk, checks for multicollinearity
problems were performed by adding the independent variables into the regression (see TABLE 6,
Model 1-5). First, the authors include only complexity, economic conditions, locations, product
groups and assets as independent variables. The next column features risk instead of complexity.
Afterward, the independent variables include complexity, risk, economic conditions, locations,
product groups and assets. Finally, radicalness is added. The signs of the coefficients do not
change, so multicollinearity does not appear to compromise our results. A generalized ridge
regression that accounts for multicollinearity (see models 6 and 7 in Table 6) was also performed
and shows that our results remain robust.
As robustness checks, the authors also estimate cumulative abnormal returns using the
Fama-French 3-factor model to verify that the results do not differ between the market model
and the Fama-French 3-factor model1. The cumulative abnormal returns for the event window (–
1; 0) are significantly positive (.24%; p < .002), and the hypothesis test results also remain
stable.
As another robustness check, the authors estimate a model with another control variable
(i.e., frequency of announcements; Sood and Tellis 2009), but it is not significant and does not
change our results.

26
Discussion
Summary of Findings
This study contributes to the literature on the fruits and drivers of the success of service
innovations. The data include up and down markets across five countries that differ in their risk
tolerance and innovativeness. This unique data set offers several interesting findings:
Security and credit innovations are the most frequent innovations; insurance innovations
are the rarest.
The share of credit innovations decreases during the financial crisis, but the percentage of
fund innovations increases. Western Europe introduces more security innovations,
whereas the United States introduces more credit innovations.
Cumulative abnormal returns to introductions of financial innovations are positive and
average $146 million. They are twice as high in the United States as in Western Europe.
On cumulative abnormal returns, increasing risk has a positive impact (confirming H2a);
increasing complexity has a negative impact (confirming H1a); and increasing radicalness
has a positive impact (confirming H3).
The recession has a positive impact on cumulative abnormal returns.
Economic condition moderates the returns to radicalness. Cumulative abnormal returns
increase with radicalness during an expansion but decrease with radicalness during a
recession (confirming H4).
Location moderates the returns to riskiness of the innovation. Cumulative abnormal
returns increase with risk in the US but they decrease with risk in Western Europe
(confirming H7a).

27
Implications
Banks introduce more fund innovations and fewer credit innovations during financial
crises; perhaps consumers look more for financial innovations that help them spread risk when
they face financial turbulence. Higher saving rates among European consumers and higher loans
among U.S. consumers seem to have incentivized European banks to introduce more security
innovations and U.S. banks to introduce more credit innovations. That is, banks appear to react
to the requirements of their local markets.
The average cumulative abnormal return to a financial innovation announcement is
significantly positive, equal to $146 million. Thus the market considers financial innovations
profitable, not harmful, despite their apparent responsibility for the financial crisis. This result
should encourage banks to develop more financial innovations. In addition, the cumulative
abnormal returns are higher for more radical innovations—a result consistent with findings in
other industries that suggest more radical innovations allow firms to charge premium prices,
which ultimately leads to high margins and cash flows (Srinivasan et al. 2009).
Yet the authors also find that the cumulative abnormal returns to an announcement of a
financial innovation are higher in a recession than in an expansion. This result may suggest fewer
announcements clutter or lower expectations in recessions, because most firms cut their R&D
investments during recessions (Barlevy 2005). In this sense, a recession may offer a chance for
banks to stand out from the crowd and use financial innovations to increase their financial value:
Banks should act contra-cyclically and introduce innovations during recessions.
Cumulative abnormal returns increase with riskiness of financial innovations. An
implication of this finding is that banks need not avoid risky financial innovations. This
knowledge may have prompted banks to introduce more risky products in the past 15 years. This

28
practice appears poorly aligned with the goals of regulatory authorities though; risky products
are not only dangerous to consumers that purchase them but to the financial system as a whole
(Stiglitz 2009). The positive impact of risk on cumulative abnormal returns shows that regulatory
authorities cannot rely on self-motivation in financial markets to reduce risky innovations.
The complexity of financial innovations instead has a negative impact on cumulative
abnormal returns. It is thus suggested that banks and firms in general should avoid complex
innovations. Not only do financial markets provide banks with incentives to avoid complex
innovations, but regulatory authorities prefer not to confront consumers with complex financial
products, which often lead to confusion and potential exploitation. In the recent financial crisis,
some new products were so complex that even the firms that created them did not fully
understand all their implications (Stiglitz 2009). The U.S. Consumer Protection Act has issued
regulations to prevent complex innovations that feature long, detailed clauses in small print. The
negative impact of complexity on cumulative abnormal returns suggests though that regulatory
authorities might be able to rely on the market to punish such financial innovations.
In an expansion, higher radicalness leads to higher cumulative abnormal returns than
lower radicalness. However, in a recession, increasing radicalness leads to lower cumulative
abnormal returns. Therefore, banks should time their launch of radical financial innovations to
coincide with periods of expansion rather than recessions; once a recession strikes, the negative
interaction term for radicalness and recession suggests that they should consider whether waiting
to launch might be preferable to an immediate launch of their radical financial innovations.
Finally, increasing risk among financial innovations increases cumulative abnormal
returns in the United States, but decreases the cumulative abnormal returns in Western Europe.
This dramatic difference in propensity to risk suggests that researchers and firms should treat
29
investors differently in the US versus Europe. Therefore, the United States is a more suitable
market for launching more risky innovations.
Limitations and Further Research
This study has several limitations that additional research might address. Our sample is limited to
publicly traded banks in five countries; the authors hope that additional research expands this
analysis to private banks and other countries. This article’s use of an event study methodology to
determine the performance of financial innovations offers the advantage of covering a relatively
large number of innovations across several countries, but it prevents us from disentangling
innovation performance across different customer segments. Further studies might analyze
publicly unavailable firm data to determine the effects for a few banks and in more detail. This
article also adopts the growing tradition in marketing of using stock market returns to ascertain
market responses to marketing activities and phenomena. However, this application of an event
study cannot reveal investors’ mindsets, which actually drive returns (Bayus, Erickson, and
Jacobson 2003; Wiles and Danielova 2009). Therefore, the authors call for research that can
validate the assumptions underlying this method.
References
Barlevy, Gadi. 2005. "Why don't recessions encourage more R&D spending?" Chicago Fed
Letter, 1-4.
Bayus, Barry L., Gary Erickson and Robert Jacobson. 2003. "The financial rewards of new
product introductions in the personal computer industry." Management Science 49 (2): 197-210.
Benartzi, Shlomo and Richard H. Thaler. 1999. "Risk aversion or myopia? Choices in repeated
gambles and retirement investments." Management Science 45 (3): 364-81.
Bureau of Economic Analysis. 2011. "Trends in consumer spending and personal saving."
(accessed 07.21.2011), [available at http://www.bea.gov/]

30
Campbell, John Y. 1987. "Stock returns and the term structure." Journal of Financial Economics
18 (2): 373-99.
Campbell, John Y., Howell E. Jackson, Brigitte C. Madrian and Peter Tufano. 2011. "Consumer
financial protection," Journal of Economic Perspectives 25 (1): 91-114.
Carow, Kenneth A. 1999. "Evidence of early-mover advantages in underwriting spreads."
Journal of Financial Services Research 15 (1): 37-55.
Chandy, Rajesh and Gerard J. Tellis. 2000. “The incumbent's curse? Incumbency, size and
radical product innovation.” Journal of Marketing 64 (3): 1-17.
Chandy, Rajesh and Gerard J. Tellis. 1998. “Organizing for radical product innovation: The
overlooked role of willingness to cannibalize.” Journal of Marketing Research 35 (4): 474-487.
Charupat, Narat and Eliezer Z. Prisman. 2004. "An essay on financial innovation: The case of
instalment receipts." Journal of Banking & Finance 28 (1): 129-56.
Cooper, Robert G. and Ulrike de Brentani. 1991. "New industrial financial services: What
distinguishes the winners." Journal of Product Innovation Management 8 (2): 75-90.
De Brentani, Ulrike. 1989. "Success and Failure in New Industrial Services." Journal of Product
Innovation Management 6 (4): 239-258.
De Brentani, Ulrike. 2001. "Innovative versus incremental new business services: Different keys
for achieving success." Journal of Product Innovation Management 18 (3): 169-187.
Dowling, Grahame R. 1999. "Perceived risk." Pp. 419-424 in: The elgar companion to consumer
research and economic psychology, edited by Peter E. Earl and Simon Kemp, 419-424.
Cheltenham: Edward Elgar.
Ettlie, John E. and Stephen R. Rosenthal. 2011. "Service versus manufacturing innovation."
Journal of Product Innovation Management 28 (2): 285-299.
Eurostat. 2011. "National accounts – GDP." (accessed 07.21.2011), [available at
www.epp.eurostat.ec.europa.eu]
Fama, Eugene F. and Kenneth R. French. 1993. "Common risk factors in the returns on stocks
and bonds." Journal of Financial Economics 33 (1): 3-56.
Frame, Scott W. and Lawrence J. White. 2004. "Empirical studies of financial innovation: Lots
of talk, little action?" Journal of Economic Literature 42 (1): 116-44.
Furst, Karen, William W. Lang, and Daniel E. Nolle. 2002. "Internet banking." Journal of
Financial Services Research 22 (1-2): 95-117.

31
Gale, Douglas. 1996. "Delay and cycles." Review of Economic Studies 63 (2): 169-98.
Hofstede, Geert. 2003. Culture's consequences, comparing values, behaviors, institutions, and
organizations across nations. Thousand Oaks: Sage Publications.
Holak, Susan L. and Donald R. Lehmann. 1990. "Purchase intentions and the dimensions of
innovation: An exploratory model." Journal of Product Innovation Management 7 (1): 59-73.
Hwang, Soosung and Steve E. Satchell. 2010. "How loss averse are investors in financial
markets?" Journal of Banking & Finance 34 (10): 2425-38.
Katona, George. 1975. Psychological economics. New York: Elsevier Scientific Publishing.
Knutson, Brian, Jonathan Taylor, Matthew Kaufman, Richard Peterson and Gary Glover. 2005.
"Distributed neural representation of expected value." Journal of Neuroscience 25 (19): 4806-12.
Labay, Duncan G. and Thomas C. Kinnear. 1981. "Exploring the consumer decision process in
the adoption of solar energy systems." Journal of Consumer Research 8 (3): 271-78.
Lamey, Lien, Barbara Deleersnyder, Marnik G. Dekimpe and Jan-Benedict E.M. Steenkamp.
2007. "How business cycles contribute to private-label success: Evidence from the United States
and Europe." Journal of Marketing 71 (1): 1-15.
Landis, J. Richard and Gary G. Koch. 1977. "The measurement of observer agreement for
categorical data." Biometrics 33 (1): 159-74.
Lee, Chol. 1990. "Determinants of national innovativeness and international market
segmentation." International Marketing Review 7 (5): 39-49.
Lee, Ruby P. and Qimei Chen. 2009. "The immediate impact of new product introductions on
stock price: The role of firm resources and size." Journal of Product Innovation Management 26
(1): 97-107.
Lerner, Josh. 2002. "Where does state street lead? A first look at finance patents, 1971 to 2000."
Journal of Finance 57 (2): 901-30.
Lerner, Josh and Peter Tufano. 2011. "The consequences of financial innovation: A
counterfactual research agenda." Working article.
Mählmann, Thomas. 2012. "Did investors outsource their risk analysis to rating agencies?
Evidence from ABS-CDOs." Journal of Banking & Finance 36 (5), 1478-1491.
Mayfield, Scott. 2004. "Estimating the market risk premium." Journal of Financial Economics
73 (3): 465-96.

32
Mick, David Glen and Susan Fournier. 1998. "Paradoxes of technology: Consumer cognizance,
emotions, and coping strategies." Journal of Consumer Research 25 (2): 123-43.
Montoya-Weiss, Mitzi M. and Roger J. Calantone. 1994. "Determinants of new product
performance." Journal of Product Innovation Management 11 (5): 397-417.
Moreau, C. Page, Donald R. Lehmann and Arthur B. Markman. 2001. "Entrenched knowledge
structures and consumer response to new products." Journal of Marketing Research 38 (1): 14-
29.
Papastathopoulou, Paulina and Erik Jan Hultnik. 2012. "New service development: An analysis
of 27 years of research." Journal of Product Innovation Management 29 (5): 705-714.
Pastor, Lubos, Meenakshi Sinha and Bhaskaran Swaminathan. 2008. "Estimating the
intertemporal risk-return tradeoff using the implied cost of capital." Journal of Finance 53 (6):
2859-97.
Rigby, Darrell. 2001. "Moving upward in a downturn." Harvard Business Review 79 (6): 99-105.
Rogers, Everett M. 2003. Diffusion of innovations, 5th ed. New York: The Free Press.
Ryan, Andrea, Gunnar Trumbull and Peter Tufano. 2010. "A brief postwar history of US
consumer finance." Working Article 11-058, Harvard Business School.
Shimp, Terence A. and William O. Bearden. 1982. "Warranty and other extrinsic cue effects on
consumers' risk perceptions." Journal of Consumer Research 9 (1): 38-46.
Skiera, Bernd, Manuel Bermes and Lutz Horn. 2011. "Customer Equity Sustainability Ratio: A
New Metric for Assessing a Firm’s Future Orientation", Journal of Marketing, 75 (May), 118-
131.
Skreta, Vasiliki and Laura Veldkamp. 2009. "Ratings shopping and asset complexity: A theory
of ratings inflation." Journal of Monetary Economics 56 (5): 678-95.
Sommer, Rainer. 2008. The subprime crisis. How rotten US credits shake the international
financial system. Hannover: Heise Heinz.
Sood, Ashish and Gerard J. Tellis. 2009. "Do innovations really pay off? Total stock market
returns to innovation." Marketing Science 28 (3): 442-56.
Sorescu, Alina B. 2012. "Innovation and the market value of firms." Pp. 129-155 in: Handbook
of marketing and finance, edited by Shankar Ganesan and Sundar Bharadwaj1-315.
Northhampton: Edward Elgar Publishing.
Soukhoroukova, Arina, Martin Spann and Bernd Skiera. 2012. "Generating and evaluating new
product ideas with idea markets." Journal of Product Innovation Management 29 (1): 100-112.

33
Srinivasan, Raji, Gary L. Lilien and Shrihari Sridhar. 2011. "Should firms spend more on
research and development and advertising during recessions?" Journal of Marketing 75 (3): 49-
65.
Srinivasan, Shuba, Koen H. Pauwels, Jorge M. Silva-Risso and Dominique Hanssens. 2009.
"Product innovations, advertising and stock returns." Journal of Marketing 73 (1): 24-43.
Stiglitz, Joseph E. 2009. "Principles for a new financial architecture." The Commission of
Experts of the President of the UN General Assembly on Reforms of the International Monetary
and Financial System.
Storey, Chris and Christopher J. Easingwood. 1998. "The augmented service offering: A
conceptualization and study of its impact on new service success." Journal of Product
Innovation Management 15 (4): 335-351.
Sweeney, Jillian C., Geoffrey N. Soutar and Lester W. Johnson. 1999. "The role of perceived
risk in the quality-value relationship: A study in a retail environment." Journal of Retailing 75
(1): 77-105.
Szpiro, George and Jean-Francois Outreville. 1988. "Relative risk aversion around the world:
Further results." Studies in Banking and Finance 6 (1): 127-28.
Tellis, Gerard J. 2013. Unrelenting innovation: How to create a culture of market dominance.
New Jersey: Jossey-Bass, Hoboken.
Tufano, Peter. 2004. "Financial innovation." Pp. 307-335 in: The handbook of the economics of
finance, edited by George Constantinides, Milton Harris, and Rene Stulz, 307-335. Amsterdam:
Elsevier.
———. 1989. "Financial innovation and first-mover advantage." Journal of Financial
Economics 25 (2): 213-40.
White, Halbert. 1980. "A heteroskedasticity-consistent covariance matrix estimator and a direct
test for heteroskedasticity." Econometrica 48 (4): 817-38.
Wiles, Michael A. and Anna Danielova. 2009. "The worth of product placement in successful
films: An event study analysis." Journal of Marketing 73 (4): 44-63.
Wuyts, Stefan, Stefan Stremersch, Christophe Van Den Bulte and Philip Hans Franses. 2004.
"Vertical marketing systems for complex products: A triadic perspective." Journal of Marketing
Research 41 (4): 479-87.
Wooder, Stella and Steven Baker. 2011. "Extracting key lessons in service innovation." Journal
of Product Innovation Management 29 (1): 13-20.
34
TABLE 1. Distribution of Financial Innovations by Product Group and Time Periods
Product Group 2001–2003 2004–2007 2008–2010 Total (2001–2010)
Securities 38% 43% 36% 40%
Funds 27% 13% 34% 23%
Credit 27% 30% 18% 25%
Account management 8% 13% 9% 11%
Insurances 0% 0% 3% 1%
N = 37 N = 223 N = 168 N = 428
35
TABLE 2. Distribution of Financial Innovations by Location and Product Group
Product Group 2001–2003 2004–2007 2008–2010
Securities in the United States 36% 15% 16%
Securities in Western Europe 64% 85% 84%
Funds in the United States 30% 30% 49%
Funds in Western Europe 70% 70% 51%
Credits in the United States 90% 63% 83%
Credits in Western Europe 10% 37% 17%
Account management in the United States 100% 43% 40%
Account management in Western Europe 0% 57% 60%
Insurance in the United States 0% 0% 20%
Insurance in Western Europe 0% 0% 80%
N = 37 N = 223 N = 168

36
TABLE 3. Cumulative Abnormal Returns to Different Event Windows
Event Window Returns p-Value Percentage of Positive
(0) .16% .017 53%
(–1, 0) .21% .007 52%
(–1,+1) .13% .271 51%
(–2,+2) .09% .571 48%
Notes: 0: announcement day. -1 (-2): one (two) day(s) prior the announcement.
+1 (+2): one (two) day(s) after the announcement.

37
TABLE 4. Descriptive Statistics of Key Variables
Variable Observations Mean Minimum Maximum
Cumulative abnormal return 428 .21% –5.18% 6.40%
Complexity 428 4.75 1.00 9.00
Risk 428 5.08 1.00 9.00
Radicalness 428 1.70 1.00 7.00
Assets (in millions) 428 925,836 1,911 3,771,200
Recession vs. expansion 148 vs. 280
United States vs. Western Europe 168 vs. 260

38
TABLE 5. Correlations Among Variables (N = 428)
1 2 3 4 5 6 7 8 9 10 11
1. CAR 1.00
2. Complexity –.06 1.00
3. Risk –.01 .92 1.00
4. Radicalness .04 .23 .21 1.00
5. Recession .09 .05 .04 –.12 1.00
6. USA .04 –.33 –.28 .01 .13 1.00
7. Security .05 .37 .37 –.06 –.08 –.37 1.00
8. Fund –.05 .52 .51 .17 .19 .02 –.44 1.00
9. Credit –.05 –.55 –.48 –.04 –.08 . 38 –.47 –.31 1.00
10. Account
management .08 –.49 –.57 –.08 –.06 . 05 –.29 –.19 –.21 1.00
11. Assets –.05 .15 .13 .16 .08 –.29 .06 .07 –.09 –.08 1.00
Notes: Correlations > .1 are significant at the 5% level.

39
Table 6. Regression Results for Drivers of Cumulative Abnormal Returns to Financial
Innovations
Independent Variables Dependent Variable: CAR
M 1 M 2 M 3 M 4 M 5 M 6 M 7
Complexity –.11 –.40 *** –.41 *** –.41 *** –.28 *** –.29 ***
Risk .11 .40 *** .39 *** .30 ** .25 *** .18 *
Radicalness .10 ** .23 *** .09 * .17 ***
Recession .10 * .12 ** .11 ** .13 ** .38 ** .12 ** .23 **
United States .04 .05 .03 .02 –.04 .03 –.03
Security .40 *** .31 ** .29 ** .30 ** .31 ** .13 * .13 *
Fund .27 ** .15 .15 .16 .17 .02 .01
Credit .21 ** .24 .15 .15 .16 .01 .01
Account management .23 *** .30 *** .25 *** .24 *** .25 ** .12 * .12 *
Assets –.04 –.04 –.04 –.05 –.04 –.05 –.04
Radicalness recession –.30 ** –.20 **
Risk recession .01 .05
Radicalness United States –.15 –.11
Risk United States .20 ** .15 **
F-value 2.22 ** 2.23 ** 2.60 *** 2.62 *** 3.16 ***
R2 3.34%
2.46%
5.14% 6.00
% 8.00%
5.53% 7.34%
N 428 428 428 428 428 428 428
Notes: *p < .1. **p < .05. ***p < .01. CAR = cumulative abnormal return.

40
-.02
-.01
0
.01
.02
CA
R
1 7
Radicalness
Expansion Recession
FIGURE 1. Impact of Radicalness x Recession on Cumulative Abnormal Return (CAR)

41
0
.002
.004
.006
1 9
Risk
Western Europe USA
CA
R
FIGURE 2. Impact of Risk x Location on Cumulative Abnormal Returns (CAR)

42
Appendix
Interrater Reliability
Each financial expert received a detailed description of the financial innovation and
product announcement, including the date. To check the interrater reliability, the authors
calculate Cronbach’s alpha values, the correlation between the ratings, and Fleiss’s Kappa
values. The Cronbach’s alphas are .97 for complexity, .98 for risk, and .90 for radicalness. The
correlations between the different raters are as follows: for complexity, .89 between rater 1 and
2, .93 between rater 2 and 3, and .95 between rater 1 and 3; for risk, .94 between rater 1 and 2,
.94 between rater 2 and 3, and .94 between rater 1 and 3; for radicalness, .78 between rater 1 and
2, .74 between rater 2 and 3, and .84 between rater 1 and 3. Finally, Fleiss’s Kappa is a statistical
measure of the reliability of an exact agreement between a fixed number of raters, for which
values greater than .4 are good (Landis and Koch 1977). Fleiss’s Kappa for complexity is .44, for
risk is .46, and for radicalness is .43. Therefore, the interrater reliabilities for risk, complexity,
and radicalness are fairly high.

43
Endnotes
1. We appreciate support received from Professor Fama, Professor French, and Professor Elsas in
collecting these data.