Embed Size (px)
Citation preview
1
Project Number: DZT0604
Stock Market Simulation
An Interactive Qualifying Project Report:
Submitted to the faculty
of the
Worcester Polytechnic Institute
in partial fulfillment of the requirements for
the Degree of Bachelor of Science
by
_____________________ _______________ John Paul Piccolomini, Levi Clifford Wade,
__________________ ______________ Jan Christian Thomas, Ryan LaFalam,
______________ Ryan Thomann
Date:
August 20th, 2007
Approved:
__________________________ Professor Dalin Tang, Advisor

2
Table of Contents
Abstract List of Figures List of Tables 1. Introduction
1.1 Goals and Methods 1.2 History of the Stock Market 1.3 Types of Common Stock 1.4 Growth Investing 1.5 Value Investing
2. Ryan Thomann’s Simulation 2.1 Introduction 2.2 Company Selection 2.3 Weekly Reports 2.4 Conclusions and Analysis
3. Ryan LaFalam’s Simulation 3.1 Introduction 3.2 Company Selection 3.3 Weekly Reports 3.4 Conclusions and Analysis
4. John Piccolomini’s Simulation 4.1 Introduction 4.2 Company Selection 4.3 Weekly Reports 4.4 Conclusions and Analysis
5. Levi Wade’s Simulation 5.1 Introduction 5.2 Company Selection 5.3 Weekly Reports 5.4 Conclusions and Analysis
6. Jan Thomas’ Simulation 6.1 Introduction 6.2 Company Selection 6.3 Weekly Reports 6.4 Conclusions and Analysis
7. Analysis and Conclusion References
3 4 8
11 11 13 20 21
22 23 32 37
39 40 41 55
57 57 58 70
71 72 72 87
89 90 91
102 103 104
3
Abstract
A stock market simulation was run over the course of seven to ten weeks to find
out which strategies fare more favorably throughout the market. Individual group
members researched trading practices and applied trading strategies to result in the best
possible outcome. Investment results of each strategy were analyzed to conclude which
strategy produced the most profitable outcome.

4
List of Figures
Figure 2.2.1 24
Figure 2.2.2 25
Figure 2.2.3 26
Figure 2.2.4 27
Figure 2.2.5 28
Figure 2.2.6 29
Figure 2.2.7 30
Figure 2.2.8 31
Figure 3.3.1 43
Figure 3.3.2 44
Figure 3.3.3 45
Figure 3.3.4 49
Figure 3.3.5 52
Figure 3.3.6 53
Figure 4.1 59

5
Figure 4.2 60
Figure 4.3 61
Figure 4.4 65
Figure 4.5 66
Figure 4.6 67
Figure 4.7 68
Figure 5.1 72
Figure 5.2 73
Figure 5.3 74
Figure 5.4 75
Figure 5.5 76
Figure 5.6 76
Figure 5.7 77
Figure 5.8 78
Figure 5.9 79
6
Figure 5.10 79
Figure 5.11 80
Figure 5.12 81
Figure 5.13 81
Figure 5.14 82
Figure 5.15 83
Figure 5.16 83
Figure5.17 84
Figure 5.18 85
Figure 5.19 86
Figure 5.20 87
Figure 6.1 93
Figure 6.2 93
Figure 6.3 94
Figure 6.4 94
Figure 6.5 96

7
Figure 6.6 96
Figure 6.7 97
Figure 6.8 98
Figure 6.9 99

8
List of Tables
Table 2.1.1 23
Table 2.1.2 32
Table 2.1.3 33
Table 2.1.4 35
Table 2.1.5 35
Table 2.1.6 36
Table 2.1.7 37
Table 2.1.8 37
Table 3.3.1 41
Table 3.3.2 42
Table 3.3.3 45
Table 3.3.4 46
Table 3.3.5 48
Table 3.3.6 50
Table 3.3.7 51
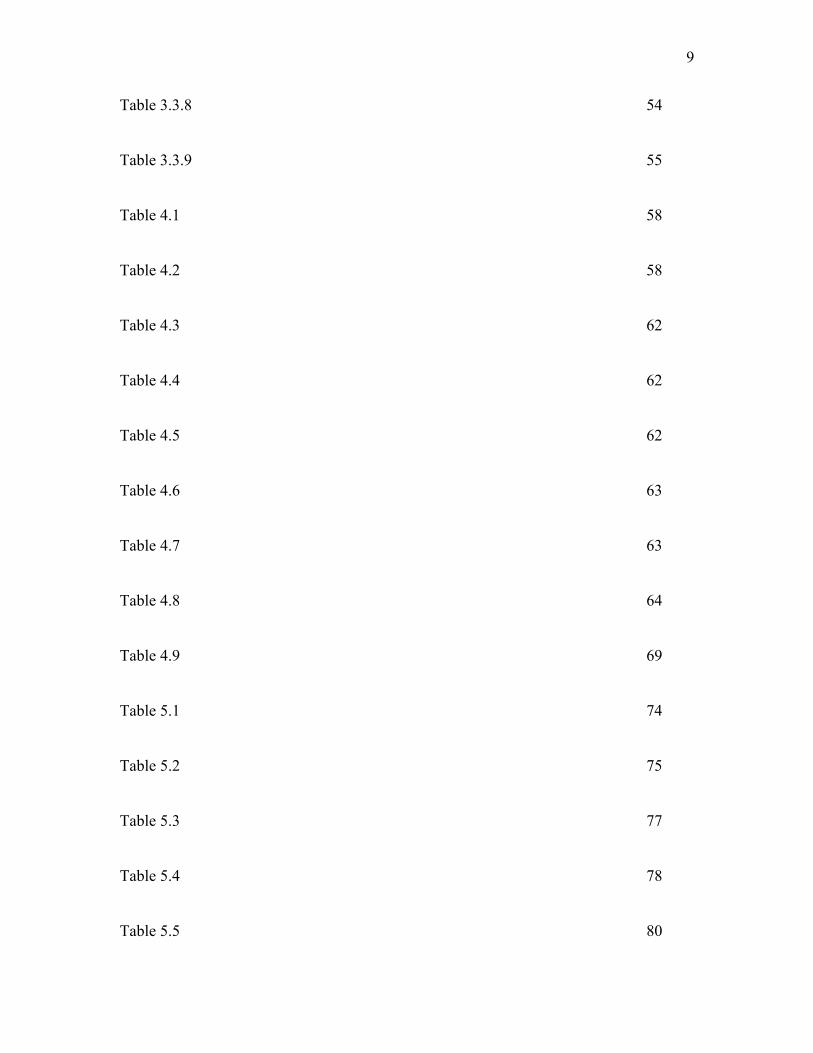
9
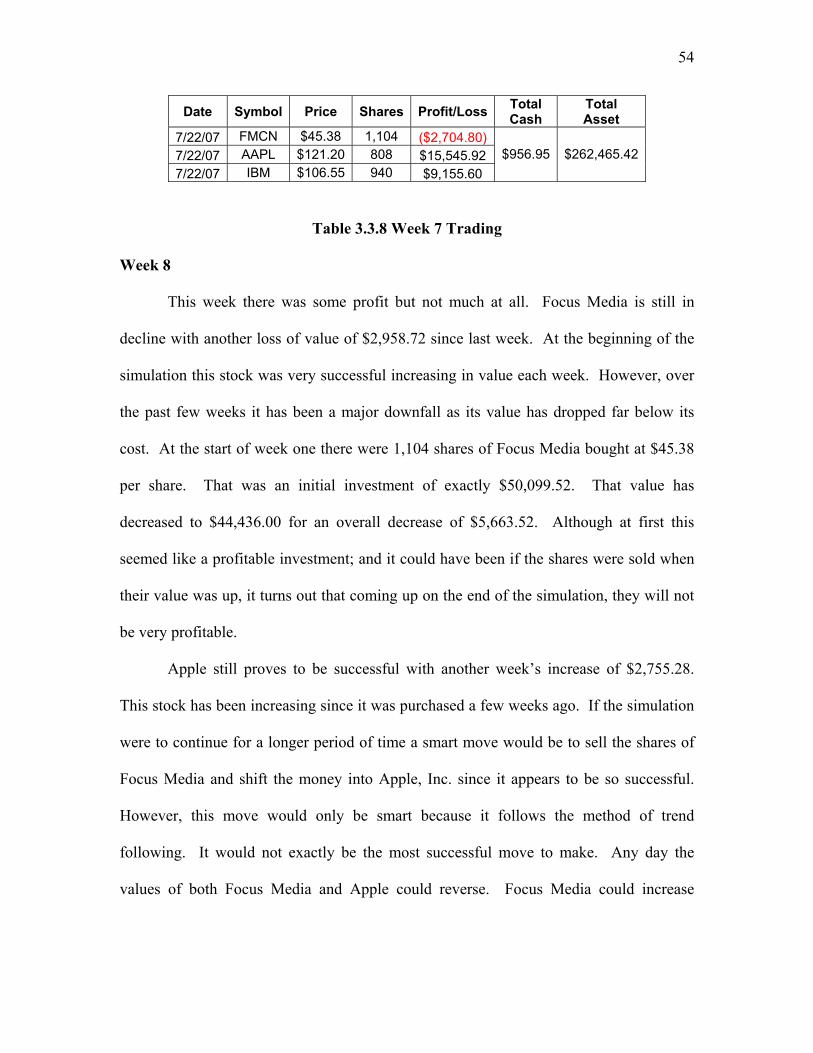
Table 3.3.8 54
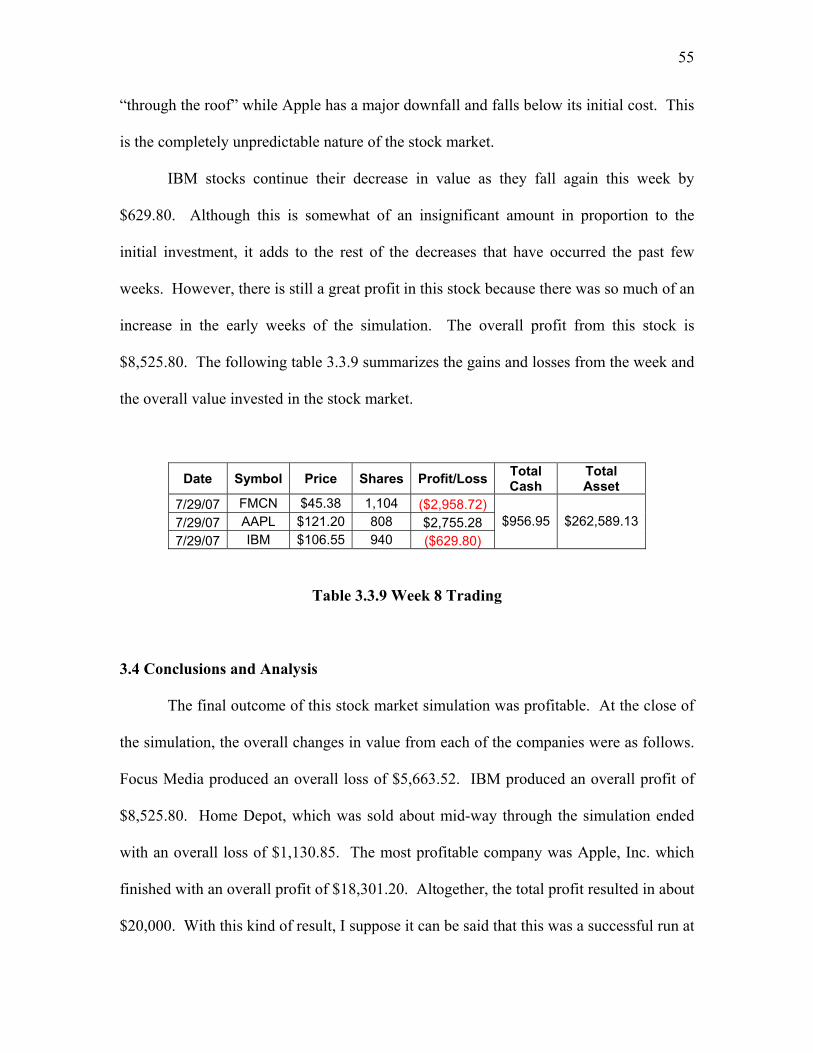
Table 3.3.9 55
Table 4.1 58
Table 4.2 58
Table 4.3 62
Table 4.4 62
Table 4.5 62
Table 4.6 63
Table 4.7 63
Table 4.8 64
Table 4.9 69
Table 5.1 74
Table 5.2 75
Table 5.3 77
Table 5.4 78
Table 5.5 80

10
Table 5.6 82
Table 5.7 84
Table 5.8 86
Table 5.9 87
Table 6.1 90
Table 6.2 92
Table 6.3 95
Table 6.4 97
Table 6.5 99
Table 6.6 101
11
1. Introduction
1.1 Goals and Methods
The main goal of this project is for our group members to gain a fundamental
knowledge of the stock market, how it works and how to invest, using a simulation
program. In the ten-weeks the simulation will run we will learn about the different types
of funds and the strategies in investing in them. We plan on doing this by each taking our
initial two-hundred fifty thousand dollars and investing it according to our pre-decided
methods. After the course of our ten-weeks has expired we will analyze our methods and
come to a conclusion as to why or why not they fared well.
1.2 History of the Stock Market
The roots of the stock market go back many centuries before there was any kind
of established market. Some of the most primitive roots could most likely be seen by the
Native Americans who used forms of trading to get fur for clothing or food. Many times
two people would desire or need goods which the other had, so they would barter and
come to a trading agreement. A French historian by the name of Fernand Braudel claims
that the Muslim and Jewish merchants of 11th century Egypt (particularly Cairo) began
the ideas of credit and payment installments. They also instituted different types and
forms of trading. The people of 12th century France can be considered the first brokers
because they were the first to use the concept of debt. A group known as the “courratiers
12
de change” worked with the bank to regulate and manage debts owed by agriculturalists
to the bank.
Trade was formally organized in the 13th century in the town of Brugse, Belgium.
Traders would meet informally on a constant basis with no real organization until a man
named Van der Buerse held a formal meeting at his home in Brugse. The idea of
organized trade then began to branch off into the neighboring country of Amsterdam and
continued to spread from there. Bankers in certain city-states of Italy began trading in
government securities, which was possible because they were run by a group of citizens
rather than one leader such as a duke.
The first company to go public and allow normal citizens to own a part of the
company was the Dutch India Trading Company. This was the first commercial
company to sell stocks and bonds, which took place on the Amsterdam Stock Exchange.
In the 17th century this was the first stock exchange to offer constant, day-to-day trading
of stocks and bonds, just like the stock markets. From this model other stock markets
began to pop up all over the world, introducing new types of trading and new companies
to invest in, transforming the most primitive trading styles into the vast and complex
market of today.
These ideas of trading and investment eventually spread to the United States
where a few different stock exchanges were begun [10].
13
1.3 Types of Common Stock
Blue-Chip Stocks
These stocks refer to companies that have a long history of sustained earnings and
dividend payments. They are usually the leaders in their type of industry and because
they are so important and large their earnings are usually stable as well as their dividend
records. Most of the companies that are in the Dow Jones Industrial are blue-chip
companies. Some examples are Wal-Mart, ExxonMobil and Merck. Wal-Mart isn’t a
typical blue-chip company because it doesn’t pay out that much for dividends, whereas
ExxonMobil and Merck historically have had growing sales and earnings and pay out a
higher percentage of their earnings in dividends [4].
Blue-chip companies are the companies that an investor looks for if they would
like a lower-risk stock. Their usually always making a steady increase in earnings and
dividends and have a positive turn out. Even in bear markets they tend to decline a lot
less than the higher-risk companies. Finally, investors that choose these companies have
a history of having a regular dividend payment [4].
Income Stocks
Income stocks have a high dividend payout, and these companies are usually in
the mature stage of their industry life cycles. This means that there stocks usually
appreciate slower than the newer companies that are growing much more rapidly like a
blue-chip company. Some examples are utility companies and real estate investment
14
trusts like American Electric Power that has a dividend of $1.40, Ameren Corp. with a
dividend of $2.54, and NiSource with a dividend of $0.92 [4].
Growth Stocks
Growth stocks consist of companies that are expected to have sustained high rates
of growth sales and earnings. They usually have a higher price-earnings ratio and do not
pay out dividends. Home Depot and Intel grew at high double-digit rates during the
1990s and at that time were considered growth stocks. Now they are more like blue-chip
companies because they are higher in their industry and pay out small dividends. Usually
there is no dividend pay out in a growth stock like Cisco Systems, which had annual sales
in the 30 to 50 percent range in the 1990s technology boom. Cisco’s stock price ended
up rising to 130,000 percent from its IPO in February 1990 to March 2000. The reason
why they are often referred to as “high-price-earnings-ratio stocks” is because their
excessive growth makes investors more willing to buy them at higher prices looking for
capital appreciation [4].
Value Stocks
Value stocks are low P/E (price-earnings) ratio stocks that investors are not
particularly fond of. Because investors have such low expectations for these companies
to grow, the stocks are usually bought at relatively low prices. Investors of value stocks
have to be patient and willing to stick it out for the long haul waiting for their prospective
earnings to increase. If growth stocks cannot hold their high growth rates their stock
prices usually fall by greater amounts as well, which could bring it to a value stock. For
15
instance, Pfizer, the pharmaceutical company, received higher earnings when its big time
drugs Lipitor, Viagra, and Celebrex hit the market. However, after the long chain of
heart problems in the patients taking Lipitor and Celebrex, the P/E ratio dropped heavily
and it became a value stock [4].
Cyclical Stocks
Cyclical stocks are ones that move relative to the changes in economic activity.
They usually reach their high and low points before the respective peaks and troughs of
the economy. As the economy prospers, the earnings of the cyclical companies soar as
well; moreover, as the economy suffers, there is a steady decline in company’s earnings.
Examples of cyclical stocks are companies that are tied to the economy like home
builders, automobile companies, and equipment companies. When there was a decline in
the economy in 1999, the stocks of John Deere and Cummins Engine were reported to
steadily decline as most of the investors sold their stocks [4].
Defensive Stocks
Defensive stocks hold their price even when the economy suffers; however, they
also don’t increase as quickly as other stocks when the economy is soaring. Companies
that hold their value even when the economy drops are considered to be defensive
companies. Examples are drug companies, food and beverage companies, utility
companies, and auto parts manufacturers. These are things that everyone needs no matter
how bad the economy may be. These are for investors looking for a safer type of stock,
and they have to wait longer to see the appreciation [4].

16
Speculative Stocks
Speculative stocks have the possibility of a very large return, but they also carry a
larger amount of risk if something was to happen to the company and it was to fold
quickly. They are usually issued by new companies that have promising ideas and look
like they are developing rapidly. They can be hit or miss because they could expand
rapidly and give the investor great returns or they could fold just as quickly. These high-
risk stocks are usually left to more educated investors with room to take risks [4].
Penny Stocks
Penny stocks are similar to speculative stocks except their value is much less.
They are usually priced under a dollar and are a risky investment. They could either
prosper or fail just like a speculative stock. Investors could buy when they think the time
is right at $0.25, and if the company does well and rises to $0.50 they have made a 100
percent return; however, if the company tanks then they lose everything [4].
Foreign Stocks
Foreign stocks come from companies that are outside the country of origin. Even
though the U.S. stock markets still account for the largest market capitalization of all the
stock markets in the world, the foreign stocks are growing rapidly and increasing in
market share. The investor can buy the stocks directly form the foreign market, or they
can use the American depository receipts (ADRs) of the foreign company. The ADR is a
negotiable receipt that contains the value of the stocks that are held in custody in a
17
foreign country. The receipts are then traded in place of foreign stock. This is a good
way for an investor to diversify their portfolio [4].
Large-, Medium-, and Small-Cap Stocks
The word “Cap” is short for market capitalization, which is the market value of a
company. The way to get the market value of a company is to multiply the market stock
price by its number of outstanding shares. As a result, the classifications can change
over time depending on how well the company does [4].
Large-Cap stocks have companies that have considerable earnings and have large
amounts of common stock outstanding. The market cap for this group is greater than 50
billion. Large-cap stocks are in the Dow Jones and the S&P 500 Index and they account
for more than half the total value of the U.S. equity markets. Typically, they are blue-
chip because they are established and can be either a growth or a value company. Some
examples of these types of companies are Intel, Microsoft, IBM, General Motors, and
ExxonMobil [4].
Medium-Cap stocks are the stocks of the medium-sized companies that have a
capitalization of $1 billion to $5 billion. These companies have the safety net of having a
steady increase in earnings but aren’t as well known as the Large-Cap companies. Some
examples are Tyson foods, Outback Steakhouse, Starbucks, and Borders [4].
Small-Cap stocks are the stocks of companies that have a cap under $1 billion.
These companies usually aren’t name brands or aren’t nearly as popular as the previous
caps. They sometime have a greater return than the Large-Cap stocks because they have
a greater risk so their stocks sell higher. Some Small-Cap companies could turn out to be

18
the next Microsoft or Intel, and others could fold quickly and result in a larger loss. That
is why investors must be careful with a Small-Cap stock [4].
Hedge Funds
A hedge fund is basically an actively managed private investment fund that
usually attracts a positive return. There can be both aggressive and conservative
strategies to trading with hedge funds. They are very tricky to work with and are usually
managed by professional investors. Most managers have a significant amount of their
own wealth invested into the hedge fund as well, which gives the investor a feeling of
comfort knowing that if the hedge fund tanks the manager loses his money as well [3].
The term “hedge fund” was introduced in the 1940s when Alfred Winslow Jones
established the first one by employing long and short strategies that were enhanced with
leverage. The Securities and Exchange Commission has defined the hedge fund as “a
general, non-legal term used to describe private, unregistered investment pools that
traditionally have been limited to sophisticated, wealthy investors” (p. 4). Hedge funds
are not like mutual funds because they are not registered with the SEC, which means that
they are subject to very few of the regulatory rules. Also, the managers of hedge funds
do not need register with the SEC, and as a result of this lack of oversight, hedge funds
have usually been limited to those accredited investors through high investments
minimums of around $1 million [3].
The hedge fund business has grown rapidly over the last couple of decades. In
1990, hedge funds managed nearly $40 billion in assets. Around 15 years later, the hedge
19
funds managed more than $975 billion, which is an astonishing growth rate. The
majority of this increase came from the new money, or cash inflows, and the appreciation
of principle. In today’s market, the growth rate in new assets is 10-11 percent each year
[3].
New assets have been pouring into the hedge funds, but the number of hedge
funds has also increased drastically over the years. Since 1990, the number of hedge
funds has increased to around 9,000 worldwide. The assets of these hedge funds have
increased to approximately $1 trillion with an average of over 612 new hedge funds being
established every year [3].
The main objective of a hedge fund is to acquire long term growth of capital.
Depending upon the type of investment strategy, this is usually the case. However, some
of the reduced-risk strategies don’t produce as much capital growth as desired. The best
way to check on the status of the investment is a comparison with certain performance
benchmarks. In order to do this properly, one must compare like styles of investing to
make accurate assumptions and obtain useful results. This helps the manager, as well as
the investor, see how they are doing. If the passive index has a return of 9 percent, and
the manager is above that, then he is doing well; moreover, if he has a return that is below
that, then his performance is questionable, and things may need to be discussed [3].
Hedge funds have performed extremely well over the past twenty years and have
even had lower risk than that of the overall market. When looking at the number of
months that the market and the hedge funds acquired positive returns, in the same period
the market had a positive return two-thirds of the time and the hedge funds three-quarters
of the time. Even though the market had a higher average monthly return, the average

20
monthly loss was very high as well, which allowed the hedge funds to make up some
ground. Therefore, in the long run, the hedge funds outperformed the market in absolute
return and in risk-adjusted return.
1. 4 Growth Investing: High Risk/High Reward
Growth investing is definitely one of the more popular investing styles where
investors look for a company that has great credentials, a history of solid earnings
growth, and a great projected growth of earnings. The most amount of time in this
process is finding the right stocks. The investor must find these stocks that not only have
a great past but a future that will continue at that pace or even better. This is the tricky
part and takes a great deal of research. However, once the investment has been made,
these portfolios can be checked only once a quarter if desired because they tend to bring
great profit; however, it is always recommended to check them more frequently in case
the research did not come through [5].
Investors that use the growth strategy have to have a high tolerance for risk
because growth stocks have a much higher P/E ratio. They can have a dramatic reversal
if the stock is affected by any number of outside influences that the investor could not
have seen coming. One example of this is Cisco Systems (CSCO). In the early 1990s its
growth rate was 50 to 100 percent each year and the P/E was around 30, which allowed it
to be a reasonably priced growth stock. Cisco continued at this rate for about 5 years,
which made it seem like a favorable stock. Then, towards the late 1990s when the hyper
growth of the Internet slowed down, Cisco systems started on a steady and very serious
21
decline, which lead to major losses. This doesn’t mean that growth investing is not worth
it, but there are definitely high risks that come with the high rewards of growth stocks [5].
1.5 Value Investing
Value investors are those that don’t really like risk and don’t like to pay full price
for a stock. They are looking for a bargain in the market. This means that any time there
is a stock that is out of favor with the market, they tend to buy. A company or sector
experiences a loss of confidence by the investors due to a series of earnings
disappointments that show a drop in the growth rate, problems within the company or
industry, or even the perception that the stock or industry has lost its excitement. This is
when the growth stocks turn into value stocks because the P/E ratio drops and the stock
prices take a beating. This is when the value investors will buy because they can accept
the loss of confidence for the lower risk value [5].
The value investor wants the same return as the growth investor but without the
risk. The value investor is different from the growth investor because they are willing to
wait for the confidence to come back to the company or sector and for the undervalued
stock to regain its value or even exceed it. This requires more patience and time than
with a growth stock [5].

22
2. Ryan Thomann’s Simulation
2.1 Introduction
Trading Strategy
Given the timeframe of our project, I have decided to go with a swing trading
approach. The swing trading strategy is a branch of day trading with the difference being
the duration of time in which you are holding the stocks before selling. In the day trading
strategy, it is self explanatory that you are buying and selling during the time that the
market is open only. The swing strategy allows you to incorporate the day trading
scheme but for longer periods of time, which are still not categorized as long term. I
believe this will be an ideal approach to take for this project and it will provide me with
the versatility that I need in order to turn successful profits in my trading. I will be using
6 or 8 different stocks during my simulation, and base my share positions that I will be
holding in each company on their strength and background. I will start out by using 4 or
5 stocks and riding them out until they have either reached my profit objective, or cut
them if they cause my overall investment in that particular company to drop 6%. After
that I will rotate in the other companies that I have interest in by following the chart
trends on the market based on a supply and demand ranking. I have provided a table
below with the stocks in which I am interested in, neglecting any order of interest.
23
2.2 Company Overviews
Company Symbol Company Involvement
Osiris Therapeutics
Inc.
OSIR Therapeutics
Home Depot Inc HD Home Improvement
supplier
Geron Corporation GERN Embryotic Stem Cells
Google Inc. GOOG Internet Search Engine
Dendreon Co. DNDN Human Stem Cells
Wal-Mart Stores Inc. WMT Retailer
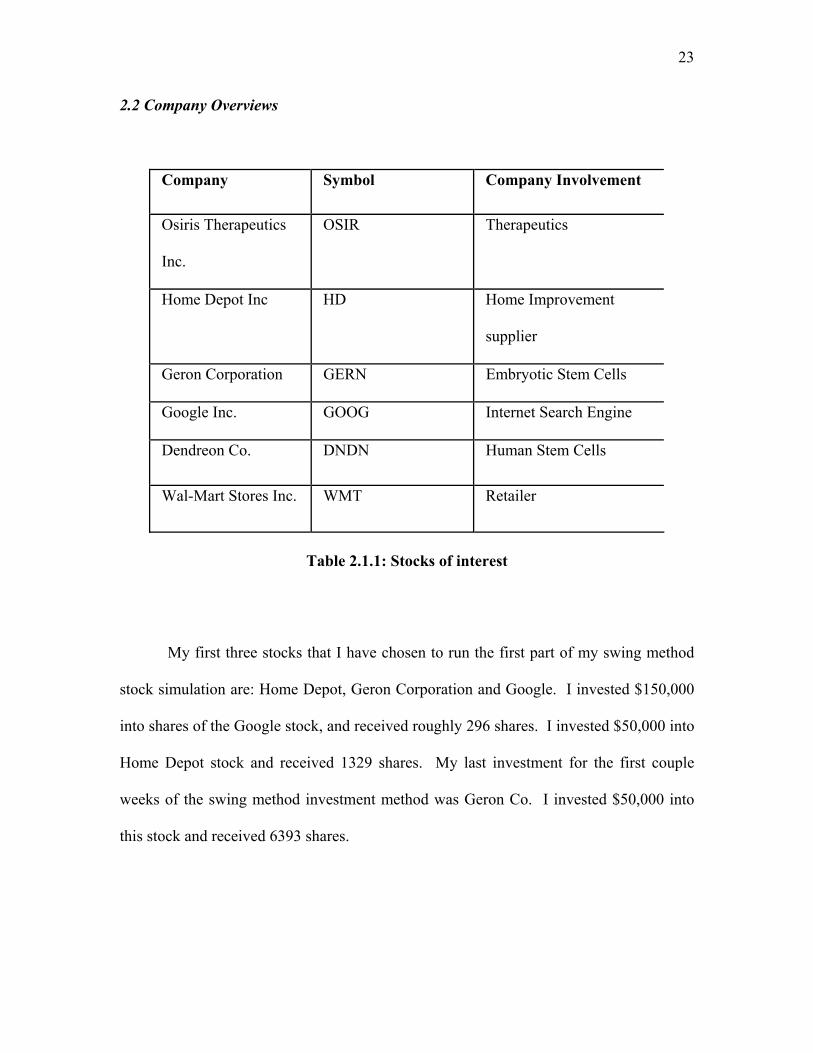
Table 2.1.1: Stocks of interest
My first three stocks that I have chosen to run the first part of my swing method
stock simulation are: Home Depot, Geron Corporation and Google. I invested $150,000
into shares of the Google stock, and received roughly 296 shares. I invested $50,000 into
Home Depot stock and received 1329 shares. My last investment for the first couple
weeks of the swing method investment method was Geron Co. I invested $50,000 into
this stock and received 6393 shares.

24
HOME DEPOT
Home Depot Inc. is a Delaware corporation that was incorporated in 1978
(Marketwatch.com). It is a home improvement retailer, whose stores sell a wide
assortment of building materials, home improvement, lawn, and garden products etc,
which is only in the United States. Their products are mainly bought by professional
business contractors, businesses, and municipalities. I figured this would be a great
company to invest in during the summer months, due to the high level of building and
reconstructing activities that are carried out during this time.
Fig 2.2.1: Home Depot Stock 1 year history
25
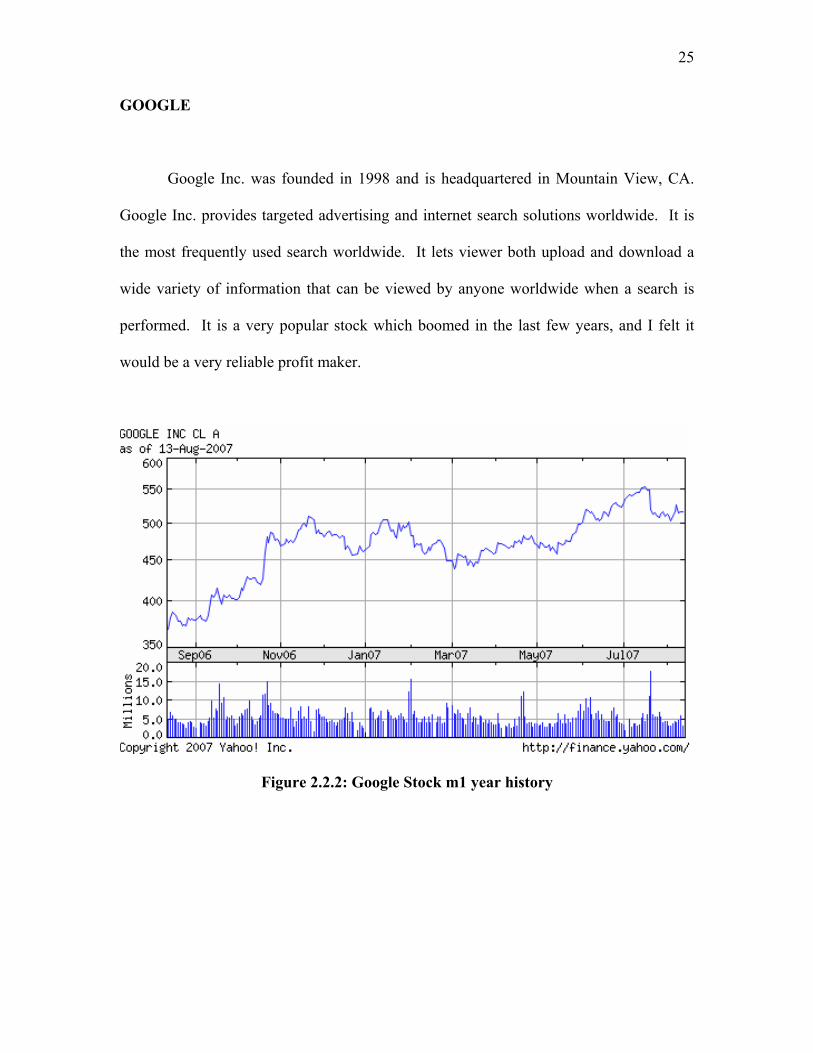
Google Inc. was founded in 1998 and is headquartered in Mountain View, CA.
Google Inc. provides targeted advertising and internet search solutions worldwide. It is
the most frequently used search worldwide. It lets viewer both upload and download a
wide variety of information that can be viewed by anyone worldwide when a search is
performed. It is a very popular stock which boomed in the last few years, and I felt it
would be a very reliable profit maker.
Figure 2.2.2: Google Stock m1 year history
26
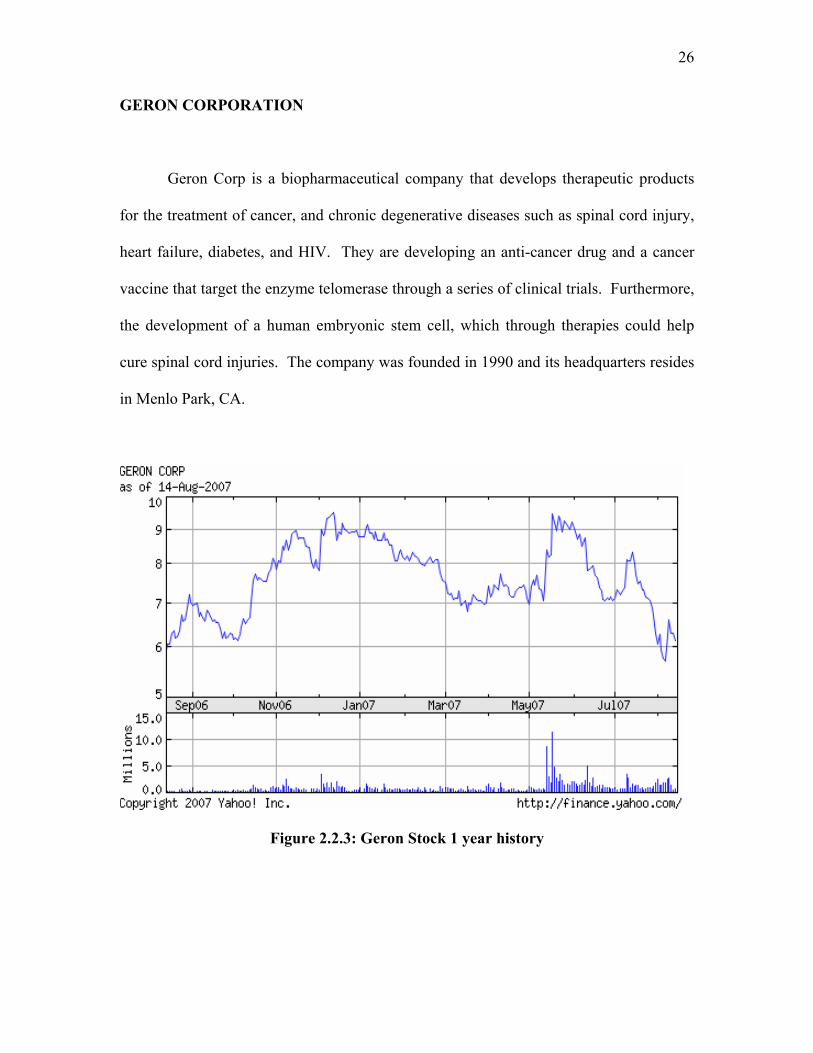
GERON CORPORATION
Geron Corp is a biopharmaceutical company that develops therapeutic products
for the treatment of cancer, and chronic degenerative diseases such as spinal cord injury,
heart failure, diabetes, and HIV. They are developing an anti-cancer drug and a cancer
vaccine that target the enzyme telomerase through a series of clinical trials. Furthermore,
the development of a human embryonic stem cell, which through therapies could help
cure spinal cord injuries. The company was founded in 1990 and its headquarters resides
in Menlo Park, CA.
Figure 2.2.3: Geron Stock 1 year history
27
WAL-MART
Wal-Mart stores Inc is a retail store in various formats worldwide. It has three
different segments including Wal-Mart, Sam’s Club, and International. Wal-Mart offers
general merchandise including apparel, domestics, fabrics, books, shoes, house wares,
hardware, electronics, sporting goods, toys etc. The store was founded in 1945 in
Bentonville, AK.
Figure 2.2.4: Wal-mart stock 1 year history
28
OSIRIS THERAPEUTICS
Osiris Therapeutics Inc. is a biotechnology company which commercializes stem
cell products from adult bone marrow in the U.S. It develops and markets products to
treat medical conditions involving inflammatory, orthopedic, and cardiovascular areas.
The company has a strategic alliance with JCR Pharmaceuticals Co, and a collaboration
agreement with Boston Scientific Corporation to develop applications of MSC
technology to treat acute myocardial infraction and chronic ischemia. The company was
founded in 1992 and is headquartered in Baltimore, MD.
Figure 2.2.5: OSIRIS stock 1 year history
29
DENDREON CORP
Dendreon Corp, formerly known as Activated Cell Therapy Inc., is another
biotech company, which engages in the discovery, development and commercialization
of therapeutics that harness the immune system to fight cancer. The company has
collaborative agreements with Genentech, Inc for the preclinical research, clinical
development, and commercialization of products derived from trp-p8, which is an ion
channel found in prostate cancer cells. The company was founded in 1992 in Seattle,
Washington.
Figure 2.2.6: Dendreon stock 1 year history

30
GENERAL DYNAMICS
General Dynamics Co provides land and expeditionary combat vehicles, systems,
armaments, munitions, business aviation, shipbuilding, and marine systems for the United
States Department of Defense. GD is comprised of four different segments: Aerospace,
Combat Systems, Marine Systems, and Information and Technology systems. GD
operates in North America, Europe, Latin America, the Middle East, Africa, and Asia. IT
was founded in 1899 and is based in Falls Church, VA.
Figure 2.2.7: GD stock 1 year history
31
RAYTHEON CO.
Raytheon Co is involved with the design, development, manufacturing,
integration, and support of tech products, services, and solutions for governmental and
commercial customers in the U.S and internationally. They primarily deal with military
defense innovations in weaponry and systems. The company has six segments:
Integrated Defense Systems, Intelligence and Info Systems, Missile Systems, Network
Centric Systems, Space and Airborne Systems and Technical Services. Raytheon was
founded in 1922 and is headquartered in Waltham, MA.
Figure 2.2.8: Raytheon Stock 1 year history

32
2.3 Trading
TRADING RECORD
Date Symb Buy/Sell
Price Shares
Net Cost Pro/Los T. Cash T. Asset
6/12/07 GERN Buy $7.81 6172 $48,203 0 $201,797 $250,000
6/12/07 HD Buy $37.55 1329 $49,903 0 $151,894 $250,000
6/12/07 GOOG Buy $506.34 296 $149,876 0 $2,018 $250,000 6/13/07 GERN Sell $7.51 6172 $46,351 ($1,852) $49,988 $248,148
6/13/07 GERN Buy $7.81 6393 $49,929 0 $59 $248,148
6/21/07 HD Sell $39.88 1329 $53,000 $3,097 $53,059 $251,245
6/25/07 GOOG Sell $530.05 296 $156,894 $7.02 $209,953 $258,263 7/9/07 GERN Sell $7.31 6393 $46,732 ($3,197) $256,685 $255,066
7/11/07 WMT Buy $47.58 2100 $99,918 0 $156,767 $255,066
7/11/07 OSIR Buy $12.87 3875 $49,871 0 $106,896 $255,066
7/11/07 DNDN Buy $7.84 6130 $48,059 0 $58,837 $255,066
7/11/07 OSIR Buy $12.72 1966 $25,007 0 $33,830 $255,066
7/13/07 GOOG Buy $548.01 55 $30,140 0 $3,690 $255,066
7/16/07 DNDN Sell $7.73 6000 $46,380 ($722) $50,070 $254,344
7/20/07 DNDN Sell $7.36 130 $956.80 $51,026 $254,344
7/26/07 OSIR Sell $12.85 5841 $75,057 $179 $223,715 $251,870
8/3/07 GD Buy $80.32 1000 $80,320 $0 $143,395 $251,821
8/3/07 RTN Buy $58.75 2000 $117,500 $0 $25,836 $250,900
Table 2.1.2: Trading record
33
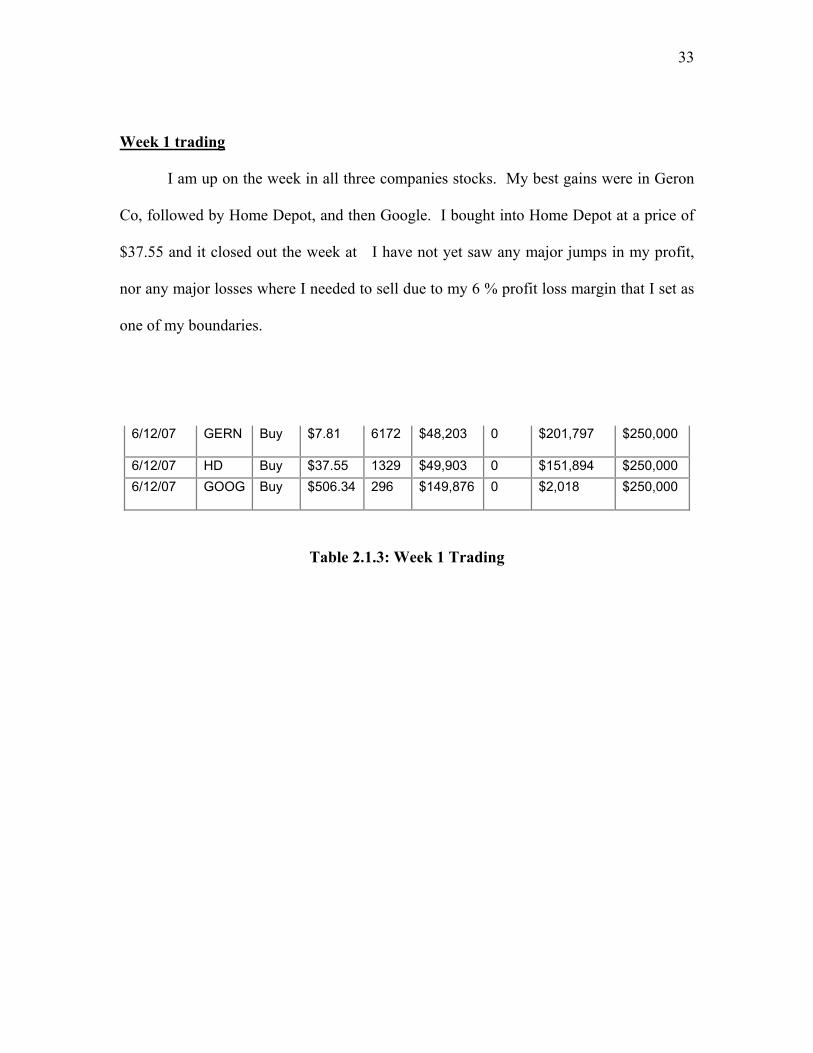
Week 1 trading
I am up on the week in all three companies stocks. My best gains were in Geron
Co, followed by Home Depot, and then Google. I bought into Home Depot at a price of
$37.55 and it closed out the week at I have not yet saw any major jumps in my profit,
nor any major losses where I needed to sell due to my 6 % profit loss margin that I set as
one of my boundaries.
6/12/07 GERN Buy $7.81 6172 $48,203 0 $201,797 $250,000
6/12/07 HD Buy $37.55 1329 $49,903 0 $151,894 $250,000 6/12/07 GOOG Buy $506.34 296 $149,876 0 $2,018 $250,000
Table 2.1.3: Week 1 Trading
34
Week 2 Trading
Geron Co. had a week low of $7.50/share, but closed out at $7.94/share at the end
of this week. I made a gain thus far of $836.20 profit in my stocks with Geron Co., and
will hold my shares in this company for another week.
Google had a week low of $498.69/share, but also closed the week with a new
high for my shares at 505.89/share. I have $82.88 profit with this company, and will
keep it for another week as well, although it may be my first trade.
Home Depot had a week low of 37.37/share, and also finished out the week up at
$37.95/share, leaving me with a profit of $584.76 thus far in my stocks with this
company. I will keep it for another week, but am also looking to trade out of some stocks
in this company this week.
Week 3 trading
This week I made my first sell on my initial three stocks that I was running my
simulation with. I sold out my shares in Google, and Home Depot and made $5,394 in
Google, as well as $3,069 in Home Depot stock. Tomorrow when the market opens I
will search for two or three more stocks to buy into and will update my status in next
weeks report. I will keep my 6393 stocks in Geron corporation, in which I am currently
35
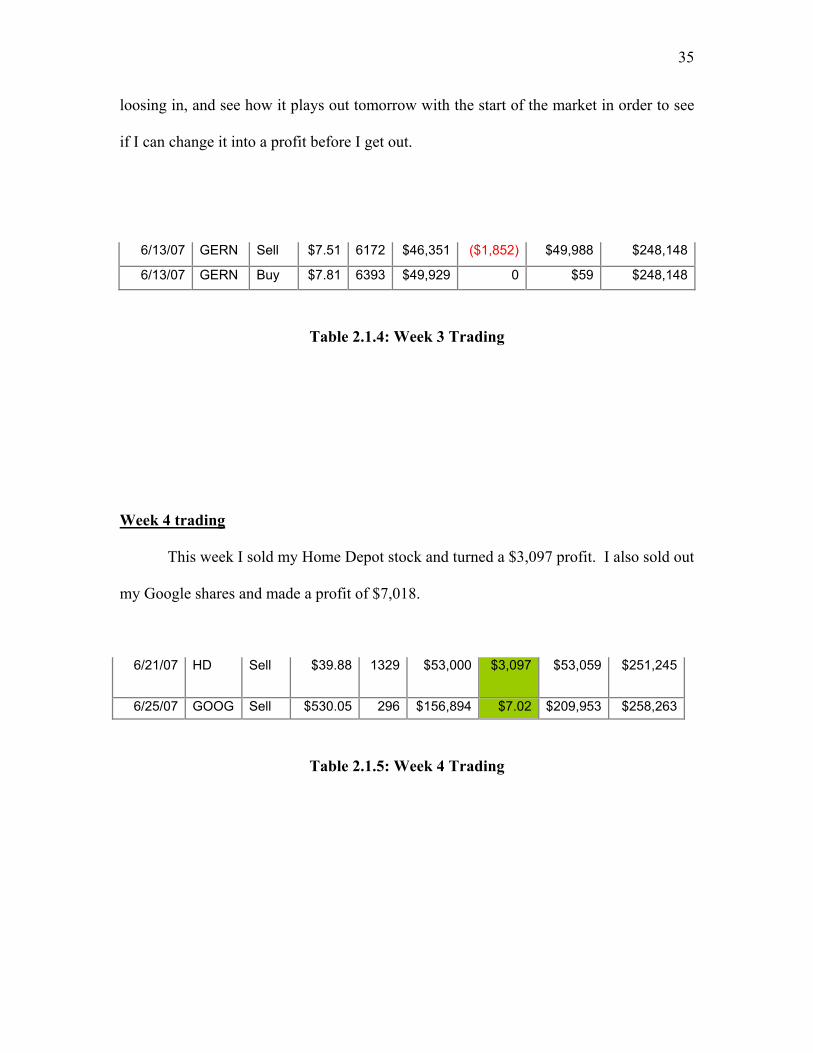
loosing in, and see how it plays out tomorrow with the start of the market in order to see
if I can change it into a profit before I get out.
6/13/07 GERN Sell $7.51 6172 $46,351 ($1,852) $49,988 $248,148
6/13/07 GERN Buy $7.81 6393 $49,929 0 $59 $248,148
Table 2.1.4: Week 3 Trading
Week 4 trading
This week I sold my Home Depot stock and turned a $3,097 profit. I also sold out
my Google shares and made a profit of $7,018.
6/21/07 HD Sell $39.88 1329 $53,000 $3,097 $53,059 $251,245
6/25/07 GOOG Sell $530.05 296 $156,894 $7.02 $209,953 $258,263
Table 2.1.5: Week 4 Trading
36
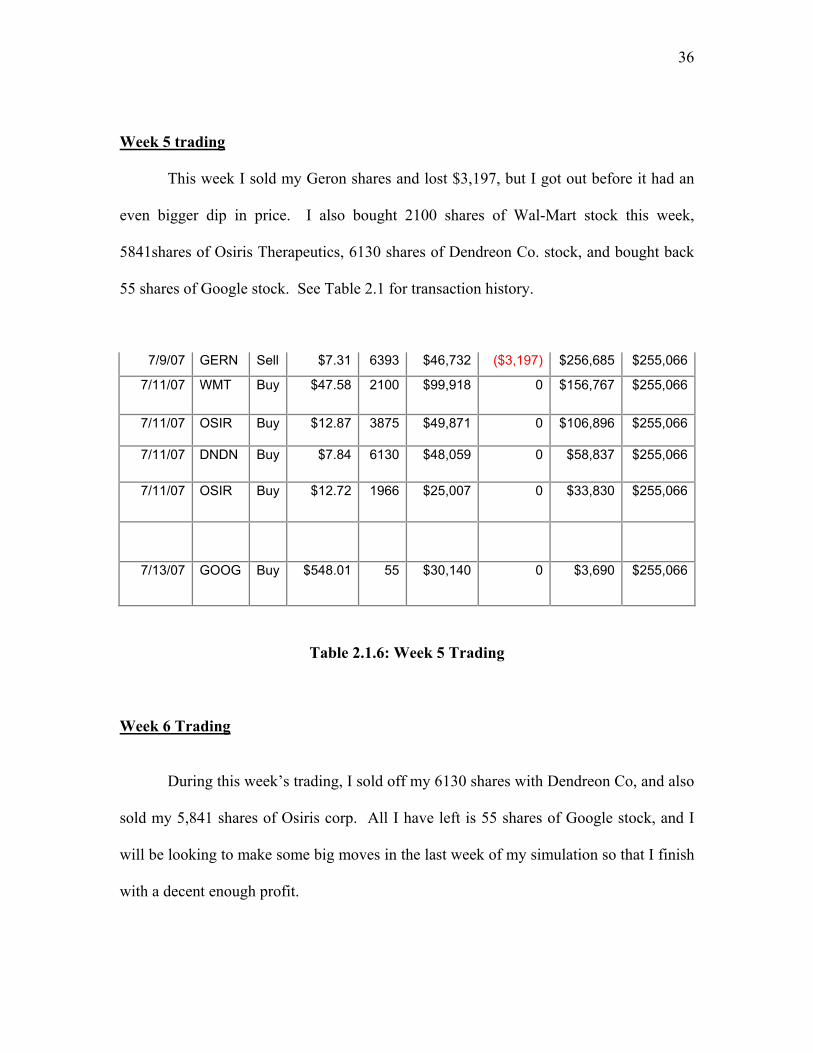
Week 5 trading
This week I sold my Geron shares and lost $3,197, but I got out before it had an
even bigger dip in price. I also bought 2100 shares of Wal-Mart stock this week,
5841shares of Osiris Therapeutics, 6130 shares of Dendreon Co. stock, and bought back
55 shares of Google stock. See Table 2.1 for transaction history.
7/9/07 GERN Sell $7.31 6393 $46,732 ($3,197) $256,685 $255,066
7/11/07 WMT Buy $47.58 2100 $99,918 0 $156,767 $255,066
7/11/07 OSIR Buy $12.87 3875 $49,871 0 $106,896 $255,066
7/11/07 DNDN Buy $7.84 6130 $48,059 0 $58,837 $255,066
7/11/07 OSIR Buy $12.72 1966 $25,007 0 $33,830 $255,066
7/13/07 GOOG Buy $548.01 55 $30,140 0 $3,690 $255,066
Table 2.1.6: Week 5 Trading
Week 6 Trading
During this week’s trading, I sold off my 6130 shares with Dendreon Co, and also
sold my 5,841 shares of Osiris corp. All I have left is 55 shares of Google stock, and I
will be looking to make some big moves in the last week of my simulation so that I finish
with a decent enough profit.
37
7/16/07 DNDN Sell $7.73 6000 $46,380 ($722) $50,070 $254,344
7/20/07 DNDN Sell $7.36 130 $956.80 $51,026 $254,344
7/26/07 OSIR Sell $12.85 5841 $75,057 $179 $223,715 $251,870
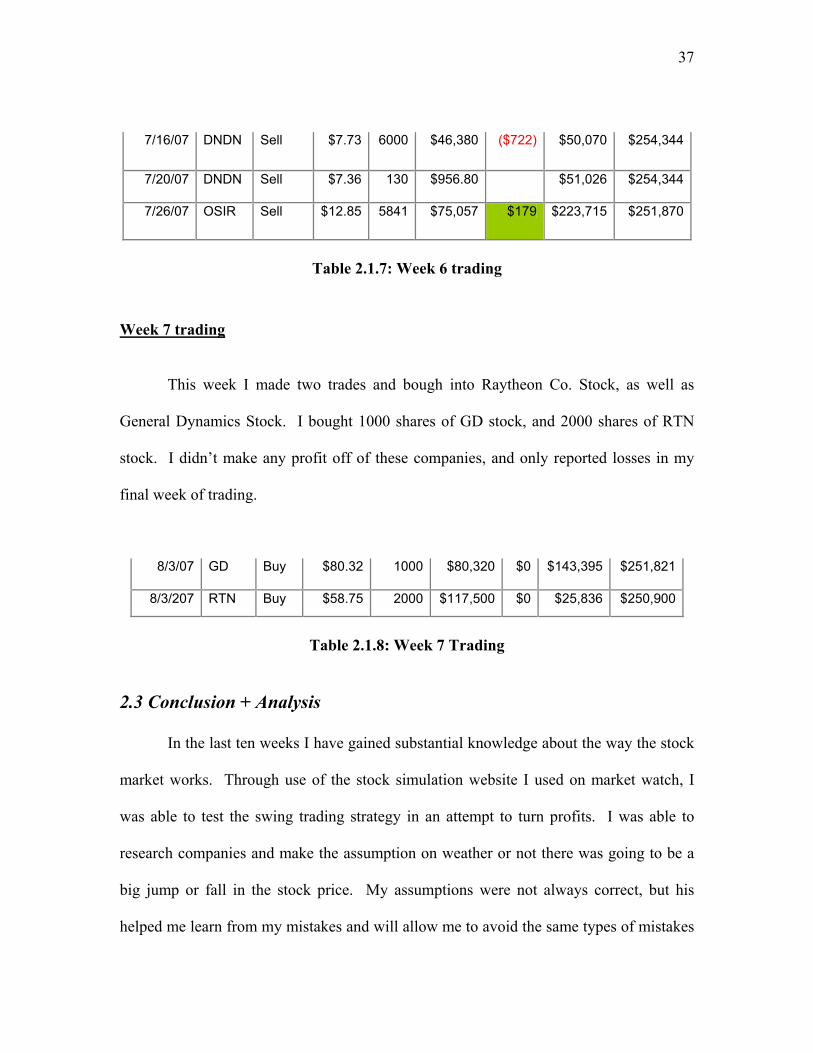
Table 2.1.7: Week 6 trading
Week 7 trading This week I made two trades and bough into Raytheon Co. Stock, as well as
General Dynamics Stock. I bought 1000 shares of GD stock, and 2000 shares of RTN
stock. I didn’t make any profit off of these companies, and only reported losses in my
final week of trading.
8/3/07 GD Buy $80.32 1000 $80,320 $0 $143,395 $251,821
8/3/207 RTN Buy $58.75 2000 $117,500 $0 $25,836 $250,900
Table 2.1.8: Week 7 Trading
2.3 Conclusion + Analysis
In the last ten weeks I have gained substantial knowledge about the way the stock
market works. Through use of the stock simulation website I used on market watch, I
was able to test the swing trading strategy in an attempt to turn profits. I was able to
research companies and make the assumption on weather or not there was going to be a
big jump or fall in the stock price. My assumptions were not always correct, but his
helped me learn from my mistakes and will allow me to avoid the same types of mistakes

38
in the future. All in all I started out with $249,708 total investment with three companies,
Home Depot, Geron Co, and Google, and ended up with $252,436. This is not the type
of profit margin I was looking to produce with my trading method; however I still made
$2700, which is still a profit. Although I spent 7 weeks of trading in an attempt to both
gain knowledge of the market and turn a successful profit, it was too short a period to
learn all of the ins and outs that the market is made up of, and it was only the tip of the
iceberg.

39
3. Ryan LaFalam’s Simulation
3.1 Introduction
The approach that I am going to take for this simulation was is based on the trend
following style of trading. I am going to pick companies that I think will be successful
and stick with them for most of the simulation. At certain times during the simulation
these companies could be on a temporary downfall where they could be traded I took
more of a day-to-day trading mentality. However, I will keep the stocks through these
temporary falls and keep them for a longer period of time. I will base my trading style on
long-term trends rather than short-term. The values of stocks change on a daily basis and
so they are quite near impossible to predict on a daily basis. There will always be gains
and always be loses on a day to day basis.
The idea of my trading style is to ignore these daily changes and focus more on
the longer term changes. These are the larger changes that occur over a longer period of
time. With this type of mentality it will be easier to understand the process of stock
trading by observing the activity of a few certain companies for weeks at a time. I will be
able to determine what relations, if any occur between the drops in stock value and the
activity that is going on in the company. For instance, maybe a new and inventive
product put out by a certain company will cause a rise in stock value, or maybe it will
cause a decline in stock value if no one buys the product.
The time for trading will come after a minimum of two or three weeks owning a
certain companies’ stocks. If the company is on a constant decline after a few weeks, the
40
stocks will most likely be sold, as this is qualified as a trend of decline. If a company is
doing well then its stocks will obviously be kept for as long as it is successful. If the
stocks of a certain company have a rapid decline, the shares will not be sold until after a
period of at least a couple weeks. This allows for redemption of the stocks value. It
gives the stock a chance to increase back to its original value and hopefully become
profitable. These are the long term fluctuations that my trading style will be based on.
3.2 Company Selection
The companies that I selected for the simulation are Home Depot, IBM
(International Business Machines). The Home Depot appeared to hold a somewhat
consistent stock value. Over the past three years the value of a stock has remained within
about a ten dollar change window. The consistency of the company means there is little
risk investing in the company, and the chances of a big loss is minimal. At the same time,
this means that the chances of a large increase are also minimal, so a large change in
value either way is unlikely.
IBM is a company whose stock value has a history of fluctuation. Over the past
two years, the value of stock has fluctuated by about forty dollars. This is a change of
around 30 or 40 percent, which is mostly increase over the past few years. It appears that
this company will be a good investment because judging by history, the stock value is
increasing. The history of the stock, however, does not tell the future of the value. Even
though it appears that the stock is on the rise, it could fall drastically in the blink of an
eye. The large changes in value make this investment more of a risk, but at the same
time, it could be more of a money maker.
41
The third company selected for the simulation is Focus Media Hldg. Ltd., which
seems to be an up and coming company. It is a fairly new media company out of China
whose stock has climbed from around five dollars about two years ago to the current
value of about forty-five. Similar to IBM, the history of rise in stock value can not be
relied on to continue that rise in the future. There will be some falls and some rises, but
to be a successful investment, the stock increases must outweigh the decreases.
3.3 Weekly Reports
Week 1
The first week of investment was not very profitable. The stock value of all three
companies decreased over the week. 1,104 shares were bought of Focus Media at $45.38
per share. After the first week, there was a total loss of $1,611.84. There were 2,153
shares of Home Depot bought at $39.80 per share. This stock value also decreased with a
total loss of $4,649.05. For IBM, there were 940 shares bought at $106.55 per share. For
the week, the overall change also resulted in a loss, which totaled $3,271.20. The losses
from the three company investments combined to give an overall loss of $9,532.09 for
the week. This is equivalent to a total return of -3.85%. Table 3.3.1 shows a
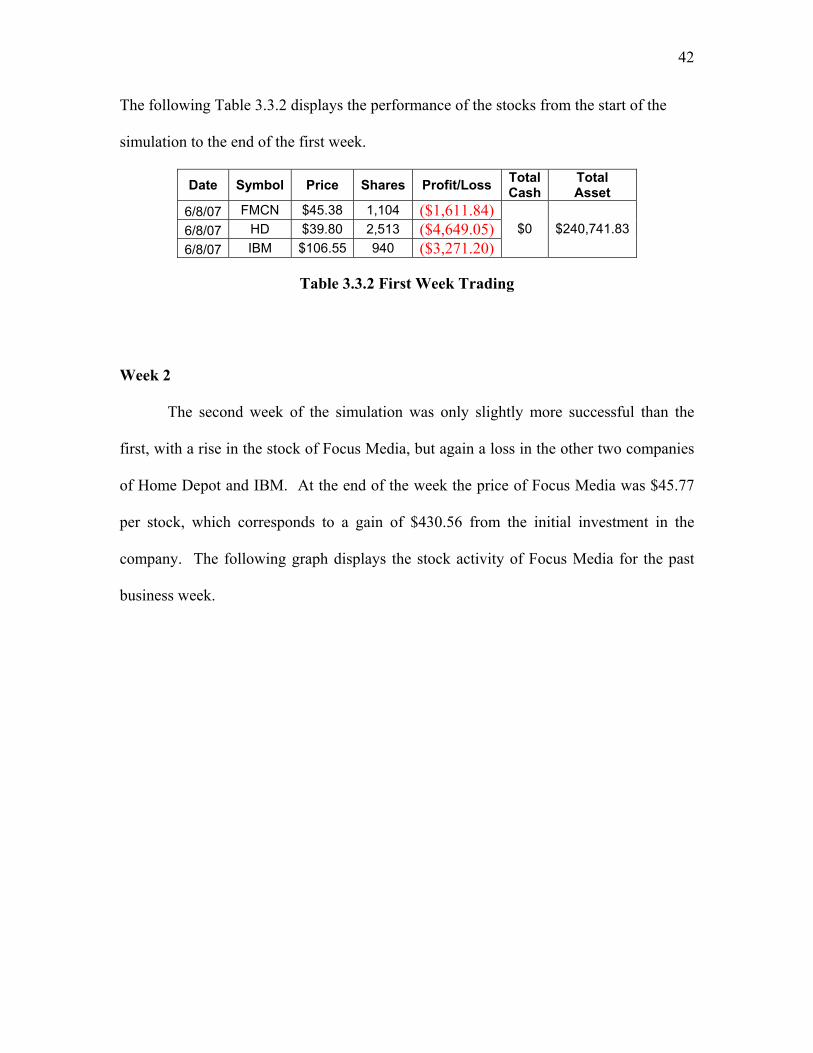
summarization of the stocks that were purchased at the start of the simulation.
Date Symbol Buy/ Sell Price Shares Net Cost Total
Cash Total Asset
6/4/07 FMCN Buy $45.38 1,104 $50,099.52 6/4/07 HD Buy $39.80 2,513 $100,017.406/4/07 IBM Buy $106.55 940 $100,157.00
$0 $250,273.92
Table 3.3.1 Purchasing of Stocks
42
The following Table 3.3.2 displays the performance of the stocks from the start of the
simulation to the end of the first week.
Date Symbol Price Shares Profit/Loss TotalCash
Total Asset
6/8/07 FMCN $45.38 1,104 ($1,611.84)6/8/07 HD $39.80 2,513 ($4,649.05)6/8/07 IBM $106.55 940 ($3,271.20)
$0 $240,741.83
Table 3.3.2 First Week Trading
Week 2
The second week of the simulation was only slightly more successful than the
first, with a rise in the stock of Focus Media, but again a loss in the other two companies
of Home Depot and IBM. At the end of the week the price of Focus Media was $45.77
per stock, which corresponds to a gain of $430.56 from the initial investment in the
company. The following graph displays the stock activity of Focus Media for the past
business week.
43
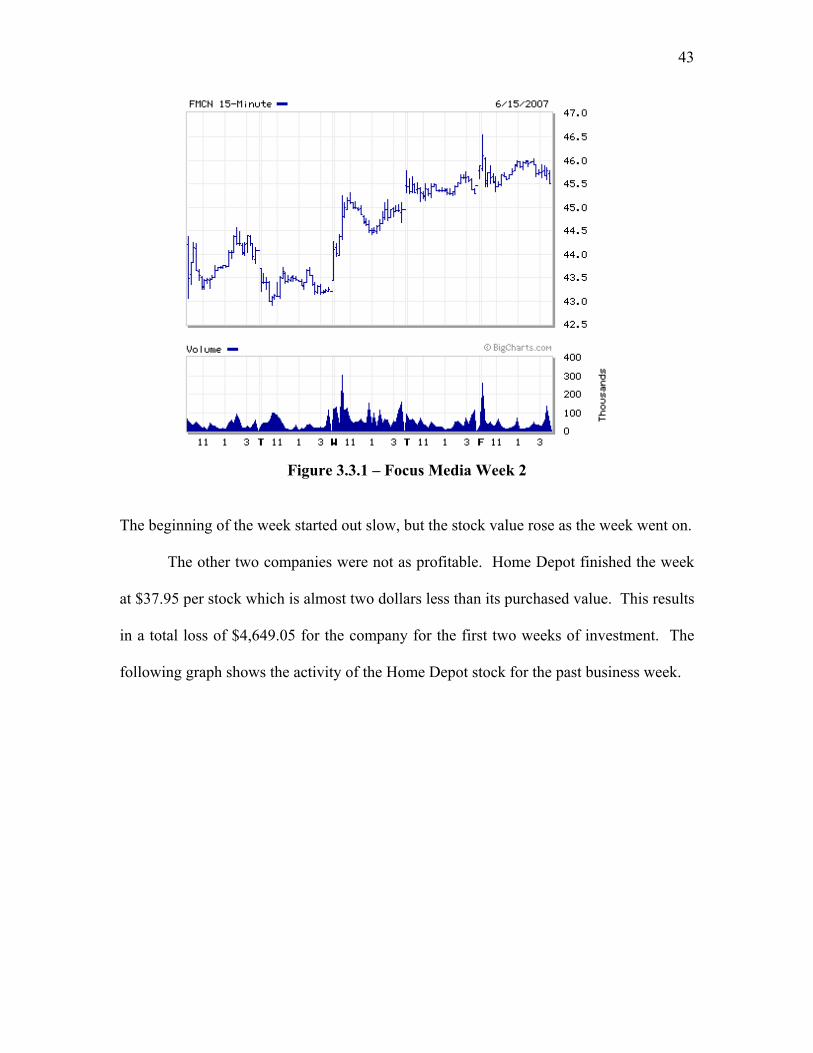
Figure 3.3.1 – Focus Media Week 2
The beginning of the week started out slow, but the stock value rose as the week went on.
The other two companies were not as profitable. Home Depot finished the week
at $37.95 per stock which is almost two dollars less than its purchased value. This results
in a total loss of $4,649.05 for the company for the first two weeks of investment. The
following graph shows the activity of the Home Depot stock for the past business week.

44
Figure 3.3.2 – Home Depot Week 2
Although there was a decent rise in the value of this stock, the price still fails to reach the
initial cost of $39.80.
The IBM stock was also unprofitable finishing out the week at a value of $105.09
per stock. This results in a total loss of $1,372.40 for the first two weeks of investment in
IBM. The following graph displays the variation in stock value for IBM over the past
business week.
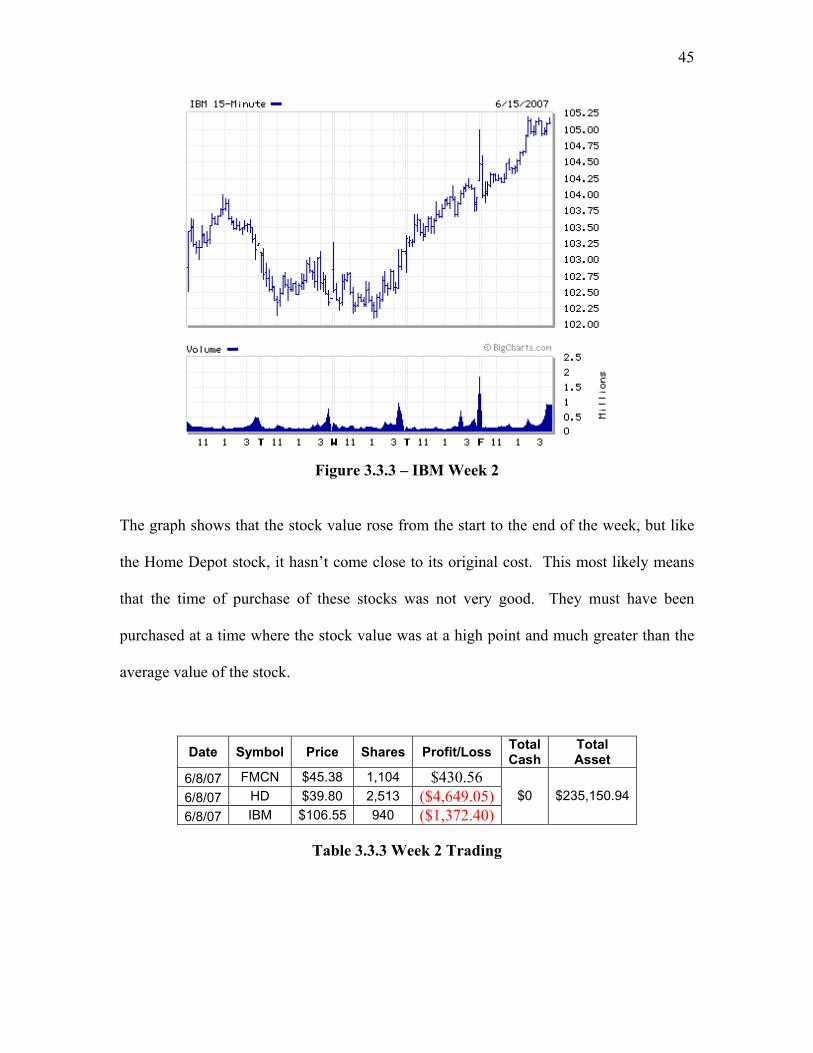
45
Figure 3.3.3 – IBM Week 2
The graph shows that the stock value rose from the start to the end of the week, but like
the Home Depot stock, it hasn’t come close to its original cost. This most likely means
that the time of purchase of these stocks was not very good. They must have been
purchased at a time where the stock value was at a high point and much greater than the
average value of the stock.
Date Symbol Price Shares Profit/Loss TotalCash
Total Asset
6/8/07 FMCN $45.38 1,104 $430.56 6/8/07 HD $39.80 2,513 ($4,649.05)6/8/07 IBM $106.55 940 ($1,372.40)
$0 $235,150.94
Table 3.3.3 Week 2 Trading

46
Week 3
Week 3 was profitable for Focus Media Inc. but again disappointing for Home
Depot and IBM. At the end of the week the value of IBM was $104.44 per share which
corresponds to an even greater loss from the previous week. Total loss for IBM totals
$1,983.40.
Home Depot’s market value increased from week 2 to 39.36, but did not reach its
initial purchase value, ending the week with a total loss of 1,105.72.
On the bright sight, Focus Media had a profitable return. The stock value at the
end of the business week was 47.27 a 3.28% increase from week 2 and a total increase of
4.16%, bringing the total market gain to 2,086.56. Total loss is $1002.56.
Focus Media is continuously on the rise due to the success of summer movie
releases. With the decrease of stock of Home Depot and IBM it is time for a trade. The
wisest move for trend following trading strategy is to sell these stocks and buy shares in
other stocks on the rise.
Date Symbol Price Shares Profit/Loss TotalCash
Total Asset
6/8/07 FMCN $45.38 1,104 $2,086.56 6/8/07 HD $39.80 2,513 ($1,105.72)6/8/07 IBM $106.55 940 ($1,983.40)
$0 $234,148.38
Table 3.3.4 Week 3 Trading
47
Week 4
In week 6 of the simulation a few transactions were made in an attempt to
increase profit. The shares of Focus Media were kept as the value of the stock continues
to increase, providing an increasing profit for that particular stock. On the other hand, the
shares of Home Depot were sold because they were not producing any profit, and
actually maintained a value under cost which caused a loss of money. Even though IBM
stock has also been disappointing over the past few weeks, all of the shares were kept.
The reasoning behind this is that the computer and technologies industry is rapidly
changing. There is a better and faster computer released to the market every few months.
When these new technologies are released, they create a big stir in the market and most
often the company which produced that product increases its worth by a large amount.
This in turn increases the value of the stock. So then, the bottom line for keeping this
stock is the anticipation of a new product from IBM.
Focus media stock again increased by a decent amount. It rose to $50.49, which
is a $3.22 increase from week 5. This leads to a total gain of $5635.92 between all the
shares of Focus Media.
IBM is still on the disappointing side. The value of each share at the end of the
week was $105.25 which is 81 cents less than the value of last week. The overall loss
from the 940 shares of IBM totals up to be $1,222.00.
I made the decision on Monday to purchase another stock from a company that
has had a previous trend of increasing stock value. The company selected was Apple,
Inc. and the reasoning behind the decision was the release of the much anticipated
iPhone. It is a new product that is supposed to revolutionize the cellular telephone
48
industry. The iPhone is a combination cell phone/portable computer/mp3 player that
should be very popular in today’s society. Eight hundred and eight shares of this stock
were bought at $121.20 per share. Table 3.3.5 shows a summary of week 4’s transactions
and performance.
Date Symbol Buy/ Sell Price Shares Net Cost/
Proceeds Profit/Loss Total Cash
Total Asset
6/29/07 HD Sell $39.35 2,513 $98,886.55 ($1,130.85)
6/29/07 FMCN $45.38 1,104 $5635.92
6/29/07 IBM $106.55 940 ($1,222.00)
$98,886.55 $253,556.99
7/2/07 AAPL Buy $121.20 808 $97,929.60 $956.95 $253,556.99
Table 3.3.5 Week 4 Trading
Week 5
The purchase of the stocks of Apple, Inc. turned out as expected at least for the
first week and proved to be a good investment. The following figure displays the stock
value of the past week from Monday, July 2nd to Friday July 6th.
49
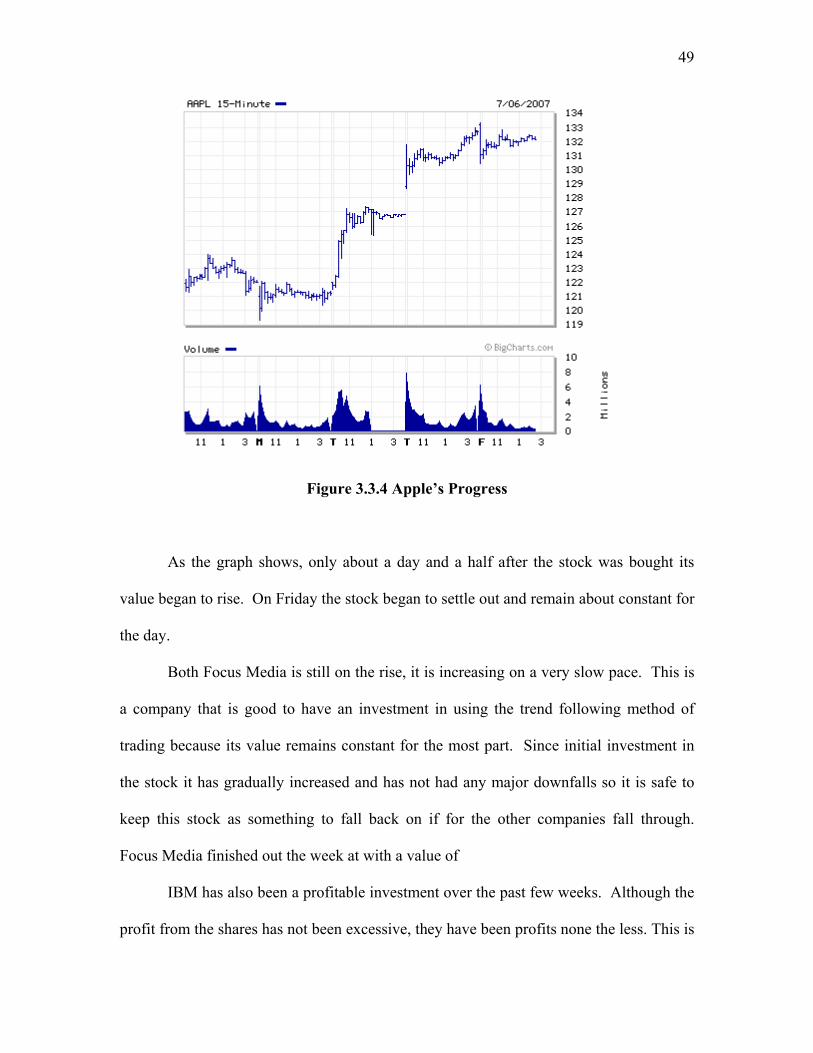
Figure 3.3.4 Apple’s Progress
As the graph shows, only about a day and a half after the stock was bought its
value began to rise. On Friday the stock began to settle out and remain about constant for
the day.
Both Focus Media is still on the rise, it is increasing on a very slow pace. This is
a company that is good to have an investment in using the trend following method of
trading because its value remains constant for the most part. Since initial investment in
the stock it has gradually increased and has not had any major downfalls so it is safe to
keep this stock as something to fall back on if for the other companies fall through.
Focus Media finished out the week at with a value of
IBM has also been a profitable investment over the past few weeks. Although the
profit from the shares has not been excessive, they have been profits none the less. This is
50
somewhat different from the history of the stock which, as mentioned earlier, varied quite
a bit. This is proof that the future of the stock market cannot be predicted by studying its
past. IBM finished out the week with a profit of $2,415.80.
Although these companies have been profitable, it may be smart to trade either
half of each stock or one whole stock and invest in a company that appears to be on the
rise. Keeping part or one of these companies provides somewhat of insurance for a solid
portion of the money invested. Half of this money can be kept constant while the other
half can be put at more of a risk with a company whose stock value fluctuates more often.
Date Symbol Price Shares Profit/Loss Total Cash
Total Asset
7/8/07 FMCN $45.38 1,104 $2,616.48 7/8/07 AAPL $121.20 808 $8,968.80 7/8/07 IBM $106.55 940 $2,415.80
$956.95 $254,513.94
Table 3.3.6 Week 5 Trading
For this week, I made profit on all of my investments. FCMN finished the week at
$47.75, which gave me a profit of $2,616.48. IBM finished the week at $109.12 leaving
me a profit of $2,415.80, and AAPL finished the week at $132.30, which lead to a profit
of $8,968.80. My overall gains are for this week are $14,001.08.
Week 6
At the end of week 6 the price of Focus Media stock was at $49.54, which is a
$1.75 increase from the end of last week. The Apple, Inc. stock finished the week at
$139.26, which is quite an increase of $6.96 from last week. IBM finished week 6 with a

51
stock value of $109.53, which is only a 41 cent increase from last week. These share
values correspond to the week’s profit for each of the stocks as shown in the following
table.
Date Symbol Price Shares Profit/Loss Total Cash
Total Asset
7/15/07 FMCN $45.38 1,104 +$4,592.64 7/15/07 AAPL $121.20 808 $14,592.48 7/15/07 IBM $106.55 940 +$2,801.20
$956.95 $262,455.02
Table 3.3.7 Week 6 Trading
The total week’s profit ended up being $7,941.08, which contributes to the total asset of
$262,455.02. With an initial investment very close to $250,000 and a total asset of
$262,455.02, my total profit after week 6 is approximately $12,455.02. After the Home
Depot Stocks were sold it seems as though profits hit an all time high, with each one of
the stocks doing well.
Week 7
This week was not quite as profitable as the past few weeks. All three of the
stocks have decreased in value since week six. Focus Media plummeted with respect to
previous changes in value ending the week at $42.93 which is a decrease of $6.61. This
causes an overall loss from the Focus Media stock of $2,704.80. The following graph
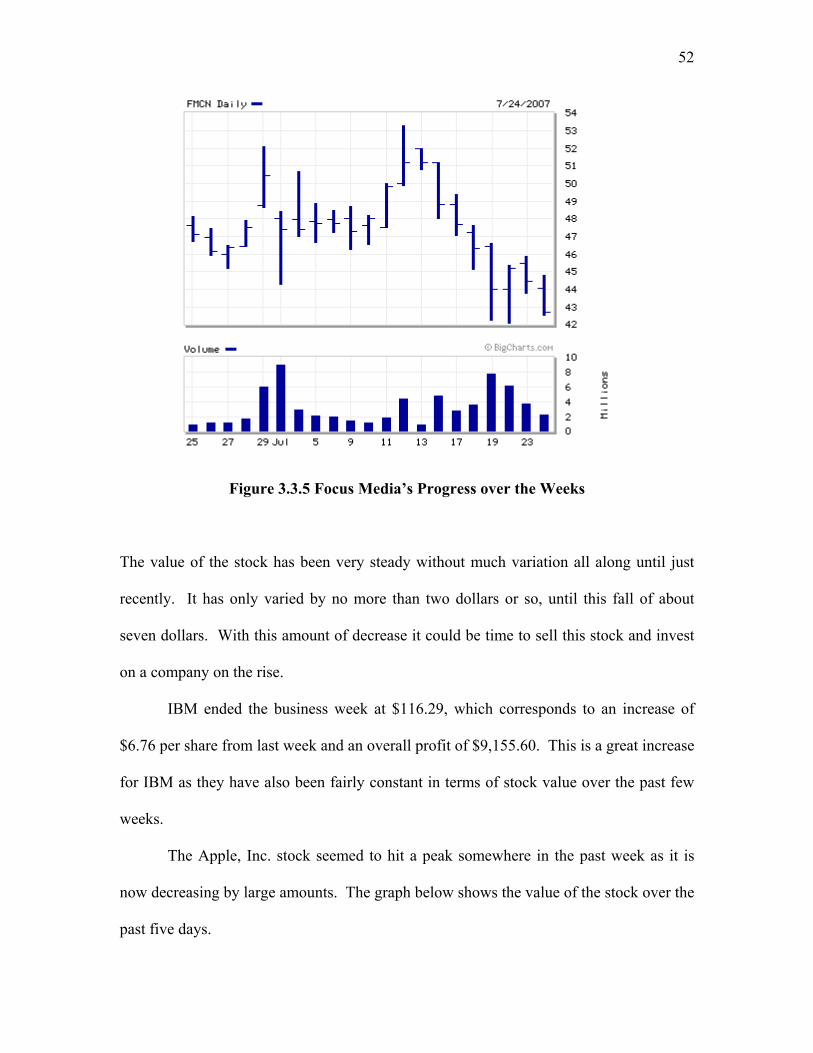
displays behavior of the stock over the past month.
52
Figure 3.3.5 Focus Media’s Progress over the Weeks
The value of the stock has been very steady without much variation all along until just
recently. It has only varied by no more than two dollars or so, until this fall of about
seven dollars. With this amount of decrease it could be time to sell this stock and invest
on a company on the rise.
IBM ended the business week at $116.29, which corresponds to an increase of
$6.76 per share from last week and an overall profit of $9,155.60. This is a great increase
for IBM as they have also been fairly constant in terms of stock value over the past few
weeks.
The Apple, Inc. stock seemed to hit a peak somewhere in the past week as it is
now decreasing by large amounts. The graph below shows the value of the stock over the
past five days.
53
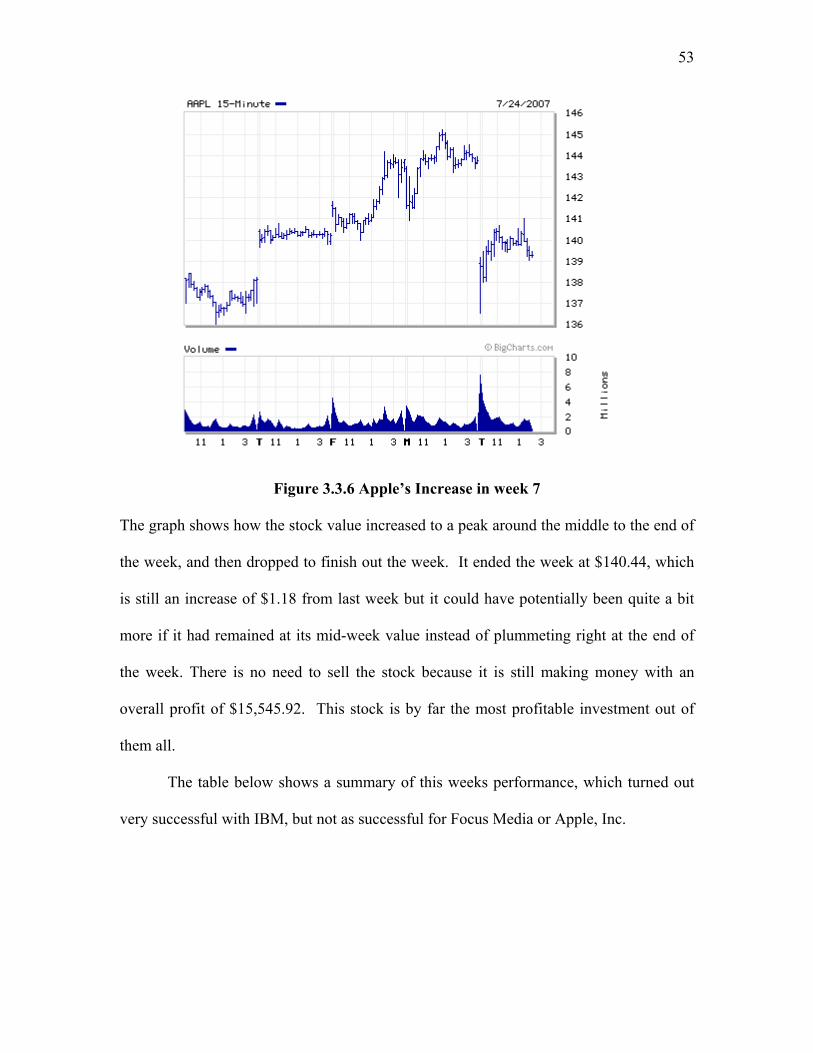
Figure 3.3.6 Apple’s Increase in week 7
The graph shows how the stock value increased to a peak around the middle to the end of
the week, and then dropped to finish out the week. It ended the week at $140.44, which
is still an increase of $1.18 from last week but it could have potentially been quite a bit
more if it had remained at its mid-week value instead of plummeting right at the end of
the week. There is no need to sell the stock because it is still making money with an
overall profit of $15,545.92. This stock is by far the most profitable investment out of
them all.
The table below shows a summary of this weeks performance, which turned out
very successful with IBM, but not as successful for Focus Media or Apple, Inc.
54
Date Symbol Price Shares Profit/Loss Total Cash
Total Asset
7/22/07 FMCN $45.38 1,104 ($2,704.80) 7/22/07 AAPL $121.20 808 $15,545.92 7/22/07 IBM $106.55 940 $9,155.60
$956.95 $262,465.42
Table 3.3.8 Week 7 Trading
Week 8
This week there was some profit but not much at all. Focus Media is still in
decline with another loss of value of $2,958.72 since last week. At the beginning of the
simulation this stock was very successful increasing in value each week. However, over
the past few weeks it has been a major downfall as its value has dropped far below its
cost. At the start of week one there were 1,104 shares of Focus Media bought at $45.38
per share. That was an initial investment of exactly $50,099.52. That value has
decreased to $44,436.00 for an overall decrease of $5,663.52. Although at first this
seemed like a profitable investment; and it could have been if the shares were sold when
their value was up, it turns out that coming up on the end of the simulation, they will not
be very profitable.
Apple still proves to be successful with another week’s increase of $2,755.28.
This stock has been increasing since it was purchased a few weeks ago. If the simulation
were to continue for a longer period of time a smart move would be to sell the shares of
Focus Media and shift the money into Apple, Inc. since it appears to be so successful.
However, this move would only be smart because it follows the method of trend
following. It would not exactly be the most successful move to make. Any day the
values of both Focus Media and Apple could reverse. Focus Media could increase
55
“through the roof” while Apple has a major downfall and falls below its initial cost. This
is the completely unpredictable nature of the stock market.
IBM stocks continue their decrease in value as they fall again this week by
$629.80. Although this is somewhat of an insignificant amount in proportion to the
initial investment, it adds to the rest of the decreases that have occurred the past few
weeks. However, there is still a great profit in this stock because there was so much of an
increase in the early weeks of the simulation. The overall profit from this stock is
$8,525.80. The following table 3.3.9 summarizes the gains and losses from the week and
the overall value invested in the stock market.
Date Symbol Price Shares Profit/Loss Total Cash
Total Asset
7/29/07 FMCN $45.38 1,104 ($2,958.72) 7/29/07 AAPL $121.20 808 $2,755.28 7/29/07 IBM $106.55 940 ($629.80)
$956.95 $262,589.13
Table 3.3.9 Week 8 Trading
3.4 Conclusions and Analysis
The final outcome of this stock market simulation was profitable. At the close of
the simulation, the overall changes in value from each of the companies were as follows.
Focus Media produced an overall loss of $5,663.52. IBM produced an overall profit of
$8,525.80. Home Depot, which was sold about mid-way through the simulation ended
with an overall loss of $1,130.85. The most profitable company was Apple, Inc. which
finished with an overall profit of $18,301.20. Altogether, the total profit resulted in about
$20,000. With this kind of result, I suppose it can be said that this was a successful run at

56
the stock market, because there was an overall profit. This profit could have changed
quickly, however, if the simulation was continued into further weeks, because of the
complete unpredictability of the stock exchange [2].

57
4. John Piccolomini’s Simulation
4.1 Introduction The strategies that I decided to employ were to take the more dominant
companies and sit on them for the entire simulation. The companies I chose dominate
their industries and have so much action and investment that the changes are usually
subtle, resulting in either a slight increase or a slight loss in the value of the stock. I
looked for companies that were on the rise with the idea that they would continue to rise
over time. Also, I picked popular companies that I had heard of before so I knew they
were dependable.
I also did a second simulation towards the end with a different strategy of buying
more companies and then selling them sooner to see if I could make a quick profit. This
made me look into companies that were growing faster and less popular. It gave me
more insight into what trading in the stock market is really like and the stresses that
people go through each day. Luckily, I was only using a simulation.
4.2 Company Selection When it came to picking my companies, I looked at companies that I thought
weren’t too risky for an initial investor and would give a hopefully profitable pay out. I
wanted companies that I could invest in with real money when I was first starting out.
For that main reason I looked for companies that were of low risk and companies that
have shown reports of steady earnings.
When I looked at Johnson & Johnson I found that they were a defensive stock as
well as a blue-chip and growth stock. This caught my attention because it had a high
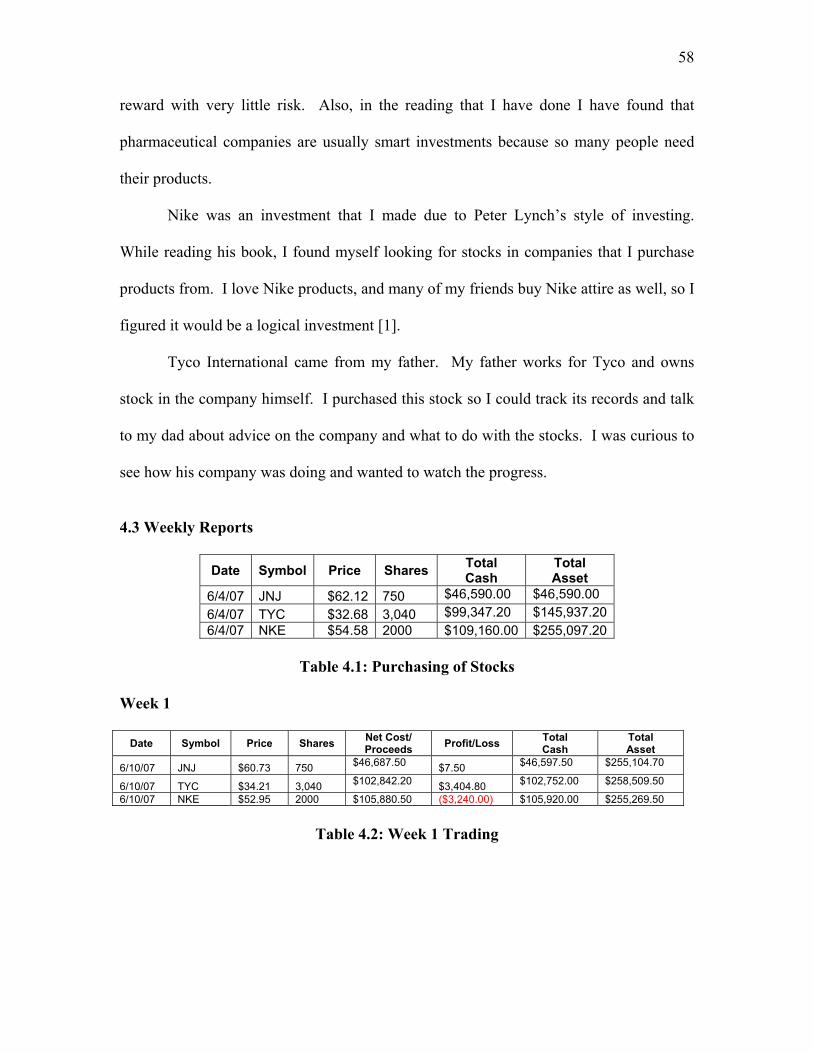
58
reward with very little risk. Also, in the reading that I have done I have found that
pharmaceutical companies are usually smart investments because so many people need
their products.
Nike was an investment that I made due to Peter Lynch’s style of investing.
While reading his book, I found myself looking for stocks in companies that I purchase
products from. I love Nike products, and many of my friends buy Nike attire as well, so I
figured it would be a logical investment [1].
Tyco International came from my father. My father works for Tyco and owns
stock in the company himself. I purchased this stock so I could track its records and talk
to my dad about advice on the company and what to do with the stocks. I was curious to
see how his company was doing and wanted to watch the progress.
4.3 Weekly Reports
Date Symbol Price Shares Total Cash
Total Asset
6/4/07 JNJ $62.12 750 $46,590.00 $46,590.00 6/4/07 TYC $32.68 3,040 $99,347.20 $145,937.20 6/4/07 NKE $54.58 2000 $109,160.00 $255,097.20
Table 4.1: Purchasing of Stocks
Week 1
Date Symbol Price Shares Net Cost/ Proceeds Profit/Loss Total
Cash Total Asset
6/10/07 JNJ $60.73 750 $46,687.50 $7.50 $46,597.50 $255,104.70
6/10/07 TYC $34.21 3,040 $102,842.20 $3,404.80 $102,752.00 $258,509.50
6/10/07 NKE $52.95 2000 $105,880.50 ($3,240.00) $105,920.00 $255,269.50
Table 4.2: Week 1 Trading

59
Figure 4.1 Charts for Week 1 Johnson & Johnson
This is the stock chart for Johnson and Johnson that shows my earnings over the
past few days. Right now Johnson and Johnson is up .13. The gain/loss ratio is +$7.50
and the percent equity is 18.63. Johnson and Johnson seem to be on the incline as shown
in the charts.

60
Figure 4.2 Charts for Week 1 Tyco International
These are the charts for Tyco International, which show that the progression this
week has been on a slow incline. Tyco has given me my largest profit this week, which
is keeping me in the green. Tyco had a change of +1.17, which led to a gain/loss ratio of
+$3,404.80 and a percent equity of 41.09.

61
Figure 4.3 Chart for Week 1 Nike
Nike was a company that has been making less money than it usually does. This
could be a risk; however, after reviewing charts and looking at the company’s prospects,
Nike looks to be coming back from its debt that it had before. I like Nike products and
continue to buy them, so I am hoping they will bounce back.
This week hasn’t been the best for Nike, and the change is at -1.14. The gain/loss
ratio put us at -$3,240 and the percent equity is 42.35. I’m hoping to see a rise in the
stock price in the next few days.
62
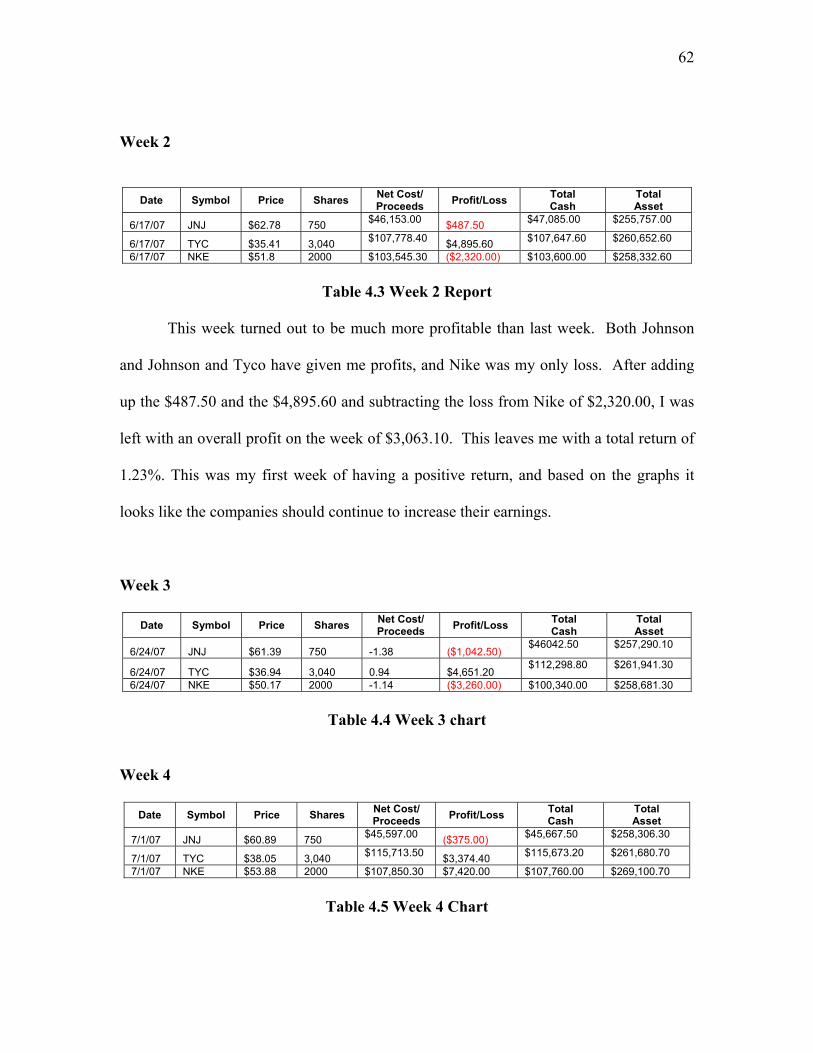
Week 2
Date Symbol Price Shares Net Cost/ Proceeds Profit/Loss Total
Cash Total Asset
6/17/07 JNJ $62.78 750 $46,153.00 $487.50 $47,085.00 $255,757.00
6/17/07 TYC $35.41 3,040 $107,778.40 $4,895.60 $107,647.60 $260,652.60
6/17/07 NKE $51.8 2000 $103,545.30 ($2,320.00) $103,600.00 $258,332.60
Table 4.3 Week 2 Report
This week turned out to be much more profitable than last week. Both Johnson
and Johnson and Tyco have given me profits, and Nike was my only loss. After adding
up the $487.50 and the $4,895.60 and subtracting the loss from Nike of $2,320.00, I was
left with an overall profit on the week of $3,063.10. This leaves me with a total return of
1.23%. This was my first week of having a positive return, and based on the graphs it
looks like the companies should continue to increase their earnings.
Week 3
Date Symbol Price Shares Net Cost/ Proceeds Profit/Loss Total
Cash Total Asset
6/24/07 JNJ $61.39 750 -1.38 ($1,042.50) $46042.50 $257,290.10
6/24/07 TYC $36.94 3,040 0.94 $4,651.20 $112,298.80 $261,941.30
6/24/07 NKE $50.17 2000 -1.14 ($3,260.00) $100,340.00 $258,681.30
Table 4.4 Week 3 chart
Week 4
Date Symbol Price Shares Net Cost/ Proceeds Profit/Loss Total
Cash Total Asset
7/1/07 JNJ $60.89 750 $45,597.00 ($375.00) $45,667.50 $258,306.30
7/1/07 TYC $38.05 3,040 $115,713.50 $3,374.40 $115,673.20 $261,680.70
7/1/07 NKE $53.88 2000 $107,850.30 $7,420.00 $107,760.00 $269,100.70
Table 4.5 Week 4 Chart

63
This week was very strong for Nike, as they had a profit of $7,420.00. This put
me in the green with a return on the week of 4.02% and a total return of 4.13%. My total
asset now is $269,100.70.
Week 5
Date Symbol Price Shares Net Cost/ Proceeds Profit/Loss Total
Cash Total Asset
7/8/07 JNJ $60.88 750 $45,613.50 ($7.70) $45,659.80 $269,093.00
7/8/07 TYC $39.16 3,040 $119,152.20 $3,374.40 $119,047.60 $272,467.40
7/8/07 NKE $54.47 2000 $108,973.00 $1,180.00 $108,940.00 $273,647.40
Table 4.6 Week 5 Chart
This week was decent overall because NKE and TYC both had a large profit, and
JNJ’s loss of $7.70 didn’t really hurt me that much. After calculating the profit and loss
from each company, I was left with a total profit this week of $4,546.70, which proved
week 5 to be a great week for me.
Weeks 6-8
My blue-chip companies JNJ and TYC didn’t fair so well these last few weeks
with JNJ losing $1,762.50 and TYC losing $1,489.60. Nike, however, has been doing
great and ended the week at $110,660.00. Therefore, the total asset for these weeks came
to $272,115.30, which gives me a profit of $17,018.10.
Date Symbol Price Shares Net Cost/ Proceeds Profit/Loss Total
Cash Total Asset
7/27/07 JNJ $58.53 750 $43,792.00 ($1,762.50) $43,897.30 $271,884.90
7/27/07 TYC $38.67 3,040 $117,472.30
($1,489.60) $117,558.00 $270,395.30
7/27/07 NKE $55.33 2000 $110,685.20 $1,720.00 $110,660.00 $272,115.30
Table 4.7 Weeks 6-8
64
Week 9
This last week I sold my companies and finished my simulation. Both JNJ and
NKE did really well for me in the last week. TYC had a rough week and dropped
$3,312.50, which surprised me because TYC was doing so well over the entire
simulation. The total profit made from TYC throughout the entire simulation was
$14,898.30, and Nike gave me a profit of $5,349.95. My only loss came with JNJ, which
dropped $1,029.77.
Date Symbol buy/ sell Price Shares
Net Cost/ Proceeds
Profit/ Loss
Total Cash
Total Asset
8/07/07 JNJ Sell 60.75 750 46,490.43 1662.93 $45,560.23 $273,778.23 8/07/07 TYC Sell 37.58 3,040 114,220.81 -3312.50 $114,245.50 $270,465.73 8/08/07 NKE Sell 57.25 2000 114,729.95 3849.95 $114,509.95 $274,315.68
Table 4.8 Week 9
Weeks 6-8 Second Simulation
These last few weeks I decided to do something different. My strategies before
had been to take the bigger companies and sit on them for a long period of time to slowly
watch them grow. The first three companies that I chose were making me profits with
that type of strategy; however, I decided that I wanted to learn more about the stock
market, the companies, and the way they rise and fall each day. To do this I decided to
buy some new stocks and watch them closely. All the stocks that I bought were at a
constant rate as the graphs above show, and they looked reasonably steady.
Unfortunately, all of them slowly started to decline as the weeks went on. I decided that I
didn’t want to sell any of them because I wanted to wait for them to make a slight
comeback. This strategy hurt me because last week was a horrible week for my
companies, as almost all of them dropped significantly. Now I will have to wait for next
65
week to sell and take a loss or hopefully see a comeback. This goes to show that you
never really know when the companies are going to bounce back or if they are going to
keep declining. There is so much to watch and read about to stay on top of your
companies and how they are doing. It would have been a really tough lesson if this was
my real money.
Figure 4.4 UBS chart
UBS AG was founded on June 29th 1998, with the merger of Union Bank of
Switzerland and Swiss Bank Corporation. It operates under Swiss Company Law and
Swiss Federal Banking Law as a corporation that has issued shares of common stock to
investors. It is a global financial services company and focuses on wealth and asset
management, investment banking, and securities businesses. The first shares of UBS that
66
I bought were at $59.96, and I bought 200 shares for a total of $11,996. With the horrible
past few days of the stock market, the shares dropped to $54.40 for a total loss of
$1,112.00.
Figure 4.5 HMC Chart
Honda Motor Co., Ltd. is a limited liability, joint stock corporation that was
started on September 24, 1948. It was formed to succeed the business of an
unincorporated enterprise established in 1946 by Soichiro Honda for the purpose of
manufacturing motors for motorized bikes. They make engines and motor products for a
variety of different cars and purposes. Approximately 19.5 million Honda engines were
sold worldwide in the fiscal year that ended on March 31st, 2006. I own a 2004 Honda
Civic and have been completely happy with it. I liked the company and decided to try
them out. I purchased 200 shares of HMC stock at $36.56 a share for a total of $7,318.00.
The shares are now at $35.65 for a total loss of $182.00.
67
Figure 4.6 ERIC chart
Ericsson Telephone Company was incorporated on August 18, 1918, and is a
provider of telecommunications equipment and related services to mobile and fixed
network operations globally. Ericsson has been a big hit recently with their walkman
related cell phone products. I traveled to Europe to find that many people had these cell
phones, which made me think they would be on steady rise of profit. I purchased 420
ERIC shares at $41.47 for a total of $17,417.40. The shares dropped to $37.23 which
gave a loss of $1,781.40.
68
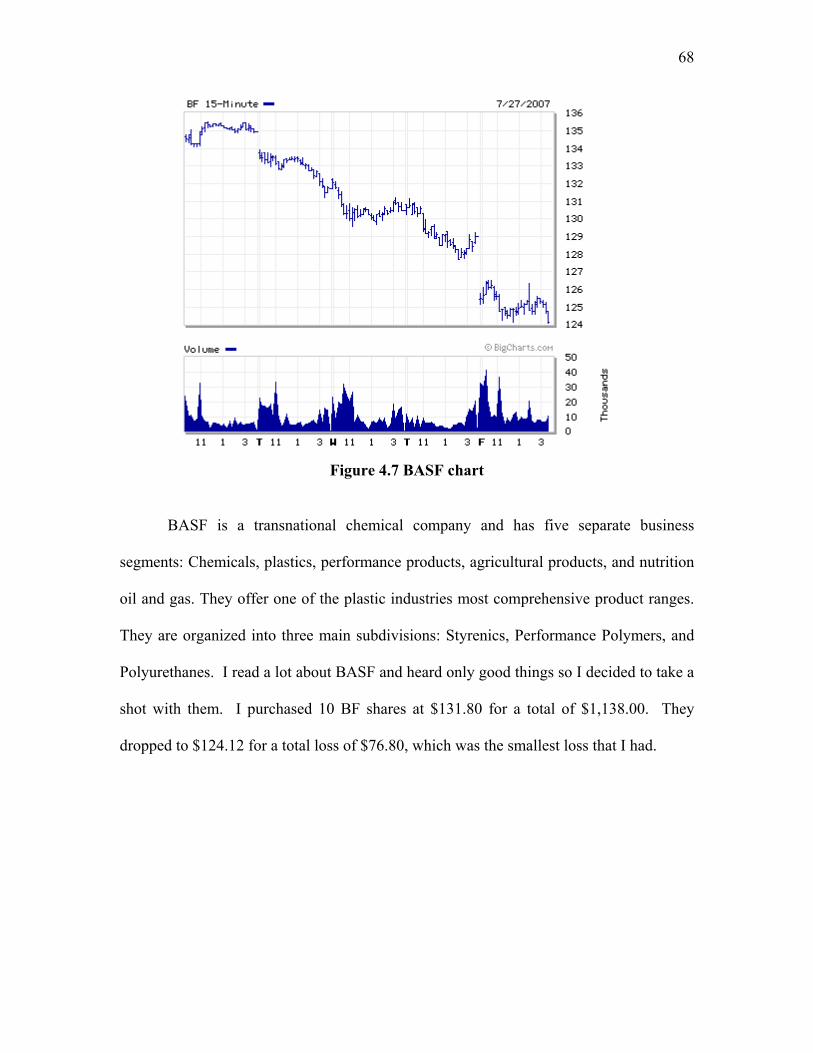
Figure 4.7 BASF chart
BASF is a transnational chemical company and has five separate business
segments: Chemicals, plastics, performance products, agricultural products, and nutrition
oil and gas. They offer one of the plastic industries most comprehensive product ranges.
They are organized into three main subdivisions: Styrenics, Performance Polymers, and
Polyurethanes. I read a lot about BASF and heard only good things so I decided to take a
shot with them. I purchased 10 BF shares at $131.80 for a total of $1,138.00. They
dropped to $124.12 for a total loss of $76.80, which was the smallest loss that I had.

69
Date Sym buy/ sell Price Shares
Net Cost/ Proceeds
Profit/ Loss
Total Cash
Total Asset
7/10/07 UBS Buy 54.4 200 10,880.00 0 $10,880.00 $192,887.00
7/10/07 HMC Buy 35.65 200 7,130.00 0 $7,130.00 $192,887.00
7/10/07 ERIC Buy 37.23 420 15,636.60 0 $15,636.60 $192,887.00
7/10/07 WPO Buy 790 200 158,000.00 0 $158,000.00 $192,887.00
7/10/07 BF Buy 124.12 10 1,241.20 0 $1,241.20 $192,887.00
8/07/07 ERIC Sell 37.97 420 15,836.95 311.35 $15,947.95 $193,198.35
8/07/07 BF Sell 132.86 10 1,335.35 87.35 $1,328.55 $193,285.70
8/08/07 UBS Sell 57.59 200 11,528.65 637.95 $11,517.95 $193,923.65
8/08/07 HMC Sell 35.08 200 7,002.65 -114.05 $7,015.95 $193,809.60
8/08/07 WPO Sell 801.84 200 160,471.55 2367.95 $160,367.95 $196,177.55
Table 4.9 The Second Simulation
As I had hoped, the companies came back this week and last week was just a bad
week. Most of the companies came back strong so I figured I would sell right away
before I lost more money, which was a strategy that Peter Lynch constantly talks about. I
started out with $192,887.00, and after I sold my shares this week I actually made a
profit. My final assets turned out to be $196,177.55, which left me with a total profit of
$3,290.55. While doing this different style of trading, I figured out that there are easier
ways to make money faster, but it requires more time and effort. I constantly was
watching to see if the companies were rising or falling, and I was constantly doing
research on the companies. This ended up being very interesting because there is so
much going on all the time. It was hard to stay on top of everything, but you learn a lot
very quickly. I learned that if you have the money, you can go for the larger companies
like WPO, and you will lose money or gain money very quickly. I ended up making a
total profit of $2367.95 on just WPO alone. It’s a risky investment, but it was fun to
research.
70
4.4 Conclusion
I started at $255,097.20 invested in these three companies, and overall I finished
with $274,315.68 for a total profit of $19,218.48. I was pleased with this overall profit
considering the fact that it was my first time investing and I acquired a decent amount of
assets. The best company that I invested in was Tyco, which made a total of $14,898.30.
My strategy of investing in the blue-chip, dominant companies seemed to turn over a
pretty favorable amount of profit; however, based on this result I feel that when trading
with this style, one must invest over a longer period of time. These companies do rise
over time, but Peter Lynch was right when he said that these companies rise slowly.
Also, the investor has to sit through the losses and wait for the overall profit, because
these companies do fluctuate a lot. This makes it difficult to trade for a short time with
these companies, and the investor must make sure that the profits will be larger than the
losses. Given the time period, I feel that I made a decent profit off these companies and
that it was a relatively smart strategy. Overall, it seems like this would be a safe
investing strategy for a long term investor.
71
5. Levi Wade’s Simulation
5.1 Introduction
While it is obvious that certain investment strategies fare better in the open
market than others, this 10-week simulation will pit strategy against itself. It seems
almost intuitive that methods of investing, by numbers alone, would vary with company
size. To put a test to this theory; companies have been chosen in two totally different
markets. Two companies from the communications sector and two from transportation
have been picked for market similarity and difference in size. The idea is that the
investment scheme will favor the larger companies. The investment strategy is as follows.
Each week market indexes will be reviewed. Buy/Sell days will be Monday, Wednesday
and Friday. If the market shows an upward trend, the stocks in that market will be
bought. However, the moment a market shows signs of a decline with a downward trend,
the stocks in that market will be sold. With the larger companies having a greater effect
on market because of their size the larger company should fare better.
Markets will be benchmarked by specific indexes. Over the next 10-weeks
analysis of the S&P 500 and the Dow Jones Transportation average will control
investment. The S&P has been chosen due to its average of highly technology based
stocks. Cellular phone companies are popular in this index and it reflects their general
status well. The Dow Jones Transportation average is just that. It reflects the
transportation industry. As air carriers are a major part of the transportation business it
will also reflect their market well. The initial investments have been chosen relative to
the size of the company. As a more sizable investment is needed proportionally, it has
been broken down as follows:
72
5.2 Company Selection Company Initial Investment Sprint Nextel Corp. (S) $93,750.00 AllTel Corp. (AT) $31,250.00
Southwest Airline Co. (LUV) $93,750.00 Alaska Air Group, Inc. (ALK) $31,750.00
Total Money Invested $250,000.00
The two companies were selected with a specific purpose. Both Sprint and
Southwest are large companies within their market. Comparatively Alltel and Alaska Air
Group are relatively small companies within their markets. Both Sprint and Alltel are
listed in the S&P 500 Index while Southwest and Alaska Air Group are listed in the Dow
Jones Transportation Index. This way, the markets can be charted and trades can be made
accordingly.
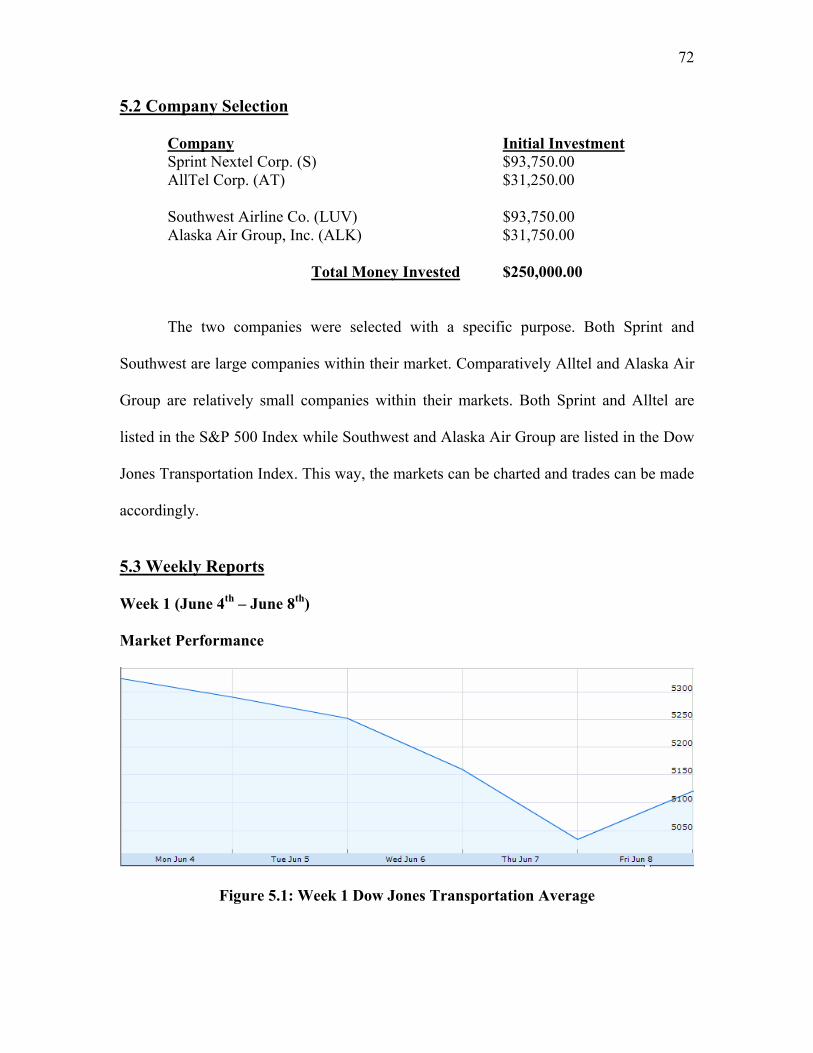
5.3 Weekly Reports Week 1 (June 4th – June 8th) Market Performance
Figure 5.1: Week 1 Dow Jones Transportation Average

73
This week was a little different as far as trades went. Being as money was to be
invested on June 4th money was instantly lost. If the trading method was followed from
the beginning, stocks would not have been purchased until June 8th. So, transportation
stocks were purchased on June 4th. When Wednesday came the market had shown a
continuing downturn and they were sold. Friday the 8th showed market growth and stocks
were again purchased.
Figure 5.2: Week 1 S&P 500 Index
Trades began in the communications sector this week on Monday, June 4th.
Almost instantly the market showed signs of decline and the money was taken out of
investments that following Wednesday, June 6th. When Friday came, the market was
showing an upward trend and communications stocks were repurchased.
74
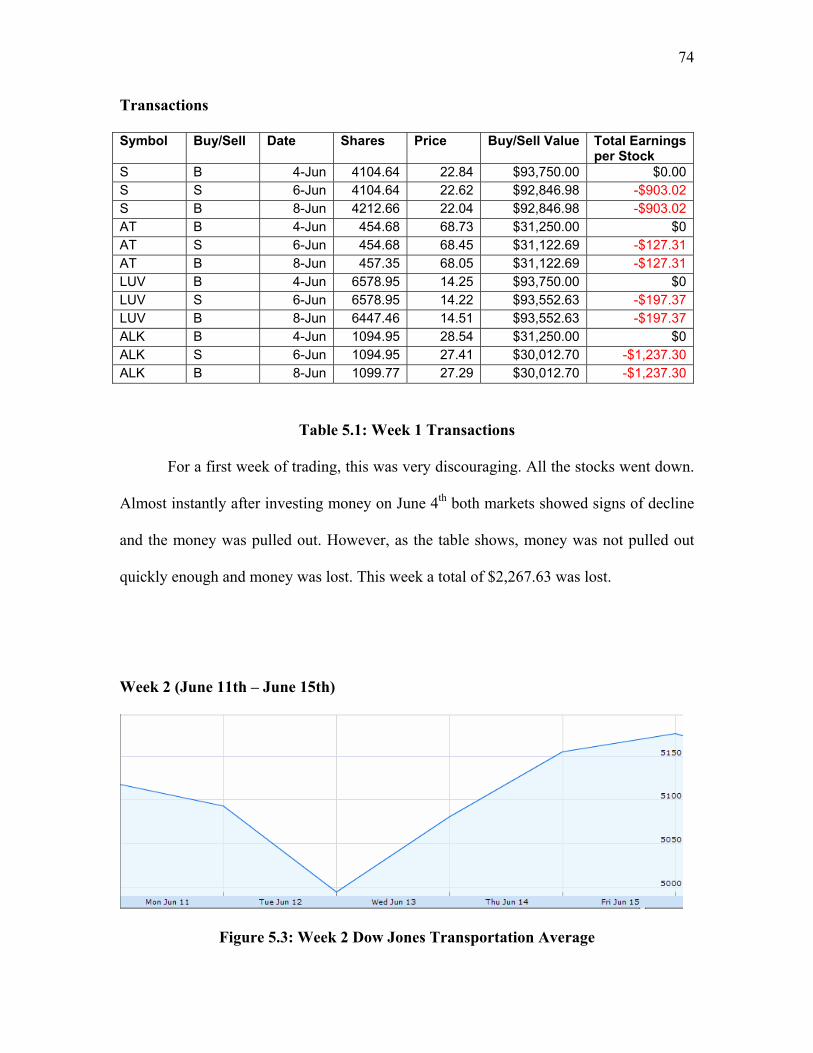
Transactions Symbol Buy/Sell Date Shares Price Buy/Sell Value Total Earnings
per Stock S B 4-Jun 4104.64 22.84 $93,750.00 $0.00S S 6-Jun 4104.64 22.62 $92,846.98 -$903.02S B 8-Jun 4212.66 22.04 $92,846.98 -$903.02AT B 4-Jun 454.68 68.73 $31,250.00 $0AT S 6-Jun 454.68 68.45 $31,122.69 -$127.31AT B 8-Jun 457.35 68.05 $31,122.69 -$127.31LUV B 4-Jun 6578.95 14.25 $93,750.00 $0LUV S 6-Jun 6578.95 14.22 $93,552.63 -$197.37LUV B 8-Jun 6447.46 14.51 $93,552.63 -$197.37ALK B 4-Jun 1094.95 28.54 $31,250.00 $0ALK S 6-Jun 1094.95 27.41 $30,012.70 -$1,237.30ALK B 8-Jun 1099.77 27.29 $30,012.70 -$1,237.30
Table 5.1: Week 1 Transactions
For a first week of trading, this was very discouraging. All the stocks went down.
Almost instantly after investing money on June 4th both markets showed signs of decline
and the money was pulled out. However, as the table shows, money was not pulled out
quickly enough and money was lost. This week a total of $2,267.63 was lost.
Week 2 (June 11th – June 15th)
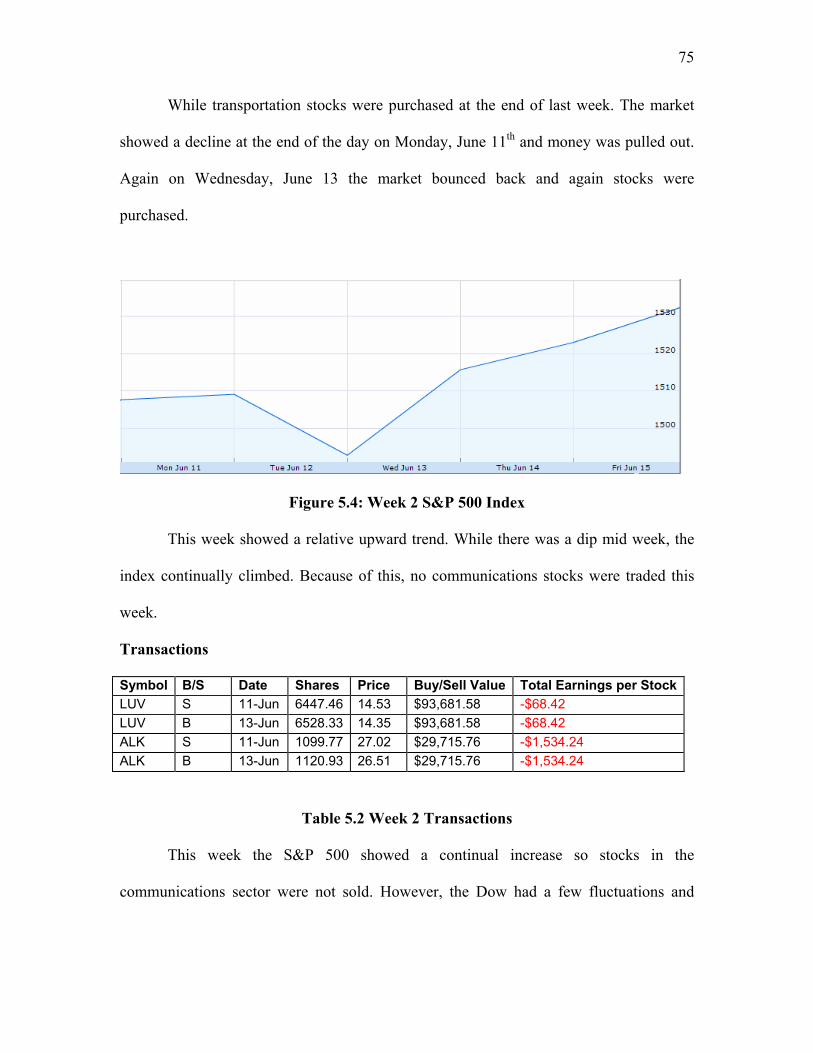
Figure 5.3: Week 2 Dow Jones Transportation Average
75
While transportation stocks were purchased at the end of last week. The market
showed a decline at the end of the day on Monday, June 11th and money was pulled out.
Again on Wednesday, June 13 the market bounced back and again stocks were
purchased.
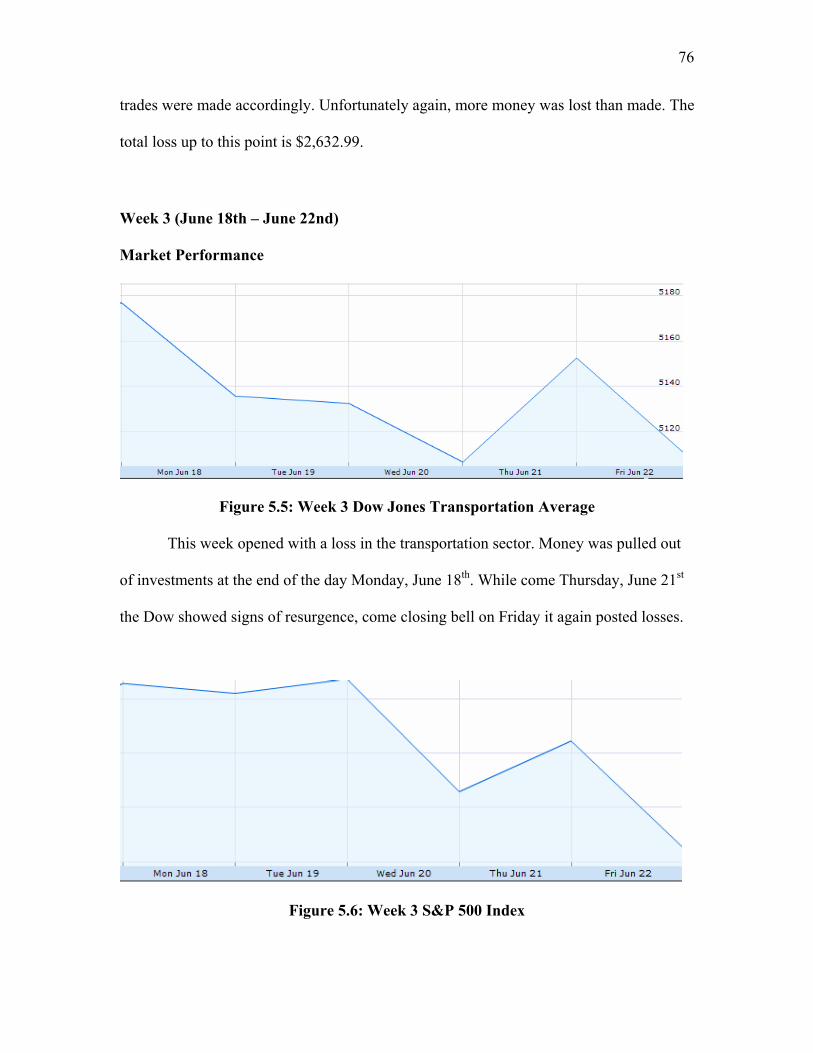
Figure 5.4: Week 2 S&P 500 Index
This week showed a relative upward trend. While there was a dip mid week, the
index continually climbed. Because of this, no communications stocks were traded this
week.
Transactions Symbol B/S Date Shares Price Buy/Sell Value Total Earnings per StockLUV S 11-Jun 6447.46 14.53 $93,681.58 -$68.42 LUV B 13-Jun 6528.33 14.35 $93,681.58 -$68.42 ALK S 11-Jun 1099.77 27.02 $29,715.76 -$1,534.24 ALK B 13-Jun 1120.93 26.51 $29,715.76 -$1,534.24
Table 5.2 Week 2 Transactions
This week the S&P 500 showed a continual increase so stocks in the
communications sector were not sold. However, the Dow had a few fluctuations and
76
trades were made accordingly. Unfortunately again, more money was lost than made. The
total loss up to this point is $2,632.99.
Week 3 (June 18th – June 22nd) Market Performance
Figure 5.5: Week 3 Dow Jones Transportation Average
This week opened with a loss in the transportation sector. Money was pulled out
of investments at the end of the day Monday, June 18th. While come Thursday, June 21st
the Dow showed signs of resurgence, come closing bell on Friday it again posted losses.
Figure 5.6: Week 3 S&P 500 Index
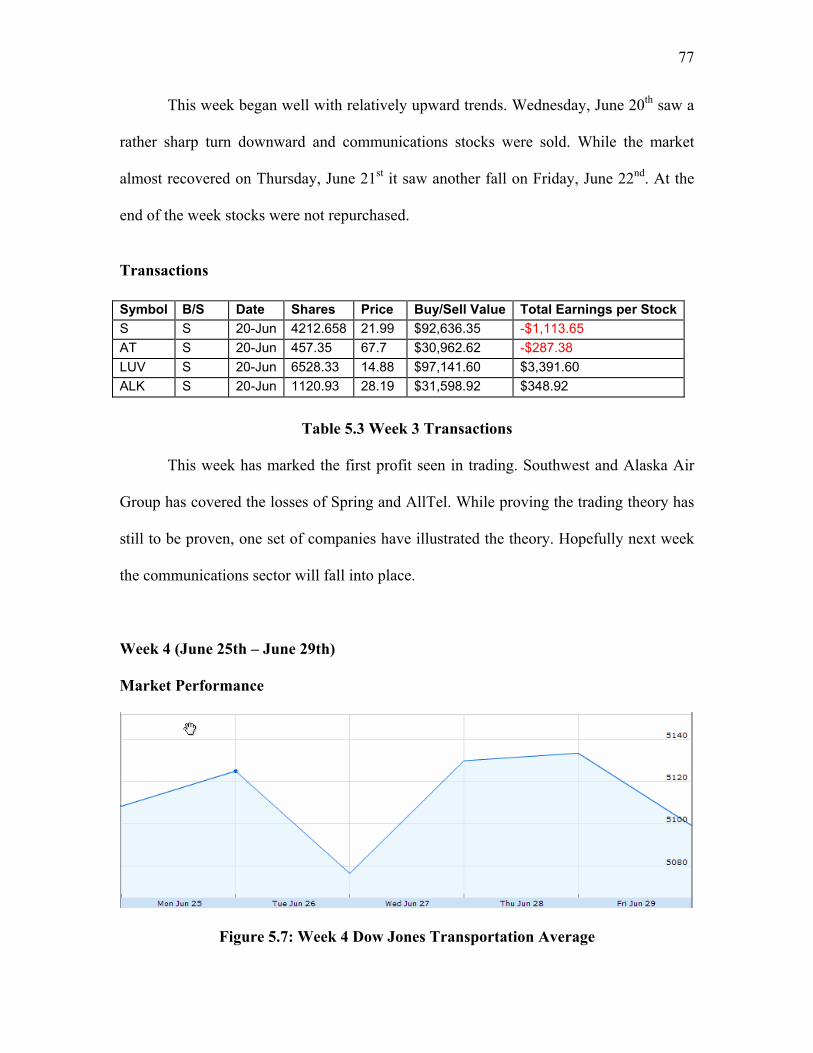
77
This week began well with relatively upward trends. Wednesday, June 20th saw a
rather sharp turn downward and communications stocks were sold. While the market
almost recovered on Thursday, June 21st it saw another fall on Friday, June 22nd. At the
end of the week stocks were not repurchased.
Transactions Symbol B/S Date Shares Price Buy/Sell Value Total Earnings per StockS S 20-Jun 4212.658 21.99 $92,636.35 -$1,113.65 AT S 20-Jun 457.35 67.7 $30,962.62 -$287.38 LUV S 20-Jun 6528.33 14.88 $97,141.60 $3,391.60 ALK S 20-Jun 1120.93 28.19 $31,598.92 $348.92
Table 5.3 Week 3 Transactions
This week has marked the first profit seen in trading. Southwest and Alaska Air
Group has covered the losses of Spring and AllTel. While proving the trading theory has
still to be proven, one set of companies have illustrated the theory. Hopefully next week
the communications sector will fall into place.
Week 4 (June 25th – June 29th) Market Performance
Figure 5.7: Week 4 Dow Jones Transportation Average
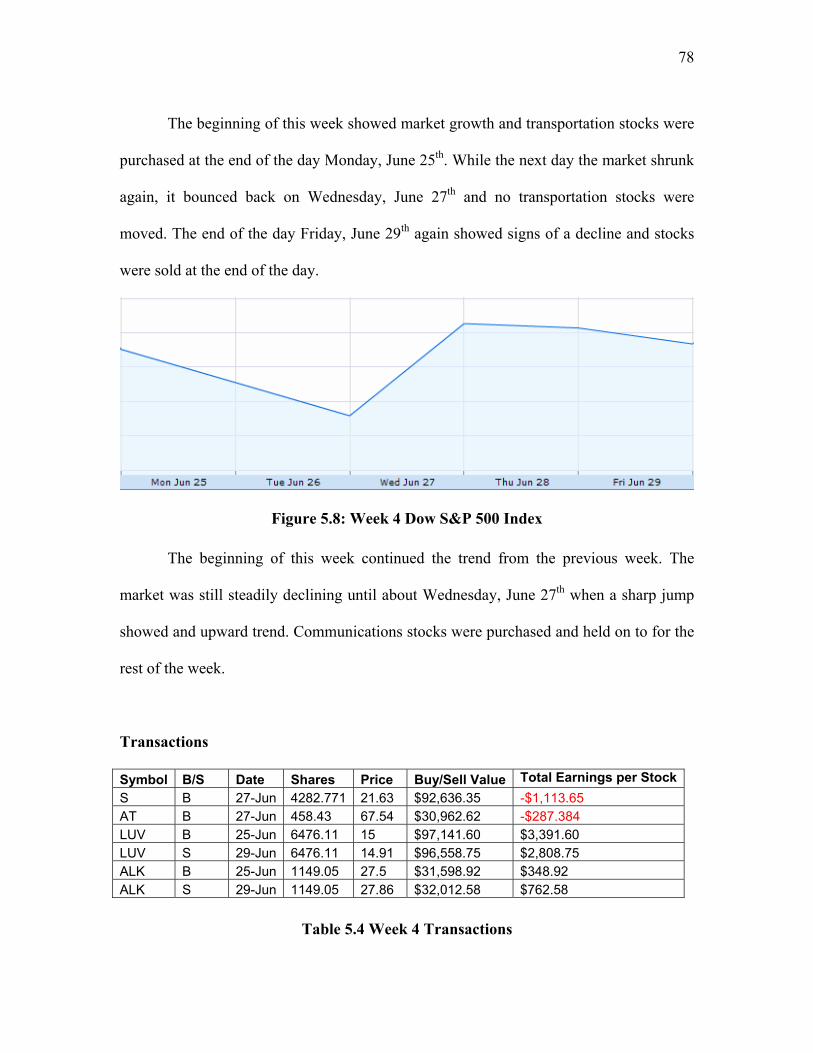
78
The beginning of this week showed market growth and transportation stocks were
purchased at the end of the day Monday, June 25th. While the next day the market shrunk
again, it bounced back on Wednesday, June 27th and no transportation stocks were
moved. The end of the day Friday, June 29th again showed signs of a decline and stocks
were sold at the end of the day.
Figure 5.8: Week 4 Dow S&P 500 Index The beginning of this week continued the trend from the previous week. The
market was still steadily declining until about Wednesday, June 27th when a sharp jump
showed and upward trend. Communications stocks were purchased and held on to for the
rest of the week.
Transactions
Symbol B/S Date Shares Price Buy/Sell Value Total Earnings per StockS B 27-Jun 4282.771 21.63 $92,636.35 -$1,113.65 AT B 27-Jun 458.43 67.54 $30,962.62 -$287.384 LUV B 25-Jun 6476.11 15 $97,141.60 $3,391.60 LUV S 29-Jun 6476.11 14.91 $96,558.75 $2,808.75 ALK B 25-Jun 1149.05 27.5 $31,598.92 $348.92 ALK S 29-Jun 1149.05 27.86 $32,012.58 $762.58
Table 5.4 Week 4 Transactions
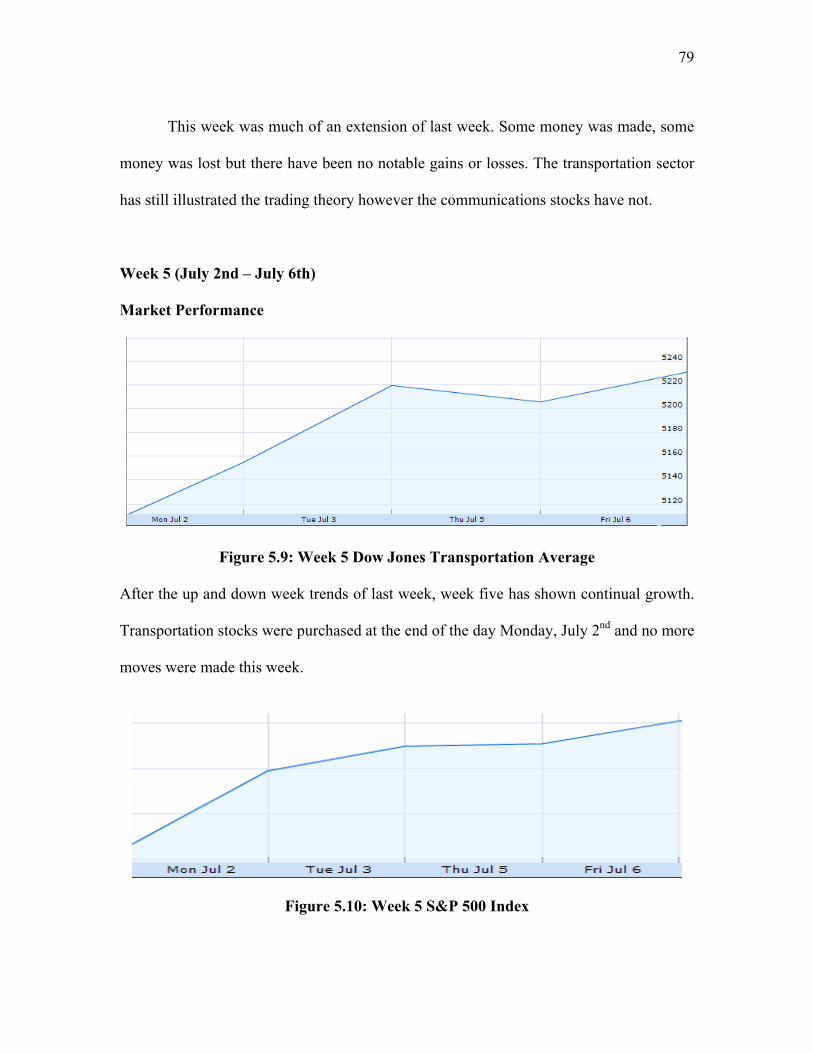
79
This week was much of an extension of last week. Some money was made, some
money was lost but there have been no notable gains or losses. The transportation sector
has still illustrated the trading theory however the communications stocks have not.
Week 5 (July 2nd – July 6th) Market Performance
Figure 5.9: Week 5 Dow Jones Transportation Average After the up and down week trends of last week, week five has shown continual growth.
Transportation stocks were purchased at the end of the day Monday, July 2nd and no more
moves were made this week.
Figure 5.10: Week 5 S&P 500 Index
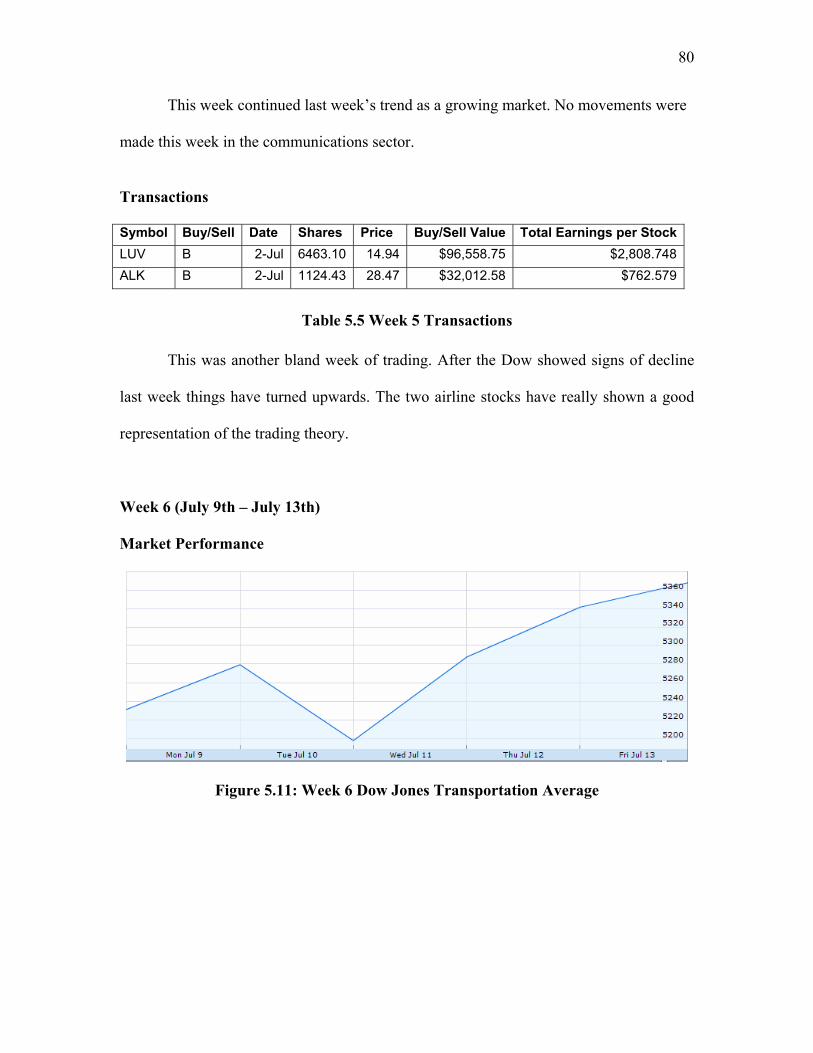
80
This week continued last week’s trend as a growing market. No movements were
made this week in the communications sector.
Transactions Symbol Buy/Sell Date Shares Price Buy/Sell Value Total Earnings per StockLUV B 2-Jul 6463.10 14.94 $96,558.75 $2,808.748ALK B 2-Jul 1124.43 28.47 $32,012.58 $762.579
Table 5.5 Week 5 Transactions
This was another bland week of trading. After the Dow showed signs of decline
last week things have turned upwards. The two airline stocks have really shown a good
representation of the trading theory.
Week 6 (July 9th – July 13th) Market Performance
Figure 5.11: Week 6 Dow Jones Transportation Average
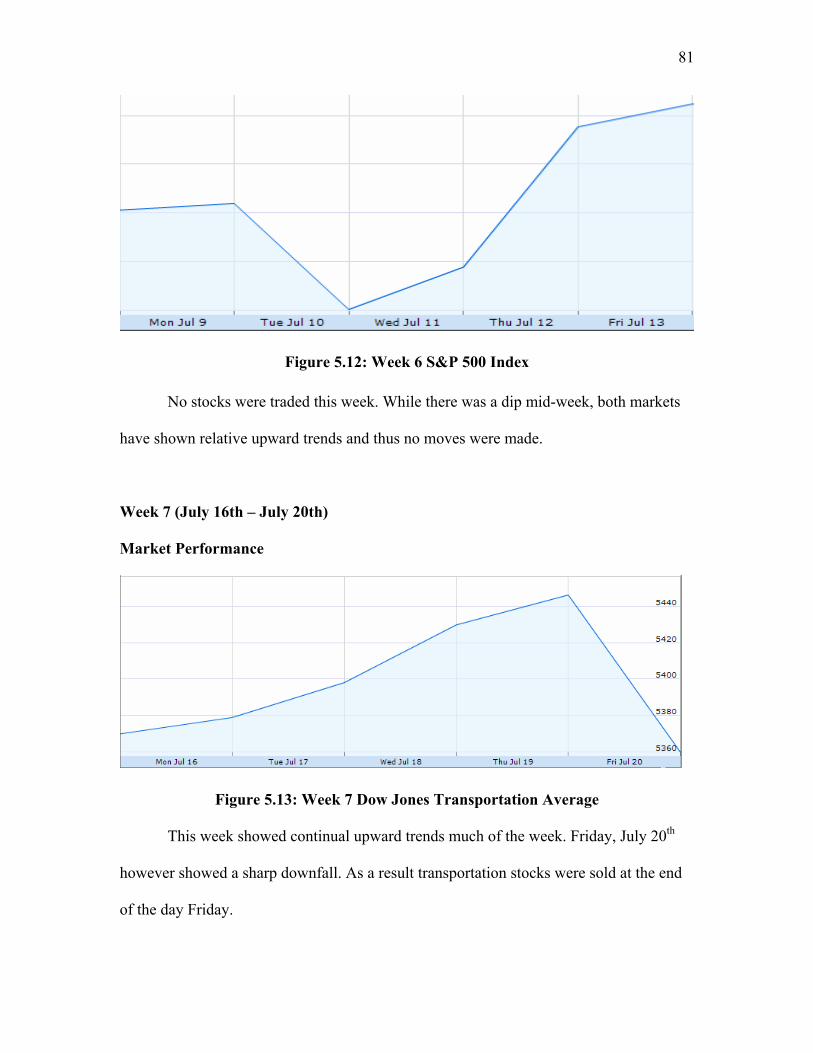
81
Figure 5.12: Week 6 S&P 500 Index No stocks were traded this week. While there was a dip mid-week, both markets
have shown relative upward trends and thus no moves were made.
Week 7 (July 16th – July 20th) Market Performance
Figure 5.13: Week 7 Dow Jones Transportation Average This week showed continual upward trends much of the week. Friday, July 20th
however showed a sharp downfall. As a result transportation stocks were sold at the end
of the day Friday.
82
Figure 5.14: Week 7 S&P 500 Index
After last week the market showed signs of decline and stocks were sold on
Monday, July 16th. No real change occurred throughout the week and thus no more
moves were made.
Transactions Symbol Buy/Sell Date Shares Price Buy/Sell Value Total Earnings per StockS S 16-Jul 4282.771 22.37 $95,805.60 $2,055.60AT S 16-Jul 458.43 67.85 $31,104.73 -$145.27LUV S 20-Jul 6463.10 16.35 $105,671.72 $11,921.72ALK S 20-Jul 1124.43 27.73 $31,180.50 -$69.50
Table 5.6 Week 7 Transactions
Finally the investments have shown some rather solid proof of the investment
theory. The larger companies have made money considerable amounts of money while
the small companies have made considerably less.
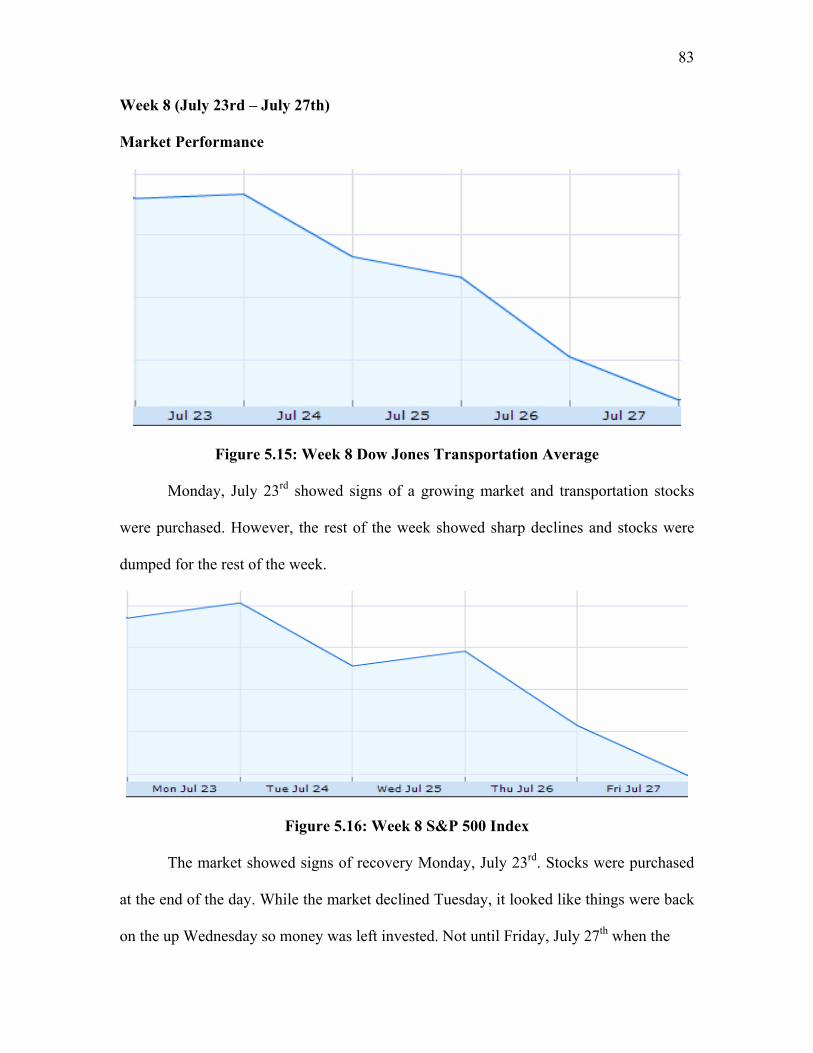
83
Week 8 (July 23rd – July 27th) Market Performance
Figure 5.15: Week 8 Dow Jones Transportation Average
Monday, July 23rd showed signs of a growing market and transportation stocks
were purchased. However, the rest of the week showed sharp declines and stocks were
dumped for the rest of the week.
Figure 5.16: Week 8 S&P 500 Index The market showed signs of recovery Monday, July 23rd. Stocks were purchased
at the end of the day. While the market declined Tuesday, it looked like things were back
on the up Wednesday so money was left invested. Not until Friday, July 27th when the
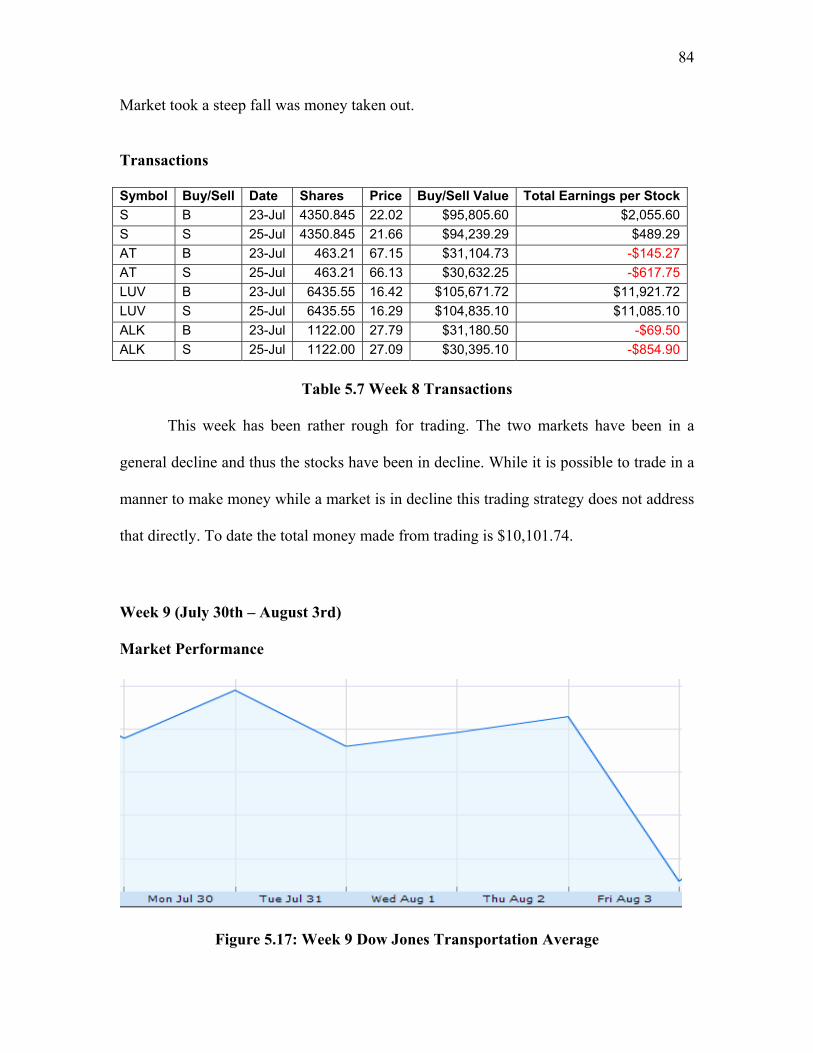
84
Market took a steep fall was money taken out.
Transactions Symbol Buy/Sell Date Shares Price Buy/Sell Value Total Earnings per StockS B 23-Jul 4350.845 22.02 $95,805.60 $2,055.60S S 25-Jul 4350.845 21.66 $94,239.29 $489.29AT B 23-Jul 463.21 67.15 $31,104.73 -$145.27AT S 25-Jul 463.21 66.13 $30,632.25 -$617.75LUV B 23-Jul 6435.55 16.42 $105,671.72 $11,921.72LUV S 25-Jul 6435.55 16.29 $104,835.10 $11,085.10ALK B 23-Jul 1122.00 27.79 $31,180.50 -$69.50ALK S 25-Jul 1122.00 27.09 $30,395.10 -$854.90
Table 5.7 Week 8 Transactions This week has been rather rough for trading. The two markets have been in a
general decline and thus the stocks have been in decline. While it is possible to trade in a
manner to make money while a market is in decline this trading strategy does not address
that directly. To date the total money made from trading is $10,101.74.
Week 9 (July 30th – August 3rd) Market Performance
Figure 5.17: Week 9 Dow Jones Transportation Average
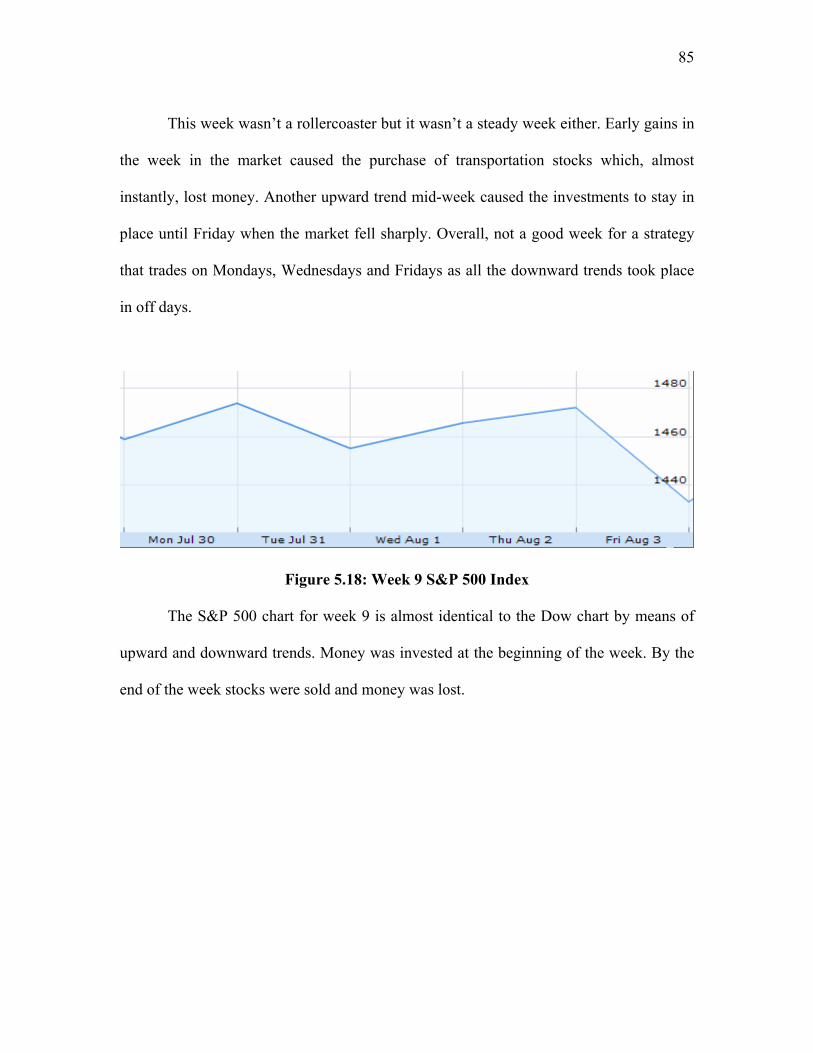
85
This week wasn’t a rollercoaster but it wasn’t a steady week either. Early gains in
the week in the market caused the purchase of transportation stocks which, almost
instantly, lost money. Another upward trend mid-week caused the investments to stay in
place until Friday when the market fell sharply. Overall, not a good week for a strategy
that trades on Mondays, Wednesdays and Fridays as all the downward trends took place
in off days.
Figure 5.18: Week 9 S&P 500 Index
The S&P 500 chart for week 9 is almost identical to the Dow chart by means of
upward and downward trends. Money was invested at the beginning of the week. By the
end of the week stocks were sold and money was lost.
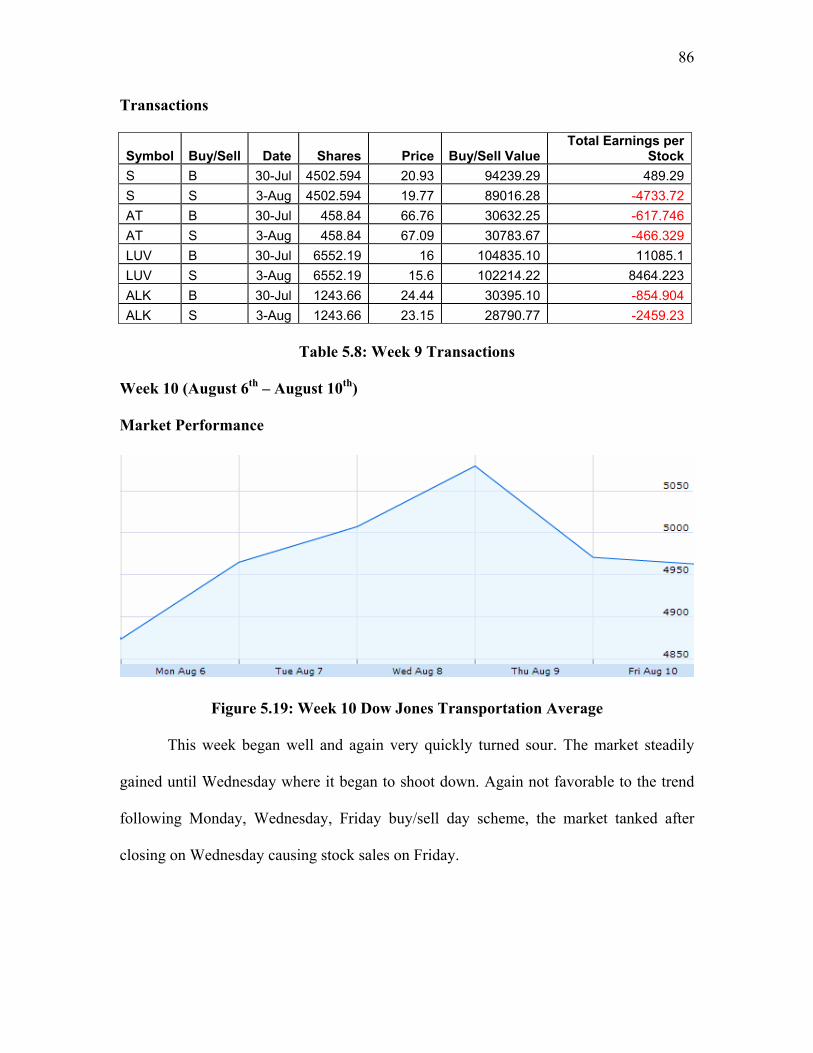
86
Transactions
Symbol Buy/Sell Date Shares Price Buy/Sell ValueTotal Earnings per
StockS B 30-Jul 4502.594 20.93 94239.29 489.29S S 3-Aug 4502.594 19.77 89016.28 -4733.72AT B 30-Jul 458.84 66.76 30632.25 -617.746AT S 3-Aug 458.84 67.09 30783.67 -466.329LUV B 30-Jul 6552.19 16 104835.10 11085.1LUV S 3-Aug 6552.19 15.6 102214.22 8464.223ALK B 30-Jul 1243.66 24.44 30395.10 -854.904ALK S 3-Aug 1243.66 23.15 28790.77 -2459.23
Table 5.8: Week 9 Transactions
Week 10 (August 6th – August 10th) Market Performance
Figure 5.19: Week 10 Dow Jones Transportation Average
This week began well and again very quickly turned sour. The market steadily
gained until Wednesday where it began to shoot down. Again not favorable to the trend
following Monday, Wednesday, Friday buy/sell day scheme, the market tanked after
closing on Wednesday causing stock sales on Friday.
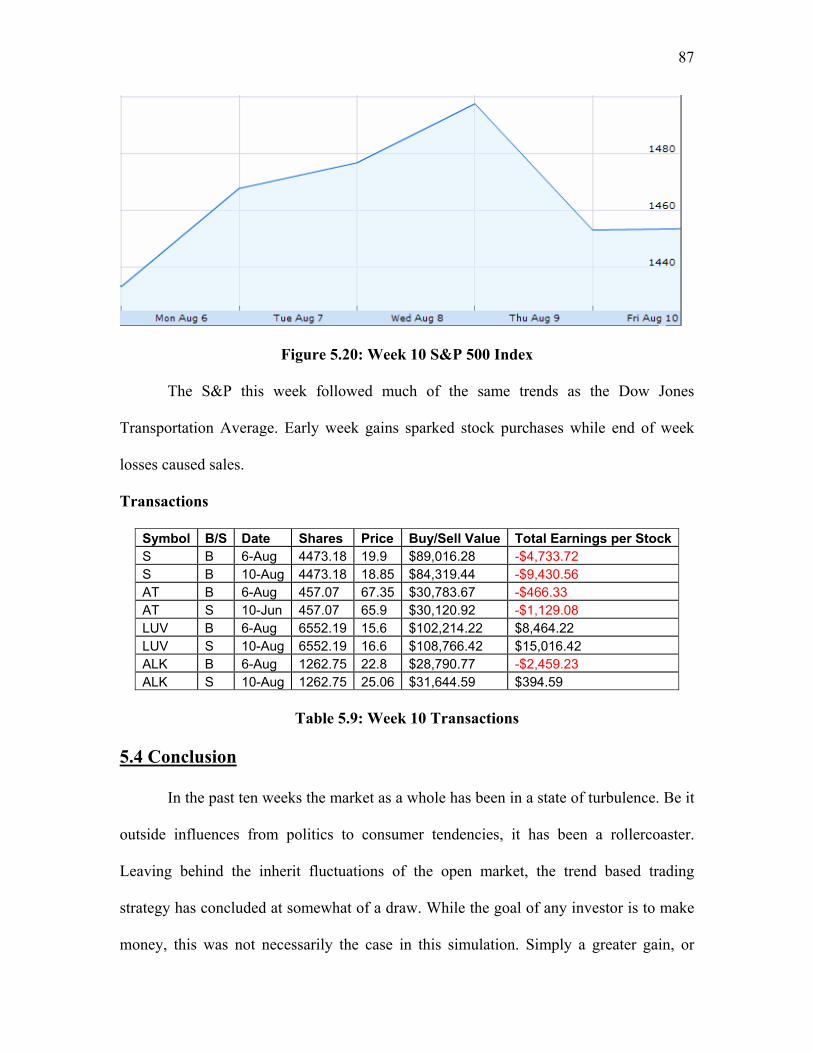
87
Figure 5.20: Week 10 S&P 500 Index The S&P this week followed much of the same trends as the Dow Jones
Transportation Average. Early week gains sparked stock purchases while end of week
losses caused sales.
Transactions
Symbol B/S Date Shares Price Buy/Sell Value Total Earnings per StockS B 6-Aug 4473.18 19.9 $89,016.28 -$4,733.72 S B 10-Aug 4473.18 18.85 $84,319.44 -$9,430.56 AT B 6-Aug 457.07 67.35 $30,783.67 -$466.33 AT S 10-Jun 457.07 65.9 $30,120.92 -$1,129.08 LUV B 6-Aug 6552.19 15.6 $102,214.22 $8,464.22 LUV S 10-Aug 6552.19 16.6 $108,766.42 $15,016.42 ALK B 6-Aug 1262.75 22.8 $28,790.77 -$2,459.23 ALK S 10-Aug 1262.75 25.06 $31,644.59 $394.59
Table 5.9: Week 10 Transactions
5.4 Conclusion
In the past ten weeks the market as a whole has been in a state of turbulence. Be it
outside influences from politics to consumer tendencies, it has been a rollercoaster.
Leaving behind the inherit fluctuations of the open market, the trend based trading
strategy has concluded at somewhat of a draw. While the goal of any investor is to make
money, this was not necessarily the case in this simulation. Simply a greater gain, or

88
similarly as lesser loss, was needed to be maintained by the larger company for a success.
However, the results are not that clear.
In the beginning it seemed is if the method was playing out as it should. Sprint
and Southwest were both making money while Alltel and Alaska Air group were either
making less or none at all. When the project came to a close in week ten however, this
was not the case. While Southwest blew Alaska Air Group out of the water in the final
week, Sprint lost an astounding nine-thousand dollars while Alltel only lost about five-
hundred. These losses can be chalked up to many factors. This unhappy investor is going
to place the blame with the competing introduction of AT&T’s iPhone.
Disregarding the final weeks for the telecommunications investments the simulation has
succeeded. While other factors may have influenced results it can be comfortably stated
that due to a larger market share, following market trends can produce greater profit
within the larger company.

89
6. Jan Thomas’ Simulation
6.1 Introduction Momentum Trading
For the next few weeks I decided to take a closer look into momentum trading in
order to successfully invest in the market. Using the momentum trading method needs
quite a great deal of knowing indicators. For me, being a novice on the market floor that
means I need a good amount of research before starting to invest. This research consists
of how to use the method plus the importance of the indicator. In addition one need to
find the right stocks that show the right patterns and characteristics needed to have a
profitable solution [8].
Momentum trading focuses on short term investment. The most important tools
with this method are the exponential moving average (EMA) which is a lagging indicator,
or trend follower, and the moving average convergence/divergence (MACD) histogram
also a lagging indicator but with leading elements. The EMA is an indicator for the
stock’s inertia. It consists of additions of averages over a certain period of time. Basically
it depicts the trend or inertia of the stock. The MACD includes the differences of moving
averages over a certain period of time this can also be seen as the momentum of the
stock, which make up for the leading elements [9]. The use of these two indicators seems
fairly simple, though when using this method one has to be very focused on the stocks
chosen to catch the right moment to buy or sell. The plan is to find a stock for which the
trends of both indicators fall in the same direction. An incline indicates a bullish
movement of the price, which means that more stocks are being bought. On the other
90
hand a decline shows a bearish movement, which means that more stocks are being sold
[9].
The goal I’m setting with this method is primarily to see if I am able to choose the
right stocks and the right moments of trading. Of course the main purpose is to gain a
profit from that solution.
6.2 Company Selection
Throughout my search for stocks I came across a few interesting companies. In
particular I am looking into companies from Europe. This is due to the fact that I am from
Germany and I would like to see how the market is doing. A few things to mention are
that I am looking for foreign companies that are represented on the NYSE (New York
Stock Exchange). I am also looking especially into technological companies, although I
will have a variety of different companies lined up to have a greater range of possible
investigations. For this matter I also picked a few communication or oil providers and a
bank. Here is an overview of the companies that I will be using throughout the
simulation.
Companies Symbol Market Deutsche Telekom DT NYSE Vodafone VOD NYSE Sprint Nextel Cp S NYSE Nokia NOK NYSE LG Philips LCD Ldt LPL NYSE Siemens SI NYSE Philips PHG NYSE DaimlerChrysler DCX NYSE British Patrol BP NYSE Deutsche Bank DB NYSE
Table 6. 1 : Companies Selection

91
I might not use every one of the stocks above, I will select the once that fit the best with
using the momentum trading method. However as far as it looks, I will be starting
tomorrow with investing into Siemens, Philips and DaimlerChrysler, though these
companies showed a useful pattern in their trend over the past week. Siemens and Philips
are two of the leading electrical companies worldwide. They both are big in development
in manufacturing, design and installation in electric equipment reaching from lights to
washing machines to x-ray tubes. Daimler Chrysler on the other hand is a leading
automobile company. It has a wide range of different brands like Mercedes Benz, Jeep,
Smart, Sterlin Trucks and more. I am personally interested in cars, which is a reason for
me to choose Chrysler. Another reason is because they have been involved in the
development in clean fuel cars, like hybrids. I will start my investing tomorrow splitting
up $250,000 among those three companies. I will choose the entering time when it seems
the best during the day. This also counts for the amount I will invest in each company.
6.3 Weekly Reports Week 1
This week has been the first week to start the simulation. I decided to use a
simulator on yahoo in order to track my transactions [7]. I started of with three companies
Siemens, Philips and Daimler Chrysler. In total I had 250,000 dollars and I started of with
investing the same amount for Siemens and Philips. I used $75,000 for each of them and
used the remaining $100,000 to invest in Daimler. With these amounts I was able to buy
1,769 shares ($42.40 per share) from Philips, 558 shares ($134.45 per share) from
Siemens and 1,094 shares ($91.35 per share) from Daimler. In the beginning of the week

92
the prices for my stocks went down pretty sharply, but leveled out a little bit. By
Thursday I decided to trade in my Daimler shares, because they made the greatest
damage. I decided to trade them for Vodafone shares. Vodafone is one of the biggest
communication providers in Europe. I sold my 1,094 Daimler shares for $86.00 per share
leaving me with $94,084.00. I had lost $6,000 on this transaction. I bought 2,993
Vodafone stocks for $31.43 per share. This came up to $94,069.99. After Wednesday I
found the prices for my stocks rising, so I decided to not take any more transactions. This
week was very interesting as the first week for me to work some stocks. I also saw that I
have to be even more careful with finding the right companies to invest in, and even more
to find the right time to invest.
Date Symbol buy/ sell Price Shares
Net Cost/ Proceeds
Profit/ Loss
Total Cash
Total Asset
4-Jun-07 SI Buy 134.45 558 75,023.10 0 34.4 250,000.00 4-Jun-07 PHG Buy 42.4 1,769 75,005.60 0 34.4 250,000.00 4-Jun-07 DCX Buy 91.35 1,094 99,936.90 0 34.4 250,000.00 7-Jun-07 DCX Sell 86 1,094 94,084.00 -5,852.90 94,118.40 244,147.10 7-Jun-07 VOD Buy 31.43 2,993 94,069.99 0 48.41 244,147.10
Table 6.2: Week 1 Trading
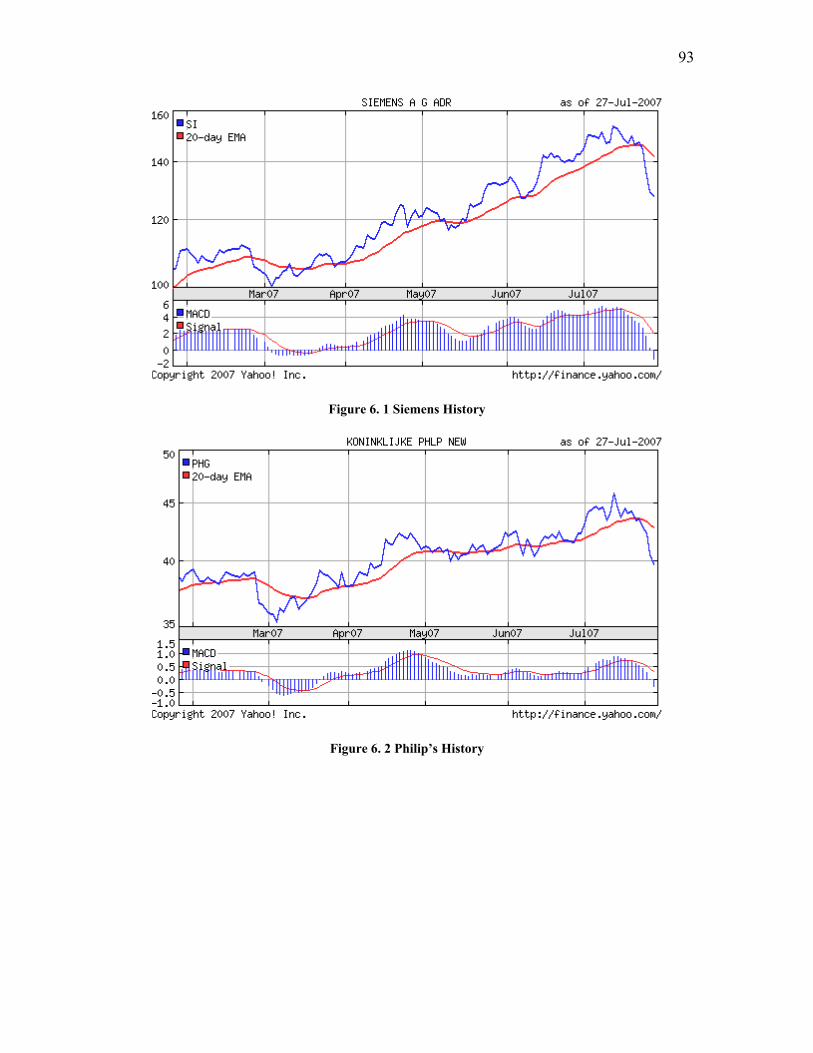
93
Figure 6. 1 Siemens History
Figure 6. 2 Philip’s History

94
Figure 6. 3 DaimlerChrysler History
Figure 6. 4 Vodafone History
Week 2 This week of trading was a bit more successful than the first. I was able to win
some of that money back that was lost during the first week. In the beginning of the week
I kept the companies I had to wait for the right moment to sell. It seemed that the stocks

95
were going to loose their momentum soon. On Wednesday I finally sold my 558 Siemens
shares making a loss of $1729.80 and 1796 Philips shares making a loss of $2883.47.
Even though I lost money I was still pleased to see the prices to go up before I sold. I
decided to invest right away. I decided to go for British Petroleum and LG Philips.
British Petroleum is a crude oil provider that is involved in transportation fuel, marketing
and refining. LG is an electronics company. Both companies seem to have a good
momentum so I bought 1075 BP shares for 68.13 dollars per share and 3094 LG shares
for 23.31 dollars per share. On Thursday I sold my BP stocks back, winning 795.50
dollars. I though that the Deutsche Bank showed a greater moment so I invested in it,
buying 495 shares for149.57 dollars per share.
I have a good feeling about this next week. The indicators look good in my favor.
Vodafone does not seem to have a lot more momentum, so I am probably going to sell
them early in the week. If I identify the EMA and the MACD correctly I will be buying
Nstar shares, since they look very promising of doing a good jump.
Date Symbol buy/ sell Price Shares
Net Cost/ Proceeds
Profit/ Loss
Total Cash
Total Asset
13-Jun-07 PHG Sell 40.77 1,769 72,122.13 -2,883.47 72,170.54 241,263.63 13-Jun-07 LPL Buy 23.31 3,094 72,121.14 0 49.4 241,263.63 13-Jun-07 SI Sell 131.35 558 73,293.30 -1,729.80 73,342.70 239,533.83 13-Jun-07 BP Buy 68.13 1,075 73,239.75 0 102.95 239,533.83 14-Jun-07 BP Sell 68.87 1,075 74,035.25 795.5 74,138.20 240,329.33 15-Jun-07 DB Buy 149.57 495 74,037.15 0 101.05 240,329.33
Table 6.3: Week 2 Trading
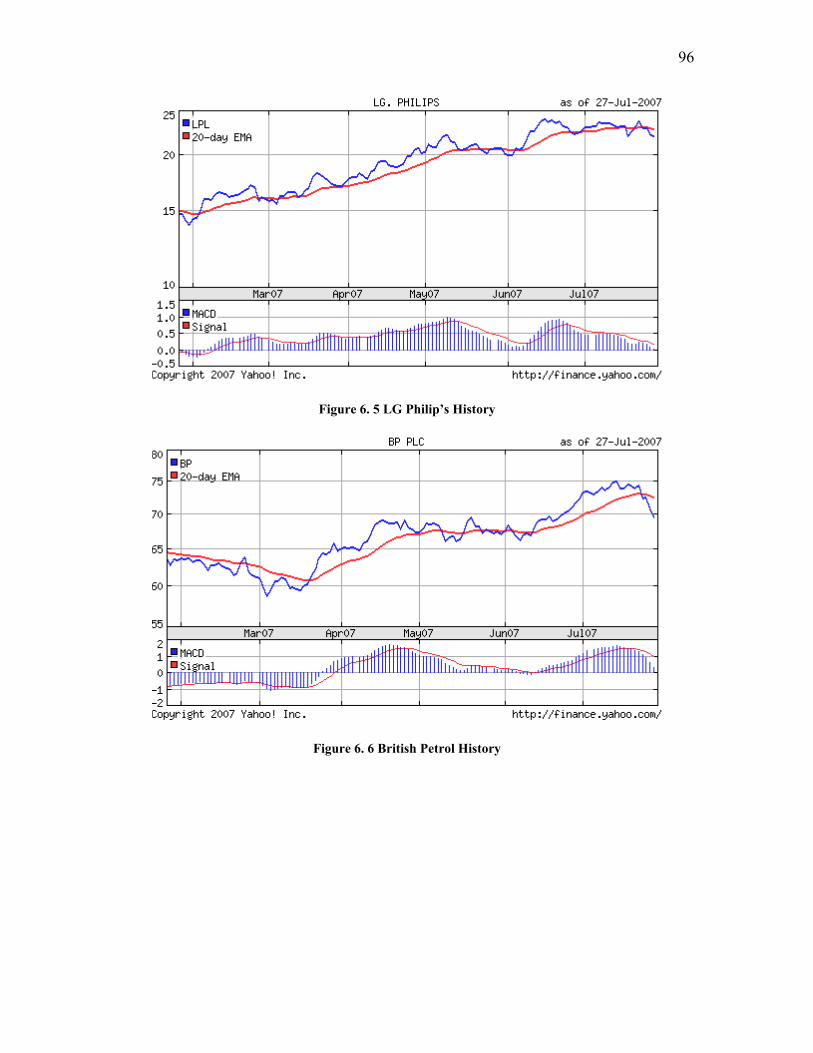
96
Figure 6. 5 LG Philip’s History
Figure 6. 6 British Petrol History
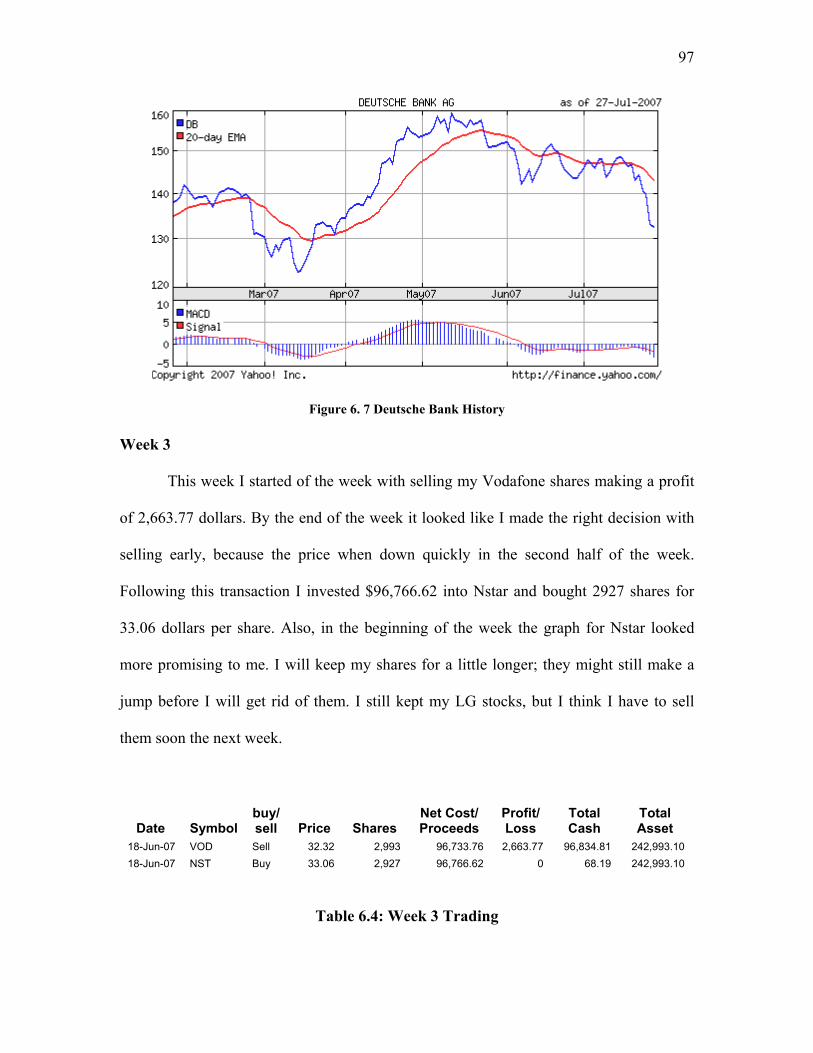
97
Figure 6. 7 Deutsche Bank History Week 3
This week I started of the week with selling my Vodafone shares making a profit
of 2,663.77 dollars. By the end of the week it looked like I made the right decision with
selling early, because the price when down quickly in the second half of the week.
Following this transaction I invested $96,766.62 into Nstar and bought 2927 shares for
33.06 dollars per share. Also, in the beginning of the week the graph for Nstar looked
more promising to me. I will keep my shares for a little longer; they might still make a
jump before I will get rid of them. I still kept my LG stocks, but I think I have to sell
them soon the next week.
Date Symbol buy/ sell Price Shares
Net Cost/ Proceeds
Profit/ Loss
Total Cash
Total Asset
18-Jun-07 VOD Sell 32.32 2,993 96,733.76 2,663.77 96,834.81 242,993.10 18-Jun-07 NST Buy 33.06 2,927 96,766.62 0 68.19 242,993.10
Table 6.4: Week 3 Trading
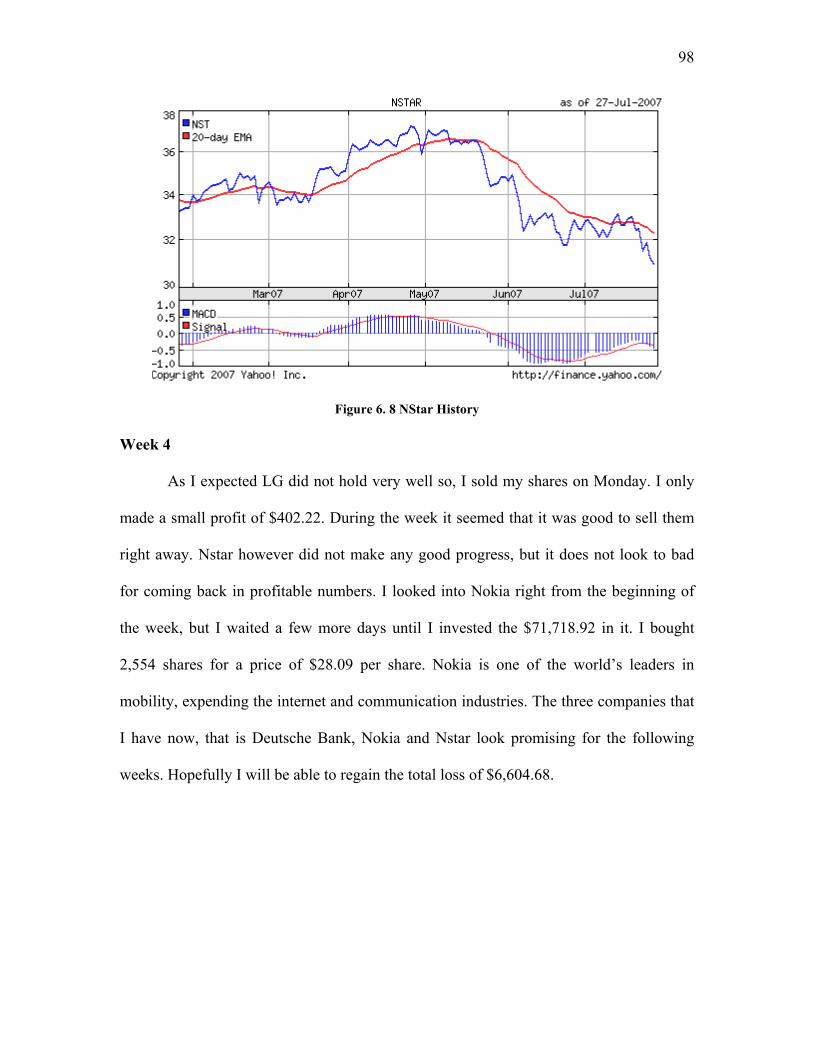
98
Figure 6. 8 NStar History Week 4
As I expected LG did not hold very well so, I sold my shares on Monday. I only
made a small profit of $402.22. During the week it seemed that it was good to sell them
right away. Nstar however did not make any good progress, but it does not look to bad
for coming back in profitable numbers. I looked into Nokia right from the beginning of
the week, but I waited a few more days until I invested the $71,718.92 in it. I bought
2,554 shares for a price of $28.09 per share. Nokia is one of the world’s leaders in
mobility, expending the internet and communication industries. The three companies that
I have now, that is Deutsche Bank, Nokia and Nstar look promising for the following
weeks. Hopefully I will be able to regain the total loss of $6,604.68.
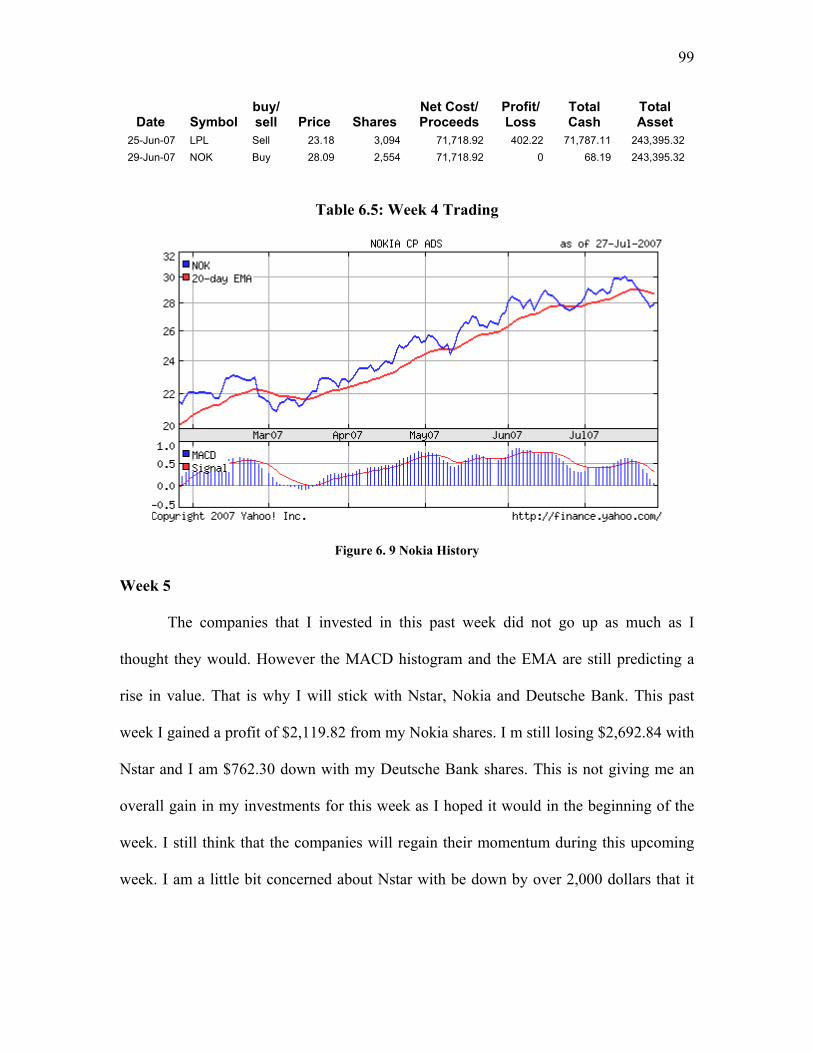
99
Date Symbol buy/ sell Price Shares
Net Cost/ Proceeds
Profit/ Loss
Total Cash
Total Asset
25-Jun-07 LPL Sell 23.18 3,094 71,718.92 402.22 71,787.11 243,395.32 29-Jun-07 NOK Buy 28.09 2,554 71,718.92 0 68.19 243,395.32
Table 6.5: Week 4 Trading
Figure 6. 9 Nokia History Week 5
The companies that I invested in this past week did not go up as much as I
thought they would. However the MACD histogram and the EMA are still predicting a
rise in value. That is why I will stick with Nstar, Nokia and Deutsche Bank. This past
week I gained a profit of $2,119.82 from my Nokia shares. I m still losing $2,692.84 with
Nstar and I am $762.30 down with my Deutsche Bank shares. This is not giving me an
overall gain in my investments for this week as I hoped it would in the beginning of the
week. I still think that the companies will regain their momentum during this upcoming
week. I am a little bit concerned about Nstar with be down by over 2,000 dollars that it
100
will rise as quickly as I would like at and being worth keeping. So I will have to make a
decision to keep it or not soon.
Week 6
This week was pretty much exactly what I expected from the values of my
holdings. Nstar, Nokia and Deutsche Bank all experienced a nice raise. Nstar is now
giving me a profit of $292.70 which is not a lot but compared to the loss I had with it in
the beginning of the week I am really happy about this outcome, also because it seems
that it still has some momentum left to even give me a higher gain in the beginning of this
following week. My Deutsche Bank shares had not a lot of movement this week. I still
have a loss of $569.25 which is just about 200 dollars less then from the week before. It
seems that DB is not experiencing the momentum I would like to have. I think I will sell
my DB shares early in the week and find another solution to keep up the increase. Nokia
kept looking very promising and raised my profit to $4,648.28. It still has some
momentum left. For the last few days I was thinking of taking all my money and look for
one stock that indicates a high momentum and put everything on it to get the most out of
that momentum.
Week 7
This last week I was unable to reach a total positive earning as I thought I could.
Nstar was looking like it would have a great upbeat. Last week it really helped me out to
101
keep my Nstar shares. In the beginning of this week it’s still had a good looking trend, so
I decided to invest all my money into this one company. On Monday I sold my 2,554
Nokia stocks for $29.88 per share giving me a solid profit of $4,594.60. I was really
happy with this outcome also because the value dropped after I sold it. The same day I
sold my Deutsche Bank stocks, 495 for $149.10 each leaving me with a small loss of
$232.65. My total asset at that point was $246,952.83. By the end of Monday I had
$246,863.82 of the total invested into in Nstar. This was a really bully move, but the
EMA and the MACD histogram both showed a parallel upward trend so I thought I
would take the risk and go for it. It did not start of good with Nstar and I was down by
about 4,000 dollars. I thought about putting all on another company, however decided
otherwise. The value of the stock rose in the middle of the week leaving me with about
plus minus zero. On Friday it took a big hit which I did not noticed quickly enough and I
ended up with loosing $2,924.30 before I sold my 7,492 shares. This week was a lot of up
and down but I wished it to be a little more up than down.
Date Symbol buy/ sell Price Shares
Net Cost/ Proceeds
Profit/ Loss
Total Cash
Total Asset
16-Jul-07 NOK Sell 29.88 2,554 76,313.52 4,594.60 76,381.71 247,185.48 16-Jul-07 DB Sell 149.1 495 73,804.50 -232.65 150,186.21 246,952.83 16-Jul-07 NST Buy 32.88 4,565 150,097.20 0 89.01 246,952.83 20-Jul-07 NST Sell 32.56 7,492 243,939.52 -2,924.30 244,028.53 244,028.53
Table 6.6: Final Trading

102
6.4 Conclusion and Analysis
The last two month I really got to understand how the stock market works, the
basics of trading and partially how to successfully invest with it, even though at the end I
lost money. But I think I got the theory down. It is really difficult to get into this kind of
work; at first one has to learn about the vocabulary that is used then graphs and
indicators. There is more to it than I thought; many different strategies that tell you when
to buy or sell and movements of graphs and histograms that indicate bullish or bearish
movements. At the end I think it comes to weather you feel comfortable with what you
doing or not. Momentum trading needs a lot of practice to efficiently be able to use this
method. Now I see how in the beginning of the simulation I was struggling with finding
the right time to enter a trade or exit one. From the trading summary I can see that I
improved in the duration of the simulation. I regained my losses, however with a risky
move in the last week lost about have of what I totally lost.
103
7. Analysis and Conclusion
After several weeks of investing, each individual gained a vast knowledge of the
stock market, the companies researched and certain strategies to turn over a profit. Some
trading strategies proved to be more profitable than others. This may have only been a
result of the time frame that the trades and investments took place, or it could have been a
general indication that certain strategies are in fact more successful than others. Since the
time frame was so short, and investors can be in the stock market for years, it is difficult
to assume which would be the be style of trading; however, based on our results, the style
that produced the most profit was that of the successful Mr. Ryan LaFalam. The long-
term trend following strategy proved most profitable. Investment in a company before
release of a new product resulted in a large increase in stock value, such as the
investment in Apple, Inc. prior to the release of their new iPhone. It is information like
this that makes the big profits; however, others did well in the simulation too.
The overall conclusion resulting from this simulation is that the stock exchange is
a completely unpredictable market. It can be very dangerous at times, yet very rewarding
as well. One day might be a huge loss, and then the next day the investor could make all
the money back and then turn over a profit. We all started from scratch not knowing
anything about the Market, and we made a decent profit. Although it seems that those
who research and know the stock market before they invest have the best luck with it,
even those who dedicate their careers to this potentially lucrative industry can wind up
bankrupt.
104
References
1. Lynch, Peter. One Up on Wall Street. Simon & Schuster Paperbacks. New York, NY, 2000. 2. July 15, 2007. http://vse.marketwatch.com/Game/Homepage.aspx. 3. Frush, Scott. Understanding Hedge Funds. McGraw-Hill. New York, NY. 2007. 4. Faerber, Esme. All About Stocks. McGraw-Hill. New York, NY. 2007. 5. Brown, David. All About Stock Market Strategies. McGraw-Hill. Chicago 2007. 6. www.finance.google.com 7. http://finance.yahoo.com/ 8. "Momentum." Investopedia. 2007. Forbe's Media Com. 29. May 2007 <http://www.investopedia.com/terms/m/momentum.asp>. 9. Van Bergen, Jason. "Momentum Trading with Discipline." Investopedia. 23. Sep. 2003. Forbe Media Company. 15 Jul 2007 <http://www.investopedia.com/articles/trading/03/092403.asp>. 10. www.wikipedia.org