Embed Size (px)
Citation preview

1
Stock Symbol: AEM (NYSE and TSX) For further information: Investor Relations
(416) 947-1212
(All amounts expressed in U.S. dollars unless otherwise noted)
AGNICO EAGLE REPORTS FIRST QUARTER 2018 RESULTS; NUNAVUT DEVELOPMENT PROJECTS PROGRESSING ON BUDGET AND ON SCHEDULE;
EXPLORATION DRILLING YIELDS FAVOURABLE RESULTS AT MULTIPLE PROJECTS
Toronto (April 26, 2018) – Agnico Eagle Mines Limited (NYSE:AEM, TSX:AEM) ("Agnico Eagle" or the "Company") today reported quarterly net income of $44.9 million, or $0.19 per share, for the first quarter of 2018. This result includes non-cash foreign currency translation gains on deferred tax liabilities of $6.7 million ($0.03 per share), mark-to-market adjustments and derivative gains on financial instruments of $0.5 million (nil per share) and non-cash foreign currency translation gains of $3.5 million ($0.01 per share). Excluding these items would result in adjusted net income1 of $34.2 million or $0.15 per share for the first quarter of 2018. In the first quarter of 2017, the Company reported net income of $76.0 million or $0.33 per share. Included in the first quarter of 2018 net income and not adjusted above is non-cash stock option expense of $7.8 million ($0.03 per share). In the first quarter of 2018, cash provided by operating activities decreased by 7% to $207.7 million ($180.5 million before changes in non-cash components of working capital), compared with cash provided by operating activities of $222.6 million in the first quarter of 2017 ($224.7 million before changes in non-cash components of working capital). The decrease in cash provided by operating activities before changes in non-cash components of working capital during the current period was mainly due to lower gold sales volumes and higher costs, partially offset by higher realized gold prices. The higher costs were primarily a result of the strengthening of local currencies against the U.S. dollar and higher costs at several operations, principally at Meadowbank. "Our operations continued to deliver strong cash flow in the first quarter with unit production costs on the lower end of full year guidance and gold production tracking slightly above full year guidance. We remain focused on optimizing unit costs and increasing production as
1Adjusted net income is a Non-GAAP measure. For a discussion regarding the Company's use of non-GAAP measures, please see "Note Regarding Certain Measures of Performance".

2
we transition through 2018 and begin to see the positive results of our growth phase in 2019", said Sean Boyd, Agnico Eagle's Chief Executive Officer. "During the first quarter, we continued to make very good progress at our Nunavut growth projects, with Amaruq permitting activities advancing as expected and development of the underground exploration ramp proceeding as planned. Construction activities and underground development remain on schedule and on budget at Meliadine", added Mr. Boyd. First quarter 2018 highlights include:
• Solid operational performance – Payable gold production2 in the first quarter of 2018 was 389,278 ounces at production costs per ounce of $759, total cash costs3 per ounce of $648 and all-in sustaining costs per ounce4 ("AISC") of $889
• Production and cost guidance reiterated for 2018 – Full year production
guidance is unchanged at 1.53 million ounces of gold at total cash costs per ounce of $625 to $675 and AISC of $890 to $940 per ounce
• Nunavut development projects progressing on schedule and on budget –
Amaruq permitting is on track for approval in the second quarter of 2018 and the underground exploration ramp is proceeding as planned. Meliadine construction and development is progressing well and procurement activities for the 2018 barge season are now complete
• Infill drilling at the East Malartic property yields favourable results, potential
development options under review – Recent drilling at East Malartic has returned significant intersections of 2.5 grams per tonne ("g/t") gold over 37.7 metres at 238 metres depth, including 3.6 g/t gold over 10.6 metres. Studies are underway to evaluate potential mining scenarios at both East Malartic and the neighbouring Odyssey project. Permitting activities to provide ramp access to both projects are currently underway
• Acquisition of Yamana Gold Inc.'s ("Yamana") 50% interest in the Canadian
exploration assets of Canadian Malartic Corporation ("CMC") completed in late March 2018 – Agnico Eagle now owns the exploration assets of CMC, which include the Kirkland Lake and Hammond Reef projects. At Kirkland Lake, a 25,700
2Payable production of a mineral means the quantity of a mineral produced during a period contained in products that have been or will be sold by the Company whether such products are shipped during the period or held as inventory at the end of the period. 3Total cash costs per ounce is a Non-GAAP measure and, unless otherwise specified, is reported on a by-product basis. For a reconciliation to production costs and for total cash costs on a co-product basis, see "Reconciliation of Non-GAAP Financial Performance Measures" below. See also "Note Regarding Certain Measures of Performance". 4All-in-sustaining costs per ounce is a Non-GAAP measure and, unless otherwise specified, is reported on a by-product basis. For a reconciliation to production costs and for all-in sustaining costs on a co-product basis, see "Reconciliation of Non-GAAP Financial Performance Measures" below. See also "Note Regarding Certain Measures of Performance".

3
metre drill program will be carried out in 2018 to further evaluate known deposits and test new target areas
• Monetization of non-core assets – The Company is assessing opportunities to
monetize non-core assets, including the West Pequop Joint Venture, Summit and PQX properties in Nevada, the Cobalt mining properties in the historic Cobalt silver district in Ontario, and its equity investment in Belo Sun Mining Corp. ("Belo Sun") which it disposed of this month as previously announced
• A quarterly dividend of $0.11 per share was declared
First Quarter Financial and Production Highlights In the first quarter of 2018, stable operational performance continued at the Company's mines, which led to payable gold production of 389,278 ounces, compared to 418,216 ounces in the first quarter of 2017. This lower level of production in the 2018 period was primarily due to reduced throughput levels at Meadowbank as the mine transitions through the last full year of mining at site and at Lapa as mill processing did not resume until March 2018. A detailed description of the production of each mine is set out below. Production costs per ounce for the first quarter of 2018 were $759, compared to $578 for the first quarter of 2017. Total cash costs per ounce for the first quarter of 2018 were $648, compared to $539 for the first quarter of 2017. Production costs per ounce and total cash costs per ounce in the first quarter of 2018 were affected by lower gold production levels at Meadowbank and Lapa, the strengthening of local currencies against the U.S. dollar and higher costs at several mines (principally at Meadowbank) compared to the first quarter of 2017. The impact of the strengthening of the local currencies was approximately $40 per ounce. AISC for the first quarter of 2018 were $889, compared to $741 for the first quarter of 2017. The higher AISC is primarily due to expected lower gold production and higher total cash costs per ounce compared to the first quarter of 2017. A detailed description of the cost performance of each mine is set out below. Cash Position Remains Strong Cash and cash equivalents and short-term investments decreased to $464.8 million at March 31, 2018, from the December 31, 2017 balance of $643.9 million due to the ongoing investment in the Company's growth projects and the recent acquisition of the Kirkland Lake and Hammond Reef projects. The outstanding balance on the Company's credit facility remained nil at March 31, 2018. This results in available credit lines of approximately $1.2 billion, not including the uncommitted $300 million accordion feature. Subsequent to the quarter end, on April 5, 2018, the Company issued notes to certain institutional investors totalling $350 million. The notes consist of $45 million at 4.38% due
4
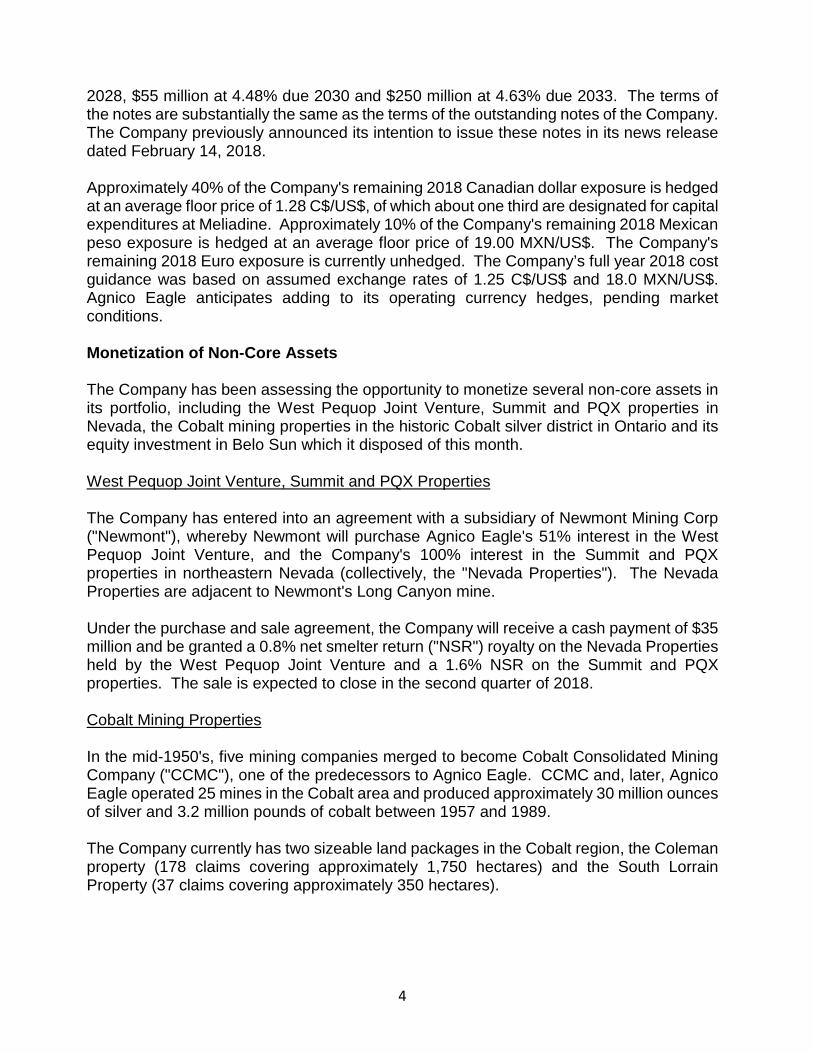
2028, $55 million at 4.48% due 2030 and $250 million at 4.63% due 2033. The terms of the notes are substantially the same as the terms of the outstanding notes of the Company. The Company previously announced its intention to issue these notes in its news release dated February 14, 2018. Approximately 40% of the Company's remaining 2018 Canadian dollar exposure is hedged at an average floor price of 1.28 C$/US$, of which about one third are designated for capital expenditures at Meliadine. Approximately 10% of the Company's remaining 2018 Mexican peso exposure is hedged at an average floor price of 19.00 MXN/US$. The Company's remaining 2018 Euro exposure is currently unhedged. The Company’s full year 2018 cost guidance was based on assumed exchange rates of 1.25 C$/US$ and 18.0 MXN/US$. Agnico Eagle anticipates adding to its operating currency hedges, pending market conditions. Monetization of Non-Core Assets The Company has been assessing the opportunity to monetize several non-core assets in its portfolio, including the West Pequop Joint Venture, Summit and PQX properties in Nevada, the Cobalt mining properties in the historic Cobalt silver district in Ontario and its equity investment in Belo Sun which it disposed of this month. West Pequop Joint Venture, Summit and PQX Properties The Company has entered into an agreement with a subsidiary of Newmont Mining Corp ("Newmont"), whereby Newmont will purchase Agnico Eagle's 51% interest in the West Pequop Joint Venture, and the Company's 100% interest in the Summit and PQX properties in northeastern Nevada (collectively, the "Nevada Properties"). The Nevada Properties are adjacent to Newmont's Long Canyon mine. Under the purchase and sale agreement, the Company will receive a cash payment of $35 million and be granted a 0.8% net smelter return ("NSR") royalty on the Nevada Properties held by the West Pequop Joint Venture and a 1.6% NSR on the Summit and PQX properties. The sale is expected to close in the second quarter of 2018. Cobalt Mining Properties In the mid-1950's, five mining companies merged to become Cobalt Consolidated Mining Company ("CCMC"), one of the predecessors to Agnico Eagle. CCMC and, later, Agnico Eagle operated 25 mines in the Cobalt area and produced approximately 30 million ounces of silver and 3.2 million pounds of cobalt between 1957 and 1989. The Company currently has two sizeable land packages in the Cobalt region, the Coleman property (178 claims covering approximately 1,750 hectares) and the South Lorrain Property (37 claims covering approximately 350 hectares).

5
The Company has initiated a strategic review of its Cobalt properties with the intent to realize value for the historical property portfolio. The Company expects that the outcome of such review may result in the sale of all or a portion of its Cobalt properties. Disposition of Investment in Belo Sun The Company reviews its portfolio of equity investments in junior mining companies on an ongoing basis. As previously announced, the Company has disposed of 44,551,000 common shares of Belo Sun for aggregate proceeds of C$14,924,585. For further details, please see the Company’s new release dated April 20, 2018. Capital Expenditures Total capital expenditures (including sustaining capital) in 2018 remain forecast to be approximately $1.08 billion. The following table sets out capital expenditures (including sustaining capital) in the first quarter of 2018.
Capital Expenditures(In thousands of US dollars)
Three Months EndedMarch 31, 2018
Sustaining CapitalLaRonde mine 15,397$ Canadian Malartic mine 16,118 Meadowbank mine 2,890 Kittila mine 9,798 Goldex mine 5,112 Pinos Altos mine 7,175 Creston Mascota mine 502 La India mine 1,430 Total Sustaining Capital 58,422
Development CapitalLaRonde mine 842$ LaRonde Zone 5 7,653 Canadian Malartic mine 5,211 Meadowbank mine 14,976 Kittila mine 18,579 Goldex mine 8,312 Pinos Altos mine - Creston Mascota mine 3,061 La India mine 561 Meliadine project 61,330 Other 480 Total Development Capital 121,005
Total Capital Expenditures 179,427$

6
Dividend Record and Payment Dates for the Second Quarter of 2018 Agnico Eagle's Board of Directors has declared a quarterly cash dividend of $0.11 per common share, payable on June 15, 2018 to shareholders of record as of June 1, 2018. Agnico Eagle has declared a cash dividend every year since 1983. Other Expected Dividend and Record Dates for 2018 Record Date Payment Date August 31 September 14 November 30 December 14 Dividend Reinvestment Plan Please see the following link for information on the Company's dividend reinvestment plan: Dividend Reinvestment Plan First Quarter 2018 Results Conference Call and Webcast Tomorrow Agnico Eagle's senior management will host a conference call on Friday, April 27, 2018 at 8:30 AM (E.D.T.) to discuss the Company's financial and operating results. Via Webcast: A live audio webcast of the conference call will be available on the Company's website at www.agnicoeagle.com. Via Telephone: For those preferring to listen by telephone, please dial 1-647-427-7450 or toll-free 1-888-231-8191. To ensure your participation, please call approximately five minutes prior to the scheduled start of the call. Replay archive: Please dial 1-416-849-0833 or toll-free 1-855-859-2056, access code 7288308. The conference call replay will expire on May 27, 2018. The webcast, along with presentation slides, will be archived for 180 days on the Company's website. Annual Meeting The Company's Annual and Special Meeting of Shareholders (the "AGM") will be held on Friday, April 27, 2018 at 11:00 am (E.D.T). The AGM will be held at the Delta Toronto Hotel (SoCo Ballroom) - 75 Lower Simcoe St, Toronto, ON M5J 3A6. During the AGM, management will provide an overview of the Company's activities. For those unable to attend in person, the alternatives to participate are listed below.

7
Via Webcast: A live audio webcast of the AGM will be available on the Company's website at www.agnicoeagle.com. Via Telephone: For those preferring to listen by telephone, please dial 1-647-427-7450 or toll-free 1-888-231-8191. To ensure your participation, please call approximately five minutes prior to the scheduled start of the AGM. Replay archive: Please dial 1-416-849-0833 or toll-free 1-855-859-2056, access code 9189563. The conference call replay will expire on May 27, 2018. The webcast, along with presentation slides, will be archived for 180 days on the Company's website.

8
NORTHERN BUSINESS REVIEW ABITIBI REGION, QUEBEC Agnico Eagle is currently Quebec's largest gold producer with a 100% interest in three mines (LaRonde, Goldex and Lapa) and a 50% interest in the Canadian Malartic mine. These mines are located within 50 kilometres of each other, which provides operating synergies and allows for the sharing of technical expertise. LaRonde Mine – Higher Grades Drive Strong First Quarter Performance as the Mine Enters its Thirtieth Year of Production The 100% owned LaRonde mine in northwestern Quebec achieved commercial production in 1988.
Production costs per tonne in the first quarter of 2018 increased when compared to the prior-year period due to higher underground and mill maintenance costs, lower throughput and the timing of unsold inventory. Production costs per ounce in the first quarter of 2018 increased when compared to the prior-year period due to the reasons described above and the strengthening of the Canadian dollar relative to the U.S. dollar between periods, partially offset by higher gold production. For the remainder of the year, grades are expected to be more in line with 2018 guidance and mill throughput is expected to increase from levels seen in the first quarter of 2018. Minesite costs per tonne5 in the first quarter of 2018 increased when compared to the prior-year period due to lower throughput levels and higher underground and mill maintenance costs. Minesite costs per tonne are expected to be in line with guidance over the balance of 2018. Total cash costs per ounce in the first quarter of 2018 decreased when compared to the prior-year period due to higher gold production and higher by-product metal revenues. Gold production in the first quarter of 2018 increased when compared to the prior-year period due to higher grades resulting from the mining sequence in the lower part of the mine.
5Minesite costs per tonne is a Non-GAAP measure. For a reconciliation of this measure to production costs, see "Reconciliation of Non-GAAP Financial Performance Measures" below. See also "Note Regarding Certain Measures of Performance".
LaRonde Mine - Operating StatisticsThree Months Ended Three Months Ended
March 31, 2018 March 31, 2017Tonnes of ore milled (thousands of tonnes) 531 559 Tonnes of ore milled per day 5,901 6,215 Gold grade (g/t) 5.49 4.61 Gold production (ounces) 89,785 78,912 Production costs per tonne (C$) 155$ 106$ Minesite costs per tonne (C$) 121$ 109$ Production costs per ounce of gold produced ($ per ounce): 723$ 562$ Total cash costs per ounce of gold produced ($ per ounce): 427$ 464$

9
At the LaRonde 3 project, conversion and exploration drilling is ongoing at depth as the Company continues to evaluate a phased approach to development between the 311 level (a depth of 3.1 kilometres) and the 350 level (a depth of 3.5 kilometres). Under this phased approach, an additional two or three levels will be developed per year in either the east or west areas of the mine through 2022. This is expected to result in the conversion of approximately 1.2 million ounces of mineral resources into mineral reserves, with full mining activities to commence in 2022. The Company believes that this phased approach is a lower risk, less capital intensive option for developing the deeper levels of the LaRonde mine. LaRonde Zone 5 – Commercial Production Remains on Schedule for Early Third Quarter 2018 In 2003, the Company acquired the LaRonde Zone 5 project from Barrick Gold Corporation. The property lies adjacent to and west of the LaRonde mining complex and previous operators exploited the deposit by open pit. In February 2017, LaRonde Zone 5 was approved by Agnico Eagle's Board of Directors for development. In the first quarter of 2018, development of the first five mining stopes was essentially completed and the first production blast is expected in early May 2018. The paste plant is expected to be commissioned in the second quarter of 2018. The development of LaRonde Zone 5 is on budget and on schedule with commercial production on schedule for early in the third quarter of 2018. For additional details on the project see the Company's news release dated February 15, 2017. Canadian Malartic Mine – Record Quarterly Gold Production; First Drill Results Reported for East Malartic Project In June 2014, Agnico Eagle and Yamana acquired Osisko Mining Corporation and created the Canadian Malartic General Partnership (the "Partnership"). The Partnership owns and operates the Canadian Malartic mine in northwestern Quebec through a joint management committee. Each of Agnico Eagle and Yamana has an indirect 50% ownership interest in the Partnership. All volume numbers in this section reflect the Company's 50% interest in the Canadian Malartic mine, except as noted.
Production costs per tonne in the first quarter of 2018 increased when compared to the prior-year period primarily due to higher contractor and fuel costs and the timing of unsold
Canadian Malartic Mine - Operating StatisticsThree Months Ended Three Months Ended
March 31, 2018 March 31, 2017Tonnes of ore milled (thousands of tonnes) 2,510 2,433 Tonnes of ore milled per day 27,888 27,029 Gold grade (g/t) 1.17 1.03 Gold production (ounces) 83,403 71,382 Production costs per tonne (C$) 24$ 18$ Minesite costs per tonne (C$) 25$ 22$ Production costs per ounce of gold produced ($ per ounce): 567$ 455$ Total cash costs per ounce of gold produced ($ per ounce): 566$ 556$

10
inventory, partially offset by higher throughput. Production costs per ounce in the first quarter of 2018 increased when compared to the prior-year period due to the reasons described above and the strengthening of the Canadian dollar relative to the U.S. dollar between periods, partially offset by higher production. Minesite costs per tonne in the first quarter of 2018 were higher when compared to the prior-year period due to the reasons described above. Total cash costs per ounce in the first quarter of 2018 were higher when compared to the prior-year period due to the reasons described above, partially offset by higher production. Gold production in the first quarter of 2018 increased when compared to the prior-year period due to higher throughput and higher grades. The Barnat extension project continues to progress on schedule and on budget. Since the beginning of the first quarter of 2018, the following activities have been undertaken:
• Construction of the temporary bridge which became operational in January 2018 • Ongoing overburden stripping and overload (new road bed foundation) preparation • Backfill of the historically mined Buckshot pit was essentially completed
Production activities at Barnat are scheduled to begin in late 2019. Infill Drilling at Odyssey Confirms Resource Grade; First Drill Results Reported from the East Malartic Zone At the Canadian Malartic mine, exploration programs are ongoing to evaluate a number of near pit and underground targets. In addition, the Partnership is exploring the East Malartic and the Odyssey properties, which are located to the east of the Canadian Malartic open pit. These opportunities have the potential to provide new sources of ore for the Canadian Malartic mill. The 2018 exploration program will consist of 140,000 metres of drilling with a budgeted cost (50% basis) of $8.6 million, including 80,000 metres for valuation in the upper and middle parts of the East Malartic Zone. There are currently three drill rigs at the East Malartic project and six rigs at the Odyssey project. In the first quarter of 2018, 22,089 metres of drilling (46 holes) were completed at the Odyssey project and 13,600 metres (18 holes) were completed at the East Malartic project. Odyssey Zone The Odyssey Zone lies on the east side of the Canadian Malartic property, approximately 3.0 kilometres east of the current limit of the Canadian Malartic open pit. Exploration results from the Odyssey Zone were last reported in the Company's news release dated February 15, 2017. The Odyssey Zone is composed of multiple mineralized bodies spatially associated with a porphyritic intrusion close to the contact of the Pontiac Group sediments and the Piché

11
Group of volcanic rocks. They are grouped into two parallel elongated sheets, the Odyssey North and Odyssey South zones approximately 500 metres apart, which strike east-southeast and dip steeply south. The Odyssey North Zone plunges shallowly to the east and has been traced from a depth of 600 to 1,400 metres below surface along a strike length of approximately 1.3 kilometres. The Odyssey South Zone has been located between approximately 200 and 550 metres below surface over a strike length of 1.2 kilometres. Initial indicated mineral resources for the Odyssey Zone are estimated at 9,000 ounces of gold (108,000 tonnes grading 2.45 g/t gold), while inferred mineral resources for the Odyssey Zone are estimated at 838,000 ounces of gold (11.2 million tonnes grading 2.32 g/t gold) as of December 31, 2017. All mineral resources are on a 50% basis. Selected recent drill intercepts from the Odyssey South Zone are set out in the table below. The drill-hole collars are located on the Canadian Malartic and Odyssey local geology map, and the pierce points are shown on the composite longitudinal section. The intercepts reported for the Odyssey South Zone show uncapped and capped grades over estimated true widths, based on a preliminary geological interpretation that is being updated as new information becomes available with further drilling. Recent exploration drill results from the Odyssey South Zone
Drill hole Location From (metres)
To (metres)
Depth of midpoint
below surface (metres)
Estimated true width (metres)
Gold grade (g/t)
(uncapped)
Gold grade (g/t) (capped)*
ODY17-5189 Odyssey South 499.0 521.0 427 18.1 2.1 2.1
ODY17-5191 Odyssey South 479.7 489.0 421 7.8 2.9 2.9
ODY18-5196 Odyssey South 337.2 347.0 270 8.9 7.3 3.7
ODY18-5198 Odyssey South 385.7 388.6 273 2.8 39.1 18.5
ODY18-5201 Odyssey South 444.0 463.1 319 18.2 2.2 2.2
ODY18-5202 Odyssey South 410.4 420.5 369 8.3 2.4 2.4
ODY18-5207 Odyssey South 319.0 339.2 241 18.8 2.5 2.5
ODY18-5218 Odyssey South 448.6 453.0 379 3.9 2.5 2.5
and Odyssey South 462.0 469.5 391 6.7 2.9 2.9
ODY18-5219 Odyssey South 455.5 466.5 399 9.5 2.4 2.4
ODY18-5221 Odyssey South 367.5 374.8 271 6.9 3.6 3.6 * Results from the Odyssey Zone use a capping factor of 20 g/t gold.

12
[Canadian Malartic and Odyssey Local Geology Map]
[Canadian Malartic and Odyssey Composite Longitudinal Section]

13
Exploration is currently focusing on infilling the near-surface portion of the deposit in Odyssey South. Recent drilling on the Odyssey South Zone returned several significant intersections that confirm its geological setting apart from the current mineral resource area, confirm the grade of the mineral resources and suggest that the size of the zone could increase. On the eastern side of the Odyssey South Zone, hole ODY18-5196 intersected 3.7 g/t gold over 8.9 metres at 270 metres depth and hole ODY18-5201 intersected 2.2 g/t gold over 18.2 metres at 319 metres depth. There are several recent intercepts in the central part of the Odyssey South Zone, including hole ODY18-5207 that intersected 2.5 g/t gold over 18.8 metres at 241 metres depth and hole ODY17-5191 that intersected 2.9 g/t gold over 7.8 metres at 421 metres depth. A further 360 metres to the west, hole ODY18-5198 intersected 18.5 g/t gold over 2.8 metres at 273 metres depth. Another 410 metres to the west, well away from the current mineral resources, hole ODY18-5202 intersected 2.4 g/t gold over 8.3 metres at 369 metres depth. Recent drilling at Odyssey has confirmed the mineral resources tonnage and grade in the central portion of the zone, and has extended the zone along strike and closer to surface. Definition and expansion drilling will continue in the coming quarters to increase confidence in the grade and zone geometry. East Malartic In 2017, an initial inferred mineral resource was declared on the East Malartic property, which was previously a gold producing property. The East Malartic property is located directly adjacent to and east of the Canadian Malartic Mine, and west of the Odyssey Zone. Inferred mineral resources at East Malartic (on a 50% basis) are estimated at 1.2 million ounces of gold (19.0 million tonnes grading 2.02 g/t gold) to a depth of 1,000 metres. This is the first report of exploration drill results from the East Malartic property in a Company news release. At the East Malartic project, the Partnership is exploring three mineralized zones with distinct geology that come together beneath and to the east of the Canadian Malartic open pit. The East Malartic and Sladen zones are intertwined, extending from beneath the open pit eastward to beneath the Odyssey North Zone, while the Sheehan Zone lies immediately north of East Malartic and Sladen in a shear zone including porphyritic intrusives and ultramafic volcanic rocks. Both the East Malartic and Sladen zones are related to the Sladen fault that also includes Canadian Malartic mineralization (to the west) and the Odyssey North Zone (to the east). The Sladen fault is at least 5 kilometres long, and hosts most of the mineralization at the Canadian Malartic, Sladen, East Malartic mines and Odyssey zones. During 2017, exploration drilling at the East Malartic project included 59,000 metres (63 holes) of diamond drilling. Selected drill intercepts from the 2017 drill program at the East Malartic project are set out in the table below. The drill-hole collars are located on the Canadian Malartic and Odyssey local geology map, and the pierce points are shown on the composite longitudinal section.

14
The intercepts reported for the East Malartic project show uncapped and capped grades over estimated true widths, based on a preliminary geological interpretation that is being updated as new information becomes available with further drilling. Recent exploration drill results from the East Malartic project
Drill hole Zone From (metres)
To (metres)
Depth of midpoint
below surface (metres)
Estimated true width (metres)
Gold grade (g/t)
(uncapped)
Gold grade (g/t) (capped)*
MEV17-001 Sladen 866.0 871.0 770 2.7 2.8 2.8 and Sladen 901.7 914.0 803 6.7 2.8 2.8 MEV17-012A Sheehan 440.0 451.2 360 7.9 3.3 3.3 including 445.0 449.0 361 2.8 6.4 6.4
and East Malartic 587.0 595.0 475 3.2 3.9 3.9 including 587.0 592.2 474 2.1 5.2 5.2 MEV17-016A Sladen 527.0 560.0 476 23.9 3.2 3.2 including 546.3 552.1 482 4.1 8.8 8.8 MEV17-024 East Malartic 272.8 334.0 238 37.7 2.5 2.5 including 272.8 290.0 225 10.6 3.6 3.6
including 326.6 334.0 264 4.6 7.1 7.1 and Sheehan 414.2 425.2 336 3.7 2.7 2.7 and Sheehan 436.6 463.0 359 8.6 2.2 2.2 and Sheehan 477.0 486.4 384 2.9 2.6 2.6 and Sheehan 534.0 562.4 438 8.6 2.5 2.5 MEV17-EA-2002WA East Malartic 1065.0 1093.9 962 18.0 2.2 2.2
MEV17-EA-2004 Sheehan 488.0 533.3 427 31.9 10.2 7.4 including 520.9 533.3 441 8.9 27.3 16.8 and East Malartic 677.2 689.8 568 5.7 2.0 2.0
MEV17-SH-1005 Sheehan 472.0 501.0 338 21.2 3.5 3.5 including 472.0 480.0 330 5.8 9.5 9.5
* Results from the Sheehan and East Malartic zones use a capping factor of 40 g/t gold. Results from Sladen use a capping factor of 30 g/t gold.
Among the most promising intercepts in the Sheehan Zone from the 2017 drill program, hole MEV17-EA-2004 intersected 7.4 g/t gold over 31.9 metres at 427 metres depth, including 16.8 g/t gold over 8.9 metres. Approximately 800 metres to the east, hole MEV17-SH-1005 intersected 3.5 g/t gold over 21.2 metres at 338 metres depth, including 9.5 g/t gold over 5.8 metres, also in the Sheehan Zone. In the East Malartic and Sladen zones, there were also promising results in 2017. Hole MEV17-024 intersected 2.5 g/t gold over 37.7 metres at 238 metres depth, including 3.6 g/t gold over 10.6 metres, and separately including 7.1 g/t gold over 4.6 metres, in the East Malartic Zone. Approximately 500 metres to the southwest in the Sladen Zone, hole MEV17-016A intersected 3.2 g/t gold over 23.9 metres at 476 metres depth, including 8.8

15
g/t gold over 4.1 metres. At greater depths, the Sladen Zone was intersected by hole MEV17-001, yielding 2.8 g/t gold over 6.7 metres at 803 metres depth. Approximately 1,100 metres to the east, hole MEV17-EA-2002WA intersected the East Malartic Zone, yielding 2.2 g/t gold over 18.0 metres at 962 metres depth. In 2018, the exploration focus will be to convert inferred mineral resources to indicated mineral resources in the shallower portions of the Odyssey South and East Malartic zones and further drilling to better define the geometry of the higher-grade internal zones at the Odyssey Zone. In addition, permitting activities are underway for an exploration ramp to provide underground access to the shallower portions of the Odyssey South and East Malartic zones. Development of the ramp, which will provide access for underground drilling and collection of a bulk sample, is expected to begin in late 2018. The goal of the underground development program is to provide higher grade feed to the Canadian Malartic mill and extend the current mine life. Kirkland Lake Project Update On March 28, 2018, the Company completed the acquisition of Yamana's indirect 50% interest in the Canadian exploration assets of CMC. As a result, Agnico Eagle now owns the transferred CMC exploration assets, which include the Kirkland Lake and Hammond Reef projects. The Company previously announced the entering into of an asset purchase agreement for the Canadian exploration assets of CMC in its news release dated December 21, 2017. The Hammond Reef project in northwestern Ontario covers approximately 31,145 hectares and contains open pit measured and indicated mineral resources of 4.5 million ounces gold (208.4 million tonnes at 0.67 g/t gold) and open pit inferred mineral resources of 12,000 ounces gold (0.5 million tonnes at 0.74 g/t gold). Mineral resources are estimated as of December 31, 2017 and are reported on a 100% basis. For a detailed breakdown of mineral resources, please refer to the Company’s press release dated February 14, 2018. The Kirkland Lake project in northeastern Ontario covers approximately 27,312 hectares and mineral reserves and mineral resources have been outlined on several properties. Deposits in the Kirkland Lake area include: Upper Beaver, Anoki and McBean, Amalgamated Kirkland, Upper Canada and Munro. The primary deposits on the Kirkland Lake property are outlined on the plan map shown below. [Kirkland Lake Property Regional Geology Map]

16
At Kirkland Lake, an initial $5 million exploration program consisting of 25,700 metres of drilling is planned for 2018. The primary exploration focus for the Kirkland Lake project this year will be:
• Expanding and locating new gold mineralization on the Upper Beaver and Upper Canada properties
• Prospecting along the Larder-Cadillac Deformation Zone • Completing a technical review of all exploration data for the Upper Beaver
deposit in order to determine the next steps at the property, including the evaluation of potential synergies between Upper Beaver and Upper Canada
The Upper Beaver deposit is atypical of the Kirkland Lake - Larder Lake mining district. Gold-copper mineralization is predominantly hosted in an alkalic intrusive complex and is associated with disseminated pyrite and chalcopyrite and magnetite-sulphide veining. The Upper Beaver deposit contains underground mineral reserves of 1.4 million ounces of gold and 20,000 tonnes of copper (8.0 million tonnes grading 5.43 g/t gold and 0.25% copper), underground measured and indicated mineral resources of 0.4 million ounces of gold and 5,100 tonnes of copper (3.6 million tonnes grading 3.45 g/t gold and 0.14% copper) and underground inferred mineral resources of 1.4 million ounces of gold and 17,300 tonnes of copper (8.7 million tonnes grading 5.07 g/t gold and 0.20% copper). Mineral reserves and mineral resources are estimated as of December 31, 2017 and are reported on a 100% basis. For a detailed breakdown of mineral reserves and mineral resources, please refer to the Company’s press release dated February 14, 2018. The exploration program at Upper Beaver in 2018 will consist of:
17
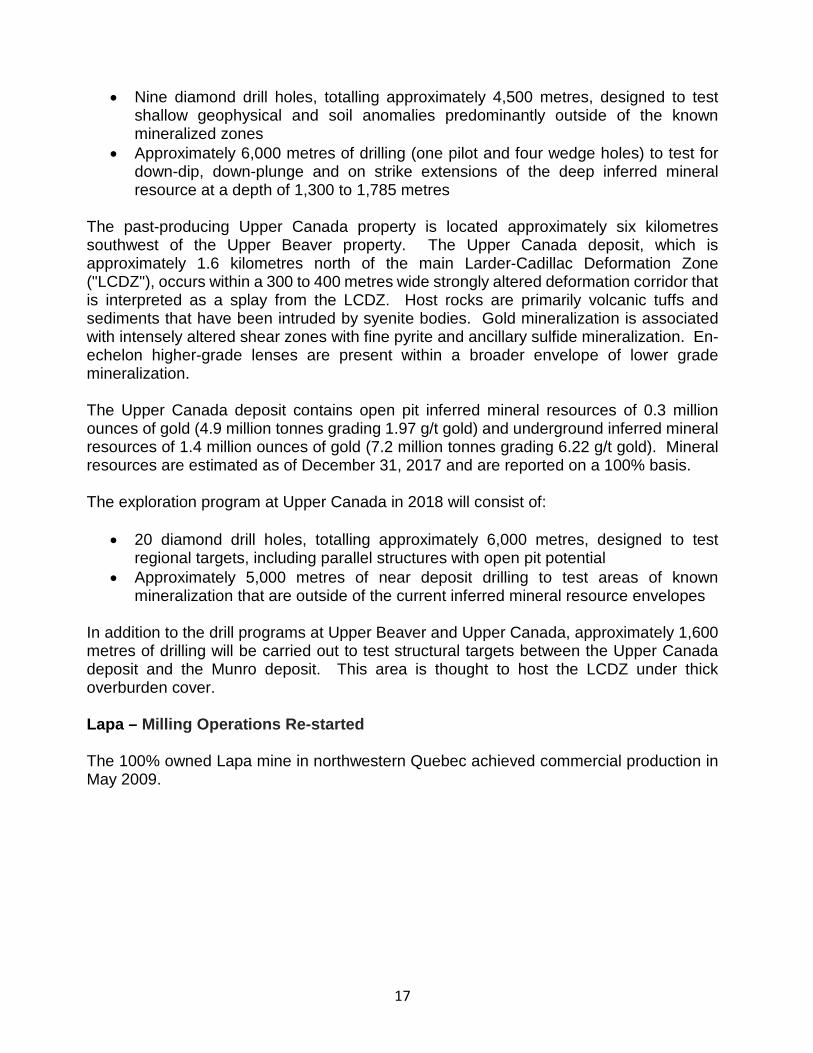
• Nine diamond drill holes, totalling approximately 4,500 metres, designed to test shallow geophysical and soil anomalies predominantly outside of the known mineralized zones
• Approximately 6,000 metres of drilling (one pilot and four wedge holes) to test for down-dip, down-plunge and on strike extensions of the deep inferred mineral resource at a depth of 1,300 to 1,785 metres
The past-producing Upper Canada property is located approximately six kilometres southwest of the Upper Beaver property. The Upper Canada deposit, which is approximately 1.6 kilometres north of the main Larder-Cadillac Deformation Zone ("LCDZ"), occurs within a 300 to 400 metres wide strongly altered deformation corridor that is interpreted as a splay from the LCDZ. Host rocks are primarily volcanic tuffs and sediments that have been intruded by syenite bodies. Gold mineralization is associated with intensely altered shear zones with fine pyrite and ancillary sulfide mineralization. En-echelon higher-grade lenses are present within a broader envelope of lower grade mineralization. The Upper Canada deposit contains open pit inferred mineral resources of 0.3 million ounces of gold (4.9 million tonnes grading 1.97 g/t gold) and underground inferred mineral resources of 1.4 million ounces of gold (7.2 million tonnes grading 6.22 g/t gold). Mineral resources are estimated as of December 31, 2017 and are reported on a 100% basis. The exploration program at Upper Canada in 2018 will consist of:
• 20 diamond drill holes, totalling approximately 6,000 metres, designed to test regional targets, including parallel structures with open pit potential
• Approximately 5,000 metres of near deposit drilling to test areas of known mineralization that are outside of the current inferred mineral resource envelopes
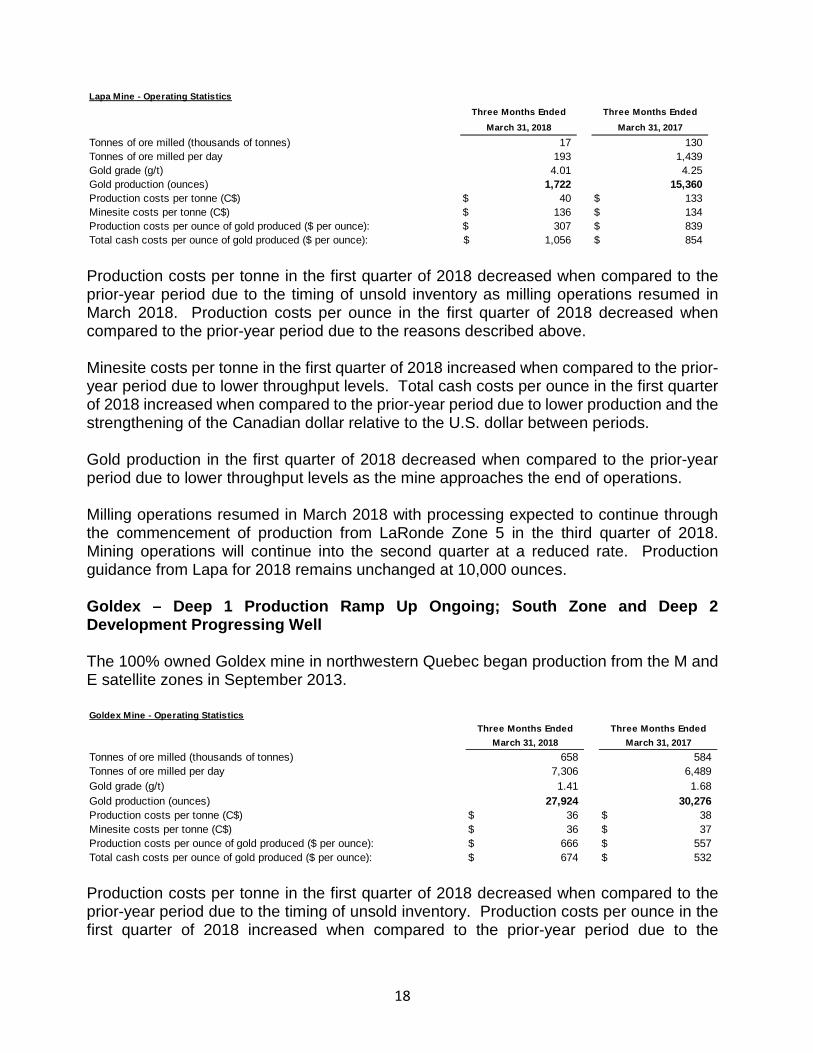
In addition to the drill programs at Upper Beaver and Upper Canada, approximately 1,600 metres of drilling will be carried out to test structural targets between the Upper Canada deposit and the Munro deposit. This area is thought to host the LCDZ under thick overburden cover. Lapa – Milling Operations Re-started The 100% owned Lapa mine in northwestern Quebec achieved commercial production in May 2009.
18
Production costs per tonne in the first quarter of 2018 decreased when compared to the prior-year period due to the timing of unsold inventory as milling operations resumed in March 2018. Production costs per ounce in the first quarter of 2018 decreased when compared to the prior-year period due to the reasons described above. Minesite costs per tonne in the first quarter of 2018 increased when compared to the prior-year period due to lower throughput levels. Total cash costs per ounce in the first quarter of 2018 increased when compared to the prior-year period due to lower production and the strengthening of the Canadian dollar relative to the U.S. dollar between periods. Gold production in the first quarter of 2018 decreased when compared to the prior-year period due to lower throughput levels as the mine approaches the end of operations. Milling operations resumed in March 2018 with processing expected to continue through the commencement of production from LaRonde Zone 5 in the third quarter of 2018. Mining operations will continue into the second quarter at a reduced rate. Production guidance from Lapa for 2018 remains unchanged at 10,000 ounces. Goldex – Deep 1 Production Ramp Up Ongoing; South Zone and Deep 2 Development Progressing Well The 100% owned Goldex mine in northwestern Quebec began production from the M and E satellite zones in September 2013.
Production costs per tonne in the first quarter of 2018 decreased when compared to the prior-year period due to the timing of unsold inventory. Production costs per ounce in the first quarter of 2018 increased when compared to the prior-year period due to the
Lapa Mine - Operating StatisticsThree Months Ended Three Months Ended
March 31, 2018 March 31, 2017Tonnes of ore milled (thousands of tonnes) 17 130 Tonnes of ore milled per day 193 1,439 Gold grade (g/t) 4.01 4.25 Gold production (ounces) 1,722 15,360 Production costs per tonne (C$) 40$ 133$ Minesite costs per tonne (C$) 136$ 134$ Production costs per ounce of gold produced ($ per ounce): 307$ 839$ Total cash costs per ounce of gold produced ($ per ounce): 1,056$ 854$
Goldex Mine - Operating StatisticsThree Months Ended Three Months Ended
March 31, 2018 March 31, 2017Tonnes of ore milled (thousands of tonnes) 658 584 Tonnes of ore milled per day 7,306 6,489 Gold grade (g/t) 1.41 1.68 Gold production (ounces) 27,924 30,276 Production costs per tonne (C$) 36$ 38$ Minesite costs per tonne (C$) 36$ 37$ Production costs per ounce of gold produced ($ per ounce): 666$ 557$ Total cash costs per ounce of gold produced ($ per ounce): 674$ 532$

19
strengthening of the Canadian dollar relative to the U.S. dollar between periods and lower production. Minesite costs per tonne in the first quarter of 2018 were essentially the same when compared to the prior-year period. Total cash costs per ounce in the first quarter of 2018 increased when compared to the prior-year period due to the strengthening of the Canadian dollar relative to the U.S. dollar between periods and lower production. Gold production in the first quarter of 2018 decreased when compared to the prior-year period due to lower grades and recoveries. The Deep 1 ramp-up continues as scheduled with average daily throughput expected to be approximately 3,500 tonnes per day in 2018 as the establishment of the mining pyramid progresses. Drilling and ramp development continues at the Deep 2 Zone. Studies are ongoing to evaluate the potential to increase throughput from the Deep 1 Zone and the potential to accelerate mining activities on a portion of the Deep 2 Zone, both of which could enhance production levels or extend the current mine life at Goldex and reduce operating costs. At the South Zone, where gold mineralization is hosted in quartz veins, underground development is underway on two levels. The first stope in the South Zone is expected to be mined in August and there is potential to mine a total of five stopes in 2018. The South Zone is estimated to contain indicated mineral resources of 57,000 ounces of gold (432,000 tonnes grading 4.09 g/t gold) and inferred mineral resources of 169,000 ounces of gold (1.1 million tonnes grading 4.74 g/t gold). Agnico Eagle acquired the Akasaba West gold-copper deposit in January 2014. Located less than 30 kilometres from Goldex, the Akasaba West deposit is expected to create flexibility and synergies for the Company's operations in the Abitibi region by utilizing extra milling capacity at both Goldex and LaRonde, while reducing costs. The public hearings under the Quebec environmental assessment process (Bureau des Audiences Publiques en Environnement or "BAPE") were completed for the Akasaba project in 2017 and the BAPE report was issued to the Quebec Minister of the Environment on June 2, 2017. The report concludes that the project is acceptable under certain conditions. Under the Federal process, the Canadian Environmental Assessment Agency released its Preliminary Environmental Assessment Report on the Akasaba project on February 21, 2018 for public comments. Permitting activities continue with both Provincial and Federal government agencies. Final recommendations are expected in 2018 and start-up is projected for 2020. NUNAVUT REGION Agnico Eagle has identified Nunavut as a politically attractive and stable jurisdiction with enormous geological potential. With the Company's Meadowbank mine and two significant development assets (Meliadine and the Amaruq satellite deposit at Meadowbank) and
20
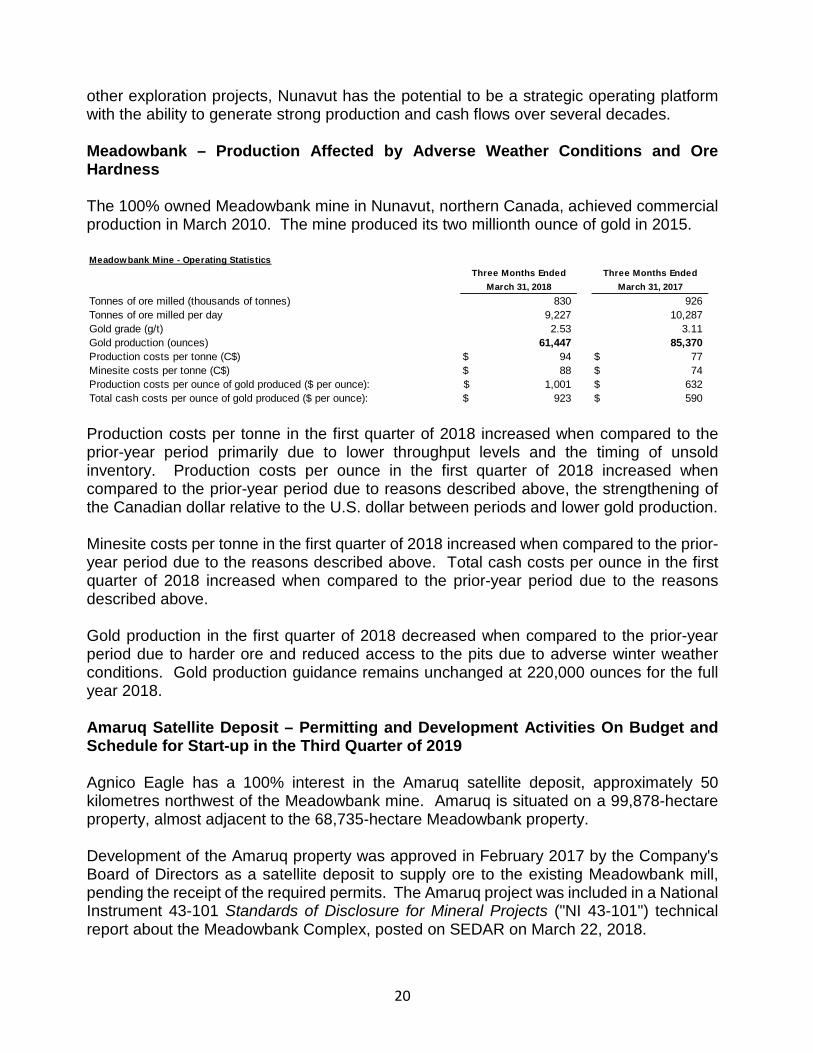
other exploration projects, Nunavut has the potential to be a strategic operating platform with the ability to generate strong production and cash flows over several decades. Meadowbank – Production Affected by Adverse Weather Conditions and Ore Hardness The 100% owned Meadowbank mine in Nunavut, northern Canada, achieved commercial production in March 2010. The mine produced its two millionth ounce of gold in 2015.
Production costs per tonne in the first quarter of 2018 increased when compared to the prior-year period primarily due to lower throughput levels and the timing of unsold inventory. Production costs per ounce in the first quarter of 2018 increased when compared to the prior-year period due to reasons described above, the strengthening of the Canadian dollar relative to the U.S. dollar between periods and lower gold production. Minesite costs per tonne in the first quarter of 2018 increased when compared to the prior-year period due to the reasons described above. Total cash costs per ounce in the first quarter of 2018 increased when compared to the prior-year period due to the reasons described above. Gold production in the first quarter of 2018 decreased when compared to the prior-year period due to harder ore and reduced access to the pits due to adverse winter weather conditions. Gold production guidance remains unchanged at 220,000 ounces for the full year 2018. Amaruq Satellite Deposit – Permitting and Development Activities On Budget and Schedule for Start-up in the Third Quarter of 2019 Agnico Eagle has a 100% interest in the Amaruq satellite deposit, approximately 50 kilometres northwest of the Meadowbank mine. Amaruq is situated on a 99,878-hectare property, almost adjacent to the 68,735-hectare Meadowbank property. Development of the Amaruq property was approved in February 2017 by the Company's Board of Directors as a satellite deposit to supply ore to the existing Meadowbank mill, pending the receipt of the required permits. The Amaruq project was included in a National Instrument 43-101 Standards of Disclosure for Mineral Projects ("NI 43-101") technical report about the Meadowbank Complex, posted on SEDAR on March 22, 2018.
Meadowbank Mine - Operating StatisticsThree Months Ended Three Months Ended
March 31, 2018 March 31, 2017Tonnes of ore milled (thousands of tonnes) 830 926 Tonnes of ore milled per day 9,227 10,287 Gold grade (g/t) 2.53 3.11 Gold production (ounces) 61,447 85,370 Production costs per tonne (C$) 94$ 77$ Minesite costs per tonne (C$) 88$ 74$ Production costs per ounce of gold produced ($ per ounce): 1,001$ 632$ Total cash costs per ounce of gold produced ($ per ounce): 923$ 590$

21
The initial mining plan at Amaruq contemplates production of approximately 2.1 million ounces of gold between 2019 and 2024, leaving approximately 60% of the current mineral reserve and mineral resource base uncovered by the mine plan. Pre-mining activities are expected to start in 2018 at the Whale Tail deposit, which is a satellite pit that will produce ore to feed the Meadowbank mill. Production is currently forecast to begin in the third quarter of 2019 (with approximately four to five months of production in 2019). Production in 2019 is expected to be between 135,000 and 190,000 ounces, with a mid-point of 162,500 ounces. In 2020, production is expected to be between 260,000 and 270,000 ounces, with a mid-point of 265,000 ounces. The Company continues to investigate additional opportunities to optimize the mine plan at Amaruq. On March 15, 2018, the project certificate for the development and operation of the Whale Tail pit was received from the Nunavut Impact Review Board. Permitting activities are ongoing with the Nunavut Water Board and the Department of Fisheries and Oceans to finalize the Whale Tail Water License A and the authorization for work in aquatic habitat. The Company expects that the final approvals for the Whale Tail project will be received in the second quarter of 2018 and construction activities are projected to start in the third quarter. Continued Focus on Site Development Activities, Installation of the Underground Exploration Ramp and Deep Exploration in the First Quarter of 2018 During the first quarter of 2018, Amaruq site activities focused on:
• Underground ramp development, which advanced by 128 metres • Detailed engineering studies for Whale Tail infrastructure (52% complete) • Long haul truck fleet purchases secured for 2018 and 2019 • Procurement of key items for the 2018 barge season • Expansion of the temporary camp facility and construction of an underground
maintenance shop • Approval for the expansion of the exploration road to a production haulage road –
work began in April 2018 The first round of the underground exploration ramp was blasted in early January 2018, and at March 31, 2018, the ramp had advanced by 128 lateral metres to 29 metres vertical depth. For the full year 2018, approximately 1.2 kilometres of underground development is planned at a cost of $21 million, which will be expensed and not included in capital costs. The main purpose of building the ramp is to carry out additional exploration drilling and evaluate the potential for underground mining activities at both the Whale Tail and V zones. During the first quarter, 108 definition drill holes totaling 9,179 metres were completed to infill the first few benches of the open pit in preparation of the first year production. The Amaruq project remains on budget with capital expenditures in 2018 forecast to be approximately $175 million.
22
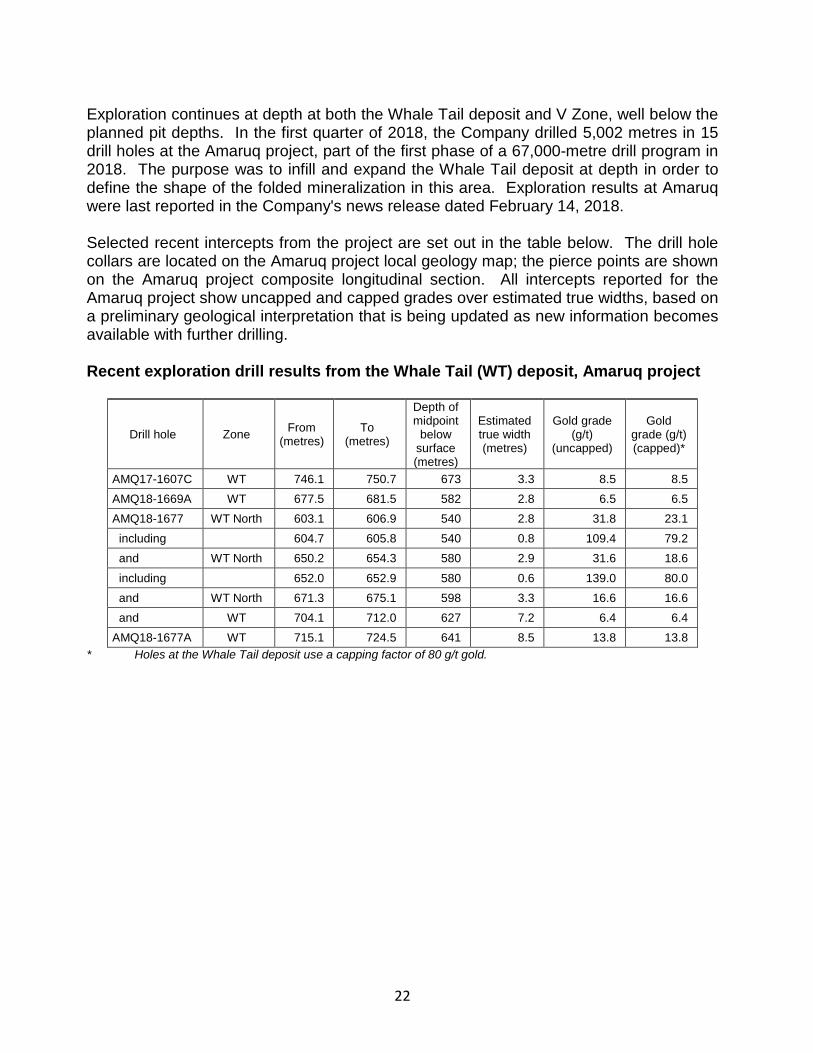
Exploration continues at depth at both the Whale Tail deposit and V Zone, well below the planned pit depths. In the first quarter of 2018, the Company drilled 5,002 metres in 15 drill holes at the Amaruq project, part of the first phase of a 67,000-metre drill program in 2018. The purpose was to infill and expand the Whale Tail deposit at depth in order to define the shape of the folded mineralization in this area. Exploration results at Amaruq were last reported in the Company's news release dated February 14, 2018. Selected recent intercepts from the project are set out in the table below. The drill hole collars are located on the Amaruq project local geology map; the pierce points are shown on the Amaruq project composite longitudinal section. All intercepts reported for the Amaruq project show uncapped and capped grades over estimated true widths, based on a preliminary geological interpretation that is being updated as new information becomes available with further drilling. Recent exploration drill results from the Whale Tail (WT) deposit, Amaruq project
Drill hole Zone From (metres)
To (metres)
Depth of midpoint
below surface (metres)
Estimated true width (metres)
Gold grade (g/t)
(uncapped)
Gold grade (g/t) (capped)*
AMQ17-1607C WT 746.1 750.7 673 3.3 8.5 8.5 AMQ18-1669A WT 677.5 681.5 582 2.8 6.5 6.5 AMQ18-1677 WT North 603.1 606.9 540 2.8 31.8 23.1 including 604.7 605.8 540 0.8 109.4 79.2 and WT North 650.2 654.3 580 2.9 31.6 18.6
including 652.0 652.9 580 0.6 139.0 80.0 and WT North 671.3 675.1 598 3.3 16.6 16.6 and WT 704.1 712.0 627 7.2 6.4 6.4 AMQ18-1677A WT 715.1 724.5 641 8.5 13.8 13.8
* Holes at the Whale Tail deposit use a capping factor of 80 g/t gold.

23
[Amaruq Project Local Geology Map]
[Amaruq Project Composite Longitudinal Section]
The Whale Tail deposit has been defined over at least 2.3 kilometres of strike length and extends from surface to 915 metres depth.

24
Hole AMQ18-1677 is a significant recent deep hole that had multiple intercepts, including some narrow, very high grades between 540 and 627 metres depth. The first three intercepts were in quartz veins in ultramafic host rocks, in a parallel structure approximately 50 metres north of the iron formation that hosts the main Whale Tail mineralized zone, and included 23.1 g/t gold over 2.8 metres at 540 metres depth, 18.6 g/t gold over 2.9 metres at 580 metres depth and 16.6 g/t gold over 3.3 metres at 598 metres depth. A lower intercept from the same drill hole – 6.4 g/t gold over 7.2 metres at 627 metres depth – was in the main Whale Tail mineralized unit. The parallel structure to the north of the main iron formation has the potential to improve the economics of the underground portion of the Whale Tail deposit. It will continue to be investigated while testing Whale Tail at depth. A branch from the same hole, numbered AMQ18-1677A, intersected 13.8 g/t gold over 8.5 metres at 641 metres depth. This intercept confirms the width of the model at this location within the mineral resources but at a grade higher than anticipated. Two new intercepts have encountered mineralization west of the current underground mineral resources, which is one of the goals of the 2018 exploration drill program. Hole AMQ18-1669A intersected 6.5 g/t gold over 2.8 metres at 582 metres depth, while AMQ17-1607C intersected 8.5 g/t gold over 3.3 metres at 673 metres depth. These intercepts extend the main Whale Tail mineralized unit to the west by approximately 130 metres from the current mineral resources, below 580 metres depth. The Whale Tail deposit remains open at depth and along strike. The drill program for the remainder of 2018 will continue to test the Whale Tail deposit and the parallel structure to its north at depth, to expand the mineral resources and continue to convert inferred to indicated mineral resources. Drilling has also resumed in the V Zone to test its depth and lateral extent. Meliadine Project - Mine Development and Construction Schedule Progressing on Plan and on Budget Located near Rankin Inlet, Nunavut, Canada, the Meliadine project was acquired in July 2010, and is Agnico Eagle's largest gold deposit in terms of mineral resources. The Company owns 100% of the 111,757 hectare property. In February 2017, the Company's Board of Directors approved the construction of the Meliadine project. The mine was initially forecast to begin operations in the third quarter of 2019. However, given the progress of construction and development activities in 2017 and through the first quarter of 2018, the Company announced in February 2018 that the Meliadine project is expected to begin operations in the second quarter of 2019. The forecast parameters surrounding the Company's proposed Meliadine operations were based on a preliminary economic assessment, which is preliminary in nature and includes inferred mineral resources that are too speculative geologically to have economic considerations applied to them that would enable them to be categorized as mineral reserves and there is no certainty that the forecast production amounts will be realized.

25
The basis for the preliminary economic assessment and the qualifications and assumptions made by the qualified person who undertook the preliminary economic assessment are set out in this news release and the Company's news release dated February 15, 2017. The results of the preliminary economic assessment had no impact on the results of any pre-feasibility or feasibility study in respect of Meliadine. Expected gold production for 2019 is estimated to be approximately 170,000 ounces. In 2020, expected production is approximately 385,000 ounces of gold. The Company is evaluating potential opportunities to increase production in 2019. At December 31, 2017, the Meliadine property was estimated to contain proven and probable mineral reserves of 3.7 million ounces of gold (16.0 million tonnes grading 7.12 g/t gold), indicated mineral resources of 3.1 million ounces of gold (25.3 million tonnes grading 3.77 g/t gold) and inferred mineral resources of 2.7 million ounces of gold (13.8 million tonnes grading 6.04 g/t gold). In addition, there are numerous other known gold occurrences along the 80-kilometre-long greenstone belt that require further evaluation. For additional technical details on the project see the Company's news release dated February 15, 2017. 2018 Activities and Additional Opportunities to Create Value at Meliadine The Meliadine project remains on budget with capital expenditures in 2018 forecast to be approximately $398 million. The 2019 project capital forecast is unchanged at approximately $130 million. Recent development/construction highlights include:
• Mechanical/Piping/Electrical/Instrumentation (MPEI) is progressing as planned for both the process plant and power plant; limited mechanical equipment will be airlifted ahead of the barge season to continue to advance the construction schedule
• Commissioning of the process plant is expected to begin in the first quarter of 2019 • The generators for the power plant are expected to be delivered to the site on the
first sealift of 2018 in June • The multiservice building (office, warehouse, maintenance) will be fully functional in
the second quarter of 2018 • Civil work for the paste and crusher plant are underway and will be ready for
construction in the second quarter of 2018 • The SAG mill components are on site and installation began in April 2018 • In the first quarter of 2018, approximately 2,118 metres of lateral underground
development was completed, which was slightly ahead of budget • In the first quarter of 2018, approximately 5,500 metres of underground delineation
drilling had been completed, which is in line with the budget. As a result, 90% of the stopes that will be developed in 2018 have been delineated. The delineation of 2019 stopes is progressing well
• Results from the delineation drilling have generally been in line with the block model

26
• The remaining procurement packages have now been awarded, with follow up for delivery on the 2018 sealift
The Company believes that there are numerous opportunities to create additional value at Meliadine, both at the mine and on the large land package. These include:
• Optimization of the current mine plan (advance Phase 2 pit implementation) • Potential to optimize labour costs once the mine is in operation (via improved use
of telecommunications) • Minesite exploration upside through mineral resource conversion and expansion of
known ore zones (most zones are open below a vertical depth of 450 metres) • Potential for the discovery of new deposits along the 80 kilometre-long greenstone
belt FINLAND AND SWEDEN Agnico Eagle's Kittila mine in Finland is the largest primary gold producer in Europe and hosts the Company's largest mineral reserves. Exploration activities continue to expand the mineral reserves and mineral resources and the Company has approved an expansion to add an underground shaft and increase expected mill throughput by 25 percent to 2.0 million tonnes per annum ("mtpa"). In Sweden, the Company has a 55% interest in the Barsele exploration project. Kittila – Higher Throughout Partially Offsets Lower Grades and Recoveries The 100% owned Kittila mine in northern Finland achieved commercial production in 2009.
Production costs per tonne in the first quarter of 2018 decreased when compared to the prior-year period due to higher throughput levels. Production costs per ounce in the first quarter of 2018 increased when compared to the prior-year period due to the strengthening of the Euro relative to the U.S. dollar between periods and lower production. Minesite costs per tonne in the first quarter of 2018 were essentially the same when compared to the prior-year period. Total cash costs per ounce in the first quarter of 2018 increased when compared to the prior-year period due to the strengthening of the Euro relative to the U.S. dollar between periods and lower production.
Kittila Mine - Operating StatisticsThree Months Ended Three Months Ended
March 31, 2018 March 31, 2017Tonnes of ore milled (thousands of tonnes) 468 423 Tonnes of ore milled per day 5,204 4,697 Gold grade (g/t) 3.77 4.29 Gold production (ounces) 48,118 51,621 Production costs per tonne (EUR) 75€ 78€ Minesite costs per tonne (EUR) 74€ 75€ Production costs per ounce of gold produced ($ per ounce): 888$ 696$ Total cash costs per ounce of gold produced ($ per ounce): 882$ 668$

27
Gold production in the first quarter of 2018 decreased when compared to the prior-year period due to lower grades and recoveries. In addition, a 10-day planned maintenance shutdown at the mill took place in April 2018. This shutdown was factored into the 2018 guidance. In February 2018, the Company's Board of Directors approved an expansion to increase throughput rates at Kittila to 2.0 mtpa from the current rate of 1.6 mtpa. This expansion includes the construction of a 1,044 metre deep shaft, a processing plant expansion as well as other infrastructure and service upgrades. This expansion project is expected to increase the efficiency of the mine and decrease or maintain current operating costs while providing access to the deeper mining horizons. In addition, the shaft is expected to provide access to the mineral resources located below 1,150 metres, where recent exploration programs have shown promising results. This expansion project remains on schedule and exploration drilling is ongoing to expand and infill the mineral reserve and mineral resource base at depth. SOUTHERN BUSINESS REVIEW Agnico Eagle's Southern Business operations are focused in Mexico. These operations have been a source of growing precious metals production (gold and silver), stable operating costs and strong free cash flow since 2009. Pinos Altos – Advancement of Satellite Deposits is a Key Focus in 2018 The 100% owned Pinos Altos mine in northern Mexico achieved commercial production in November 2009.
Production costs per tonne in the first quarter of 2018 increased when compared to the prior-year period due to lower throughput, higher costs associated with underground mining and the timing of unsold inventory. Production costs per ounce in the first quarter of 2018 increased when compared to the prior-year period due to lower gold production, the strengthening of the Mexican peso relative to the U.S. dollar between periods and the reasons described above. Minesite costs per tonne in the first quarter of 2018 increased when compared to the prior-year period due to the reasons described above. Total cash costs per ounce in the first quarter of 2018 increased when compared to the prior-year period due to lower gold
Pinos Altos Mine - Operating StatisticsThree Months Ended Three Months Ended
March 31, 2018 March 31, 2017Tonnes of ore processed (thousands of tonnes) 519 553 Tonnes of ore processed per day 5,770 6,149 Gold grade (g/t) 2.62 2.71 Gold production (ounces) 41,836 45,360 Production costs per tonne 67$ 43$ Minesite costs per tonne 61$ 48$ Production costs per ounce of gold produced ($ per ounce): 829$ 523$ Total cash costs per ounce of gold produced ($ per ounce): 539$ 358$

28
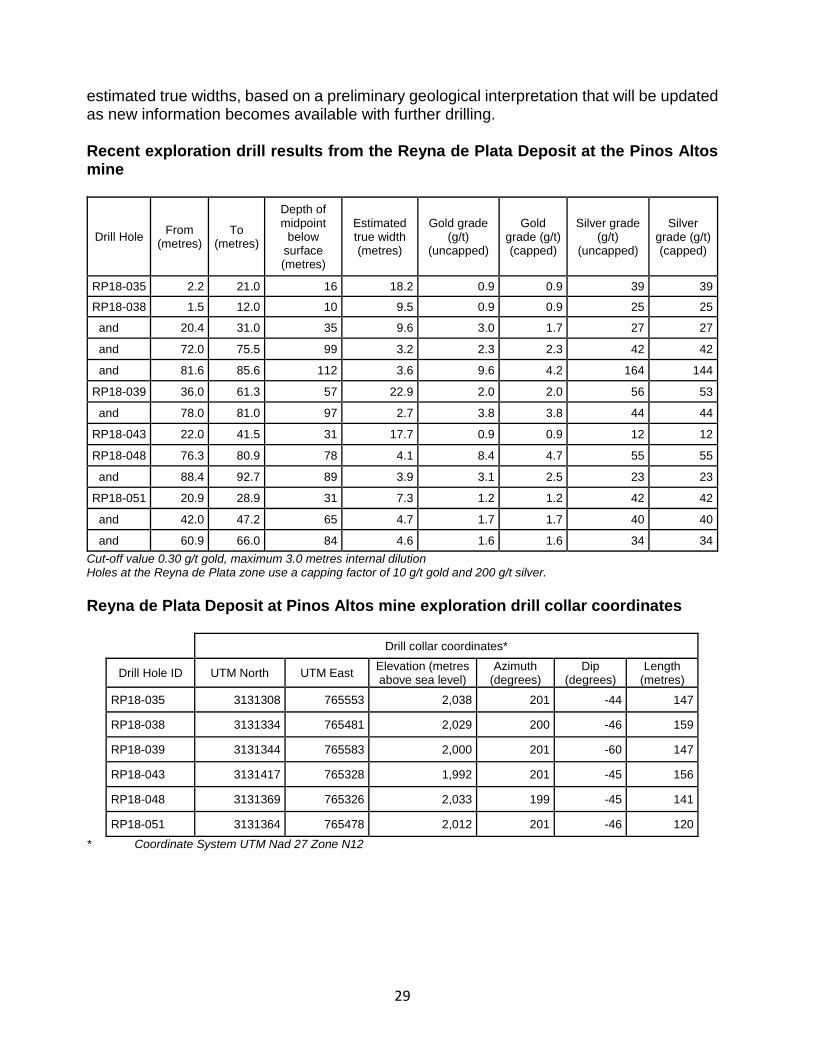
production, slightly lower by-product revenue, the strengthening of the Mexican peso relative to the U.S. dollar between periods and the reasons described above. Gold production in the first quarter of 2018 decreased when compared to the prior-year period due to lower throughput and lower grades, however, throughput and grades are expected to improve over the balance of 2018 with resulting lower unit costs. In 2018, Pinos Altos is transitioning into a predominantly underground mining operation, with associated higher costs, and limited open pit production. The development of satellite deposits provides an opportunity to lower unit costs by filling available capacity at the processing and heap leaching facility. Optimization opportunities are being studied to reduce unit costs During the first quarter of 2018, construction was completed on the Phase IV heap leach pad and ore stacking commenced. This pad will receive the remaining open pit ore being mined at Pinos Altos in 2018 and will have the capacity to process heap leach ore from other sources. A key focus in the first quarter of 2018 was on the continued advancement of the Sinter and Cubiro satellite deposits at Pinos Altos. The Sinter deposit will be mined from underground and a small open pit. At Sinter, tree clearing has been completed and permits have been received for open pit mining and underground ramp development. Construction of the portal and underground development activities are expected to begin in the second quarter of 2018, with initial production from Sinter expected to commence in the fourth quarter of this year. The Cubiro deposit is an underground exploration opportunity, located immediately west of the Creston Mascota mine, which is envisioned to potentially produce high grade ore that will be trucked to the Pinos Altos processing facilities as early as in 2022. The access road is under construction with completion expected in July 2018. Portal and ramp development will be initiated once the access road is completed and 420 metres of underground development is planned for the fourth quarter of 2018. Underground exploration and delineation are expected to commence in early 2019. Exploration in the First Quarter of 2018 Focused on Reyna de Plata Deposit The Reyna de Plata deposit is an opportunity for another satellite source of ore on the Pinos Altos property, approximately 1,200 metres north of the Oberon de Weber pit. Exploration permits were received for the Reyna de Plata deposit in the fourth quarter of 2017, and a 5,000-metre drill program commenced in mid-January 2018. In the first quarter of 2018, exploration included 3,450 metres of infill drilling focused on converting inferred to indicated mineral resources within the current resources pit model. Selected recent drill results and drill hole collar coordinates are set out in the tables below. The collars are also located on the Pinos Altos Local Geology Map. All intercepts reported for the Reyna de Plata Zone show uncapped and capped gold and silver grades over
29
estimated true widths, based on a preliminary geological interpretation that will be updated as new information becomes available with further drilling. Recent exploration drill results from the Reyna de Plata Deposit at the Pinos Altos mine
Drill Hole From (metres)
To (metres)
Depth of midpoint
below surface (metres)
Estimated true width (metres)
Gold grade (g/t)
(uncapped)
Gold grade (g/t) (capped)
Silver grade (g/t)
(uncapped)
Silver grade (g/t) (capped)
RP18-035 2.2 21.0 16 18.2 0.9 0.9 39 39
RP18-038 1.5 12.0 10 9.5 0.9 0.9 25 25
and 20.4 31.0 35 9.6 3.0 1.7 27 27
and 72.0 75.5 99 3.2 2.3 2.3 42 42
and 81.6 85.6 112 3.6 9.6 4.2 164 144
RP18-039 36.0 61.3 57 22.9 2.0 2.0 56 53
and 78.0 81.0 97 2.7 3.8 3.8 44 44
RP18-043 22.0 41.5 31 17.7 0.9 0.9 12 12
RP18-048 76.3 80.9 78 4.1 8.4 4.7 55 55
and 88.4 92.7 89 3.9 3.1 2.5 23 23
RP18-051 20.9 28.9 31 7.3 1.2 1.2 42 42
and 42.0 47.2 65 4.7 1.7 1.7 40 40
and 60.9 66.0 84 4.6 1.6 1.6 34 34 Cut-off value 0.30 g/t gold, maximum 3.0 metres internal dilution Holes at the Reyna de Plata zone use a capping factor of 10 g/t gold and 200 g/t silver. Reyna de Plata Deposit at Pinos Altos mine exploration drill collar coordinates
Drill collar coordinates*
Drill Hole ID UTM North UTM East Elevation (metres above sea level)
Azimuth (degrees)
Dip (degrees)
Length (metres)
RP18-035 3131308 765553 2,038 201 -44 147
RP18-038 3131334 765481 2,029 200 -46 159
RP18-039 3131344 765583 2,000 201 -60 147
RP18-043 3131417 765328 1,992 201 -45 156
RP18-048 3131369 765326 2,033 199 -45 141
RP18-051 3131364 765478 2,012 201 -46 120 * Coordinate System UTM Nad 27 Zone N12

30
[Pinos Altos Local Geology Map]
The geological focus of the Pinos Altos property is a horst structure – which is an uplifted block of rocks – at least 10 kilometers long by 3 kilometers wide, defined by the Reyna de Plata Fault to the north and the Santo Niño Fault to the south. The Reyna de Plata deposit hosts inferred mineral resources of 110,000 ounces gold and 3.9 million ounces silver (5.8 million tonnes grading 0.59 g/t gold and 21.14 g/t silver) at open pit depth, as well as 93,000 ounces gold and 1.4 million ounces silver (1.2 million tonnes grading 2.35 g/t gold and 35.11 g/t silver) at underground depth. These inferred mineral resources formed part of the total Pinos Altos mineral resources estimate as of December 31, 2017. The Reyna de Plata deposit lies along the Reyna de Plata Fault, as does the Sinter Zone 1,740 metres to the northwest. The Reyna de Plata deposit consists of low-sulphidation epithermal vein-style mineralization over a 2.5-kilometre strike length in an east-west direction. The gold and silver mineralization is accompanied by green-clear-white quartz and calcite in veins, stockwork and breccia. Recent drilling has yielded significant shallow intervals such as hole RP18-038 that intersected multiple mineralized intervals, including 1.7 g/t gold and 27 g/t silver over 9.6 metres at 35 metres depth and 4.2 g/t gold and 144 g/t silver over 3.6 metres at 112 metres depth. Approximately 100 metres to the east, hole RP18-039 intersected 2.0 g/t gold and 53 g/t silver over 22.9 metres at 57 metres depth and 3.8 g/t gold and 44 g/t silver over 2.7 metres at 97 metres depth. Approximately 270 metres to the northwest of the latter hole, hole RP18-043 intersected 0.9 g/t gold and 12 g/t silver over 17.7 metres at 31 metres depth. The results of this program are expected to increase the mineral resources and allow for the conversion to indicated mineral resources at Reyna de Plata in the year-end mineral resources estimate.

31
Different mining options are currently being studied for the potential exploitation of the deposit. Creston Mascota – Mining Transitions to Bravo Deposit; Drilling Continues to Extend Mineralization at Madrono The 100% owned Creston Mascota open pit heap leach, located less than 7 kilometres from Pinos Altos, has been operating since late 2010.
Production costs per tonne in the first quarter of 2018 increased when compared to the prior-year period due to fewer tonnes processed, higher contractor and maintenance costs and the timing of unsold inventory. Production costs per ounce in the first quarter of 2018 increased when compared to the prior-year period due to the strengthening of the Mexican peso relative to the U.S. dollar between periods and the reasons described above. Minesite costs per tonne in the first quarter of 2018 increased when compared to the prior-year period due to the reasons described above. Total cash costs per ounce in the first quarter of 2018 increased when compared to the prior-year period due to the strengthening of the Mexican peso relative to the U.S. dollar between periods and reasons described above. Gold production in the first quarter of 2018 increased when compared to the prior-year period due to optimizations made to the leaching process, which resulted in faster initial recoveries from on-pad inventories when compared to the prior-year period. Silver recoveries also improved in the current period largely due to a finer crush size. In 2018, the Creston Mascota pit will be transitioning to the Bravo pit, located immediately to the south. Higher costs are expected due to longer hauling distances and higher stripping volumes. Optimization opportunities are being studied to reduce unit costs. The development of satellite deposits provide an opportunity to extend mine life at the Creston Mascota heap leaching facility. During the first quarter of 2018, work continued on the access road to the Bravo deposit (92% completed) and a new waste rock storage site has been located closer to the deposit, which is expected to reduce waste haulage costs. Initial mining activities have commenced at Bravo and it is expected to be the primary ore source at Creston Mascota for approximately the next two years.
Creston Mascota deposit at Pinos Altos - Operating StatisticsThree Months Ended Three Months Ended
March 31, 2018 March 31, 2017Tonnes of ore processed (thousands of tonnes) 475 524 Tonnes of ore processed per day 5,273 5,817 Gold grade (g/t) 0.67 1.16 Gold production (ounces) 11,988 11,244 Production costs per tonne 20$ 13$ Minesite costs per tonne 22$ 13$ Production costs per ounce of gold produced ($ per ounce): 805$ 621$ Total cash costs per ounce of gold produced ($ per ounce): 738$ 525$

32
Soil removal at the Phase V heap leach pad was completed in March 2018, and the new pad is expected to be in operation in the third quarter of 2018. Drilling Continues to Expand Mineralized Zones at Madrono Exploration at the high-grade Madrono Zone, immediately southeast of the Creston Mascota pit, began in early 2016, and to the end of 2017 a total of 33,045 metres (162 holes) had been drilled on the zone. The initial indicated mineral resources at the Madrono zone are 56,000 ounces gold and 863,000 ounces silver (858,000 tonnes grading 2.03 g/t gold and 31.26 g/t silver), all at underground depth. The Madrono zone also has inferred mineral resources of 144,000 ounces gold and 2.6 million ounces silver (1,941,000 tonnes grading 2.31 g/t gold and 40.97 g/t silver), all at underground depth. The Madrono zone’s mineral resources formed part of the total Pinos Altos mineral resources estimate as of December 31, 2017. Drilling in the first quarter of 2018 totalled 5,073 metres of infill and exploration drilling in 24 holes. The Madrono zone is a potential satellite mining opportunity to provide mill feed to extend the mine life at Pinos Altos. Drilling results for Madrono were last reported in the Company's news release dated February 14, 2018. Selected recent drill results from the Madrono Zone and drill hole collar coordinates are set out in the tables below. The collars are also located on the Pinos Altos Local Geology Map. All intercepts reported for the Madrono Zone show uncapped and capped gold and silver grades over estimated true widths, based on a preliminary geological interpretation that will be updated as new information becomes available with further drilling. Recent exploration drill results from the Madrono Zone at the Creston Mascota mine
Drill Hole From (metres)
To (metres)
Depth of midpoint
below surface (metres)
Estimated true width (metres)
Gold grade (g/t)
(uncapped)
Gold grade (g/t) (capped)
Silver grade (g/t) (uncapped)
Silver grade (g/t) (capped)
MAD17-128 144.0 149.0 173 4.3 4.3 3.5 41 41
MAD17-131 73.0 78.0 72 4.3 1.6 1.5 20 20
and 102.0 108.5 96 5.6 2.0 2.0 39 39
MAD18-133 109.4 117.4 128 7.7 1.7 1.7 22 22
including 109.4 110.3 124 0.9 7.8 7.8 65 65
and 130.7 135.0 148 4.2 1.3 1.3 46 46
and 144.5 148.8 161 4.1 1.8 1.8 14 14
MAD18-134 121.8 130.5 118 7.5 5.1 2.0 28 28
including 125.4 126.9 121 1.3 27.2 10.0 111 111
MAD18-135 115.0 123.3 126 7.8 1.4 1.4 27 27
and 127.0 133.3 136 6.0 3.2 1.8 52 46

33
Drill Hole From (metres)
To (metres)
Depth of midpoint
below surface (metres)
Estimated true width (metres)
Gold grade (g/t)
(uncapped)
Gold grade (g/t) (capped)
Silver grade (g/t) (uncapped)
Silver grade (g/t) (capped)
and 135.0 142.5 144 7.1 1.1 1.1 22 22
MAD18-136 125.8 142.6 145 16.2 3.2 2.2 47 47
Including 134.0 135.5 147 1.5 21.3 10.0 133 133
MAD18-148 35.7 42.6 23 6.7 3.4 3.1 38 38 Cut-off value 0.30 g/t gold, maximum 3.0 metres internal dilution Holes at the Madrono Zone use a capping factor of 10 g/t gold and 200 g/t silver. Madrono Zone at Creston Mascota mine exploration drill collar coordinates
Drill collar coordinates*
Drill Hole ID UTM North UTM East Elevation
(metres above sea level)
Azimuth (degrees) Dip (degrees) Length
(metres)
MAD17-128 3134755 761703 2,080 050 -53 252
MAD17-131 3134919 761662 2,134 359 -45 351
MAD18-133 3134882 761698 2,124 052 -45 207
MAD18-134 3134904 761639 2,118 000 -45 348
MAD18-135 3134727 761760 2,124 051 -46 237
MAD18-136 3134826 761701 2,106 051 -45 192
MAD18-148 3135002 761643 2,154 011 -45 180
* Coordinate System UTM Nad 27 Zone [Pinos Altos Local Geology Map] Recent results at Madrono are encouraging for the potential of a broad area of mineralization at the junction of the Madrono and Santa Martha veins. Intercepts in this area include hole MAD18-133 that intersected 1.7 g/t gold and 22 g/t silver over 7.7 metres at 128 metres depth. Sixty metres to the northwest, hole MAD18-134 intersected 2.0 g/t gold and 28 g/t silver over 7.5 metres at 118 metres depth. Also nearby is hole MAD18-136 that intersected 2.2 g/t gold and 47 g/t silver over 16.2 metres at 145 metres depth. These intercepts indicate the presence of an ore shoot plunging to the southwest with potential to grow at depth and laterally. The Madrono Zone continues to be open at depth. Mineral resources are expected to be updated at the end of this year considering various mining scenarios. La India – Modifications to Heap Leach Process Expected to Improve Gold Production The 100% owned La India mine in Sonora, Mexico, located approximately 70 kilometres from the Company's Pinos Altos mine, achieved commercial production in February 2014.

34
Production costs per tonne in the first quarter of 2018 were the same when compared to the prior-year period. Production costs per ounce in the first quarter of 2018 increased when compared to the prior-year period due to lower gold production and the strengthening of the Mexican peso relative to the U.S. dollar between periods. Minesite costs per tonne in the first quarter of 2018 were essentially the same when compared to the prior-year period. Total cash costs per ounce in the first quarter of 2018 increased when compared to the prior-year period due to lower gold production, lower by-product revenue and the strengthening of the Mexican peso relative to the U.S. dollar between periods. Gold production in the first quarter of 2018 decreased when compared to the prior-year period due to lower recoveries. In 2017, La India transitioned to mining the Main Zone by open pit. This zone has slower recoveries than the North Zone, which are being addressed with an optimization strategy to improve production and costs. The development of satellite deposits also provides an opportunity to extend mine life. In the first quarter of 2018, several small modifications that are part of a broader optimization plan were completed to the La India heap leach process to improve gold production. Improvements included:
• At the absorption, desorption and refining ("ADR") plant, two additional carbon columns were installed and commissioned in mid-March with positive results
• An additional carbon regeneration kiln has also been ordered with commissioning expected by June 2018
• At the heap leach pad, ore stacking and irrigation plans have been optimized, which is expected to provide more effective leaching dynamics
La India Exploration Focused on Extending Near-Pit Mineralization and Other Near-Mine Targets During the first quarter of 2018, exploration drilling was predominately focused in the El Realito area to evaluate the potential to increase mineral resources in close proximity to the current mining areas. Drilling was also carried out on the Los Tubos Zone to explore
La India Mine - Operating StatisticsThree Months Ended Three Months Ended
March 31, 2018 March 31, 2017Tonnes of ore processed (thousands of tonnes) 1,695 1,402 Tonnes of ore processed per day 18,838 15,575 Gold grade (g/t) 0.74 0.74 Gold production (ounces) 23,055 26,296 Production costs per tonne 9$ 9$ Minesite costs per tonne 9$ 10$ Production costs per ounce of gold produced ($ per ounce): 668$ 499$ Total cash costs per ounce of gold produced ($ per ounce): 668$ 438$

35
northeast- and northwest-trending mineralized structures. Drilling results for the La India property were last reported in the Company's news release dated February 14, 2018. Mine-site exploration at the La India property in the first quarter of 2018 included 2,665 metres (22 holes) at Los Tubos and 4,168 metres (27 holes) at El Realito, totalling 6,833 metres of the 25,000-metre budget in 2018. In addition, the regional exploration at the La India property in the first quarter of 2018 included mapping and surface sampling at Chipriona as well as metallurgical testing. Exploration and definition drilling of the Chipriona structure will resume in May. Selected recent drill results from the La India property and the drill hole collar coordinates are set out in the tables below. The collars are located on the La India Area Property and Location Map. The intercepts reported for the La India property show uncapped and capped gold and silver grades over estimated true widths, based on a preliminary geological interpretation that will be updated as new information becomes available with further drilling. The gold and silver grades for the Chipriona regional target are not capped as the project is at too early a stage to determine capping values. Additional drilling is planned in the El Realito, Los Tubos, El Cochi, Main Zone, Chipriona and Tarachi areas over the remainder of 2018. Recent exploration drill results from the La India property
Drill Hole Vein From (metres)
To (metres)
Depth of midpoint
below surface (metres)
Estimated true width (metres)
Gold grade (g/t)
(uncapped)
Gold grade (g/t)
(capped)
Silver grade (g/t)
(uncapped)
Silver grade (g/t)
(capped)
INER18-125 El Realito 74.5 79.0 86 3.3 1.6 1.6 21 21 and El Realito 124.0 140.9 134 14.1 2.4 2.4 3 3 including 135.0 139.0 137 3.2 6.8 6.8 5 5 INER18-139 El Realito 82.0 90.1 56 7.2 3.4 3.1 15 15 CHP17-010 Chipriona 25.5 44.5 25 14.3 0.5 - 15 - including 33.0 38.0 25 3.8 1.1 - 32 - CHP17-012 Chipriona 0.0 24.0 10 18.0 0.6 - 216 - including 17.0 22.3 19 4.0 1.5 - 813 - CHP17-013 Chipriona 96.0 107.0 103 8.3 0.9 - 407 - CHP17-014 Chipriona 67.0 95.0 68 21.0 0.5 - 18 - including 67.0 74.0 59 5.3 0.8 - 30 - CHP17-016 Chipriona 14.0 24.0 20 7.5 0.6 - 82 - CHP17-019 Chipriona 0.0 78.0 38 58.5 0.6 - 21 - including 19.0 27.0 23 6.0 1.8 - 70 - CHP17-021 Chipriona 45.8 49.8 22 3.0 0.6 - 137 - and Chipriona 125.0 159.5 114 24.6 0.5 - 60 - including 145.0 151.0 117 4.5 0.7 - 137 - CHP17-024 Chipriona 242.0 264.0 214 16.5 2.3 - 24 - including 250.0 256.0 212 4.5 7.5 - 20 -

36
Drill Hole Vein From (metres)
To (metres)
Depth of midpoint
below surface (metres)
Estimated true width (metres)
Gold grade (g/t)
(uncapped)
Gold grade (g/t)
(capped)
Silver grade (g/t)
(uncapped)
Silver grade (g/t)
(capped)
CHP17-026 Chipriona 18.3 32.0 11 10.3 1.0 - 9 - CHP17-027 Chipriona 12.0 57.4 22 33.0 0.4 - 120 - including 47.0 52.5 35 3.1 1.0 - 684 - CHP17-028 Chipriona 57.0 61.5 27 3.4 0.2 - 269 - and Chipriona 122.5 127.0 48 3.4 4.1 - 66 - and Chipriona 182.8 188.0 80 3.9 1.2 - 21 - and Chipriona 314.5 320.0 127 4.1 1.2 - 57 - CHP17-035 Chipriona 1.5 76.6 37 56.3 0.9 - 34 - including 23.0 61.5 40 28.9 1.4 - 40 - CHP17-036 Chipriona 0.0 37.5 20 28.1 0.7 - 170 - including 0.0 10.1 5 7.6 1.8 - 370 -
Holes at the La India property, including the El Realito Zone, use a capping factor of 10 g/t gold and 200 g/t silver. Holes at the Chipriona regional target report uncapped gold and silver grades. La India property exploration drill hole collar coordinates
Drill Hole Collar Coordinates*
Drill Hole ID UTM North UTM East
Elevation (metres
above sea level)
Azimuth (degrees)
Dip (degrees)
Length (metres)
INER18-125 3177900 708838 2,000 270 -75 180
INER18-139 3178363 709102 2,031 315 -60 135 CHP17-010 3180458 706983 1,502 045 -55 183
CHP17-012 3180561 706779 1,543 225 -45 222
CHP17-013 3180607 706627 1,567 045 -45 369
CHP17-014 3180793 706316 1,553 225 -45 222
CHP17-016 3180721 706617 1,609 225 -45 228
CHP17-019 3180420 707007 1,519 045 -45 180
CHP17-021 3180856 706627 1,633 225 -45 270
CHP17-024 3180602 706907 1,505 225 -45 291
CHP17-026 3180480 707247 1,611 225 -45 171
CHP17-027 3180696 706363 1,570 225 -45 170
CHP17-028 3180414 707307 1,617 225 -45 324
CHP17-035 3180325 707059 1,543 045 -45 162
CHP17-036 3181019 706470 1,558 225 -45 252 * Coordinate System UTM NAD27 Mexico 12 Zone

37
[La India Area Property and Location Map]
El Realito Zone; Encouraging results, Open to the Northeast and Southwest Exploration drilling is defining and extending the mineralization at the El Realito satellite project, which is approximately 1.5 kilometres east of the North and La India zones, to evaluate the potential to increase mineral resources in close proximity to the existing La India mining operations, with encouraging results. Initial indicated mineral resources have been declared at El Realito of 112,000 ounces gold and 642,000 ounces silver (5.0 million tonnes grading 0.70 g/t gold and 4.00 g/t silver); inferred mineral resources are 18,000 ounces gold and 97,000 ounces silver (1.4 million tonnes grading 0.40 g/t gold and 2.20 g/t silver). The mineral resources at El Realito formed part of the total mineral resources estimate for La India as of December 31, 2017. The El Realito mineralization is found in northeast-striking subvertical parallel structural corridors of breccia that appear to have acted as conduits, bringing gold and silver mineralization into the favourable subhorizontal volcanic rock layers (the lower porphyritic dacite). An infill drill program is underway at El Realito, with some holes being extended to explore areas outside the current mineral resources. An example of this is hole INER18-125 that intersected 1.6 g/t gold and 21 g/t silver over 3.3 metres at 86 metres depth, followed by 2.4 g/t gold and 3 g/t silver over 14.1 metres at 134 metres depth, including 6.8 g/t gold and 5 g/t silver over 3.2 metres. This hole extends both the subvertical and the subhorizontal mineralization approximately 50 metres to the southwest.

38
Approximately 600 metres to the northeast, hole INER18-139 intersected 3.1 g/t gold and 15 g/t silver over 7.2 metres at 56 metres depth. Previous mineralization encountered in this area grades lower than this and was mostly in subhorizontal layers, whereas this mineralization is thought to be related to the subvertical feeder zone. El Realito remains open to the northeast and southwest. Chipriona Zone; Indications of Sulphide Potential The Chipriona satellite target is located approximately one kilometre north of the North Zone at the La India mine. Agnico Eagle acquired its 100% interest in the Chipriona property in December 2016. Mineralization at Chipriona consists of what appears to be structurally controlled gold- and silver-rich veins, stringers and breccia with significant sulphide zinc, lead and copper content. Metallurgical testing will be conducted to determine the potential processing and cut-off grades for this type of mineralization. A diamond drill program on Chipriona began in the second quarter of 2017 and 8,582 metres (38 holes) were completed last year. Results of the initial holes were reported in the Company's news release dated September 5, 2017. Selected results from the remainder of the program are included in this new release. Initial results at Chipriona have been encouraging. Surface mapping and sampling have traced stacked structures within the Chipriona mineralized corridor that has a width ranging from tens of metres to a few hundred metres over a northwest strike length of at least 2,000 metres; 1,200 metres of this length has been confirmed through drill-testing. Mineralization has been intersected from surface to a depth of 214 metres. The project hosts a swarm of parallel and subparallel structural pathways that are favourable hosts for sulphide-based gold-silver mineralization with base metal credits. Significant mineralization has been intersected near surface over substantial widths; this suggests the potential for bulk mining lower-grade mineralization in stockwork zones that surround high-grade feeder zones. The gold and silver grades reported at Chipriona are uncapped. The strongest intercept to date at Chipriona is also the deepest. In the southeast part of the zone, hole CHP17-024 intersected 2.3 g/t gold and 24 g/t silver over 16.5 metres at 214 metres depth, including 7.5 g/t gold and 20 g/t silver over 4.5 metres. Close to surface in the same area, hole CHP17-012 intersected 0.6 g/t gold and 216 g/t silver over 18.0 metres at 10 metres depth, including 1.5 g/t gold and 813 g/t silver over 4.0 metres. Approximately 300 metres to the southeast, hole CHP17-035 intersected 0.9 g/t gold and 34 g/t silver over 56.3 metres at 37 metres depth, including 1.4 g/t gold and 40 g/t silver over 28.9 metres. In the same vicinity, hole CHP17-028 intersected 0.2 g/t gold and 269 g/t silver over 3.4 metres at 27 metres depth, as well as 4.1 g/t gold and 66 g/t silver over 3.4 metres at 48 metres depth. Approximately 1,000 metres to the northwest, hole CHP17-036 intersected 0.7 g/t gold and 170 g/t silver over 28 metres at 20 metres depth, including 1.8 g/t gold and 370 g/t silver over 7.6 metres.
39
The mineralized system remains open along strike, and shows significant potential at depth; parallel mineralized structures show Chipriona-like potential. Definition drilling is expected to start soon to look at opportunities for either bulk-mineable or high-grade areas in the known portion of the zone. Exploration drilling will test for extensions of the mineralized system. About Agnico Eagle Agnico Eagle is a senior Canadian gold mining company that has produced precious metals since 1957. Its eight mines are located in Canada, Finland and Mexico, with exploration and development activities in each of these countries as well as in the United States and Sweden. The Company and its shareholders have full exposure to gold prices due to its long-standing policy of no forward gold sales. Agnico Eagle has declared a cash dividend every year since 1983. Further Information For further information regarding Agnico Eagle, contact Investor Relations at [email protected] or call (416) 947-1212. Note Regarding Certain Measures of Performance This news release discloses certain measures, including "total cash costs per ounce", "all-in sustaining costs per ounce", "minesite costs per tonne" and "adjusted net income" that are not standardized measures under IFRS. These data may not be comparable to data reported by other issuers. For a reconciliation of these measures to the most directly comparable financial information reported in the consolidated financial statements prepared in accordance with IFRS, other than adjusted net income, see "Reconciliation of Non-GAAP Financial Performance Measures" below. The total cash costs per ounce of gold produced is reported on both a by-product basis (deducting by-product metal revenues from production costs) and co-product basis (before by-product metal revenues). The total cash costs per ounce of gold produced on a by-product basis is calculated by adjusting production costs as recorded in the consolidated statements of income for by-product revenues, unsold concentrate inventory production costs, smelting, refining and marketing charges and other adjustments, and then dividing by the number of ounces of gold produced. The total cash costs per ounce of gold produced on a co-product basis is calculated in the same manner as the total cash costs per ounce of gold produced on a by-product basis, except that no adjustment is made for by-product metal revenues. Accordingly, the calculation of total cash costs per ounce of gold produced on a co-product basis does not reflect a reduction in production costs or smelting, refining and marketing charges associated with the production and sale of by-product metals. The total cash costs per ounce of gold produced is intended to provide information about the cash-generating capabilities of the Company's mining operations. Management also uses this measure to monitor the performance of the Company's mining operations. As market prices for gold are quoted on a per ounce basis, using the total cash

40
costs per ounce of gold produced on a by-product basis measure allows management to assess a mine's cash-generating capabilities at various gold prices. The Company calculates all-in sustaining costs per ounce of gold produced on a by-product basis as the aggregate of total cash costs on a by-product basis, sustaining capital expenditures (including capitalized exploration), general and administrative expenses (including stock options) and reclamation expenses, and then dividing by the number of ounces of gold produced. The all-in sustaining costs per ounce of gold produced on a co-product basis is calculated in the same manner as the all-in sustaining costs per ounce of gold produced on a by-product basis, except that the total cash costs on a co-product basis are used, meaning no adjustment is made for by-product metal revenues. All-in sustaining costs per ounce is used to show the full cost of gold production from current operations. Management is aware that these per ounce measures of performance can be affected by fluctuations in foreign exchange rates and, in the case of total cash costs per ounce of gold produced on a by-product basis, by-product metal prices. Management compensates for these inherent limitations by using these measures in conjunction with minesite costs per tonne (discussed below) as well as other data prepared in accordance with IFRS. Minesite costs per tonne are calculated by adjusting production costs as recorded in the consolidated statements of income for unsold concentrate inventory production costs, and then dividing by tonnes of ore processed. As the total cash costs per ounce of gold produced can be affected by fluctuations in by-product metal prices and foreign exchange rates, management believes that minesite costs per tonne provides additional information regarding the performance of mining operations, eliminating the impact of varying production levels. Management also uses this measure to determine the economic viability of mining blocks. As each mining block is evaluated based on the net realizable value of each tonne mined, in order to be economically viable the estimated revenue on a per tonne basis must be in excess of the minesite costs per tonne. Management is aware that this per tonne measure of performance can be impacted by fluctuations in processing levels and compensates for this inherent limitation by using this measure in conjunction with production costs prepared in accordance with IFRS. Adjusted net income is calculated by adjusting the basic net income per share as recorded in the consolidated statements of income for foreign currency translation gains and losses, mark-to-market adjustments, non-recurring gains and losses and unrealized gains and losses on financial instruments. Management uses adjusted net income to evaluate the underlying operating performance of the Company and to assist with the planning and forecasting of future operating results. Management believes that adjusted net income is a useful measure of performance because foreign currency translation gains and losses, mark-to-market adjustments, non-recurring gains and losses and unrealized gains and losses on financial instruments do not reflect the underlying operating performance of the Company and may not be indicative of future operating results. Management also performs sensitivity analyses in order to quantify the effects of fluctuating foreign exchange rates and metal prices. This news release also contains information as to estimated future total cash costs per ounce, all-in sustaining costs per ounce and minesite costs per tonne. The estimates are based upon the total cash costs

41
per ounce, all-in sustaining costs per ounce and minesite costs per tonne that the Company expects to incur to mine gold at its mines and projects and, consistent with the reconciliation of these actual costs referred to above, do not include production costs attributable to accretion expense and other asset retirement costs, which will vary over time as each project is developed and mined. It is therefore not practicable to reconcile these forward-looking non-GAAP financial measures to the most comparable IFRS measure. Forward-Looking Statements The information in this news release has been prepared as at April 26, 2018. Certain statements contained in this news release constitute "forward-looking statements" within the meaning of the United States Private Securities Litigation Reform Act of 1995 and "forward-looking information" under the provisions of Canadian provincial securities laws and are referred to herein as "forward-looking statements". When used in this news release, the words "anticipate", "could", "estimate", "expect", "forecast", "future", "plan", "possible", "potential", "will" and similar expressions are intended to identify forward-looking statements. Such statements include, without limitation: the Company's forward-looking production guidance, including estimated ore grades, project timelines, drilling results, metal production, life of mine estimates, total cash costs per ounce, all-in sustaining costs per ounce, minesite costs per tonne, other expenses and cash flows; the estimated timing and conclusions of technical reports and other studies and evaluations; the methods by which ore will be extracted or processed; statements concerning the Company's plans to build operations at Meliadine, Amaruq, LaRonde Zone 5 and Akasaba West and the Company's expansion plans at Kitilla, including the timing and funding thereof; statements concerning other expansion projects, recovery rates, mill throughput, optimization and projected exploration expenditures, including costs and other estimates upon which such projections are based; statements regarding timing and amounts of capital expenditures and other assumptions; estimates of future mineral reserves, mineral resources, mineral production, optimization efforts and sales; estimates of future capital expenditures and other cash needs, and expectations as to the funding thereof; statements as to the projected development of certain ore deposits, including estimates of exploration, development and production and other capital costs and estimates of the timing of such exploration, development and production or decisions with respect to such exploration, development and production; estimates of mineral reserves and mineral resources; statements regarding the Company's ability to obtain the necessary permits and authorizations in connection with its exploration, development and mining operations and the anticipated timing thereof; statements regarding anticipated future exploration; the anticipated timing of events with respect to the Company's mine sites; and statements regarding the sufficiency of the Company's cash resources and other statements regarding anticipated trends with respect to the Company's operations, exploration and the funding thereof. Such statements reflect the Company's views as at the date of this news release and are subject to certain risks, uncertainties and assumptions, and undue reliance should not be placed on such statements. Forward-looking statements are necessarily based upon a number of factors and assumptions that, while considered reasonable by Agnico Eagle as of the date of such statements, are inherently subject to significant business, economic and competitive uncertainties and contingencies. The material factors and

42
assumptions used in the preparation of the forward looking statements contained herein, which may prove to be incorrect, include, but are not limited to, the assumptions set forth herein and in management's discussion and analysis ("MD&A") and the Company's Annual Information Form ("AIF") for the year ended December 31, 2017 filed with Canadian securities regulators and that are included in its Annual Report on Form 40-F for the year ended December 31, 2017 ("Form 40-F") filed with the U.S. Securities and Exchange Commission (the "SEC") as well as: that there are no significant disruptions affecting operations; that production, permitting, development and expansion at each of Agnico Eagle's properties proceeds on a basis consistent with current expectations and plans; that the relevant metal prices, foreign exchange rates and prices for key mining and construction supplies will be consistent with Agnico Eagle's expectations; that Agnico Eagle's current estimates of mineral reserves, mineral resources, mineral grades and metal recovery are accurate; that there are no material delays in the timing for completion of ongoing growth projects; that the Company's current plans to optimize production are successful; and that there are no material variations in the current tax and regulatory environment. Many factors, known and unknown, could cause the actual results to be materially different from those expressed or implied by such forward looking statements. Such risks include, but are not limited to: the volatility of prices of gold and other metals; uncertainty of mineral reserves, mineral resources, mineral grades and mineral recovery estimates; uncertainty of future production, project development, capital expenditures and other costs; foreign exchange rate fluctuations; financing of additional capital requirements; cost of exploration and development programs; mining risks; community protests, including by First Nations groups; risks associated with foreign operations; the unfavorable outcome of litigation involving the Partnership; governmental and environmental regulation; the volatility of the Company's stock price; and risks associated with the Company's currency, fuel and by-product metal derivative strategies. For a more detailed discussion of such risks and other factors that may affect the Company's ability to achieve the expectations set forth in the forward-looking statements contained in this news release, see the AIF and MD&A filed on SEDAR at www.sedar.com and included in the Form 40-F filed on EDGAR at www.sec.gov, as well as the Company's other filings with the Canadian securities regulators and the SEC. Other than as required by law, the Company does not intend, and does not assume any obligation, to update these forward-looking statements. Notes to Investors Regarding the Use of Mineral Resources Cautionary Note to Investors Concerning Estimates of Measured and Indicated Mineral Resources This news release uses the terms "measured mineral resources" and "indicated mineral resources". Investors are advised that while those terms are recognized and required by Canadian regulations, the SEC does not recognize them. Investors are cautioned not to assume that any part or all of mineral deposits in these categories will ever be converted into mineral reserves. Cautionary Note to Investors Concerning Estimates of Inferred Mineral Resources

43
This news release also uses the term "inferred mineral resources". Investors are advised that while this term is recognized and required by Canadian regulations, the SEC does not recognize it. "Inferred mineral resources" have a great amount of uncertainty as to their existence, and great uncertainty as to their economic and legal feasibility. It cannot be assumed that all or any part of an inferred mineral resource will ever be upgraded to a higher category. Under Canadian rules, estimates of inferred mineral resources may not form the basis of feasibility or pre-feasibility studies, except in rare cases. Investors are cautioned not to assume that any part or all of an inferred mineral resource exists, or is economically or legally mineable. Scientific and Technical Data The scientific and technical information contained in this news release relating to Quebec operations has been approved by Christian Provencher, Eng., Vice-President, Canada; relating to Nunavut operations has been approved by Dominique Girard, Eng., Vice-President, Nunavut Operations; relating to the Finland operations has been approved by Francis Brunet, Eng., Corporate Director Mining; relating to Southern Business operations has been approved by Marc Legault, Eng., Senior Vice President, Operations – U.S.A. & Latin America; and relating to exploration has been approved by Alain Blackburn, Eng., Senior Vice-President, Exploration and Guy Gosselin, Eng. and P.Geo., Vice-President, Exploration, each of whom is a "Qualified Person" for the purposes of NI 43-101. The scientific and technical information relating to Agnico Eagle's mineral reserves and mineral resources contained herein (other than the Canadian Malartic mine) has been approved by Daniel Doucet, Eng., Senior Corporate Director, Reserve Development; and relating to mineral reserves and mineral resources at the Canadian Malartic mine contained herein has been approved by Donald Gervais, P.Geo., Director of Technical Services at CMC, each of whom is a "Qualified Person" for the purposes of NI 43-101. Cautionary Note to U.S. Investors - The SEC permits U.S. mining companies, in their filings with the SEC, to disclose only those mineral deposits that a company can economically and legally extract or produce. Agnico Eagle reports mineral reserve and mineral resource estimates in accordance with the Canadian Institute of Mining, Metallurgy and Petroleum Best Practice Guidelines for Exploration and Best Practice Guidelines for Estimation of Mineral Resources and Mineral Reserves, in accordance with NI 43-101. These standards are similar to those used by the SEC's Industry Guide No. 7, as interpreted by Staff at the SEC ("Guide 7"). However, the definitions in NI 43-101 differ in certain respects from those under Guide 7. Accordingly, mineral reserve information contained herein may not be comparable to similar information disclosed by U.S. companies. Under the requirements of the SEC, mineralization may not be classified as a "reserve" unless the determination has been made that the mineralization could be economically and legally produced or extracted at the time the reserve determination is made. A "final" or "bankable" feasibility study is required to meet the requirements to designate mineral reserves under Guide 7. Agnico Eagle uses certain terms in this news release, such as "measured", "indicated", "inferred" and "resources" that the SEC guidelines strictly prohibit U.S. registered companies from including in their filings with the SEC.

44
In prior periods, mineral reserves for all properties were typically estimated using historic three-year average metals prices and foreign exchange rates in accordance with the SEC guidelines. These guidelines require the use of prices that reflect current economic conditions at the time of mineral reserve determination, which the Staff of the SEC has interpreted to mean historic three-year average prices. Given the current commodity price environment, Agnico Eagle has decided to use price assumptions that are below the three-year averages. Assumptions used for the December 31, 2017 mineral reserves estimate at all mines and advanced projects reported by the Company
Metal prices Exchange rates Gold
(US$/oz) Silver
(US$/oz) Copper (US$/lb)
Zinc (US$/lb)
C$ per US$1.00
Mexican peso per US$1.00
US$ per €1.00
Long-life operations and projects
$1,150 $16.00 $2.50 $1.00
C$1.20 MXP16.00 US$1.15
Short-life operations – Lapa, Meadowbank mine, Santos Nino pit and Creston Mascota satellite operation at Pinos Altos
C$1.25 MXP17.00 Not applicable
Upper Canada, Upper Beaver*, Canadian Malartic mine**
$1,200 Not applicable 2.75 Not
applicable C$1.25 Not applicable
Not applicable
*The Upper Beaver project has a C$125/tonne net smelter return (NSR) **The Canadian Malartic mine uses a cut-off grade between 0.35 g/t and 0.37 g/t gold (depending on the deposit) NI 43-101 requires mining companies to disclose mineral reserves and mineral resources using the subcategories of "proven mineral reserves", "probable mineral reserves", "measured mineral resources", "indicated mineral resources" and "inferred mineral resources". Mineral resources that are not mineral reserves do not have demonstrated economic viability. A mineral reserve is the economically mineable part of a measured and/or indicated mineral resource. It includes diluting materials and allowances for losses, which may occur when the material is mined or extracted and is defined by studies at pre-feasibility or feasibility level as appropriate that include application of modifying factors. Such studies demonstrate that, at the time of reporting, extraction could reasonably be justified. The mineral reserves presented in this news release are separate from and not a portion of the mineral resources. Modifying factors are considerations used to convert mineral resources to mineral reserves. These include, but are not restricted to, mining, processing, metallurgical, infrastructure, economic, marketing, legal, environmental, social and governmental factors.

45
A proven mineral reserve is the economically mineable part of a measured mineral resource. A proven mineral reserve implies a high degree of confidence in the modifying factors. A probable mineral reserve is the economically mineable part of an indicated and, in some circumstances, a measured mineral resource. The confidence in the modifying factors applying to a probable mineral reserve is lower than that applying to a proven mineral reserve. A mineral resource is a concentration or occurrence of solid material of economic interest in or on the Earth's crust in such form, grade or quality and quantity that there are reasonable prospects for eventual economic extraction. The location, quantity, grade or quality, continuity and other geological characteristics of a mineral resource are known, estimated or interpreted from specific geological evidence and knowledge, including sampling. A measured mineral resource is that part of a mineral resource for which quantity, grade or quality, densities, shape and physical characteristics are estimated with confidence sufficient to allow the application of modifying factors to support detailed mine planning and final evaluation of the economic viability of the deposit. Geological evidence is derived from detailed and reliable exploration, sampling and testing and is sufficient to confirm geological and grade or quality continuity between points of observation. An indicated mineral resource is that part of a mineral resource for which quantity, grade or quality, densities, shape and physical characteristics are estimated with sufficient confidence to allow the application of modifying factors in sufficient detail to support mine planning and evaluation of the economic viability of the deposit. Geological evidence is derived from adequately detailed and reliable exploration, sampling and testing and is sufficient to assume geological and grade or quality continuity between points of observation. An inferred mineral resource is that part of a mineral resource for which quantity and grade or quality are estimated on the basis of limited geological evidence and sampling. Geological evidence is sufficient to imply but not verify geological and grade or quality continuity. Investors are cautioned not to assume that part or all of an inferred mineral resource exists, or is economically or legally mineable. A feasibility study is a comprehensive technical and economic study of the selected development option for a mineral project that includes appropriately detailed assessments of applicable modifying factors, together with any other relevant operational factors and detailed financial analysis that are necessary to demonstrate, at the time of reporting, that extraction is reasonably justified (economically mineable). The results of the study may reasonably serve as the basis for a final decision by a proponent or financial institution to proceed with, or finance, the development of the project. The confidence level of the study will be higher than that of a pre-feasibility study. Additional Information Additional information about each of the mineral projects that is required by NI 43-101, sections 3.2 and 3.3 and paragraphs 3.4(a), (c) and (d) can be found in Technical Reports,

46
which may be found at www.sedar.com. Other important operating information can be found in the Company's AIF, MD&A and Form 40-F. Property/Project name and location Date of most recent Technical Report
(NI 43-101) filed on SEDAR LaRonde, LaRonde Zone 5 & Ellison, Quebec, Canada March 23, 2005 Canadian Malartic, Quebec, Canada June 16, 2014 Kittila, Kuotko and Kylmakangas, Finland March 4, 2010 Meadowbank Gold Complex including the Amaruq Satellite Mine Development, Nunavut, Canada
February 14, 2018
Goldex, Quebec, Canada October 14, 2012 Lapa, Quebec, Canada June 8, 2006 Meliadine, Nunavut, Canada February 11, 2015 Hammond Reef, Ontario, Canada July 2, 2013 Upper Beaver (Kirkland Lake property), Ontario, Canada November 5, 2012 Pinos Altos and Creston Mascota, Mexico March 25, 2009 La India, Mexico August 31, 2012

47
2018 2017
Operating margin(i) by mine: Northern Business
LaRonde mine 89,760$ 70,702$ Lapa mine 289 6,205Goldex mine 18,052 20,854Meadowbank mine 30,193 57,473
Canadian Malartic mine(ii) 62,261 51,586Kittila mine 23,309 29,841
Southern Business Pinos Altos mine 37,219 42,033Creston Mascota mine 7,636 8,057La India mine 14,390 20,369
Total operating margin(i) 283,109 307,120Amortization of property, plant and mine development 134,370 132,509Exploration, corporate and other 79,386 71,964Income before income and mining taxes 69,353 102,647Income and mining taxes expense 24,423 26,697Net income for the period 44,930$ 75,950$ Net income per share — basic (US$) 0.19$ 0.33$ Net income per share — diluted (US$) 0.19$ 0.33$
Cash flows: Cash provided by operating activities 207,706$ 222,611$ Cash used in investing activities (354,717)$ (153,687)$ Cash (used in) provided by financing activities (34,348)$ 181,571$
Realized prices (US$): Gold (per ounce) 1,332$ 1,223$ Silver (per ounce) 16.76$ 17.62$ Zinc (per tonne) 3,439$ 2,782$ Copper (per tonne) 7,201$ 6,277$
AGNICO EAGLE MINES LIMITEDSUMMARY OF OPERATIONS KEY PERFORMANCE INDICATORS
(thousands of United States dollars, except where noted)(Unaudited)
Three Months EndedMarch 31,

48
Payable production(iii): Gold (ounces):
Northern Business LaRonde mine 89,785 78,912 Lapa mine 1,722 15,360
Goldex mine 27,924 32,671Meadowbank mine 61,447 85,370Canadian Malartic mine(ii) 83,403 71,382
Kittila mine 48,118 51,621Southern Business Pinos Altos mine 41,836 45,360 Creston Mascota mine 11,988 11,244 La India mine 23,055 26,296
Total gold (ounces) 389,278 418,216
Silver (thousands of ounces): Northern Business LaRonde mine 367 272 Lapa mine — 1 Goldex mine — — Meadowbank mine 60 71 Canadian Malartic mine(ii) 106 84 Kittila mine 3 3Southern Business Pinos Altos mine 541 583 Creston Mascota mine 91 56 La India mine 45 128
Total silver (thousands of ounces) 1,213 1,198
Zinc (tonnes) 1,046 1,005Copper (tonnes) 1,292 1,272

49
Payable metal sold: Gold (ounces):
Northern Business LaRonde mine 101,825 85,456 Lapa mine 613 15,407 Goldex mine 27,458 33,212 Meadowbank mine 68,125 90,555 Canadian Malartic mine(ii)(iv) 77,045 63,860 Kittila mine 49,780 53,900Southern Business Pinos Altos mine 46,360 45,133 Creston Mascota mine 11,889 11,626 La India mine 22,030 25,680
Total gold (ounces) 405,125 424,829
Silver (thousands of ounces): Northern Business LaRonde mine 362 288 Lapa mine — — Goldex mine — — Meadowbank mine 58 63 Canadian Malartic mine(ii)(iv) 87 79 Kittila mine 4 2Southern Business Pinos Altos mine 611 606 Creston Mascota mine 86 50 La India mine 47 129
Total silver (thousands of ounces): 1,255 1,217
Zinc (tonnes) 2,530 2,136Copper (tonnes) 1,288 1,229

50
Total cash costs per ounce of gold produced — co-product basis (US$)(v): Northern Business
LaRonde mine 639$ 662$ Lapa mine 1,059 855 Goldex mine(vi) 674 532 Meadowbank mine 938 603 Canadian Malartic mine(ii) 586 575 Kittila mine 883 669
Southern Business Pinos Altos mine 758 594Creston Mascota mine 865 618La India mine 700 525
Weighted average total cash costs per ounce of gold produced 733$ 616$
Total cash costs per ounce of gold produced — by-product basis (US$)(v): Northern Business
LaRonde mine 427$ 464$ Lapa mine 1,056 854 Goldex mine(vi) 674 532 Meadowbank mine 923 590 Canadian Malartic mine(ii) 566 556 Kittila mine 882 668
Southern Business Pinos Altos mine 539 358 Creston Mascota mine 738 525 La India mine 668 438
Weighted average total cash costs per ounce of gold produced 648$ 539$
Notes:
(i) Operating margin is calculated as revenues from mining operations less production costs.
(ii) The information set out in this table reflects the Company's 50% interest in the Canadian Malartic mine sincethe date of acquisition.
(iii) Payable production (a non-GAAP non-financial performance measure) is the quantity of mineral producedduring a period contained in products that have been or will be sold by the Company, whether such products aresold during the period or held as inventories at the end of the period.
(iv) The Canadian Malartic mine's payable metal sold excludes the 5.0% net smelter royalty in favour of OsiskoGold Royalties Ltd.

51
(vi) The Goldex mine’s data presented on a per ounce of gold produced basis for the three months ended March31, 2017 excludes 2,395 ounces of payable gold production and the associated costs related to the Deep 1 Zonewhich were produced prior to the achievement of commercial production.
(v) Total cash costs per ounce of gold produced is not a recognized measure under IFRS and this data may not becomparable to data reported by other gold producers. Total cash costs per ounce of gold produced is reported onboth a by-product basis (deducting by-product metal revenues from production costs) and co-product basis(without deducting by-product metal revenues). Total cash costs per ounce of gold produced on a by-productbasis is calculated by adjusting production costs as recorded in the condensed interim consolidated statements ofincome for by-product metal revenues, inventory production costs, smelting, refining and marketing charges andother adjustments, and then dividing by the number of ounces of gold produced. Total cash costs per ounce ofgold produced on a co-product basis is calculated in the same manner as total cash costs per ounce of goldproduced on a by-product basis except that no adjustment for by-product metal revenues is made. Accordingly,the calculation of total cash costs per ounce of gold produced on a co-product basis does not reflect a reductionin production costs or smelting, refining and marketing charges associated with the production and sale of by-product metals. The Company believes that these generally accepted industry measures provide a realisticindication of operating performance and provide useful comparison points between periods. Total cash costs perounce of gold produced is intended to provide information about the cash generating capabilities of theCompany's mining operations. Management also uses these measures to monitor the performance of theCompany's mining operations. As market prices for gold are quoted on a per ounce basis, using the total cashcosts per ounce of gold produced on a by-product basis measure allows management to assess a mine's cashgenerating capabilities at various gold prices. Management is aware that these per ounce measures of performancecan be affected by fluctuations in exchange rates and, in the case of total cash costs of gold produced on a by-product basis, by-product metal prices. Management compensates for these inherent limitations by using thesemeasures in conjunction with minesite costs per tonne as well as other data prepared in accordance with IFRS.Management also performs sensitivity analyses in order to quantify the effects of fluctuating metal prices andexchange rates.
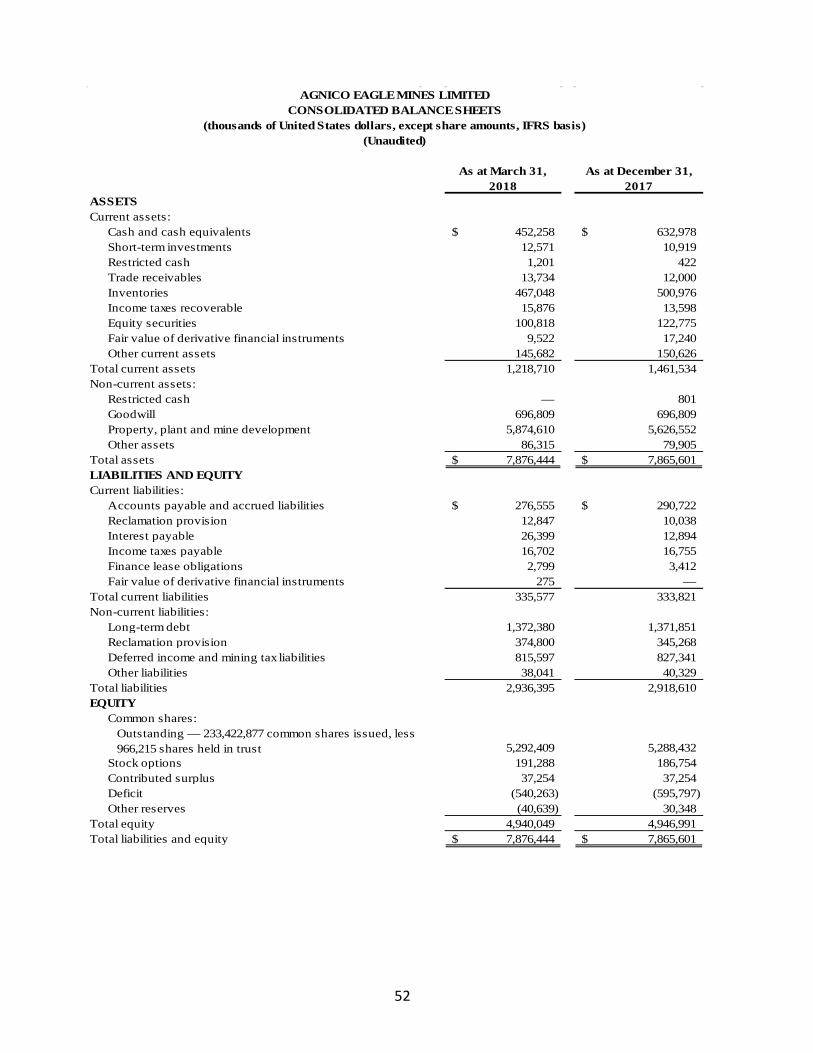
52
As at March 31, 2018
As at December 31, 2017
ASSETSCurrent assets:
Cash and cash equivalents 452,258$ 632,978$ Short-term investments 12,571 10,919Restricted cash 1,201 422Trade receivables 13,734 12,000Inventories 467,048 500,976Income taxes recoverable 15,876 13,598Equity securities 100,818 122,775Fair value of derivative financial instruments 9,522 17,240Other current assets 145,682 150,626
Total current assets 1,218,710 1,461,534Non-current assets:
Restricted cash — 801Goodwill 696,809 696,809Property, plant and mine development 5,874,610 5,626,552Other assets 86,315 79,905
Total assets 7,876,444$ 7,865,601$ LIABILITIES AND EQUITYCurrent liabilities:
Accounts payable and accrued liabilities 276,555$ 290,722$ Reclamation provision 12,847 10,038Interest payable 26,399 12,894Income taxes payable 16,702 16,755Finance lease obligations 2,799 3,412Fair value of derivative financial instruments 275 —
Total current liabilities 335,577 333,821Non-current liabilities:
Long-term debt 1,372,380 1,371,851Reclamation provision 374,800 345,268Deferred income and mining tax liabilities 815,597 827,341Other liabilities 38,041 40,329
Total liabilities 2,936,395 2,918,610EQUITY
Common shares:Outstanding — 233,422,877 common shares issued, less 966,215 shares held in trust 5,292,409 5,288,432
Stock options 191,288 186,754Contributed surplus 37,254 37,254Deficit (540,263) (595,797)Other reserves (40,639) 30,348
Total equity 4,940,049 4,946,991Total liabilities and equity 7,876,444$ 7,865,601$
AGNICO EAGLE MINES LIMITEDCONSOLIDATED BALANCE SHEETS
(thousands of United States dollars, except share amounts, IFRS basis)(Unaudited)

53
2018 2017
REVENUESRevenues from mining operations 578,435$ 547,459$
COSTS, EXPENSES AND OTHER INCOME Production(i) 295,326 240,339Exploration and corporate development 30,223 25,313Amortization of property, plant and mine development 134,370 132,509General and administrative 33,461 30,754Finance costs 21,816 19,706Gain on derivative financial instruments (1,306) (3,800)Gain on sale of equity securities — (76)Environmental remediation 207 328Foreign currency translation (gain) loss (3,485) 852Other income (1,530) (1,113)Income before income and mining taxes 69,353 102,647Income and mining taxes expense 24,423 26,697Net income for the period 44,930$ 75,950$
Net income per share - basic 0.19$ 0.33$ Net income per share - diluted 0.19$ 0.33$
Weighted average number of common shares outstanding (in thousands):Basic 232,490 226,883Diluted 234,575 229,345
Note:(i) Exclusive of amortization, which is shown separately.
March 31,
AGNICO EAGLE MINES LIMITEDCONSOLIDATED STATEMENTS OF INCOME
(thousands of United States dollars, except per share amounts, IFRS basis)(Unaudited)
Three Months Ended

54
2018 2017
OPERATING ACTIVITIESNet income for the period 44,930$ 75,950$ Add (deduct) items not affecting cash:
Amortization of property, plant and mine development 134,370 132,509Deferred income and mining taxes (11,622) 531Gain on sale of equity securities — (76)Stock-based compensation 15,324 15,390Foreign currency translation (gain) loss (3,485) 852Other 1,652 (111)
Adjustment for settlement of reclamation provision (633) (306)Changes in non-cash working capital balances:
Trade receivables (1,734) (1,428)Income taxes (2,331) (3,803)Inventories 24,550 7,936Other current assets 4,753 5,219Accounts payable and accrued liabilities (10,439) (21,159)Interest payable 12,371 11,107
Cash provided by operating activities 207,706 222,611
INVESTING ACTIVITIESAdditions to property, plant and mine development (186,094) (128,639)Acquisition (162,479) —Net purchases of short-term investments (1,652) (2,721)Net proceeds from sale of equity securities — 191Purchases of equity securities (4,514) (22,537)Decrease in restricted cash 22 19Cash used in investing activities (354,717) (153,687)
FINANCING ACTIVITIESDividends paid (22,649) (19,458)Repayment of finance lease obligations (920) (1,682)Proceeds from long-term debt 250,000 —Repayment of long-term debt (250,000) —Long-term debt financing (104) —Repurchase of common shares for stock-based compensation plans (26,256) (24,238)Proceeds on exercise of stock options 12,184 10,913Common shares issued 3,397 216,036Cash (used in) provided by financing activities (34,348) 181,571Effect of exchange rate changes on cash and cash equivalents 639 2,718Net (decrease) increase in cash and cash equivalents during the period (180,720) 253,213Cash and cash equivalents, beginning of period 632,978 539,974Cash and cash equivalents, end of period 452,258$ 793,187$
SUPPLEMENTAL CASH FLOW INFORMATIONInterest paid 7,167$ 6,867$ Income and mining taxes paid 37,838$ 30,363$
March 31,
AGNICO EAGLE MINES LIMITEDCONSOLIDATED STATEMENTS OF CASH FLOWS
(thousands of United States dollars, IFRS basis)(Unaudited)
Three Months Ended

55
Total Production Costs by Mine(thousands of United States dollars)LaRonde mineLapa mineGoldex mineMeadowbank mineCanadian Malartic mine(i)
Kittila minePinos Altos mineCreston Mascota mineLa India mine
Production costs per the consolidated statement of income
LaRonde MinePer Ounce of Gold Produced(ii)
(thousands) ($ per ounce ) (thousands) ($ per ounce )
Gold production (ounces) 89,785 78,912
Production costs 64,936$ 723$ 44,365$ 562$ Inventory and other adjustments(iv) (7,531) (84) 7,840 100
Cash operating costs (co-product basis) 57,405$ 639$ 52,205$ 662$ By-product metal revenues (19,060) (212) (15,585) (198)
Cash operating costs (by-product basis) 38,345$ 427$ 36,620$ 464$
LaRonde MinePer Tonne(iii)
(thousands) ($ per tonne ) (thousands) ($ per tonne )
Tonnes of ore milled (thousands of tonnes) 531 559
Production costs 64,936$ 122$ 44,365$ 79$ Production costs (C$) 82,132C$ 155C$ 59,224C$ 106C$ Inventory and other adjustments (C$)(v) (17,985) (34) 1,496 3Minesite operating costs (C$) 64,147C$ 121C$ 60,720C$ 109C$
Three Months Ended Three Months EndedMarch 31, 2018 March 31, 2017
Reconciliation of Production Costs to Total Cash Costs per Ounce of Gold Produced (ii) by Mine and Reconciliation of Production Costs to Minesite Costs per Tonne(iii) by Mine (thousands of United States dollars, except as noted)
Three Months Ended Three Months EndedMarch 31, 2018 March 31, 2017
9,651 6,97815,402 13,114
295,326$ 240,339$
47,320 32,50142,716 35,91934,699 23,732
528 12,88718,584 16,86561,490 53,978
AGNICO EAGLE MINES LIMITEDRECONCILIATION OF NON-GAAP FINANCIAL PERFORMANCE MEASURES
(thousands of United States dollars, except where noted)(Unaudited)
Three Months Ended March 31, 2018
Three Months Ended March 31, 2017
64,936$ 44,365$

56
Lapa MinePer Ounce of Gold Produced(ii)
(thousands) ($ per ounce ) (thousands) ($ per ounce )
Gold production (ounces) 1,722 15,360
Production costs 528$ 307$ 12,887$ 839$ Inventory and other adjustments(iv) 1,295 752 242 16
Cash operating costs (co-product basis) 1,823$ 1,059$ 13,129$ 855$ By-product metal revenues (5) (3) (14) (1)
Cash operating costs (by-product basis) 1,818$ 1,056$ 13,115$ 854$
Lapa MinePer Tonne(iii)
(thousands) ($ per tonne ) (thousands) ($ per tonne )
Tonnes of ore milled (thousands of tonnes) 17 130
Production costs 528$ 31$ 12,887$ 99$ Production costs (C$) 675C$ 40C$ 17,259C$ 133C$ Inventory and other adjustments (C$)(v) 1,681 96 61 1Minesite operating costs (C$) 2,356C$ 136C$ 17,320C$ 134C$
Goldex MinePer Ounce of Gold Produced(ii)(vi)
(thousands) ($ per ounce ) (thousands) ($ per ounce )
Gold production (ounces) 27,924 30,276
Production costs 18,584$ 666$ 16,865$ 557$ Inventory and other adjustments(iv) 237 8 (752) (25)
Cash operating costs (co-product basis) 18,821$ 674$ 16,113$ 532$ By-product metal revenues (4) — (8) —
Cash operating costs (by-product basis) 18,817$ 674$ 16,105$ 532$
Goldex MinePer Tonne(iii)(vii)
(thousands) ($ per tonne ) (thousands) ($ per tonne )
Tonnes of ore milled (thousands of tonnes) 658 584
Production costs 18,584$ 28$ 16,865$ 29$ Production costs (C$) 23,537C$ 36C$ 22,303C$ 38C$ Inventory and other adjustments (C$)(v) 402 — (973) (1)Minesite operating costs (C$) 23,939C$ 36C$ 21,330C$ 37C$
Three Months Ended Three Months EndedMarch 31, 2018 March 31, 2017
Three Months Ended Three Months EndedMarch 31, 2018 March 31, 2017
Three Months Ended Three Months EndedMarch 31, 2018 March 31, 2017
Three Months Ended Three Months EndedMarch 31, 2018 March 31, 2017

57
Meadowbank MinePer Ounce of Gold Produced(ii)
(thousands) ($ per ounce ) (thousands) ($ per ounce )
Gold production (ounces) 61,447 85,370
Production costs 61,490$ 1,001$ 53,978$ 632$ Inventory and other adjustments(iv) (3,821) (63) (2,515) (29)
Cash operating costs (co-product basis) 57,669$ 938$ 51,463$ 603$ By-product metal revenues (974) (15) (1,107) (13)
Cash operating costs (by-product basis) 56,695$ 923$ 50,356$ 590$
Meadowbank MinePer Tonne(iii)
(thousands) ($ per tonne ) (thousands) ($ per tonne )
Tonnes of ore milled (thousands of tonnes) 830 926
Production costs 61,490$ 74$ 53,978$ 58$ Production costs (C$) 77,661C$ 94C$ 71,414C$ 77C$ Inventory and other adjustments (C$)(v) (4,857) (6) (3,141) (3)Minesite operating costs (C$) 72,804C$ 88C$ 68,273C$ 74C$
Canadian Malartic Mine(i)
Per Ounce of Gold Produced(ii)
(thousands) ($ per ounce ) (thousands) ($ per ounce )
Gold production (ounces) 83,403 71,382
Production costs 47,320$ 567$ 32,501$ 455$ Inventory and other adjustments(iv) 1,588 19 8,563 120
Cash operating costs (co-product basis) 48,908$ 586$ 41,064$ 575$ By-product metal revenues (1,668) (20) (1,353) (19)
Cash operating costs (by-product basis) 47,240$ 566$ 39,711$ 556$
Canadian Malartic Mine(i)
Per Tonne(iii)
(thousands) ($ per tonne ) (thousands) ($ per tonne )
Tonnes of ore milled (thousands of tonnes) 2,510 2,433
Production costs 47,320$ 19$ 32,501$ 13$ Production costs (C$) 60,502C$ 24C$ 42,996C$ 18C$ Inventory and other adjustments (C$)(v) 2,042 1 11,132 4Minesite operating costs (C$) 62,544C$ 25C$ 54,128C$ 22C$
Three Months Ended Three Months EndedMarch 31, 2018 March 31, 2017
Three Months Ended Three Months EndedMarch 31, 2018 March 31, 2017
Three Months Ended Three Months EndedMarch 31, 2018 March 31, 2017
Three Months Ended Three Months EndedMarch 31, 2018 March 31, 2017

58
Kittila MinePer Ounce of Gold Produced(ii)
(thousands) ($ per ounce ) (thousands) ($ per ounce )
Gold production (ounces) 48,118 51,621
Production costs 42,716$ 888$ 35,919$ 696$ Inventory and other adjustments(iv) (224) (5) (1,392) (27)
Cash operating costs (co-product basis) 42,492$ 883$ 34,527$ 669$ By-product metal revenues (71) (1) (44) (1)
Cash operating costs (by-product basis) 42,421$ 882$ 34,483$ 668$
Kittila MinePer Tonne(iii)
(thousands) ($ per tonne ) (thousands) ($ per tonne )
Tonnes of ore milled (thousands of tonnes) 468 423
Production costs 42,716$ 91$ 35,919$ 85$ Production costs (€) 34,984€ 75€ 33,104€ 78€ Inventory and other adjustments (€)(v) (482) (1) (1,340) (3)Minesite operating costs (€) 34,502€ 74€ 31,764€ 75€
Pinos Altos MinePer Ounce of Gold Produced(ii)
(thousands) ($ per ounce ) (thousands) ($ per ounce )
Gold production (ounces) 41,836 45,360
Production costs 34,699$ 829$ 23,732$ 523$ Inventory and other adjustments(iv) (2,987) (71) 3,211 71
Cash operating costs (co-product basis) 31,712$ 758$ 26,943$ 594$ By-product metal revenues (9,165) (219) (10,695) (236)
Cash operating costs (by-product basis) 22,547$ 539$ 16,248$ 358$
Pinos Altos MinePer Tonne(iii)
(thousands) ($ per tonne ) (thousands) ($ per tonne )
Tonnes of ore processed (thousands of tonnes) 519 553
Production costs 34,699$ 67$ 23,732$ 43$ Inventory and other adjustments(v) (2,974) (6) 2,841 5Minesite operating costs 31,725$ 61$ 26,573$ 48$
Three Months Ended Three Months EndedMarch 31, 2018 March 31, 2017
Three Months Ended Three Months EndedMarch 31, 2018 March 31, 2017
Three Months Ended Three Months EndedMarch 31, 2018 March 31, 2017
Three Months Ended Three Months EndedMarch 31, 2018 March 31, 2017
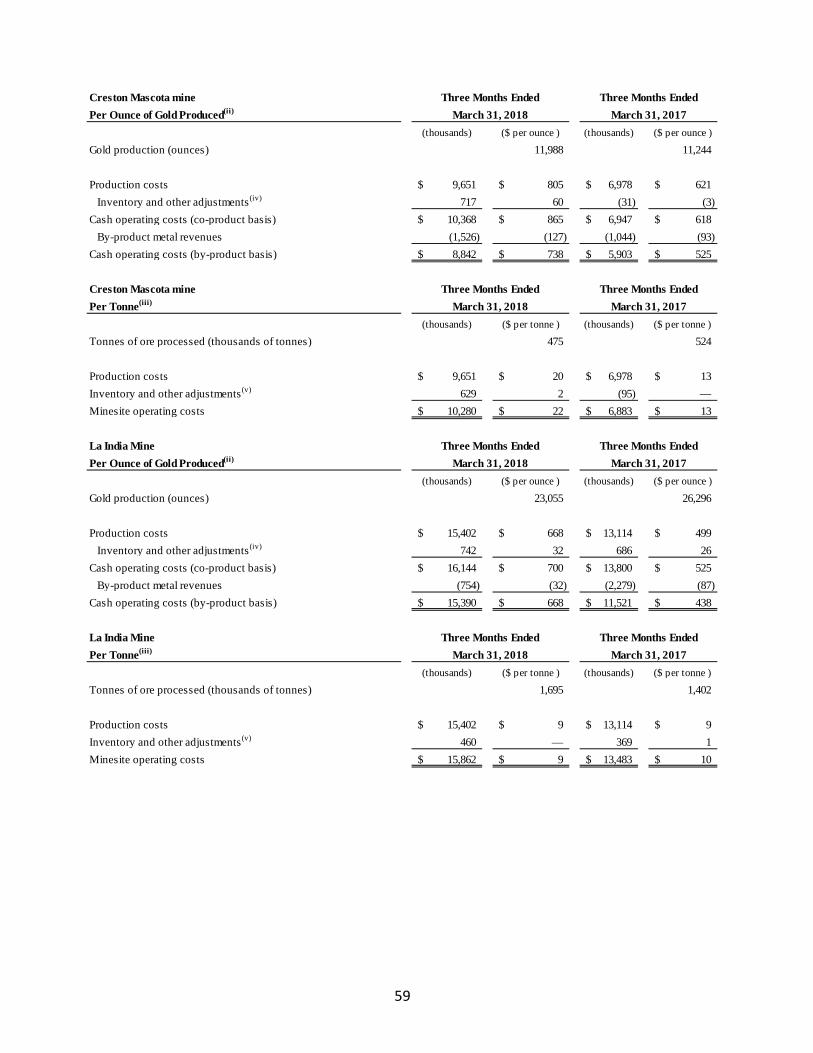
59
Creston Mascota minePer Ounce of Gold Produced(ii)
(thousands) ($ per ounce ) (thousands) ($ per ounce )
Gold production (ounces) 11,988 11,244
Production costs 9,651$ 805$ 6,978$ 621$ Inventory and other adjustments(iv) 717 60 (31) (3)
Cash operating costs (co-product basis) 10,368$ 865$ 6,947$ 618$ By-product metal revenues (1,526) (127) (1,044) (93)
Cash operating costs (by-product basis) 8,842$ 738$ 5,903$ 525$
Creston Mascota minePer Tonne(iii)
(thousands) ($ per tonne ) (thousands) ($ per tonne )
Tonnes of ore processed (thousands of tonnes) 475 524
Production costs 9,651$ 20$ 6,978$ 13$ Inventory and other adjustments(v) 629 2 (95) —Minesite operating costs 10,280$ 22$ 6,883$ 13$
La India MinePer Ounce of Gold Produced(ii)
(thousands) ($ per ounce ) (thousands) ($ per ounce )
Gold production (ounces) 23,055 26,296
Production costs 15,402$ 668$ 13,114$ 499$ Inventory and other adjustments(iv) 742 32 686 26
Cash operating costs (co-product basis) 16,144$ 700$ 13,800$ 525$ By-product metal revenues (754) (32) (2,279) (87)
Cash operating costs (by-product basis) 15,390$ 668$ 11,521$ 438$
La India MinePer Tonne(iii)
(thousands) ($ per tonne ) (thousands) ($ per tonne )
Tonnes of ore processed (thousands of tonnes) 1,695 1,402
Production costs 15,402$ 9$ 13,114$ 9$ Inventory and other adjustments(v) 460 — 369 1Minesite operating costs 15,862$ 9$ 13,483$ 10$
Three Months Ended Three Months EndedMarch 31, 2018 March 31, 2017
Three Months Ended Three Months EndedMarch 31, 2018 March 31, 2017
Three Months Ended Three Months EndedMarch 31, 2018 March 31, 2017
Three Months Ended Three Months EndedMarch 31, 2018 March 31, 2017

60
Notes:
(i) The information set out in this table reflects the Company’s 50% interest in the Canadian Malartic mine.
(ii) Total cash costs per ounce of gold produced is not a recognized measure under IFRS and this data may not be comparable to datareported by other gold producers. Total cash costs per ounce of gold produced is reported on both a by-product basis (deducting by-product metal revenues from production costs) and co-product basis (without deducting by-product metal revenues). Total cash costsper ounce of gold produced on a by-product basis is calculated by adjusting production costs as recorded in the consolidated statementof income for by-product metal revenues, inventory production costs, smelting, refining and marketing charges and other adjustments,and then dividing by the number of ounces of gold produced. Total cash costs per ounce of gold produced on a co-product basis iscalculated in the same manner as total cash costs per ounce of gold produced on a by-product basis except that no adjustment for by-product metal revenues is made. Accordingly, the calculation of total cash costs per ounce of gold produced on a co-product basis doesnot reflect a reduction in production costs or smelting, refining and marketing charges associated with the production and sale of by-product metals. The Company believes that these non-GAAP provide a realistic indication of operating performance and provide usefulcomparison points between periods. Total cash costs per ounce of gold produced is intended to provide information about the cashgenerating capabilities of the Company's mining operations. Management also uses these measures to monitor the performance of theCompany's mining operations. As market prices for gold are quoted on a per ounce basis, using the total cash costs per ounce of goldproduced on a by-product basis measure allows management to assess a mine's cash generating capabilities at various gold prices.Management is aware that these per ounce measures of performance can be affected by fluctuations in exchange rates and, in the case oftotal cash costs of gold produced on a by-product basis, by-product metal prices. Management compensates for these inherentlimitations by using these measures in conjunction with minesite costs per tonne as well as other data prepared in accordance with IFRS.Management also performs sensitivity analyses in order to quantify the effects of fluctuating metal prices and exchange rates.
(iii) Minesite costs per tonne is not a recognized measure under IFRS and this data may not be comparable to data reported by other goldproducers. This measure is calculated by adjusting production costs as shown in the consolidated statement of income for inventoryproduction costs and other adjustments, and then dividing by tonnes of ore milled. As the total cash costs per ounce of gold producedmeasure can be affected by fluctuations in by-product metal prices and exchange rates, management believes that the minesite costs pertonne measure provides additional information regarding the performance of mining operations, eliminating the impact of varyingproduction levels. Management also uses this measure to determine the economic viability of mining blocks. As each mining block isevaluated based on the net realizable value of each tonne mined, in order to be economically viable the estimated revenue on a per tonnebasis must be in excess of the minesite costs per tonne. Management is aware that this per tonne measure of performance can beimpacted by fluctuations in processing levels and compensates for this inherent limitation by using this measure in conjunction withproduction costs prepared in accordance with IFRS.
(iv) Under the Company's revenue recognition policy, revenue is recognized when legal title and risk is transferred. As total cash costsper ounce of gold produced are calculated on a production basis, an inventory adjustment is made to reflect the portion of production not yet recognized as revenue. Other adjustments include the addition of smelting, refining and marketing charges to production costs.
(v) This inventory and other adjustment reflects production costs associated with the portion of production still in inventory andsmelting, refining and marketing charges associated with production.
(vi) The Goldexmine’s data presented on a per ounce of gold produced basis for the three months ended March 31, 2017 excludes 2,395ounces of payable gold production and the associated costs related to the Deep 1 Zone which were produced prior to the achievement ofcommercial production.
(vii) The Goldexmine’s data presented on a per tonne basis for the three months ended March 31, 2017 excludes 57,730 tonnes processedand the associated costs related to the Deep 1 Zone which were processed prior to the achievement of commercial production.

61
(United States dollars per ounce of gold produced, except where noted)Production costs per the consolidated statements of income and comprehensive income (thousands of United States dollars)
Adjusted gold production (ounces)(i)
Production costs per ounce of adjusted gold production(i)
Adjustments:
Inventory and other adjustments(ii)
Total cash costs per ounce of gold produced (co-product basis)(iii)
By-product metal revenuesTotal cash costs per ounce of gold produced (by-product Adjustments: Sustaining capital expenditures (including capitalized exploration)General and administrative expenses (including stock options)Non-cash reclamation provision and otherAll-in sustaining costs per ounce of gold produced (by-product By-product metal revenuesAll-in sustaining costs per ounce of gold produced (co-product
Notes:
Reconciliation of Production Costs to All-in Sustaining Costs per Ounce of Gold Produced
Three Months Ended March 31, 2018
Three Months Ended March 31, 2017
295,326$ 240,339$
389,278 415,821
759$ 578$
(26) 38733$ 616$ (85) (77)648$ 539$
150 12586 745 3
889$ 741$ 85 77
974$ 818$
(i) Adjusted gold production for the three months ended March 31, 2017 excludes 2,395 ounces of payable gold production at the Goldexmine's Deep 1 Zone which were produced prior to the achievement of commercial production.
(ii) Under the Company’s revenue recognition policy, revenue is recognized when legal title and risk is transferred. As total cash costsper ounce of gold produced are calculated on a production basis, this inventory adjustment reflects the sales margin on the portion ofproduction not yet recognized as revenue.
(iii) Total cash costs per ounce of gold produced is not a recognized measure under IFRS and this data may not be comparable to datapresented by other gold producers. Total cash costs per ounce of gold produced is presented on both a by-product basis (deducting by-product metal revenues from production costs) and co-product basis (without deducting by-product metal revenues). Total cash costsper ounce of gold produced on a by-product basis is calculated by adjusting production costs as recorded in the consolidatedstatements of income for by-product metal revenues, inventory production costs, smelting, refining and marketing charges and otheradjustments, and then dividing by the number of ounces of gold produced. Total cash costs per ounce of gold produced on a co-productbasis is calculated in the same manner as total cash costs per ounce of gold produced on a by-product basis except that no adjustmentfor by-product metal revenues is made. Accordingly, the calculation of total cash costs per ounce of gold produced on a co-productbasis does not reflect a reduction in production costs or smelting, refining and marketing charges associated with the production and sale of by-product metals. The Company believes that these non-GAAP generally accepted industry measures provide a realistic indicationof operating performance and provide useful comparison points between periods. Total cash costs per ounce of gold produced isintended to provide information about the cash generating capabilities of the Company’s mining operations. Management also usesthese measures to monitor the performance of the Company’s mining operations. As market prices for gold are quoted on a per ouncebasis, using the total cash costs per ounce of gold produced on a by-product basis measure allows management to assess a mine’s cashgenerating capabilities at various gold prices. Management is aware that these per ounce measures of performance can be affected byfluctuations in exchange rates and, in the case of total cash costs of gold produced on a by-product basis, by-product metal prices.Management compensates for these inherent limitations by using these measures in conjunction with minesite costs per tonne as well asother data prepared in accordance with IFRS. Management also performs sensitivity analysis in order to quantify the effects offluctuating metal prices and exchange rates.