Embed Size (px)
Citation preview
EDUCATION
Storage Performance Testing
Woody Hutsell, Texas Memory Systems
EDUCATION
Storage Performance Testing© 2007 Storage Networking Industry Association. All Rights Reserved.
2
SNIA Legal Notice
• The material contained in this tutorial is copyrighted by the SNIA.
• Member companies and individuals may use this material in presentations and literature under the following conditions:– Any slide or slides used must be reproduced without
modification– The SNIA must be acknowledged as source of any
material used in the body of any document containing material from these presentations.
• This presentation is a project of the SNIA Education Committee.
EDUCATION
Storage Performance Testing© 2007 Storage Networking Industry Association. All Rights Reserved.
3
Abstract
Storage Performance TestingConducting storage performance tests is essential to selecting storage for tiered storage environments. Some applications require endless hours of constant data acquisition, while others experience peak bursts of small block I/O. The best storage device for one application is almost never the right storage device for another.
This session will provide an in-depth technical discussion of storage performance testing.
EDUCATION
Storage Performance Testing© 2007 Storage Networking Industry Association. All Rights Reserved.
4
Agenda Topics
• Why test storage?• Types of storage performance testing:
– Benchmarking.– Application simulation.– Application testing.– Production testing.
• Common mistakes.

EDUCATION
Storage Performance Testing© 2007 Storage Networking Industry Association. All Rights Reserved.
5
Why Test Storage?
• Because it matters to your users and customers.– Slow storage performance means slow response times and long
running queries.
• Because it affects your batch window.– Slow storage can mean longer batch or backup windows causing
lower application availability or maintenance windows.
• Because it matters to your company’s profitability.– Slow storage can frustrate your customers and waste the
investment you have made in your server infrastructure.– Inappropriate use of fast storage means wasted dollars spent on
performance.
• Because storage vendors do not publicize every relevant metric for your application and environment.
EDUCATION
Storage Performance Testing© 2007 Storage Networking Industry Association. All Rights Reserved.
6
Types of Storage Performance Testing• Benchmarking.
– Review published and audited industry benchmarks.– Conduct tests with industry standard software.– Conduct tests for data corruption.
• Application simulation.– Use industry standard software to test a program with
conditions similar to a target application.• Application testing.
– Test an application with sample queries or scripts in a production-like environment.
• Production testing.
EDUCATION
Storage Performance Testing© 2007 Storage Networking Industry Association. All Rights Reserved.
7
Published Benchmarks
• Storage Performance Council– www.StoragePerformance.Org– SPC-1 test simulates an on-line transaction processing (OLTP)
environment.– SPC-2 test to simulate large block sequential processing.
• Spec-SFS– www.Spec.Org/sfs97r1– A good test for measuring performance of file servers and
network attached storage.
• TPC-C– www.tpc.org– TPC-C for testing OLTP, TPC-H for decision support and TPC-W
for web e-commerce.
EDUCATION
Storage Performance Testing© 2007 Storage Networking Industry Association. All Rights Reserved.
8
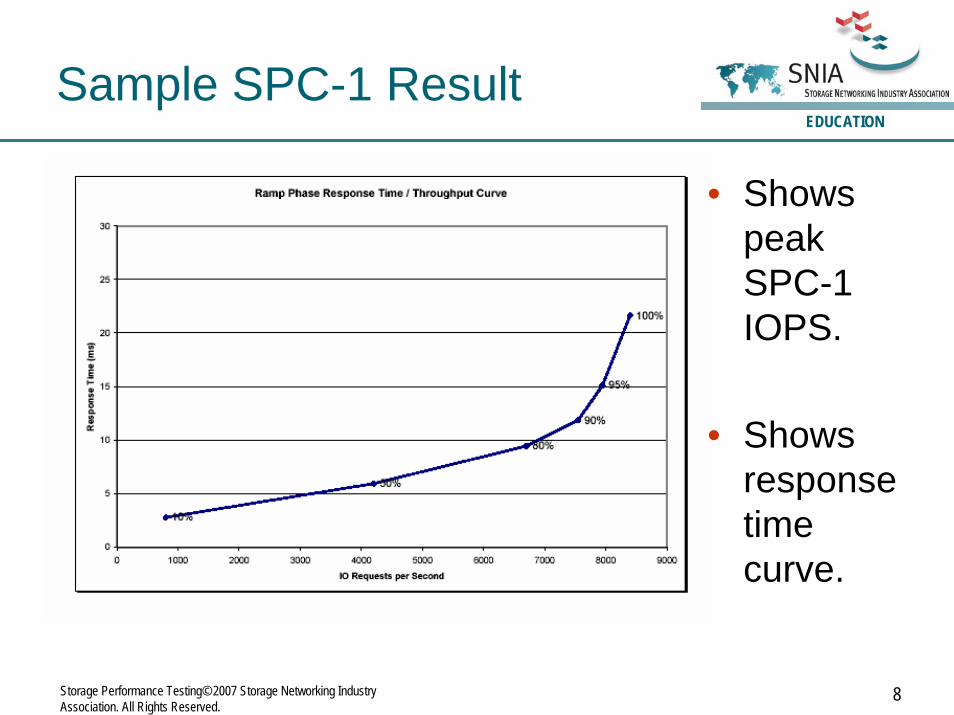
Sample SPC-1 Result
• Shows peak SPC-1 IOPS.
• Shows response time curve.
EDUCATION
Storage Performance Testing© 2007 Storage Networking Industry Association. All Rights Reserved.
9
Benchmarking Software
• IOMeter– Most popular tool among storage vendors.– Available free from www.iometer.org.– Primarily a Windows-based tool.
• IOZone– Broad OS support.– Available free from www.iozone.org.
• Benchmark Factory for Databases by Quest Software.– TPC-B, TPC-C, TPC-D (not for publishing results).
• Vendor tools.
EDUCATION
Storage Performance Testing© 2007 Storage Networking Industry Association. All Rights Reserved.
10
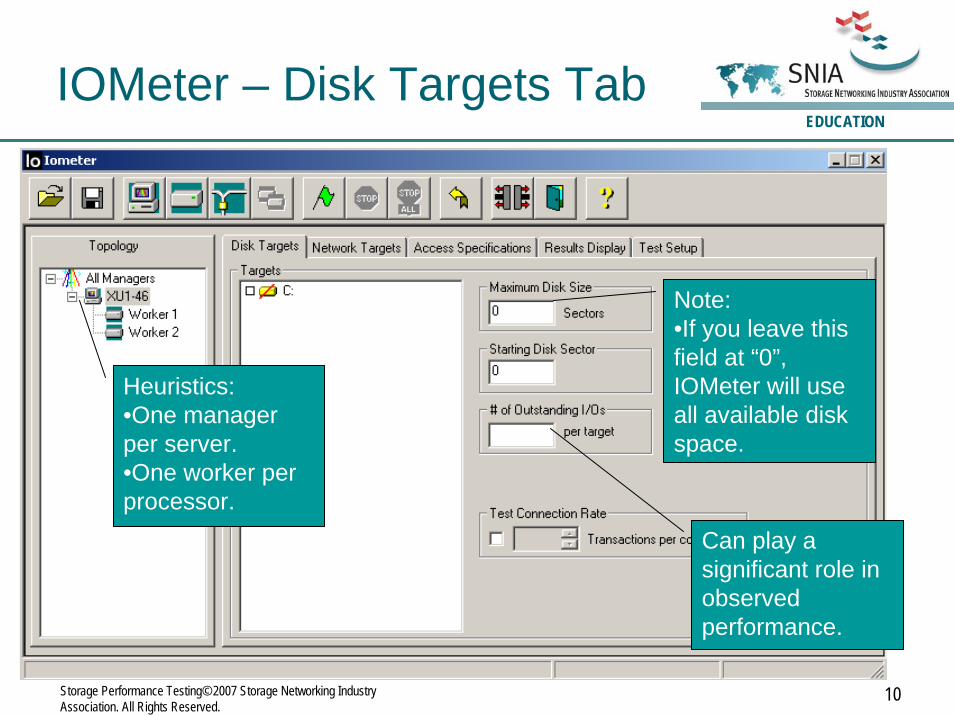
IOMeter – Disk Targets Tab
Heuristics:•One manager per server.•One worker per processor.
Note:•If you leave this field at “0”, IOMeter will use all available disk space.
Can play a significant role in observed performance.
EDUCATION
Storage Performance Testing© 2007 Storage Networking Industry Association. All Rights Reserved.
11
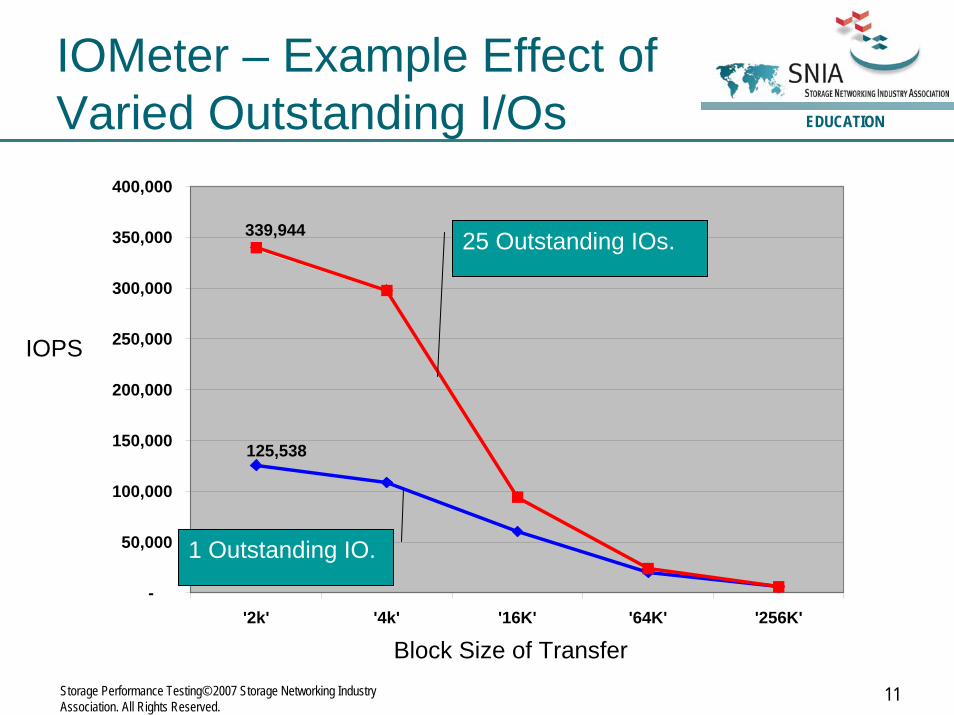
IOMeter – Example Effect of Varied Outstanding I/Os
125,538
339,944
-
50,000
100,000
150,000
200,000
250,000
300,000
350,000
400,000
'2k' '4k' '16K' '64K' '256K'
Block Size of Transfer
IOPS
25 Outstanding IOs.
1 Outstanding IO.
EDUCATION
Storage Performance Testing© 2007 Storage Networking Industry Association. All Rights Reserved.
12
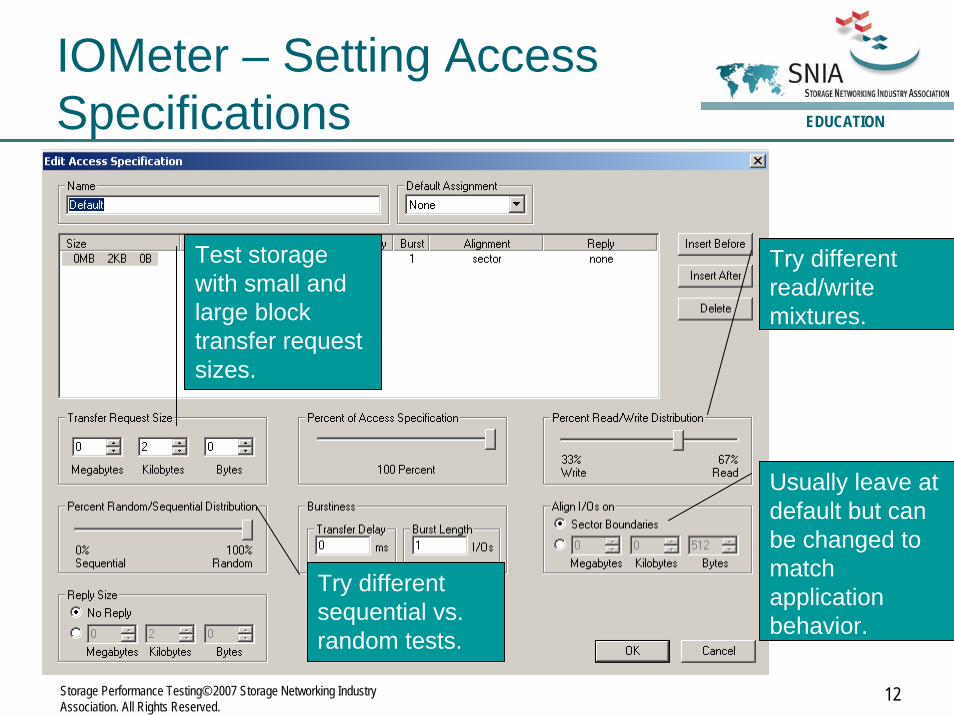
IOMeter – Setting Access Specifications
Test storage with small and large block transfer request sizes.
Try different sequential vs. random tests.
Try different read/write mixtures.
Usually leave at default but can be changed to match application behavior.
EDUCATION
Storage Performance Testing© 2007 Storage Networking Industry Association. All Rights Reserved.
13
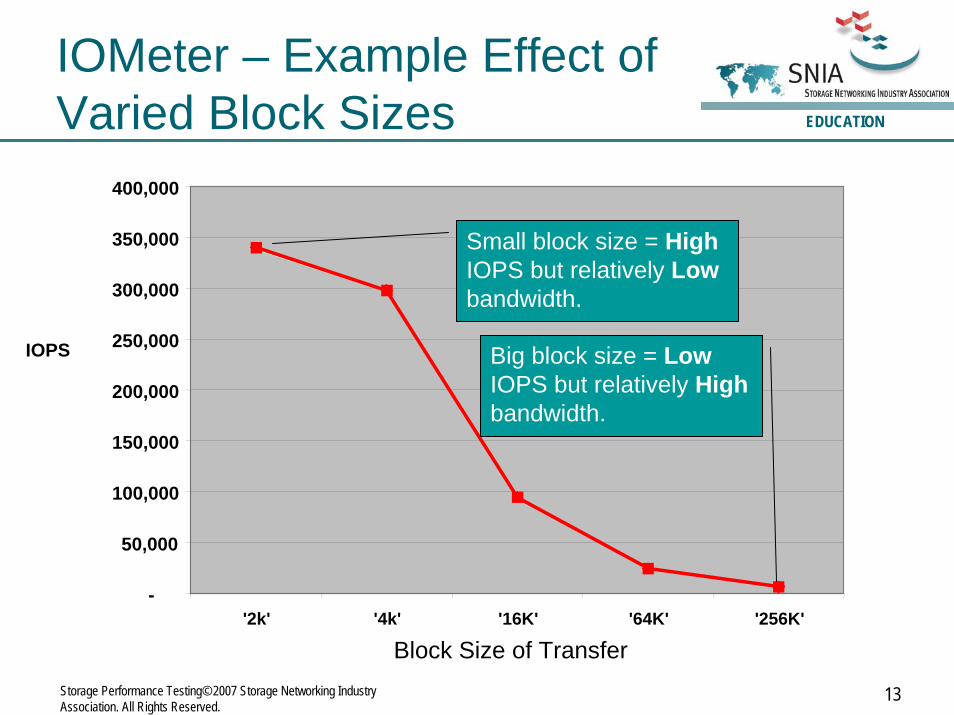
IOMeter – Example Effect of Varied Block Sizes
-
50,000
100,000
150,000
200,000
250,000
300,000
350,000
400,000
'2k' '4k' '16K' '64K' '256K'
Block Size of Transfer
IOPS
Small block size = HighIOPS but relatively Lowbandwidth.
Big block size = LowIOPS but relatively Highbandwidth.
EDUCATION
Storage Performance Testing© 2007 Storage Networking Industry Association. All Rights Reserved.
14
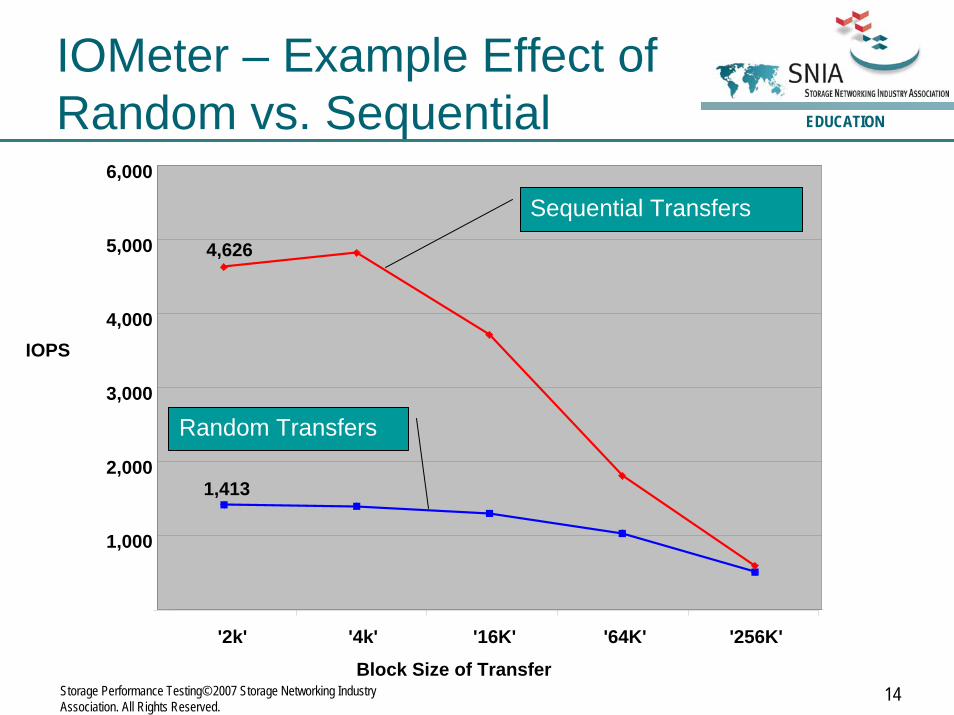
IOMeter – Example Effect of Random vs. Sequential
1,413
4,626
1,000
2,000
3,000
4,000
5,000
6,000
'2k' '4k' '16K' '64K' '256K'
Block Size of Transfer
Sequential Transfers
Random Transfers
IOPS
EDUCATION
Storage Performance Testing© 2007 Storage Networking Industry Association. All Rights Reserved.
15
IOMeter - Scripting
• IOMeter can be used to generate scripts.• Scripts can be set-up to run through a long set of
data patterns and then record the output to a log file.
• Good for overnight testing runs of new products.• Collect these reports and use them to compare
products.• Monitor a device over time or after major
configuration changes to verify performance baseline.
EDUCATION
Storage Performance Testing© 2007 Storage Networking Industry Association. All Rights Reserved.
16
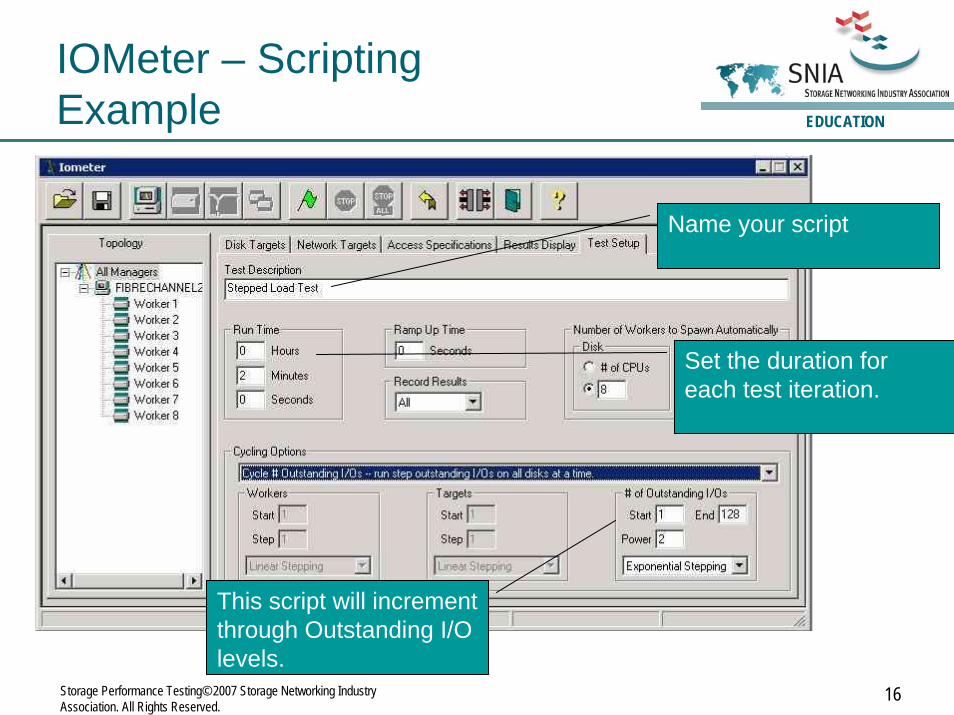
IOMeter – ScriptingExample
Name your script
Set the duration for each test iteration.
This script will increment through Outstanding I/O levels.
EDUCATION
Storage Performance Testing© 2007 Storage Networking Industry Association. All Rights Reserved.
17
Testing for Data Corruption
• Storage devices and storage network components are almost always reliable in predictable performance ranges, but the question is how do they handle extreme requirements.
• Most benchmarking tools do not automatically check data.
• Testing for data corruption usually means testing with data patterns that challenge components.– Need to test extremes of performance.– Need to test extreme data patterns.
EDUCATION
Storage Performance Testing© 2007 Storage Networking Industry Association. All Rights Reserved.
18
Case Study: Server NMIs
• Problem: Storage device was causing server NMI (crash) when other company storage does not.• Weeks were spent testing. Progress was slow because the
problem did not repeat frequently.• Key test tool: Medusa Labs software was deployed to
generate difficult data patterns for server and storage.• Resulted in nearly instant NMIs due to their challenging data
patterns (a good thing in this case because it helped diagnose the problem faster).
• Conclusion: Brand “X” HBA in PCI slot 1 caused NMIswhile the same card in PCI slot 2 did not cause NMI. Brand “Y” HBA worked fine in either PCI slot. Problem only observed under extreme loads.
EDUCATION
Storage Performance Testing© 2007 Storage Networking Industry Association. All Rights Reserved.
19
Application Simulation Testing• One type of test does not represent all
applications.• One type of application does not represent all
uses for a storage product.• Common types of application simulation testing:
– Test storage latency for messaging or other single-threaded applications.
– Test peak storage bandwidth for data acquisition or data streaming environments.
– Test peak storage IOPS for databases.
EDUCATION
Storage Performance Testing© 2007 Storage Networking Industry Association. All Rights Reserved.
20
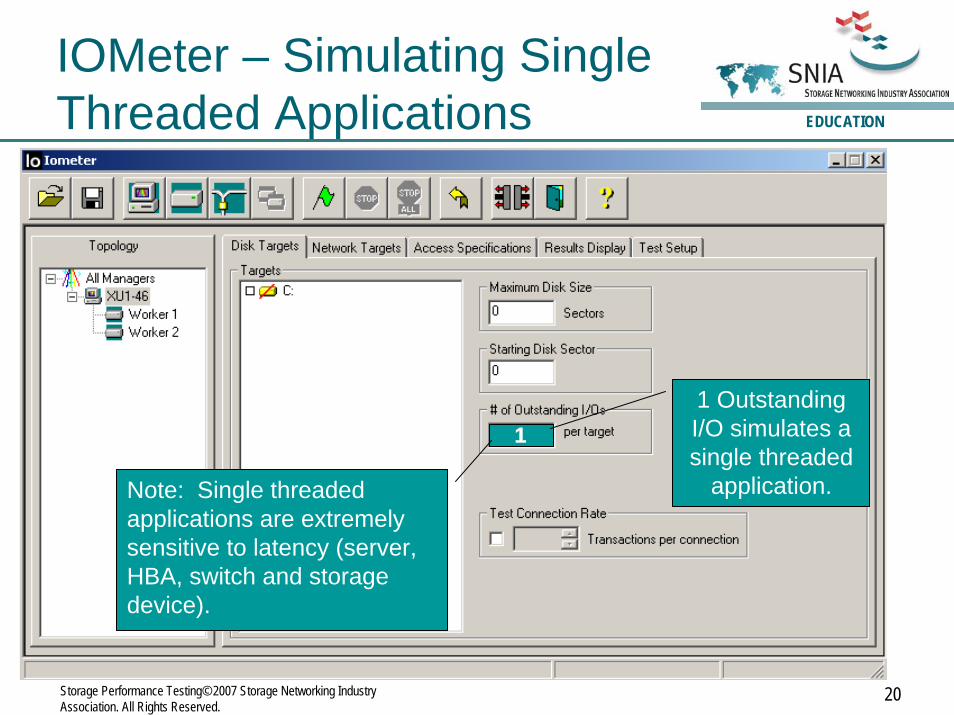
IOMeter – Simulating Single Threaded Applications
11 Outstanding I/O simulates a single threaded
application.Note: Single threaded applications are extremely sensitive to latency (server, HBA, switch and storage device).
EDUCATION
Storage Performance Testing© 2007 Storage Networking Industry Association. All Rights Reserved.
21
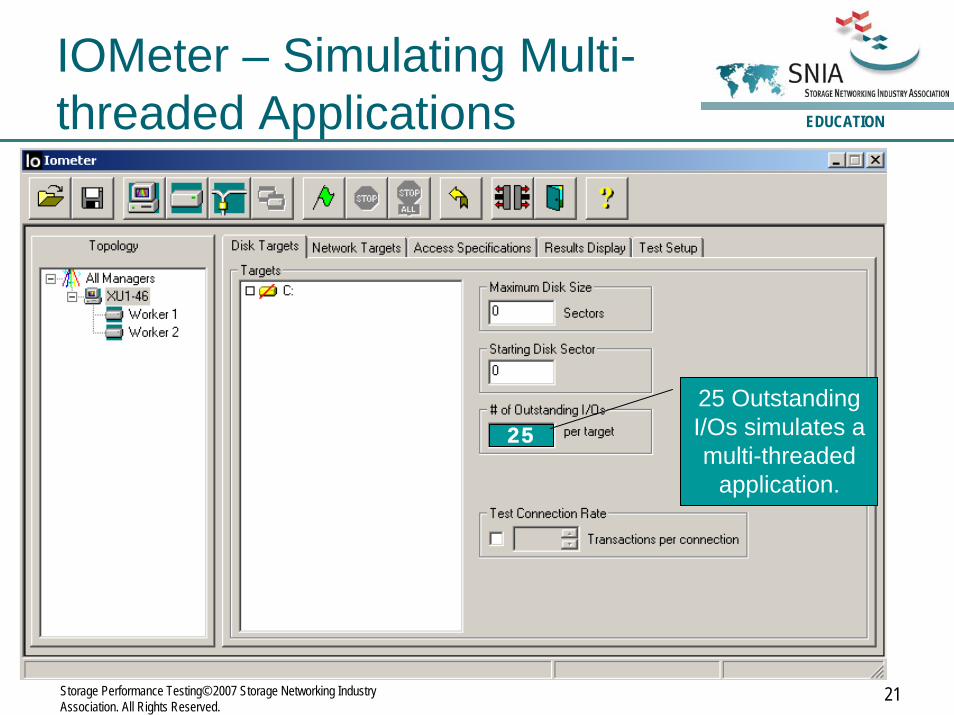
IOMeter – Simulating Multi-threaded Applications
2525 Outstanding I/Os simulates a multi-threaded
application.

EDUCATION
Storage Performance Testing© 2007 Storage Networking Industry Association. All Rights Reserved.
22
IOMeter – Simulating Database Environments
8
Small transfer request size simulates
database transfers.Match the
application’s read/write
distribution.
Database activity is
mostly random.
EDUCATION
Storage Performance Testing© 2007 Storage Networking Industry Association. All Rights Reserved.
23
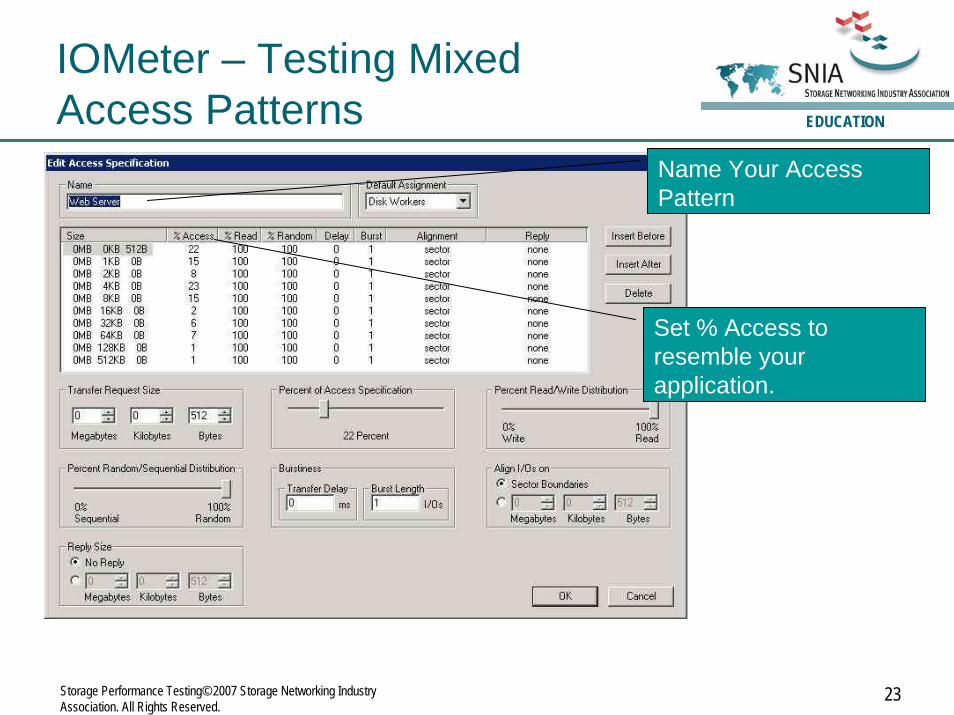
IOMeter – Testing Mixed Access Patterns
Name Your Access Pattern
Set % Access to resemble your application.
EDUCATION
Storage Performance Testing© 2007 Storage Networking Industry Association. All Rights Reserved.
24
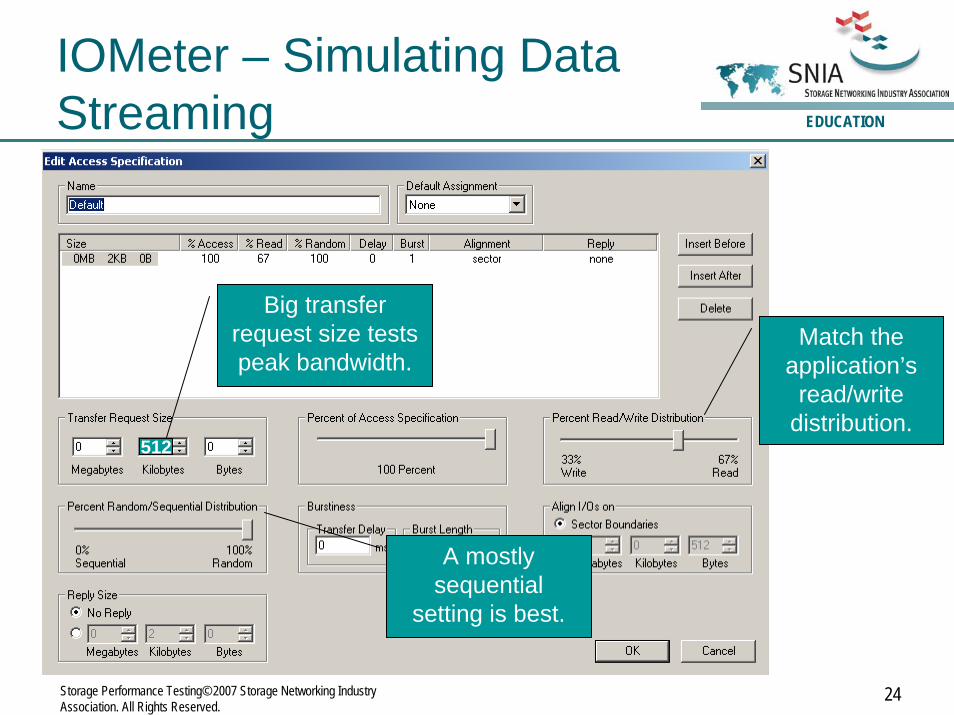
IOMeter – Simulating Data Streaming
512
Big transfer request size tests peak bandwidth.
Match the application’s
read/write distribution.
A mostly sequential
setting is best.
EDUCATION
Storage Performance Testing© 2007 Storage Networking Industry Association. All Rights Reserved.
25
Application Testing
• Testing with the actual application is the best way to measure storage performance.– Production-like environment that can stress storage
limits is desirable.– Measure performance of different solutions:
• Compare OLTP response times.• Compare batch run times.• Compare sustained streaming rates.
– Operating system and application tools can help monitor storage performance.
EDUCATION
Storage Performance Testing© 2007 Storage Networking Industry Association. All Rights Reserved.
26
Case Study: Windows Storage Performance• Windows performance monitor can be used to
monitor storage performance.• Capture the following key variables over the
duration of a peak processing period or test run:– Processor: % processor time (total and by processor).– Physical disk: average disk queue (total, read and
write by disk/array).– Physical disk: disk bytes/second (total, read and write
by disk array).
EDUCATION
Storage Performance Testing© 2007 Storage Networking Industry Association. All Rights Reserved.
27
Case Study: Windows Storage Performance• Tips to analyzing Windows Performance Monitor
results:– Use the following scaling to ease visual analysis:
• Disk queues: 1:1 ratio (default is 100:1).• Processor utilization: 1:1 ratio (default is 1:1).• Disk bytes: 0000001:1 ratio (default is a .0001:1).
– Start with “total” fields and then drill down into “read/write/by disk/by processor” variables.
– Alter the line thickness to see your results easier.– Use the slider bars to zoom into trouble spots.
EDUCATION
Storage Performance Testing© 2007 Storage Networking Industry Association. All Rights Reserved.
28
Case Study: Windows Storage Performance• More tips to analyzing Windows Performance Monitor
results:– Disk bytes per second should be divided by 1024 to get disk KB
and 1024 again to get disk MB.– Where physical disk queues increase is likely at the same point
where you have hit a storage performance limitation.– A system with high processor utilization does not have a storage
performance bottleneck.– Microsoft recommends that physical disk queues greater than 3
(per disk) shows an I/O bottleneck.– Processor utilization levels off in places you have physical disk
queues this is an indication that faster storage will improve application performance.
EDUCATION
Storage Performance Testing© 2007 Storage Networking Industry Association. All Rights Reserved.
29
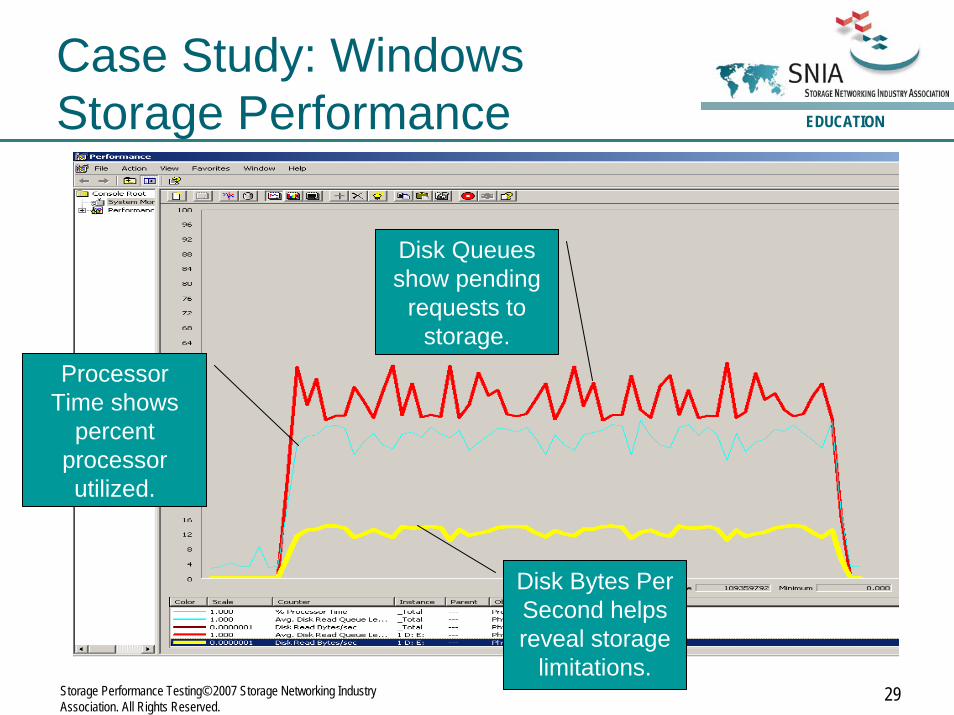
Case Study: Windows Storage Performance
Disk Queues show pending
requests to storage.
Disk Bytes Per Second helps reveal storage
limitations.
Processor Time shows
percent processor utilized.
EDUCATION
Storage Performance Testing© 2007 Storage Networking Industry Association. All Rights Reserved.
30
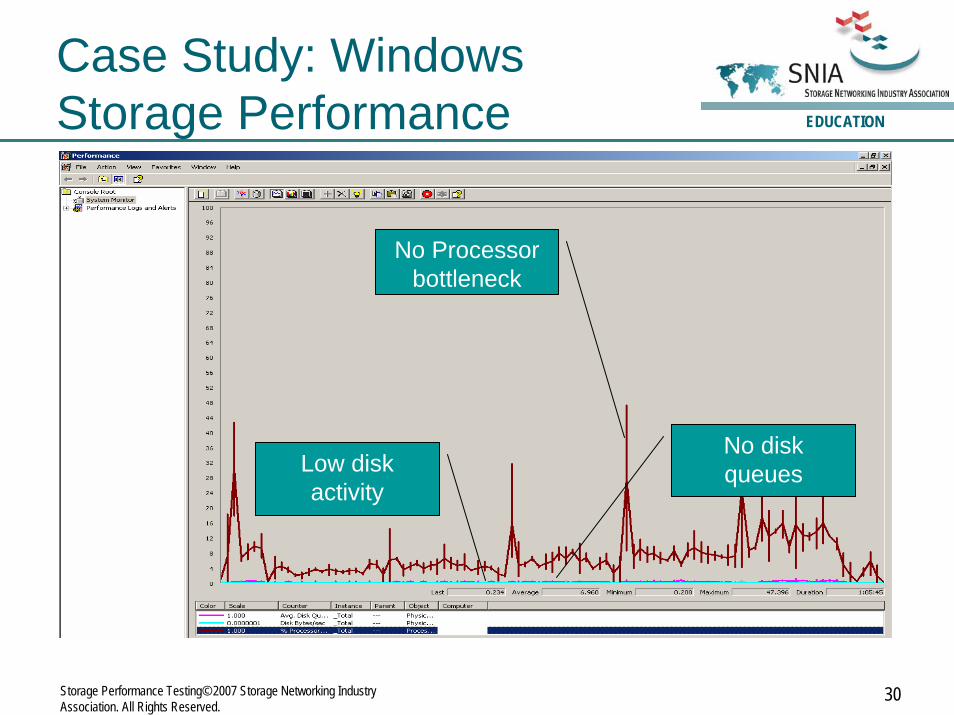
Case Study: Windows Storage Performance
No Processor bottleneck
No disk queuesLow disk
activity
EDUCATION
Storage Performance Testing© 2007 Storage Networking Industry Association. All Rights Reserved.
31
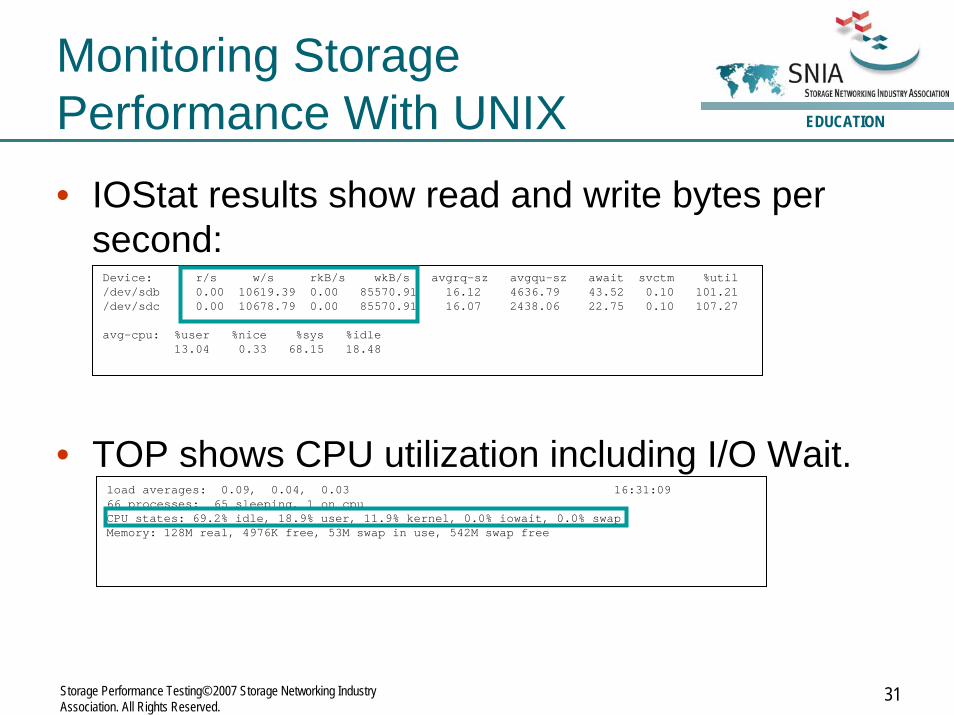
• IOStat results show read and write bytes per second:
• TOP shows CPU utilization including I/O Wait.
Monitoring Storage Performance With UNIX
Device: r/s w/s rkB/s wkB/s avgrq-sz avgqu-sz await svctm %util/dev/sdb 0.00 10619.39 0.00 85570.91 16.12 4636.79 43.52 0.10 101.21/dev/sdc 0.00 10678.79 0.00 85570.91 16.07 2438.06 22.75 0.10 107.27
avg-cpu: %user %nice %sys %idle13.04 0.33 68.15 18.48
load averages: 0.09, 0.04, 0.03 16:31:0966 processes: 65 sleeping, 1 on cpuCPU states: 69.2% idle, 18.9% user, 11.9% kernel, 0.0% iowait, 0.0% swapMemory: 128M real, 4976K free, 53M swap in use, 542M swap free
EDUCATION
Storage Performance Testing© 2007 Storage Networking Industry Association. All Rights Reserved.
32
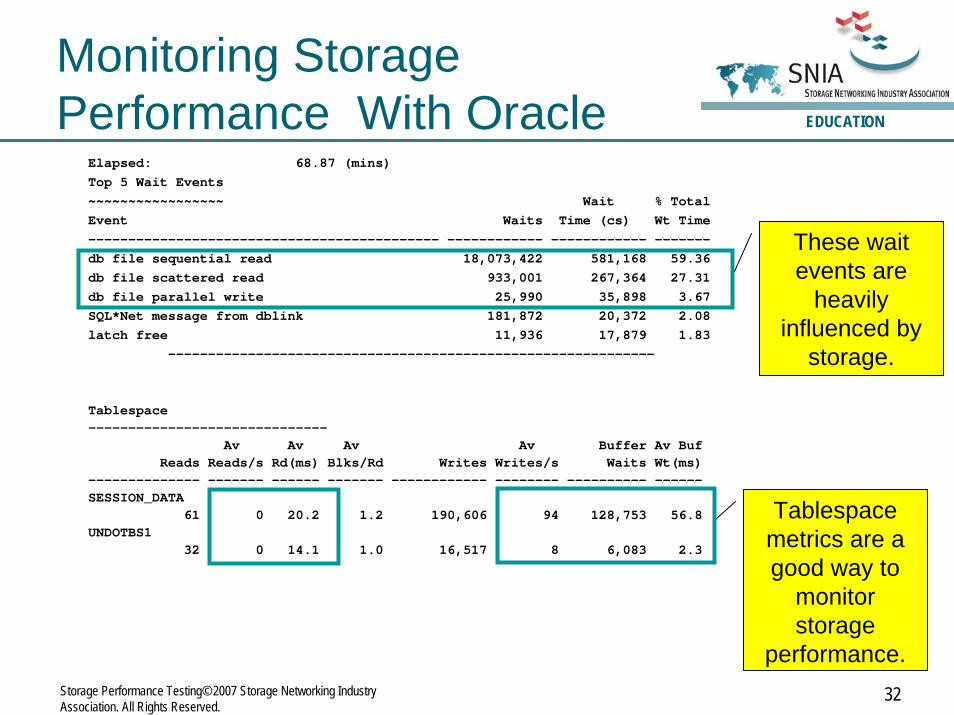
Monitoring Storage Performance With Oracle
Elapsed: 68.87 (mins)Top 5 Wait Events~~~~~~~~~~~~~~~~~ Wait % TotalEvent Waits Time (cs) Wt Time-------------------------------------------- ------------ ------------ -------db file sequential read 18,073,422 581,168 59.36db file scattered read 933,001 267,364 27.31db file parallel write 25,990 35,898 3.67SQL*Net message from dblink 181,872 20,372 2.08latch free 11,936 17,879 1.83
-------------------------------------------------------------
Tablespace------------------------------
Av Av Av Av Buffer Av BufReads Reads/s Rd(ms) Blks/Rd Writes Writes/s Waits Wt(ms)
-------------- ------- ------ ------- ------------ -------- ---------- ------SESSION_DATA
61 0 20.2 1.2 190,606 94 128,753 56.8UNDOTBS1
32 0 14.1 1.0 16,517 8 6,083 2.3
These wait events are
heavily influenced by
storage.
Tablespace metrics are a good way to
monitor storage
performance.
EDUCATION
Storage Performance Testing© 2007 Storage Networking Industry Association. All Rights Reserved.
33
• Risk vs. Reward.– Risk: taking an unsupported, well-traveled evaluation
unit and putting it in a production environment could compromise application availability and expose unexpected system problems.
– Reward: sometimes this is the only way to know for certain that storage performance is acceptable for an application.
Production Testing
EDUCATION
Storage Performance Testing© 2007 Storage Networking Industry Association. All Rights Reserved.
34
Typical Mistakes
• Testing storage performance with file copy commands.
• Comparing storage devices back-to-back without clearing server cache.
• Testing where the data set is so small the benchmark rarely goes beyond server or storage cache.
• Forgetting to monitor processor utilization during testing.
• Monitoring the wrong server’s performance.
EDUCATION
Storage Performance Testing© 2007 Storage Networking Industry Association. All Rights Reserved.
35
Continue Your SNIA Education Experience At SNW• Attend Hands-On Labs in:
Data ClassificationKey to Service Level Management
Data Security and Protection Data Assurance Solutions to Meet Corporate
RequirementsIP Storage
iSCSI, Your IP SANStorage Management
Manage Storage or Be Managed By ItStorage Virtualization
Increasing ProductivityZero to SAN
• Fibre Channel Connectivity in No Time
Sessions begin Monday afternoon, April 16 and continue through Wednesday, April 18. All sessions in Emma/Maggie/Annie, 3rd
Floor of the Hyatt Manchester.Registration at the SNW Registration area
EDUCATION
Storage Performance Testing© 2007 Storage Networking Industry Association. All Rights Reserved.
36
Q&A / Feedback• Please send any questions or comments on this presentation to
SNIA: [email protected]
Many thanks to the following individuals for their contributions to this tutorial.
SNIA Education Committee
Sarah Worthy Jamon BowenStorage Performance Council Elaine SilberChris Lionetti Rob Peglar