Embed Size (px)
Citation preview
Stout Restricted Stock Study Companion Guide © 2021 Stout Risius Ross, LLC
1
To Users of Our Study:
It is our pleasure to present the 2021 edition of the Stout Restricted Stock Study Companion Guide, which is provided to users of the Stout Restricted Stock Study™ at www.BVResources.comsm. Before using the study, please review the information contained in this guide.
The Stout Restricted Stock Study™ is designed to assist the valuation professional charged with determining discounts for lack of marketability. We believe this study to be the most robust restricted stock study to date.
We would like to express our gratitude for the support we have received from Business Valuation Resources in preparing this update to the study and for its valuable assistance in developing the Stout DLOM Calculator™.
Finally, we would like to thank the many subscribers who have raised thought-provoking questions and provided valuable feedback regarding the database over the years, which have resulted in continual improvements to the study.
Sincerely,
STOUT
© 2021 Stout Risius Ross, LLC
All rights reserved. No part of this publication may be reproduced, stored in a retrieval system, or transmitted, in any form or by any means, electronic, mechanical, photocopying, recording, or otherwise, without the prior written permission of the copyright owner.
The Stout Restricted Stock Study & DLOM Calculator is governed by a single-user license agreement. For more information about multiuser license solutions for your firm, please contact at [email protected] or 1-503-479-8200, ext. 2.
Stout Restricted Stock Study Companion Guide © 2021 Stout Risius Ross, LLC
2
Table of Contents
I. Introduction ............................................................................................................................................... 4
The Stout DLOM Calculator .................................................................................................................. 4
Inflation Adjustment Tool ...................................................................................................................... 5
Goals of the Study and Anticipated Future Developments .................................................................... 5
II. Discounts for Lack of Marketability—A Brief History ........................................................................... 6
Discounts Allowed in Prior Court Cases................................................................................................ 6
Benchmark Average Approach ............................................................................................................. 6
The Mandelbaum Approach .................................................................................................................. 8
Restricted Stock Comparative Analysis Approach ................................................................................ 9
III. Understanding Restricted Stock and Rule 144 .................................................................................. 10
Rule 144 ............................................................................................................................................. 10
Amendments to Rule 144.................................................................................................................... 11
Liquidating Restricted Stock Positions ................................................................................................ 13
Registration Rights Agreements ......................................................................................................... 14
IV. Description of the Stout Restricted Stock Study ............................................................................... 15
Selection Criteria ................................................................................................................................. 15
DLOM Calculation ............................................................................................................................... 16
Analysis of the Data ............................................................................................................................ 16
Investment Risk .................................................................................................................................. 17
Industry Classification ......................................................................................................................... 19
Degree of Liquidity .............................................................................................................................. 19
Market Volatility ................................................................................................................................... 21
Summary of Findings .......................................................................................................................... 24
Holding Period Considerations ............................................................................................................ 25
V. DLOM Determination Methodology ..................................................................................................... 27
Discount Methodology ........................................................................................................................ 28
Restricted Stock Equivalent Discount (RSED) .................................................................................... 28
Market Volatility Adjustment ................................................................................................................ 30
Private Entity Discount (PED) ............................................................................................................. 31
Additional Considerations ................................................................................................................... 34
VI. Using the Stout DLOM CalculatorTM ................................................................................................... 36
General Instructions ............................................................................................................................ 36
Restricted Stock Equivalent Discount Analysis ................................................................................... 37
Market Volatility Adjustment ................................................................................................................ 37
Private Entity Discount ........................................................................................................................ 37
Stout Restricted Stock Study Companion Guide © 2021 Stout Risius Ross, LLC
3
Discount Conclusion ........................................................................................................................... 38
VII. Case Study ........................................................................................................................................... 39
Background ......................................................................................................................................... 39
Application of Stout’s Preferred DLOM Determination ........................................................................ 40
VIII. Additional Considerations ................................................................................................................. 45
Restricted Stock of Publicly Traded Companies ................................................................................. 45
Asset-Holding Entities ......................................................................................................................... 45
Stout Restricted Stock Study Companion Guide © 2021 Stout Risius Ross, LLC
4
I. Introduction
In 2001, FMV Opinions Inc. (FMV) began licensing this study through Business Valuation Resources, LLC to provide the valuation community with an analytical tool to provide more detailed analysis in determining a discount for lack of marketability (DLOM). On March 1, 2017, Stout acquired FMV. As a result, the study now benefits from the combined thought leadership and expertise of the combined firm.
The Stout Restricted Stock Study™ consists of over 750 restricted stock transactions with distinct transaction and company characteristics on which comparisons to a subject company can be made. The study represents the most widely used and accepted database available to valuators for DLOM determination.
The study is based on an immense amount of data from the underlying transactions. As valuation professionals have analyzed the data, many realized that significant time must be invested to make appropriate DLOM determinations. For users of the study, valid and necessary questions arise, such as:
Which data are most relevant?
How should I interpret the data?
What is the best way to use the data?
How does Stout use the data?
Valuation analysts that have been successful in court utilizing restricted stock studies tend to do the following: (i) perform a quantitative analysis with respect to each study; (ii) identify attributes that impact the magnitude of discounts in each study; (iii) identify the liquidity attributes of the subject interest; and (iv) perform a comparative analysis between the subject interest and the underlying subjects composing the restricted stock transactions.
This guide provides valuators with the information necessary to understand the theoretical foundation for the DLOM, be fully informed regarding the data underlying the study, weigh the valid discount characteristics, determine an appropriate DLOM, and explain and defend the discount determination when challenged. In Section VI of this guide, we provide a tutorial to users of the Stout DLOM Calculator™, our web-based application for determining a reliable DLOM.
Stout has worked diligently to better understand the marketplace for restricted stock and to incorporate new and useful developments to the study. We trust you will find that these developments will enhance the quality and reliability of your DLOM analyses.
The Stout DLOM Calculator
The calculator was released in fall 2010. This interactive, web-based tool incorporates inputs from a user’s subject company and guides valuators step by step through the methodology for determining the DLOM. The calculator provides valuators with the following benefits:
1. Greatly reduces time and effort in deriving DLOMs;
2. Makes detailed comparisons between subject companies and issuers of restricted stock included in the study;
3. Provides users with the options to exclude restricted stock transactions with registration rights and adjust for specific holding periods, allowing for a more detailed comparison;
4. Provides users with an option to adjust the relevant financial statistics in the study for inflation to enhance comparability with a subject company as of a specific valuation date;

Stout Restricted Stock Study Companion Guide © 2021 Stout Risius Ross, LLC
5
5. Allows users flexibility to enter their own assumptions and tailor the results based on their professional knowledge and experience;
6. Creates an easy-to-follow set of exhibits that can be inserted into the user’s valuation report; and
7. Provides users with the confidence that they are using the latest restricted stock data published by Stout, the industry leader in determining the DLOM.
Inflation Adjustment Tool
Users who choose not to use the calculator can still adjust the statistics in the study for inflation. An Inflation Adjustment Tool is posted on the Stout Articles page. This tool adjusts the data in the study to a user-selected valuation date, based on the Consumer Price Index (CPI), published by the U.S. Bureau of Labor Statistics.
Goals of the Study and Anticipated Future Developments
Stout continues to devote substantial resources to the ongoing development of the study, with the following two primary goals: (1) to provide the largest, most detailed, most accurate, and most current database of restricted stock transactions available; and (2) to add valuable insight as to the appropriate interpretation and application of the data underlying the study for the purpose of more efficient, accurate, and defensible DLOM determinations.
Disclaimer—The discussion included herein illustrates one possible method for deriving a DLOM for noncontrolling interests in private companies and may not be appropriate in all cases. The application of the proposed methodology to the subject interest in ABC Corp., as described in Section VII, is provided for illustrative purposes only and may not be relied upon by anyone, for any purpose, as accurately reflecting the DLOM for any interest in any company, no matter how similar such interest/company may be to the example provided herein. Stout and Business Valuation Resources do not assume any responsibility for the improper use and/or interpretation of the data and/or methodology described herein.
The data and analyses summarized herein are derived from a study, available at www.BVResources.comsm, as of October 2021. The study is periodically updated, and therefore the results of the analyses, as presented herein, and Stout’s proposed methodology for determining a DLOM, are subject to change without notice.
Stout Restricted Stock Study Companion Guide © 2021 Stout Risius Ross, LLC
6
II. Discounts for Lack of Marketability—A Brief History
Discounts Allowed in Prior Court Cases
The data available to the first valuators regarding how to determine a DLOM were extremely limited. As a result, many valuators cited the marketability discounts determined in prior court decisions to support a DLOM. In fact, many initial challenges by the IRS regarding the DLOM still contain a list of prior court cases and the discount determined in each case.
With the passage of time and evolution of valuation, the courts do not view the “discounts-allowed-in-prior-court-cases approach” to determine discounts favorably. To illustrate, in the LeFrak case, echoing other prior decisions, the court stated,
“We must remind the parties that the amount of discount must be decided on the basis of the record in the instant case, and not on what a court found reasonable in another case involving different evidence.”1
While it may be productive for an attorney advocating for their client to discuss discounts determined in prior court cases when negotiating with the IRS over the magnitude of the DLOM, it is generally not appropriate for a valuation expert to rely on this approach in a formal appraisal.
Benchmark Average Approach
In 1971, with the publication of the Security and Exchange Commission’s “Institutional Investor Study” (SEC Study), the valuator had a tool, based on empirical evidence, to aid in determining the DLOM. The SEC Study examined more than 300 private placement purchases of stock that were restricted under provisions similar to Rule 144, issued by publicly traded companies, which occurred between 1966 and mid-1969. This landmark study found that, on average, sales of restricted stock sold at a 24% discount to its otherwise identical publicly traded sister stock. Importantly, the SEC Study found that restricted stock discounts were correlated with certain key financial metrics of the issuer and were higher if the freely traded sister securities were traded “over-the-counter” rather than on an established securities exchange. For the first time, valuators could point to hard data involving actual “willing buyers” and “willing sellers” to support a DLOM. The SEC Study was the catalyst for the IRS’ issuance of Revenue Ruling 77-287, which established guidelines for the valuation of “securities that cannot be immediately resold because they are restricted from resale pursuant to federal securities laws.” Revenue Ruling 77-287 outlines two major factors that a purchaser of restricted securities must consider:
The risk that the underlying value of the stock will change in a way that, absent the restrictive provisions, would have prompted a decision to sell; and
The risk that the contemplated means of legally disposing of the stock may not materialize.
The ruling emphasized that no automatic formula could be used and that the discounts were a function of the company’s investment attributes, such as earnings, net assets, sales, trading market, and any resale agreement provisions.
The SEC Study marked the beginning of a series of other restricted stock transaction studies (see Exhibit 1). However, many of these subsequent studies generally differed from the SEC Study in two important ways. First, these studies involved a very limited number of transactions. Second, they generally reported only the average discount and lacked the detailed background of the SEC Study that allows for an analysis of how the characteristics of a given company influence the magnitude of the discount. Important to many
1 Estate of LeFrak, T.C. Memo. 1993-526 (Nov. 16, 1993).
Stout Restricted Stock Study Companion Guide © 2021 Stout Risius Ross, LLC
7
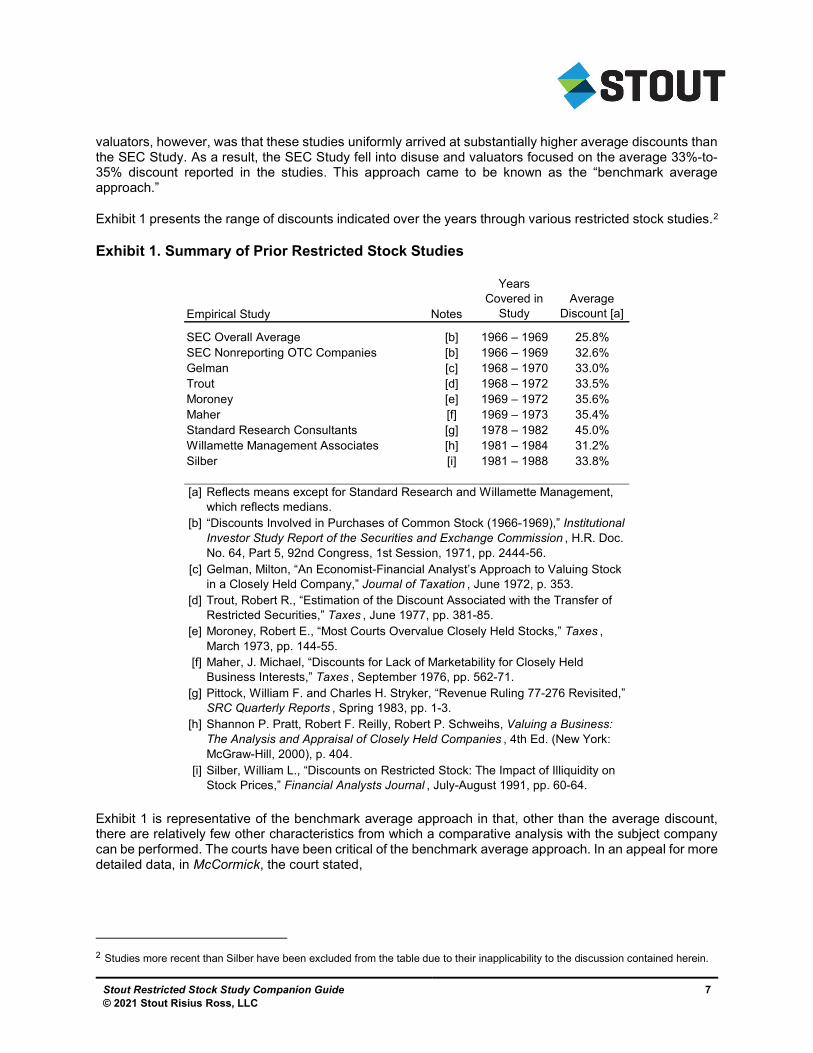
valuators, however, was that these studies uniformly arrived at substantially higher average discounts than the SEC Study. As a result, the SEC Study fell into disuse and valuators focused on the average 33%-to-35% discount reported in the studies. This approach came to be known as the “benchmark average approach.”
Exhibit 1 presents the range of discounts indicated over the years through various restricted stock studies.2
Exhibit 1. Summary of Prior Restricted Stock Studies
Exhibit 1 is representative of the benchmark average approach in that, other than the average discount, there are relatively few other characteristics from which a comparative analysis with the subject company can be performed. The courts have been critical of the benchmark average approach. In an appeal for more detailed data, in McCormick, the court stated,
2 Studies more recent than Silber have been excluded from the table due to their inapplicability to the discussion contained herein.
Empirical Study Notes
Years Covered in
StudyAverage
Discount [a]
SEC Overall Average [b] 1966 – 1969 25.8%SEC Nonreporting OTC Companies [b] 1966 – 1969 32.6%Gelman [c] 1968 – 1970 33.0%Trout [d] 1968 – 1972 33.5%Moroney [e] 1969 – 1972 35.6%Maher [f] 1969 – 1973 35.4%Standard Research Consultants [g] 1978 – 1982 45.0%Willamette Management Associates [h] 1981 – 1984 31.2%Silber [i] 1981 – 1988 33.8%
[a]
[b]
[c]
[d]
[e]
[f]
[g]
[h]
[i]
Shannon P. Pratt, Robert F. Reilly, Robert P. Schweihs, Valuing a Business: The Analysis and Appraisal of Closely Held Companies , 4th Ed. (New York: McGraw-Hill, 2000), p. 404.Silber, William L., “Discounts on Restricted Stock: The Impact of Illiquidity on Stock Prices,” Financial Analysts Journal , July-August 1991, pp. 60-64.
Reflects means except for Standard Research and Willamette Management, which reflects medians.
Pittock, William F. and Charles H. Stryker, “Revenue Ruling 77-276 Revisited,” SRC Quarterly Reports , Spring 1983, pp. 1-3.
“Discounts Involved in Purchases of Common Stock (1966-1969),” Institutional Investor Study Report of the Securities and Exchange Commission , H.R. Doc. No. 64, Part 5, 92nd Congress, 1st Session, 1971, pp. 2444-56.Gelman, Milton, “An Economist-Financial Analyst’s Approach to Valuing Stock in a Closely Held Company,” Journal of Taxation , June 1972, p. 353.Trout, Robert R., “Estimation of the Discount Associated with the Transfer of Restricted Securities,” Taxes , June 1977, pp. 381-85. Moroney, Robert E., “Most Courts Overvalue Closely Held Stocks,” Taxes , March 1973, pp. 144-55.Maher, J. Michael, “Discounts for Lack of Marketability for Closely Held Business Interests,” Taxes , September 1976, pp. 562-71.

Stout Restricted Stock Study Companion Guide © 2021 Stout Risius Ross, LLC
8
“Respondent relied on third-party studies for her … base [discount]. We are unable to analyze the specifics of respondent’s base.”3
In other words, the courts are seeking “first-party studies” with sufficient data available underlying the discounts so that they may ensure valuators make appropriate comparisons.
This complaint was echoed in Peracchio, as the court dismissed the discount determined by the use of the benchmark average approach, stating,
“[The valuation expert] simply lists the average discounts observed in several such studies, effectively asking us to accept on faith the premise that the approximate average of those results provides a ‘reliable benchmark for the transferred interests.’”4
In Temple, the court stated,
“Rather than taking restricted stock sale data and explaining its relation to the gifted interests, [the taxpayer’s expert] simply listed the studies and picked a discount based on the range of numbers in the studies.”5
The Mandelbaum Approach
In Mandelbaum v. Commissioner,6 both experts used the benchmark average approach in support of their respective discounts. However, as a variation on the benchmark average approach, Judge David Laro developed a nine-factor adjustment process to the benchmark average. These factors are:
1. Financial statement analysis;
2. Company’s dividend policy;
3. Nature of the company, its history, its position in the industry, and its economic outlook;
4. Company management;
5. Amount of control in transferred shares;
6. Restrictions on transferability of stock;
7. Holding period for stock;
8. Company’s redemption policy; and
9. Costs associated with making a public offering.
This nine-step approach was an improvement over the benchmark average approach and invited valuators to perform a more detailed analysis of the subject company and subject interest being valued. However, the problem remained that, without the underlying data, there is no ability to assess the specifics of the subject company against the unpublished (and therefore unknown) data underlying the discount averages in order to quantify the impact of the Mandelbaum factors on the DLOM.
3 Estate of McCormick, T.C. Memo. 1995-371 (Aug. 7, 1995). 4 Peracchio v. Commissioner, T.C. Memo. 2003-80 (Sept. 25, 2003). 5 Temple v. U.S., No. 9:03-CV-165 (March 10, 2006). 6 Mandelbaum v. Commissioner, T.C. Memo. 1995-255, affd. 91 F.3d 124 (3rd Circuit, 1996).
Stout Restricted Stock Study Companion Guide © 2021 Stout Risius Ross, LLC
9
Restricted Stock Comparative Analysis Approach
In Temple v. U.S., the court was faced with three different discount approaches: the benchmark average approach; the quantitative marketability discount model (QMDM), a version of the discounted cash flow approach to determining the DLOM; and the restricted stock comparative analysis approach (RSCAA). The Temple court rejected both the benchmark average approach and the QMDM. However, the court responded favorably to the RSCAA, stating,
“As for the lack-of-marketability discount, the Court finds reliability in the fact that [the valuation expert] endeavored to understand and incorporate the market dynamics of restricted stock sales.… The better method is to analyze the data from the restricted stock studies and relate it to the gifted interests.”
To use the RSCAA, two things are necessary: (1) a sufficient database of restricted stock transactions, including specific characteristics of the underlying companies; and (2) an in-depth understanding of restricted stock.

Stout Restricted Stock Study Companion Guide © 2021 Stout Risius Ross, LLC
10
III. Understanding Restricted Stock and Rule 144
To effectively use the study, it is important for valuation experts to understand restricted stock. The term “restricted stock” is often used synonymously with “unregistered stock” or “letter stock” and refers to: (1) unregistered shares public companies issue in private placement transactions; and (2) registered and unregistered securities affiliates of issuers hold. Restricted stock may not be sold through public transactions, not because of contractual arrangements between holders and issuers, but rather due to securities laws and regulations.
After the stock market crash of 1929, the federal government sought ways to prevent manipulation of stock prices through the purchasing and “dumping” of large blocks of stock. While the government understood that, periodically, legitimate long-term investors may want to sell their shares, the government sought to limit the ability of short-term speculators to do the same. Through passage of the Securities Act of 1933 (the Act), the government requires registration of nearly all securities prior to their sale in public transactions, unless an exemption from registration under the Act can be found. Private placements are exempt under Section 4(2) of the Act, and the exemption most commonly used for resale of unregistered stock in the public markets is Section 4(1)—transactions not involving issuers, underwriters, or dealers. Section 2(a)(11) of the Act defines underwriters as anyone who participates in a distribution or who “has purchased from an issuer with a view to … distribution.” (emphasis added) Anyone who purchases unregistered securities from an issuer in a private placement, for example, and then wishes to sell the stock to the public must show that he or she is not an underwriter in order to qualify for this exemption from registration.
Prior to the adoption of Rule 144, the SEC and the courts were required to delve into the subjective intent of the purchaser to reach a conclusion regarding whether a seller of unregistered shares qualified for exemption under Section 4(1). In other words, they needed to ascertain whether the purchaser bought unregistered stock with a view to distributing it. Over time, this subjective test evolved in the courts into a complicated set of rules, focusing on how long the purchaser had held the securities and whether the purchaser had undergone a change of circumstances that might force a sale. This complex and unpredictable situation was unsatisfactory to issuers, investors, and the SEC alike. Under this regime, unregistered securities had severely limited marketability.
Rule 144
In January 1972, the SEC adopted Rule 144 under the Act as an objective safe harbor for the resale of restricted securities. The result was an improvement in the liquidity of restricted stock as the rules surrounding resale became significantly more predictable. Rule 144 regulates public sales of restricted securities, including both unregistered securities and control securities. Unregistered securities are those acquired in private sales from public issuers or affiliates of public issuers through private placement offerings, Regulation D offerings, or employee stock benefit plans, or in exchange for startup capital.7 Control securities are those affiliates of issuers hold, where affiliates are those with the power to direct the company’s management and policies, whether through the ownership of voting securities, by contract, or otherwise. The definition of an “affiliate” is similar to, but not the same as, the definition of an “insider” under Section 16 of the Securities Exchange Act of 1934. Individuals may be considered affiliates based on evidence of actual control exercised, board seats held, management responsibilities, and percentage ownership. Owners of 5% of an issuer’s outstanding shares or more are typically considered affiliates. However, while this figure is widely relied upon, it is not included in any rule or statute.8 Rule 144 governs public sales by affiliates of both unregistered and registered stock, while it only governs sales by
7 Rule 144(a)(3) identifies what types of transactions produce restricted securities. 8 Spadaccini, Michael, Untangling Rule 144: Restricted Stock Sales and Affiliate Volume Limitations, LearnAboutLaw.com, July 2003.
Stout Restricted Stock Study Companion Guide © 2021 Stout Risius Ross, LLC
11
nonaffiliates of unregistered stock. It is important to note that restricted shares may always be sold to other “accredited” investors in private sales.9
To prevent the purchasing of unregistered securities with a view to resale in public markets, Rule 144 requires an initial holding period of some length of time. Under the original version of the rule, all unregistered securities had to be held for at least two years, measured from the time the securities were purchased from the issuer or an affiliate, before any public resale. After the initial holding period, unregistered securities could be sold in public transactions by complying with certain “dribble-out,” or volume-limit, provisions. According to these provisions, the total amount of unregistered securities sold in public transactions in any three-month period, to qualify for exemption from registration, is determined as follows:
For exchange-listed and Nasdaq-quoted securities, up to the greater of: (i) 1% of the outstanding shares of the same class being sold; or (ii) the average reported weekly trading volume during the four weeks preceding each sale; and
For over-the-counter issuers (OTCBB and Pink Sheets), up to 1% of the outstanding shares of the same class being sold.
Furthermore, to sell securities under Rule 144, issuers subject to the public reporting requirements of the Act must be current in their filing of all reports (financial and other) required by the SEC, and issuers not subject to the reporting requirements under the Act must have information publicly available equivalent to that found in a 15c2-11 filing (which may be satisfied by posting corporate and financial information to their company websites). Rule 144 provides additional requirements for affiliates, including the following:
Manner of sale requirement—Sales must be handled in all respects as routine trading transactions, meaning that brokers may not receive more than a normal commission and neither the seller nor the broker can solicit orders to buy the securities; and
Filing requirement—The seller must file a Notice of Proposed Sale with the SEC (Form 144) in advance of any sale, effective for three months, if the sale involves more than 5,000 shares or the aggregate dollar amount is greater than $50,000 in any three-month period.
Rule 144 has become the resale exemption of choice for unregistered and affiliate-held securities, in particular after the 1983-to-2008 amendments (as described below), though other exemptions may be available in certain circumstances. Rule 144 is nonexclusive, and facts and circumstances may allow the Section 4(1) exemption to be used even if the requirements of Rule 144 have not all been satisfied.
Amendments to Rule 144
Rule 144 has been amended as follows on various occasions, each time resulting in improved liquidity for restricted stock:
In 1983, Rule 144(k) was added and provides that nonaffiliates may sell unregistered securities without volume limits after three years from the date of purchase.
In 1990, the “tacking” concept of Rule 144 was amended. Prior to this amendment, any sale of unregistered stock, even in privately negotiated transactions, would result in the required holding restarting. The 1990 amendment allowed nonaffiliate purchasers to “tack” the previous owners’ holding period onto their own holding period, as long as the previous owners were nonaffiliates of the issuer.
9 Private sales of restricted shares are neither governed nor protected by Rule 144 and commonly rely upon what is known as the “4(1 and ½)” exemption.
Stout Restricted Stock Study Companion Guide © 2021 Stout Risius Ross, LLC
12
In 1997, the initial holding period was decreased from two years to one year and the ultimate holding period for nonaffiliates was shortened from three years to two years (affiliates remain subject to Rule 144 requirements as long as they are affiliates).
In 2008, the initial holding period was shortened from one year to six months, and the ultimate holding period for nonaffiliates was shortened from two years to one year (affiliates remain subject to Rule 144’s requirements as long as they are affiliates).
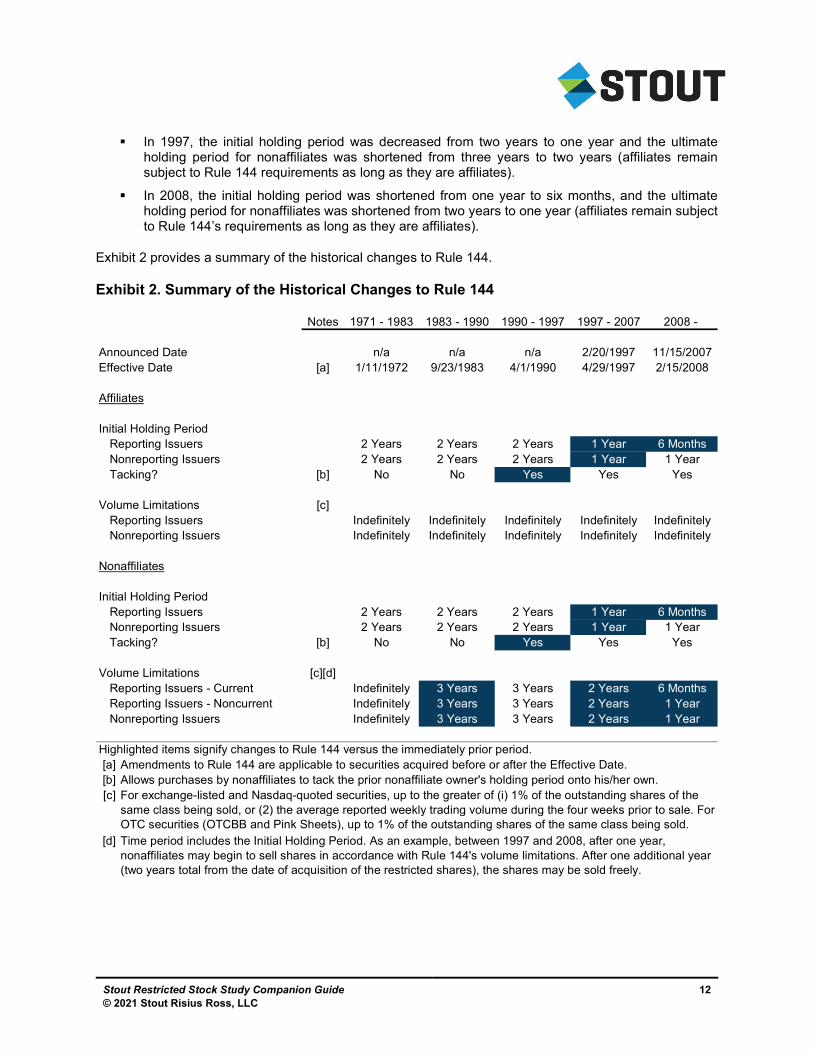
Exhibit 2 provides a summary of the historical changes to Rule 144.
Exhibit 2. Summary of the Historical Changes to Rule 144
Notes 1971 - 1983 1983 - 1990 1990 - 1997 1997 - 2007 2008 -
Announced Date n/a n/a n/a 2/20/1997 11/15/2007Effective Date [a] 1/11/1972 9/23/1983 4/1/1990 4/29/1997 2/15/2008
Affiliates
Initial Holding PeriodReporting Issuers 2 Years 2 Years 2 Years 1 Year 6 MonthsNonreporting Issuers 2 Years 2 Years 2 Years 1 Year 1 YearTacking? [b] No No Yes Yes Yes
Volume Limitations [c]Reporting Issuers Indefinitely Indefinitely Indefinitely Indefinitely IndefinitelyNonreporting Issuers Indefinitely Indefinitely Indefinitely Indefinitely Indefinitely
Nonaffiliates
Initial Holding PeriodReporting Issuers 2 Years 2 Years 2 Years 1 Year 6 MonthsNonreporting Issuers 2 Years 2 Years 2 Years 1 Year 1 YearTacking? [b] No No Yes Yes Yes
Volume Limitations [c][d]Reporting Issuers - Current Indefinitely 3 Years 3 Years 2 Years 6 MonthsReporting Issuers - Noncurrent Indefinitely 3 Years 3 Years 2 Years 1 YearNonreporting Issuers Indefinitely 3 Years 3 Years 2 Years 1 Year
Highlighted items signify changes to Rule 144 versus the immediately prior period.[a] Amendments to Rule 144 are applicable to securities acquired before or after the Effective Date.[b] Allows purchases by nonaffiliates to tack the prior nonaffiliate owner's holding period onto his/her own.[c]
[d]
For exchange-listed and Nasdaq-quoted securities, up to the greater of (i) 1% of the outstanding shares of the same class being sold, or (2) the average reported weekly trading volume during the four weeks prior to sale. For OTC securities (OTCBB and Pink Sheets), up to 1% of the outstanding shares of the same class being sold.Time period includes the Initial Holding Period. As an example, between 1997 and 2008, after one year, nonaffiliates may begin to sell shares in accordance with Rule 144's volume limitations. After one additional year (two years total from the date of acquisition of the restricted shares), the shares may be sold freely.
Stout Restricted Stock Study Companion Guide © 2021 Stout Risius Ross, LLC
13
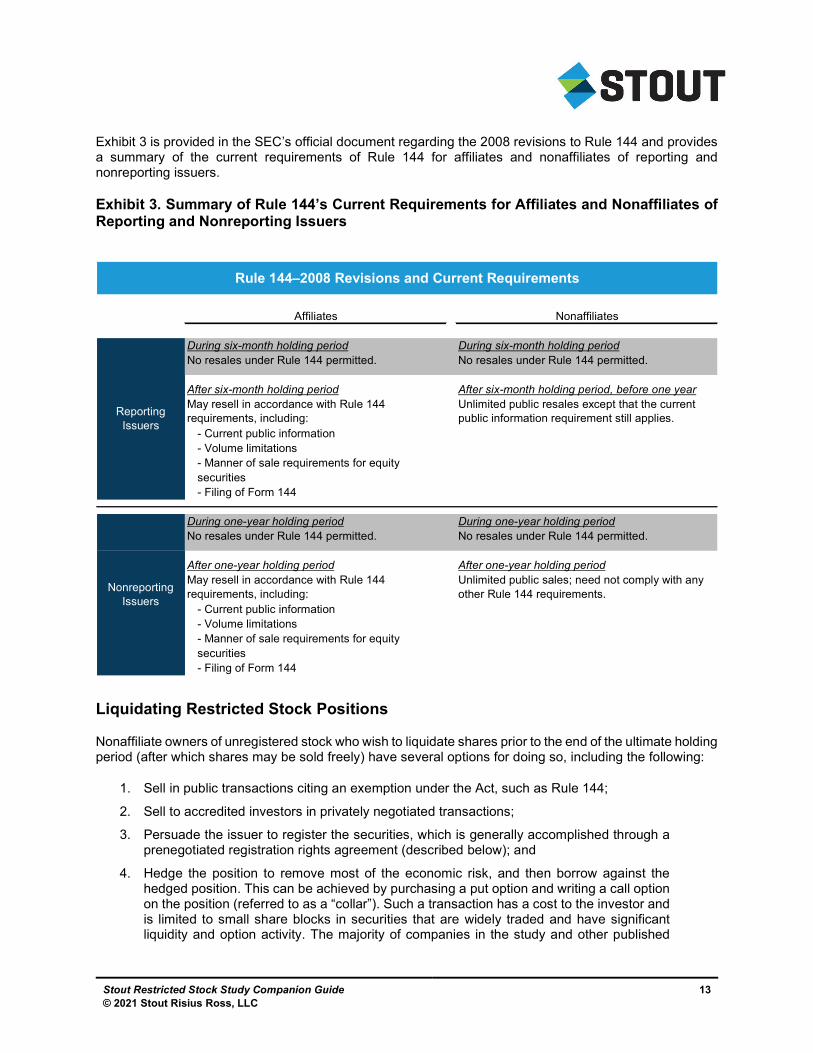
Exhibit 3 is provided in the SEC’s official document regarding the 2008 revisions to Rule 144 and provides a summary of the current requirements of Rule 144 for affiliates and nonaffiliates of reporting and nonreporting issuers.
Exhibit 3. Summary of Rule 144’s Current Requirements for Affiliates and Nonaffiliates of Reporting and Nonreporting Issuers
Liquidating Restricted Stock Positions
Nonaffiliate owners of unregistered stock who wish to liquidate shares prior to the end of the ultimate holding period (after which shares may be sold freely) have several options for doing so, including the following:
1. Sell in public transactions citing an exemption under the Act, such as Rule 144;
2. Sell to accredited investors in privately negotiated transactions;
3. Persuade the issuer to register the securities, which is generally accomplished through a prenegotiated registration rights agreement (described below); and
4. Hedge the position to remove most of the economic risk, and then borrow against the hedged position. This can be achieved by purchasing a put option and writing a call option on the position (referred to as a “collar”). Such a transaction has a cost to the investor and is limited to small share blocks in securities that are widely traded and have significant liquidity and option activity. The majority of companies in the study and other published
Rule 144–2008 Revisions and Current Requirements
Affiliates Nonaffiliates
During six-month holding period During six-month holding periodNo resales under Rule 144 permitted. No resales under Rule 144 permitted.
After six-month holding period After six-month holding period, before one year
- Current public information- Volume limitations- Manner of sale requirements for equitysecurities- Filing of Form 144
During one-year holding period During one-year holding periodNo resales under Rule 144 permitted. No resales under Rule 144 permitted.
After one-year holding period After one-year holding period
- Current public information- Volume limitations- Manner of sale requirements for equitysecurities- Filing of Form 144
May resell in accordance with Rule 144 requirements, including:
Unlimited public sales; need not comply with any other Rule 144 requirements.
Nonreporting Issuers
May resell in accordance with Rule 144 requirements, including:
Unlimited public resales except that the current public information requirement still applies.
Reporting Issuers

Stout Restricted Stock Study Companion Guide © 2021 Stout Risius Ross, LLC
14
restricted stock studies are not large and liquid enough to be good candidates for such hedging or sale transactions.
Registration Rights Agreements
Even though the resale limitations of Rule 144 have been relaxed somewhat over the years, investors often negotiate with issuers in private placements to provide for possible liquidity prior to the end of the required holding period by entering into registration rights agreements. These agreements typically occur in one of the following forms:
1. Demand registration rights—Require issuers to register the shares or a portion of the shares upon the purchaser’s request, generally at the issuer’s expense. These are typically considered the most valuable form of registration rights and are also the rarest form.
2. Mandatory registration rights—Require issuers to register the shares or a portion of the shares within some specified time frame, at either the issuer’s or the investor’s expense. While these rights provide investors with some benefit, there are often lengthy periods until required registration.
3. Piggyback registration rights—Grant investors the right to register the shares when either the issuer or another investor initiates a registration of shares. These are viewed as inferior to demand and mandatory registration rights because the investor cannot initiate the registration process.
The presence of a registration rights agreement tends to improve the liquidity of restricted stock. However, there is no “standard” registration rights agreement, and it is difficult to gauge the precise impact that a particular registration rights agreement has on the marketability of a particular security. Even after registration, many investors may be deemed to be affiliates and thus still subject to Rule 144. Accordingly, restricted stock, even when registration rights are present, is less liquid than the issuer’s unrestricted shares. Outside of a prenegotiated registration rights agreement, a holder of unregistered securities is unlikely to be able to force the issuer to register the shares due to the significant time, effort, and expense involved.
Stout Restricted Stock Study Companion Guide © 2021 Stout Risius Ross, LLC
15
IV. Description of the Stout Restricted Stock Study
Compiled since 1991, the study is a database of private placements of unregistered common stock issued by public companies. As of October 2021, the study includes transactions from 1980 to 2020. Over the years, the number of transactions in the database has grown to approximately 750. The database will continue to grow over time as new transactions are generally added quarterly (with a two-quarter lag, e.g., Q1 is generally updated at the end of Q3).
Selection Criteria
Most of the transactions in the study were discovered through searches using a number of sources, including: 10K Wizard, Security Data Corp.; EDGAR and EDGAR Pro; Dow Jones News Retrieval; Disclosure CompactD; and S&P Corporate Transactions Records. Sagient Research, a data research company that compiles PIPE transactions, provided more recent transactions. For each transaction identified, we conducted thorough reviews of all relevant public filings and exhibits thereto, including but not limited to forms 8-K, 10-K, 10-Q, S-1, S-3, S-4, stock purchase agreements, and registration rights agreements. Overall, we reviewed thousands of private placement transactions during the construction of the study. Transactions were eliminated from the study for the following reasons:
1. The transaction was not a private placement of unregistered shares (i.e., the stock was registered prior to the transaction date), or the stock was registered and became fully marketable within 30 days of the transaction.
2. The private placement included debt, preferred stock, convertible preferred stock, or some kind of hybrid equity-derivative security (the security issued must be identical to the publicly traded common stock in all respects other than its unregistered status).
3. The private placement was issued as part of a stock-warrant unit or had warrants attached, or detachable warrants or options were issued with the common stock.
4. The transaction did not close (i.e., was announced and later withdrawn).
5. The stock was not traded on a domestic exchange; the underlying company is a 6-K filing foreign company (as opposed to an 8-K filing domestic company).
6. The stock traded below $1 for the entire month of the transaction, or the trading volume is extremely low.
7. We were unable to determine the private placement discount because significant pieces of information were unavailable, such as the following:
a. The market reference price for the fully liquid shares was unavailable;
b. The private placement transaction price was unavailable; and
c. Only the net transaction proceeds to the issuer were reported publicly (net of unknown transaction costs and fees), not the gross purchase price.
8. There were special contractual arrangements between buyer and seller limiting either the economic upside or downside of the buyer (e.g., an agreement to increase the number of shares purchased if the market trading price were to fall below a certain level within some specified period of time).
9. The stock was issued in connection with a strategic business relationship, a merger or acquisition, in exchange for services or in connection with any other transaction that could cast doubt on the fair market value of the restricted stock.
Stout Restricted Stock Study Companion Guide © 2021 Stout Risius Ross, LLC
16
10. The lead purchaser10 in the transaction was, based on explicit language provided in the issuer’s public filings (or, if not explicitly stated, based on our best judgment considering all available evidence), a “related party” or received one or more seats on the issuer’s board of directors as a result of the transaction.
11. Transactions indicating premiums (negative discounts) in the study were removed. While we do not have access to the underlying purchase contracts, we believe that many of these premiums may be the result of an investment opportunity not available to other investors or an unidentifiable relationship with the seller.
This screening process eliminated over 95% of the transactions reviewed, leaving the current database (as of October 2021) of 763 “plain-vanilla” private placements of restricted common stock.
DLOM Calculation
The DLOM (i.e., transaction discount) is the percentage difference between the private placement price per share and the market trading price per share. If stated explicitly in the language describing the private placement, the transaction discount represents the discount agreed to between the issuer and the purchaser. If not stated, the transaction discount is the percentage difference between the private placement price per share and the closing market price as of the date prior to the agreement date. If the agreement date is not known, the market trading price represents the closing market price as of the day prior to the first to occur of the announcement date or the closing date. For many transactions in the study, only the month of the transaction, not the exact transaction date, is specified. In these instances, the market trading price is represented by the high-low average stock price for the month of the transaction.
Analysis of the Data
This section examines the study data in detail and provides empirical evidence illustrating which company-specific and broader market variables are relevant determinants of the DLOM. In general, these variables relate to the issuer’s risk profile, the degree of liquidity of the privately placed stock, and the overall level of stock market volatility around the time of the transaction.
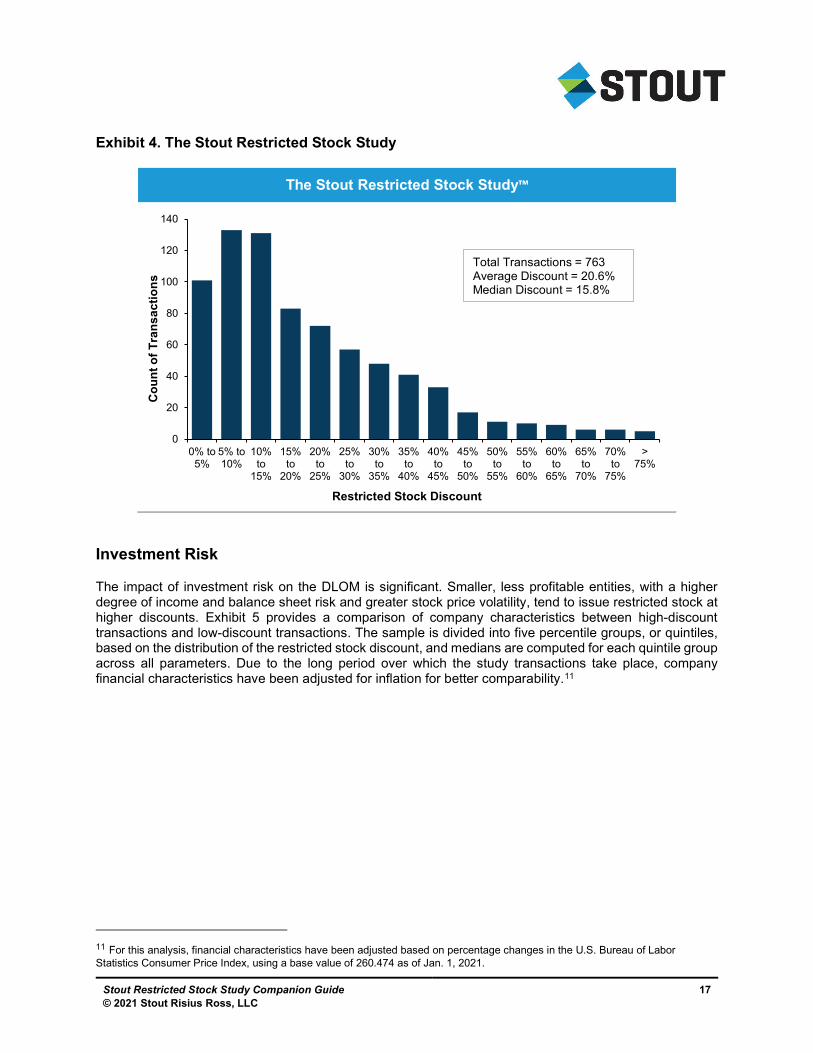
Using data from the study, we have examined 763 private placement transactions of unregistered common stock, with and without registration rights, issued by publicly traded companies from July 1980 through December 2020. The overall average discount for all 763 transactions in the study (as of October 2021) is 20.6%, and the median discount is 15.8%. The discount was calculated by dividing the difference between the private placement price and the market reference price by the market reference price. The market reference price in the study is represented by the stock price on the agreement date, closing date, announcement date, or the high-low average stock price for the month of the transaction if no date is specified. The sample distribution is shown in Exhibit 4.
10 A “lead purchaser” is deemed to be any purchaser of greater than 50% of the shares acquired in the private placement.
Stout Restricted Stock Study Companion Guide © 2021 Stout Risius Ross, LLC
17
Exhibit 4. The Stout Restricted Stock Study
Investment Risk
The impact of investment risk on the DLOM is significant. Smaller, less profitable entities, with a higher degree of income and balance sheet risk and greater stock price volatility, tend to issue restricted stock at higher discounts. Exhibit 5 provides a comparison of company characteristics between high-discount transactions and low-discount transactions. The sample is divided into five percentile groups, or quintiles, based on the distribution of the restricted stock discount, and medians are computed for each quintile group across all parameters. Due to the long period over which the study transactions take place, company financial characteristics have been adjusted for inflation for better comparability.11
11 For this analysis, financial characteristics have been adjusted based on percentage changes in the U.S. Bureau of Labor Statistics Consumer Price Index, using a base value of 260.474 as of Jan. 1, 2021.
The Stout Restricted Stock Study™
0
20
40
60
80
100
120
140
0% to5%
5% to10%
10%to
15%
15%to
20%
20%to
25%
25%to
30%
30%to
35%
35%to
40%
40%to
45%
45%to
50%
50%to
55%
55%to
60%
60%to
65%
65%to
70%
70%to
75%
>75%
Co
un
t o
f T
ran
sa
cti
on
s
Restricted Stock Discount
Total Transactions = 763Average Discount = 20.6%Median Discount = 15.8%

Stout Restricted Stock Study Companion Guide © 2021 Stout Risius Ross, LLC
18
Exhibit 5. Comparison of Company Characteristics Between High-Discount Transactions and Low-Discount Transactions
As shown in Exhibit 5, lower market values, revenues, total assets and book values, and higher market-to-book (MTB) ratios and stock price volatility, are correlated with higher discounts. Accordingly, higher investment risk, as reflected in smaller firm size, higher MTB ratios, and increasing stock price volatility, tends to increase the discount. Profitability is also often used as an indicator of firm risk. However, absolute levels of earnings/losses do not demonstrate a strong correlation with the discount due primarily to the greater impact of company size on the discount. Private placements by large, unprofitable firms tend to exhibit lower discounts than small, profitable firms. Net profit margin tends to be a better indicator than net income as it is not impacted by firm size.
Comparison of Financial Characteristics
In Millions of U.S. DollarsQuintile
1 2 3 4 5
DiscountHigh 7.3% 12.8% 20.1% 33.1% 91.3%Median 3.8% 9.9% 15.8% 25.9% 42.9%Low 0.0% 7.4% 12.8% 20.2% 33.3%
Company Characteristics (Median Statistics)Market Value $200.7 $212.5 $148.9 $117.2 $63.4Revenues 33.9 41.7 24.1 19.3 9.0Total Assets 113.5 92.9 42.1 30.1 11.8Book Value of Equity 52.3 45.6 22.4 15.6 6.8MTB Ratio 2.6 3.3 3.9 5.8 6.1Net Income -2.6 -2.0 -2.1 -4.7 -2.9Net Profit Margin -3.5% -5.4% -5.8% -23.0% -38.7%Volatility 60.9% 65.0% 72.6% 80.0% 99.4%
Note - Transactions are sorted by discount with all statistics being adjusted for inflation.
Stout Restricted Stock Study Companion Guide © 2021 Stout Risius Ross, LLC
19
Industry Classification
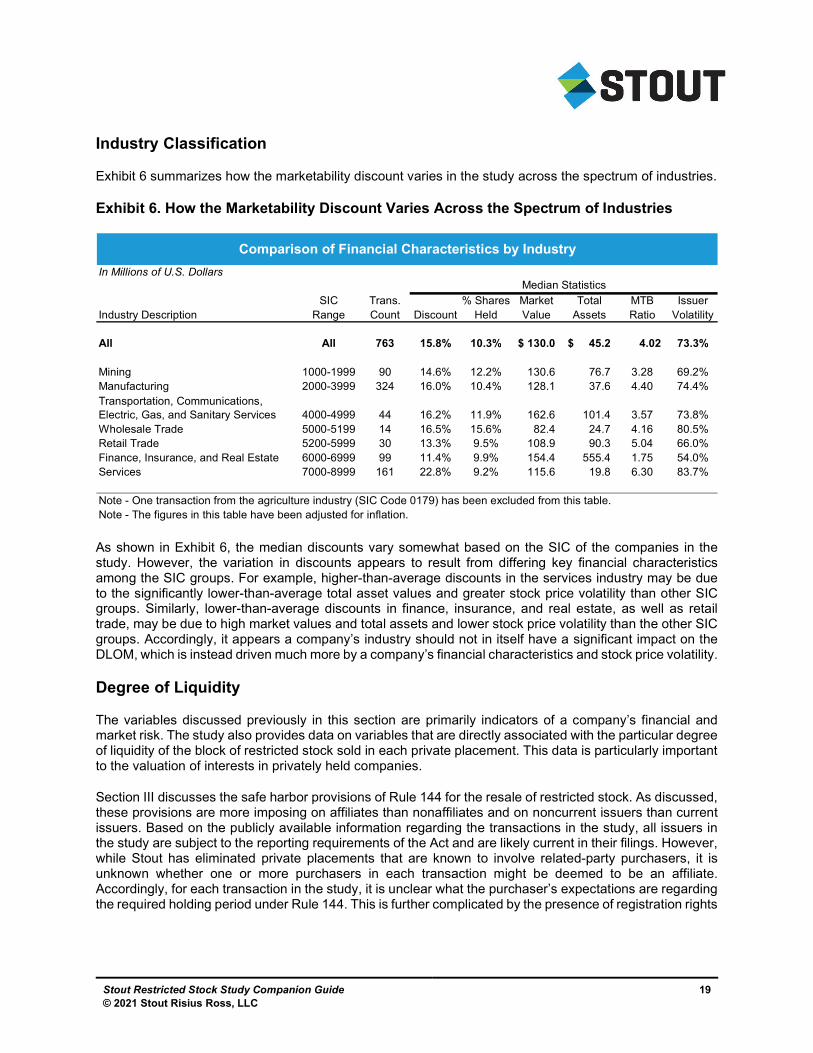
Exhibit 6 summarizes how the marketability discount varies in the study across the spectrum of industries.
Exhibit 6. How the Marketability Discount Varies Across the Spectrum of Industries
As shown in Exhibit 6, the median discounts vary somewhat based on the SIC of the companies in the study. However, the variation in discounts appears to result from differing key financial characteristics among the SIC groups. For example, higher-than-average discounts in the services industry may be due to the significantly lower-than-average total asset values and greater stock price volatility than other SIC groups. Similarly, lower-than-average discounts in finance, insurance, and real estate, as well as retail trade, may be due to high market values and total assets and lower stock price volatility than the other SIC groups. Accordingly, it appears a company’s industry should not in itself have a significant impact on the DLOM, which is instead driven much more by a company’s financial characteristics and stock price volatility.
Degree of Liquidity
The variables discussed previously in this section are primarily indicators of a company’s financial and market risk. The study also provides data on variables that are directly associated with the particular degree of liquidity of the block of restricted stock sold in each private placement. This data is particularly important to the valuation of interests in privately held companies.
Section III discusses the safe harbor provisions of Rule 144 for the resale of restricted stock. As discussed, these provisions are more imposing on affiliates than nonaffiliates and on noncurrent issuers than current issuers. Based on the publicly available information regarding the transactions in the study, all issuers in the study are subject to the reporting requirements of the Act and are likely current in their filings. However, while Stout has eliminated private placements that are known to involve related-party purchasers, it is unknown whether one or more purchasers in each transaction might be deemed to be an affiliate. Accordingly, for each transaction in the study, it is unclear what the purchaser’s expectations are regarding the required holding period under Rule 144. This is further complicated by the presence of registration rights
Comparison of Financial Characteristics by Industry
In Millions of U.S. DollarsMedian Statistics
SIC Trans. % Shares Market Total MTB IssuerIndustry Description Range Count Discount Held Value Assets Ratio Volatility
All All 763 15.8% 10.3% 130.0$ 45.2$ 4.02 73.3%
Mining 1000-1999 90 14.6% 12.2% 130.6 76.7 3.28 69.2%Manufacturing 2000-3999 324 16.0% 10.4% 128.1 37.6 4.40 74.4%
4000-4999 44 16.2% 11.9% 162.6 101.4 3.57 73.8%Wholesale Trade 5000-5199 14 16.5% 15.6% 82.4 24.7 4.16 80.5%Retail Trade 5200-5999 30 13.3% 9.5% 108.9 90.3 5.04 66.0%Finance, Insurance, and Real Estate 6000-6999 99 11.4% 9.9% 154.4 555.4 1.75 54.0%Services 7000-8999 161 22.8% 9.2% 115.6 19.8 6.30 83.7%
Note - One transaction from the agriculture industry (SIC Code 0179) has been excluded from this table.Note - The figures in this table have been adjusted for inflation.
Transportation, Communications, Electric, Gas, and Sanitary Services
Stout Restricted Stock Study Companion Guide © 2021 Stout Risius Ross, LLC
20
agreements in the study,12 the terms of which are largely unknown (especially for older transactions). Therefore, the resulting impact on the liquidity of the shares based on these factors is difficult to assess.
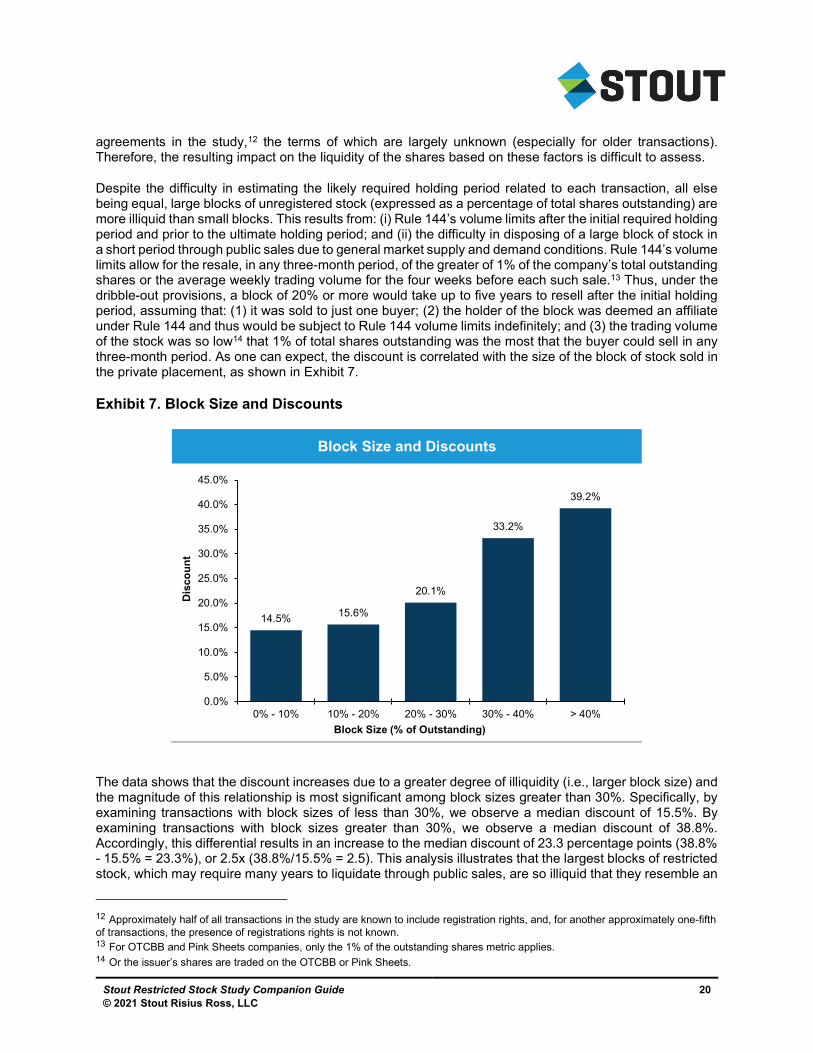
Despite the difficulty in estimating the likely required holding period related to each transaction, all else being equal, large blocks of unregistered stock (expressed as a percentage of total shares outstanding) are more illiquid than small blocks. This results from: (i) Rule 144’s volume limits after the initial required holding period and prior to the ultimate holding period; and (ii) the difficulty in disposing of a large block of stock in a short period through public sales due to general market supply and demand conditions. Rule 144’s volume limits allow for the resale, in any three-month period, of the greater of 1% of the company’s total outstanding shares or the average weekly trading volume for the four weeks before each such sale.13 Thus, under the dribble-out provisions, a block of 20% or more would take up to five years to resell after the initial holding period, assuming that: (1) it was sold to just one buyer; (2) the holder of the block was deemed an affiliate under Rule 144 and thus would be subject to Rule 144 volume limits indefinitely; and (3) the trading volume of the stock was so low14 that 1% of total shares outstanding was the most that the buyer could sell in any three-month period. As one can expect, the discount is correlated with the size of the block of stock sold in the private placement, as shown in Exhibit 7.
Exhibit 7. Block Size and Discounts
The data shows that the discount increases due to a greater degree of illiquidity (i.e., larger block size) and the magnitude of this relationship is most significant among block sizes greater than 30%. Specifically, by examining transactions with block sizes of less than 30%, we observe a median discount of 15.5%. By examining transactions with block sizes greater than 30%, we observe a median discount of 38.8%. Accordingly, this differential results in an increase to the median discount of 23.3 percentage points (38.8% - 15.5% = 23.3%), or 2.5x (38.8%/15.5% = 2.5). This analysis illustrates that the largest blocks of restricted stock, which may require many years to liquidate through public sales, are so illiquid that they resemble an
12 Approximately half of all transactions in the study are known to include registration rights, and, for another approximately one-fifth of transactions, the presence of registrations rights is not known. 13 For OTCBB and Pink Sheets companies, only the 1% of the outstanding shares metric applies. 14 Or the issuer’s shares are traded on the OTCBB or Pink Sheets.
Block Size and Discounts
14.5% 15.6%
20.1%
33.2%
39.2%
0.0%
5.0%
10.0%
15.0%
20.0%
25.0%
30.0%
35.0%
40.0%
45.0%
0% - 10% 10% - 20% 20% - 30% 30% - 40% > 40%
Dis
cou
nt
Block Size (% of Outstanding)
Stout Restricted Stock Study Companion Guide © 2021 Stout Risius Ross, LLC
21
investment in a private entity. Stated differently, the dribble-out provisions of Rule 144, in addition to general supply and demand conditions for the securities, make it so difficult to sell such blocks in public trading that the most attractive solution, in most cases, would be a private sale. As we will explain in Section V, we use these facts, along with the empirical data discussed above, to derive DLOMs for noncontrolling interests in private entities.
Market Volatility
The variables discussed previously in this section are indicators of company-specific financial and market risk and the degree of liquidity of a security. The study also provides data regarding the impact of broader market risk, measured by volatility in equity markets. An analysis of the discounts associated with transactions occurring during periods of abnormally high market volatility suggests that, given a fixed level of company-specific financial and market risk and the degree of liquidity of a security, discounts are greater during high-volatility periods than during normal periods.
To assess the impact of broader market risk on restricted stock discounts, we have assigned each transaction in the study (occurring after June 1990) a “market volatility” variable around the time of the transaction. For this analysis, we utilized “VIX” values, which represent the level of expected future volatility in equity markets and is a widely used measure of market risk.15 To control for short-term fluctuations in VIX values (which are highly volatile) and to account for the typical period required to complete a private placement transaction, we have calculated a trailing six-month average daily VIX closing value for each transaction. For some of the transactions in the database, the exact day is not known, so the market volatility variable for these transactions is the trailing six-month average daily VIX closing value for the month of the transaction.
15 The CBOE Volatility Index® (VIX®) is a key measure of market expectations of near-term volatility conveyed by S&P 500 stock index option prices. Since its introduction in 1993, many have considered VIX to be the world's premier barometer of investor sentiment and market volatility. See www.cboe.com/micro/vix/introduction.aspx.
Stout Restricted Stock Study Companion Guide © 2021 Stout Risius Ross, LLC
22
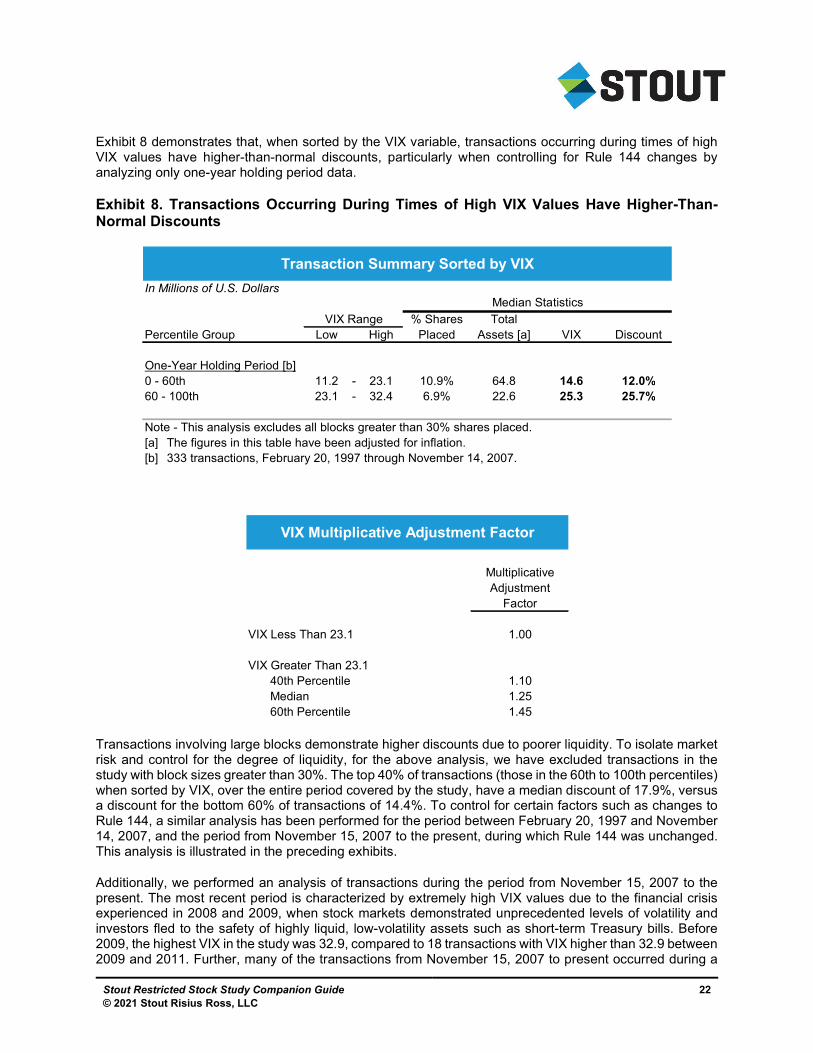
Exhibit 8 demonstrates that, when sorted by the VIX variable, transactions occurring during times of high VIX values have higher-than-normal discounts, particularly when controlling for Rule 144 changes by analyzing only one-year holding period data.
Exhibit 8. Transactions Occurring During Times of High VIX Values Have Higher-Than-Normal Discounts
Transactions involving large blocks demonstrate higher discounts due to poorer liquidity. To isolate market risk and control for the degree of liquidity, for the above analysis, we have excluded transactions in the study with block sizes greater than 30%. The top 40% of transactions (those in the 60th to 100th percentiles) when sorted by VIX, over the entire period covered by the study, have a median discount of 17.9%, versus a discount for the bottom 60% of transactions of 14.4%. To control for certain factors such as changes to Rule 144, a similar analysis has been performed for the period between February 20, 1997 and November 14, 2007, and the period from November 15, 2007 to the present, during which Rule 144 was unchanged. This analysis is illustrated in the preceding exhibits.
Additionally, we performed an analysis of transactions during the period from November 15, 2007 to the present. The most recent period is characterized by extremely high VIX values due to the financial crisis experienced in 2008 and 2009, when stock markets demonstrated unprecedented levels of volatility and investors fled to the safety of highly liquid, low-volatility assets such as short-term Treasury bills. Before 2009, the highest VIX in the study was 32.9, compared to 18 transactions with VIX higher than 32.9 between 2009 and 2011. Further, many of the transactions from November 15, 2007 to present occurred during a
Transaction Summary Sorted by VIX
In Millions of U.S. DollarsMedian Statistics
VIX Range % Shares TotalPercentile Group Low High Placed Assets [a] VIX Discount
One-Year Holding Period [b]0 - 60th 11.2 - 23.1 10.9% 64.8 14.6 12.0%60 - 100th 23.1 - 32.4 6.9% 22.6 25.3 25.7%
Note - This analysis excludes all blocks greater than 30% shares placed.[a] The figures in this table have been adjusted for inflation.[b] 333 transactions, February 20, 1997 through November 14, 2007.
VIX Multiplicative Adjustment Factor
MultiplicativeAdjustment
Factor
VIX Less Than 23.1 1.00
VIX Greater Than 23.140th Percentile 1.10Median 1.2560th Percentile 1.45
Stout Restricted Stock Study Companion Guide © 2021 Stout Risius Ross, LLC
23
period having unusually high VIX, with half above 23. Thus, we calculate the multiplicative adjustment factor using data from the period between February 20, 1997 and November 14, 2007. For this period, which captures periods of very high stock market volatility (e.g., the tech boom and bust of 1997 to 2002), as well as periods of very low stock market volatility (e.g., 2003 to mid-2007), the study contains 333 one-year-holding-period-era transactions with block sizes less than 30%, providing a rich sample for analysis. As shown, the top 40% of transactions (those in the 60th-to-100th percentiles) when sorted by VIX have a median discount of 25.7%, versus only 12.0% for the bottom 60% of transactions. Based on our analysis, in the event that a valuation date falls within a period of high market volatility, it is appropriate to apply an adjustment factor to the discount arrived at by comparison of company-specific financial and market risk and security liquidity characteristics.
The impact of market volatility on restricted stock discounts is particularly important during the latter part of 2008, when the VIX soared well above historical highs. Prior to 2008, a VIX reading of 20 or below was considered to be an indication of investor calm and confidence in the market, while a VIX value of 30 or above was considered to reflect investor panic. From 1990 through the end of 2008, the VIX briefly topped 40 during only three periods: the 1998 Russian debt crisis and subsequent collapse of Long-Term Capital Management, the dot-com bubble collapse, and the attack on the World Trade Center and Pentagon on September 11, 2001. However, during October 2008, the average VIX daily closing value was 61.2; on October 27, 2008, the VIX closed at over 80.0. One would expect significantly higher restricted stock discounts during this period in light of such extreme market volatility.
The study includes 35 arm’s-length common-stock-only private placements during 2008. Not surprisingly, the majority of these transactions occurred during the first half of the year, and only nine were completed after August 2008, when investors largely fled to less volatile, more liquid investments. The median discount for the transactions occurring between January 1, 2008 and September 15, 2008 was 10.0%. However, it was 24.8% for transactions occurring from September 15, 2008 to the end of the year, approximately 2.5 times the median discount for the first eight months of 2008. Furthermore, companies that successfully completed private placements after August 2008 demonstrated substantially stronger financial and market risk characteristics than those during the first eight months of the year, which would otherwise suggest lower, rather than higher, discounts for such companies. This indicates that the actual impact of increased market volatility may be even greater than observed (i.e., when the VIX is below 30).
One issuer included in the study, Western Alliance Bancorporation (WAL), privately placed an 11.2% block of its common shares on June 27, 2008, and another 11.3% block on September 30, 2008. Based on block size and the terms of registration rights provided in each case, the two blocks purchased appear roughly equivalent with respect to liquidity. Furthermore, between June 27, 2008 and September 30, 2008, WAL’s share price increased from $8.11 per share to $15.50 per share, similar to the share price increases of major competitors Bank of America and Wells Fargo, suggesting an improved market for WAL’s stock and the financial sector generally. However, between the two transaction dates, the VIX increased from 23.4 to 39.4, a nearly twofold increase. As a result, the June transaction had a discount of 2.1%, while the September transaction had a discount of 25.6%.

Stout Restricted Stock Study Companion Guide © 2021 Stout Risius Ross, LLC
24
Summary of Findings
In summary, our analysis of the data in the study suggests that the most important determinants of the magnitude of the DLOM are: (1) the issuing firm’s financial and market risk; (2) the level of stock market volatility prevailing around the transaction date; and (3) the degree of liquidity of the securities. Regarding certain company-specific and market variables that fall into the above categories, the study data demonstrate the following correlations with the DLOM:
Negatively correlated with:
1. The issuing firm’s market value of equity;
2. The issuing firm’s revenues;
3. The issuing firm’s total assets;
4. The issuing firm’s book value of shareholders’ equity; and
5. The issuing firm’s net profit margin.
Positively correlated with:
1. The issuing firm’s MTB ratio;
2. The issuing firm’s stock price volatility;
3. The block size of the placement, described as a percentage of the total ownership; and
4. The level of market volatility prevailing as of the transaction date, as measured by VIX.
Stout Restricted Stock Study Companion Guide © 2021 Stout Risius Ross, LLC
25
Holding Period Considerations
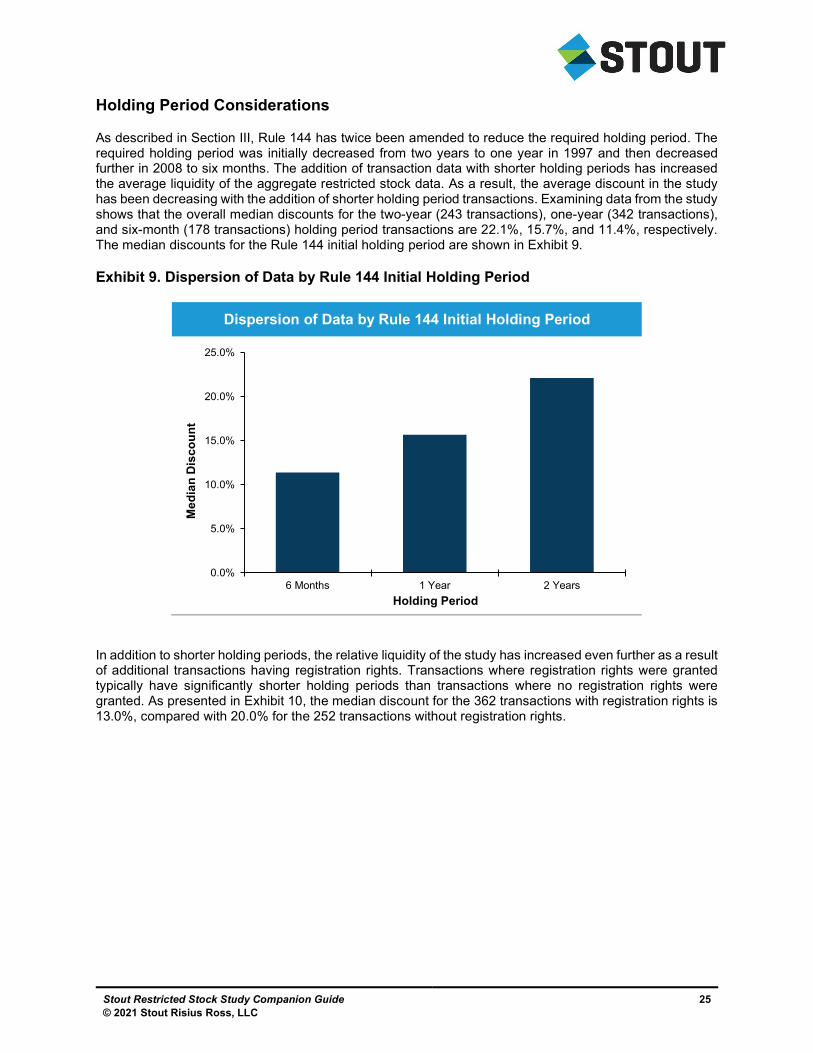
As described in Section III, Rule 144 has twice been amended to reduce the required holding period. The required holding period was initially decreased from two years to one year in 1997 and then decreased further in 2008 to six months. The addition of transaction data with shorter holding periods has increased the average liquidity of the aggregate restricted stock data. As a result, the average discount in the study has been decreasing with the addition of shorter holding period transactions. Examining data from the study shows that the overall median discounts for the two-year (243 transactions), one-year (342 transactions), and six-month (178 transactions) holding period transactions are 22.1%, 15.7%, and 11.4%, respectively. The median discounts for the Rule 144 initial holding period are shown in Exhibit 9.
Exhibit 9. Dispersion of Data by Rule 144 Initial Holding Period
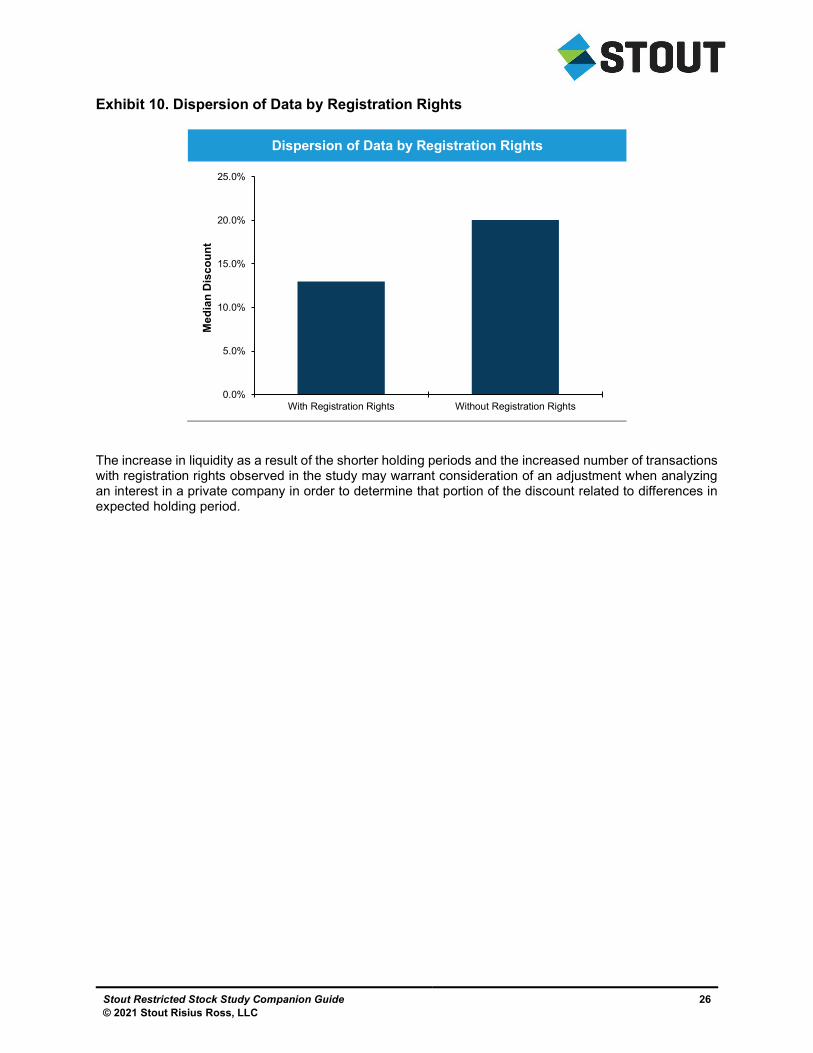
In addition to shorter holding periods, the relative liquidity of the study has increased even further as a result of additional transactions having registration rights. Transactions where registration rights were granted typically have significantly shorter holding periods than transactions where no registration rights were granted. As presented in Exhibit 10, the median discount for the 362 transactions with registration rights is 13.0%, compared with 20.0% for the 252 transactions without registration rights.
Dispersion of Data by Rule 144 Initial Holding Period
0.0%
5.0%
10.0%
15.0%
20.0%
25.0%
6 Months 1 Year 2 Years
Me
dia
n D
isc
ou
nt
Holding Period
Stout Restricted Stock Study Companion Guide © 2021 Stout Risius Ross, LLC
26
Exhibit 10. Dispersion of Data by Registration Rights
The increase in liquidity as a result of the shorter holding periods and the increased number of transactions with registration rights observed in the study may warrant consideration of an adjustment when analyzing an interest in a private company in order to determine that portion of the discount related to differences in expected holding period.
Dispersion of Data by Registration Rights
0.0%
5.0%
10.0%
15.0%
20.0%
25.0%
With Registration Rights Without Registration Rights
Me
dia
n D
isc
ou
nt
Stout Restricted Stock Study Companion Guide © 2021 Stout Risius Ross, LLC
27
V. DLOM Determination Methodology
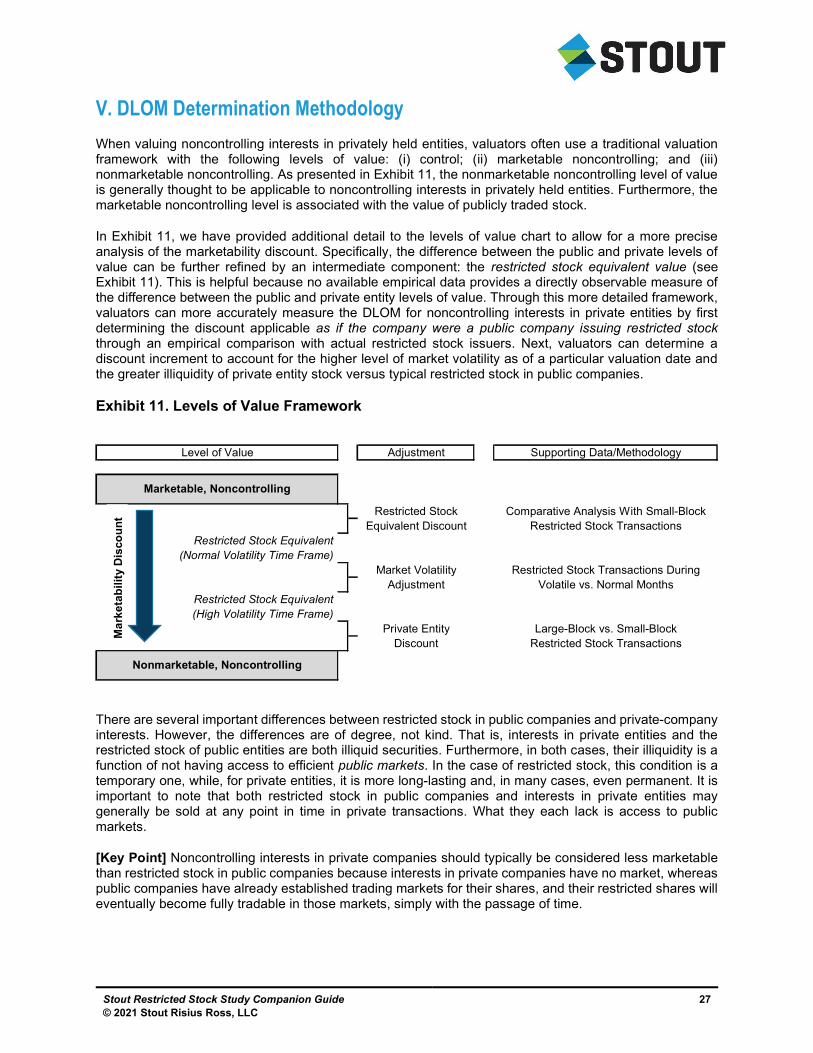
When valuing noncontrolling interests in privately held entities, valuators often use a traditional valuation framework with the following levels of value: (i) control; (ii) marketable noncontrolling; and (iii) nonmarketable noncontrolling. As presented in Exhibit 11, the nonmarketable noncontrolling level of value is generally thought to be applicable to noncontrolling interests in privately held entities. Furthermore, the marketable noncontrolling level is associated with the value of publicly traded stock.
In Exhibit 11, we have provided additional detail to the levels of value chart to allow for a more precise analysis of the marketability discount. Specifically, the difference between the public and private levels of value can be further refined by an intermediate component: the restricted stock equivalent value (see Exhibit 11). This is helpful because no available empirical data provides a directly observable measure of the difference between the public and private entity levels of value. Through this more detailed framework, valuators can more accurately measure the DLOM for noncontrolling interests in private entities by first determining the discount applicable as if the company were a public company issuing restricted stock through an empirical comparison with actual restricted stock issuers. Next, valuators can determine a discount increment to account for the higher level of market volatility as of a particular valuation date and the greater illiquidity of private entity stock versus typical restricted stock in public companies.
Exhibit 11. Levels of Value Framework
There are several important differences between restricted stock in public companies and private-company interests. However, the differences are of degree, not kind. That is, interests in private entities and the restricted stock of public entities are both illiquid securities. Furthermore, in both cases, their illiquidity is a function of not having access to efficient public markets. In the case of restricted stock, this condition is a temporary one, while, for private entities, it is more long-lasting and, in many cases, even permanent. It is important to note that both restricted stock in public companies and interests in private entities may generally be sold at any point in time in private transactions. What they each lack is access to public markets.
[Key Point] Noncontrolling interests in private companies should typically be considered less marketable than restricted stock in public companies because interests in private companies have no market, whereas public companies have already established trading markets for their shares, and their restricted shares will eventually become fully tradable in those markets, simply with the passage of time.
Level of Value Adjustment Supporting Data/Methodology
Restricted Stock Comparative Analysis With Small-BlockEquivalent Discount Restricted Stock Transactions
Restricted Stock Equivalent(Normal Volatility Time Frame)
Market Volatility Restricted Stock Transactions DuringAdjustment Volatile vs. Normal Months
Restricted Stock Equivalent(High Volatility Time Frame)
Private Entity Large-Block vs. Small-BlockDiscount Restricted Stock Transactions
Nonmarketable, Noncontrolling
Marketable, Noncontrolling
Ma
rke
tab
ilit
yD
isco
un
t
Stout Restricted Stock Study Companion Guide © 2021 Stout Risius Ross, LLC
28
Discount Methodology
Note: The following methodology is the same as that the calculator employs. The calculator automates the data sorting and formula building that a user would otherwise have to conduct manually. A tutorial for using the calculator is provided in Section VI.
As described in Section IV, an analysis of the study data suggests that the most important determinants of the DLOM are: (1) the issuing firm’s financial and market risk; (2) the level of stock market volatility prevailing around the transaction date; and (3) the degree of liquidity of the securities. Accordingly, Stout’s determination of the appropriate DLOM for noncontrolling interests in private companies involves a three-step analysis:
1. Restricted stock equivalent discount (RSED)—The discount applicable to the shares (or other equity interest) in a private company, as if they were typical restricted shares in a public company. The determination of the RSED is based on a comparative analysis of the subject company and the companies in the study issuing small blocks of restricted stock (less than 30% shares placed).
2. Market volatility adjustment—The adjustment to the RSED required in the event that equity markets demonstrate unusually high volatility around a given valuation date. The adjustment factor is derived from a comparison of the transactions in the study occurring during months with normal trailing six-month average VIX values versus those occurring during months with very high trailing six-month average VIX values. The result of applying the market volatility adjustment to the RSED is the adjusted restricted stock equivalent discount, referred to hereinafter as the “ARSED.”
3. Private entity discount (PED)—The discount required for a private entity, which reflects the fact that interests in private entities are significantly less liquid than all but the most illiquid issues (i.e., the largest blocks) of restricted stock in public companies. The adjustment to go from the ARSED to the PED is based on the adjustment factors derived from the comparison of discounts associated with small-block versus large-block transactions in the study.
[Key Point] Stout does not advocate estimating the DLOM based on a direct comparison of the subject company with large-block transactions, which would necessitate a single step to derive the PED because there is not a sufficient sample of large-block transactions to allow for a detailed financial characteristics comparison and account for the various risk factors that impact the DLOM. It is our opinion that the three-step analysis to derive the PED generates more accurate results.
Restricted Stock Equivalent Discount (RSED)
The RSED adjusts the value of the subject interest from a publicly traded equivalent (marketable noncontrolling) level of value to a restricted stock equivalent level of value. Since the goal in this first step is to determine the RSED (and not the total discount applicable to the subject interest), we base this analysis on a comparison of small-block transactions only (i.e., blocks less than 30% of shares placed). For the determination of the RSED, the financial characteristics of the subject private company are analyzed in relation to the small-block data in the study. We typically perform this analysis on the following variables: market value, revenues, total assets, shareholders’ equity, MTB ratio, net profit margin, and volatility. We typically do not consider stock price volatility to be a measurable statistic for a private company. Consequently, when valuing noncontrolling interests in private companies, Stout typically does not assign any weight to the volatility variable, unless a reasonable estimate can be made by examining the stock price volatility of comparable public companies. Stout typically does not consider industry classification to be a significant determinant of the DLOM. Accordingly, when we determine the RSED applicable to the subject interest, we generally use the above financial risk characteristics rather than industry classification for selecting the companies in the study that we consider most comparable to the subject entity.
Stout Restricted Stock Study Companion Guide © 2021 Stout Risius Ross, LLC
29
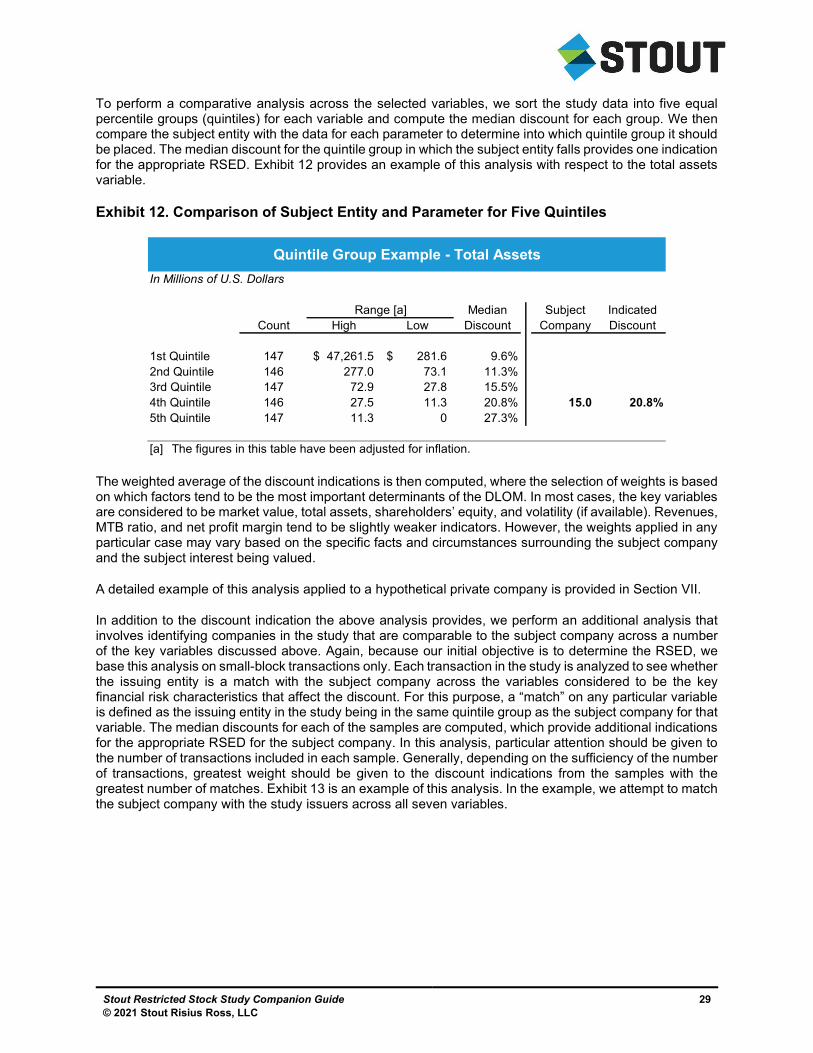
To perform a comparative analysis across the selected variables, we sort the study data into five equal percentile groups (quintiles) for each variable and compute the median discount for each group. We then compare the subject entity with the data for each parameter to determine into which quintile group it should be placed. The median discount for the quintile group in which the subject entity falls provides one indication for the appropriate RSED. Exhibit 12 provides an example of this analysis with respect to the total assets variable.
Exhibit 12. Comparison of Subject Entity and Parameter for Five Quintiles
The weighted average of the discount indications is then computed, where the selection of weights is based on which factors tend to be the most important determinants of the DLOM. In most cases, the key variables are considered to be market value, total assets, shareholders’ equity, and volatility (if available). Revenues, MTB ratio, and net profit margin tend to be slightly weaker indicators. However, the weights applied in any particular case may vary based on the specific facts and circumstances surrounding the subject company and the subject interest being valued.
A detailed example of this analysis applied to a hypothetical private company is provided in Section VII.
In addition to the discount indication the above analysis provides, we perform an additional analysis that involves identifying companies in the study that are comparable to the subject company across a number of the key variables discussed above. Again, because our initial objective is to determine the RSED, we base this analysis on small-block transactions only. Each transaction in the study is analyzed to see whether the issuing entity is a match with the subject company across the variables considered to be the key financial risk characteristics that affect the discount. For this purpose, a “match” on any particular variable is defined as the issuing entity in the study being in the same quintile group as the subject company for that variable. The median discounts for each of the samples are computed, which provide additional indications for the appropriate RSED for the subject company. In this analysis, particular attention should be given to the number of transactions included in each sample. Generally, depending on the sufficiency of the number of transactions, greatest weight should be given to the discount indications from the samples with the greatest number of matches. Exhibit 13 is an example of this analysis. In the example, we attempt to match the subject company with the study issuers across all seven variables.
Quintile Group Example - Total Assets
In Millions of U.S. Dollars
Range [a] Median Subject IndicatedCount High Low Discount Company Discount
1st Quintile 147 47,261.5$ 281.6$ 9.6%2nd Quintile 146 277.0 73.1 11.3%3rd Quintile 147 72.9 27.8 15.5%4th Quintile 146 27.5 11.3 20.8% 15.0 20.8%5th Quintile 147 11.3 0 27.3%
[a] The figures in this table have been adjusted for inflation.
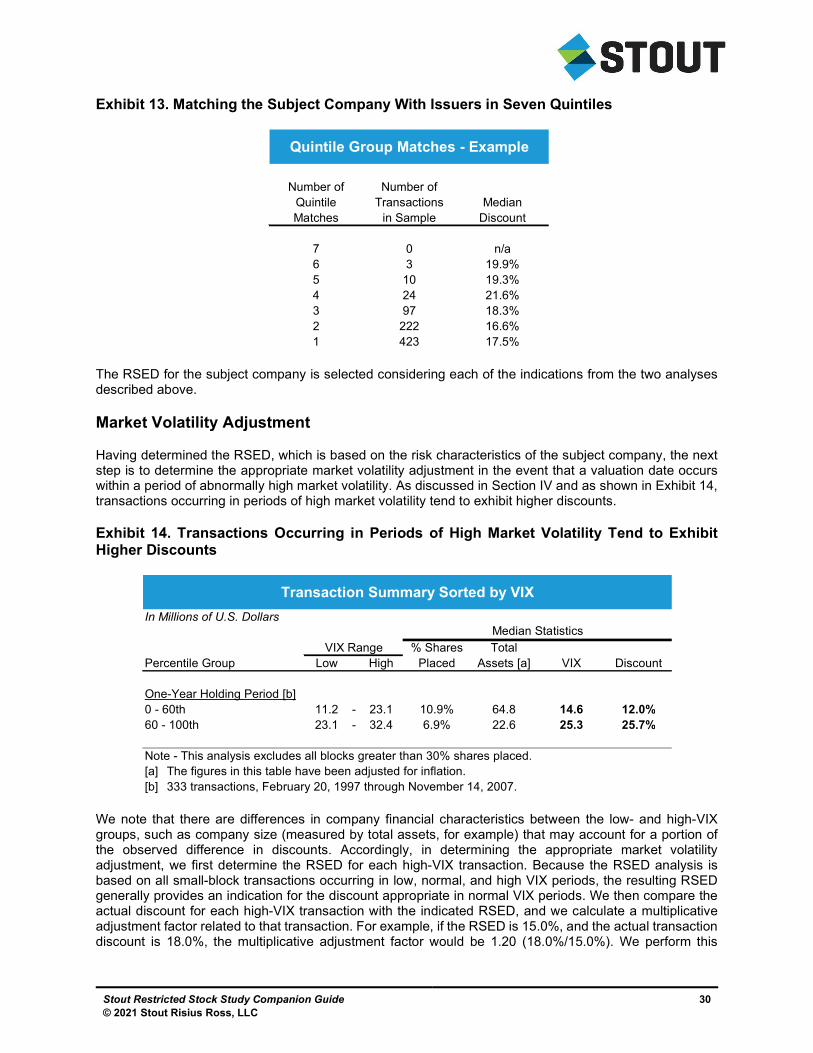
Stout Restricted Stock Study Companion Guide © 2021 Stout Risius Ross, LLC
30
Exhibit 13. Matching the Subject Company With Issuers in Seven Quintiles
The RSED for the subject company is selected considering each of the indications from the two analyses described above.
Market Volatility Adjustment
Having determined the RSED, which is based on the risk characteristics of the subject company, the next step is to determine the appropriate market volatility adjustment in the event that a valuation date occurs within a period of abnormally high market volatility. As discussed in Section IV and as shown in Exhibit 14, transactions occurring in periods of high market volatility tend to exhibit higher discounts.
Exhibit 14. Transactions Occurring in Periods of High Market Volatility Tend to Exhibit Higher Discounts
We note that there are differences in company financial characteristics between the low- and high-VIX groups, such as company size (measured by total assets, for example) that may account for a portion of the observed difference in discounts. Accordingly, in determining the appropriate market volatility adjustment, we first determine the RSED for each high-VIX transaction. Because the RSED analysis is based on all small-block transactions occurring in low, normal, and high VIX periods, the resulting RSED generally provides an indication for the discount appropriate in normal VIX periods. We then compare the actual discount for each high-VIX transaction with the indicated RSED, and we calculate a multiplicative adjustment factor related to that transaction. For example, if the RSED is 15.0%, and the actual transaction discount is 18.0%, the multiplicative adjustment factor would be 1.20 (18.0%/15.0%). We perform this
Quintile Group Matches - Example
Number of Number ofQuintile Transactions MedianMatches in Sample Discount
7 0 n/a6 3 19.9%5 10 19.3%4 24 21.6%3 97 18.3%2 222 16.6%1 423 17.5%
Transaction Summary Sorted by VIX
In Millions of U.S. DollarsMedian Statistics
VIX Range % Shares TotalPercentile Group Low High Placed Assets [a] VIX Discount
One-Year Holding Period [b]0 - 60th 11.2 - 23.1 10.9% 64.8 14.6 12.0%60 - 100th 23.1 - 32.4 6.9% 22.6 25.3 25.7%
Note - This analysis excludes all blocks greater than 30% shares placed.[a] The figures in this table have been adjusted for inflation.[b] 333 transactions, February 20, 1997 through November 14, 2007.
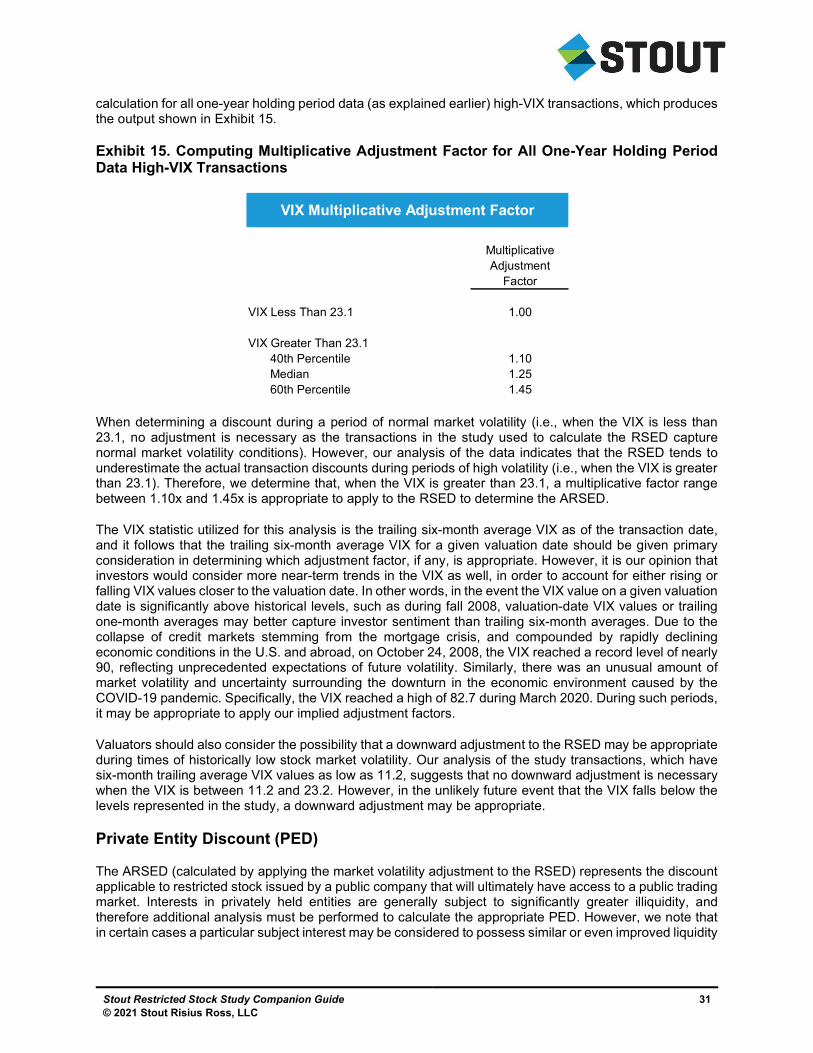
Stout Restricted Stock Study Companion Guide © 2021 Stout Risius Ross, LLC
31
calculation for all one-year holding period data (as explained earlier) high-VIX transactions, which produces the output shown in Exhibit 15.
Exhibit 15. Computing Multiplicative Adjustment Factor for All One-Year Holding Period Data High-VIX Transactions
When determining a discount during a period of normal market volatility (i.e., when the VIX is less than 23.1, no adjustment is necessary as the transactions in the study used to calculate the RSED capture normal market volatility conditions). However, our analysis of the data indicates that the RSED tends to underestimate the actual transaction discounts during periods of high volatility (i.e., when the VIX is greater than 23.1). Therefore, we determine that, when the VIX is greater than 23.1, a multiplicative factor range between 1.10x and 1.45x is appropriate to apply to the RSED to determine the ARSED.
The VIX statistic utilized for this analysis is the trailing six-month average VIX as of the transaction date, and it follows that the trailing six-month average VIX for a given valuation date should be given primary consideration in determining which adjustment factor, if any, is appropriate. However, it is our opinion that investors would consider more near-term trends in the VIX as well, in order to account for either rising or falling VIX values closer to the valuation date. In other words, in the event the VIX value on a given valuation date is significantly above historical levels, such as during fall 2008, valuation-date VIX values or trailing one-month averages may better capture investor sentiment than trailing six-month averages. Due to the collapse of credit markets stemming from the mortgage crisis, and compounded by rapidly declining economic conditions in the U.S. and abroad, on October 24, 2008, the VIX reached a record level of nearly 90, reflecting unprecedented expectations of future volatility. Similarly, there was an unusual amount of market volatility and uncertainty surrounding the downturn in the economic environment caused by the COVID-19 pandemic. Specifically, the VIX reached a high of 82.7 during March 2020. During such periods, it may be appropriate to apply our implied adjustment factors.
Valuators should also consider the possibility that a downward adjustment to the RSED may be appropriate during times of historically low stock market volatility. Our analysis of the study transactions, which have six-month trailing average VIX values as low as 11.2, suggests that no downward adjustment is necessary when the VIX is between 11.2 and 23.2. However, in the unlikely future event that the VIX falls below the levels represented in the study, a downward adjustment may be appropriate.
Private Entity Discount (PED)
The ARSED (calculated by applying the market volatility adjustment to the RSED) represents the discount applicable to restricted stock issued by a public company that will ultimately have access to a public trading market. Interests in privately held entities are generally subject to significantly greater illiquidity, and therefore additional analysis must be performed to calculate the appropriate PED. However, we note that in certain cases a particular subject interest may be considered to possess similar or even improved liquidity
VIX Multiplicative Adjustment Factor
MultiplicativeAdjustment
Factor
VIX Less Than 23.1 1.00
VIX Greater Than 23.140th Percentile 1.10Median 1.2560th Percentile 1.45
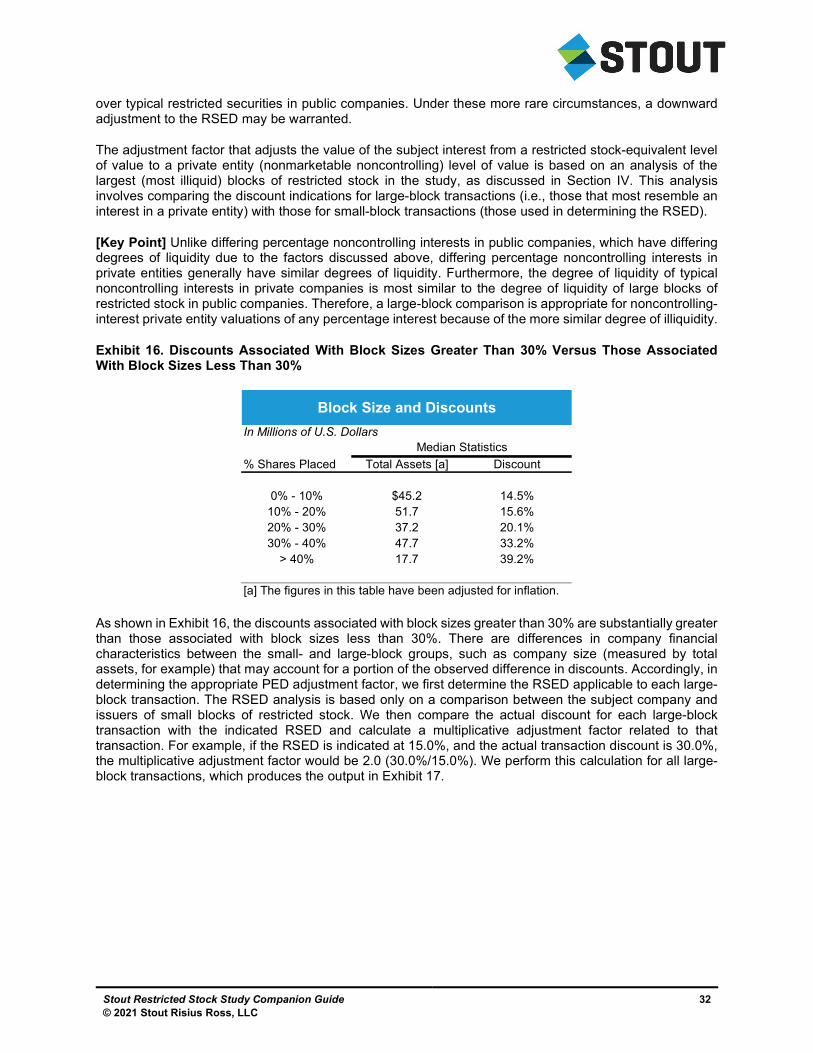
Stout Restricted Stock Study Companion Guide © 2021 Stout Risius Ross, LLC
32
over typical restricted securities in public companies. Under these more rare circumstances, a downward adjustment to the RSED may be warranted.
The adjustment factor that adjusts the value of the subject interest from a restricted stock-equivalent level of value to a private entity (nonmarketable noncontrolling) level of value is based on an analysis of the largest (most illiquid) blocks of restricted stock in the study, as discussed in Section IV. This analysis involves comparing the discount indications for large-block transactions (i.e., those that most resemble an interest in a private entity) with those for small-block transactions (those used in determining the RSED).
[Key Point] Unlike differing percentage noncontrolling interests in public companies, which have differing degrees of liquidity due to the factors discussed above, differing percentage noncontrolling interests in private entities generally have similar degrees of liquidity. Furthermore, the degree of liquidity of typical noncontrolling interests in private companies is most similar to the degree of liquidity of large blocks of restricted stock in public companies. Therefore, a large-block comparison is appropriate for noncontrolling-interest private entity valuations of any percentage interest because of the more similar degree of illiquidity.
Exhibit 16. Discounts Associated With Block Sizes Greater Than 30% Versus Those Associated With Block Sizes Less Than 30%
As shown in Exhibit 16, the discounts associated with block sizes greater than 30% are substantially greater than those associated with block sizes less than 30%. There are differences in company financial characteristics between the small- and large-block groups, such as company size (measured by total assets, for example) that may account for a portion of the observed difference in discounts. Accordingly, in determining the appropriate PED adjustment factor, we first determine the RSED applicable to each large-block transaction. The RSED analysis is based only on a comparison between the subject company and issuers of small blocks of restricted stock. We then compare the actual discount for each large-block transaction with the indicated RSED and calculate a multiplicative adjustment factor related to that transaction. For example, if the RSED is indicated at 15.0%, and the actual transaction discount is 30.0%, the multiplicative adjustment factor would be 2.0 (30.0%/15.0%). We perform this calculation for all large-block transactions, which produces the output in Exhibit 17.
Block Size and Discounts
In Millions of U.S. DollarsMedian Statistics
% Shares Placed Total Assets [a] Discount
0% - 10% $45.2 14.5%10% - 20% 51.7 15.6%20% - 30% 37.2 20.1%30% - 40% 47.7 33.2%
> 40% 17.7 39.2%
[a] The figures in this table have been adjusted for inflation.
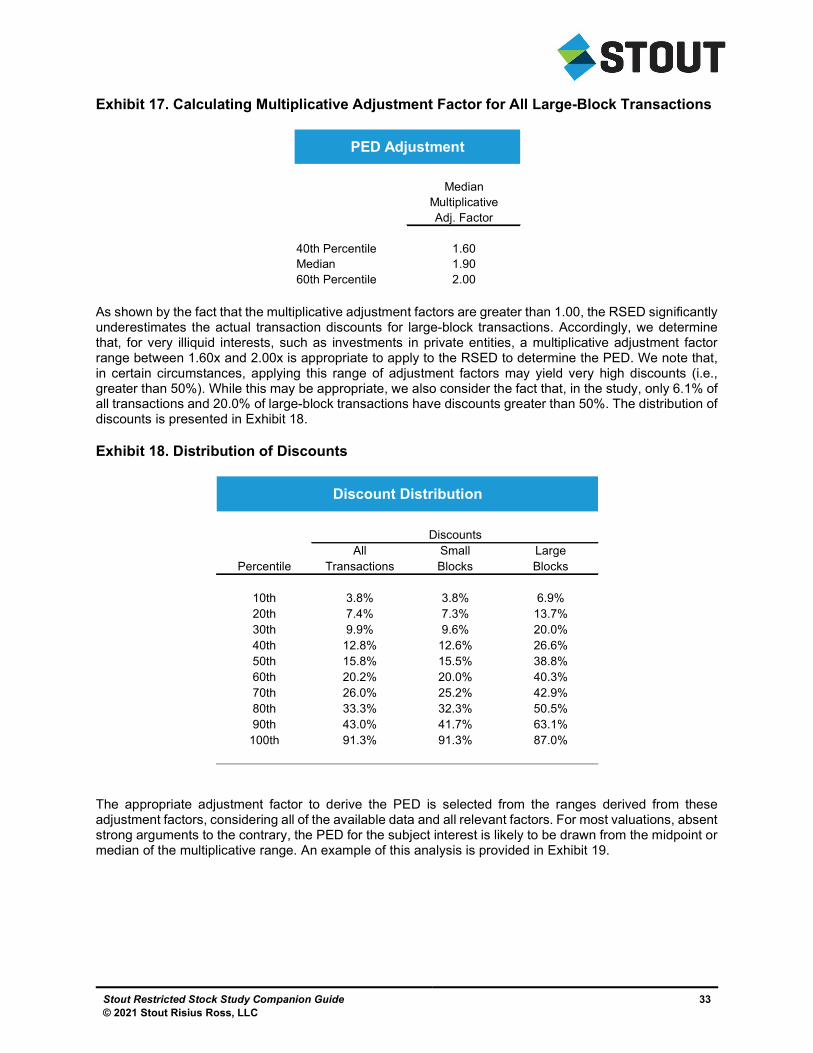
Stout Restricted Stock Study Companion Guide © 2021 Stout Risius Ross, LLC
33
Exhibit 17. Calculating Multiplicative Adjustment Factor for All Large-Block Transactions
As shown by the fact that the multiplicative adjustment factors are greater than 1.00, the RSED significantly underestimates the actual transaction discounts for large-block transactions. Accordingly, we determine that, for very illiquid interests, such as investments in private entities, a multiplicative adjustment factor range between 1.60x and 2.00x is appropriate to apply to the RSED to determine the PED. We note that, in certain circumstances, applying this range of adjustment factors may yield very high discounts (i.e., greater than 50%). While this may be appropriate, we also consider the fact that, in the study, only 6.1% of all transactions and 20.0% of large-block transactions have discounts greater than 50%. The distribution of discounts is presented in Exhibit 18.
Exhibit 18. Distribution of Discounts
The appropriate adjustment factor to derive the PED is selected from the ranges derived from these adjustment factors, considering all of the available data and all relevant factors. For most valuations, absent strong arguments to the contrary, the PED for the subject interest is likely to be drawn from the midpoint or median of the multiplicative range. An example of this analysis is provided in Exhibit 19.
PED Adjustment
MedianMultiplicativeAdj. Factor
40th Percentile 1.60Median 1.9060th Percentile 2.00
Discount Distribution
DiscountsAll Small Large
Percentile Transactions Blocks Blocks
10th 3.8% 3.8% 6.9%20th 7.4% 7.3% 13.7%30th 9.9% 9.6% 20.0%40th 12.8% 12.6% 26.6%50th 15.8% 15.5% 38.8%60th 20.2% 20.0% 40.3%70th 26.0% 25.2% 42.9%80th 33.3% 32.3% 50.5%90th 43.0% 41.7% 63.1%
100th 91.3% 91.3% 87.0%
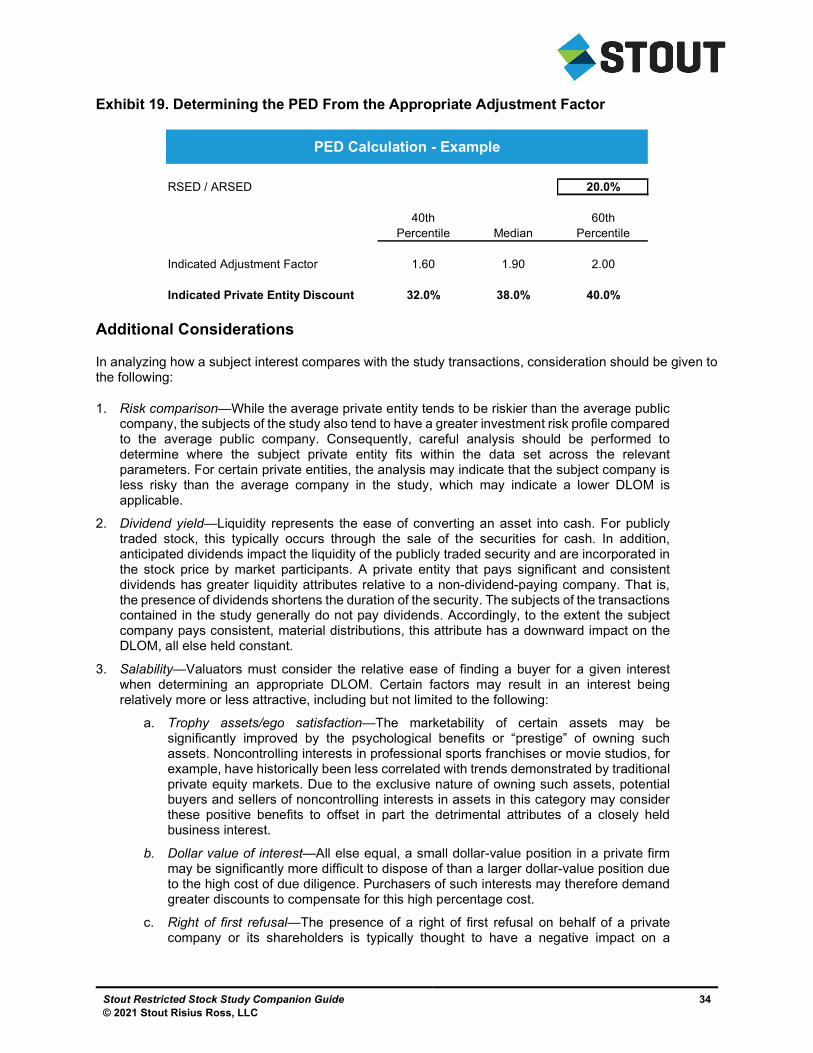
Stout Restricted Stock Study Companion Guide © 2021 Stout Risius Ross, LLC
34
Exhibit 19. Determining the PED From the Appropriate Adjustment Factor
Additional Considerations
In analyzing how a subject interest compares with the study transactions, consideration should be given to the following:
1. Risk comparison—While the average private entity tends to be riskier than the average public company, the subjects of the study also tend to have a greater investment risk profile compared to the average public company. Consequently, careful analysis should be performed to determine where the subject private entity fits within the data set across the relevant parameters. For certain private entities, the analysis may indicate that the subject company is less risky than the average company in the study, which may indicate a lower DLOM is applicable.
2. Dividend yield—Liquidity represents the ease of converting an asset into cash. For publicly traded stock, this typically occurs through the sale of the securities for cash. In addition, anticipated dividends impact the liquidity of the publicly traded security and are incorporated in the stock price by market participants. A private entity that pays significant and consistent dividends has greater liquidity attributes relative to a non-dividend-paying company. That is, the presence of dividends shortens the duration of the security. The subjects of the transactions contained in the study generally do not pay dividends. Accordingly, to the extent the subject company pays consistent, material distributions, this attribute has a downward impact on the DLOM, all else held constant.
3. Salability—Valuators must consider the relative ease of finding a buyer for a given interest when determining an appropriate DLOM. Certain factors may result in an interest being relatively more or less attractive, including but not limited to the following:
a. Trophy assets/ego satisfaction—The marketability of certain assets may be significantly improved by the psychological benefits or “prestige” of owning such assets. Noncontrolling interests in professional sports franchises or movie studios, for example, have historically been less correlated with trends demonstrated by traditional private equity markets. Due to the exclusive nature of owning such assets, potential buyers and sellers of noncontrolling interests in assets in this category may consider these positive benefits to offset in part the detrimental attributes of a closely held business interest.
b. Dollar value of interest—All else equal, a small dollar-value position in a private firm may be significantly more difficult to dispose of than a larger dollar-value position due to the high cost of due diligence. Purchasers of such interests may therefore demand greater discounts to compensate for this high percentage cost.
c. Right of first refusal—The presence of a right of first refusal on behalf of a private company or its shareholders is typically thought to have a negative impact on a
PED Calculation - Example
RSED / ARSED 20.0%
40th 60thPercentile Median Percentile
Indicated Adjustment Factor 1.60 1.90 2.00
Indicated Private Entity Discount 32.0% 38.0% 40.0%
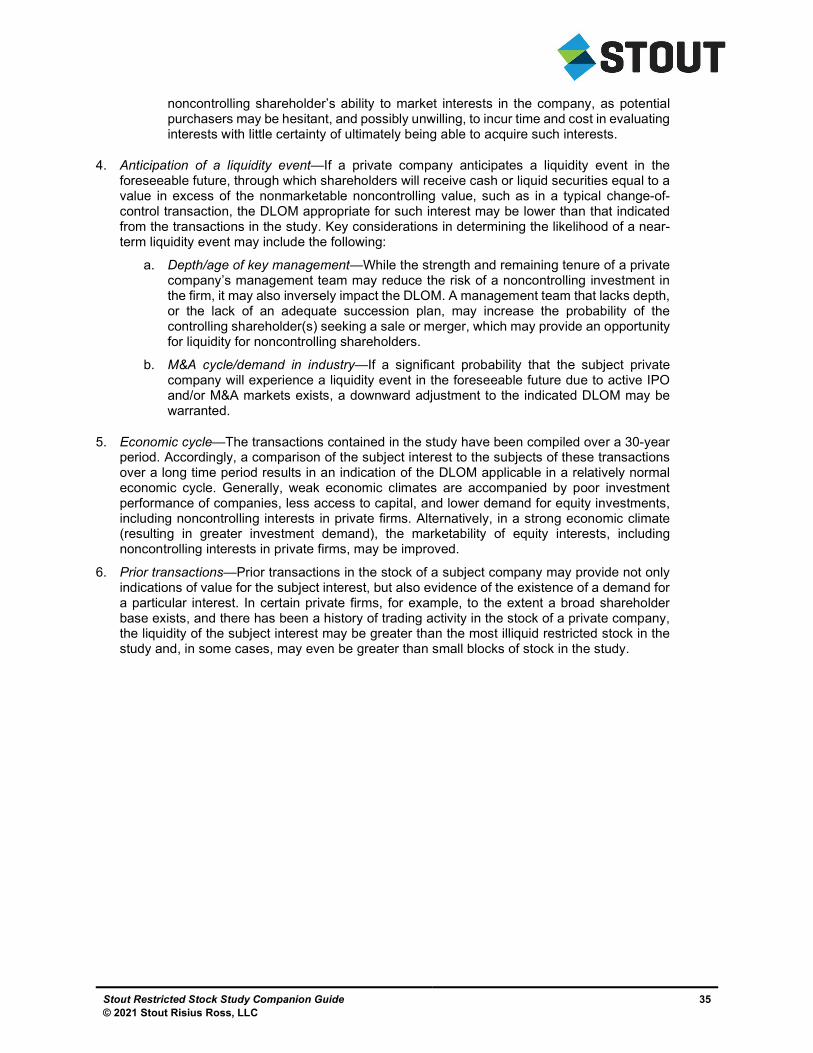
Stout Restricted Stock Study Companion Guide © 2021 Stout Risius Ross, LLC
35
noncontrolling shareholder’s ability to market interests in the company, as potential purchasers may be hesitant, and possibly unwilling, to incur time and cost in evaluating interests with little certainty of ultimately being able to acquire such interests.
4. Anticipation of a liquidity event—If a private company anticipates a liquidity event in the foreseeable future, through which shareholders will receive cash or liquid securities equal to a value in excess of the nonmarketable noncontrolling value, such as in a typical change-of-control transaction, the DLOM appropriate for such interest may be lower than that indicated from the transactions in the study. Key considerations in determining the likelihood of a near-term liquidity event may include the following:
a. Depth/age of key management—While the strength and remaining tenure of a private company’s management team may reduce the risk of a noncontrolling investment in the firm, it may also inversely impact the DLOM. A management team that lacks depth, or the lack of an adequate succession plan, may increase the probability of the controlling shareholder(s) seeking a sale or merger, which may provide an opportunity for liquidity for noncontrolling shareholders.
b. M&A cycle/demand in industry—If a significant probability that the subject private company will experience a liquidity event in the foreseeable future due to active IPO and/or M&A markets exists, a downward adjustment to the indicated DLOM may be warranted.
5. Economic cycle—The transactions contained in the study have been compiled over a 30-year period. Accordingly, a comparison of the subject interest to the subjects of these transactions over a long time period results in an indication of the DLOM applicable in a relatively normal economic cycle. Generally, weak economic climates are accompanied by poor investment performance of companies, less access to capital, and lower demand for equity investments, including noncontrolling interests in private firms. Alternatively, in a strong economic climate (resulting in greater investment demand), the marketability of equity interests, including noncontrolling interests in private firms, may be improved.
6. Prior transactions—Prior transactions in the stock of a subject company may provide not only indications of value for the subject interest, but also evidence of the existence of a demand for a particular interest. In certain private firms, for example, to the extent a broad shareholder base exists, and there has been a history of trading activity in the stock of a private company, the liquidity of the subject interest may be greater than the most illiquid restricted stock in the study and, in some cases, may even be greater than small blocks of stock in the study.

Stout Restricted Stock Study Companion Guide © 2021 Stout Risius Ross, LLC
36
VI. Using the Stout DLOM CalculatorTM
In this section, we provide instructions for using the calculator to derive DLOMs for noncontrolling interests in private companies. Then, we provide a case study demonstrating how the calculator may be used to determine a discount for a hypothetical private company interest.
General Instructions
The user is asked to input the following:
Company name: For presentation purposes only, as the calculator allows users to print a set of illustrative schedules.
Valuation date: Used to calculate inflation adjustments to the restricted stock issuers’ financial characteristics, as well as to determine the applicable VIX values.
Inflation adjustment: Allows users to select whether the restricted stock issuers’ financial characteristics are adjusted to the same CPI basis as the subject company’s characteristics. Stout recommends always selecting “Yes,” which provides for more appropriate comparisons between the subject company and the restricted stock issuers.
Trim dates: Selecting “Yes” will allow the calculator to exclude all restricted stock transactions that occurred after the valuation date. Otherwise, the calculator will derive a DLOM using the entire database.
Registration rights: While all transactions in the database have holding periods of two years, one year, or six months, transactions where registration rights were granted may have drastically shorter holding periods. Depending on the circumstances, it may be appropriate to include or exclude registration rights transactions for a more appropriate comparison to the subject company.
Holding period: Depending on the circumstances of the subject company, it may be appropriate to use only those transactions with a specific holding period (e.g., it may be appropriate in the case of the valuation of a public company’s stock, which is restricted from resale for a one-year period, to only use transactions with a one-year holding period).
Company financials: Enter all figures in thousands of U.S. dollars (i.e., exclude three zeros), except for volatility. If any of the characteristics are not available for a subject company, or if the user believes any of the characteristics are not meaningful for a subject company, one or more of these fields may be left blank.
Volatility: For public companies, use trailing 12-month daily volatility, expressed as a percentage. For private companies, users may estimate volatility based on the stock price volatility of a set of guideline public companies or leave this field blank.
Stout Restricted Stock Study Companion Guide © 2021 Stout Risius Ross, LLC
37
Restricted Stock Equivalent Discount Analysis
This analysis, as described in Section V, considers all transactions involving less than 30% shares placed. For the financial characteristics comparison analysis, we recommend weights based on the observed strength of the relationship between each variable and the DLOM. For volatility, we recommend zero weight for private companies, given the uncertainty in estimating stock price volatility for private companies. However, if you believe you have a reliable indication of the subject company volatility based on a set of guideline public companies or other method, we recommend a weighting of three. With that said, we recommend zero weight if the representative VIX value is greater than 23.1, and you apply a market volatility adjustment to the restricted stock equivalent discount as the impact of subject company volatility is likely captured in the market volatility adjustment.
For the best comparables analysis, we recommend selecting all variables that are available and considered meaningful for the subject company in order to get the most comparable transaction samples possible. The greater the number of quintile matches, the stronger the discount indication. However, careful consideration should be given to transaction counts. Samples with fewer than approximately 10 transactions may not be considered sufficient to provide reliable discount indications. Users may find that the discount indications trend in a certain direction and may indicate a discount materially above or below that indicated by the financial characteristics comparison analysis. Given that these indications are derived from subsamples of the study issuers that are comparable with the subject company across multiple financial characteristics, rather than only one characteristic, the selected RSED may reasonably be closer to the indications provided by the best comparables analysis. Stout has found that, in most cases, with the exception of very risky firms, the two analyses provide roughly similar discount indications.
Market Volatility Adjustment
This analysis provides indications for the appropriate market volatility adjustment based on the valuation-date VIX, trailing one-month average VIX, and trailing six-month average VIX. Due to the highly volatile nature of the VIX, primary consideration should be given to the indication provided by the six-month average VIX. However, it is reasonable to consider the discount indications provided by near-term trends in the VIX. A declining VIX over the trailing six months may suggest an adjustment factor below that indicated by the six-month average VIX. Conversely, a rising VIX may suggest an adjustment factor above that indicated by the six-month average VIX.
Private Entity Discount
Stout provides for a multiplicative private entity adjustment factor. As explained in Section V, the multiplicative adjustment factor for each large-block transaction is calculated as actual discount divided by the RSED. The multiplicative adjustment factor may yield implausible results for higher RSEDs. Note the distribution of discounts in Exhibit 20.

Stout Restricted Stock Study Companion Guide © 2021 Stout Risius Ross, LLC
38
Exhibit 20. Distribution of Discounts
Users should have strong reasons for selecting discounts at the very high end of the observed range. The appropriate adjustment factor to derive the PED is selected from the indicated ranges, considering all of the available data. For most valuations, absent strong arguments to the contrary, the PED for the subject interest is likely to be drawn from the middle of the appropriate range.
Discount Conclusion
In determining the appropriate DLOM for a noncontrolling interest in a private company, the user must consider all factors involving an investment in such interest (see discussion in Section V for specific factors to consider). To the extent certain factors are not adequately accounted for in the above analysis, additional adjustments may be made. The calculator allows users the flexibility to select their own discount conclusions based on the indications the above analysis provides.
Discount Distribution
DiscountsAll Small Large
Percentile Transactions Blocks Blocks
10th 3.8% 3.8% 6.9%20th 7.4% 7.3% 13.7%30th 9.9% 9.6% 20.0%40th 12.8% 12.6% 26.6%50th 15.8% 15.5% 38.8%60th 20.2% 20.0% 40.3%70th 26.0% 25.2% 42.9%80th 33.3% 32.3% 50.5%90th 43.0% 41.7% 63.1%
100th 91.3% 91.3% 87.0%

Stout Restricted Stock Study Companion Guide © 2021 Stout Risius Ross, LLC
39
VII. Case Study
The following case study provides an example of how the calculator may be used to determine a DLOM for a hypothetical noncontrolling interest in a private company.
Background
ABC Corp. is involved in the merchant wholesale distribution of beverages, primarily to large-scale retail outlets in the U.S. The company has a long history of stable operating and financial performance and has an experienced management team. ABC Corp. is a closely held corporation with a single class of voting common stock. There are no buy-sell agreements, put or redemption rights, or other contractual provisions that would impact the “market” for the company’s stock or provide an indication of the value of noncontrolling interests in ABC Corp. Management has not solicited, nor has it received, any offers to acquire the company from competitors or financial buyers, and there is no intention at this time of bringing the company public.
For estate planning purposes, the appraiser is charged with determining the fair market value of a 10% interest (Subject Interest) in the common stock of ABC Corp., as of December 31, 2020 (Valuation Date). The marketable, noncontrolling interest (publicly traded equivalent) value for 100% of the company’s equity has been determined to be $75 million. The following provides certain key financial metrics relevant to the determination of the DLOM applicable to noncontrolling interests in the company’s shares:
Trailing 12-month (TTM) revenues of $150 million;
TTM net income of $7.5 million;
Total assets of $75 million as of December 31, 2020;
Book value of shareholders’ equity of $25 million as of December 31, 2020;
Dividends have not been paid historically in favor of retaining income for expansion, and the majority owners intend to pursue a similar strategy in the foreseeable future; and
As of December 31, 2020, the VIX closed at 22.75, with the trailing one-month and six-month average VIX at 22.37 and 25.72, respectively.
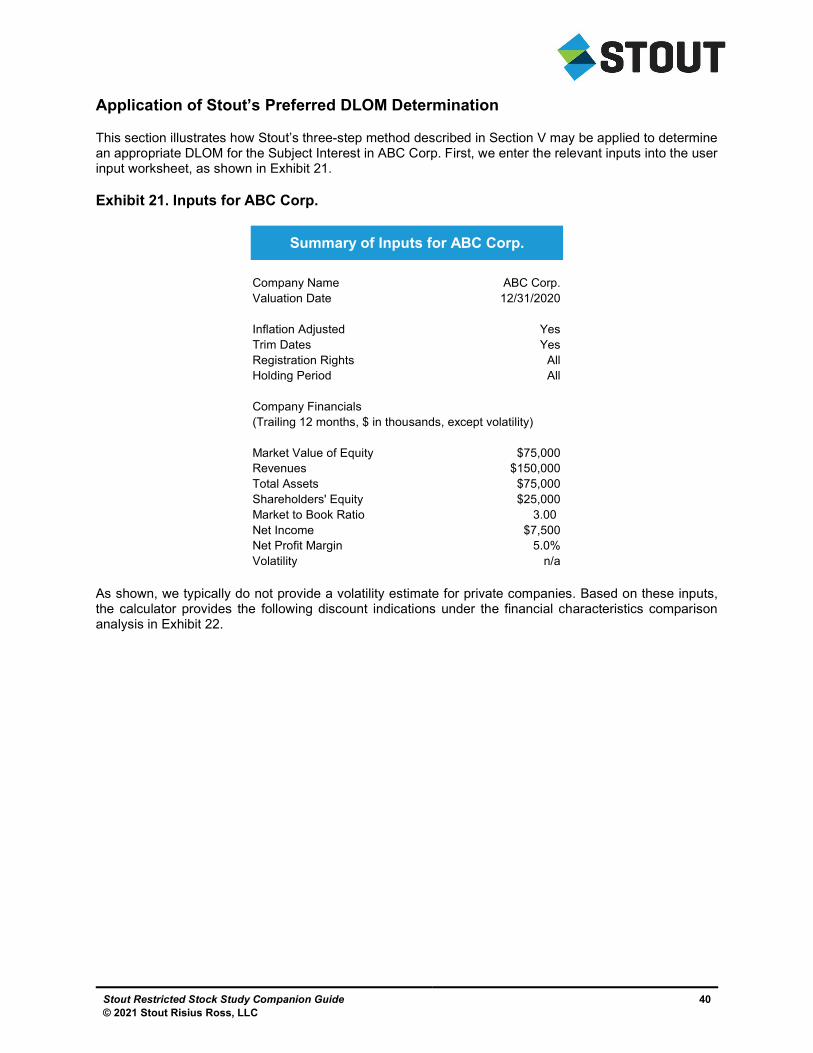
Stout Restricted Stock Study Companion Guide © 2021 Stout Risius Ross, LLC
40
Application of Stout’s Preferred DLOM Determination
This section illustrates how Stout’s three-step method described in Section V may be applied to determine an appropriate DLOM for the Subject Interest in ABC Corp. First, we enter the relevant inputs into the user input worksheet, as shown in Exhibit 21.
Exhibit 21. Inputs for ABC Corp.
As shown, we typically do not provide a volatility estimate for private companies. Based on these inputs, the calculator provides the following discount indications under the financial characteristics comparison analysis in Exhibit 22.
Summary of Inputs for ABC Corp.
Company Name ABC Corp.Valuation Date 12/31/2020
Inflation Adjusted YesTrim Dates YesRegistration Rights AllHolding Period All
Company Financials(Trailing 12 months, $ in thousands, except volatility)
Market Value of Equity $75,000Revenues $150,000Total Assets $75,000Shareholders' Equity $25,000Market to Book Ratio 3.00 Net Income $7,500Net Profit Margin 5.0%Volatility n/a
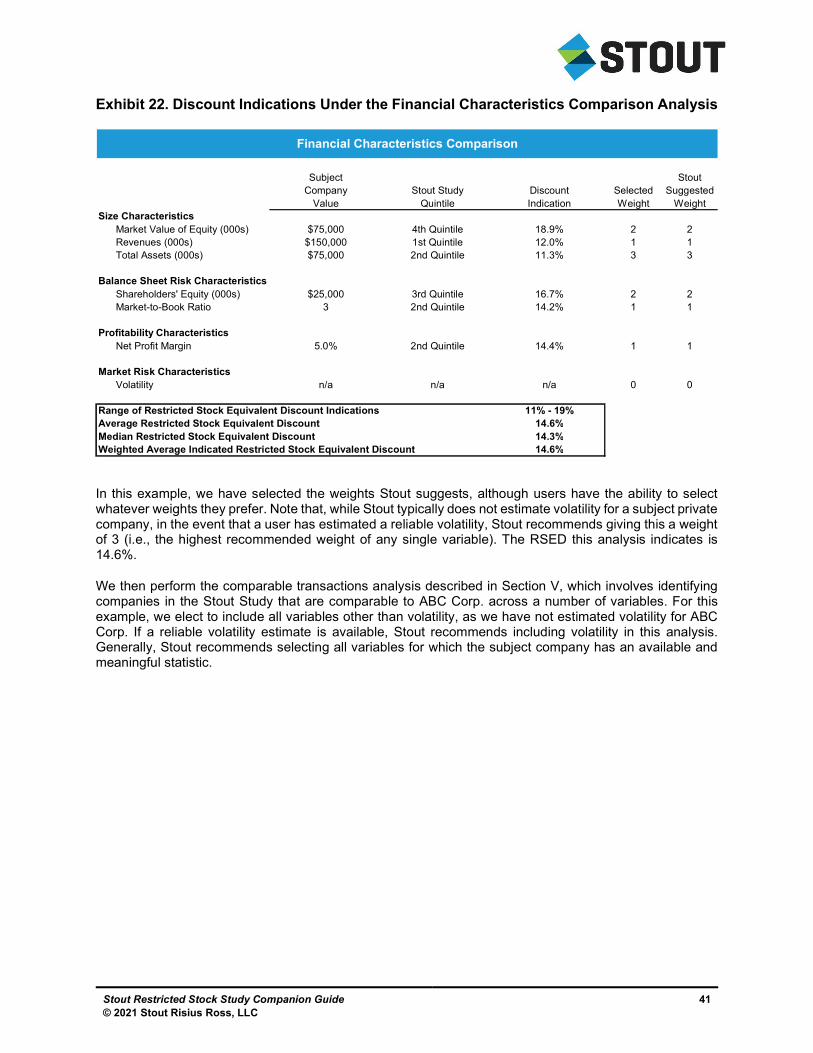
Stout Restricted Stock Study Companion Guide © 2021 Stout Risius Ross, LLC
41
Exhibit 22. Discount Indications Under the Financial Characteristics Comparison Analysis
In this example, we have selected the weights Stout suggests, although users have the ability to select whatever weights they prefer. Note that, while Stout typically does not estimate volatility for a subject private company, in the event that a user has estimated a reliable volatility, Stout recommends giving this a weight of 3 (i.e., the highest recommended weight of any single variable). The RSED this analysis indicates is 14.6%.
We then perform the comparable transactions analysis described in Section V, which involves identifying companies in the Stout Study that are comparable to ABC Corp. across a number of variables. For this example, we elect to include all variables other than volatility, as we have not estimated volatility for ABC Corp. If a reliable volatility estimate is available, Stout recommends including volatility in this analysis. Generally, Stout recommends selecting all variables for which the subject company has an available and meaningful statistic.
Financial Characteristics Comparison
Subject StoutCompany Stout Study Discount Selected Suggested
Value Quintile Indication Weight WeightSize Characteristics
Market Value of Equity (000s) $75,000 4th Quintile 18.9% 2 2Revenues (000s) $150,000 1st Quintile 12.0% 1 1Total Assets (000s) $75,000 2nd Quintile 11.3% 3 3
Balance Sheet Risk CharacteristicsShareholders' Equity (000s) $25,000 3rd Quintile 16.7% 2 2Market-to-Book Ratio 3 2nd Quintile 14.2% 1 1
Profitability CharacteristicsNet Profit Margin 5.0% 2nd Quintile 14.4% 1 1
Market Risk CharacteristicsVolatility n/a n/a n/a 0 0
Range of Restricted Stock Equivalent Discount Indications 11% - 19%Average Restricted Stock Equivalent Discount 14.6%Median Restricted Stock Equivalent Discount 14.3%Weighted Average Indicated Restricted Stock Equivalent Discount 14.6%
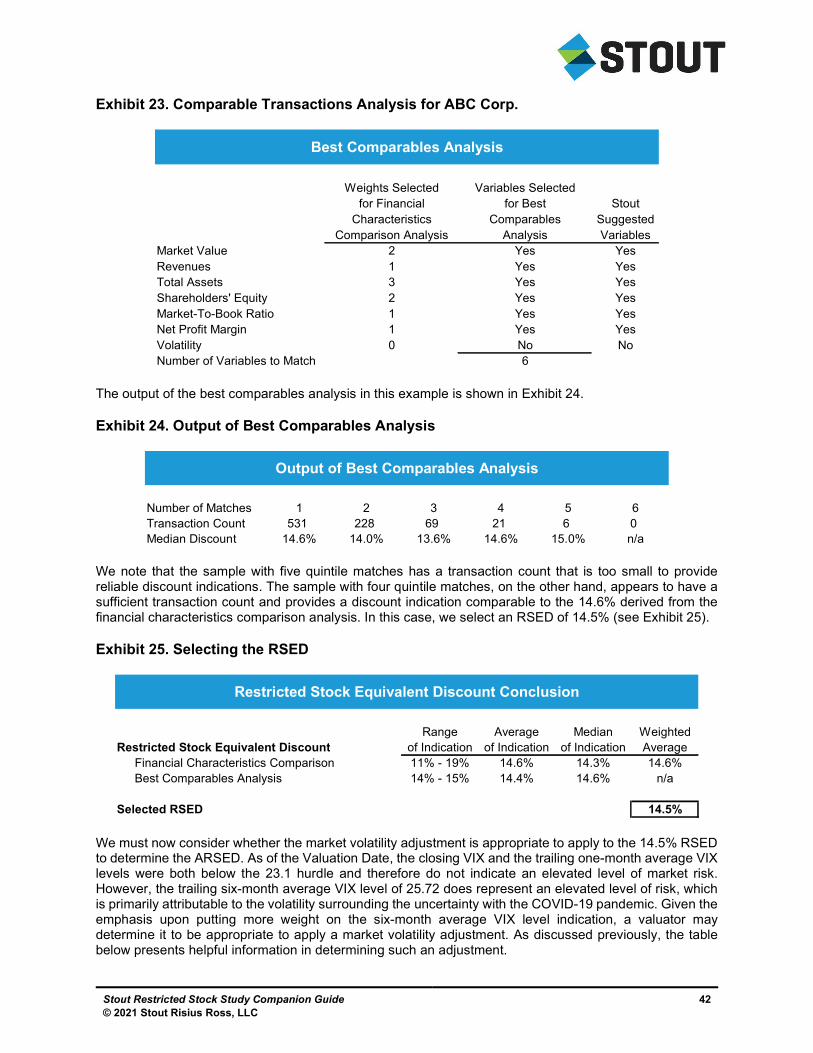
Stout Restricted Stock Study Companion Guide © 2021 Stout Risius Ross, LLC
42
Exhibit 23. Comparable Transactions Analysis for ABC Corp.
The output of the best comparables analysis in this example is shown in Exhibit 24.
Exhibit 24. Output of Best Comparables Analysis
We note that the sample with five quintile matches has a transaction count that is too small to provide reliable discount indications. The sample with four quintile matches, on the other hand, appears to have a sufficient transaction count and provides a discount indication comparable to the 14.6% derived from the financial characteristics comparison analysis. In this case, we select an RSED of 14.5% (see Exhibit 25).
Exhibit 25. Selecting the RSED
We must now consider whether the market volatility adjustment is appropriate to apply to the 14.5% RSED to determine the ARSED. As of the Valuation Date, the closing VIX and the trailing one-month average VIX levels were both below the 23.1 hurdle and therefore do not indicate an elevated level of market risk. However, the trailing six-month average VIX level of 25.72 does represent an elevated level of risk, which is primarily attributable to the volatility surrounding the uncertainty with the COVID-19 pandemic. Given the emphasis upon putting more weight on the six-month average VIX level indication, a valuator may determine it to be appropriate to apply a market volatility adjustment. As discussed previously, the table below presents helpful information in determining such an adjustment.
Best Comparables Analysis
Weights Selected Variables Selectedfor Financial for Best Stout
Characteristics Comparables SuggestedComparison Analysis Analysis Variables
Market Value 2 Yes YesRevenues 1 Yes YesTotal Assets 3 Yes YesShareholders' Equity 2 Yes YesMarket-To-Book Ratio 1 Yes YesNet Profit Margin 1 Yes YesVolatility 0 No NoNumber of Variables to Match 6
Output of Best Comparables Analysis
Number of Matches 1 2 3 4 5 6Transaction Count 531 228 69 21 6 0Median Discount 14.6% 14.0% 13.6% 14.6% 15.0% n/a
Restricted Stock Equivalent Discount Conclusion
Range Average Median WeightedRestricted Stock Equivalent Discount of Indication of Indication of Indication Average
Financial Characteristics Comparison 11% - 19% 14.6% 14.3% 14.6%Best Comparables Analysis 14% - 15% 14.4% 14.6% n/a
Selected RSED 14.5%
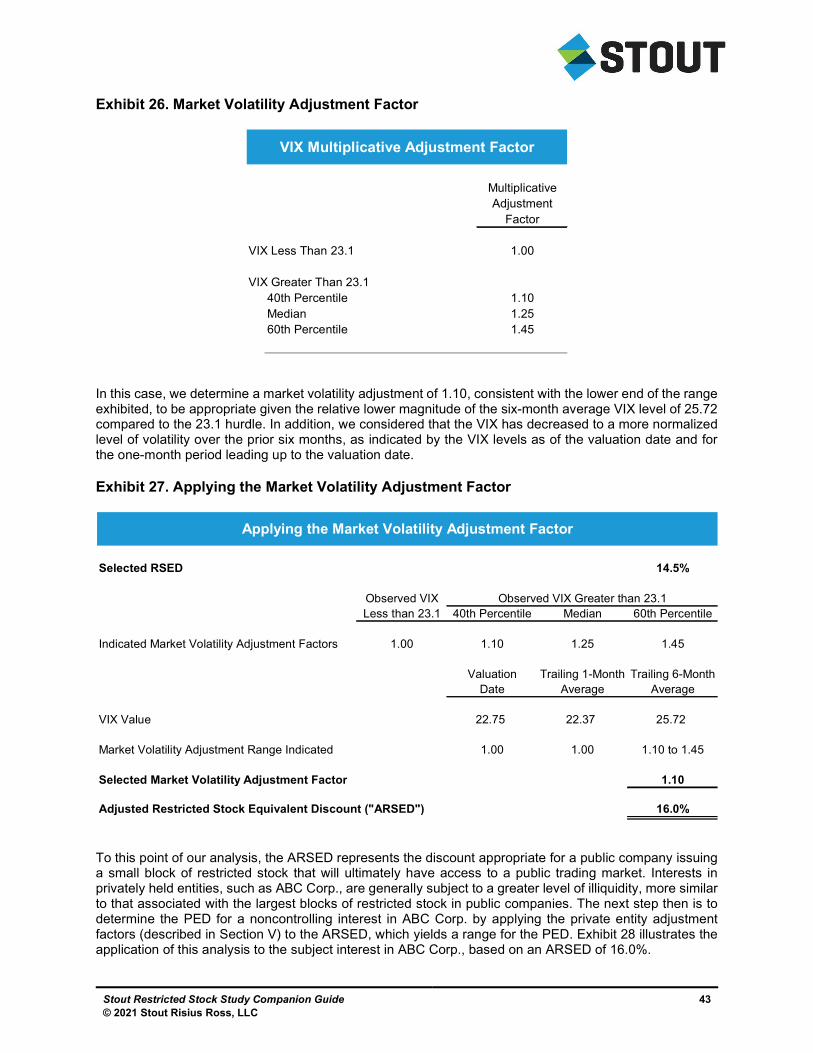
Stout Restricted Stock Study Companion Guide © 2021 Stout Risius Ross, LLC
43
Exhibit 26. Market Volatility Adjustment Factor
In this case, we determine a market volatility adjustment of 1.10, consistent with the lower end of the range exhibited, to be appropriate given the relative lower magnitude of the six-month average VIX level of 25.72 compared to the 23.1 hurdle. In addition, we considered that the VIX has decreased to a more normalized level of volatility over the prior six months, as indicated by the VIX levels as of the valuation date and for the one-month period leading up to the valuation date.
Exhibit 27. Applying the Market Volatility Adjustment Factor
To this point of our analysis, the ARSED represents the discount appropriate for a public company issuing a small block of restricted stock that will ultimately have access to a public trading market. Interests in privately held entities, such as ABC Corp., are generally subject to a greater level of illiquidity, more similar to that associated with the largest blocks of restricted stock in public companies. The next step then is to determine the PED for a noncontrolling interest in ABC Corp. by applying the private entity adjustment factors (described in Section V) to the ARSED, which yields a range for the PED. Exhibit 28 illustrates the application of this analysis to the subject interest in ABC Corp., based on an ARSED of 16.0%.
VIX Multiplicative Adjustment Factor
MultiplicativeAdjustment
Factor
VIX Less Than 23.1 1.00
VIX Greater Than 23.140th Percentile 1.10Median 1.2560th Percentile 1.45
Applying the Market Volatility Adjustment Factor
Selected RSED 14.5%
Observed VIX Observed VIX Greater than 23.1Less than 23.1 40th Percentile Median 60th Percentile
Indicated Market Volatility Adjustment Factors 1.00 1.10 1.25 1.45
Valuation Trailing 1-Month Trailing 6-MonthDate Average Average
VIX Value 22.75 22.37 25.72
Market Volatility Adjustment Range Indicated 1.00 1.00 1.10 to 1.45
Selected Market Volatility Adjustment Factor 1.10
Adjusted Restricted Stock Equivalent Discount ("ARSED") 16.0%
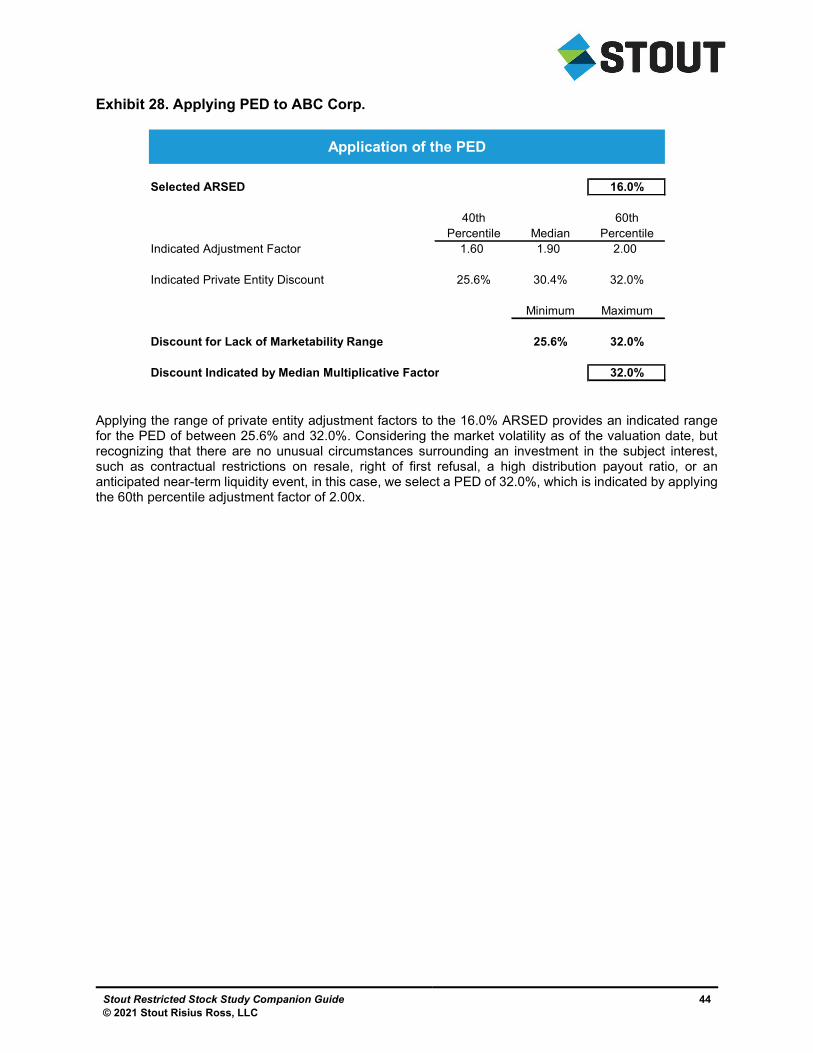
Stout Restricted Stock Study Companion Guide © 2021 Stout Risius Ross, LLC
44
Exhibit 28. Applying PED to ABC Corp.
Applying the range of private entity adjustment factors to the 16.0% ARSED provides an indicated range for the PED of between 25.6% and 32.0%. Considering the market volatility as of the valuation date, but recognizing that there are no unusual circumstances surrounding an investment in the subject interest, such as contractual restrictions on resale, right of first refusal, a high distribution payout ratio, or an anticipated near-term liquidity event, in this case, we select a PED of 32.0%, which is indicated by applying the 60th percentile adjustment factor of 2.00x.
Application of the PED
Selected ARSED 16.0%
40th 60thPercentile Median Percentile
Indicated Adjustment Factor 1.60 1.90 2.00
Indicated Private Entity Discount 25.6% 30.4% 32.0%
Minimum Maximum
Discount for Lack of Marketability Range 25.6% 32.0%
Discount Indicated by Median Multiplicative Factor 32.0%
Stout Restricted Stock Study Companion Guide © 2021 Stout Risius Ross, LLC
45
VIII. Additional Considerations
The following provides additional guidelines we have developed at Stout for valuing various types of nonmarketable securities that do not represent typical noncontrolling interests in closely held operating companies.
Restricted Stock of Publicly Traded Companies
The valuation of restricted stock in public companies is the area where the study has the greatest applicability. In using the study data for the valuation of less than fully liquid stock in publicly listed firms (e.g., due to formal restrictions, low trading volume relative to the block size, etc.), the following general process should be followed:
1. Analyze in detail all formal restrictions and other potential limitations on public trading associated with the subject block;
2. Analyze specific contractual rights that apply to the securities, including registration rights, if any;
3. Based on the findings in 1 and 2, estimate the particular degree of liquidity of the subject interest relative to the small and large blocks of restricted stock in the study;
4. Analyze the trading characteristics of the stock on its exchange or trading system, including stock price trends, volatility, and trading volume;
5. Determine the risk of the stock, taking into consideration firm financial risk and market risk (e.g., volatility); and
6. Apply the method outlined in Section V, making necessary adjustments to account for the particular degree of liquidity of the subject shares.
Asset-Holding Entities
Asset-holding entities are generally defined as entities that primarily hold assets, rather than that have active business operations. Asset-holding entities can be C or S corporations, limited or general partnerships, or limited liability companies (LLCs). The assets that these companies hold usually come in the form of real estate, marketable securities, notes receivable, interests in illiquid investment funds (e.g., venture or private equity), and ownership interests in privately held companies.
When valuing an interest in an asset-holding entity, the analysis is generally based on the adjusted book value method. This approach analyzes the balance sheet and adjusts the book value of the assets and liabilities with their appropriate current values to arrive at the adjusted net asset value (adjusted assets minus adjusted liabilities). Thereafter, the valuator needs to determine the discount for lack of control (DLOC) and discount for lack of marketability (DLOM) applicable to the subject interest.
The most common situations that arise, particularly in the estate planning context, are the use of family limited partnerships (FLPs), LLCs, and subchapter S corporations that hold either real estate or publicly traded securities as their primary assets. In any case, when dealing with the valuation of a noncontrolling interest, the DLOC and DLOM need to be determined for the subject interest. Often, these discounts are determined separately, with one data set supporting the DLOC and another data set supporting the DLOM. The study is an excellent data set to support the DLOM applicable to noncontrolling interests in asset-holding entities.
In the analysis of a noncontrolling interest in an FLP, LLC, or corporation that holds real property, great care must be taken in using the study. Real estate holding entities tend to make significant distributions. Additionally, all things being equal, real estate tends to have much lower volatility and is an otherwise “safer” investment than the equity of operating companies. Moreover, future cash flows and expenses for real
Stout Restricted Stock Study Companion Guide © 2021 Stout Risius Ross, LLC
46
estate entities tend to be far more predictable than for operating companies, due to the contractual nature of most rents. This stability and predictability of real estate, however, can also lead to significant financial leverage of the underlying real estate, which can partially or fully offset the previously mentioned factors. Leverage may increase the risk profile of the entity and create greater volatility of the entity’s cash flows available to equity owners.
When determining the DLOC and DLOM associated with a noncontrolling interest in an entity holding marketable securities, many valuation experts will utilize closed-end fund data to determine the DLOC. For the applicable DLOM, the valuator needs to determine the diminution in value resulting from the illiquidity attributes of the subject interest. Again, the data in this study are likely the best available evidence for determining the DLOM. Special consideration should be given to the fact that the underlying assets will, in many cases, have performance characteristics significantly more attractive than many of the companies in the study. Moreover, when determining the DLOM for a portfolio of equity securities, consideration should be given to the generally lower volatility of a portfolio than the individual stocks in the study.